Abstract
Global Navigation Satellite System (GNSS) signal quality, type of receiver equipment, and external environment can cause GNSS observations to be anomalous, and these anomalies are sometimes reflected in GNSS pseudorange observations rather than phase observations. To better detect blunders in pseudorange observations, this paper proposes three pseudorange blunder detection methods under the same frequency and different code types (case1), and the same code type and different frequencies (case2), of pseudorange observations, which are the Code Observation Difference Method (CODM), the Inter-satellite Code Observation Difference Method (ICODM), and the Inter-epoch and Inter-satellite Code Observation Difference Method (IICODM). The corresponding thresholds for the constructed test statistics of the three detection methods were derived based on the Bessel formula. Performance analysis of the three detection methods was performed under case1 based on C2 and P2 code observation data of Global Positioning System (GPS) at 137 Multi-GNSS Experiment (MGEX) stations, and case2 based on BDS B1I and B3I frequency observation data of BeiDou Navigation Satellite System (BDS) at 232 MGEX stations, on 29 July 2022. The results show that the statistical information value of the three methods in case1 was significantly smaller than that in case2. In the first case, the maximum values of test statistics, RMSE and threshold mean values were 0.526, 0.752 and 2.243 m, respectively, while the corresponding values in case2 were 7.066, 4.490 and 13.480 m respectively. The reason for this is that the data quality of global GPS is higher than that of BDS and the differential observation equation eliminates or weakens more errors with the same frequency and different types of code pseudorange observations. Under the same conditions, compared with ICODM and IICODM, CODM has high computational efficiency and a simple mathematical model. It is recommended to use CODM first for pseudorange blunder detection in the GNSS observation domain. According to the RMSE of 3 times as the limit, it is recommended that the threshold be set to 5 m under case1 for GPS and 15 m under case2 for BDS, which is half the existing reference value. Finally, the blunder detection methods proposed can improve positioning performance through actual data verification.
1. Introduction
The raw observations of GNSS mainly include pseudorange observations and carrier phase observations. Standard Point Positioning (SPP) makes use of real-time broadcast ephemeris and pseudorange observations, while Precise Point Positioning (PPP) utilizes post-event precise ephemeris and carrier phase observations [1]. In comparison, SPP has lower accuracy than carrier phase positioning, but due to its simple positioning model and easy implementation, SPP has been widely used in the field of satellite positioning and navigation where accuracy is not a very significant issue. In general, the accuracy of pseudorange positioning mainly depends on the noise level of pseudorange observations and various errors involved in the propagation of satellite signals, such as satellite ephemeris error, satellite clock error, atmospheric delay, and the multipath effect. Accuracy varies from meters to tens of meters depending on receivers, observation environments and error cancellation levels.
However, pseudorange observations and carrier phase observations need to be combined in precise point positioning (PPP). If there are blunders in the pseudorange observations, the positioning accuracy is greatly reduced. Therefore, it is necessary to perform blunder detection on pseudorange observations to ensure the reliability of positioning accuracy.
Moreover, phase observations are widely used in positioning and navigation due to their high accuracy, while continuous tracking signals from satellites can guarantee the continuity of integer ambiguities. Phase observation errors, where the integral part is wrong and the fractional part is correct, are called cycle slips [2]. If these occur and are not fixed correctly, an unknown integer cycle deviation is directly added to the positioning result. The detection methods of cycle slips are mainly based on the time-varying laws of observed values, such as the higher-order difference method and polynomial fitting method [3], but these methods are not suitable for data preprocessing with a large sampling rate. Methods based on different combinations of observations include the single-frequency/dual-frequency code-phase combination method, ionospheric residual method, and Doppler integration method [4,5,6,7,8]. However, these methods are not suitable for the detection of small cycle slips. A cycle slip can also be detected based on the residuals of parameter estimates [3]. In addition, there is triple-frequency or non-difference combination cycle slip detection [9,10], the Quasi-Accurate Detection (QUAD) of blunders method [11], continuous Wavelet transform [12], and an inertial navigation-aided cycle-slip detection method [13].
The above methods have achieved good results in the detection of cycle slips in carrier phase observations. To detect blunders in pseudorange observations, a range of methods have also been proposed. The commonly used methods for the detection of pseudorange blunders include the Kalman filter method and the integrity monitoring method [14,15,16]. The Kalman filter method requires an appropriate filter. If the receiver is relatively mobile, it may lead to misjudgment caused by the filtered transmission. Therefore, improvement of the Kalman filtering algorithm is important. For example, a Kalman Filter for the outlier rejection technique was presented in [17], and Teunissen et al. (2021) introduced a generalized Kalman filter with precision in a recursive form when the stochastic model is mis specified [18]. The Traditional Receiver Autonomous Integrity Monitoring (RAIM) algorithm in the integrity monitoring method is based on hypothesis testing and reliability theory associated with mathematical statistics theory to detect and eliminate blunders [19]. RAIM algorithms mainly include the distance comparison method, least square residual method, parity vector method and the maximum interval method [20,21,22]. These methods are effective for single blunder detection but are suitable for multiple blunders. In 2008, the GNSS Evolutionary Architecture Study (GEAS) group proposed the concept of Advanced RAIM (ARAIM), which is widely used in satellite fault monitoring [23]. The multiple hypotheses proposed by Pervan in ARAIM at 1998 are used to consider all potential risks of GNSS, and to detect and eliminate GNSS failures according to the multiple hypothesis theory [24]. With the continuous progress of data processing theory and methods, scholars have also improved the algorithm in ARAIM. The predicted false alarm probability in ARAIM can reduce predefined requirements by about 50% considering the correlation among test statistics when trip satellites fail [25]. On this basis, Han et al. (2021) adopted a maximum minimization method to reasonably allocate integrity risk and continuity risk and improve the availability of single constellation ARAIM [26]. Considering measurement time correlation colored noise, a linear Kalman filter-based integrity monitoring method was proposed based on a linear colored Kalman filter (CKF) by a first-order Gauss–Markov model [27]. A dynamic test showed that the proposed method can reduce the false alarm rate. To improve the coverage of navigation services, Zhao et al. (2021) developed a tight integrity risk for residual-based advanced receiver autonomous integrity monitoring (ARAIM) [28]. An error function-based method was also developed to compute conservative integrity risk which can improve HPL calculation efficiency by avoiding the involved integral [29]. A deep neural network has also been introduced into RAIM recently [30]. GNSS and Inertial Measurement Unit (IMU) integrated navigation systems can be severely degraded in urban environments, and a new pseudorange comparison-based algorithm and a dual w-test-based quality control algorithm for Fault Detection and Exclusion (FDE) have been proposed [31,32]. The potential faults in the Kalman Filter state prediction step are considered in FDE [33].
These detection methods are all completed in the coordinate domain, which requires the calculation of the observation data, resulting in the mathematical model being complex, and the real-time performance being poor. Therefore, Guo (2013) proposed a blunder detection method in the observation domain [34].
Although these methods have achieved good results in practical applications, their limitation is that they do not distinguish between pseudorange anomalies and phase anomalies for satellites with observation anomalies. Once a satellite is marked as a blunder, the satellite’s pseudorange and phase observations are discarded at the same time, resulting in a waste of some normal observation information. Aiming at handling these problems, this paper investigates real-time blunder detection of pseudorange observations in the observation domain. Based on the GNSS pseudorange observation equation, we propose three pseudorange blunder detection methods, namely a Code Observation Difference Method (CODM), an Inter-satellite Code Observation Difference Method (ICODM), and an Inter-epoch and Inter-satellite Code Observation Difference Method (IICODM), and construct their corresponding test statistics. The GPS C2 and P2 code pseudorange observation of 137 Multi-GNSS Experiment (MGEX) stations were used to analyze the performance of the three methods under the same frequency and different code types (case1), and the BDS B1I and B3I code pseudorange observations of 232 MGEX stations were used for the same code type and different frequencies (case2). The performance of the three methods was verified, and meaningful conclusions were obtained.
The rest of this paper is organized as follows. The discrimination criteria for GNSS blunders in the existing observation domain are presented in Section 2. The construction of test statistics for the three blunder detection methods is presented in Section 3. The calculation process and performance analysis of the three blunder detection methods are presented in Section 4. A conclusion is drawn in Section 5.
2. Discrimination Criteria for GNSS Blunders in the Observation Domain
For the existing GNSS blunder detection methods, Guo (2013) used the code observation method of different code types of the same frequency and different frequencies of the same code type [34]. Taking GPS as an example, let C1 and P1 be the same frequency observation with different code types, and P1 and Px be the same code type of observation with different frequencies. For any station, the following code pseudorange difference equation can be constructed.
where and are the code pseudorange deviations between the observed values of C1 and P1 (same frequency and different code types) and that between P1 and Px (different frequencies and same code type). and are the satellite code deviations between C1 and P1 and that between P1 and Px, respectively. and are the receiver code deviations between C1 and P1 and that between P1 and Px, respectively. and are the satellite code deviations between C1 and P1 and that between P1 and Px. and are the variables of the receiver hardware delay bias between C1 and P1 and that between P1 and Px. is the ionospheric delay residual term. and are the sum of the residual error and noise terms between C1 and P1 and that between P1 and Px.
From the analysis of the physical mechanism, and eliminate the geometric distance and have nothing to do with the motion state of the carrier. The two differences are mainly manifested in the remaining hardware delay bias at the satellite and receiver sides, the remaining residual term and the difference of observation noise.
Since the hardware delay bias of the satellite transmitter is usually small and stable, and the channel delay of the receiver is basically the same for all satellites, these two differences, and are relatively stable and are suitable for detecting blunders in pseudorange observations. Therefore, these two quantities can be used as the test statistics of blunder detection. The guidelines are:
where k1 and k2 are thresholds when considering the ionospheric delay residual error term, k1 < k2, k1 is 10 m, and k2 is 30 m.
Guo (2013) presented a method for detecting blunders in pseudorange observations [34]. It was found that the thresholds k1 and k2 are empirical values, lacking a certain theoretical calculation basis. Secondly, if the difference between several satellite observations (single difference observation) occurs at the same station, the receiver clock error and the hardware delay of the receiver can be eliminated. Furthermore, if differences are determined between epochs on previous single difference observations to obtain new differences observations, various residual delays in the satellite signal propagation path can be further eliminated.
Therefore, this paper constructs test statistics for the Inter-satellite Code Observation Difference Method (ICODM) and the Inter-epoch and Inter-satellite Code Observation Difference Method (IICODM) based on the Code Observation Difference Method (CODM) in the observation domain, and analyzes the detection performance of these three blunder detection methods in detail.
3. Test Statistics of Three Blunder Detection Methods
To overcome the limitations of existing methods for blunder detection in the positioning domain, this section describes the process of constructing the test statistics of CODM, ICODM, and IICODM in detail based on GNSS raw pseudorange observations. When the observation epoch is t, and the frequency is f, the pseudorange observation equation from the station r to the satellite s is:
where is the code pseudorange observations at frequencies f and observation epoch time t between the observing receiver or station r and satellite s, and are the receiver clock error and the satellite clock error, and are ionospheric and tropospheric delay errors, and are receiver and satellite hardware delay biases. Other relevant terms are the multipath and the random measurement noise .
However, C1 and P1, C2 and P2 released by GPS belong to the same frequency and different code types (case1) of GPS pseudorange observations. At present, BDS releases observation data in three frequency bands, B1, B2, and B3. Among them, B1 and B3 are the most used in the current combined observations and belong to the same code type with different frequencies (case2) of BDS pseudorange observations. For this reason, the following differential observation equations with case1 were derived from the C2 and P2 pseudorange observations in GPS, and differential observation equations with case2 were derived from the code pseudorange observations B1I and B3I, considering the highest accuracy of the branch I in BDS.
3.1. Differential Equation and Test Statistic in Both Cases
(1) Differential equation of CODM in the observation domain
For case1, according to Equation (3), the observation equation of the complete pseudorange observation in GPS is:
The first-order differential observation equation of CODM in case1 is obtained by subtracting the two formulas in Equation (4):
where , , are the difference between the hardware delay biases, multipath error, and ionospheric delay error under case1, respectively. These values are relatively stable in a short period and can be regarded as constants.
The first-order differential observation equation of CODM for B1I and B3I observations in the BDS under case2 can also be written as:
where , , and are the differences of hardware delay bias, multipath error difference, ionospheric delay error difference, and tropospheric delay error difference under case2, respectively. These values are relatively stable in a short period and can be regarded as constants.
Therefore, the values of the test statistics and formed by Equations (5) and (6) are relatively stable and are also suitable for detecting blunders in pseudorange observations.
(2) Differential equation of ICODM in the observation domain
A differential equation of CODM between satellites can eliminate the receiver clock difference and the hardware delay of the receiver, and also has a weakening effect on other residual errors. According to Equations (5) and (6), the difference of observation equation in ICODM between satellites i and j under two conditions are:
where the superscripts i, j are the indexes of the satellites. It can be seen from Equations (7) and (8) that the ionospheric error, tropospheric error, and multipath error are further weakened due to the differential operations.
(3) Differential equation of IICODM in the observation domain
Inter-epoch differences between the equation of ICODM can further eliminate various residual delays on the satellite signal propagation path. According to Equations (7) and (8), the observation equations at epochs t2 and t1 are obtained as:
where represents the difference between the epoch t1 and t2 of the satellite j and satellite i code deviation equations (See Equations (7) and (8)) in two cases.
It can be seen from Equations (9) and (10) that the influence of various residual errors in the signal propagation process can be further weakened. The mathematical models of the three blunder detection methods in the observation domain are deduced in detail above, and the test statistics of blunder detection are given correspondingly.
3.2. Calculation Method of Threshold
For both cycle slip detection and blunders detection, the threshold value is mainly calculated by an empirical value or based on the error propagation law. Blunder detection in this paper is carried out in the observation domain, which can be easily implemented and thus is applicable. Specifically, Bessel’s formula is used to calculate the threshold based on the differential observations calculated by the three methods. The Root Mean Square Error (RMSE) of Bessel’s formula is:
where n is the number of differential observations, corresponds to the test statistic ,, , , , respectively, and is the mean of corresponding test statistics, is the difference between the test statistic of the k-th difference equation and the mean of the test statistic. using formula (11) to calculate the RMSE, and the corresponding thresholds are taken as 3 times RMSE.
According to the three methods, the test statistics under case1 and case2 are calculated and compared with the corresponding threshold to judge whether there is a blunder in the corresponding observation value.
4. Results and Discussions
For data of different frequencies released by BDS, we chose B1I and B3I code pseudorange observation in BDS as the observation data of different frequencies and the same code type for experiments. The C2 and P2 code pseudorange observations in GPS were taken as experimental data of the same frequency and different code types.
4.1. Experimental Data
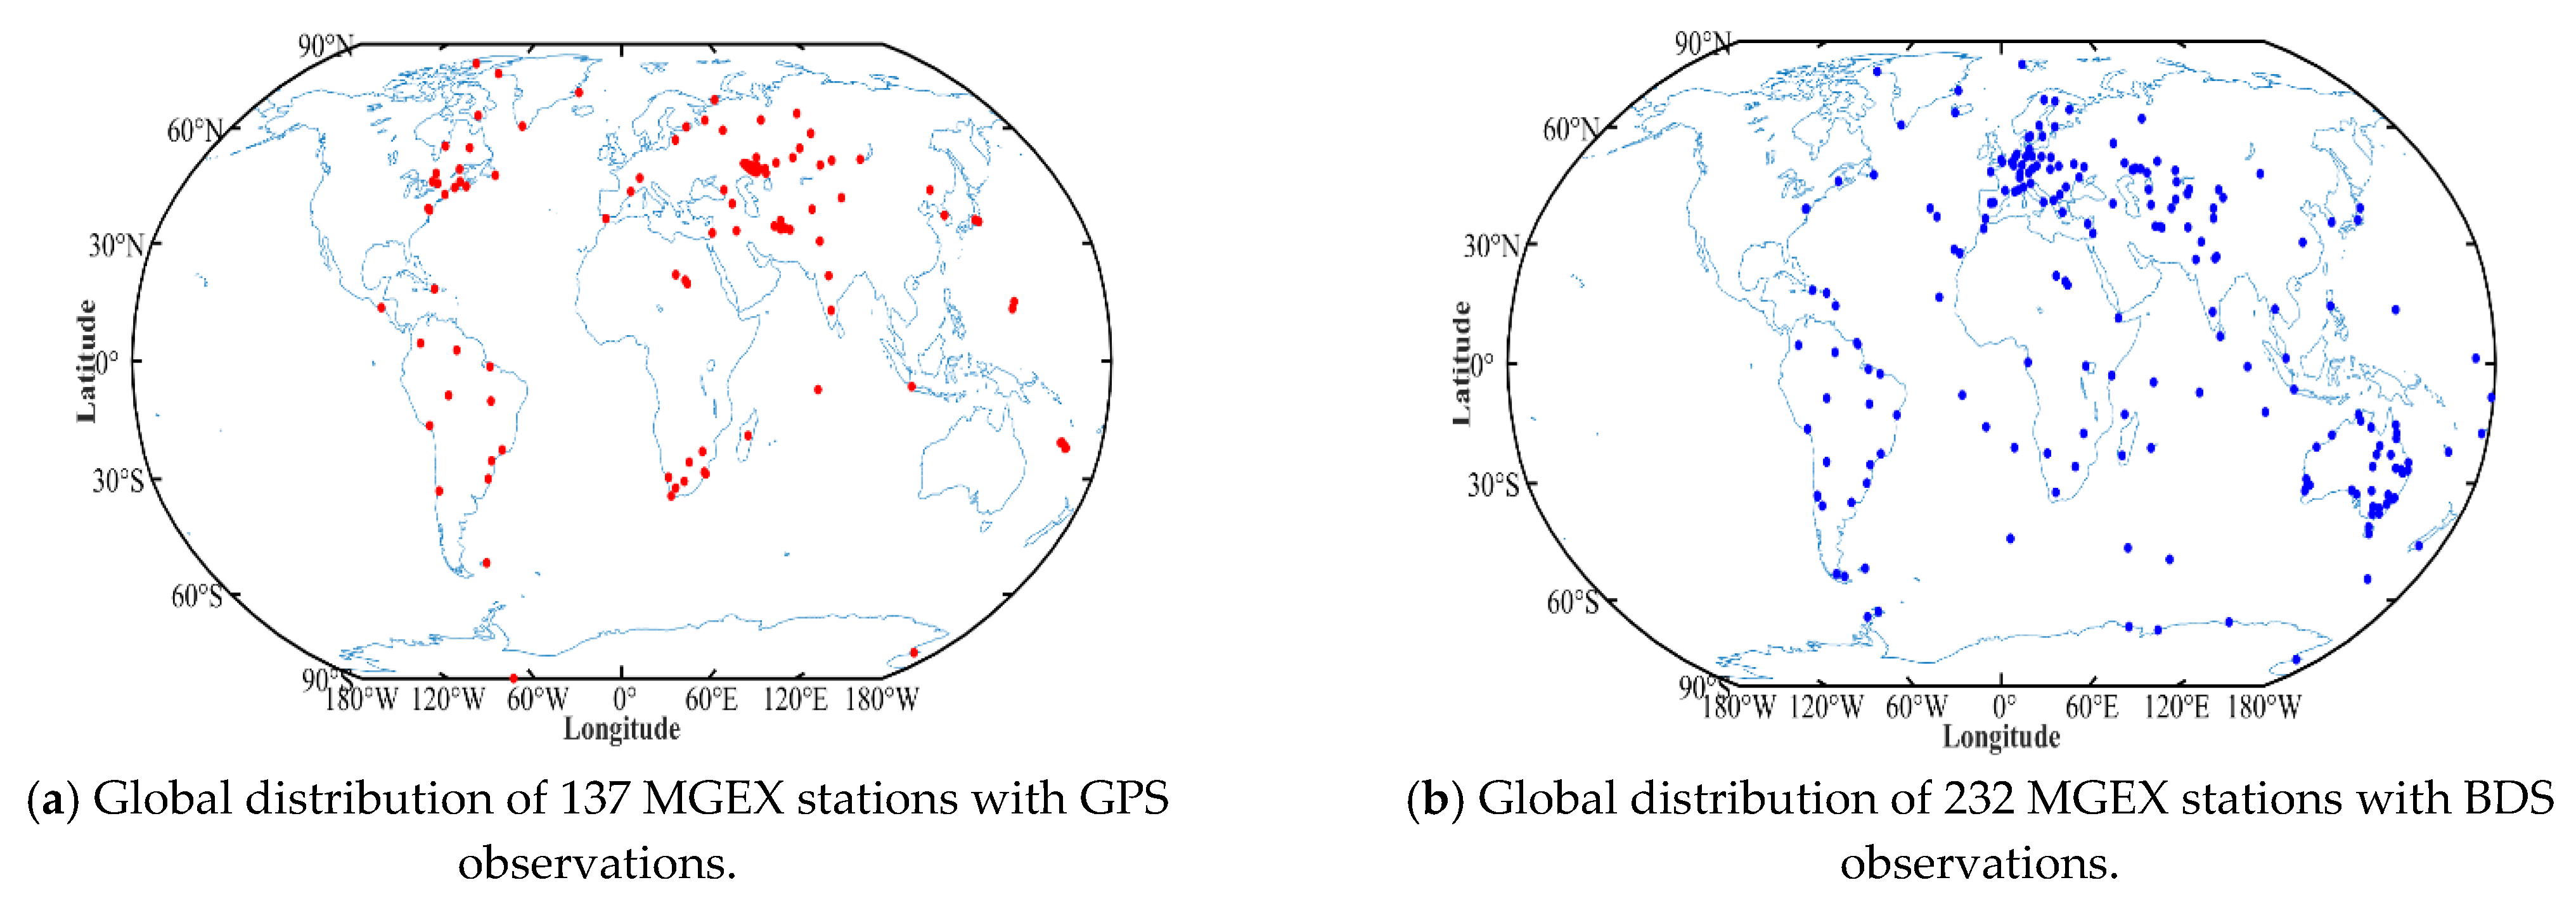
We selected the observation data of C2 and P2 code pseudorange in GPS from 137 MGEX stations on 29 July 2022. At the same time, the observation data of B1I and B3I code pseudorange in BDS from 232 MGEX stations on the same day were selected. The distribution of these stations is shown in Figure 1. The sampling interval of each station in the MGEX network is 30 s, and each day contains 2880 epochs. The number of GPS and BDS visible satellites in each epoch is about 6–16. There are more visible satellites in individual areas or stations. In particular, BDS has more visible satellites in China than in other regions. Each epoch has GNSS pseudorange observation information.
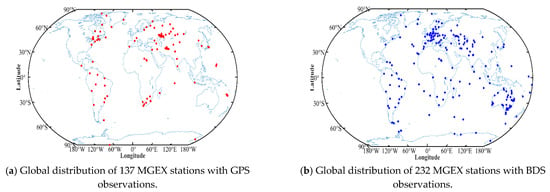
Figure 1.
Global distribution of (a) 137 MGEX stations with GPS observations and (b) 232 MGEX stations with BDS observations.
The observation data of these two systems were used to calculate the test statistics of the three blunder detection methods in the two cases using Equations (5)~(10). The performances of the three different methods of CODM, ICODM and IICODM were analyzed, and the corresponding threshold value is given by Equation (11). According to the calculated test statistic and the given threshold by formula (2), it was judged which observation contains a blunder. The specific results are given in the following subsections.
4.2. Test Statistics and Thresholds of CODM
The C2 and P2 code pseudorange observation data of different code types with the same frequency were extracted from the GPS observation data of 137 MGEX stations, and B1I and B3I code pseudorange observations of the same code type with different frequencies were extracted from BDS observation data of 232 MGEX stations. We obtained test statistics of CODM using Equations (5) and (6) and calculated the threshold value by using Equation (11).
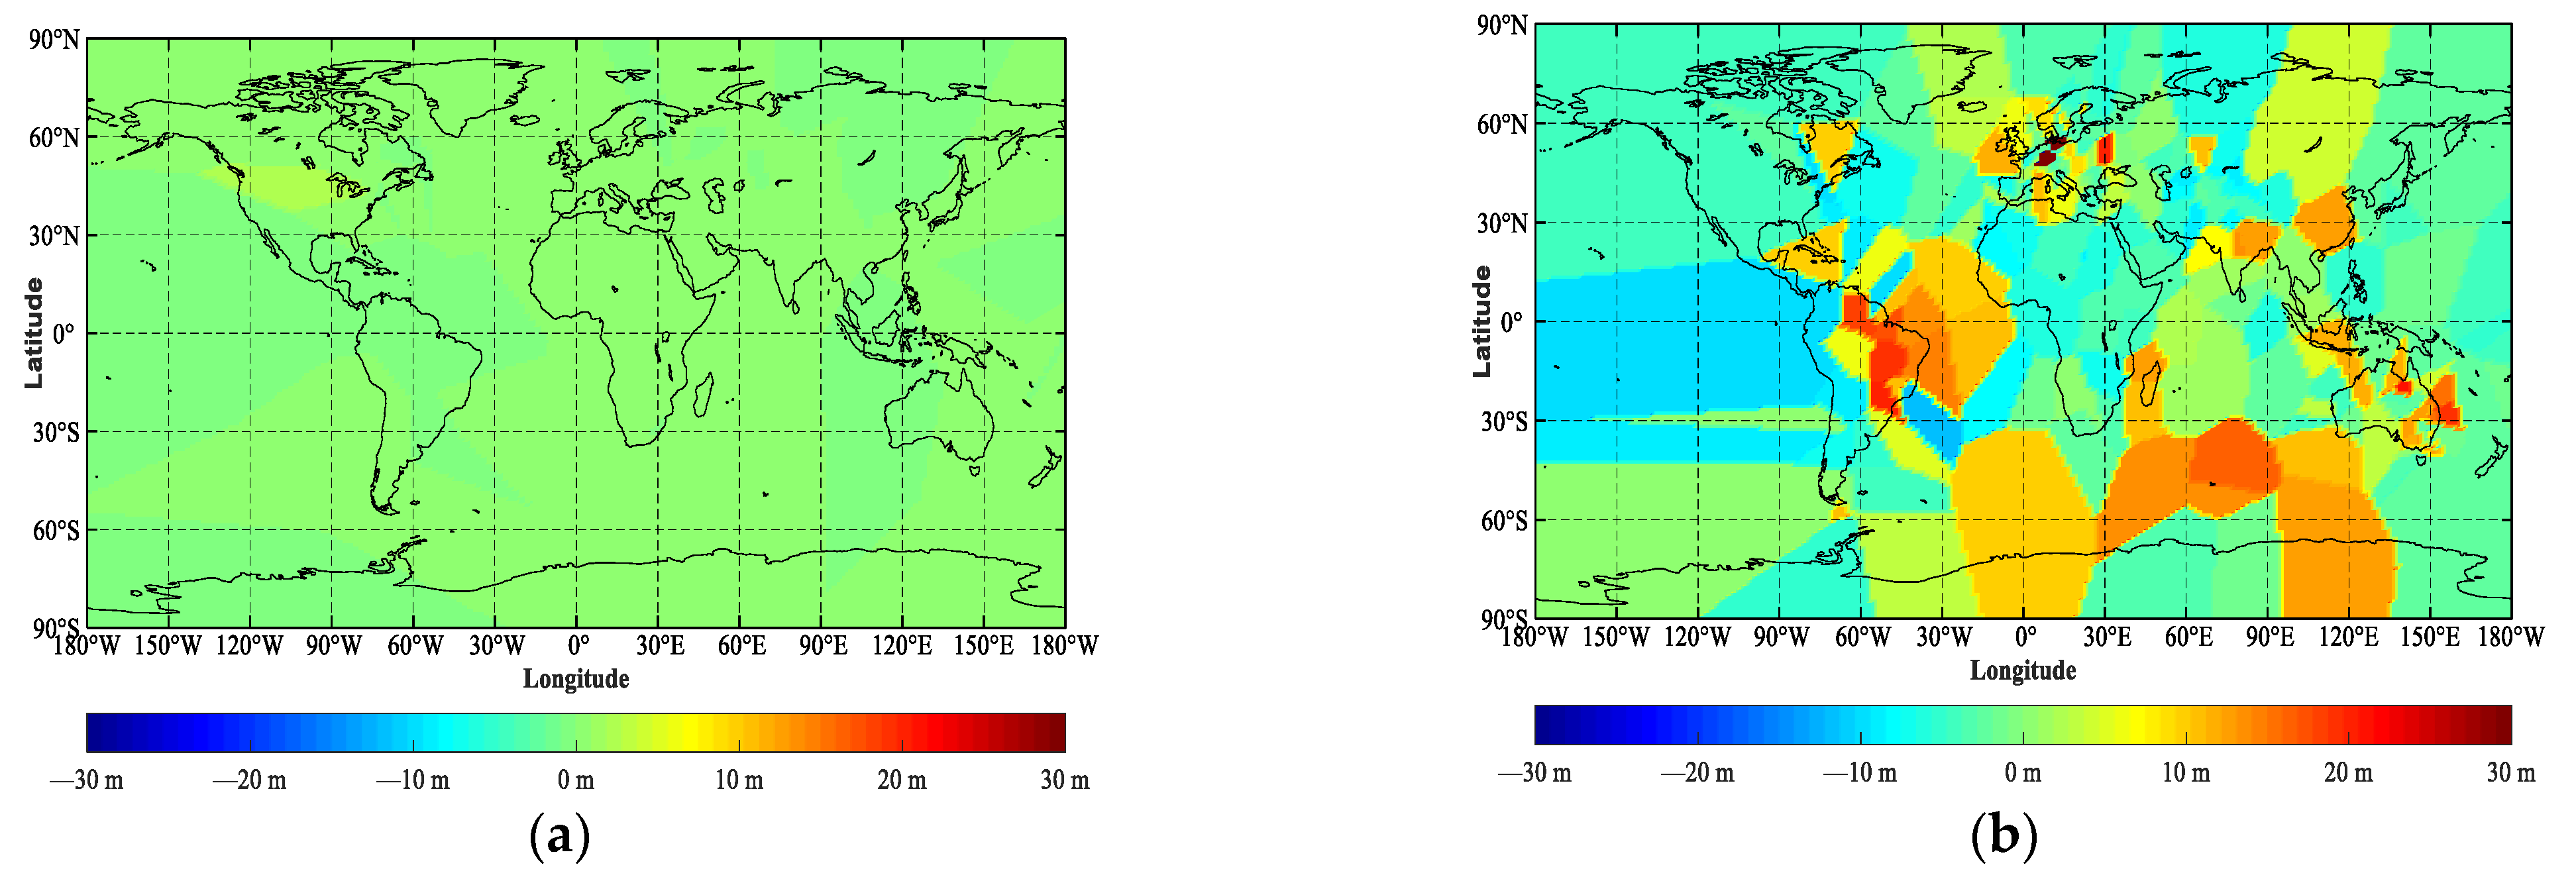
Figure 2 shows the global test statistics distribution of CODM under case1 and case2, respectively.
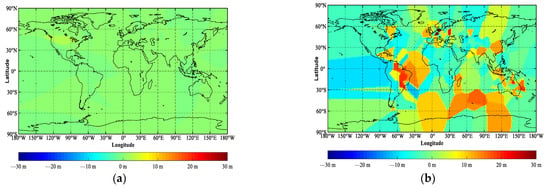
Figure 2.
Global test statistics distribution of CODM based on (a) GPS and (b) BDS observation under case1 and case2.
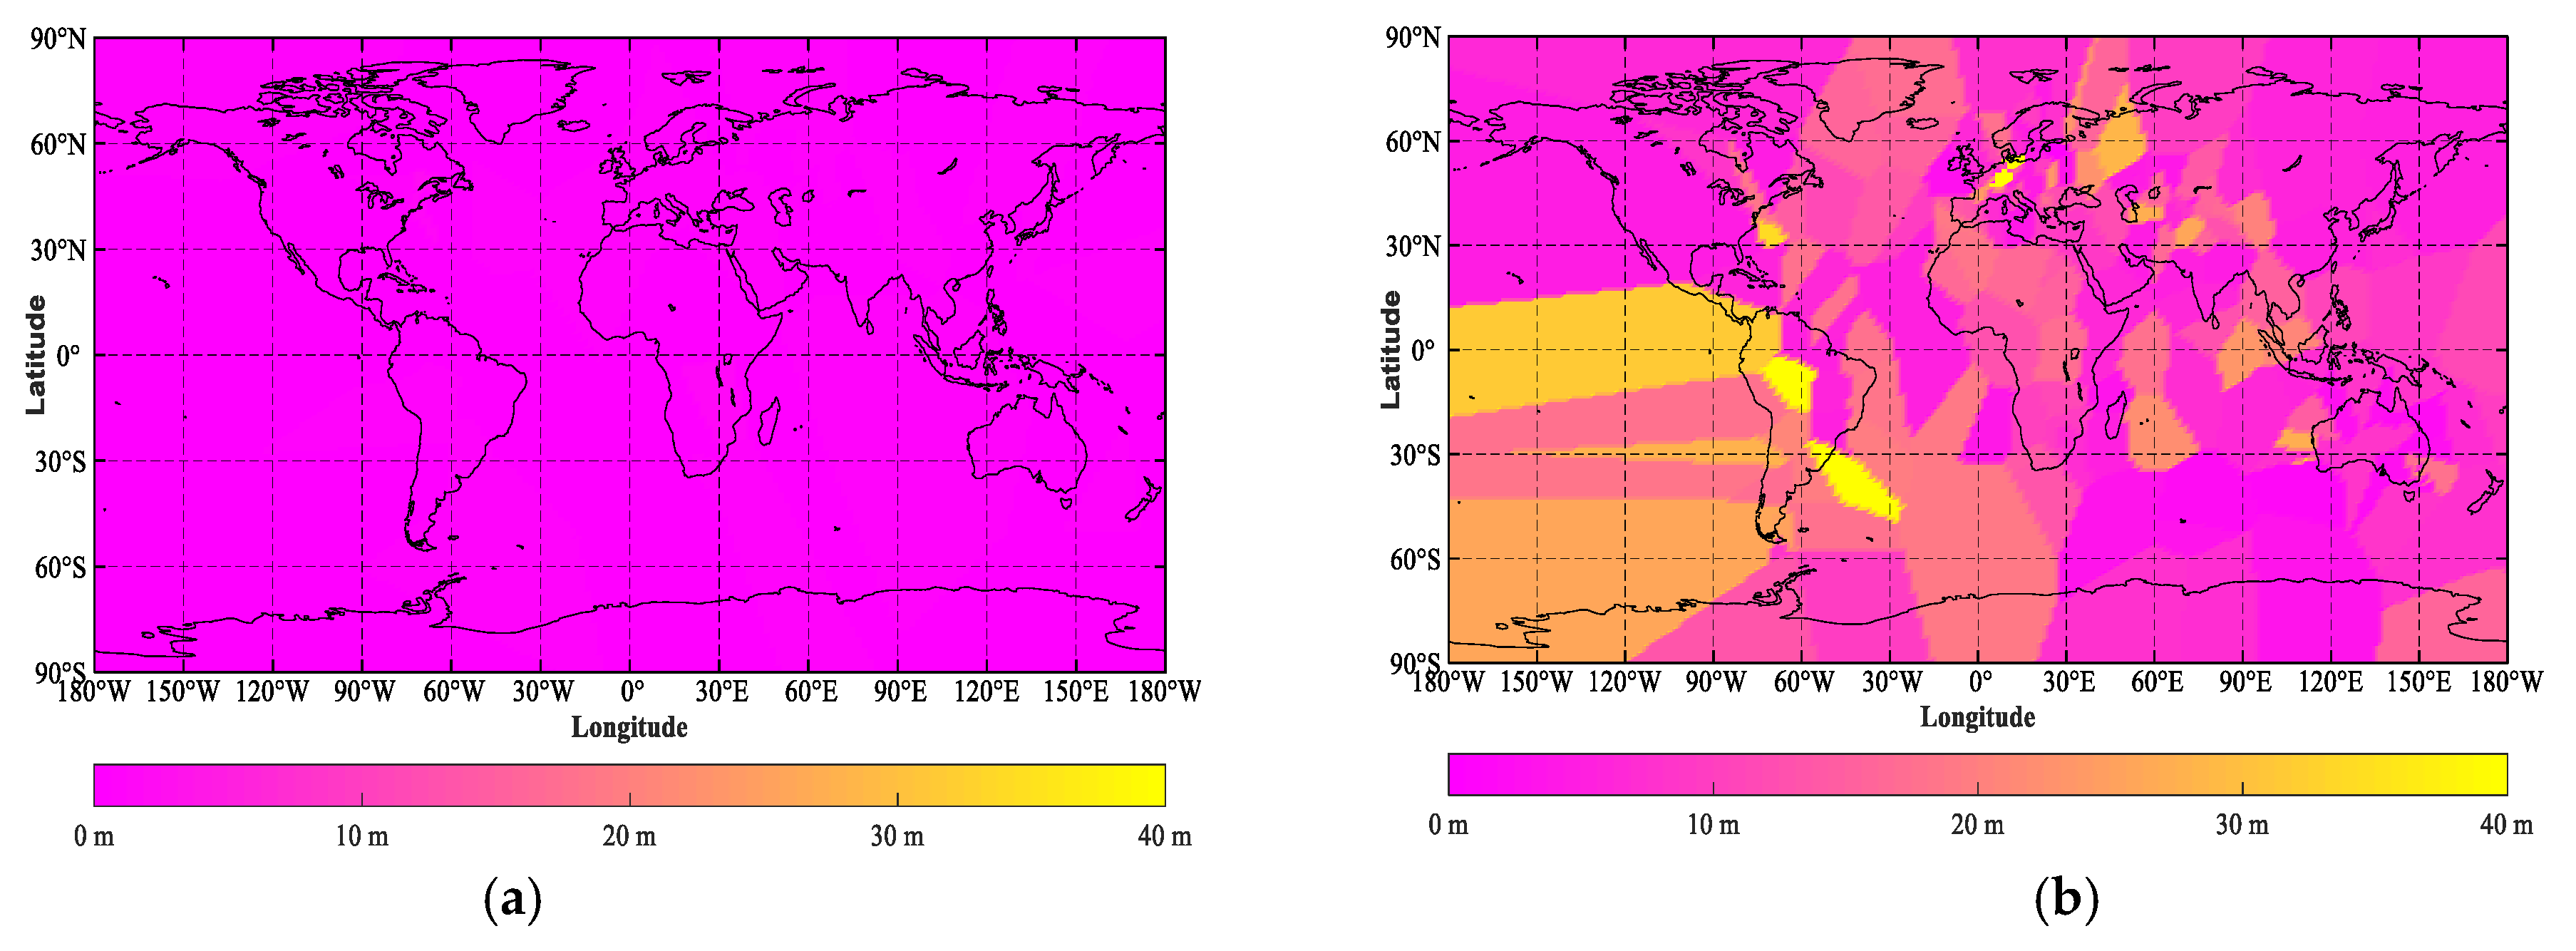
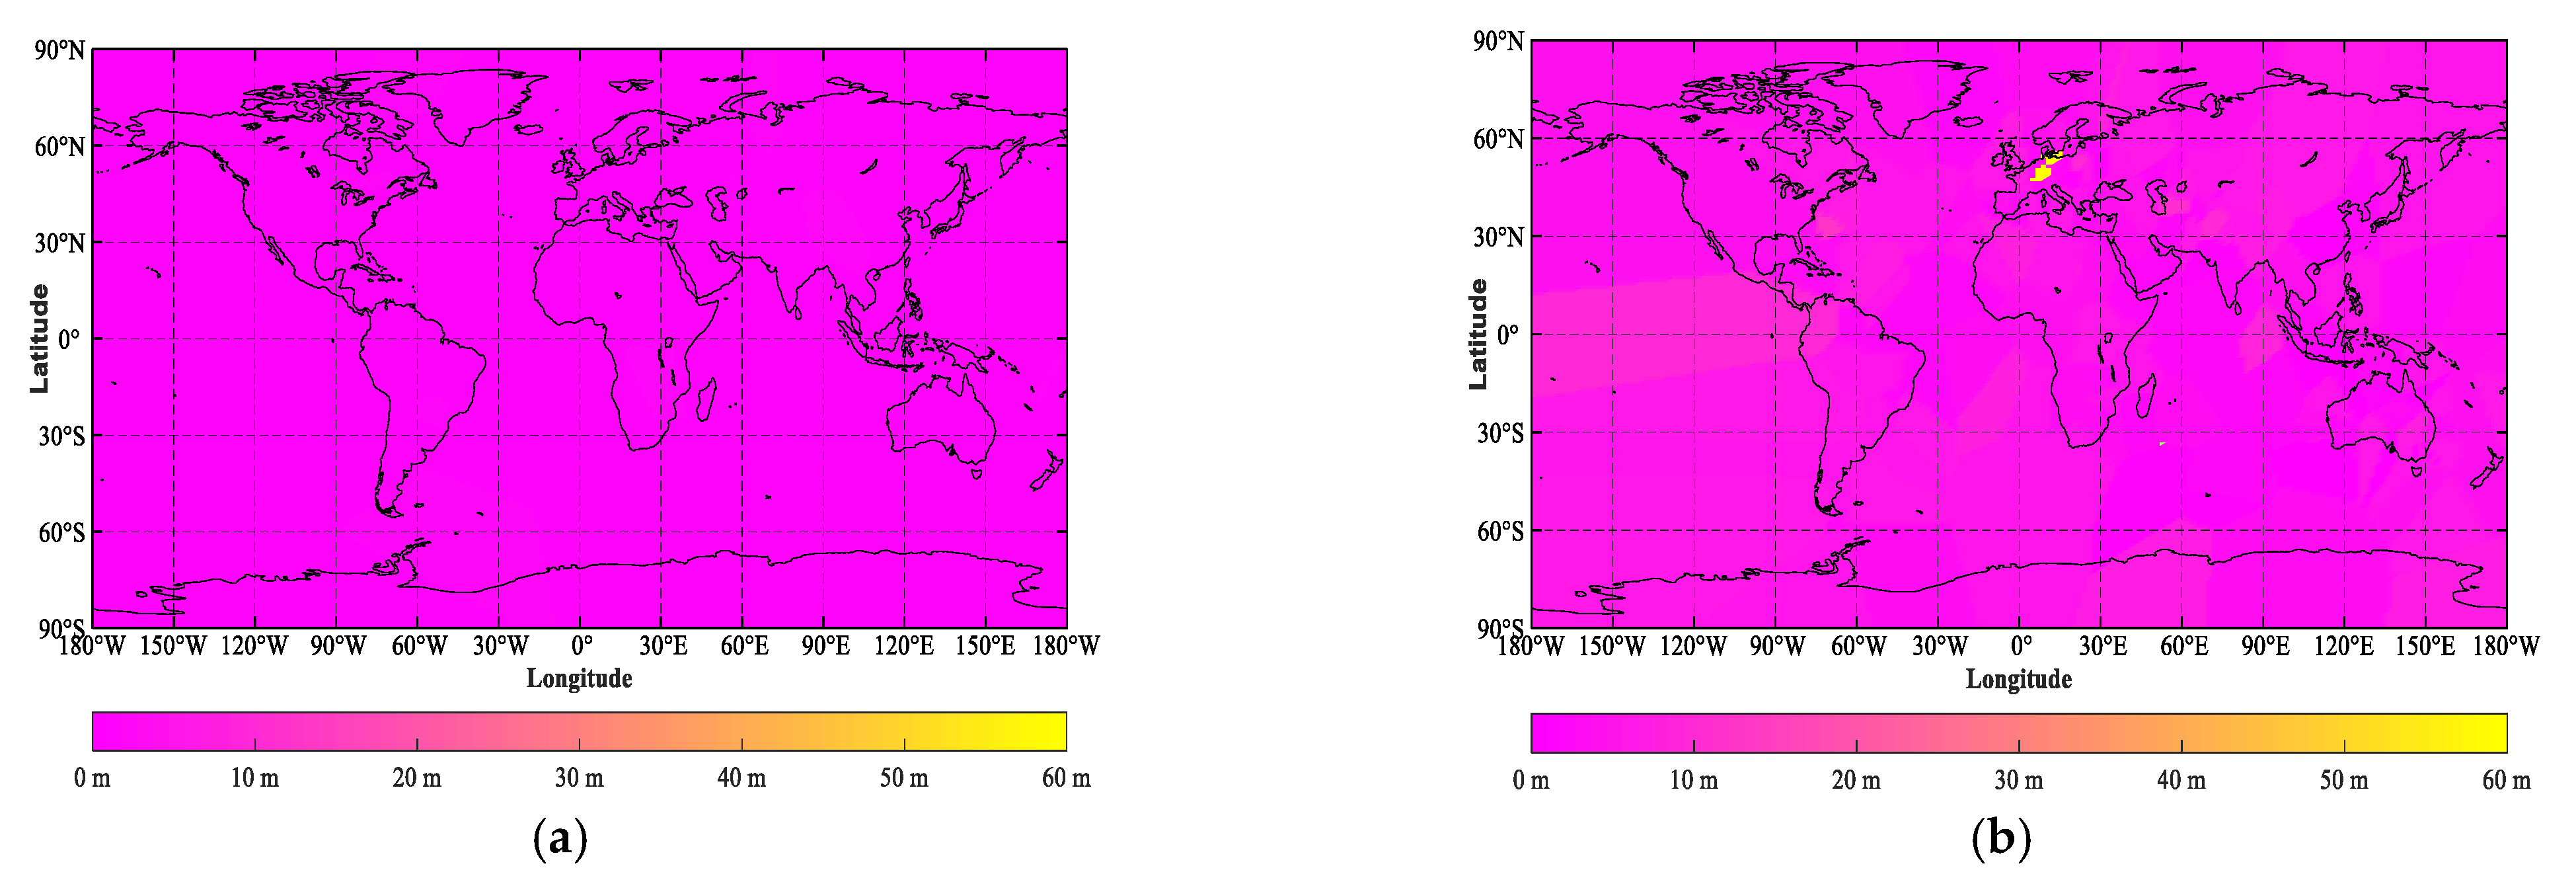
Figure 3 shows the Global threshold distribution of CODM base on GPS and BDS observation under the two cases.
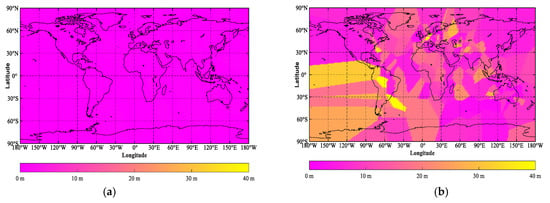
Figure 3.
Global threshold distribution of CODM based on (a) GPS and (b) BDS observation under case1 and case2.
After deleting the stations where the average value of the test statistics in the CODM was obviously very large (at least tens of thousands), Table 1 shows the minimum value, average value of absolute value and maximum value of the test statistics in the CODM. Table 2 shows the minimum value, average value, maximum value, and Standard Deviation (Std) of the threshold value.

Table 1.
statistics of CODM test statistics and RMSE (m).

Table 2.
statistics of CODM threshold (m).
From the results in the figures and tables above, it can be concluded that:
- (1)
- The test statistic calculated under case2 is more than 5 times the test statistic under case 1 in CODM, that is, the code deviation of the same code type and different frequencies of BDS is significantly larger than that of the different code types and same frequency of GPS, which is similar to that given by Guo (2013) in [34].
- (2)
- The minimum value, mean value and maximum value of the RMSEs in case1 are less than the corresponding values in case2, indicating that the differences between the observations of different code types at the same frequency can eliminate or weaken more errors. This is mainly because the accuracy and stability of GPS in the global scope are higher than those of BDS.
- (3)
- The threshold value of different code types at the same frequency of GPS in CODM calculated by the Bessel formula does not exceed 5 m, which is far less than the 10 m threshold given by Guo (2013) in [34], which is related to the current good data quality of GPS and the improvement of data processing strategies. However, the threshold of the same code type and different frequencies of BDS in CODM is less than 15 m.
4.3. Test Statistics and Thresholds of ICODM
We used Equations (7) and (8) to complete the calculation of test statistics of ICODM, and used formula (11) to calculate the threshold.
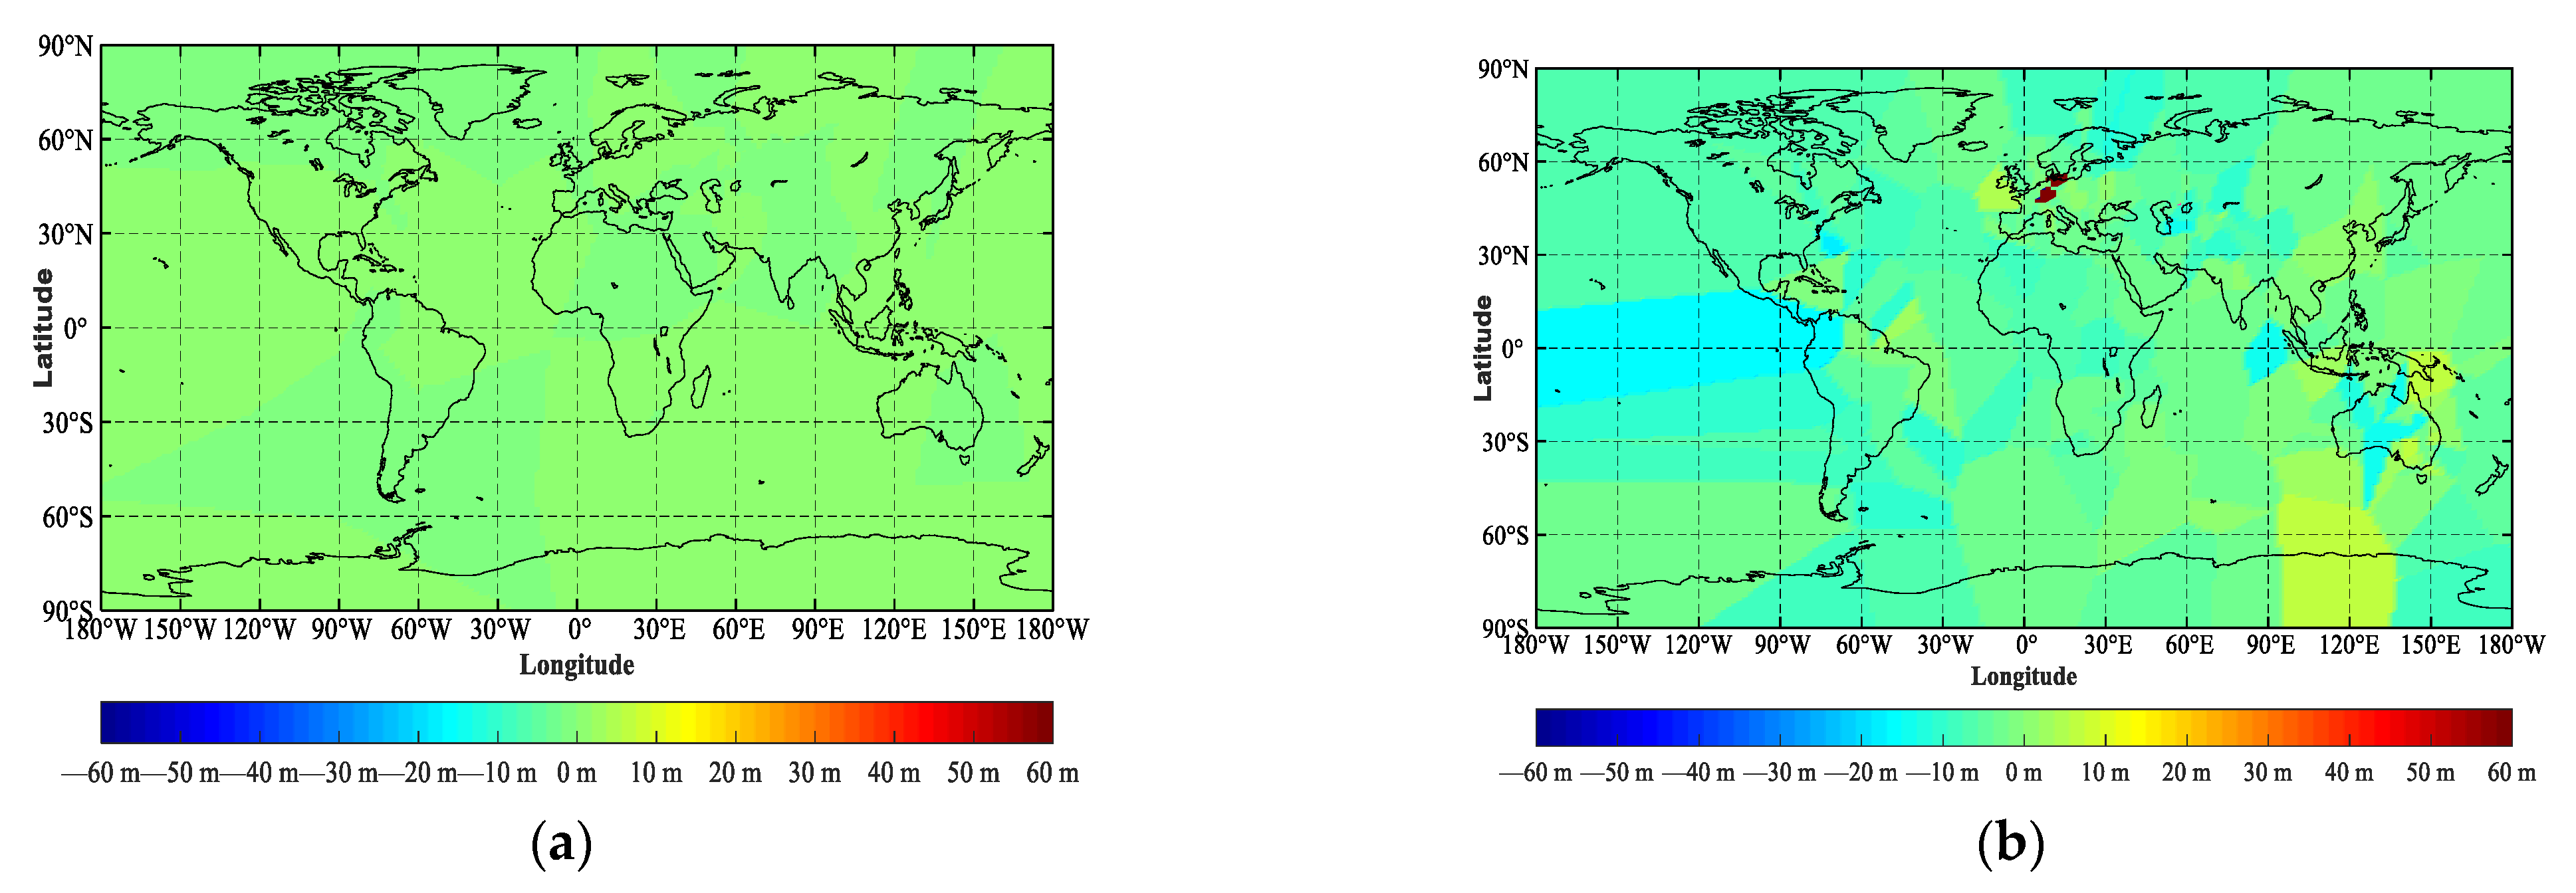
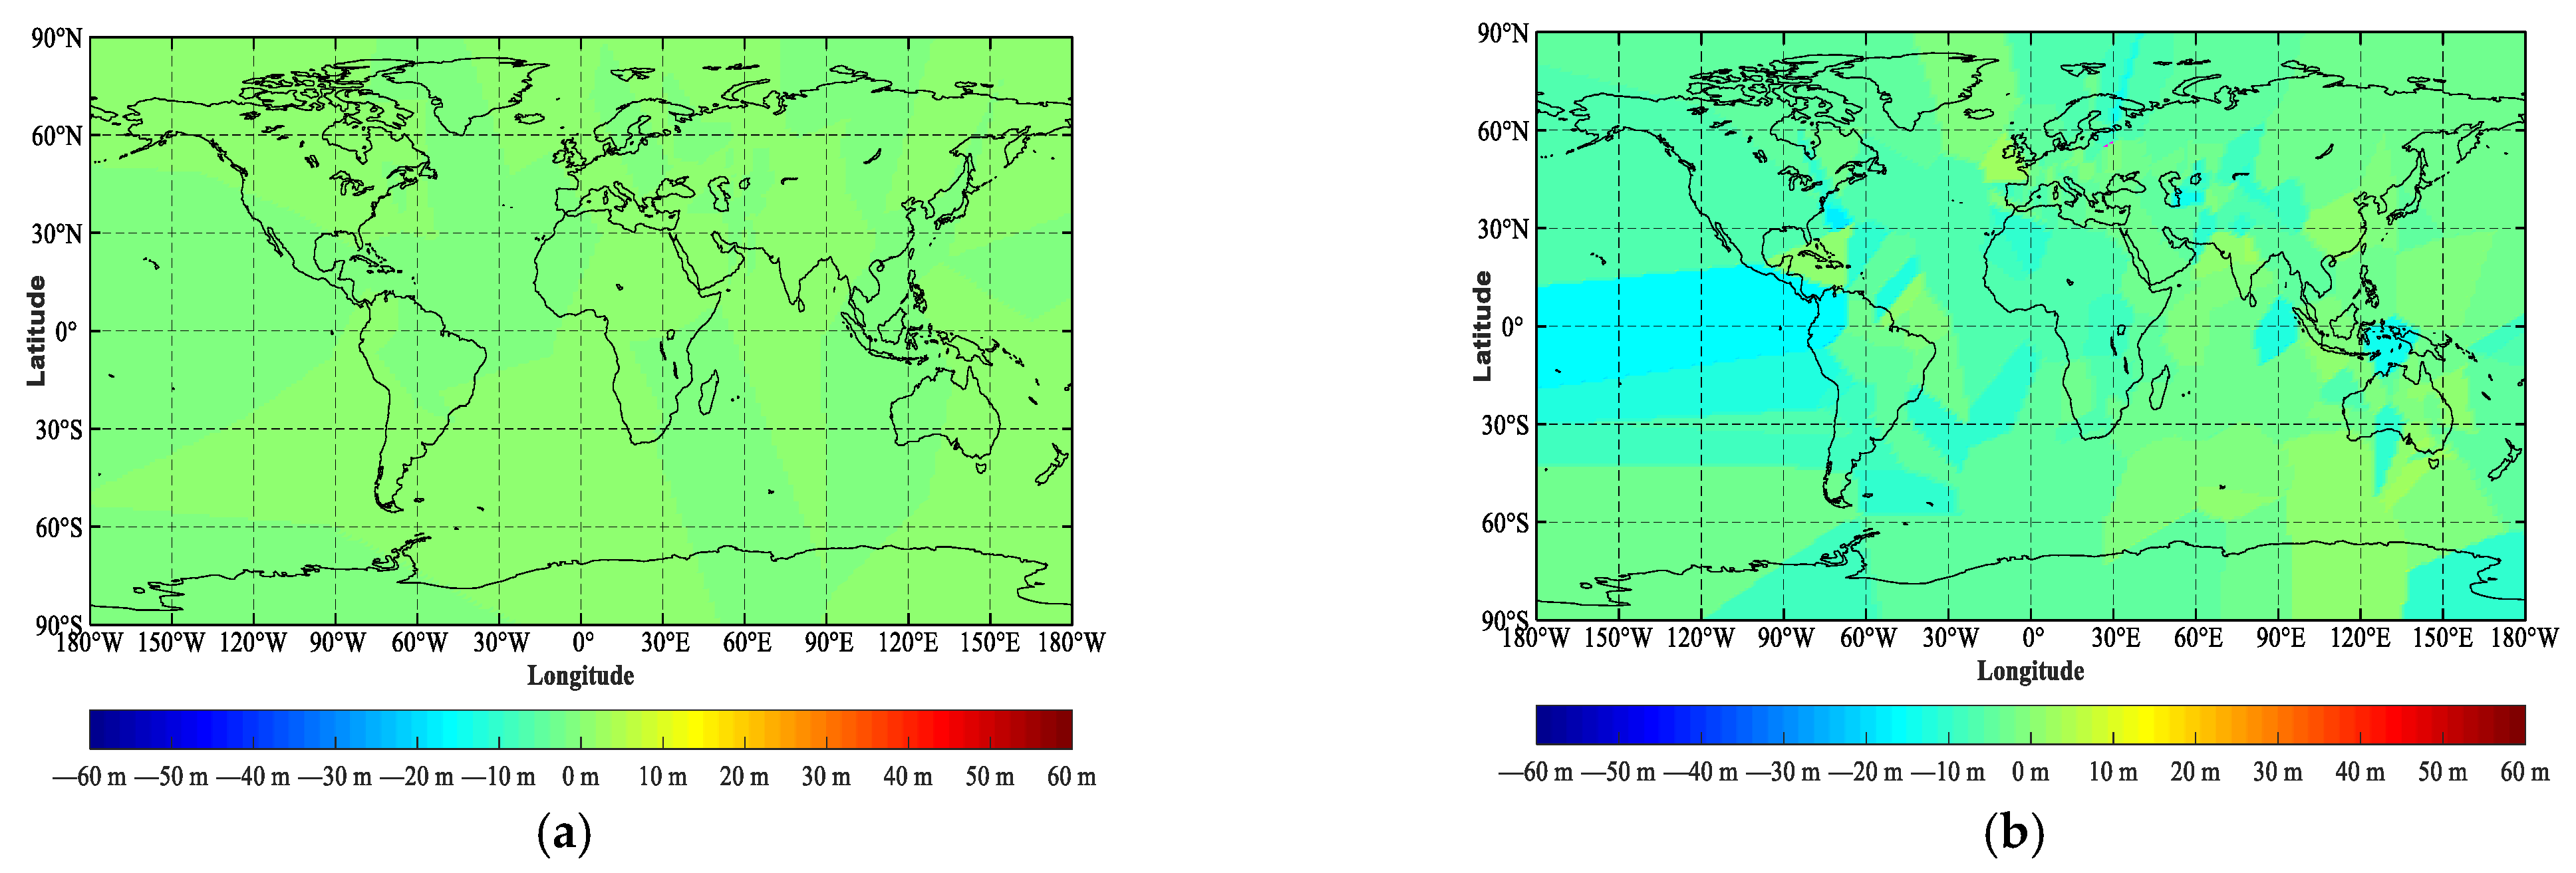
The stations were deleted with the average value of test statistics being very large, Table 3 and Table 4, respectively, count the minimum, average, average value of absolute value, maximum of test statistics and RMSE in ICODM, as well as the minimum, average, maximum and Std of threshold values, and show the size of the threshold in the two cases. Figure 4 shows the global distribution of the ICODM test statistics in the two cases.

Table 3.
Statistics ICODM test statistics and RMSE (m).

Table 4.
Statistics of ICODM threshold (m).
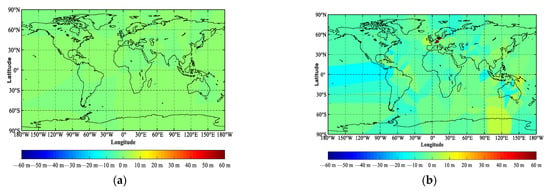
Figure 4.
Global test statistics distribution of ICODM based on GPS (a) and BDS (b)observation under case1 and case2.
Figure 5 shows the Global threshold distribution of ICODM base on GPS and BDS observation under two cases.
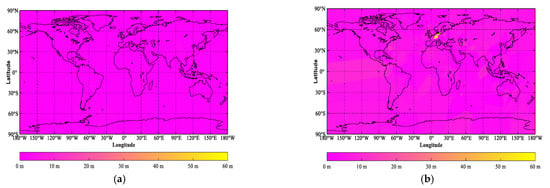
Figure 5.
Global threshold distribution of ICODM based on (a) GPS and (b) BDS observation under case1 and case2.
- (1)
- The mean value of the test statistic calculated by ICODM is 0.421 m under case1, and the mean value of the test statistic calculated by CODM is 0.327 m. The mean values of the RMSE of the test statistic constructed by the two methods based on GPS observation data are 0.212 m and 0.570 m, respectively, and the difference of the test statistic and the RMSE calculated by the CODM and ICODM methods under case1 is small (less than 0.5 m). Similarly, the same conclusion was reached using BDS data under case2, in that the difference of test statistics between CODM and ICODM and that of RMSE between the two methods did not exceed 2.0 m.
- (2)
- (3)
- Taking 3 times the RMSE, the mean of the thresholds in ICODM do not exceed 5 m and 15 m in two cases, respectively. The recommended thresholds are 5 m and 15 m, respectively.
4.4. Test Statistics and Thresholds of IICODM
As above, the test statistic calculation of the IICODM was conducted using Equations (9) and (10), and the threshold was calculated using Equation (11).
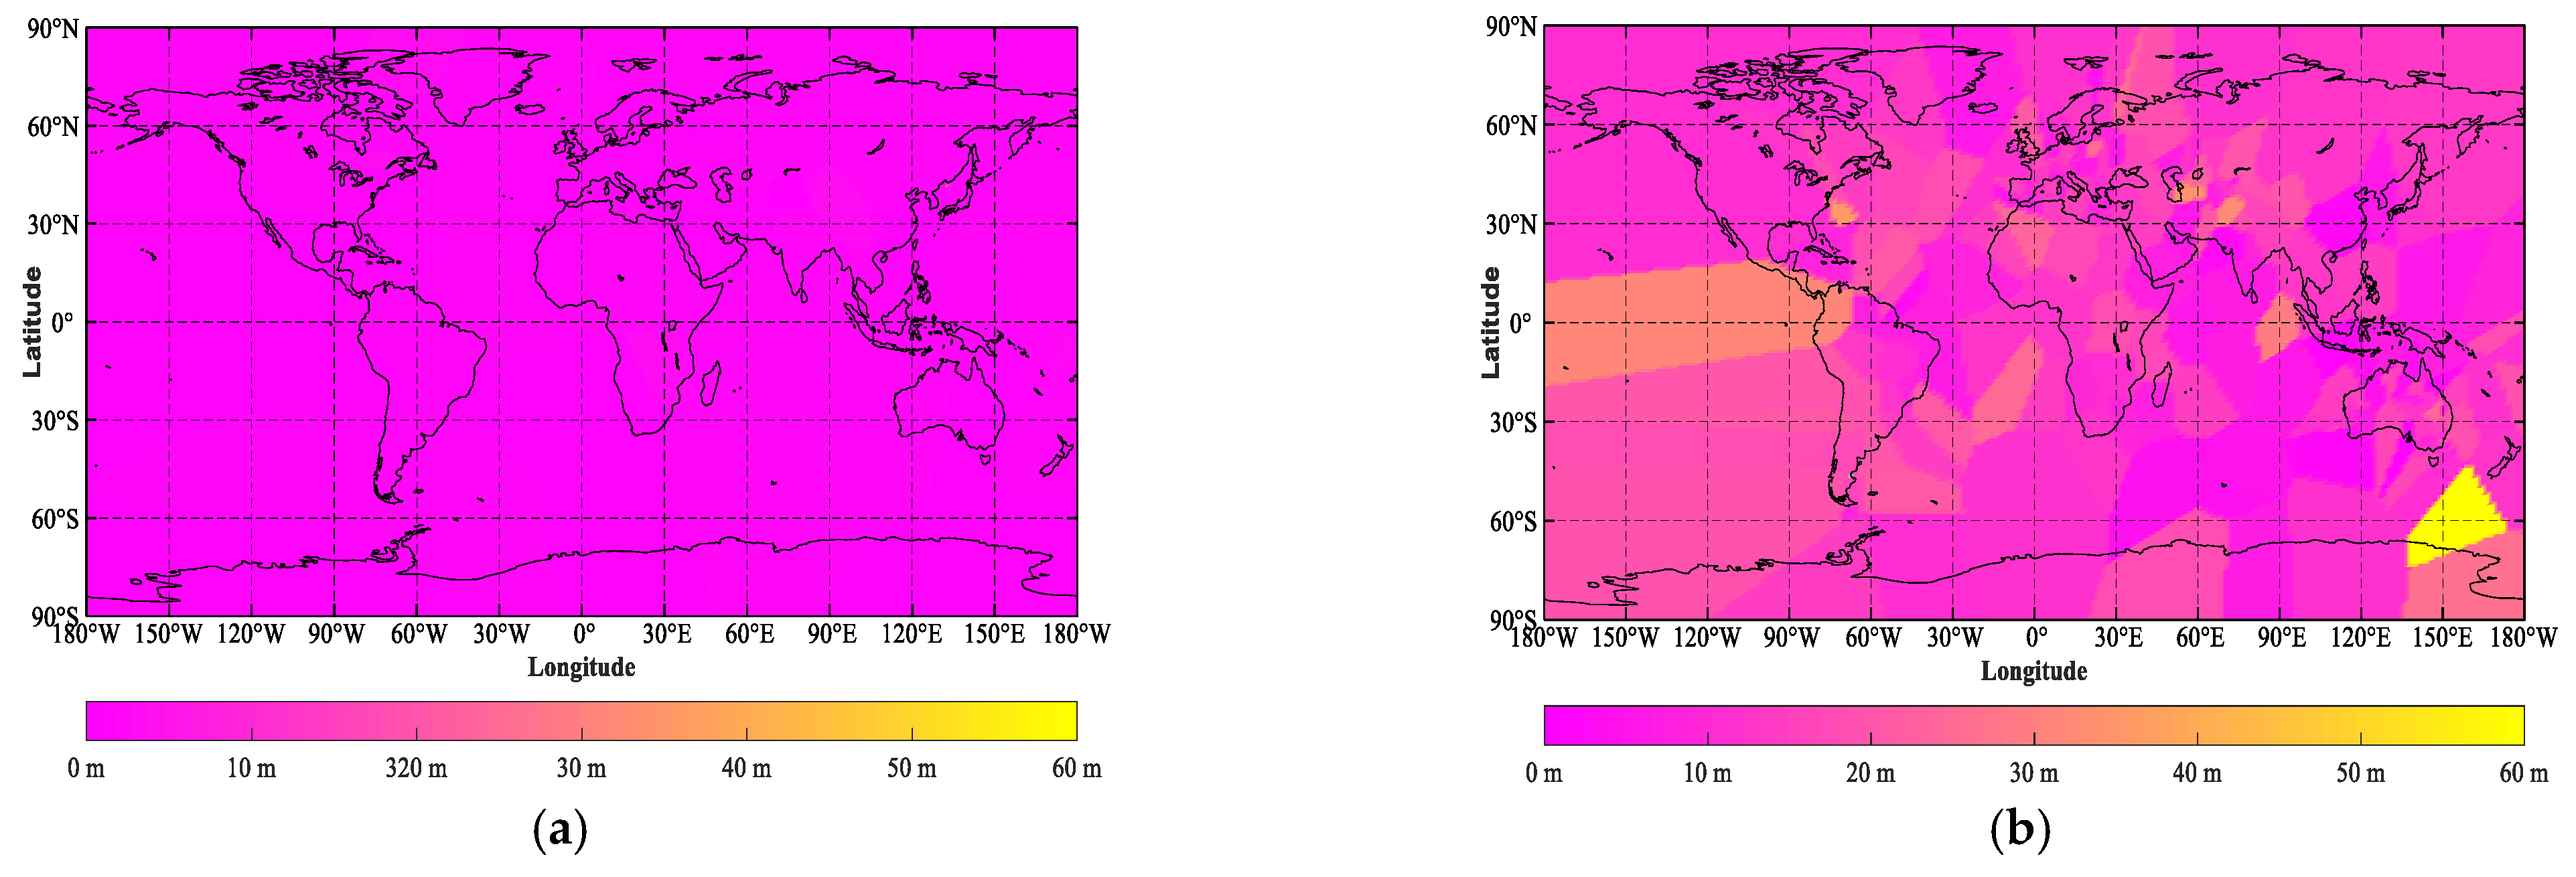
When deleting stations with significantly large average values of test statistics, Figure 6 show the Global distribution of the IICODM test statistics in the two cases, and Table 5 and Table 6 show the statistical information of test statistics, RMSE and threshold in IICODM under two cases.
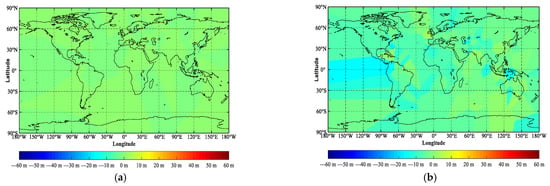
Figure 6.
Global test statistics of IICODM based on (a) GPS and (b) BDS observation under case1 and case2.

Table 5.
Statistics of IICODM test statistics and RMSE (m).

Table 6.
Statistics of IICODM threshold (m).
Figure 7 shows the Global threshold distribution of IICODM based on GPS and BDS observation under the two cases.
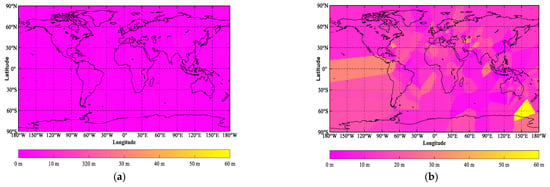
Figure 7.
Global threshold distribution of IICODM based on (a) GPS and (b) BDS observation under case1 and case2.
From Figure 2, Figure 4 and Figure 6, combined with Table 1, Table 2, Table 3, Table 4, Table 5 and Table 6, it can be concluded that in case 1, the average values of test statistics, RMSE and threshold calculated by the three methods are relatively small based on GPS observation data (the maximum difference is not more than 0.5 m). The same applies to the conclusion based on the BDS observation data in case2, but the maximum difference is not more than 2 m. Overall, the statistical value of the three methods in case1 is smaller than that in case2.
The thresholds calculated by the IICODM in the two cases are 2.243 m and 13.480 m, respectively, and the thresholds do not exceed 5 m and 15 m. It is recommended to use these two values as the thresholds.
4.5. Performance Analysis of Three Methods
The three methods described in Section 4.4 can all judge blunders well according to the calculated test statistics and thresholds. The thresholds given in this paper are 5 m and 15 m, while the thresholds given in [34] are 10 m and 30 m, which are half the values presented in the existing literature. For the sake of conservativeness, the analysis in this section is based on the threshold given in the literature.
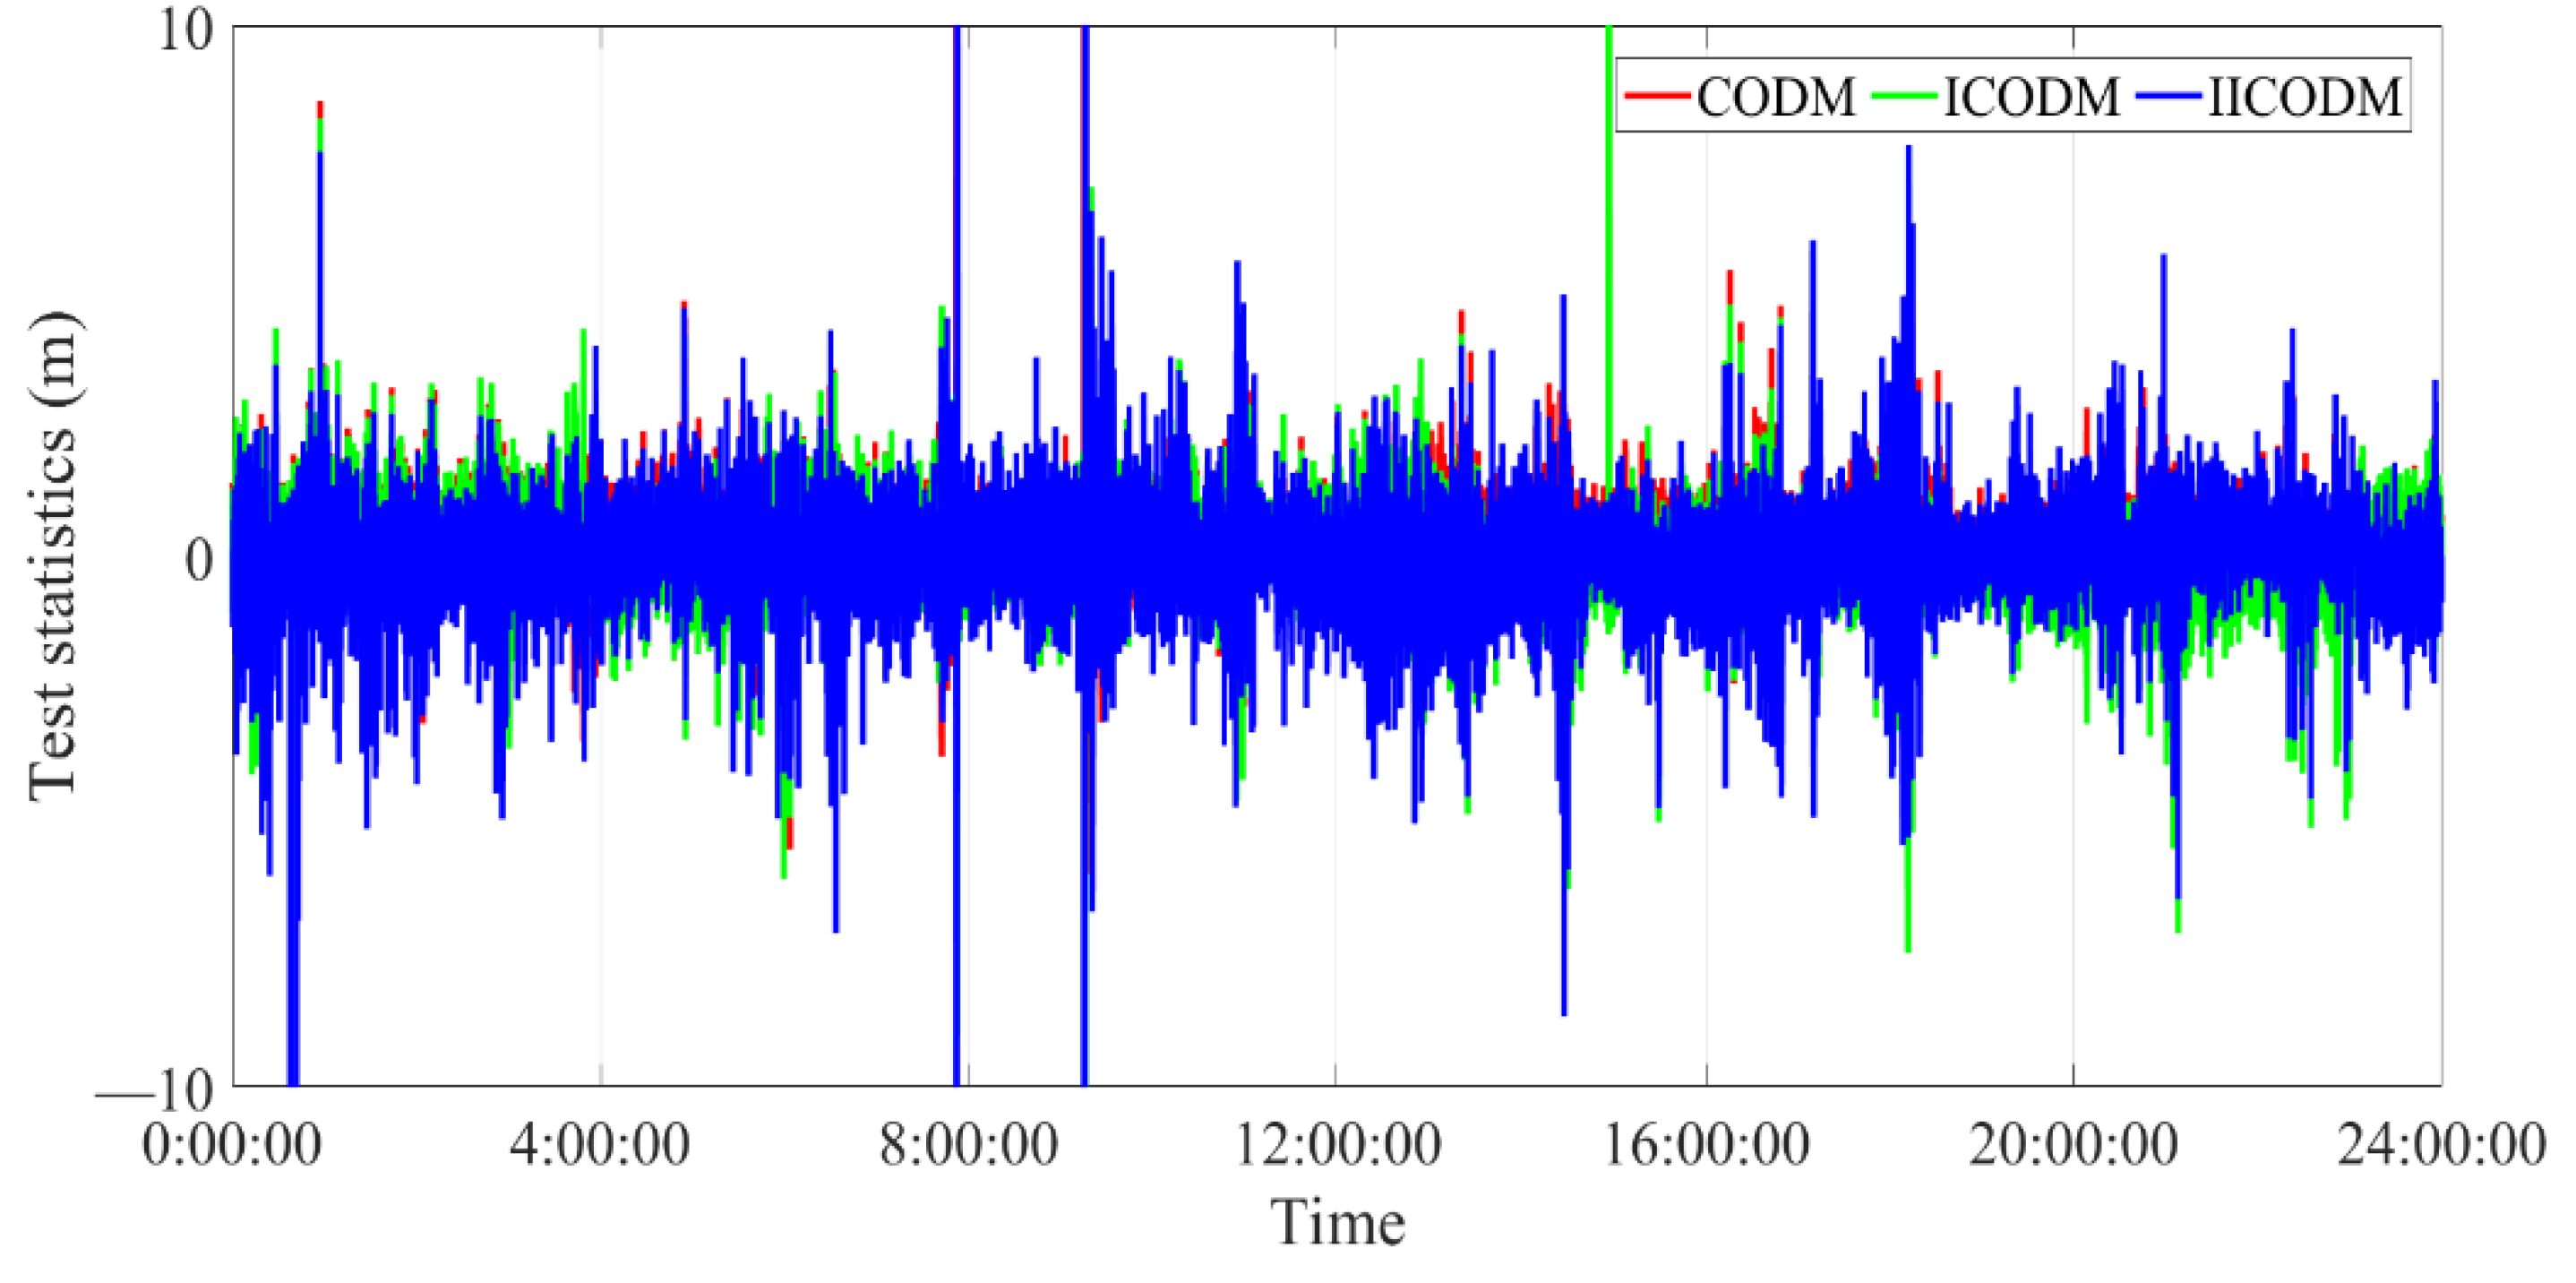
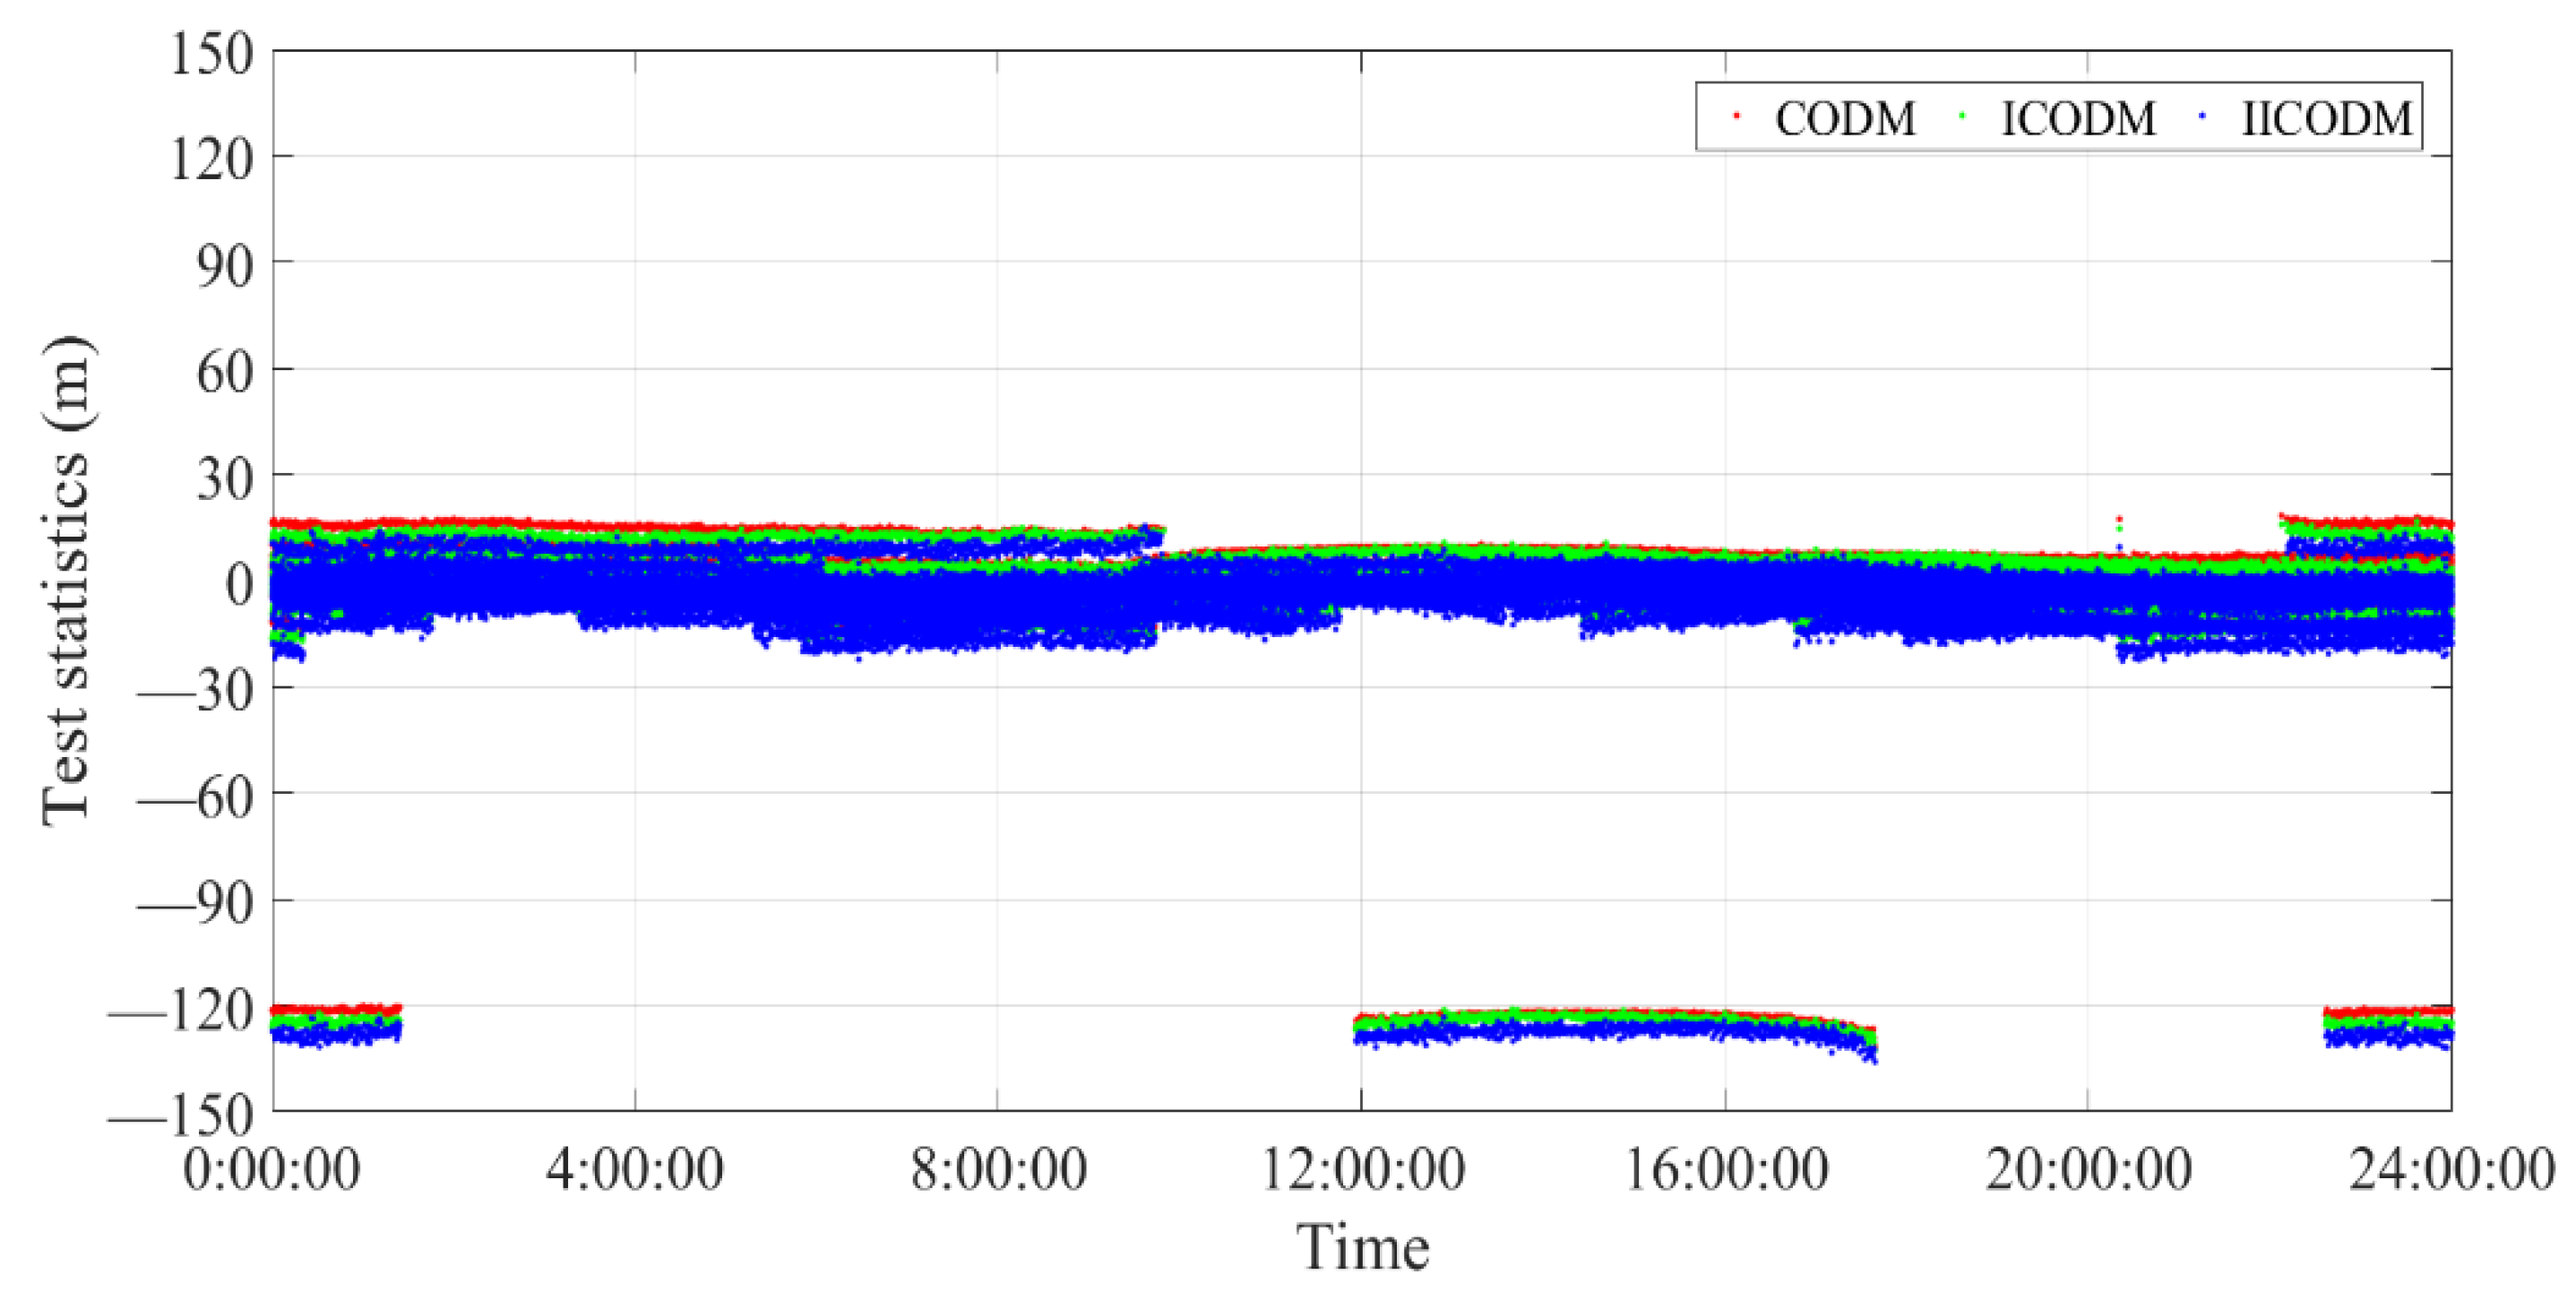
Blunder detection was carried out using the three pseudorange blunder detection methods in the previous section, and it was found that GPS and BDS observations from most MGEX stations did not have blunders, and very few MGEX stations or epochs also had pseudorange blunders. Here, the GPS observation data of the SC04 station and the BDS observation data of the BRMG station were used as examples to discuss, as shown in Figure 8 and Figure 9 respectively.
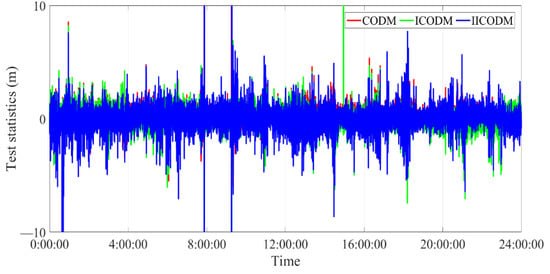
Figure 8.
Time series of test statistics of CODM, ICODM and IICODM at SC04 station under case1.
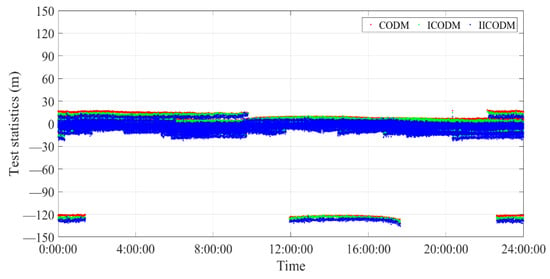
Figure 9.
Time series of test statistics of CODM, ICODM and IICODM at BRMG station under case2.
In addition, to show the efficiency and time consumption for these three methods, Table 7 shows the relative times of the three methods in the two cases expressed as percentages.

Table 7.
The computation time of three methods in two cases (%).
- (1)
- According to the given threshold, all three methods can detect code pseudorange blunders in GPS and BDS observations, and the maximum difference of the value of the test statistic calculated by the three methods does not exceed 2 m (red, green and blue colors in two figures).
- (2)
- Among the three methods, ICODM is based on CODM, and the IICODM method is based on ICODM. Therefore, blunders in CODM are reflected in the test statistics of the last two methods. For example, the test statistics calculated by the G01 satellite in CODM at the epoch time (9: 15: 30) of the SC04 station is 145.243 m. In ICODM, the test statistics related to the epoch and G01 satellite all exceed the threshold, and its value is about −145 m. The test statistics calculated by G01 in IICODM also exceed the threshold, and their values are between −145 m and 145 m. After data analysis, it is found that the pseudorange blunders in BDS observations are mainly caused by the C57 and C58 satellites. These two satellites are experimental Geosynchronous Earth Orbit (GEO) satellites with relatively poor observation quality.
- (3)
- According to Table 8, the CODM requires less computation time than the other two methods in both cases. The mathematical model of the CODM is simpler, as in Equations (5)–(10). Therefore, CODM is simple, practical and efficient. Under the same conditions, the CODM can find pseudorange blunder observations in GNSS faster than the other two methods. Although this paper discusses ICODM and IICODM, their practical significance is not very large, and the CODM is recommended for practical application.
 Table 8. Std value in NEU direction of SC04 and BRMG stations (m).
4.6. Analysis of the Influence of Blunder Detection Method on SPP
To analyze the influence of blunder detection method on SPP positioning, the CODM was used to compare the positioning results of the SC04 station and the BRMG station before and after blunder detection. The data processing strategy of SPP was as follows.
- (1)
- Global broadcast ephemeris was adopted for the ephemeris file in the SPP solution. GPS provided satellite orbit parameters, satellite clock parameters, satellite status information and other information every 2 h, while for BDS it was 1 h.
- (2)
- In the SPP solution, the GPS observation data adopted P2 and C2 pseudorange measurements under case1, while BDS adopted B1I and B3I measurements under case2.
- (3)
- The correction of the ionosphere delay used the Klobuchar model. The troposphere delay was corrected by the Saastamoinen model.
- (4)
- The weight matrix in the SPP Solution was determined by the well-known elevation angle method.
- (5)
- The influence of errors (e.g., ephemeris error, Earth’s solid tide and others) on the positioning accuracy was ignored.
- (6)
- The clock error of the receiver for each epoch was solved as an unknown parameter, absorbing the hardware delay of the receiver.
Figure 10 shows the coordinate time series of the SC04 station in North (N), East (E) and Up (U) directions before and after blunder detection in SPP. Figure 11 shows the coordinate time series of the BRMG station in three directions.

Figure 10.
Time series of the N, E and U directions of SCO4 station based on GPS C2 and P2 observation data before (a) and after (b) blunder detection.

Figure 11.
Time series of N, E and U directions of BRMG station based on BI1 and B3I observation data before (a) and after (b) blunder error detection.
From Figure 10 and Figure 11, it can be concluded that the variation of the time coordinate sequence of the two stations after blunder detection is smaller than the variation of the time sequence of the blunder detection coordinate. In particular, the observations of large blunders are significantly reduced. However, the variation of NEU direction after blunder detection is slightly greater than that before blunder detection in some epochs, mainly because blunder detection reduces the number of observations used for SPP solution in the epoch. The maximum values of Std in three directions before and after blunder detection are 10.746 m and 6.037 m, respectively. This shows that the blunder detection method proposed in this paper can significantly improve positioning performance.
5. Conclusions
The current GNSS blunder judgment criterion is only obtained by using the first-order difference of the code pseudorange observations, and the threshold value is generated empirically. This paper proposes three blunder detection methods, namely CODM, ICODM and IICODM, and constructs test statistics for these three methods. Using the GPS observation data of 137 MGEX stations and the BDS observation data of 232 MGEX stations, the performance of the three methods was analyzed in detail, and the corresponding thresholds are recommended.
- (1)
- On the whole, the average values of test statistics, RMSE and threshold of the three methods in case1 are significantly smaller than those in case2. The maximum values corresponding to the average values of the three statistics are 0.526, 0.752 and 2.243 m under case1, respectively. Under case2, the maximum values corresponding to the average values of the three statistics are 7.066, 4.490 and 13.480 m, respectively. This is mainly because the observed quality of GPS from global MGEX stations is higher than that of BDS, and the difference of the observation equation eliminates or weakens more errors with the same frequency and different types of code pseudorange observations. The recommended thresholds for the three methods in both cases are 5 m and 15 m, respectively, which are half of the reference values given in the current literature.
- (2)
- ICODM is obtained from the CODM operation between satellites, while IICODM is obtained from the ICODM operation between epochs. The mathematical model of CODM is simpler. Results of actual data demonstrate that CODM can find blunders more easily and faster and is more suitable for data preprocessing in the GNSS observation domain under the same conditions. The ICODM and IICOMD discussed in this paper are new models, and the CODM is recommended. It also is proved that the blunder detection method proposed improves the positioning performance.
- (3)
- Although this paper uses GNSS observations and the Bessel formula to calculate the threshold, the calculated threshold is smaller than the reference value given by the existing literature, mainly because this paper uses the latest data, and the data quality is better than for past GNSS data. However, there are many deficiencies in calculation of the threshold, such as the limited amount of GNSS data used. The method for calculating the threshold needs to be further studied, and there are many unknown factors that have not been considered. The calculated threshold is only a reference.
- (4)
- The pseudorange blunder detection methods proposed in this paper are based on the principle of simplicity, practicality and efficiency, and are carried out in the observation domain. The methods can only detect the blunder larger than the threshold value in the preprocessing before solving. The methods can also detect the blunders contained in GNSS pseudorange observations without misjudging the normal carrier phase observations in cycle slip detection. These issues will be the subject of future research related to their impact on positioning, using a more rigorous method of gross error detection to repair blunders.
Author Contributions
Methodology, X.M. and Q.W.; software, L.Z.; validation, X.H.; writing—original draft preparation, K.Y. and L.Z.; writing—review and editing, K.Y. and X.H.; visualization, Q.W.; funding acquisition, X.M. All authors have read and agreed to the published version of the manuscript.
Funding
This research was funded by the National Key Research and Development Program (2016YFB0502102), the National Natural Science Foundation of China (41904171, 42104023, 42274039, 42074039), Jiangxi University of Science and Technology High-level Talent Research Startup Project (205200100564), Local special scientific research plan project of Shaanxi Provincial Department of Education (22JE012).
Data Availability Statement
Not applicable.
Conflicts of Interest
The authors declare no conflict of interest.
References
- Teunissen, P.; Montenbruck, O. Springer Handbook of Global Navigation Satellite Systems; Springer International Publishing: New York, NY, USA, 2017. [Google Scholar]
- Leick, A.; Rapoport, L.; Tatarnikov, D. GPS Satellite Surveying, 4th ed.; John Wiley & Sons: Hoboken, NJ, USA, 2015. [Google Scholar]
- Li, Z.; Huang, J. GPS Surveying and Data Processing; Wuhan University Press: Wuhan, China, 2013. [Google Scholar]
- Blewitt, G. An automatic editing algorithm for GPS data. Geophys. Res. Lett. 1990, 17, 199–202. [Google Scholar] [CrossRef]
- Hatch, R. The synergism of GPS code and carrier measurements. In Proceedings of the International Geodetic Symposium on Satellite Doppler Positioning, Las Cruces, NM, USA, 8–12 February 1983; Volume 2, pp. 1213–1231. [Google Scholar]
- Goad, C. Precise positioning with the global position system. In Proceedings of the 3rd International Symposium on Inertial Technology for Surveying and Geodesy, Banff, AB, Canada, 16–20 September 1985; pp. 745–756. [Google Scholar]
- Melbourne, W. The case for ranging in GPS-based geodetic systems. In Proceedings of the First International Symposium on Precise Positioning with GPS, Rockville, MD, USA, 15–19 April 1985; pp. 373–386. [Google Scholar]
- Wubbena, G. Software developments for geodetic positioning with GPS using TI 4100 code and carrier measurements. In Proceedings of the 1st International Symposium on Precise Positioning with the Global Positioning System, Rockville, MD, USA, 15–19 April 1985; US Department of Commerce: Washington, DC, USA; pp. 403–412. [Google Scholar]
- Li, J.; Yang, Y.; Xu, J.; He, H.; Guo, H. Real-time cycle-slip detection and repair based on code-phase combinations for GNSS triple-frequency Un-differenced observations. Acta Geod. Et Cartogr. Sin. 2011, 4, 717–723. [Google Scholar]
- Zhang, C.; Dang, Y.; Xue, S.; Zhang, L. Detection and repair of the Non-significant Cycle slip in BDS triple-frequencies GIF combination. Acta Geod. Et Cartogr. Sin. 2018, 47, 38–44. [Google Scholar]
- Han, B.; Ou, J.; Chai, Y. Detecting and repairing the gross errors and cycle slips by QUAD method. Geomat. Inf. Sci. Wuhan Univ. 2002, 27, 246–250. [Google Scholar]
- Huang, B.; Liu, L.; Gao, G.; Zhou, J. Detection of Cycle-slip in the GPS precise point positioning Based on Wavelet transform. Geomat. Inf. Sci. Wuhan Univ. 2006, 31, 512–515. [Google Scholar]
- Wu, Y.; Wang, J.; Hu, D. A new technique for INS/GNSS attitude and parameter estimation using online optimization. IEEE Trans. Signal Process. 2014, 62, 2642–2655. [Google Scholar] [CrossRef]
- Teunissen, P. Quality control in integrated navigation systems. IEEE Aerosp. Electron. Syst. Mag. 1990, 5, 35–41. [Google Scholar] [CrossRef]
- Yang, Y.; Gao, W. Comparison of Two Fading Filters and Adaptively Robust Filter. Geomat. Inf. Sci. Wuhan Univ. 2006, 31, 980–982. [Google Scholar] [CrossRef]
- Bei, J. GNSS Integrity Monitoring Method, Technology and Application. Ph.D. Thesis, Wuhan University, Wuhan, China, 2010. [Google Scholar]
- Navon, E.; Bobrovsky, B. An efficient outlier rejection technique for Kalman filters. Signal Process. 2021, 188, 108164. [Google Scholar] [CrossRef]
- Teunissen, P.; Khodabandeh, A.; Psychas, D. A generalized Kalman filter with its precision in recursive form when the stochastic model is misspecified. J. Geod. 2021, 95, 108. [Google Scholar] [CrossRef]
- Turza, M. Navigation system integrity monitoring using redundant measurements. Navigation 1988, 35, 483–501. [Google Scholar]
- Sturza, M.; Brown, A. Comparison of fixed and variable threshold RAIM algorithms. In Proceedings of the 3rd International Technical Meeting of the Satellite Division of The Institute of Navigation (ION GPS 1990), Colorado Spring, CO USA, 21 September 1990; pp. 437–443. [Google Scholar]
- Brown, A.; Sturza, M. The effect of geometry on integrity monitoring performance. In Proceedings of the 46th Annual Meeting of The Institute of Navigation (1990), Atlantic, NJ, USA, 26–28 June 1990; pp. 121–129. [Google Scholar]
- Brown, R.; Chin, G.; Kraemer, J. Update on GPS Integrity Requirements of the RTCA MOPS. In Proceedings of the 4th International Technical Meeting of the Satellite Division of the Institute of Navigation (ION GPS 1991), Albuquerque, NM, USA, 11–13 September 1991; pp. 761–772. [Google Scholar]
- FAA. GNSS Evolutionary Architecture Study Phase I—Panel Report. In GNSS Evolutionary Architecture Study; FAA: Washington, DC, USA, 2008. [Google Scholar]
- Pervan, B.; Pullen, S.; Christie, J. A multiple hypothesis approach to satellite navigation integrity. Navigation 1998, 45, 61–71. [Google Scholar] [CrossRef]
- Bang, E.; Milner, C.; Macabiau, C. Cross-correlation effect of ARAIM test statistic on false alarm risk. GPS Solut. 2020, 24, 107. [Google Scholar] [CrossRef]
- Han, Q.; Luo, S.; Luo, S.; Shu, B.; Yue, C. Optimal allocation of risk probability based on ARAIM algorithm. Acta Geod. Et Cartogr. Sin. 2021, 50, 1751–1761. [Google Scholar]
- Gao, Y.; Jiang, Y.; Gao, Y.; Huang, G. A linear Kalman filter-based integrity monitoring considering colored measurement noise. GPS Solut. 2021, 25, 59. [Google Scholar] [CrossRef]
- Zhao, P.; Joerger, M.; Liang, X.; Pervan, B.; Liu, Y. A New Method to Bound the Integrity Risk for Residual-Based ARAIM. IEEE Trans. Aerosp. Electron. Syst. 2021, 57, 1378–1385. [Google Scholar] [CrossRef]
- Liu, B.; Gao, Y.; Gao, Y.; Wang, S. HPL calculation improvement for Chi-squared residual-based ARAIM. GPS Solut. 2022, 26, 45. [Google Scholar] [CrossRef]
- Sun, Y. RAIM-NET: A deep neural network for receiver autonomous integrity monitoring. Remote Sens. 2020, 12, 1503. [Google Scholar] [CrossRef]
- Sun, R.; Wang, J.; Cheng, Q.; Mao, Y.; Ochieng, W.Y. A new IMU-aided multiple GNSS fault detection and exclusion algorithm for integrated navigation in urban environments. GPS Solut. 2021, 25, 147. [Google Scholar] [CrossRef]
- Sun, R.; Qiu, M.; Liu, F.; Wang, Z.; Ochieng, W.Y. A Dual w-test based quality control algorithm for integrated IMU/GNSS navigation in urban areas. Remote Sens. 2022, 14, 2132. [Google Scholar] [CrossRef]
- Wang, S.; Zhan, X.; Zhai, Y.; Liu, B. Fault detection and exclusion for tightly coupled GNSS/INS system considering fault in state prediction. Sensors 2020, 20, 590. [Google Scholar] [CrossRef] [PubMed]
- Guo, F. Theory and Methodology of Quality Control and Quality Analysis for GPS Precise Point Positioning. Ph.D. Thesis, Wuhan University: Wuhan, China, 2013. [Google Scholar]
Publisher’s Note: MDPI stays neutral with regard to jurisdictional claims in published maps and institutional affiliations. |
© 2022 by the authors. Licensee MDPI, Basel, Switzerland. This article is an open access article distributed under the terms and conditions of the Creative Commons Attribution (CC BY) license (https://creativecommons.org/licenses/by/4.0/).

