Technical Note

Methods and Algorithms of Subsurface Holographic Sounding

1
Pushkov Institute of Terrestriaj Magnetism, Ionosphere and Radio Wave Propagation, Troitsk, 108840 Moscow, Russia
2
JSC Company VNIISMI, 127566 Moscow, Russia
*
Author to whom correspondence should be addressed.
Remote Sens. 2022, 14(20), 5274; https://doi.org/10.3390/rs14205274
Submission received: 19 August 2022 / Revised: 18 October 2022 / Accepted: 18 October 2022 / Published: 21 October 2022

Abstract

:
In our experiments, we develop and test portable multi-element receiver antenna arrays, electrically scanned in order to immediately obtain a recognizable image of subsurface objects. Two quadrature components of the radar return signal are processed with a Kirchhoff backward migration algorithm. Physical theory is used to assess the quality of the holographic image, and the synthetic aperture approach is developed and tested. The parabolic wave equation and Gaussian beam technique are used in order to take into account refraction effects and to suppress specular reflection from the air-ground interface. Laboratory and field tests confirmed the predicted device parameters.

Graphical Abstract

1. Introduction

In the literature on georadar (ground penetrating radar, GPR), the idea of using the holography principle [1] to obtain in real time a volumetric picture of subsurface scatterers or electrically contrasting media boundaries has long been discussed (see, e.g., [2,3,4]). Attempts of subsurface object visualization by means of microwave holography started in the 1960s [5]. During those times, the possibilities of measurement and computation were not adequate to perform this task. Recently, substantial progress was made in the radio-frequency wave monitoring of closed rooms and identification of moving objects (“through-wall vision” [6]), as well as in the problems of defectoscopy, medicine, hidden weapons detection, and humanitarian demining [7,8,9,10,11,12]. Here, basic difficulties are encountered: the unfavorable relationship between the wavelength, object dimensions, probing range, and antenna array aperture; the EM wave attenuation in subsurface matter; and strongly interfering interface reflection. These problems are partially mitigated by scanning the material surface with a combined microwave transceiver. Considerable progress in instrumental and methodical development has been described in a number of monographs and journal publications (see, e.g., [13,14]). However, the scanning method essentially hinders and complicates the process of subsurface vision and limits the range of practical applications.
Our work was aimed at the visualization of subsurface environment and embedded electrically contrasted objects (“underground and in-wall vision”) without close contact with the surface. Here, we applied another scheme of registration and processing of the subsurface probing data: the object of interest, embedded in a dielectric half-space, is illuminated from outside with harmonic microwave radiation. The amplitude and phase distribution of the scattered signal is captured by a multi-element receiver array separated from the material surface. Imaging of the scattering object is performed via mathematical wave front inversion. The use of a holographic receiver array gives an immediate diffraction-limited image of the subsurface object.
In our papers [15,16,17,18,19], we described an analytical approach and numerical algorithms allowing one to explain quantitatively the image formation of a complicated object in microwave holography. It was shown that the main role in the image distortion involves losing a part of the scattered radiation angular spectrum. We derived a quantitative estimate of the holographic radar spectral window and pointed out a way to increase the spatial resolution of the radar by the synthetic aperture approach. Having in mind future applications in near-surface geophysics, we generalized the Kirchhoff inversion procedure [1] to the case of a stratified non-uniform medium. In this case, the integral operator relating microwave image with the object shape is almost identical to its free-space case but takes account of the wave reflected from the interface and the refraction in the material medium. As shown in [10], it is possible to get the best data quality from the uneven surface when the antenna height is about λ/2. Our theory can be applied in laboratory and field experiments, with the antenna detached from the surface, and also for lower working frequencies used in order to obtain deep penetration [20]. The experimental implementation of subsurface imaging was performed, and efficient methods of eliminating the interfering reflection from the material boundary were developed. Laboratory and field experiments demonstrated the possibility to reconstruct a recognizable microwave image of an electrically contrasted object in a material medium.
In this review, we overview the development and testing of the compact holographic subsurface radar (HSR) at the Pushkov Institute of Terrestrial Magnetism, Ionosphere and Radio Wave Propagation (IZMIRAN), in collaboration with industrial partners. The practical aim of this project was to develop methods and algorithms for the detection and visualization of foreign objects in the material environment, such as rebars and voids in building structures, or buried objects in the subsurface environment.

2. IZMIRAN Works on Holographic Near-Field Radar
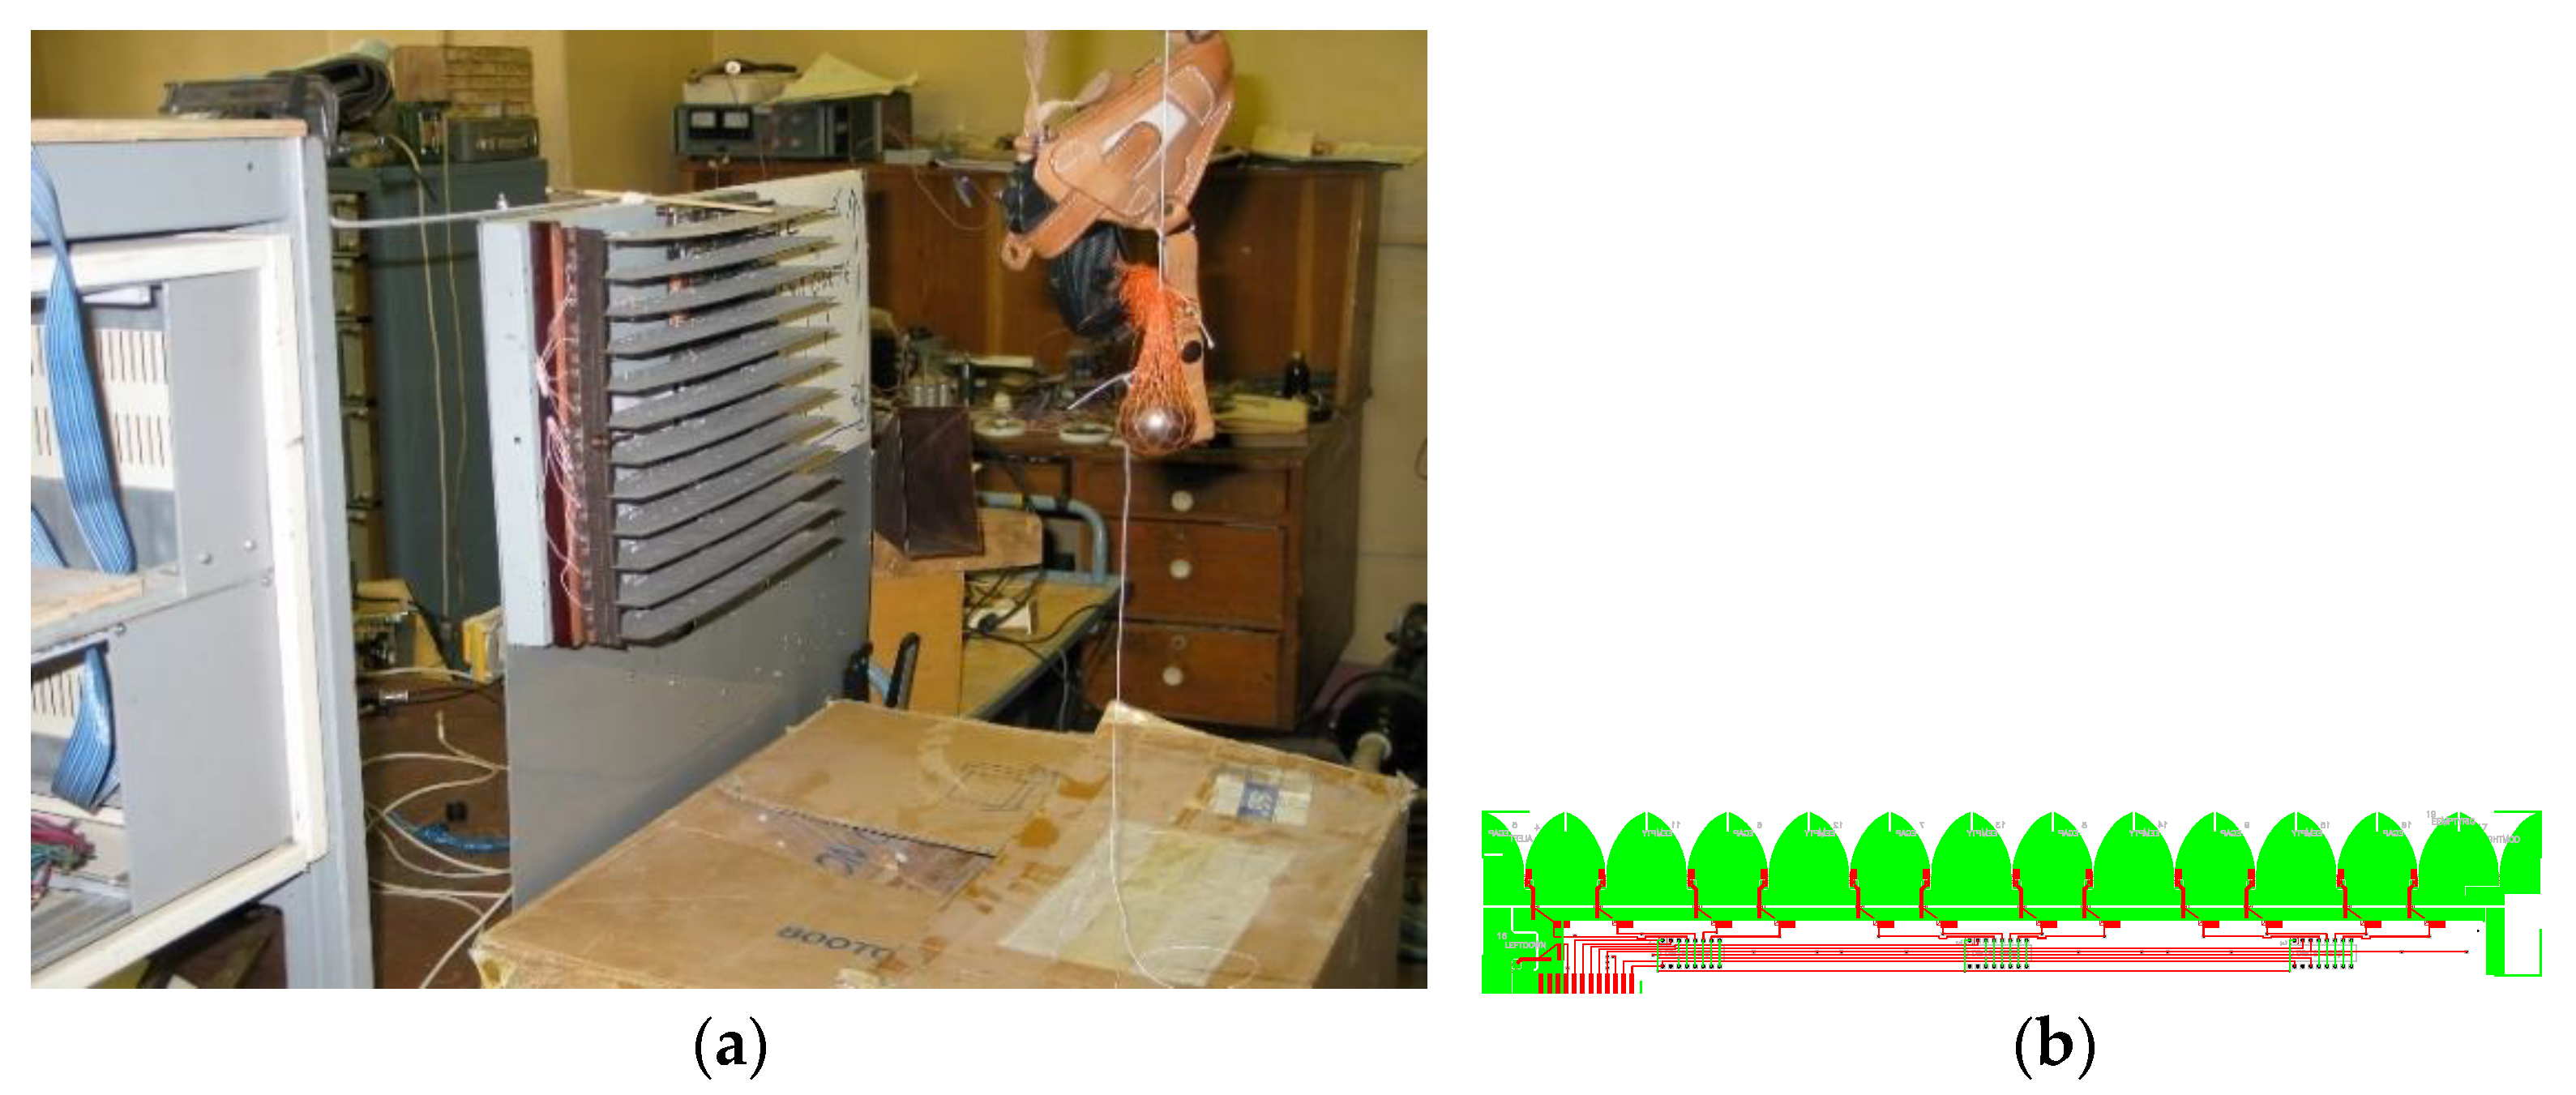
2.1. Brief History

Experimental works on subsurface holographic radar started at IZMIRAN around 2000 [15] from laboratory experiments with a two-quadrature component receiver antenna mechanically scanning a drawing board illuminated by the scattered radiation of a test object.
As shown in Figure 1, a 25 × 25 element phase hologram registered with a two-component receiver antenna scanning a 60 × 60 cm area allows one to reconstruct a typical test object from its microwave hologram. Based on these experiments, in cooperation with specialists from the Moscow Institute of Instrument Engineering V.V. Rinkus and L.M. Yakuben, a working sample of a holographic subsurface radar with a 12 × 12 array of Vivaldi planar horn antennas (a quarter of the prospective 24 × 24 antenna), see Figure 2, was manufactured [16].
Experimental tests of this device were carried out at the EPOS department of IZMIRAN (A.E. Reznikov, V.V. Kopeikin, S.A. Annakuliev) and later in St. Petersburg at JSC Jupiter-Z (N.A. Fedorov, N.E. Podozerov), together with A.V. Popov and graduate students V.A. Vinogradov and S.A. Zapunidi [17]. The development of a planar antenna array for subsurface radar (V.V. Kopeikin, N.A. Fedorov) also was started there—see Figure 3.
These works ended in the 2010th with the creation of a working sample of holographic microwave introscope by JSC Company VNIISMI (A.I. Berkut, V.V. Kopeikin, P.A. Morozov). Two copies of the device were provided to IZMIRAN for laboratory tests and software development (V.V. Kopeikin, D.E. Edemsky, I.V. Prokopovich). These works contributed to the creation of the physical theory of subsurface microwave holography (A.V. Popov, I.V. Prokopovich) and practical sounding techniques (V.V. Kopeikin, D.E. Edemsky) [18,19]. They were suspended in 2018 due to the death of V.V. Kopeikin and the loss of one of the experimental samples of the device.

2.2. First Estimates, Preliminaey Experiments

The experimental stand was mounted in the laboratory building of IZMIRAN—see Figure 4a. The setup included a wall simulator, an 80 × 60 × 30 cm box filled with dry sand, and a container of test objects (1). The radiator horn antenna (2), the receiver antenna array (3), and the test object container were placed on a work table surrounded by radio-absorbing material (4). In order to reconstruct the image of the subsurface object by Kirchhoff approximation [1,21] and visualize the results, the internal device software was used, as well as special computer codes developed in Matlab environment—see Figure 4b.
Previous experimental work has shown that in order to obtain a high-quality radar image it is necessary to choose the optimal illumination conditions, ensuring that the main part of the radiation scattered by the object was falling into the aperture of the receiving array and minimizing the distortions caused by diffraction effects. Significant improvement in the quality of the radio image, as shown in [18,19], can be achieved by coherent multi-view sensing.
The quality of the radio image is greatly affected by the “glare” caused by the side radiation from the transmitter hitting the receiver antenna aperture or by the transmitter signal reflected from the surface of the medium under study. These signals may significantly exceed the level of the signal reflected from the alien objects in the subsurface environment. In some cases, this interference may make the process of detecting and locating subsurface objects impossible. To assess the performance of the device in the introscope mode and to find ways to optimize the conditions of irradiation and minimize the influence of parasitic illumination, experiments were carried out in laboratory conditions.
The first tests allowed us to estimate the attenuation of the radar signal when radiation passed through the thickness of sand. Irradiation of the object from the side wall of the box (Figure 5a) excluded the direct illumination of the antenna aperture by the transmitter and at the same time uniformly irradiated the object in the material medium. The experiments with side-wall illumination showed that, in the absence of direct illumination of the receiver aperture by the transmitter and the glare from the interface into the antenna aperture, it is possible to confidently register objects located in the material medium at a depth of not less than 30 cm.
Experiments with side-wall illumination were carried out both with the transmitter antenna located on the media interface and in the case of remote illumination—see Figure 6. The level of the registered signal from the reinforcement bar in sand, judging by the holograms, was more than by 10 dB higher than the noise level. Tests with the illumination at an angle to the medium surface plane and evaluation of the registered signal level were carried out as well. In order to reduce the influence of the illumination of the receiver antenna array with the reflected wave, in some experiments it was placed on the back side of the box—see Figure 5b.
From the results of the experiment, we saw that with a change of the illumination angle from 90 to 30 degrees relative to the surface of the box, the scattered signal from the bar was confidently fixed, although its amplitude decreased with the decrease in the angle of illumination. However, even against the background of the surface wave and scattered signals from the sand inhomogeneities, it was quite distinguishable without additional processing. For real-life measurements, on the basis of these visualization experiments, we decided on the option of placing the receiver array at a distance of about 40 cm from the object under study.
The VNIISMI HSR prototype works in a rather narrow frequency range of Δ f ~ 0.1 GHz around f ~ 9.9 GHz. The operating frequency band was chosen as a trade-off between mutually contradicting requirements of penetration depth and spatial resolution. The frequency range Δ f allowed the operator to select an optimal frequency preferable for “monochrome” vision—the third one in Figure 7—and to introduce an equalizing factor in multi-frequency experiments and object depth estimation [17,22].
These preliminary experiments were useful to develop the methods of multi-position sensing and synthetic aperture that are discussed below.

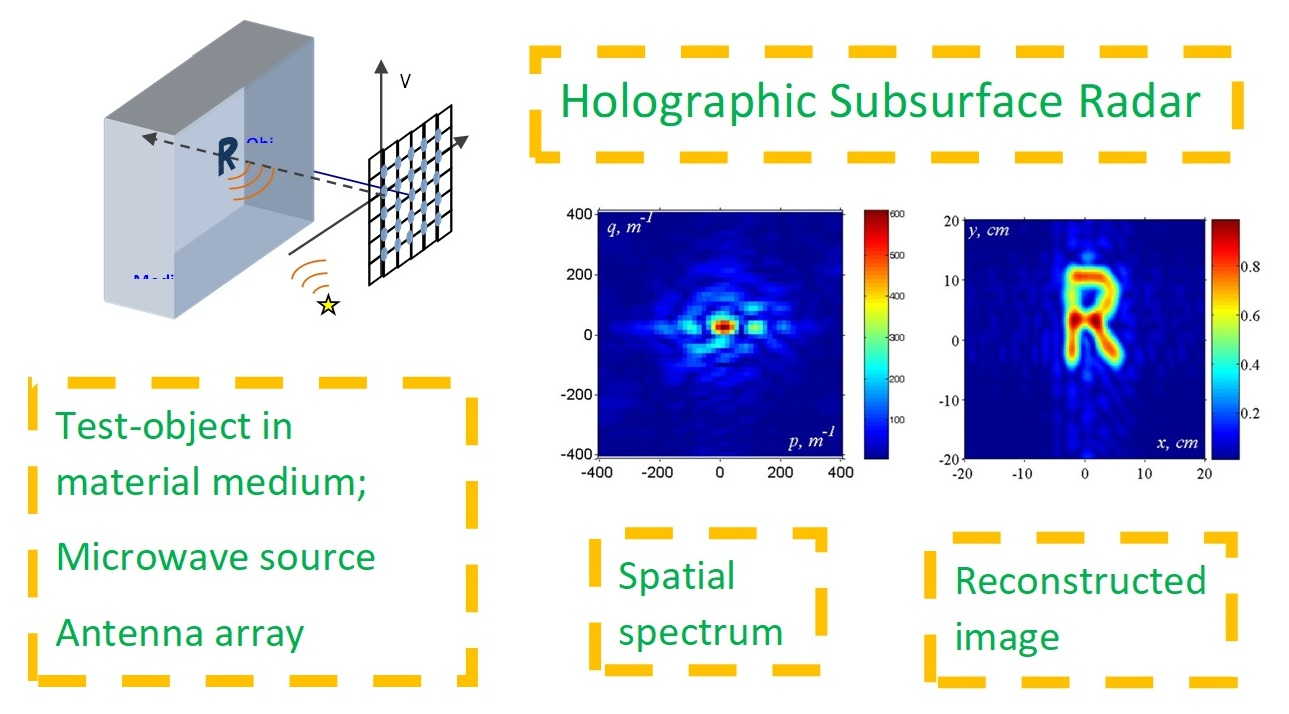
3. Methods of Subsurface Radar Holography

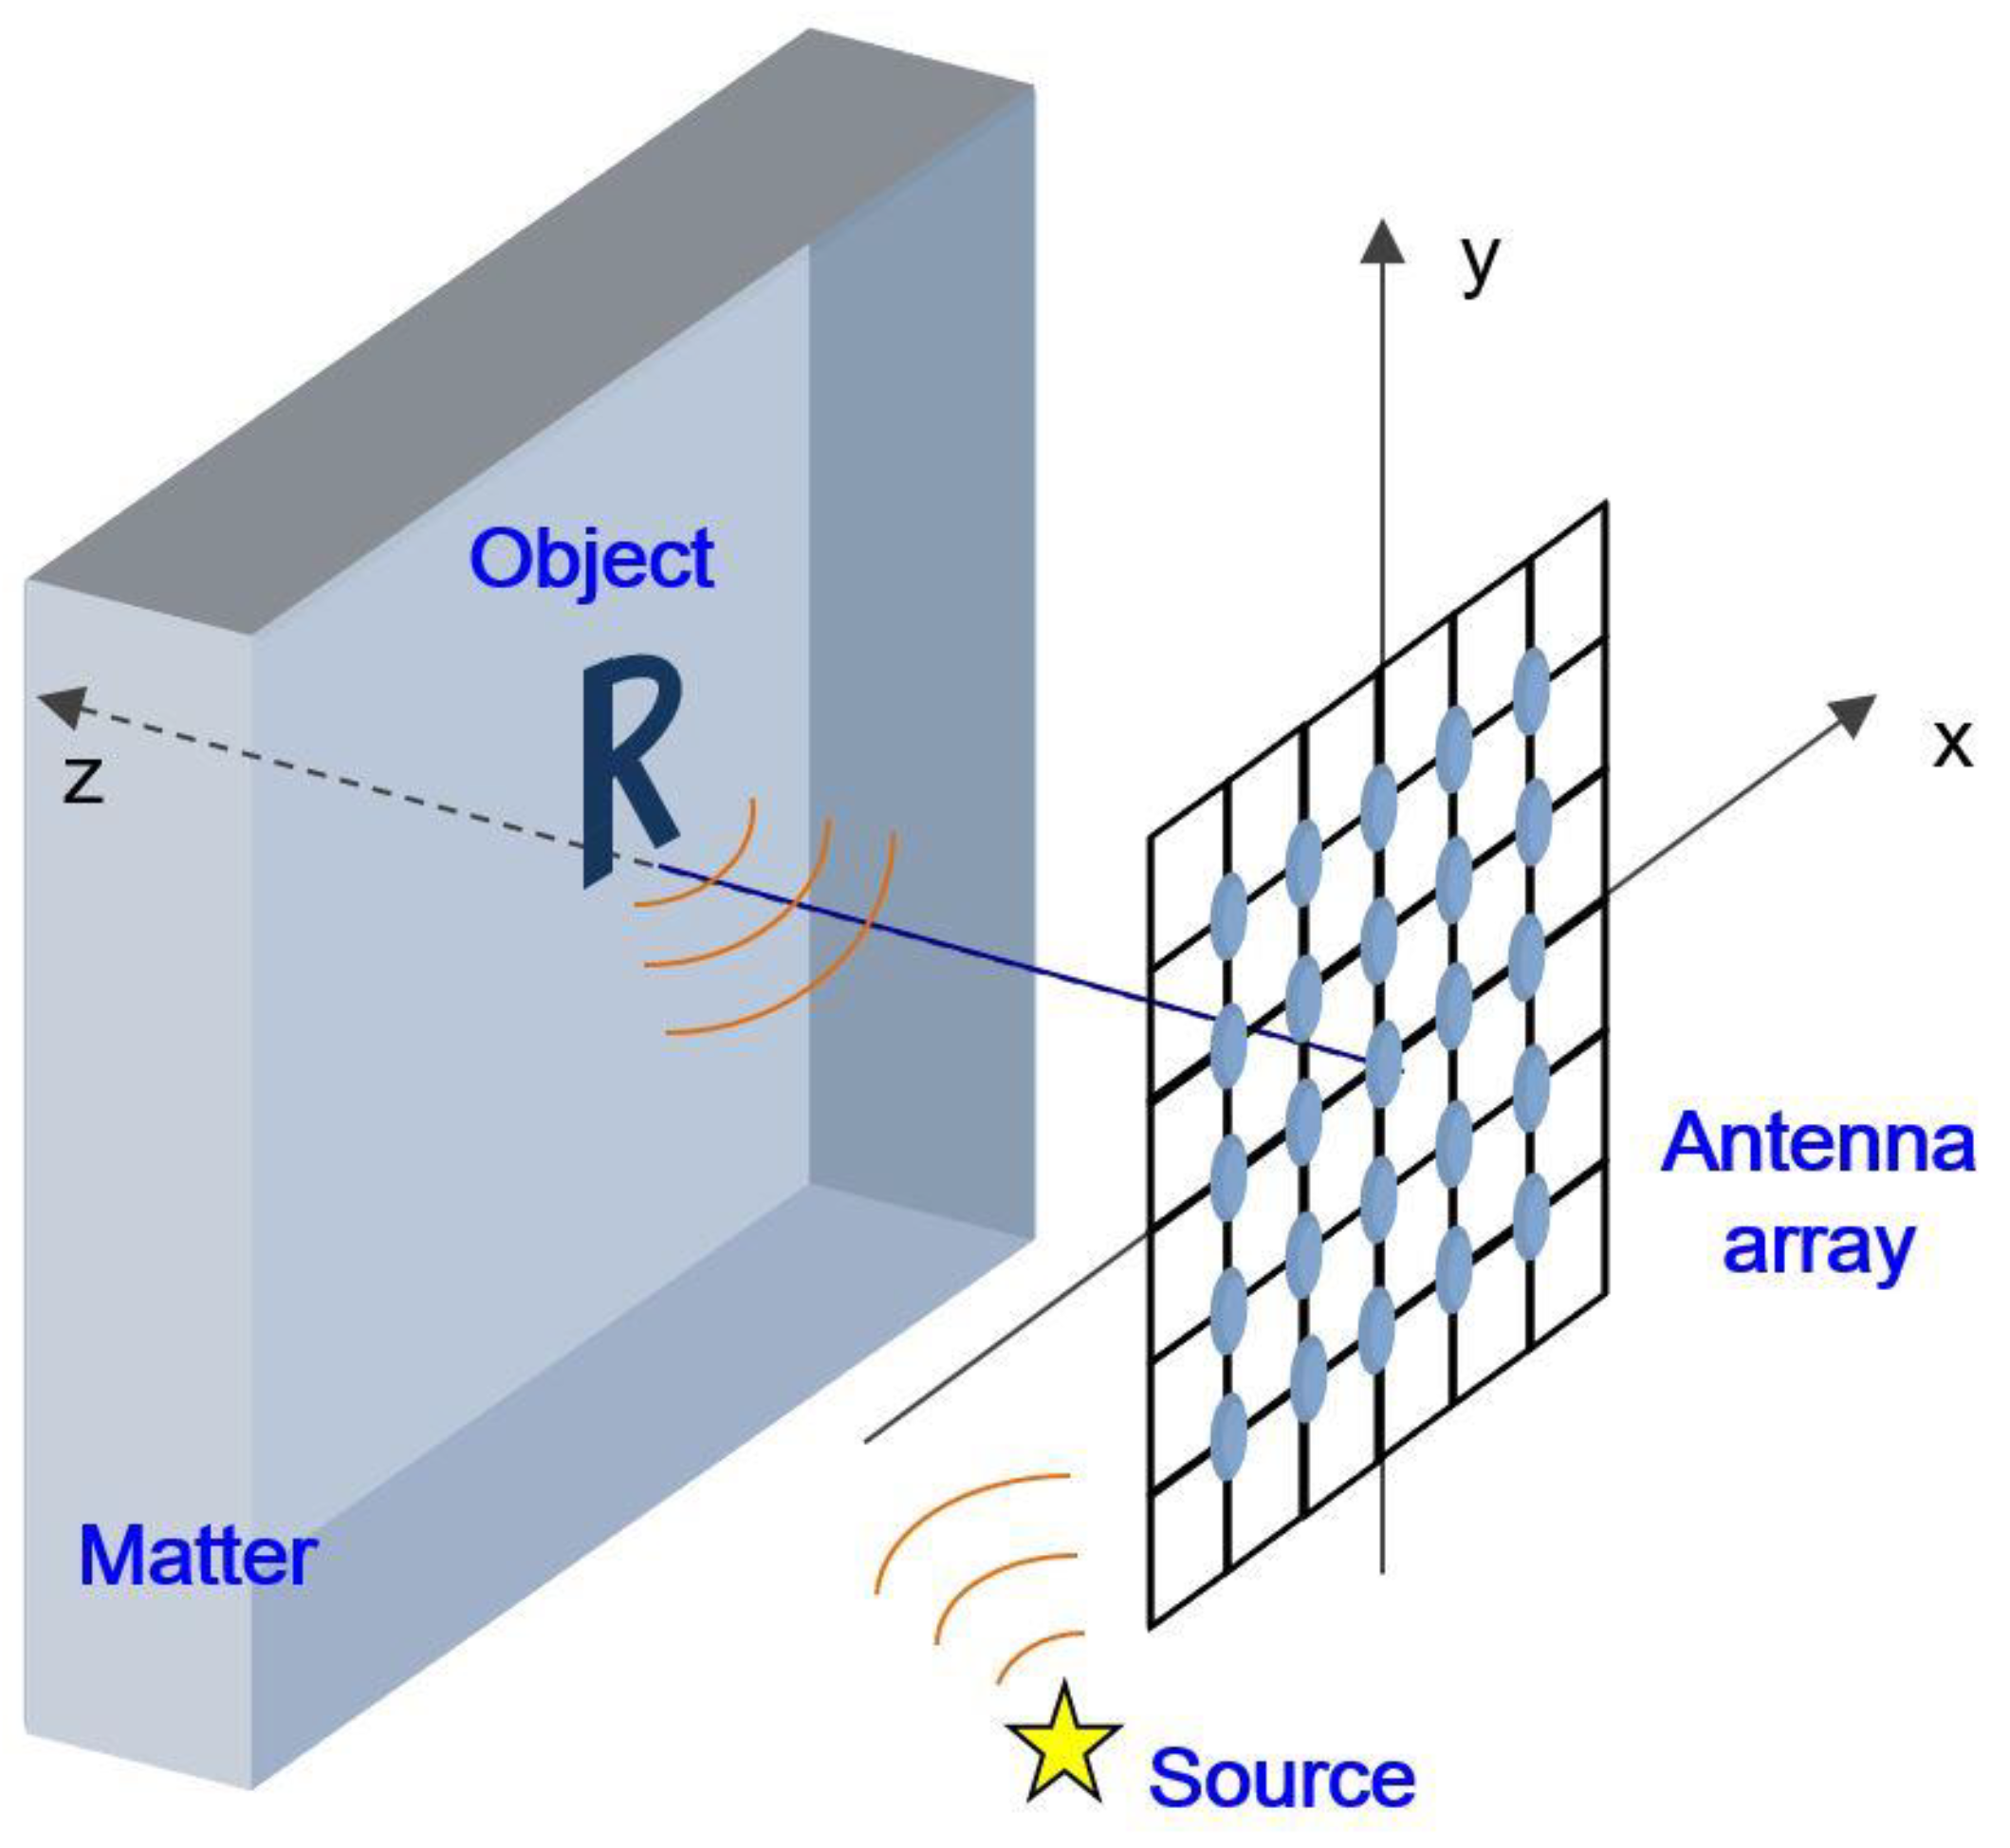
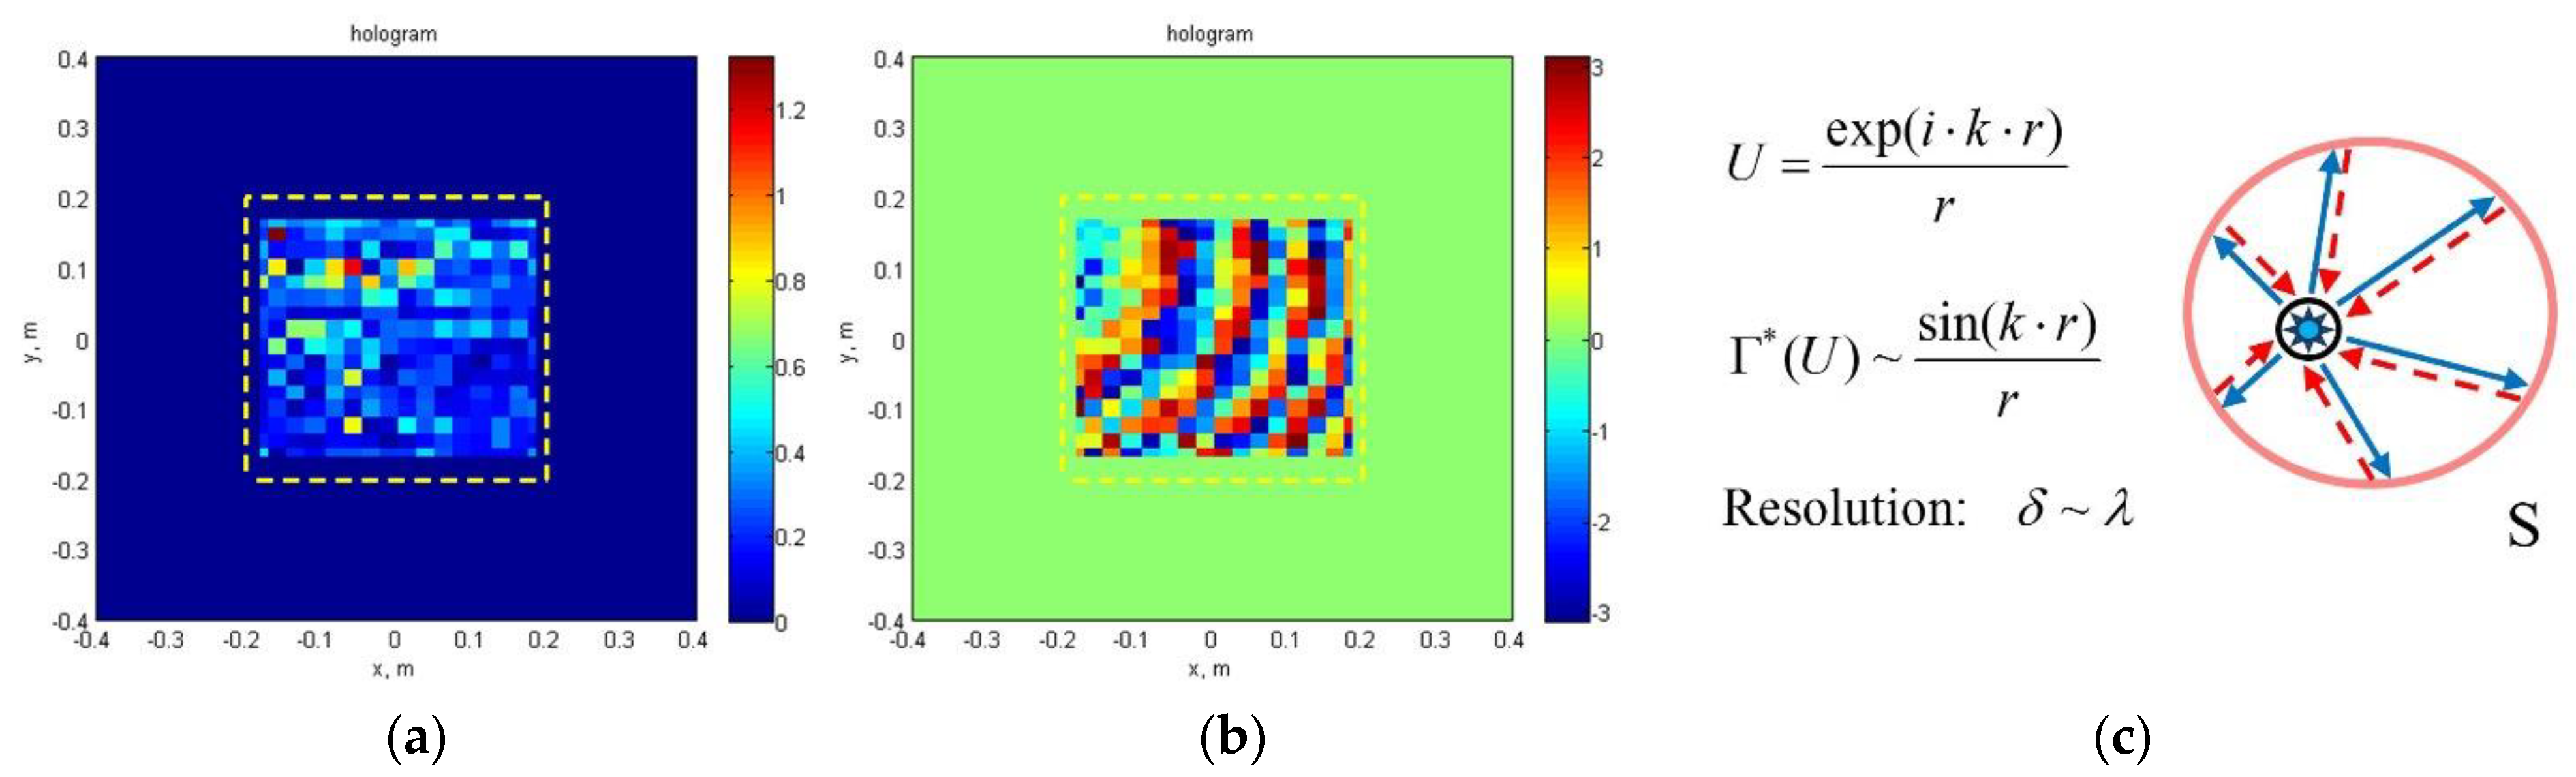
3.1. Physical Theory of Image Formation

Consider the standard scheme of subsurface radio holography and its practical implementation. The experimental setup is shown in Figure 8. A flat aluminum or cardboard 10 × 15 cm stencil is placed at a 10–15 cm depth in a box filled with sand and irradiated by a microwave horn source—see Figure 4a. Incident radiation penetrates the material medium, being scattered by the immersed object and returning back through the interface to be registered by a 16 × 16 element holographic receiver array.
Two-quadrature components of the received signal, obtained with a phase converter [23] and recalculated into the “digital hologram (mplitudeand phase distribution in the receiving antenna aperture—Figure 9a), serve as an initial condition for the scattering object reconstruction. The process of scattered wave front conversion is described by the inverse Green theorem illustrated by the schematic picture Figure 9c. While the classical Green formula [1,21] reads as follows:
Γ ( U ) 1 4 π S ( U ( r ) G n G ( r , r ) U n ) d S , G ( r , r ) = exp ( i k R ) R , R = | r r |
and provides smooth continuation of the propagating wave U ( r ) through an arbitrary closed contour S; its complex-conjugate:
Γ * ( U ) 1 4 π S ( U ( r ) G * n G * ( r , r ) U n ) d S ,
returns it backward, producing diffraction-limited image of the wave source. Figure 9c illustrates the action of this “anti-Green” formula [17] on the simplest example of a point source when, receiving an elementary spherical wave U = exp ( i k r ) / r with singularity at the origin, it returns a regular function Γ * ( U ) sin ( k r ) / r , transforming the singularity of the point source into a sharp peak with a diameter on the order of wavelength. This example illustrates the maximum resolution achievable in microwave holography.
In practice, we have not a closed Green’s surface but a limited aperture of the receiver antenna. For simplicity, at this stage we neglect the effects of polarization of the radiation and limit ourselves to the paraxial approximation. In free space, the reconstruction of the scattered field can be performed using the “anti-Green” Formula (2). Applying the Fresnel–Kirchhoff approximation [1,21] we use the measured electric field amplitude h ( x 0 , y 0 ) E s ( x 0 , y 0 , 0 ) as an initial condition for so called Kirchhoff wave front inversion [4]—paraxial version of the inverse Green theorem (2):
E rec ( x , y , z ) = k 2 π i a a b b h ( x 0 , y 0 ) e i k R 0 R 0 d x 0 d y 0 , R 0 z + ( x x 0 ) 2 + ( y y 0 ) 2 2 z
For a planar test object R characterized by a binary reflection coefficient f ( ξ , η ) = { 1 , ( ξ , η ) R 0 , ( ξ , η ) R , its digital hologram can also be calculated in the Kirchhoff approximation:
E s ( x 0 , y 0 , 0 ) = e i k k 2 π i l E 0 ( ξ , η , l ) f ( ξ , η ) e i k ( ξ x 0 ) 2 + ( η y 0 ) 2 2 l d ξ d η
For a plane incident wave E 0 ( ξ , η , l ) = exp [ i k ( ξ sin α 0 + η sin β 0 ) ] , we have an integral operator relating the object shape f ( ξ , η ) with its radar image g ( x , y ) = E rec ( x , y , l ) :
g ˜ ( x , y ) = 1 π 2 f ˜ ( ξ , η ) e i ( p 0 ξ + q 0 η ) sin μ ( ξ x ) ξ x sin ν ( η y ) η y d ξ d η ;   where f ˜ ( ξ , η ) = f ( ξ , η ) e i k ξ 2 + η 2 2 l , g ˜ ( x , y ) = g ( x , y ) e i k x 2 + y 2 2 l , p 0 = k sin α 0 , q 0 = k sin β 0 , μ = k a , ν = k b
In an ideal case, using integral Equation (5), it would be possible to reconstruct the object f ( ξ , η ) from its radar image g ( x , y ) . Unfortunately, in a general case it has no solution [24]. It can be understood by applying Fourier transform
F ˜ ( p , q ) = f ˜ ( x , y ) e i ( p x + q y ) d x d y , G ˜ ( p , q ) = g ˜ ( x , y ) e i ( p x + q y ) d x d y
reducing integral Equation (5) to an elementary functional equation [18]
G ˜ ( p , q ) = F ˜ ( p p 0 , q q 0 ) Π μ , ν ( p , q )
Here, Π μ , ν ( p , q ) is a rectangular step function equal to zero for | p | > μ , | q | > ν . Functional Equation (7) clarifies the action of the integral operator (5): it cuts from the object spatial spectrum F ˜ ( p , q ) a rectangular portion depending on the wavelength λ = 2 π / k , antenna aperture ( a , b ) , probing distance l , and illumination angles ( α 0 , β 0 ) . Spectral information outside this rectangle is irretrievably lost.
Spectral representation (7) explains the poor spatial resolution of the holographic subsurface radar (HSR) prototype, which is in full agreement with the rules of physical optics—see Figure 10b, where only right leg of the letter R in Figure 10a is reproduced—in accordance with the visual estimates of the HSR resolving power in Figure 10c. Moreover it prompts a constructive method to improve the image quality by coherent summation of several digital holograms taken with different irradiance angles [18]. A model example of four coherent hologram synthesis is shown in Figure 11.

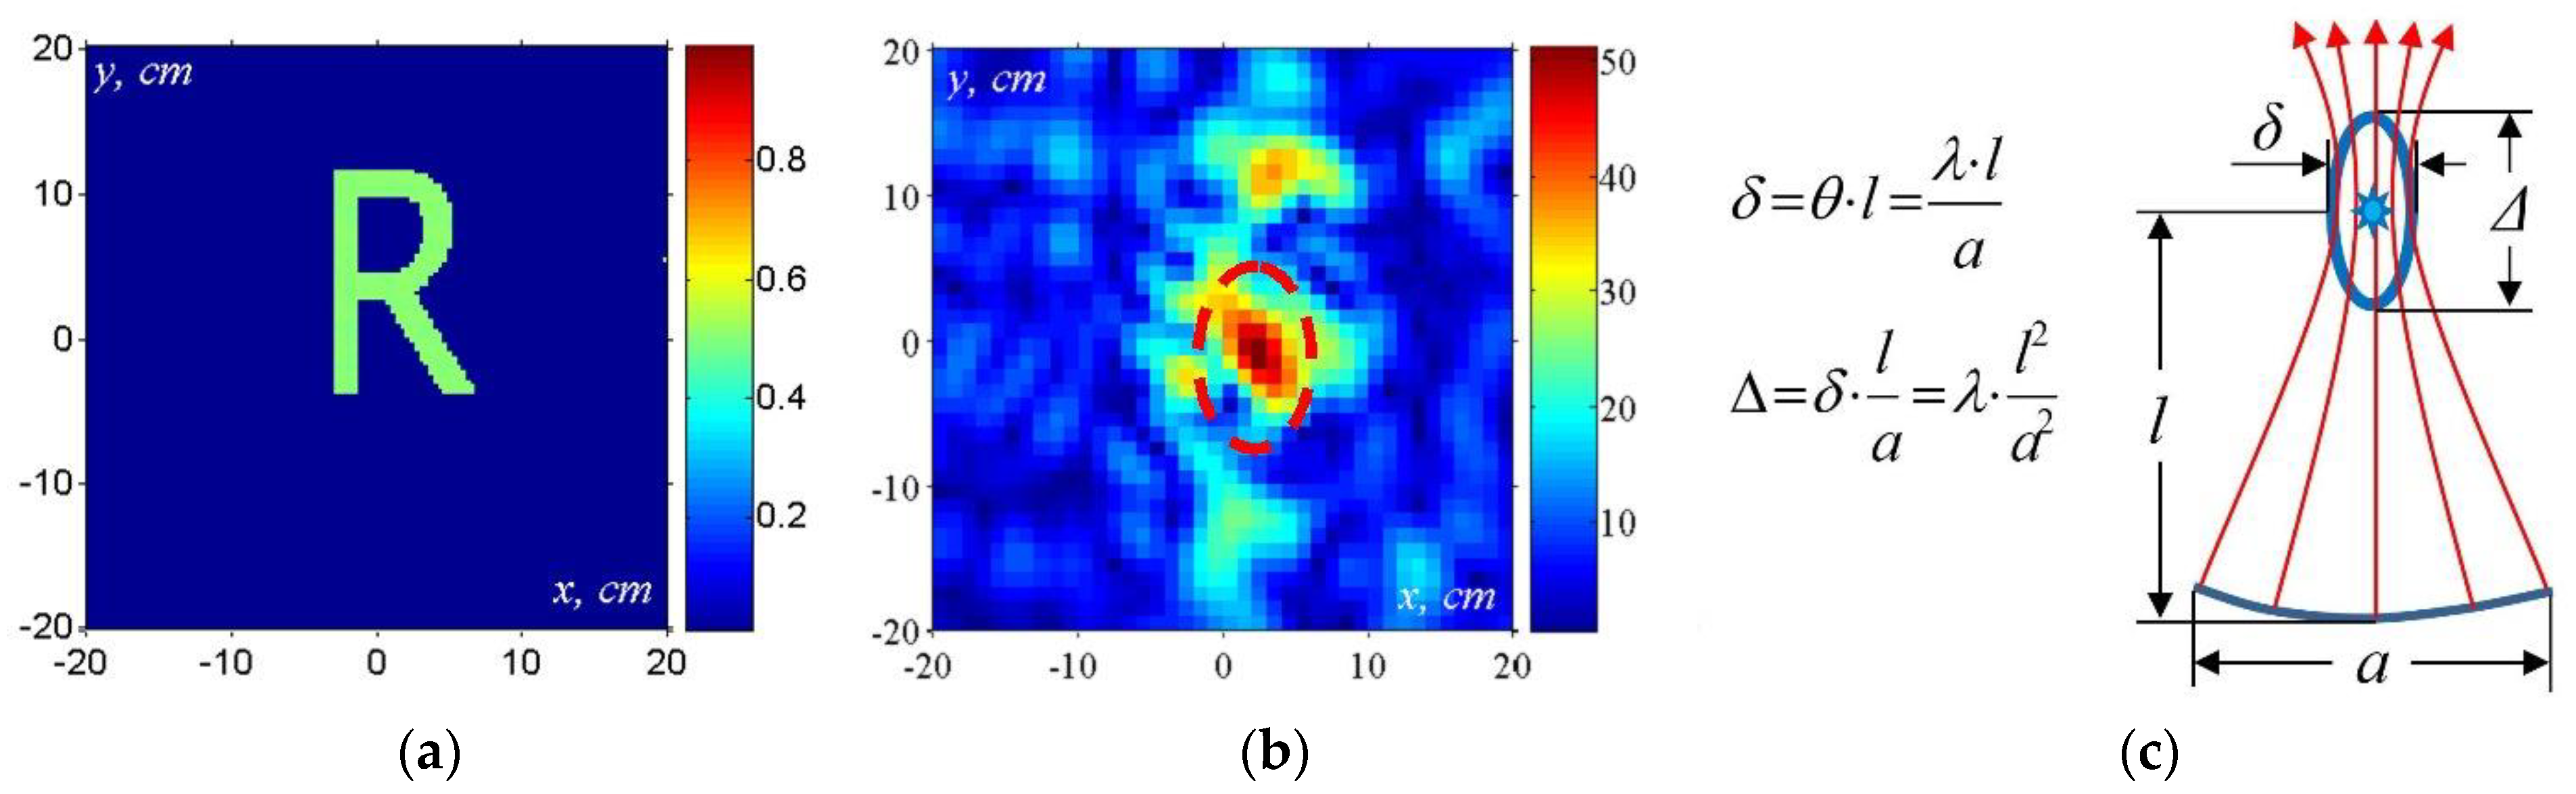
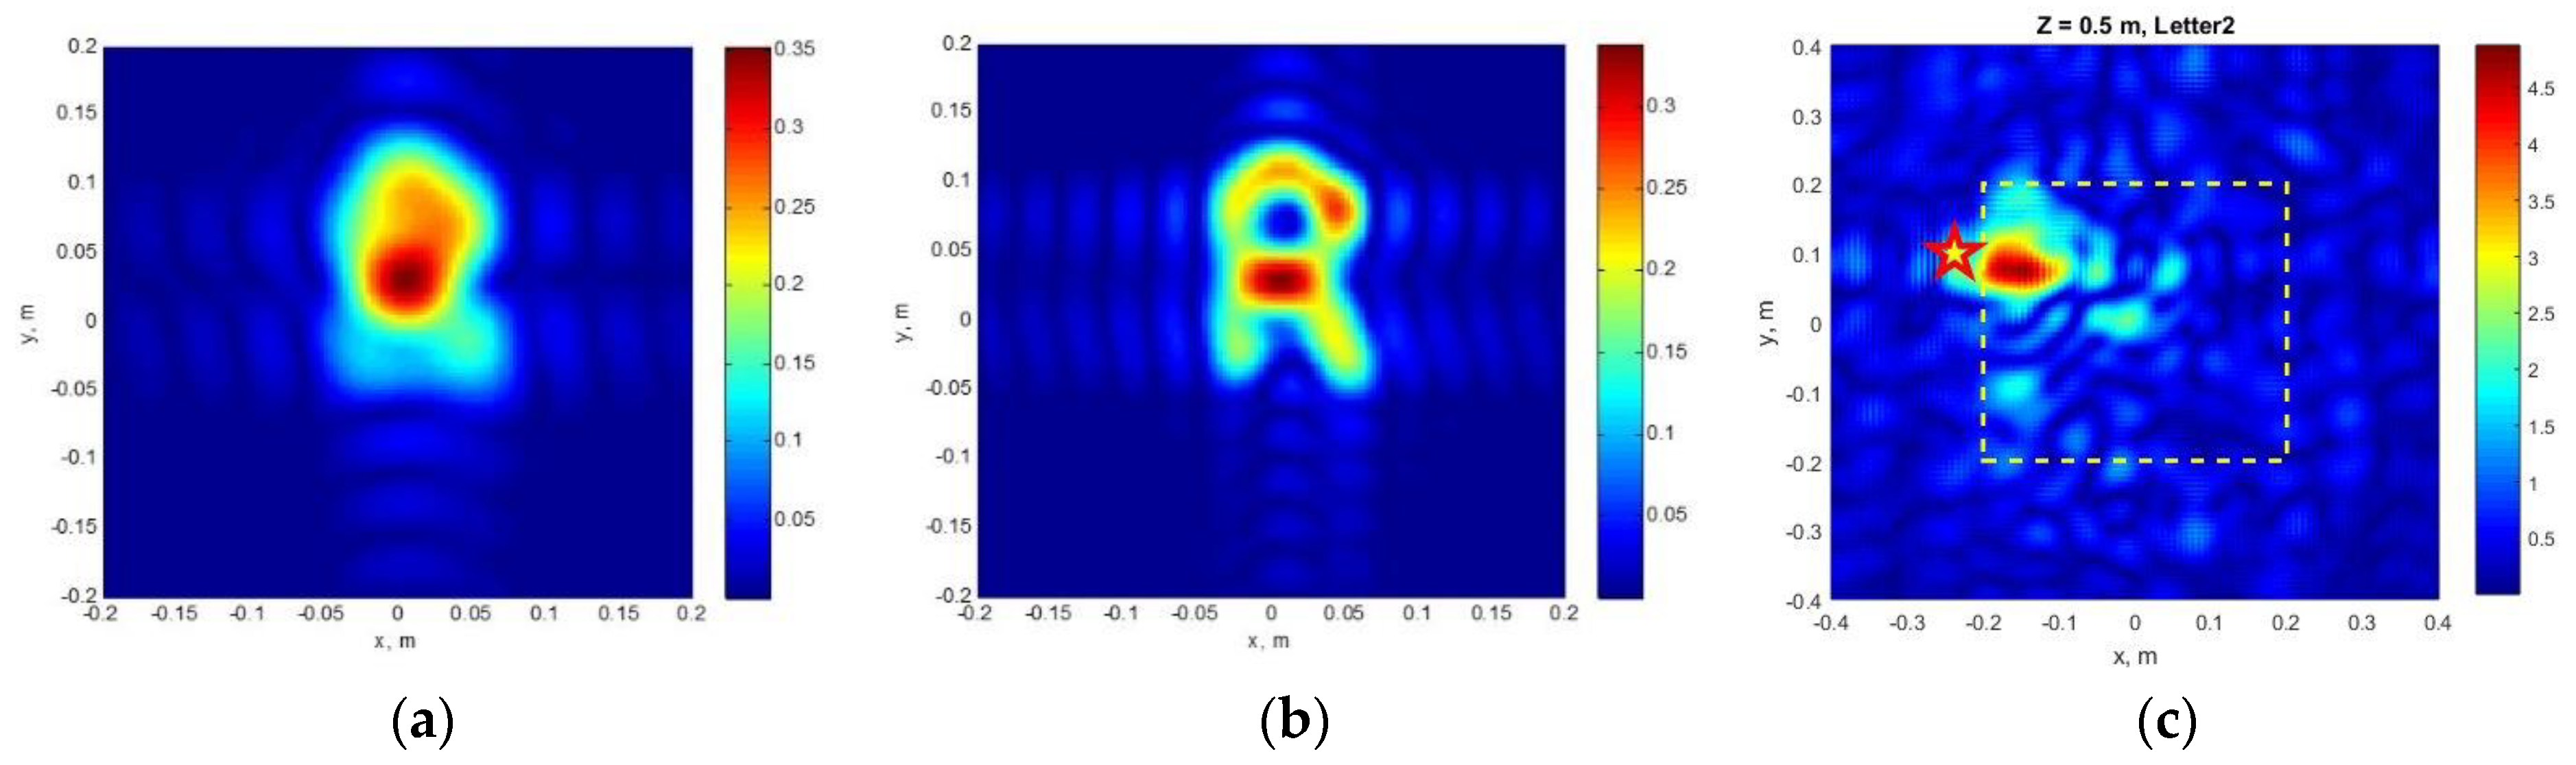
3.2. Visualization of Subsurface Objects

The above analysis can be generalized to the case of a planar electrically contrasting object immersed in a layered inhomogeneous dielectric subsurface medium with slowly changing refractive index n ( z ) = ε ( z ) , z > z 0 (in most examples it is just two uniform half-spaces although we look forward to dealing with large-scale natural environments where horizontally layered structure serves as a good model [20]). In the paraxial approximation, the incident wave has the following form:
E ( x , y , z ) { e i k z u 0 ( x , y , z ) + V e i k ( 2 z 0 z ) u r ( x , y , z ) , z < z 0 W u t ( x , y , z ) exp ( z 0 + i k n ( z ) d z ) , z > z 0
where the reflection and transmission coefficients V and W are given by Fresnel formulas, while the slowly varying amplitudes u 0 ( x , y , z ) and u t ( x , y , z ) of the propagating forward waves satisfy the parabolic equations:
2 i k u z + 2 u x 2 + 2 u y 2 = 0 , 0 < z < z 0 i k [ 2 n ( z ) u z + n ( z ) u ] + 2 u x 2 + 2 u y 2 = 0 , z > z 0
The waves reflected at the interface and scattered by the immersed subsurface object satisfy complex conjugate parabolic equations. In order to solve the parabolic equations, we use Fourier transform. In the case of a homogeneous dielectric half-space: n ( z ) = ε ( z ) = { 1 , 0 < z < z 0 n , z > z 0 , the wave front conversion formulas are similar to the case of free space—we only have to take into account the change in the phase velocity, as well as refraction and reflection of the incident wave at the interface: V 1 n 1 + n , W 2 1 + n . In this case, the operator relating the radar image g ( x , y ) with the shape of the object f ( x , y ) has the following form:
G ˜ ( p , q ) = 2 n + 1 F ˜ ( p p 0 , q q 0 ) Π μ , ν ( p , q ) + G ˜ r e f ( p , q )
which is almost identical to the free-space case (6), except for the factor 2 n + 1 , the last term G ˜ r e f ( p , q ) describing the wave reflected by the interface z = z 0 , and a modified value of the Fresnel numbers: μ = k a L and ν = k b L , where L = l z 0 n + z 0 is the apparent distance to the object, taking into account refraction in the material medium. As n > 1 , the material medium reduces the apparent distance and diffraction effects, which could improve the image quality—see Figure 12a,b. In reality, the situation becomes much worse due to wave absorption in the medium and reflection at the interface masking the weak subsurface signal—see Figure 12c.

3.3. Reflected Wave Subtraction and Synthetic Aperture Method

As experience shows, the main problem in the detection and imaging of subsurface objects is the interference of the weak scattered signal with a powerful wave reflected from the boundary of the material medium—see Figure 13a. Fortunately, in most applications this boundary is a rather flat surface z = z 0 forming a regular reflected signal. In this case, we can assume that the wavefront conversion procedure should give a compact specular image of the radiation source in the plane of the imaginary source z = 2 z 0 —see Figure 13b. The experiment confirms this hypothesis.
The following series of experimental color plots illustrates the possibility of visualizing the subsurface object. Figure 14a shows the distribution of the wavefield amplitude reconstructed from the experimental hologram and extended to the plane of the imaginary source. It clearly shows a bright specular image of the microwave emitter. When this bright spot is mechanically “bitten off”, a diffraction-limited image of the subsurface object appears—see Figure 14b. However, such a “surgical” method generates strong parasitic effects in the object plane—see Figure 14c.
A better result can be achieved by a smooth approximation of the source image by a Gaussian wave beam (see Figure 15a) diffracted by the rectangular contour of the receiver antenna and subtracted from the experimental hologram in the imaginary source plane (see Figure 15b). In this case, spurious effects do not mask the image of the object in the middle of the frame—Figure 15c.
Finally, by combining the procedure of reflected wave “biting off” with the coherent summation of the cleaned holograms obtained by irradiation of the object at different angles (synthetic aperture approach), we obtain in the object plane its quite distinguishable image—see Figure 16a–c.

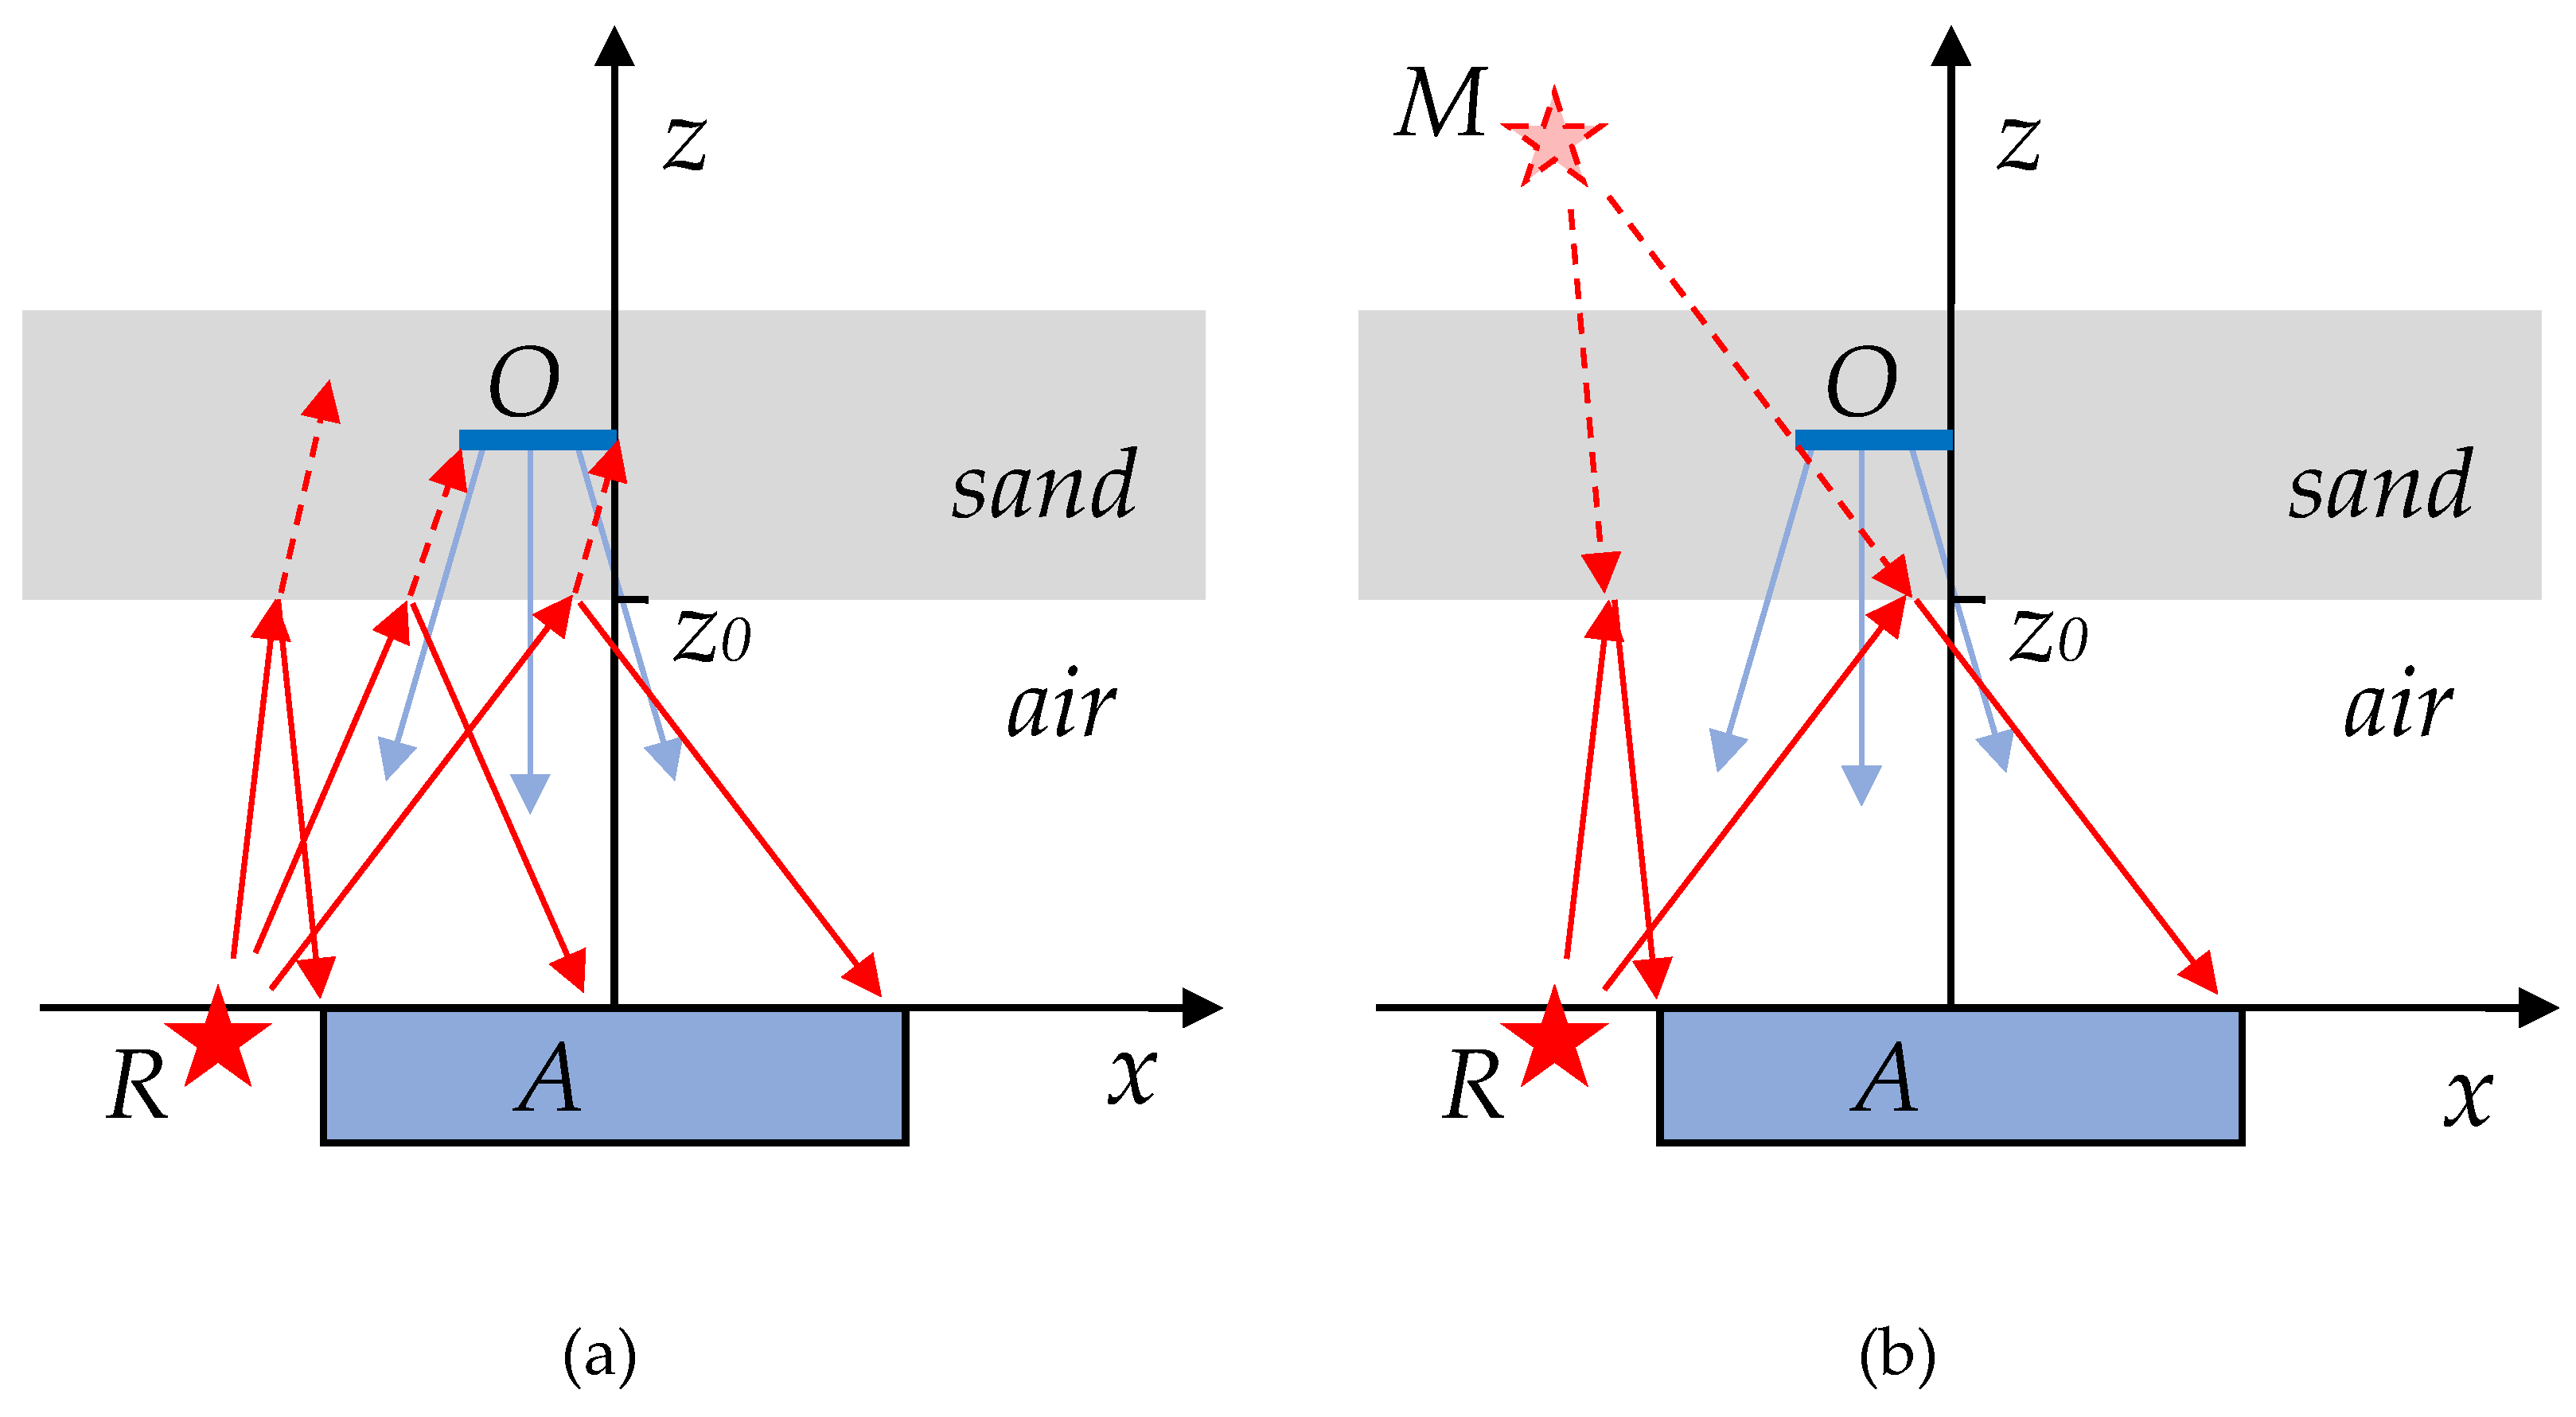
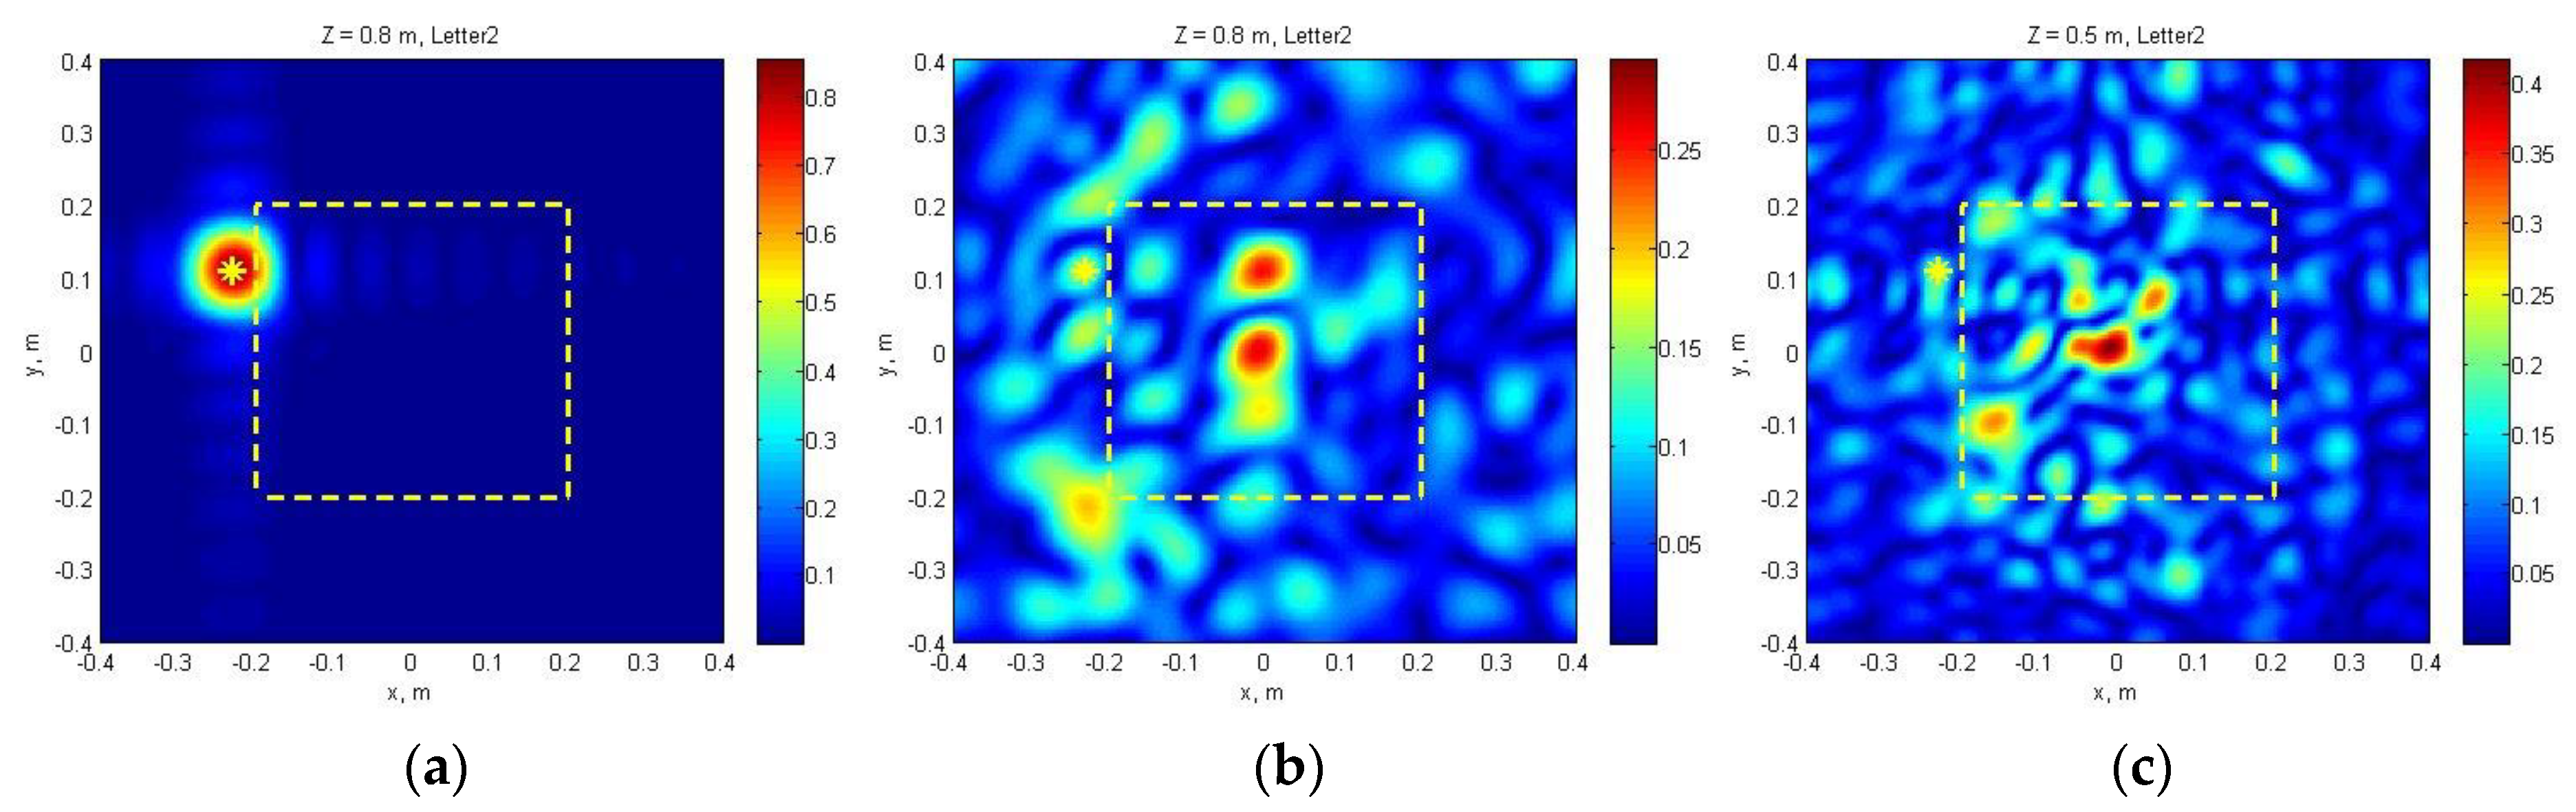
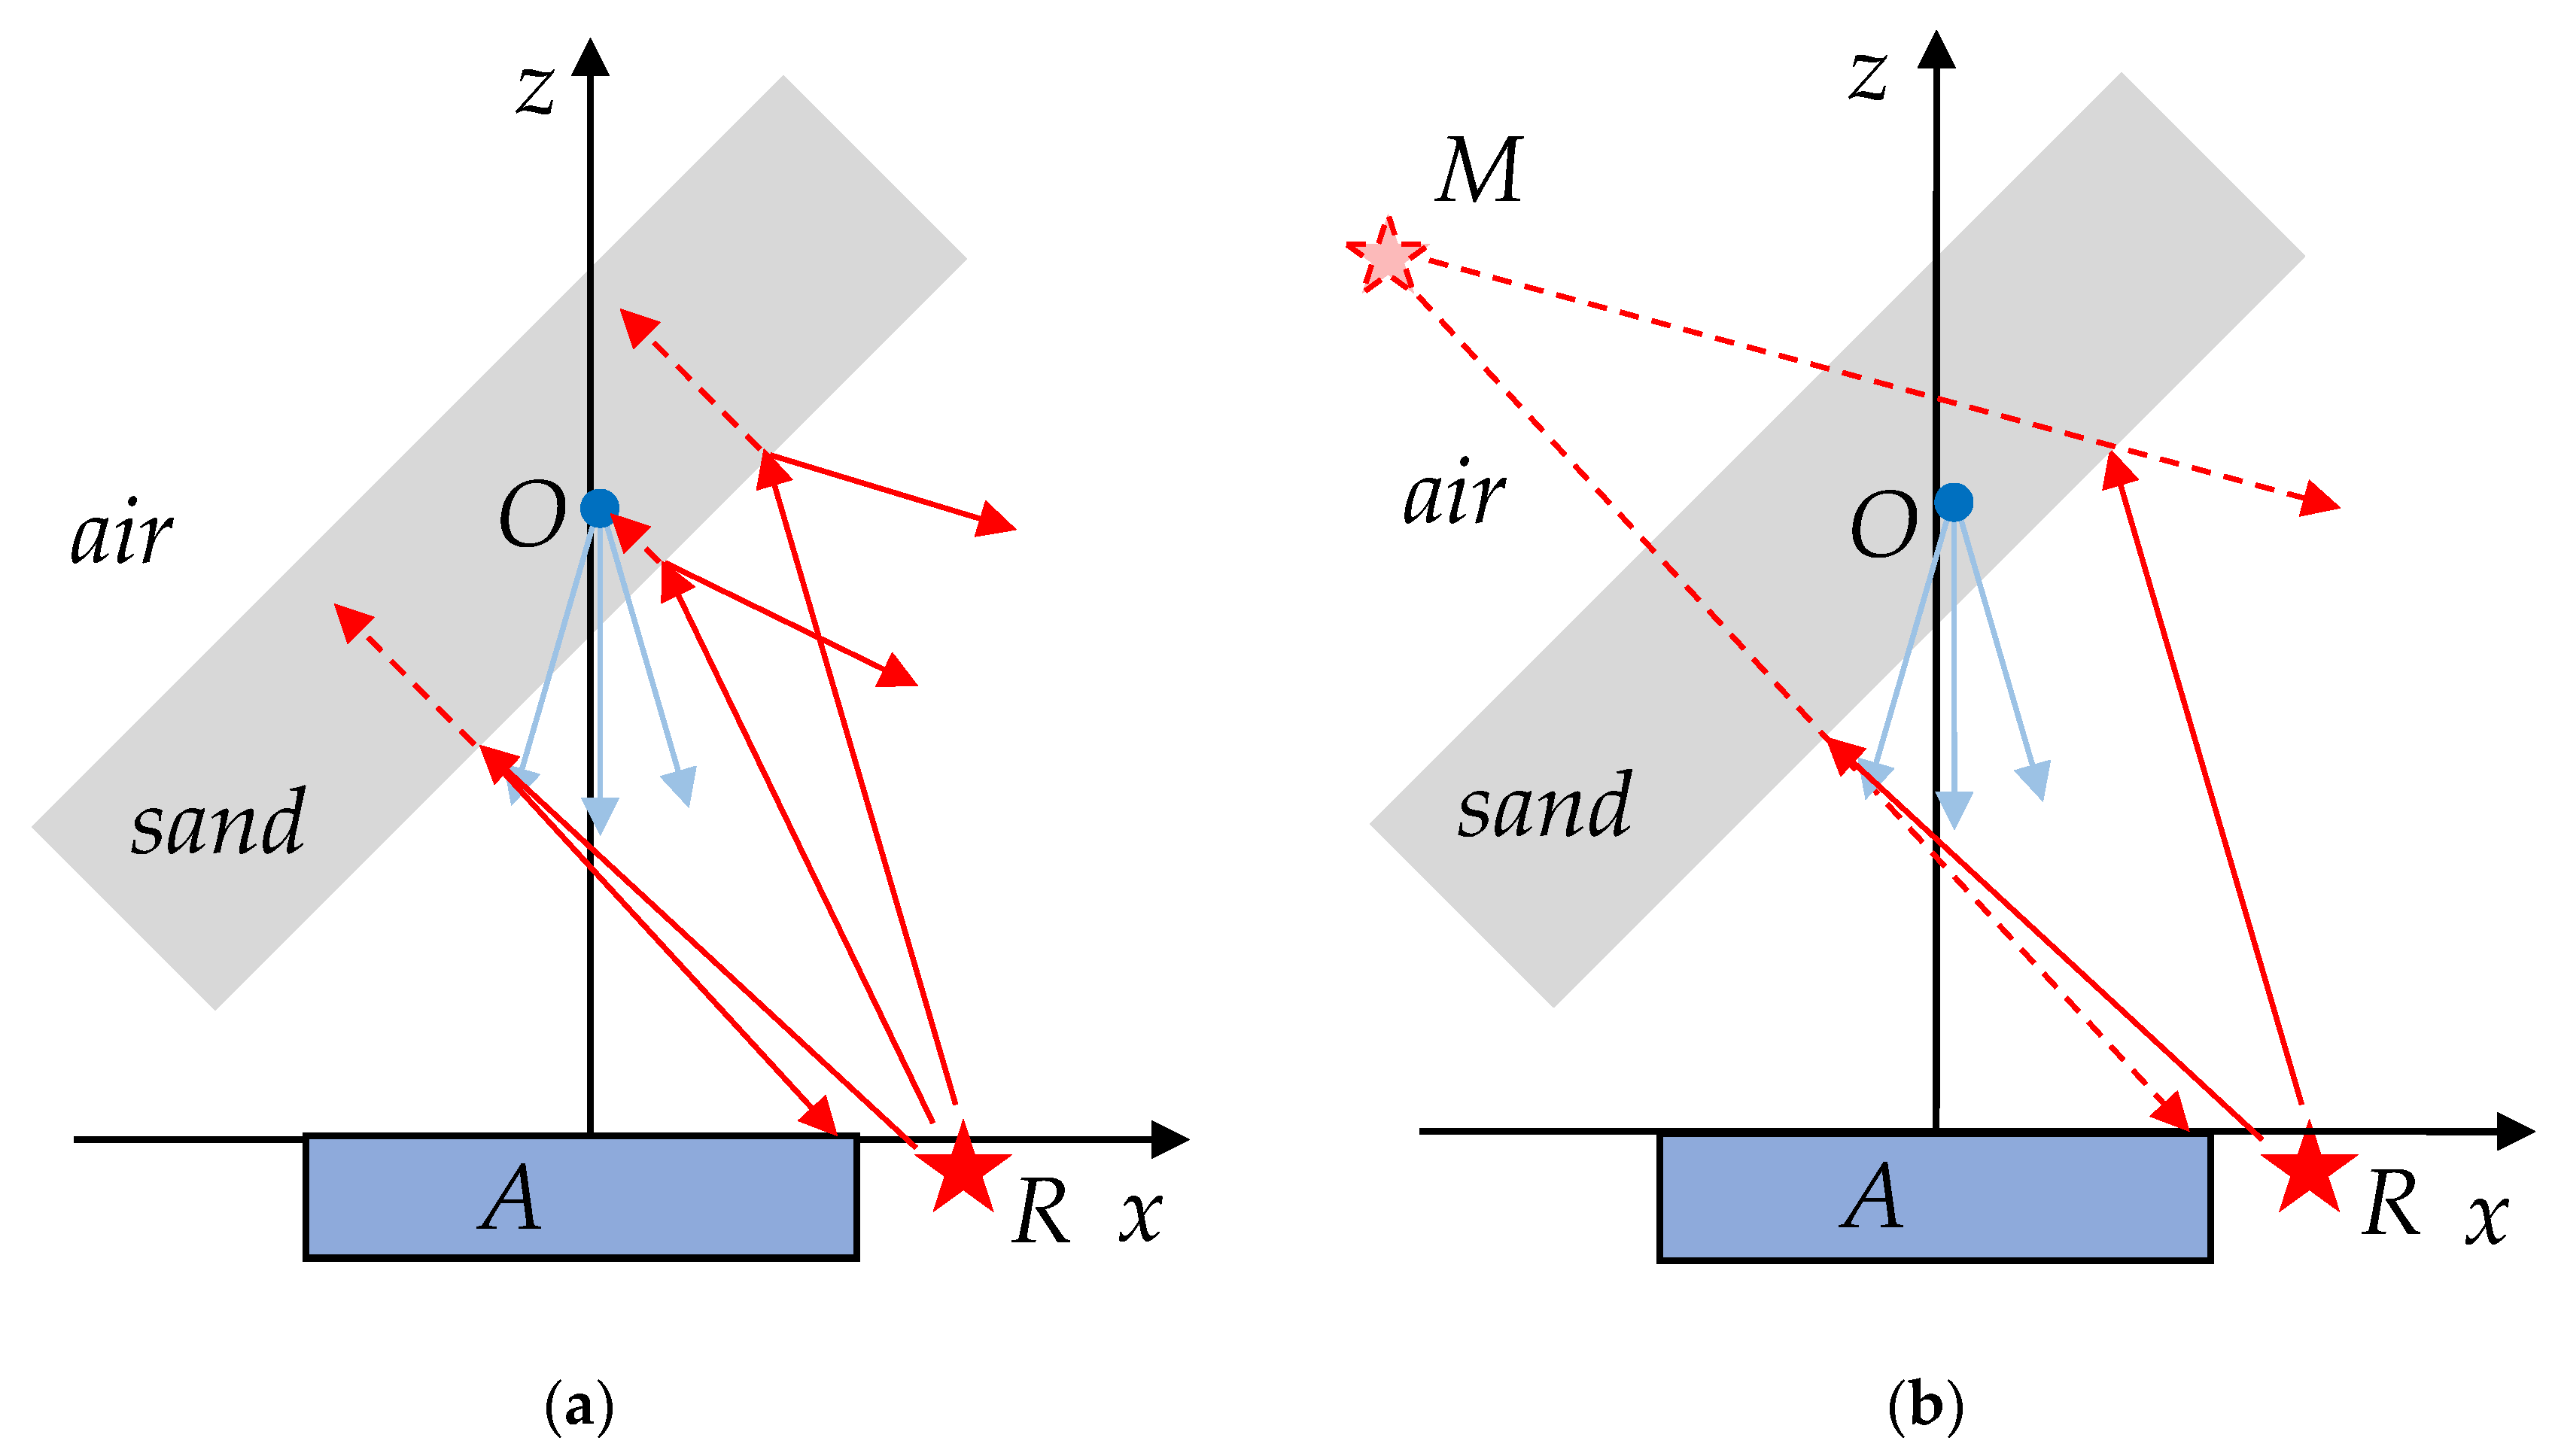
3.4. Oblique Sounding Layout

Difficulties of the reflected wave compensation forced us to search for a more efficient experimental configuration. As a result of experiments carried out at the IZMIRAN stand, a new scheme of subsurface sounding was worked out, replacing the frontal position of the holographic antenna array with its placement at an angle to the interface. Geometry allows one to find an optimum position of the antenna array and the radiator relative to the object and medium surface (Figure 17). One can see that the strong specular reflection from the medium surface almost misses the holographic antenna aperture, so compensation of the reflected signal is practically useless.
The series of experimental holograms below confirms the geometrical calculation and demonstrates the efficiency of the oblique sounding method. The results of holographic reconstruction of a vertical metallic rod, performed in the geometry of Figure 17, are shown in Figure 18. It is interesting to trace the image dependence on the probing distance z. At z = 0.7 m, along with the central spot; being a diffraction limited image of the immersed object, we see a bright spot in the left part of the picture, which is a specular image of the radiation source, marked with a dotted circle. As the distance decreases, the image of the object is focused and becomes brighter while the reflected source image shifts to the center and gradually fades.
Finally, at z = 0.4 m (effective distance to the object), the brightness of the radiator image is reduced to the noise level and, unlike the frontal imaging scheme, no “biting out” of the reflected wave is required. Each of the images in Figure 19 already gives a good idea of the scattering object, although the synthetic aperture method can still improve the image quality.

4. Laboratory and Field Tests

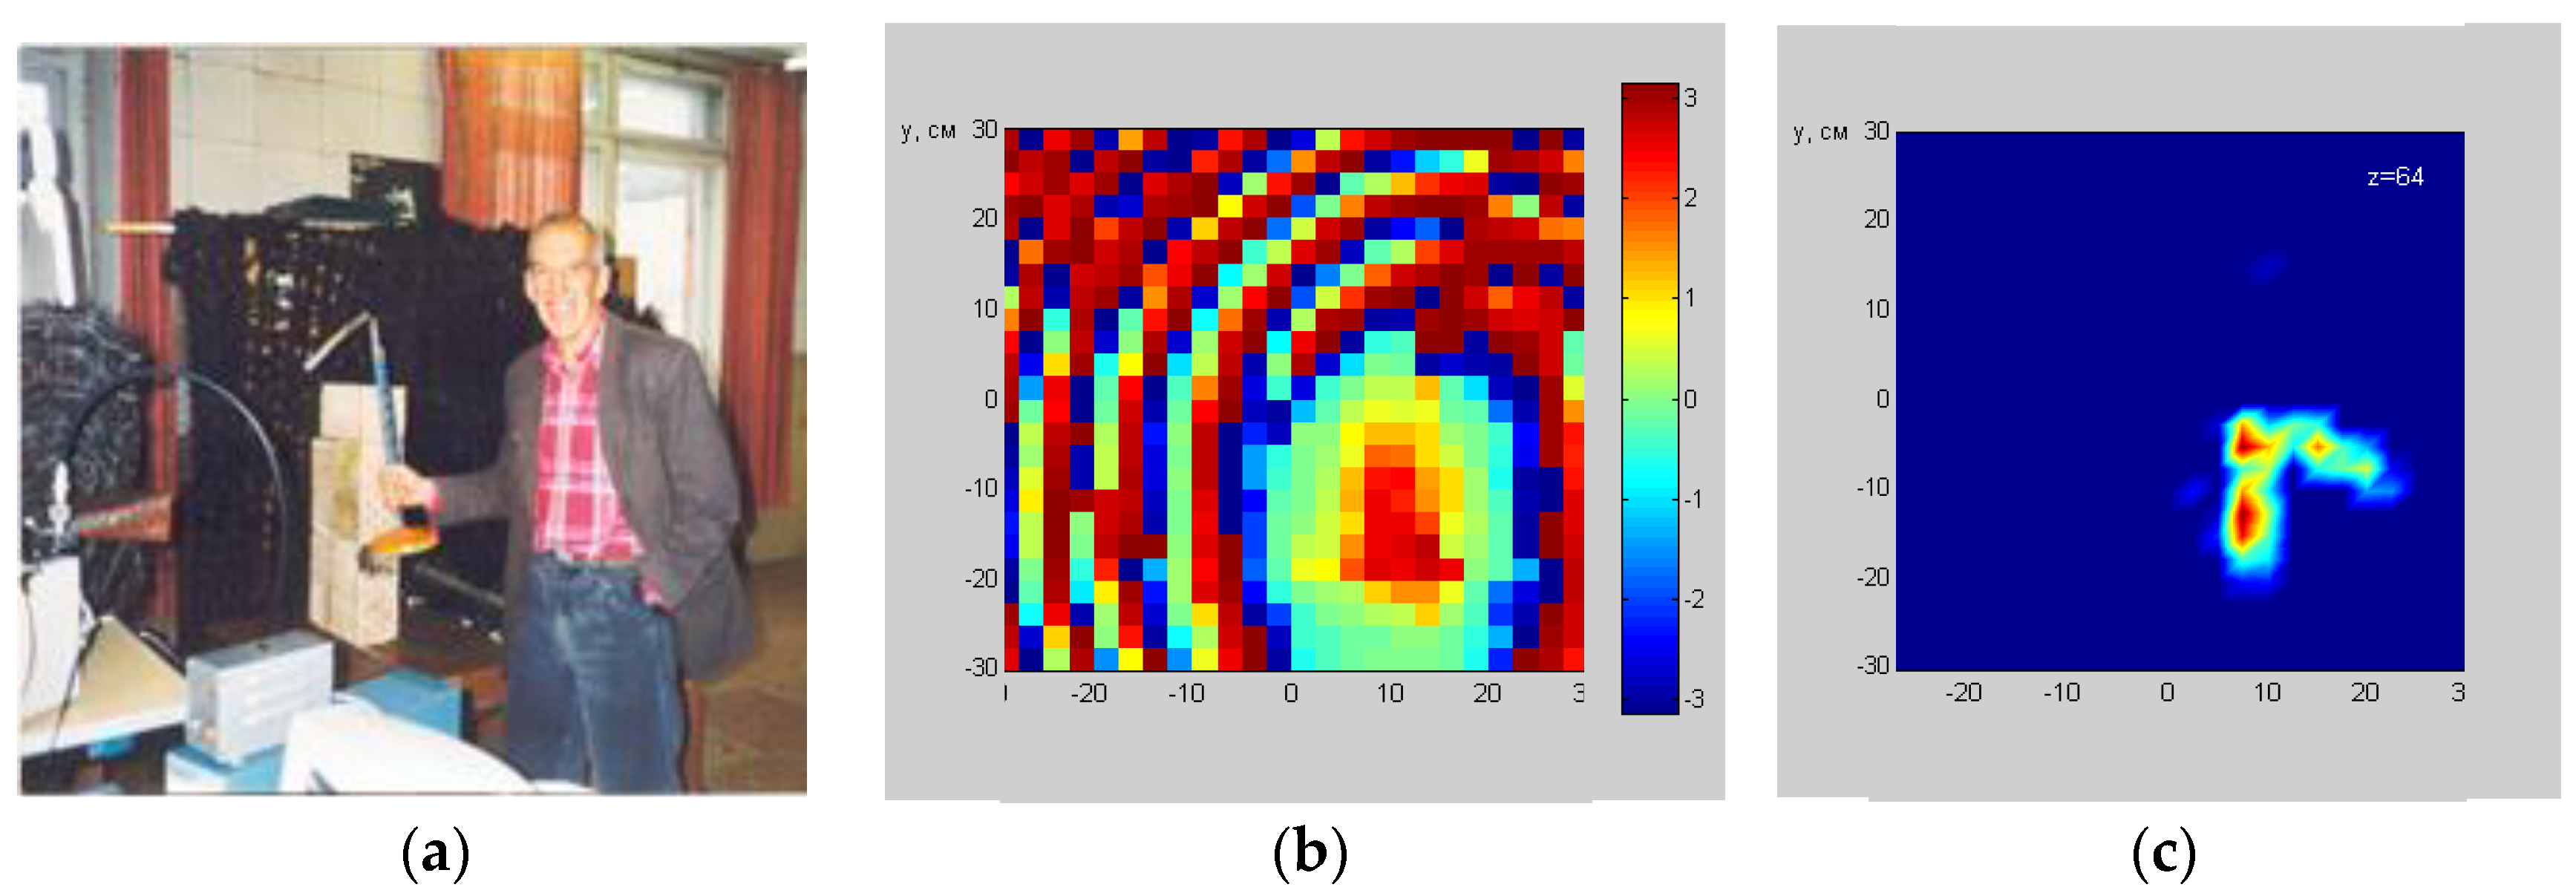
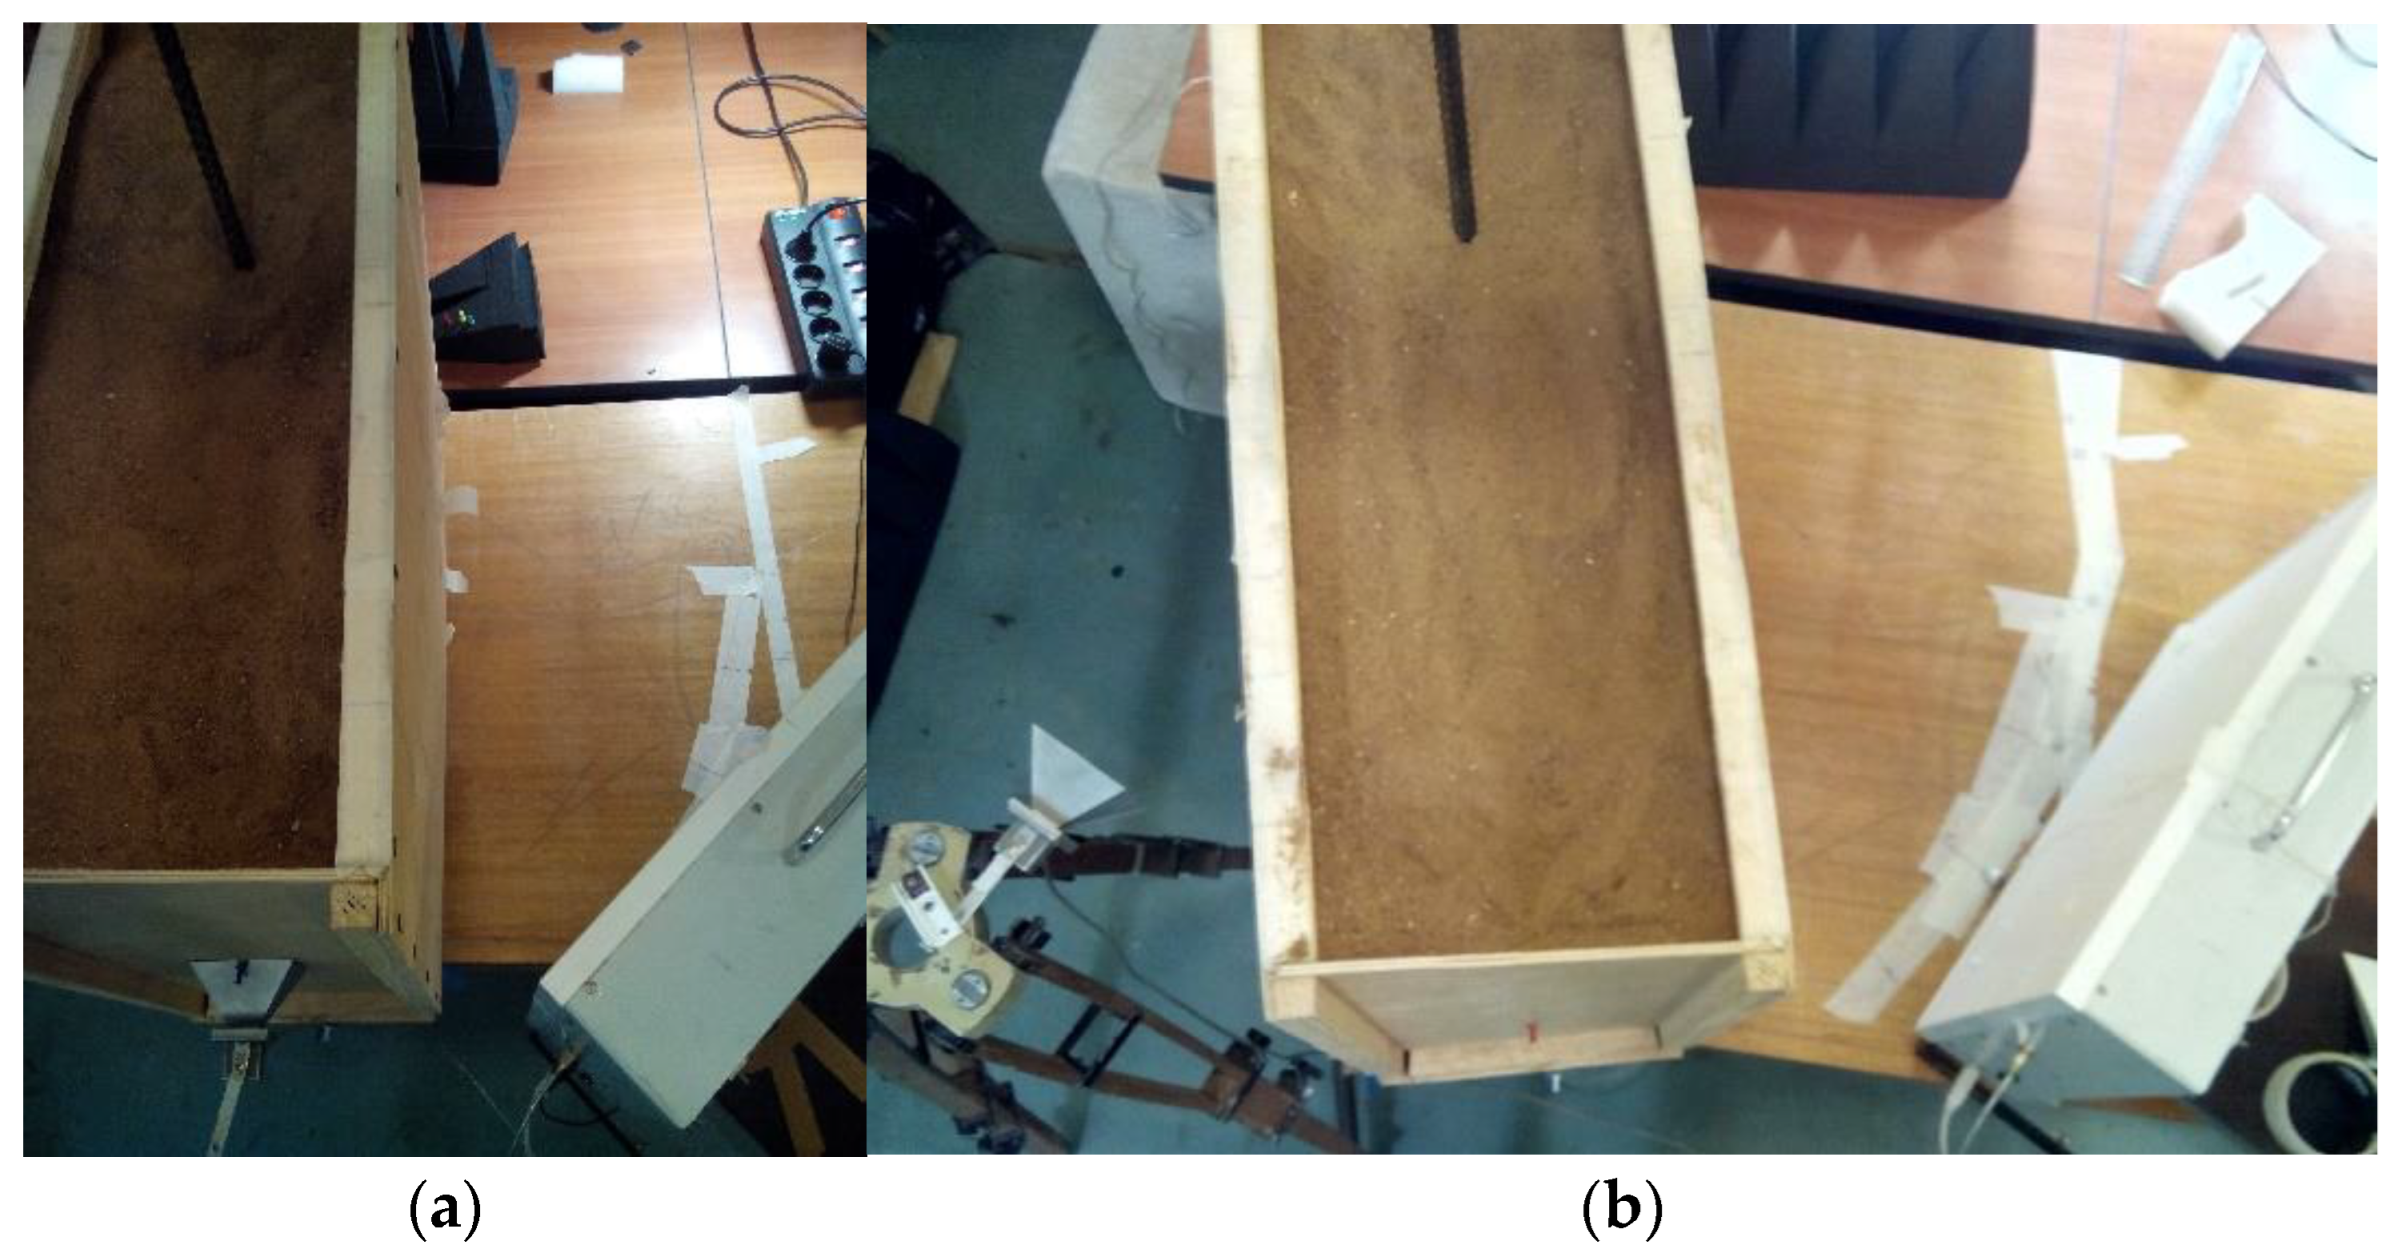
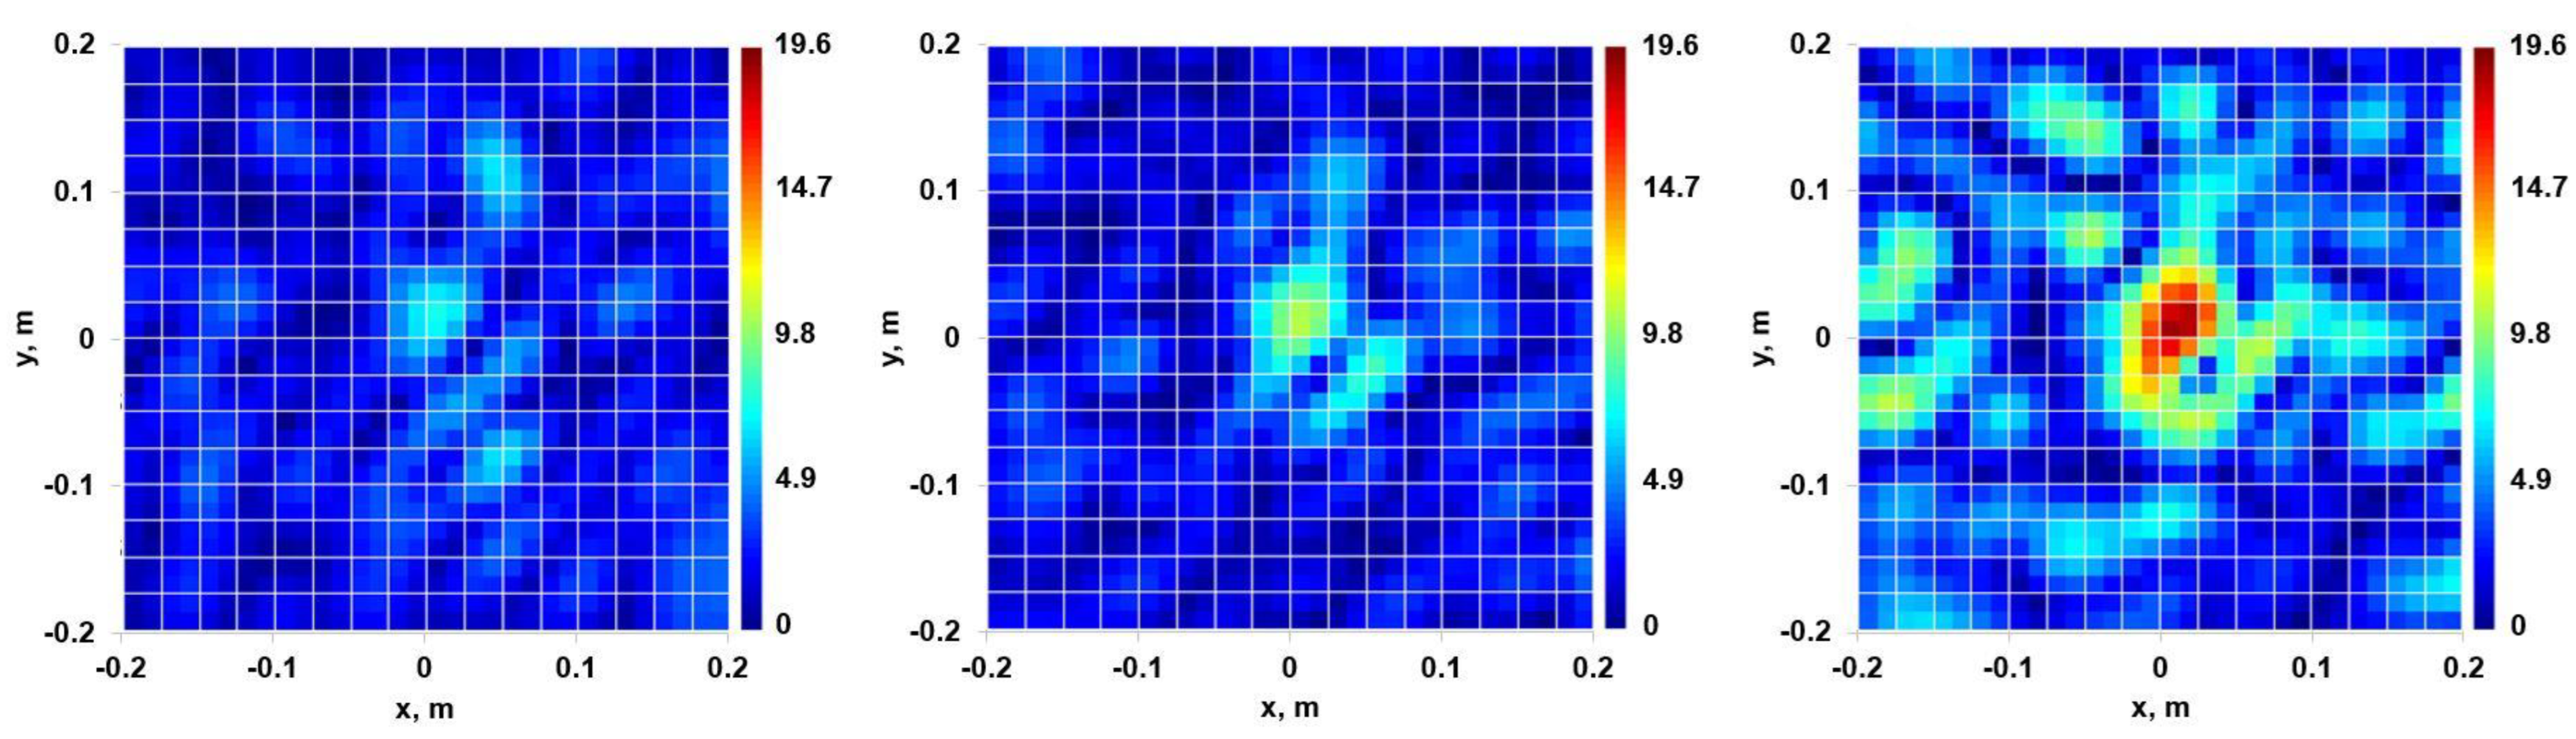
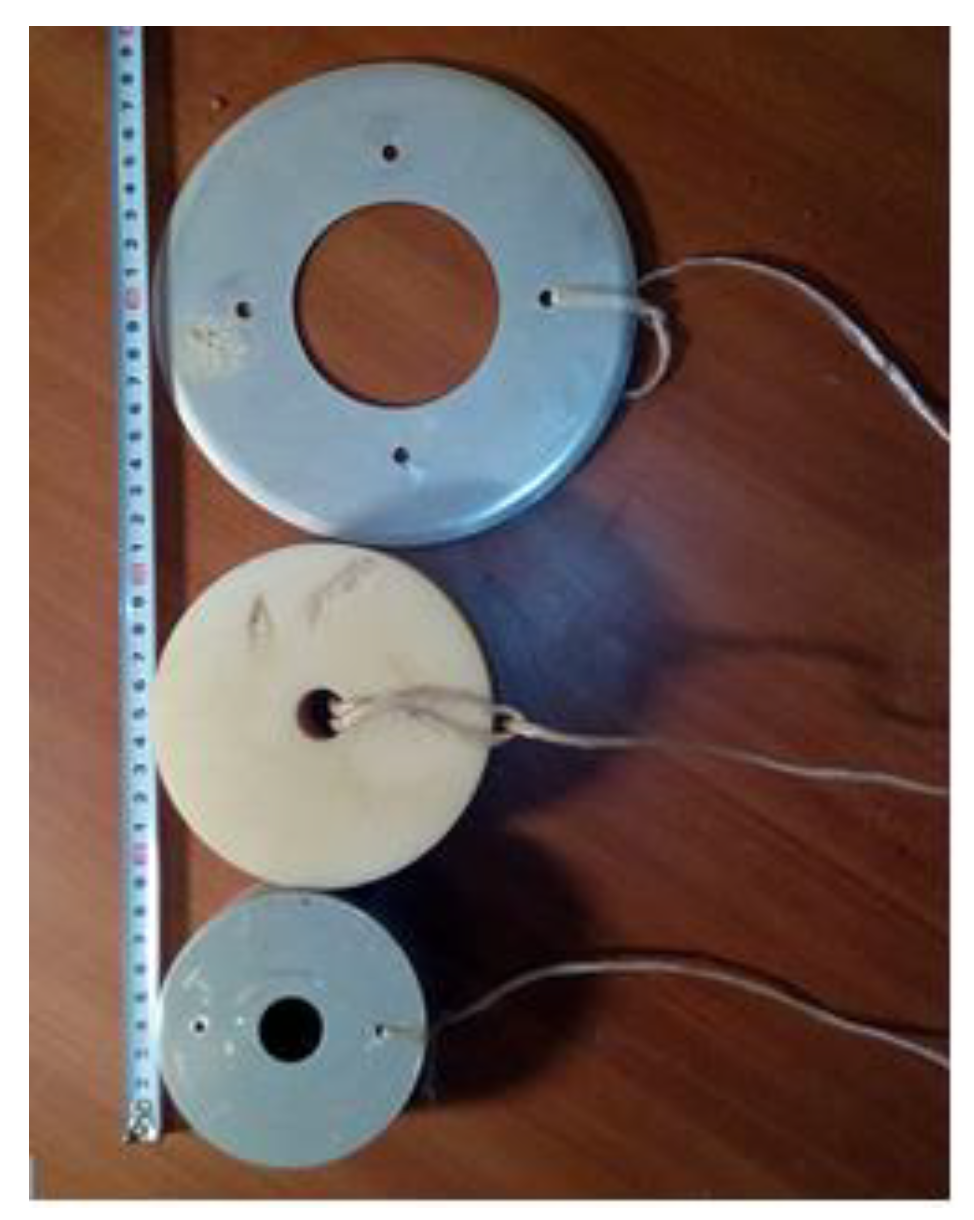
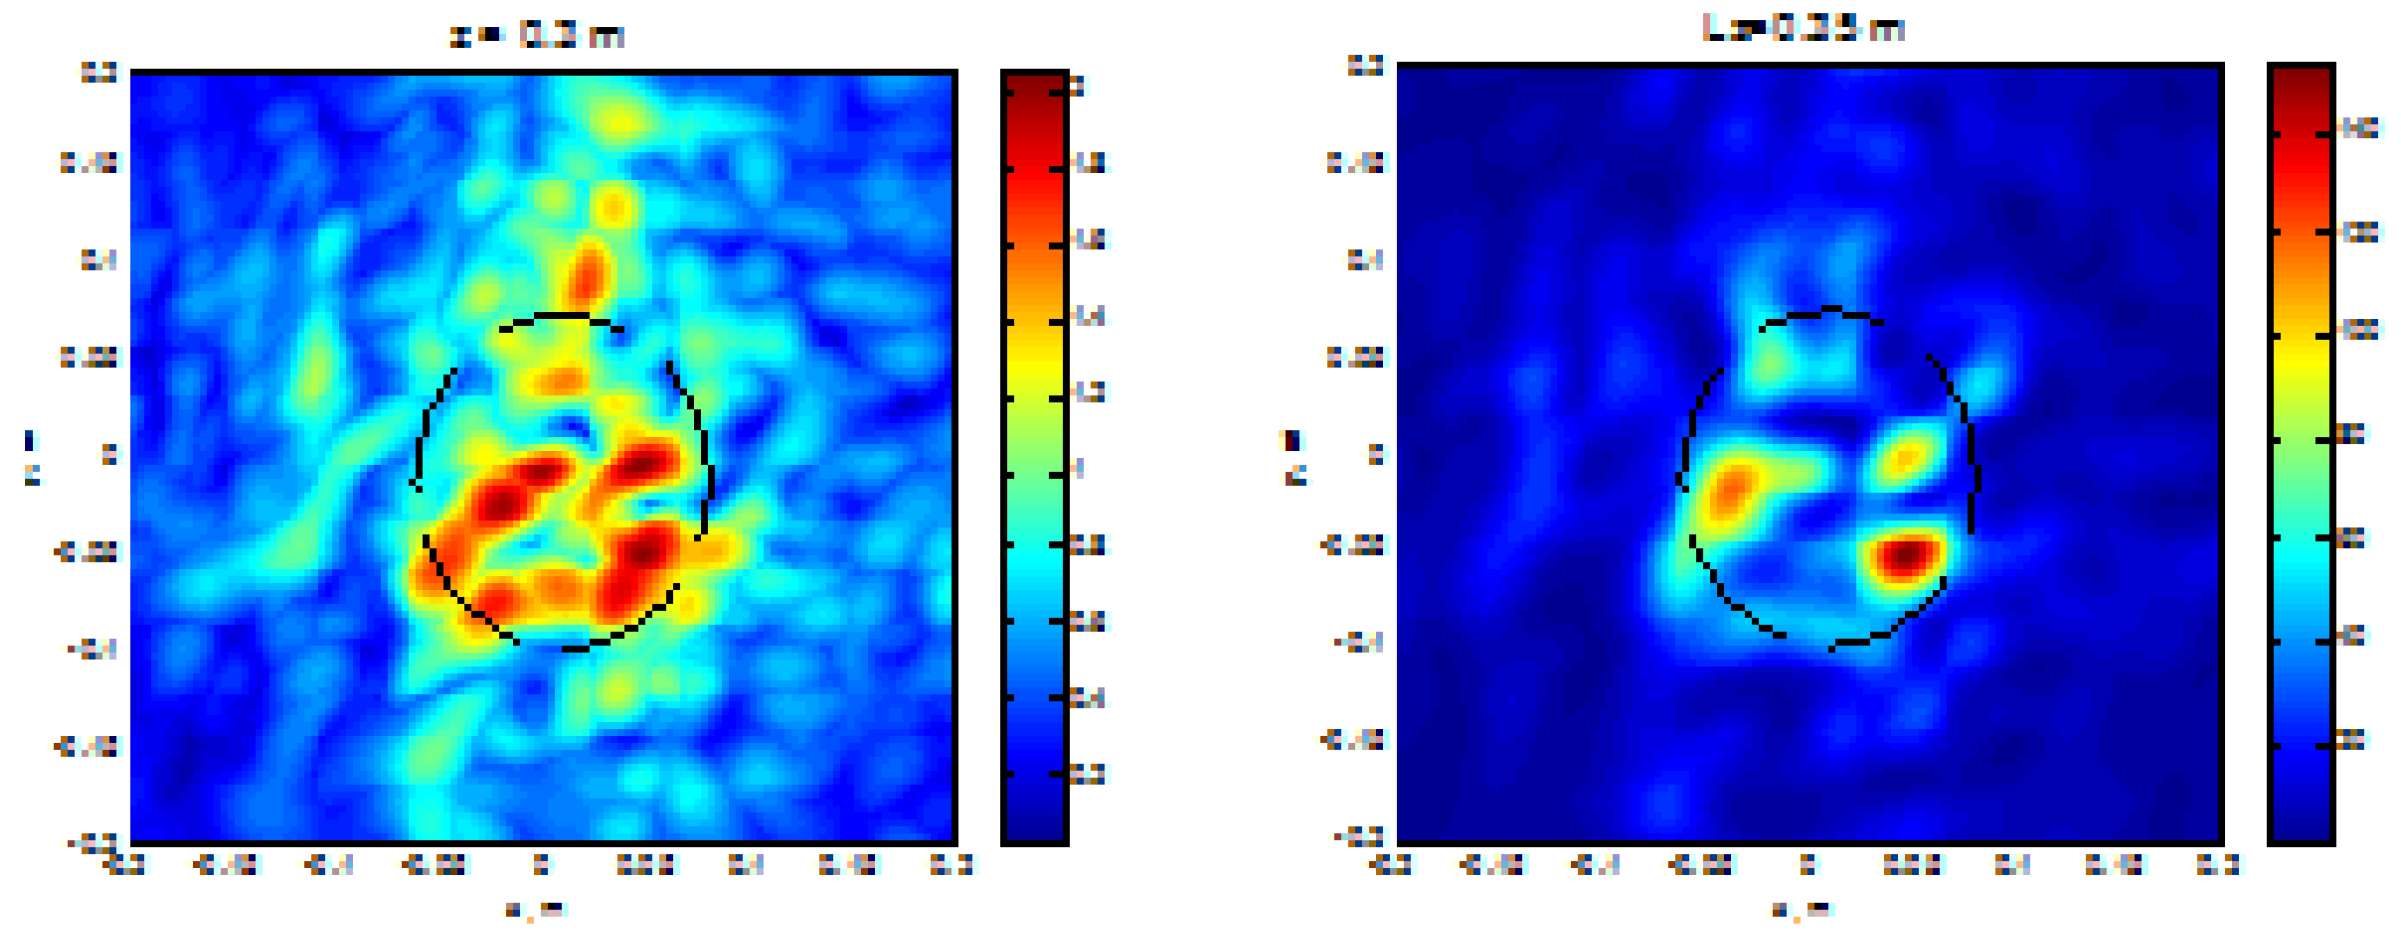
4.1. Object Shape Detection (Laboratory Tests)

Objects of round shape of different diameters (8, 11, 18 cm), made of different materials (steel, aluminum, polyamide), and of different thicknesses were used as research objects in these experiments—see Figure 20. Experiments were carried out on the laboratory stand in order to assess the possibility of detection and localization of round-shaped objects in the sand, using the proposed above scheme of oblique holographic probing.
The results of measurements with multi-position illumination of a metal disk of 18 cm in diameter are shown in Figure 21. The horn radiator scanned an interval Y0 = −15 to +15 cm. We can see that in the oblique illumination scheme, if the specular reflected wave does not fall into the receiver antenna aperture, the main contribution in the received signal gives the “edge wave” well known in the theory of diffraction by planar objects [1,21]. Each of these individual images has practically no resemblance with the original—just a small bright spot at the edge of the planar object.
On the other hand, using the developed measurement technique with coherent multipoint illumination, a recognizable image of the object hidden in the subsurface medium at a depth of 10–12 cm could be obtained from a height of about 0.3 m—see Figure 22.
The results of coherent multi-view hologram summation allow one to estimate the object shape and location. Comparing Figure 21 and Figure 22, one can see a striking difference: while it is absolutely impossible to recognize the object from a single frame of Figure 21, the latter gives a clear idea of the object shape and size. This complex of laboratory experiments proved the possibility of subsurface object location of and suggested the methodology of oblique subsurface sounding in field conditions.

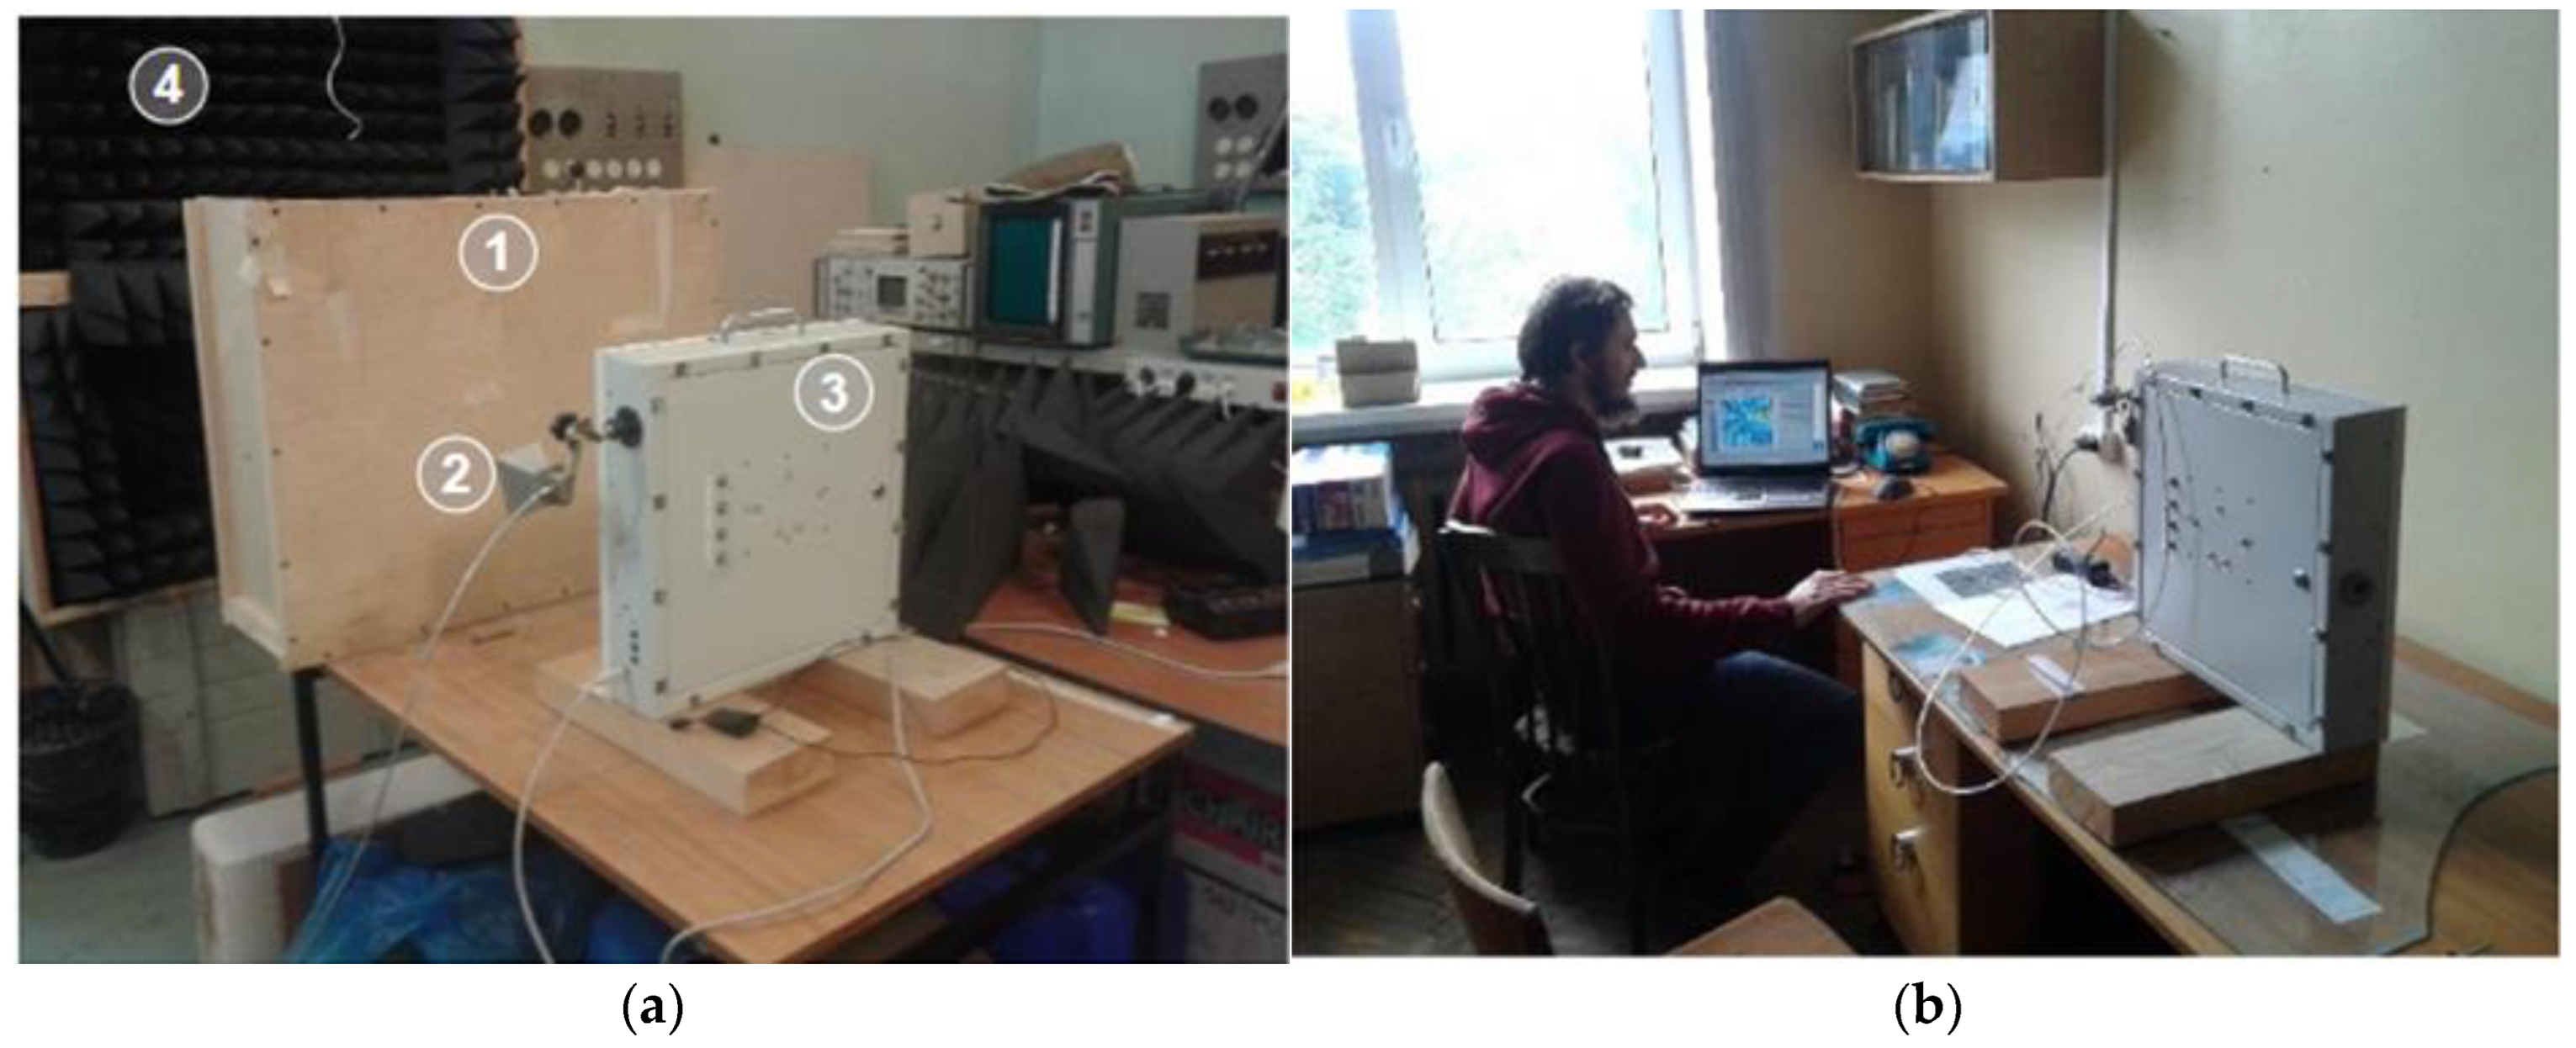
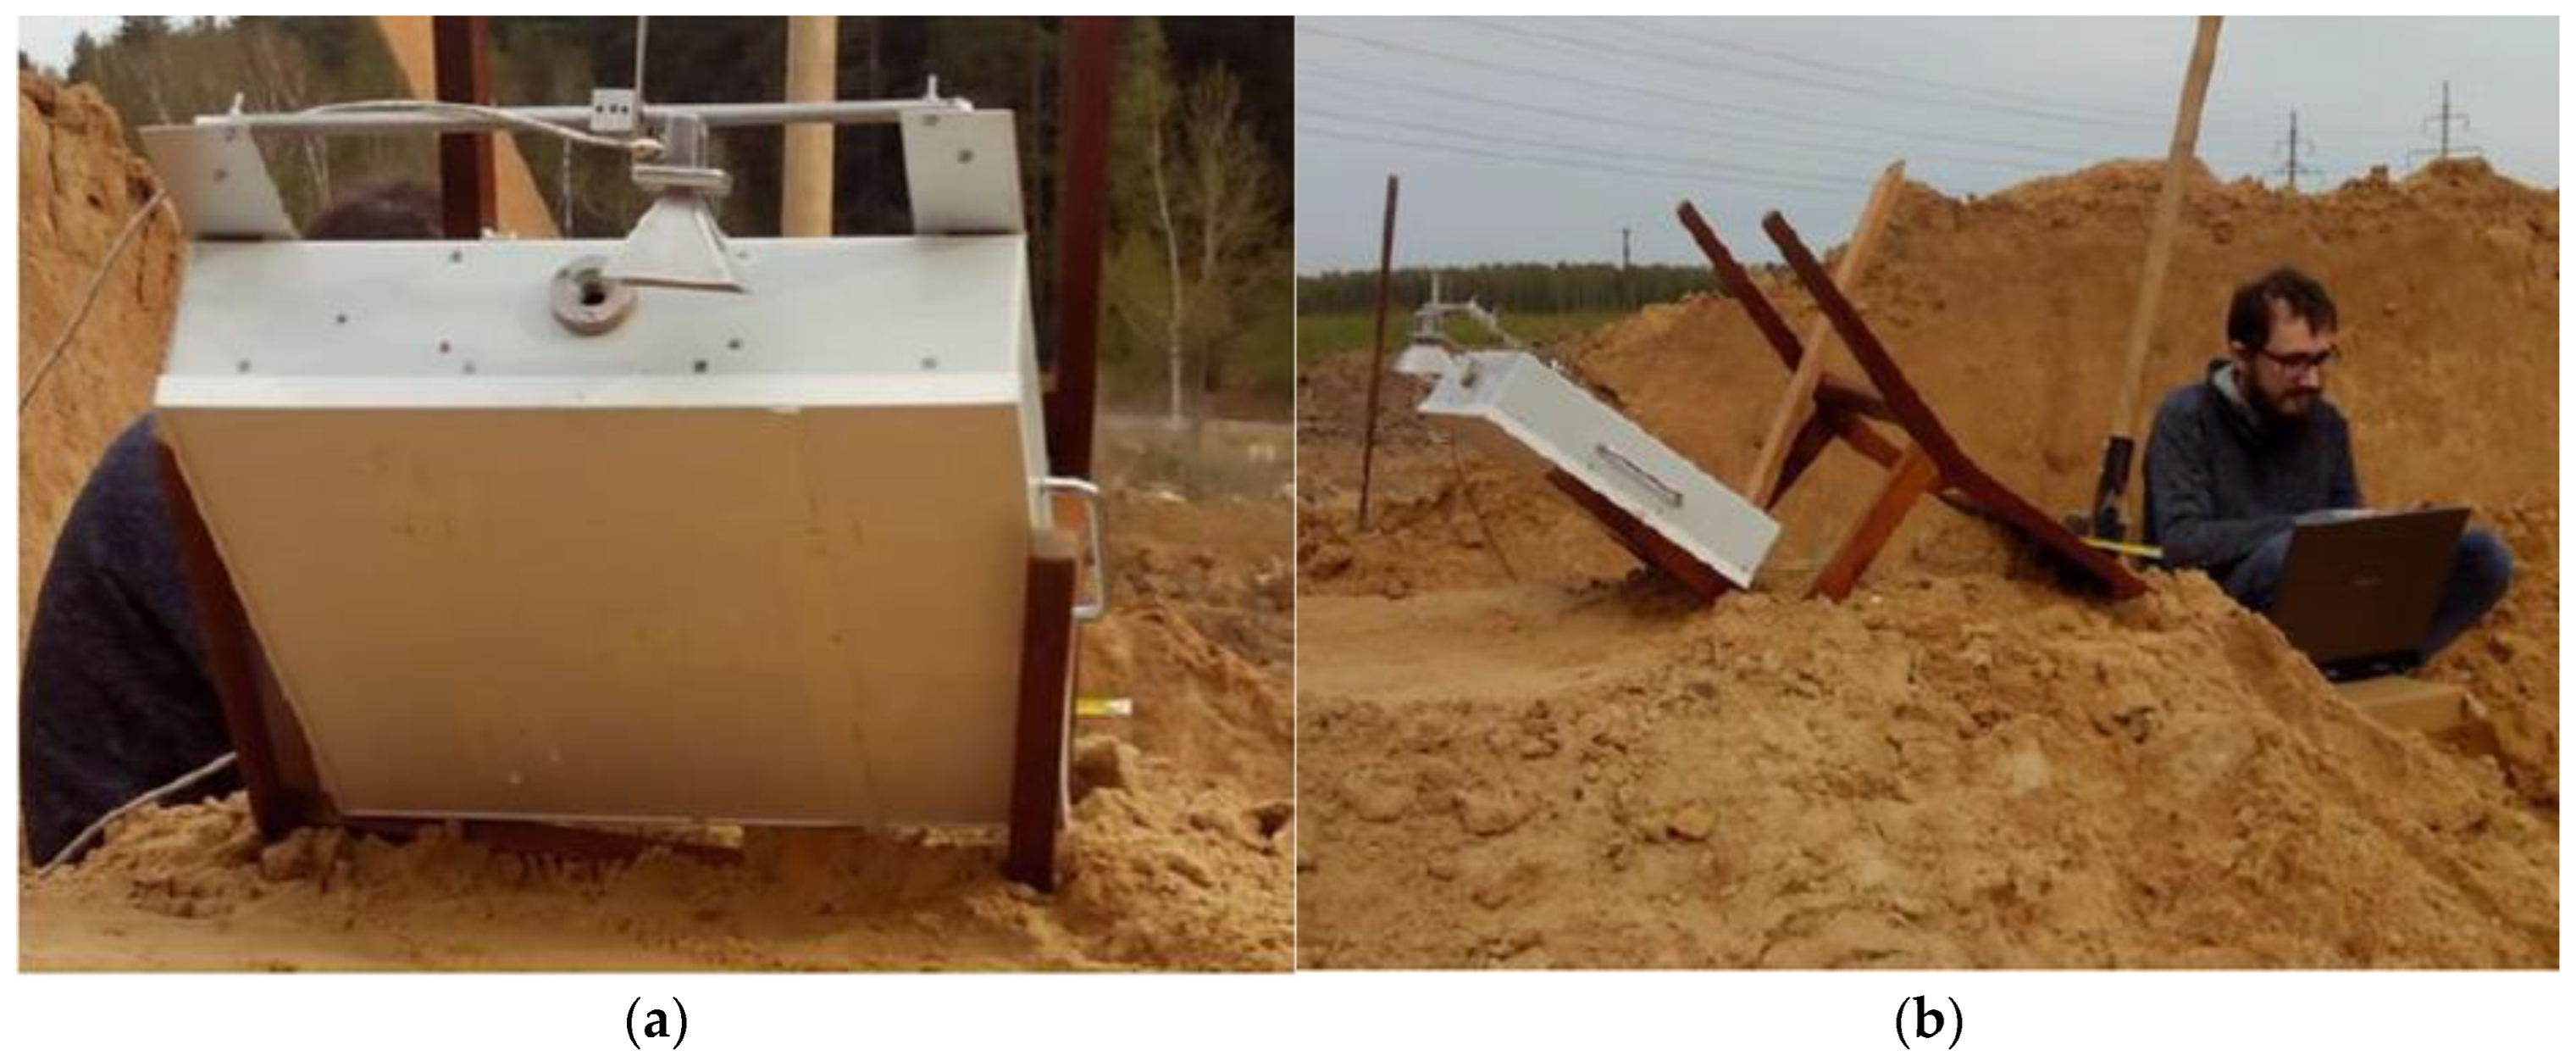
4.2. HSR Performance Assessment in Field Conditions

After the studies on the experimental stand, with the purpose of refining the experiment methodology, field tests were carried out on the localization of foreign objects in the ground. The experiments were performed in the area of Kaluga highway, at one of its reconstruction sites. As the underlying ground, the road bed (sand-gravel mixture with an admixture of clay) was chosen. Rather high humidity of the underlying medium was caused by prolonged rainfall on the eve of the experiments. The device was installed at an angle of 35–40 degrees to the ground surface. Photographs of the improvised experimental setup are shown in Figure 23.
As test objects, metal and plastic disks were used. The objects were placed in the subsurface medium at a depth of 5–10 cm. The measurements were carried out in the multi-view radar mode, the transmitter horn antenna was moved parallel to the ground surface.

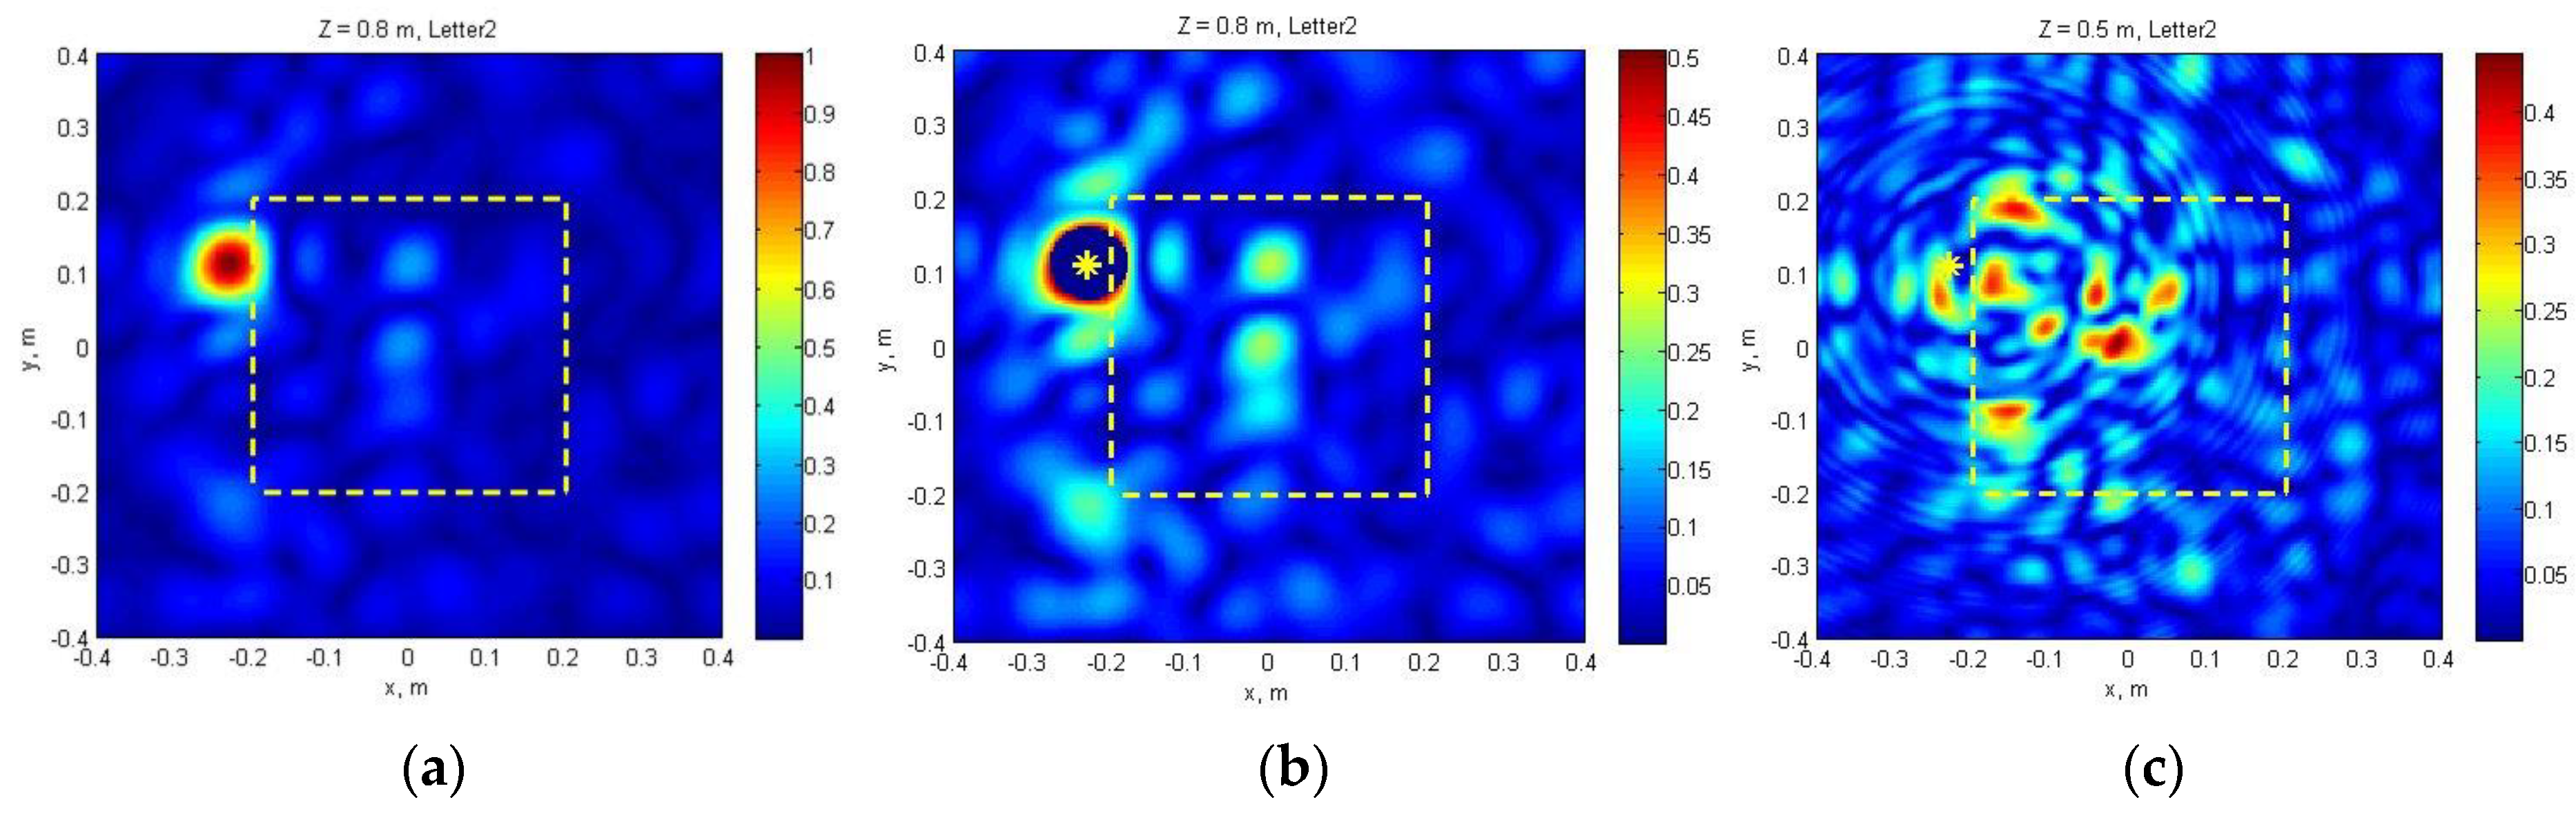
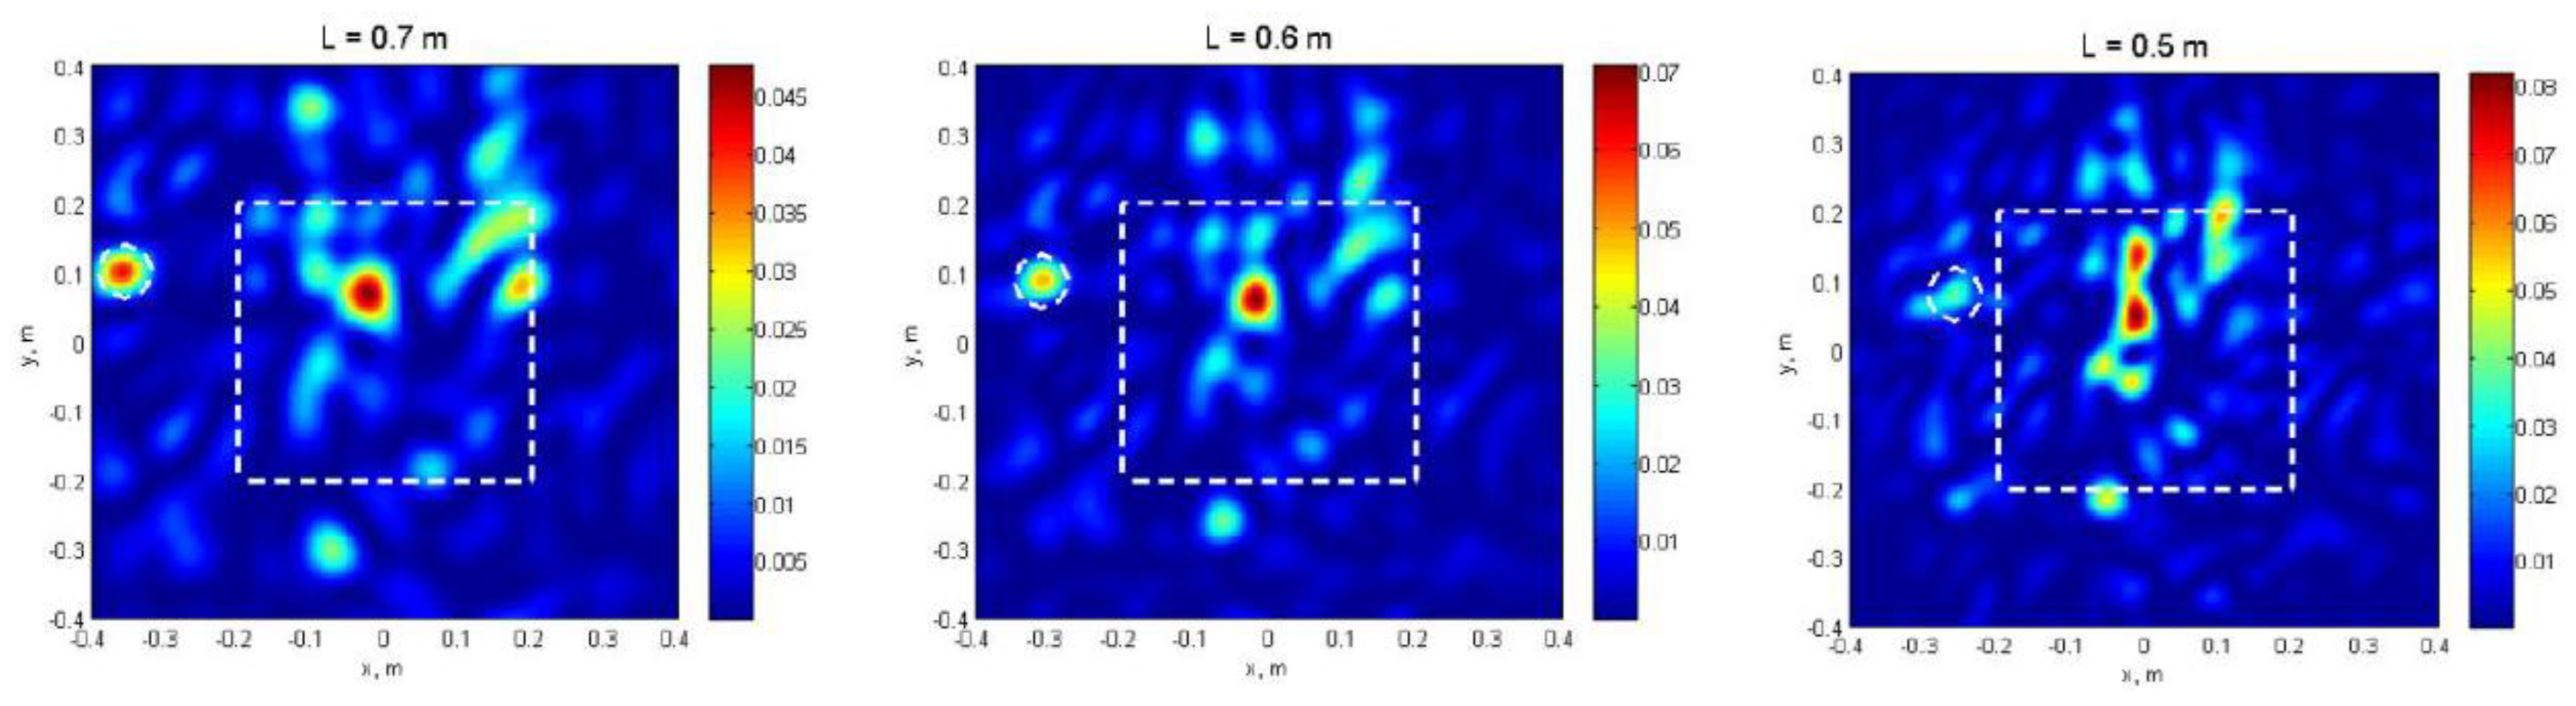
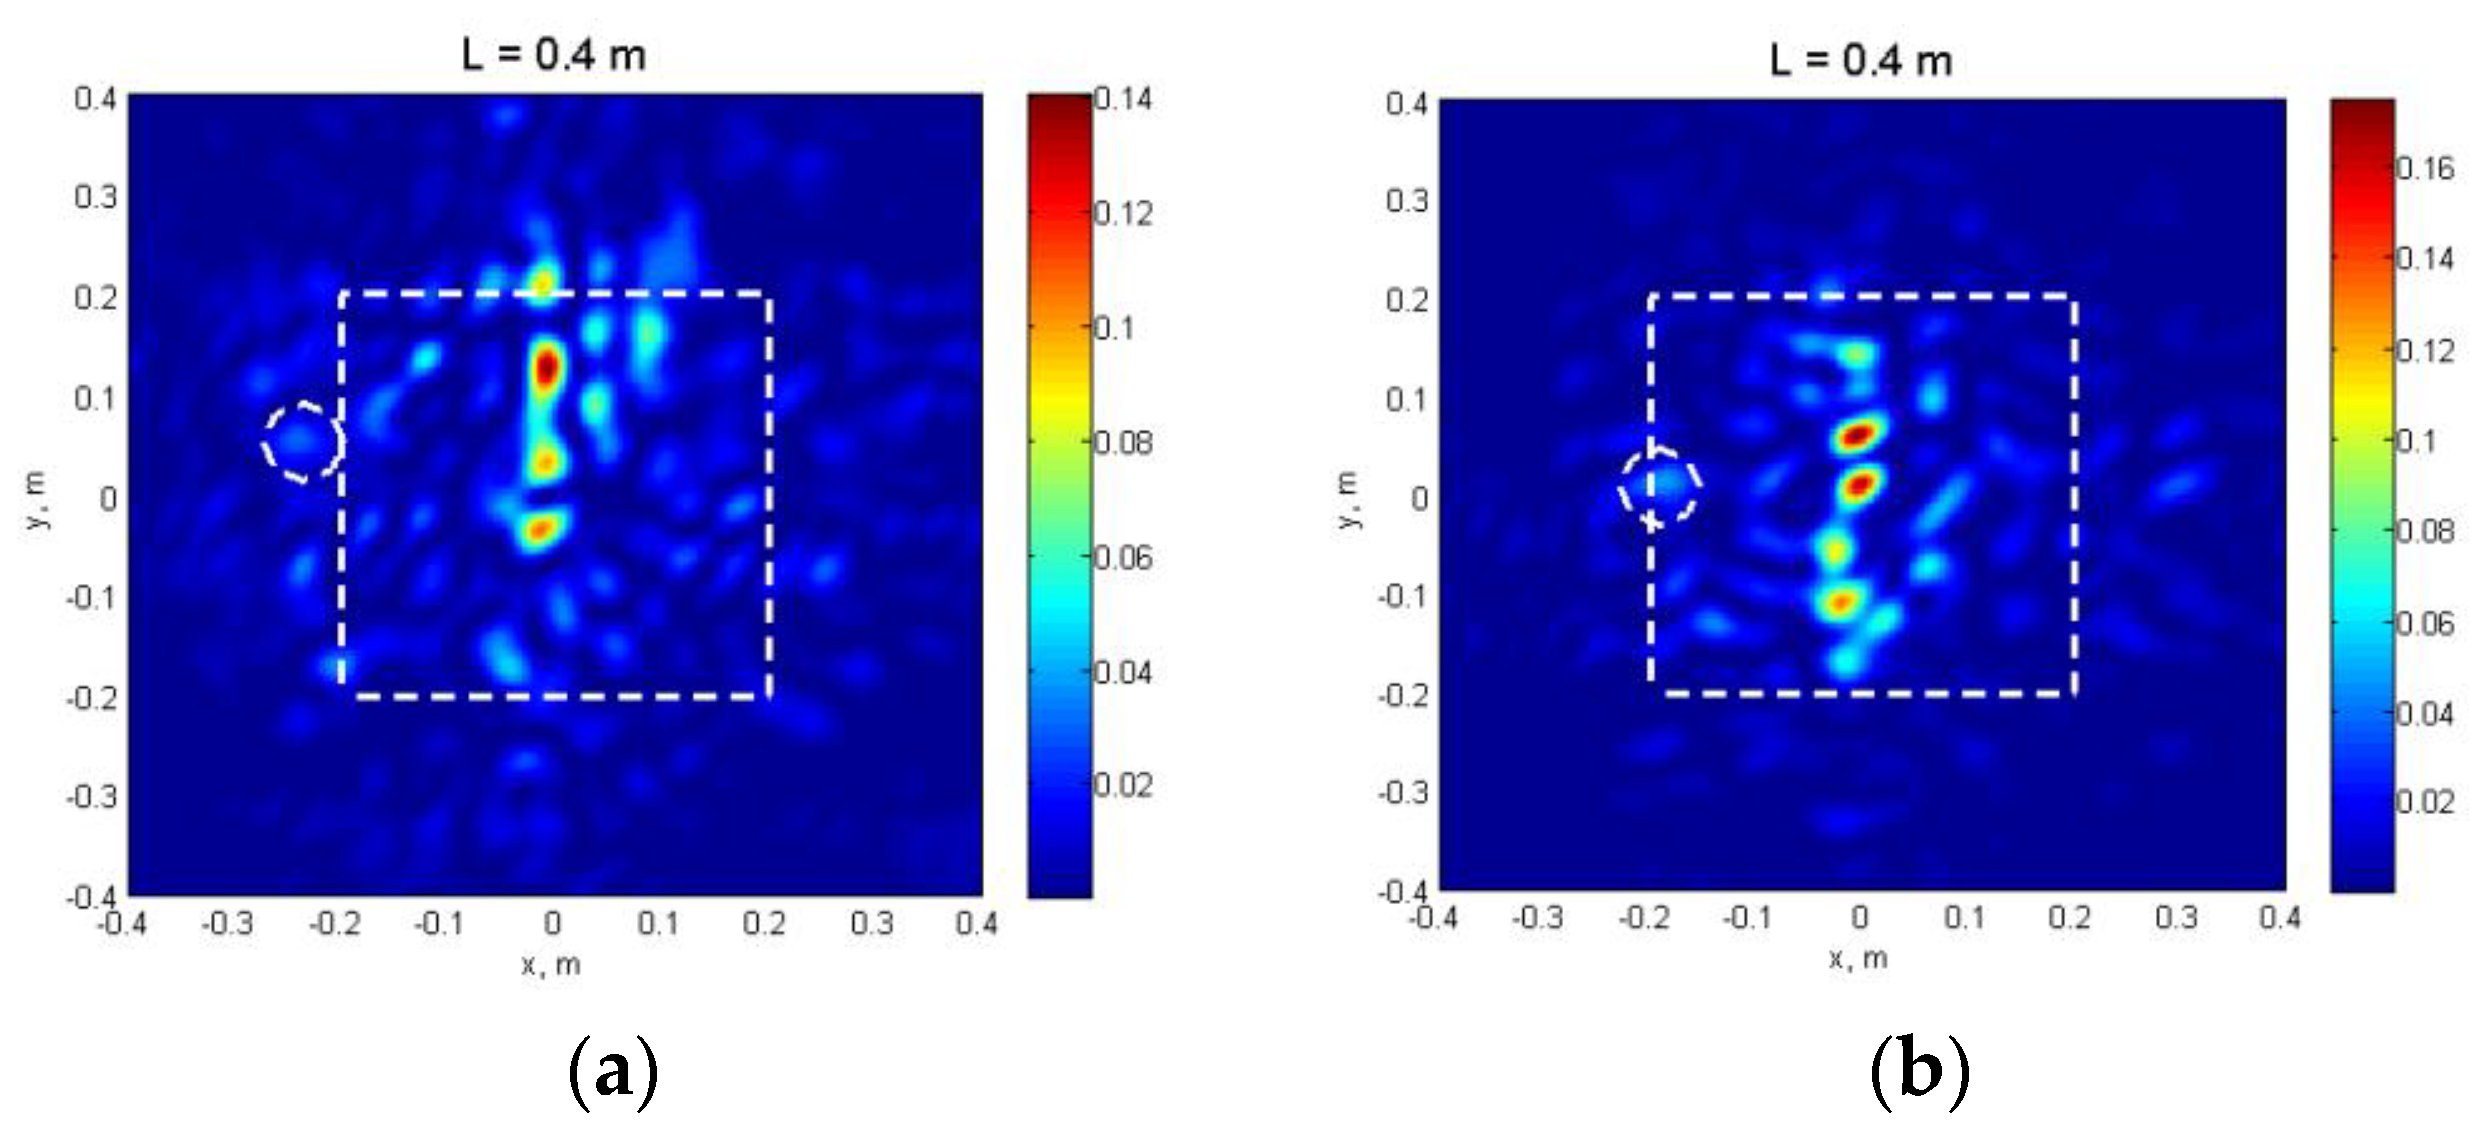
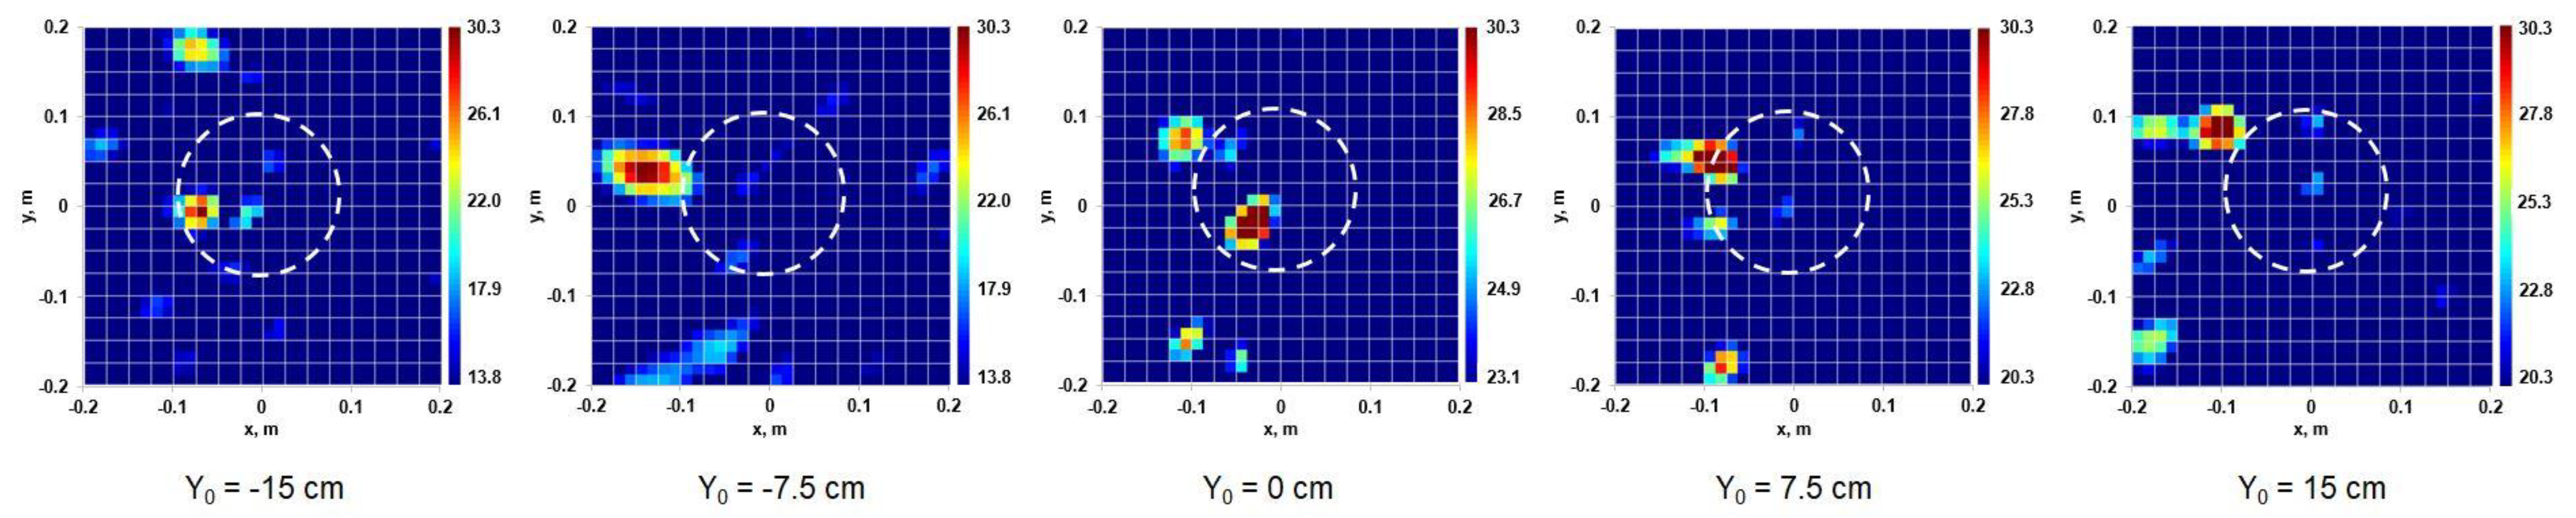
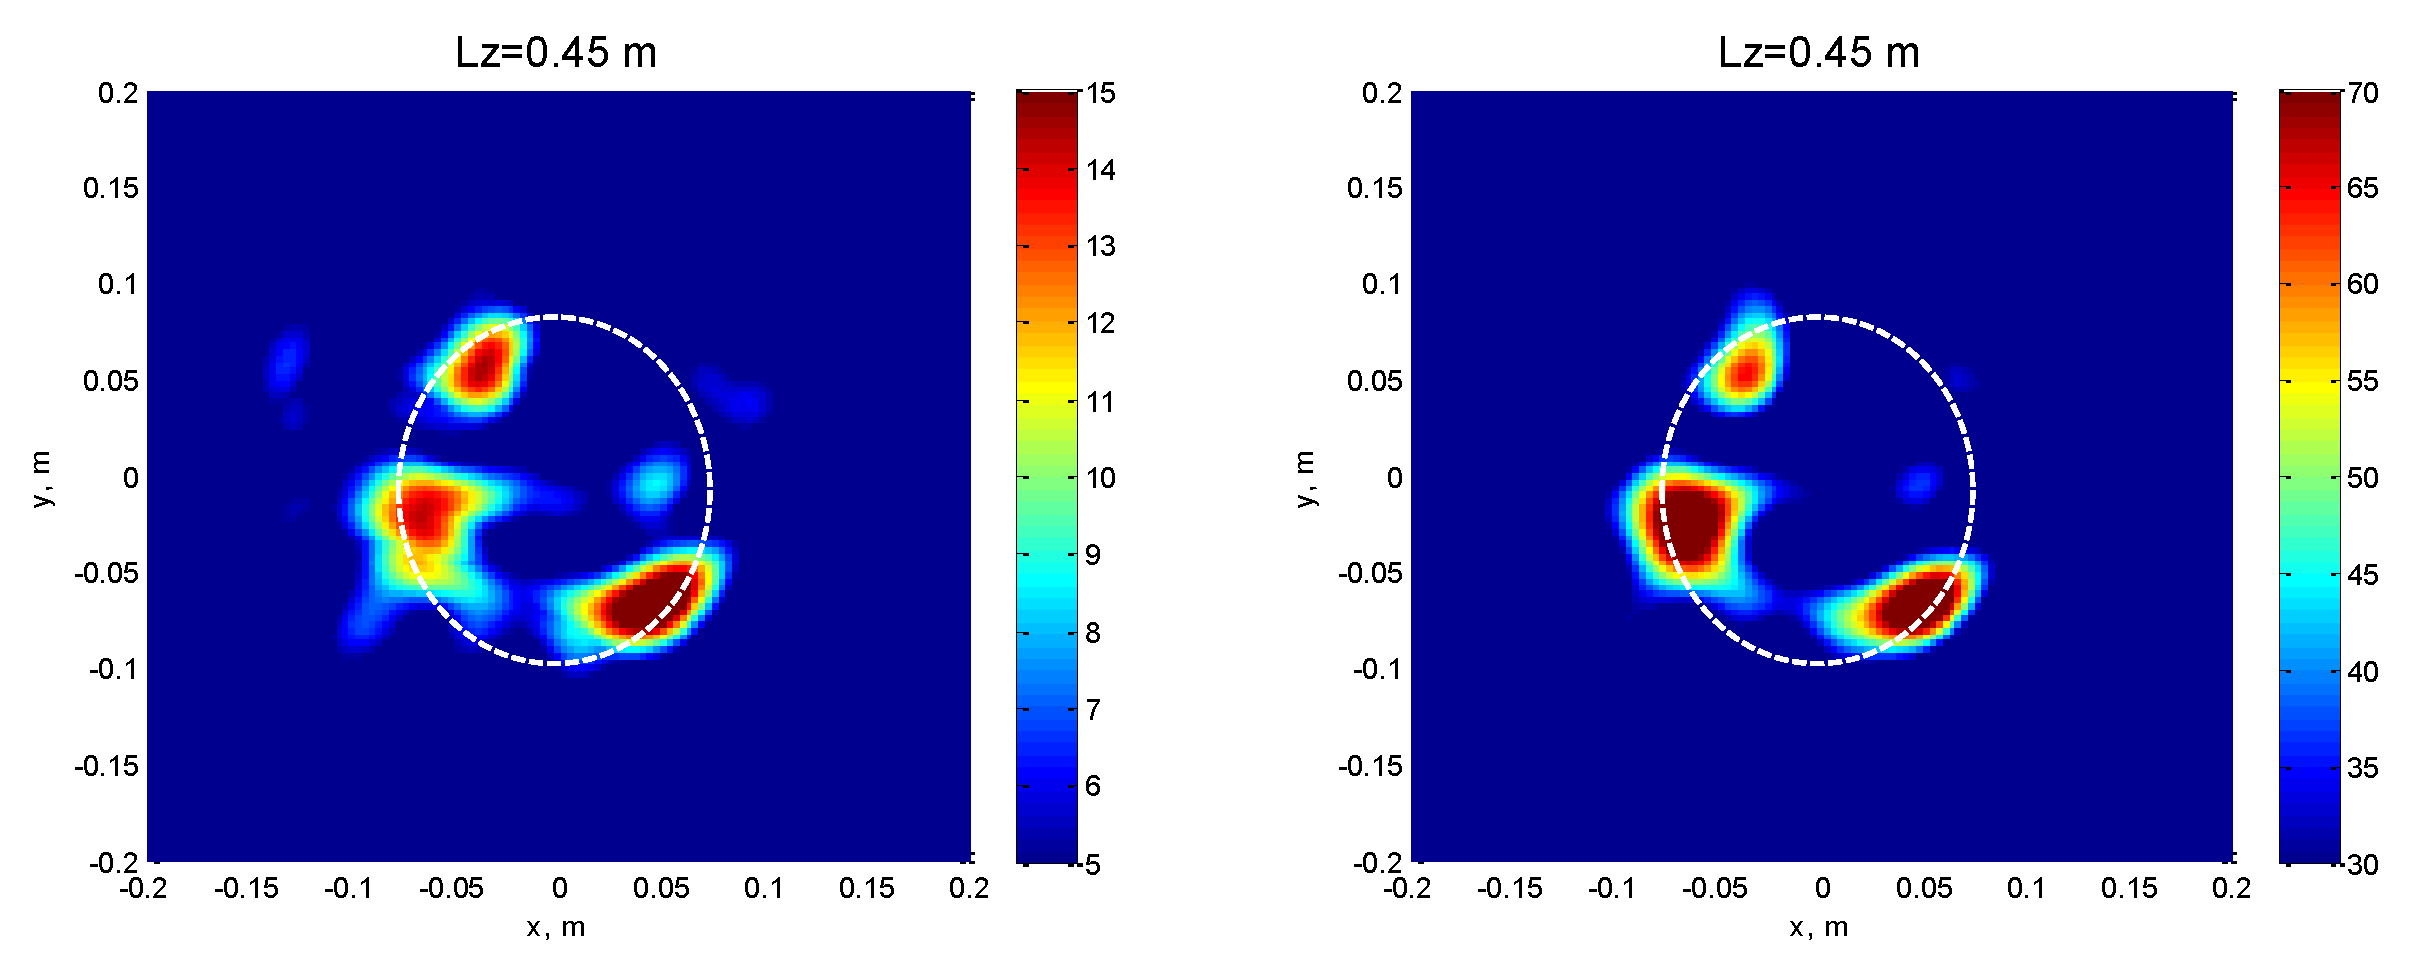
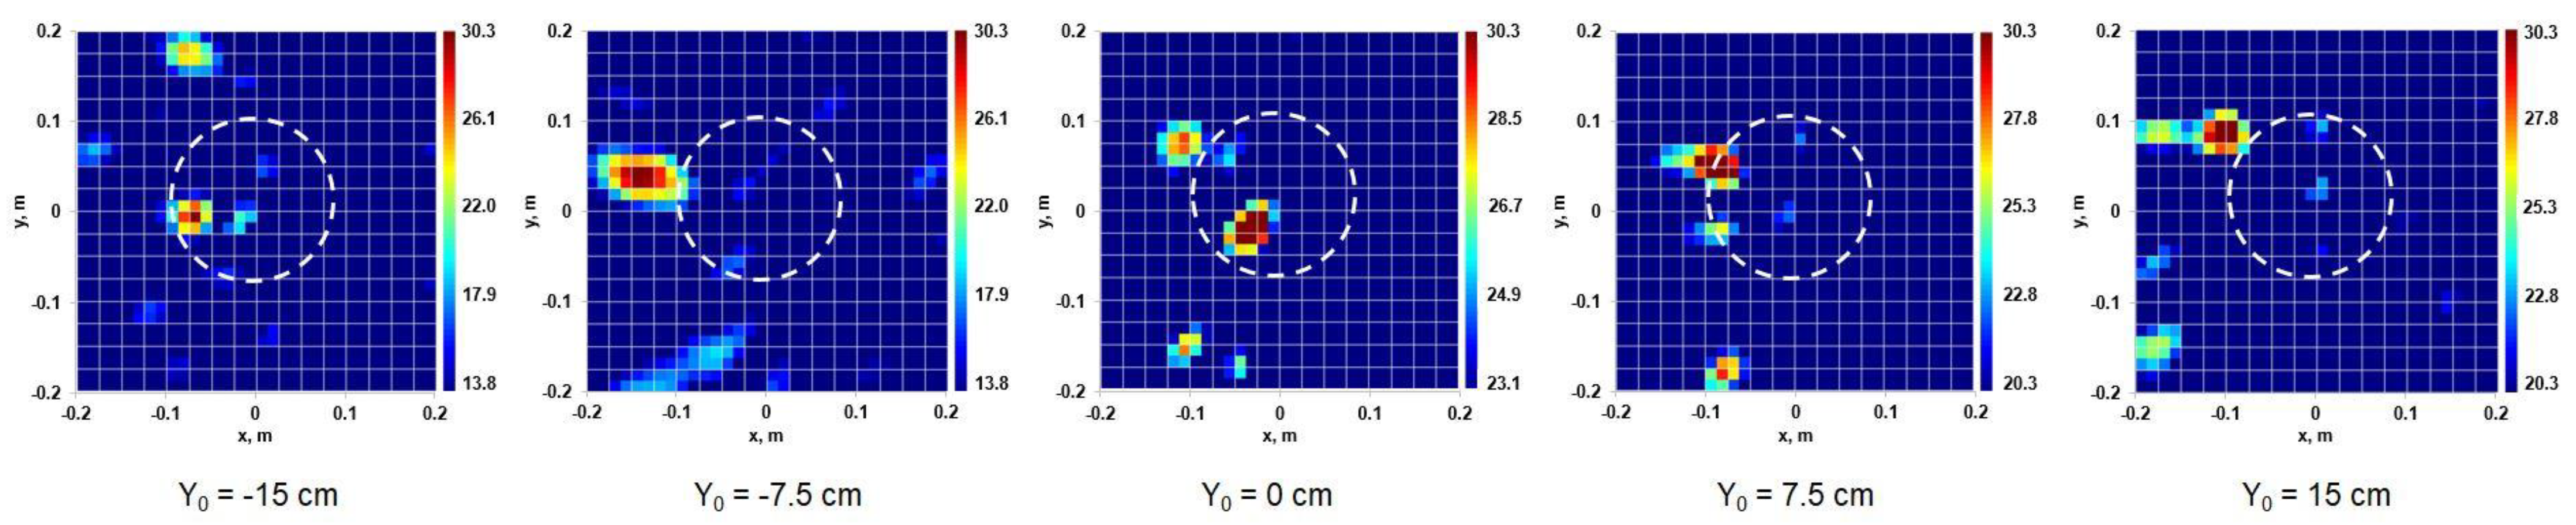
4.3. Results of Oblique Sounding, Field Test

The objects shown in Figure 20, buried in the ground, were used in the experiment. The HSR radiator has been moved along the ground, parallel to the device horizontal edge. The results of one measurement series are shown in Figure 24 and Figure 25. A metal disk with thickness of 2 mm and diameter of 18 cm, located in the subsurface at a depth around 10 cm, was used as a test object.
Each frame in Figure 24 (cleaned data) shows a hologram obtained with a certain position Y0 of the radiator horn. Evidently, the position of the main bright spot is determined by the specular scattering from the disk edge [21]. The results of amplitude and quasi-coherent summation of these frames, obtained with different illumination angles, are shown in Figure 25. The test object is confidently mapped.
One can notice a good qualitative agreement of the individual frames of Figure 24 with the physical optics laws [1]: diffraction spot size δ = λ l / a for λ = 3 cm, l = 60 cm and antenna aperture a = 40 cm measures as δ = 4.5 cm. Moreover, in accordance with diffraction theory [21] they are shifted to the disc edge. Both amplitude and coherent multi-view summation (Figure 25) allow one to estimate actual size and shape of the buried object. A remarkable result of our laboratory and field experiments is a strikingly high similarity in both individual (Figure 21 and Figure 24) and synthesized images (Figure 22 and Figure 25) taken indoors and in realistic conditions.

5. Conclusions

This paper summarizes 20 years of theoretical, engineering, and experimental works conducted by the IZMIRAN radiophysics research group in collaboration with industrial partners from the Moscow Institute of Instrument Engineering, JSC Jupiter-Z and JSC VNIISMI. The main goal was the development of a microwave holographic sensor for industrial and geophysical applications. Unlike most published papers on holographic subsurface radar describing near-field microwave scanning devices, we used multielement two-quadrature component receiver arrays capable of immediately producing diffraction-limited image of subsurface objects. Two constructive solutions were implemented and tested at IZMIRAN. Practical experience was gained in the course of laboratory and field tests. Diffraction theory of holographic subsurface sensing in uniform and horizontally layered medium was developed, and theoretical estimates were given and confirmed by the experiment. A coherent multi-view scheme was proposed and tested in order to improve spatial resolution of the device. The proposed oblique sensing scheme allows for reduction of the parasitic outer reflection.

Author Contributions

Conceptualization, A.E.R., A.I.B. and P.A.M.; methodology, A.V.P. and D.E.E.; software, I.V.P.; formal analysis, A.V.P. and I.V.P.; investigation, D.E.E. and I.V.P.; writing—original draft preparation, A.V.P.; writing—review and editing, I.V.P. and A.V.P.; funding acquisition, A.E.R., A.I.B. and A.V.P. All authors have read and agreed to the published version of the manuscript.

Funding

The first part of this work, I.V.P. has been supported by the Russian Foundation for Basic Research, grants No 01-05-64667, No 03-05-06130 and No 05-02-08025. The second part of the experimental work has been performed with technical support from JSC Company VNIISMI. Analysis of holographic probing of horizontally layered medium has been supported by the Russian Science Foundation, grant No 22-12-00083.

Acknowledgments

We dedicate this publication to the memory of our late friend and colleague, pioneer of holographic subsurface sensing at IZMIRAN, Vladimir Kopeikin.

Conflicts of Interest

The authors declare no conflict of interest.

References

  1. Born, M.; Wolf, E. Principles of Optics: Electromagnetic Theory of Propagation, Interference and Diffraction of Light, 7th ed.; Cambridge University Press: Cambridge, UK, 1999. [Google Scholar]
  2. Anderson, A.P. Microwave holography. Proc. IEEE 1977, 124, 946–962. [Google Scholar] [CrossRef]
  3. Tricoles, G.; Farhat, N.H. Microwave holography: Applications and techniques. Proc. IEEE 1977, 65, 108–121. [Google Scholar] [CrossRef]
  4. Cao, Q.; Goodman, J.W. Wave-front inversion using a thin phase hologram: A computer simulation. Appl. Opt. 1984, 23, 4575–4587. [Google Scholar] [CrossRef] [PubMed]
  5. Iizuka, K. Microwave hologram by photoengraving. Proc. IEEE 1969, 57, 813–814. [Google Scholar] [CrossRef]
  6. Adib, F.; Hsu, C.Y.; Mao, H.; Katabi, D.; Durand, F. Capturing the human figure through a wall–Journ. ACM Trans. Graph. 2015, 34, 219. [Google Scholar] [CrossRef]
  7. Wu, H.; Ravan, M.; Amineh, R.K. Holographic Near-Field Microwave Imaging With Antenna Arrays in a Cylindrical Setup. IEEE Trans. Microw. Theory Tech. 2021, 69, 418–430. [Google Scholar] [CrossRef]
  8. Amineh, R.K.; Nikolova, N.K.; Ravan, M. Real-Time Three-Dimensional Imaging of Dielectric Bodies Using Microwave/Millimeter-Wave Holography; IEEE Press: Piscataway, NJ, USA; Wiley: Hoboken, NJ, USA, 2019. [Google Scholar]
  9. Ivashov, S.I.; Razevig, V.V.; Sergeev, D.L.; Bugaev, A.S.; Zhou, F.; Prokhanova, E.I.; Shcherbakova, A.V.; Dobrynin, S.N.; Vasilenkov, M. An example of microwave holography investigation of an old orthodox Russian icon dated to 19th Century. Heritage 2022, 5, 2804–2817. [Google Scholar] [CrossRef]
  10. Qin, T.; Bossi, L.; Bartolini, A.; Falorni, P.; Giannelli, P.; Zhao, Y.; Capineri, L. Influence Analysis of Uneven Surface on Landmine Detection Using Holographic Radar. In Proceedings of the Progress in Electromagnetics Research Symposium, Toyama, Japan, 1–4 August 2018; pp. 683–691. [Google Scholar]
  11. Chen, C.; Su, Y.; He, Z.; Liu, T.; Song, X. Clutter mitigation in holographic subsurface radar imaging using generative adversarial network with attentive subspace projection. IEEE Trans. Geosci. Remote Sens. 2022, 60, 5116214. [Google Scholar] [CrossRef]
  12. Bossi, L.; Falorni, P.; Priori, S.; Olmi, R.; Capineri, L. Numerical Design and Experimental Validation of a Plastic 3D-Printed Waveguide Antenna for Shallow Object Microwave Imaging. Sens. Imaging 2021, 22, 22. [Google Scholar] [CrossRef]
  13. Nikolova, N.K. Introduction to Microwave Imaging. In EuMA High Frequency Technologies Series; Cambridge University Press: Cambridge, UK, 2017. [Google Scholar]
  14. Ivashov, S.I.; Capineri, L.; Bechtel, T.D.; Razevig, V.V.; Inagaki, M.; Gueorguiev, N.L.; Kizila, A. Design and applications of multi-frequency holographic subsurface radar: Review and case histories. Remote Sens. 2021, 13, 3487. [Google Scholar] [CrossRef]
  15. Popov, A.V.; Kopeikin, V.V.; Vinogradov, V.A. Holographic subsurface radar: Numerical simulation. In Proceedings of the 8th Internatinal Conference on Ground Penetrating Radar, Gold Coast, Australia, 23–26 May 2000; pp. 288–291. [Google Scholar]
  16. Kopeikin, V.V.; Popov, A.V.; Reznikov, A.E.; Rinkus, V.V.; Yakuben, L.M.; Annakuliev, S.K.; Vinogradov, V.A.; Zapunidi, S.A. A prototype of holographic subsurface radar: Hardware. Electromagn. Waves Electron. Syst. EWES 2003, 8, 66–70. [Google Scholar]
  17. Popov, A.V.; Kopeikin, V.V.; Vinogradov, V.A.; Zapunidi, S.A. Reconstruction algorithms and experiments with a prototype of holographic subsurface radar. In Proceedings of the 4th Internatinal Conference on Antenna Theory and Techniques, Sevastopol, Ukraine, 9–12 September 2003; Volume 2, pp. 561–563. [Google Scholar]
  18. Popov, A.; Prokopovich, I.; Kopeikin, V.; Edemskii, D. Synthetic aperture approach to microwave holographic image improvement. In Proceedings of the International Conference Days on Diffraction, St. Petersburg, Russia, 26–30 May 2014; pp. 192–197. [Google Scholar]
  19. Popov, A.; Prokopovich, I.; Edemskii, D. Experimental implementation of microwave subsurface holography. In Proceedings of the 2016 Days on Diffraction (DD), St. Petersburg, Russia, 27 June–1 July 2016; pp. 147–152. [Google Scholar]
  20. Berkut, A.I.; Edemsky, D.E.; Kopeikin, V.V.; Morozov, P.A.; Prokopovich, I.V.; Popov, A.V. Deep Penetration Subsurface Radar: Hardware, Results, Interpretation, 9th Internat; Workshop IWAGPR: Edinburgh, UK, 2017. [Google Scholar]
  21. Hönl, H.; Maue, A.W.; Westpfahl, R. Theory of Diffraction; Department of Navy, Naval Intelligence Support Center: Suitland, MD, USA, 1978. [Google Scholar]
  22. Popov, A.V.; Vinogradov, V.A. Focused Gaussian beams in the problem of holographic imaging. IEEE Trans. Antennas Propag. 2002, 50, 1236–1244. [Google Scholar] [CrossRef]
  23. Wade, G. Signal Coding and Processing, 2nd ed.; Cambridge University Press: Cambridge, UK, 1994; Volume 1. [Google Scholar]
  24. Whittaker, E.; Watson, G. A Course of Modern Analysis; Cambridge University Press: Cambridge, UK, 1996; Volume 1. [Google Scholar]
Figure 1. First laboratory tests: 10 GHz vertical E, harmonic illumination; simulated two-quadrature component, 25 × 25 element, antenna array. (a) Test object; (b) experimental phase hologram; (c) object reconstruction (Kirchhoff migration).
Remotesensing 14 05274 g001
Figure 2. Holographic antenna array (a) composed of twelve 12-element Vivaldi antenna lines (b).
Remotesensing 14 05274 g002
Figure 3. 16 × 16 element planar antenna array designed at JSC Jupiter-Z.
Remotesensing 14 05274 g003
Figure 4. VNIISMI prototype of holographic subsurface radar. (a) Horn transmitter antenna attached to the receiver antenna block. (b) Realistic through-wall vision experiment.
Remotesensing 14 05274 g004
Figure 5. Estimation of scattered signal level and absorption in material medium ( dry   sand ,   estimated   values : ε ’~2.5, tan δ~0.005). Side-wall illumination (a) and back-side illumination (b).
Remotesensing 14 05274 g005
Figure 6. Radar signal from a reinforcement bar in sand (steel, 14 mm in diameter), side-wall illumination—see Figure 5a.
Remotesensing 14 05274 g006
Figure 7. Holograms of reinforcement bar in sand at three different frequencies in the frequency range Δ f ~ 0.1 , shown in a fixed amplitude scale.
Remotesensing 14 05274 g007
Figure 8. Schematic view of the experiment and HSR prototype.
Remotesensing 14 05274 g008
Figure 9. Amplitude (a) and phase (b) distribution of the scattered wave in the receiver antenna aperture and schematic picture of wave front conversion (c). Blue arrows symbolize outgoing spherical wave propagation, red ones—backward migration described with Equation (2).
Remotesensing 14 05274 g009
Figure 10. Test object (a) and its diffraction-limited image (b)—experiment; estimates (c) of longitudinal Δ and transversal δ resolution for a finite antenna aperture a . Red arrows symbolize complex rays of backward wave migration, blue ellips marks the focal spot size.
Remotesensing 14 05274 g010
Figure 11. Spatial spectrum of the test object (a) and superposition of four holographic image spectra taken with four different angles of illumination (b) and synthesized image of the object (c).
Remotesensing 14 05274 g011
Figure 12. Calculated images of the test object at a distance l = 50 cm in free space (a) and in a material medium with the interface at z 0 = 30 cm and dielectric permittivity ε = 9 (b); an attempt to visualize an object immersed in a medium with such parameters—experiment (c). The asterisk and dashed line show the transmitter and the receiver antenna aperture.
Remotesensing 14 05274 g012
Figure 13. Wave scattered by a subsurface object is masked by specular reflection from the medium outer boundary (a); wave front conversion localizes the imaginary source (b). Notations: radiator, R; object, O; holographic antenna, A; mirror source image, M.
Remotesensing 14 05274 g013
Figure 14. (a) Reconstructed wave field in the imaginary source plane; (b) mechanical cutting out of the source image; (c) migration to the object plane. Dotted line marks the holographic antenna contour, asterisk shows the radiator position.
Remotesensing 14 05274 g014
Figure 15. (a) Gaussian approximation of the specular image of the emitter; (b) cutting off the imaginary source; (c) migration into the object plane. Dotted line—HSR contour; asterisk—radiator position.
Remotesensing 14 05274 g015
Figure 16. Coherent image of six radiation sources in the plane of specular reflection z = 0.8 m (a); “biting off” Gaussian imaginary sources (b); migration to the object plane z = 0.5 m (c). Dotted line—HSR contour.
Remotesensing 14 05274 g016
Figure 17. Geometry of oblique probing (a); imaginary source does not irradiate HSR aperture (b). Notations: radiator, R; object, O; holographic antenna, A; mirror source image, M. Arrows mark the incident and reflected waves.
Remotesensing 14 05274 g017
Figure 18. Dependence of the image (vertical rod in sand) on the recovery depth: z = 0.7 , 0.6 , 0.5 m.
Remotesensing 14 05274 g018
Figure 19. Image of the metal rod, focused in object plane z = 0.4 m. Radiator height (a): h = 0.1 m; (b): h = 0.05 m.
Remotesensing 14 05274 g019
Figure 20. Test objects.
Remotesensing 14 05274 g020
Figure 21. Images of a round-shaped object, marked with the dotted circle, under multi-position illumination from the left side.
Remotesensing 14 05274 g021
Figure 22. Aluminum ring with diameter of 18 cm in a subsurface medium at a depth of 12 cm. Amplitude (a) and coherent (b) multi-view summation.
Remotesensing 14 05274 g022
Figure 23. Photo of the HSR prototype with a movable radiator (a). Preparing experimental site and equipment (b).
Remotesensing 14 05274 g023
Figure 24. Results of multi-view holographic sensing of a metal disk, buried in the road bed.
Remotesensing 14 05274 g024
Figure 25. The results of amplitude and quasi-coherent multi-view summation.
Remotesensing 14 05274 g025
Publisher’s Note: MDPI stays neutral with regard to jurisdictional claims in published maps and institutional affiliations.

