Next Article in Journal
Shallow Sea Topography Detection from Multi-Source SAR Satellites: A Case Study of Dazhou Island in China
Next Article in Special Issue
Mapping Crop Leaf Area Index and Canopy Chlorophyll Content Using UAV Multispectral Imagery: Impacts of Illuminations and Distribution of Input Variables
Previous Article in Journal
Satellite-Derived Photosynthetically Available Radiation at the Coastal Arctic Seafloor
Previous Article in Special Issue
Winter Wheat Lodging Area Extraction Using Deep Learning with GaoFen-2 Satellite Imagery
 
 
Correction published on 19 May 2023, see Remote Sens. 2023, 15(10), 2654.
Article

A Method to Estimate Clear-Sky Albedo of Paddy Rice Fields

1
State Key Laboratory of Urban and Regional Ecology, Research Center for Eco-Environmental Sciences, Chinese Academy of Sciences, Beijing 100085, China
2
State Key Laboratory of Resources and Environmental Information System, Institute of Geographic Sciences and Natural Resources Research, Chinese Academy of Sciences, Beijing 100101, China
3
College of Resources and Environment, University of Chinese Academy of Sciences, Beijing 100049, China
*
Author to whom correspondence should be addressed.
Remote Sens. 2022, 14(20), 5185; https://doi.org/10.3390/rs14205185
Submission received: 9 September 2022 / Revised: 7 October 2022 / Accepted: 12 October 2022 / Published: 17 October 2022 / Corrected: 19 May 2023
(This article belongs to the Special Issue Digital Farming with Remote Sensing)

Abstract

:
As a major crop type in the global agroecosystem, paddy rice fields contribute to global greenhouse gas emissions. Surface albedo plays a vital role in estimating carbon emissions. However, it is difficult to find a broadband albedo estimation over paddy rice fields. The objective of this study was to derive an applicable method to improve albedo estimation over a paddy rice field. Field multiangle reflectance and surface albedo were collected throughout the growing season. A physically based model (AMBRALS) was utilized to reconstruct the directional reflectance into the spectral albedo. Multiple spectral albedos (at the wavelengths of 470, 550, 660, 850, 1243, 1640 and 2151 nm) were calculated, and new narrowband to broadband conversion coefficients were derived between the observed spectral albedo and broadband albedo. The conversion schemes showed high consistency with the field albedo observations in the shortwave (285–3000 nm), infrared (700–3000 nm), and visible (400–700 nm) bands. This method can help improve albedo estimation in partially submerged environments.

Graphical Abstract

1. Introduction

Land surface albedo, the fraction of incident solar radiation reflected by the Earth’s surface, is a primary factor controlling the surface energy balance [1]. As one of the essential crop types in the global agricultural ecosystem, paddy rice is differentiated from other dryland crops by seasonal, partially submerged water [2]. It is crucial to accurately estimate the paddy rice albedo for the reliable retrieval of terrestrial greenhouse gas emissions [3,4]. However, due to complicated interactions between the bottom soil–middle water–upper plant features of paddy rice fields [5,6,7,8] and the scarcity of continuous albedo observations over paddy rice fields [9], realistic albedo estimation is challenging.
Remote sensing provides the ability to obtain global albedo observations. Generally, there are two ways to obtain remote sensing albedos: the physical retrieval method based on radiative transfer models and the empirical fitting method from remote sensing reflectance. The most extensively used physically based method is the kernel-driven model, which uses radiative transfer theory and has been successfully applied to Moderate Resolution Imaging Spectroradiometer (MODIS) and Landsat data [10]. The kernel-driven model applies several kernel functions to fit various surface properties, such as the Li-Sparse and Li-Dense [11] and Roujean model [12] for surface scattering and the Ross model [13] for volume scattering. The Isotropic-RossThick-LiSparse Reciprocal (RTLSR) kernels are often selected for retrieving the seasonal vegetation albedo due to the stability and good performance of this configuration [14,15,16,17].
The empirical conversion from narrowband (spectral) to broadband albedo is a more straightforward way to describe reflected solar radiation [18]. Many conversion formulas have been developed to adapt various nonflooded surface types and different kinds of satellite sensors [19,20,21,22,23,24,25,26]. Unique surfaces such as snow or glaciers are separately treated [27,28,29,30,31]. The most commonly used conversion schemes were introduced by Liang [18] and have been proven successful on many nonflood land surfaces.
Currently, there are no albedo estimation schemes for paddy rice fields. The existing albedo products from remote sensing have poor accuracy over partially flooded areas [32,33,34,35]. In addition, as an essential input parameter in land surface models (LSMs) [36,37], the albedo of paddy rice regions is now empirically considered as predefined values or simple derivations without matching growing status and seasonal variations [38,39,40,41]. It is necessary to develop an applicable albedo estimation method over paddy rice fields to improve estimations of greenhouse gas emissions.
Therefore, this study aimed to develop a broadband albedo estimation method over paddy rice fields. The method covers multiple broadband bands, including 400–700 nm (visible spectrum, VIS), 700–3000 nm (infrared spectrum, IR), and 285–3000 nm (full shortwave spectrum, SW). The seasonal albedo observations and synchronous reflectance measurements recorded in 2015 were used as the data basis. The kernel-driven directional reflectance model [42,43] was applied as a bridge between the field multiangle reflectance and multiband albedo to produce the spectral albedo. Nine viewing angles were analyzed to fit the best spectral albedo. After that, the narrowband-to-broadband albedo conversion schemes were derived through multiple variable regressions. Finally, the newly derived albedo results were compared with existing conversion schemes and field observations.

2. Materials and Methods

2.1. Study Area and Paddy Rice Growing Features

The experimental area was located in a paddy rice field (400 × 200 m) in Beijing, China (40.076°N, 116.204°E) (Figure 1). Beijing has a temperate continental climate with a hot, humid summer and a cold, dry winter. The annual precipitation in Beijing was approximately 566 mm, and the annual mean temperature was 12.7 °C. This paddy rice field was partially submerged by water from early June (day of year (DOY) 154) to late October (DOY 289) in 2015.
A Nikon-D50 digital camera (Nikon in Tokyo, Japan) was used to estimate vegetation cover fraction (FVC). Photos were shot at a height of 1.5 m from the nadir (direction point directly to the ground). According to the recommended sampling protocol over paddy rice fields [44,45], four elementary sampling units (ESUs, 20 × 20 m2) were selected. The diamond-shaped sampling box was performed at the ESU level. Three photos were taken at each point.
As Figure 2 illustrates, the FVC grew faster than the plant height from 3 June to 26 July. In the tillering stage, the FVC rapidly increased from 0.4 to 0.6 and then slowly increased to 0.8, while the plants’ height rose from 0.3 to 0.6 m during this time. After that, the FVC remained stable at approximately 0.8 and slightly decreased in late September. The height of rice plants continued to grow until mid-August and then started to decline.

2.2. Data Preparation

2.2.1. Directional Reflectance

We sampled multiangle reflectance and albedo over the paddy rice field throughout the growing season. The reflectance observation instrument was specially designed for paddy rice. The directional reflectance was measured with an Avafield-3 spectrometer (Avantes in Apeldoorn, The Netherlands), which measured the reflectance between 300 and 2500 nm. A 2.5 m optic fiber with a 25° field of view (FOV) was attached to the spectrometer. The multiangle reflectance data were collected in 10-day intervals under clear sky conditions. A total of 9 view angles including the forward and backward directions were used in sampling, which were −60°, −45°, −30°, −15°, 0°, 15°, 30°, 45°, and 60°. The backward view angles were marked with a negative symbol. More detailed multiangle reflectance measurements can be found in a previous study [9]. The time we measured the reflectance matched the ten-minute broadband albedo.

2.2.2. Albedo Observations

Regarding the surface broadband albedo, three pairs of pyranometers (Kipp & Zonen in Delft, The Netherlands) with different spectral ranges (400–2800, 700–2800, and 285–2800 nm) were set in the center of the paddy rice field throughout the growing season (Figure 1). The observation height of the pyranometer was 2.2 m from the bottom soil. The pyranometers recorded the data in 10-min steps.
The seasonal albedo and the sample diurnal albedo are illustrated in Figure 3. The asymmetry was significant on the diurnal albedo, with higher values in the morning than in the afternoon. The lower albedo values from 5 to 7 October were affected by cloudy days.
The diurnal mean albedo was averaged from the ten-minute data (7:00–16:00). The seasonality of the rice field albedo was evident in all three spectral ranges. Among them, the values of the infrared albedo (700–3000 nm) were higher than the values of the visible albedo (400–700 nm) and shortwave albedo (285–3000 nm). When the soil surface was totally submerged by water and younger plants (before 23 June), the albedos of all three bands were almost the same. Then, the albedo values started to show discrepancies with the growth in rice plants. During the tillering stage (23 June–9 July), with increasing number of rice leaves, the albedo of the photosynthetic band (400–700 nm) decreased, while the other two albedo bands rapidly increased. After, the shortwave and infrared albedo remained high and stable, while the photosynthetic albedo remained low. After 26 August, the rice grew to the ripening stage and the gradually yellowing leaves indicated a decrease in photosynthetic ability, which resulted in a slow increase in the albedo at 400–700 nm.

2.3. Proposed Method
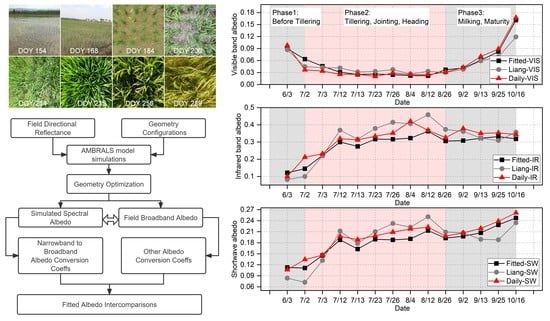
The proposed method in this study derives broadband albedo by combining field albedo observations and model simulations. As Figure 4 illustrates, first, the model parameters of the spectral albedo were built from the directional reflectance. In this study, the spectral bands were 470, 550, 660, 850, 1243, 1640, and 2151 nm, consistent with previous studies [29]. The best viewing angles to generate the spectral albedo were given in this step. Second, the observed (ten-minute) broadband albedo and the generated spectral albedo were regressed to derive the conversion schemes from narrowband albedo to broadband albedo. Finally, our albedo estimations and the results from the existing conversion schemes for MODIS [18] were compared with the daily albedo observations.
We used a physical model (Algorithm for Model Bidirectional Reflectance Anisotropies of the Land Surface (AMBRALS)) [46] to aggregate directional reflectance to the spectral albedo. The inversion mode of the AMBRALS model was adopted, the white-sky albedo and black-sky albedo were generated, and the diffuse ratio of the sky was calculated from the MODIS aerosol product to derive the blue-sky albedo [47,48].
The AMBRALS model provides a linear expression [12] to describe the surface anisotropy:
R θ , ϑ , ϕ , Λ = k f k Λ K k θ , ϑ , ϕ
where R θ , ϑ , ϕ , Λ is bidirectional reflectance in waveband Λ , f k Λ is the kernel model parameter, K k θ , ϑ , ϕ is the model kernel, θ is solar zenith angle (SZA), ϑ is view zenith angle (VZA), and ϕ is view-sun relative azimuth angle. Define a least square error function to minimize the e 2 / f k :
e 2 Λ = 1 d l ρ θ l , ϑ l , ϕ l , Λ R θ l , ϑ l , ϕ l , Λ 2 ω l Λ
which derives the solutions for the model parameter f k . The directional-hemispherical and bihemispherical integrals of the kernel model kernels can be defined as follows:
h k θ = 0 2 π 0 π 2 K k θ , ϑ , ϕ s i n ϑ c o s ϑ d ϑ d ϕ
H k = 2 0 π / 2 h k θ s i n θ c o s θ d θ
Then, the black-sky albedo and white-sky albedo are:
α b s θ , Λ = k f k Λ h k θ
α w s Λ = k f k Λ H k
Black-sky albedo is defined as the albedo in the absence of a diffuse component and is a function of the solar zenith angle. White-sky albedo is defined as the albedo in the absence of a direct component when the diffuse component is isotropic, which is a constant [49].
Black-sky albedo and white-sky albedo mark the extreme cases of completely direct and completely diffuse illumination, respectively. Actual albedo is a value interpolated between these two depending on the aerosol optical depth. If the diffuse skylight is assumed to be an isotropic fraction S θ , τ Λ of total illumination, then the actual spectral albedo is:
α θ , Λ = 1 S θ , τ Λ α b s θ , Λ + S θ , τ Λ α w s Λ
Then, the broadband albedo can be converted by the empirical conversion weights c i , which reflect the distribution of downwelling radiative flux:
A θ = i c i α θ , Λ i
The directional reflectance can be modeled as several kernels that represent the scattering types: isotropic scattering, volumetric scattering from horizontally homogeneous leaf canopies, and geometric-optical surface scattering from scenes containing three-dimensional objects:
R θ , ϑ , ϕ , λ = f i s o λ + f v o l λ k v o l θ , ϑ , ϕ + f g e o λ k g e o θ , ϑ , ϕ
where k v o l is the volume scattering as a function of solar zenith angle θ s , view zenith angle θ v , and relative azimuth angle ϕ ; k g e o is the surface scattering from the canopy; f v o l and f g e o are the weights of the kernels; and f i s o is a constant corresponding to isotropic scattering. More detailed information about the kernel mathematics can be found in the algorithm documents of the MODIS product (MOD43B).
RossThick and LiSparse-R kernels were adopted in this study. A simple mathematical expression was found in the AMBRALS model to express the integrations of directional reflectance, which provides a numerical way to calculate the spectral albedo:
h k θ = g 0 k + g 1 k θ 2 + g 2 k θ 3
α b s θ , Λ = f i s o Λ g 0 i s o + g 1 i s o θ 2 + g 2 i s o θ 3 + f v o l Λ g 0 v o l + g 1 v o l θ 2 + g 2 v o l θ 3 + f g e o Λ g 0 g e o + g 1 g e o θ 2 + g 2 g e o θ 3
The white-sky albedo ( α w s Λ ) is given as a constant in the outputs of the AMBRALS model with the kernel coefficients.

3. Results

3.1. Generation of Spectral Albedo from Directional Reflectance

The clear-sky spectral albedo was derived from the relationships between field multiangle reflectance and kernel-driven simulations. Figure 5 shows the relationships between the directional reflectance and spectral albedo including all spectral bands. As Figure 5 illustrates, the fitting relationships were more discrete when the directional reflectance was higher than 0.5. A linear relationship was found between the directional reflectance and spectral albedo:
α λ ϑ = k 1 ρ λ ϑ + k 2
where α λ is the spectral albedo, k 1 and k 2 are the model coefficients, and ρ λ indicates the reflectance from the specified viewing zenith angle ( ϑ ).
The fitting coefficients for spectral albedo are shown in Table 1. The average R2 was 0.947, and the average RMSE was 0.037. According to Table 1, the oblique reflectance contributed more information to estimating the spectral albedo. Forward observations (positive VZA) produced higher accuracy than nadir and backward observations, whose R2 values were greater than 0.96 and RMSEs were lower than 0.037. The best fitting came from the forward 30°, which suggested that the forward 30° might be a more reliable viewing angle for estimating the spectral albedo over paddy rice fields.

3.2. Conversion Formulas from Narrowband to Broadband

We derived conversion schemes for MODIS, the most commonly used sensor when estimating the surface albedo. Multiple linear regression was adopted at full shortwave (285–3000 nm), infrared (700–3000 nm), and visible (400–700 nm) bands. The derived broadband albedo was a function of spectral albedo generated from the reflectance of forward 30°. The linear conversion forms weighted with the given coefficients are listed in Table 2:

3.3. Intercomparison of Broadband Albedo

We compared the fitted broadband albedo derived from new conversion schemes with field measurements and Liang’s results (Figure 6). The daily field albedo was the baseline in our comparison. For the VIS band, except for phase 3, the values showed good consistency in the other growth stages. Albedos were almost the same in phase 1 when the paddy rice field was covered mainly by water. Liang’s albedo conversion presented a slight overestimation (≈0.01) in phase 2, and showed an underestimation when the rice plants were fully matured in phase 3. For the IR band, due to the radiation absorption of the water surface, both Liang’s conversions and our results were close to the pyranometer’s results (≈0.1) before the rice tillering stage (phase 1). Thereafter, the rapid growth and extension of vegetation leaves significantly increased the field albedo between 2 and 12 July. In phase 2, from the mean values, our results underestimated the field observations by 0.052 while Liang’s conversion overestimated the field observations by approximately 0.018. In phase 3, both Liang’s and our albedos were close to the field albedo.
The variations in the albedo in the shortwave band were similar to those in the infrared band in phases 1 and 2 (Figure 6c). For the SW band, our results slightly underestimated the field observations by 0.015 and Liang’s conversion overestimated the field observations by approximately 0.01. In phase 3, Liang’s conversion schemes showed underestimation and our fitted results were consistent.
For the whole growing season, the regressions between fitted and field broadband albedo are illustrated in Figure 7. For the shortwave albedo, the results of this study showed higher accuracy than those from Liang’s conversions. The underestimations in phases 1 and 3 led to the relatively lower accuracy of Liang’s conversion schemes. Liang’s conversion results were close to our results in the infrared and visible bands.

4. Discussion

4.1. SZA Dependence on Broadband Albedo Conversion

In this study, the SZAs were grouped into four ranges: 20°–30°, 30°–40°, 40°–50°, and 50°–65°. In Figure 8, SZA presents lower RMSE values in the ranges of 30°–40° and 40°–50° at most VZAs. The larger SZAs (>50°) did not show significant degradation in accuracy (Table 3), which is different than the results in a previous study [50]. The higher fitting accuracy of SZA dependence throughout the growing season indicates the robustness of our albedo conversion method.
The weak dependences on wavelengths and the higher fitting accuracy on SZA indicated that the albedo derivation in this study could include more spectral bands and adapt more measurement time points.

4.2. Spectral Dependence on Broadband Albedo Conversion

As Table 4 illustrates, except for the forward 15° and nadir VZAs, similar fitting slopes were observed in the other VZAs between the directional reflectance and spectral albedo. The slope values showed consistent variations in each VZA among all the wavelengths, which hinted at the independence of wavelengths in estimating the spectral albedo. Regarding fitting errors for all the VZAs, relatively higher RMSEs were varied for longer wavelengths (1243, 1640, and 2151 nm), which is understandable because of the varied characteristics of the spectral absorption in shortwave wavelengths [51], especially over submerged water fields. These assessments support incorporating more spectral bands in albedo estimations with fewer errors.
The conversion schemes in this study use the same number of bands and similar spectral ranges as the methods in previous studies. The performance of our method was better in SW albedo than in IR and VIS albedo, which suggests the better fitting ability of the longer wavelength used in this study and the insufficient consideration of water background in previous studies.
A previous study [50] reported similar spectral dependence results in the visible and near-infrared spectral bands (443–865 nm). Our study further reported the weak dependence of the longer SWIR bands (>1243 nm). A study also discussed the spectral dependence in estimating albedo [52] and found that the error was only 1% in the estimation of the TOA broadband albedo. In summary, the model derived in this study is dependable from directional reflectance to spectral albedo and has more spectra tolerances for other remote sensors.
Although all field measurements used in this study were extracted under clear-sky conditions, there were still a few diffuse components in the reflected radiance that could not be separated. Therefore, the directional reflectance used in this study was apparent bidirectional reflectance [53], and the estimated albedo should be called apparent albedo (clear-sky abedo), which includes the direct and diffuse components.

4.3. Applicability of the Proposed Method

In this study, we designed a method to estimate clear-sky albedo over paddy rice fields, which provides a clear technical path and direct conversion coefficients between spectral and broadband albedo. The advantages of this method are twofold: (1) The constructing procedures are duplicable and the AMBRALS model is stable, optimal, and free. In addition, the method can be extended to other kinds of land cover. (2) The albedo conversion coefficients are available throughout the growing season of paddy rice. Meanwhile, the disadvantages are: (1) a certain amount of measured data is required, and (2) the output coefficients need validation before being applied over similar land surfaces.
This study provides conversion coefficients based on specific wavelengths that cover spectral bands of the MODIS platform. If more conversion schemes are needed, through our assessments, the derivations of conversion coefficients for new satellite sensors or transplantations from one surface type to another are feasible and easy to complete.

5. Conclusions

Albedo is an essential parameter for estimating the greenhouse gas emissions of paddy rice. Through radiative transfer model simulations and field measurements, this study proposed a new narrowband to broadband method to estimate the paddy rice field albedo in the visible (400–700 nm), infrared (700–3000 nm), and full shortwave (285–3000 nm) spectral bands. The new method showed good consistency with field measurements throughout the growing season and was weakly affected by wavelengths. The method could be flexibly used in field environments and with remote sensing platforms.
This study method has the potential to couple with the land surface model and to extend the conversion schemes to other wetland types. The conversion schemes in the current study will be more representative if more data from various wetland types (such as marshes and swamps) are included. Therefore, deriving more universal albedo conversion schemes for all wetland types is a future research objective.
This study provided a simple method for albedo calculation over paddy rice fields and helped improve carbon emission estimations over similar kinds of partially submerged vegetation.

Author Contributions

Conceptualization, T.S. and H.F.; methodology, T.S.; writing—original draft preparation, T.S.; writing—review and editing, L.C., H.F. and R.S.; funding acquisition, T.S. All authors have read and agreed to the published version of the manuscript.

Funding

This research was funded by the National Natural Science Foundation of China (41901217) and the open funding of State Key Laboratory of Resource and Environmental Information System (LREIS), China Academy of Sciences.

Data Availability Statement

The data presented in this study are available on request from the corresponding author.

Conflicts of Interest

The authors declare no conflict of interest.

References

  1. Hall, A. The role of surface albedo feedback in climate. J. Clim. 2004, 17, 1550–1568. [Google Scholar] [CrossRef]
  2. Avis, C.A.; Weaver, A.J.; Meissner, K.J. Reduction in areal extent of high-latitude wetlands in response to permafrost thaw. Nat. Geosci. 2011, 4, 444–448. [Google Scholar] [CrossRef]
  3. Qu, Z.; Jacob, D.J.; Shen, L.; Lu, X.; Zhang, Y.; Scarpelli, T.R.; Nesser, H.; Sulprizio, M.P.; Maasakkers, J.D.; Bloom, A.A.; et al. Global distribution of methane emissions: A comparative inverse analysis of observations from the TROPOMI and GOSAT satellite instruments. Atmos. Chem. Phys. 2021, 21, 14159–14175. [Google Scholar] [CrossRef]
  4. Roberts, D.A.; Bradley, E.S.; Cheung, R.; Leifer, I.; Dennison, P.E.; Margolis, J.S. Mapping methane emissions from a marine geological seep source using imaging spectrometry. Remote Sens. Environ. 2010, 114, 592–606. [Google Scholar] [CrossRef]
  5. Zhou, G.; Niu, C.; Xu, W.; Yang, W.; Wang, J.; Zhao, H. Canopy modeling of aquatic vegetation: A radiative transfer approach. Remote Sens. Environ. 2015, 163, 186–205. [Google Scholar] [CrossRef]
  6. Hedley, J.; Russell, B.; Randolph, K.; Dierssen, H. A physics-based method for the remote sensing of seagrasses. Remote Sens. Environ. 2016, 174, 134–147. [Google Scholar] [CrossRef]
  7. Lee, Z.P.; Du, K.; Voss, K.J.; Zibordi, G.; Lubac, B. An inherent-optical-property-centered approach to correct the angular effects in water-leaving radiance. Appl. Opt. 2011, 50, 3155–3167. [Google Scholar] [CrossRef]
  8. Beget, M.E.; Bettachini, V.A.; di Bella, C.M.; Baret, F. SAILHFlood: A radiative transfer model for flooded vegetation. Ecol. Model. 2013, 257, 25–35. [Google Scholar] [CrossRef]
  9. Sun, T.; Fang, H.; Liu, W.; Ye, Y. Impact of water background on canopy reflectance anisotropy of a paddy rice field from multi-angle measurements. Agric. For. Meteorol. 2017, 233, 143–152. [Google Scholar] [CrossRef]
  10. He, T.; Liang, S.; Wang, D.; Wu, H.; Yu, Y.; Wang, J. Estimation of surface albedo and directional reflectance from Moderate Resolution Imaging Spectroradiometer (MODIS) observations. Remote Sens. Environ. 2012, 119, 286–300. [Google Scholar] [CrossRef]
  11. Li, X.; Strahler, A.H. Geometric-optical bidirectional reflectance modeling of the discrete crown vegetation canopy: Effect of crown shape and mutual shadowing. IEEE Trans. Geosci. Remote 1992, 30, 276–292. [Google Scholar] [CrossRef]
  12. Roujean, J.L.; Leroy, M.; Deschamps, P.Y. A bidirectional reflectance model of the Earth’s surface for the correction of remote sensing data. J. Geophys. Res. Atmos. 1992, 97, 20455–20468. [Google Scholar] [CrossRef]
  13. Schaaf, C.B.; Gao, F.; Strahler, A.H.; Lucht, W.; Li, X.; Tsang, T.; Strugnell, N.C.; Zhang, X.; Jin, Y.; Muller, J. First operational BRDF, albedo nadir reflectance products from MODIS. Remote Sens. Environ. 2002, 83, 135–148. [Google Scholar] [CrossRef]
  14. Hu, B.; Lucht, W.; Li, X.H.; Strahler, A. Validation of kernel-driven semiempirical models for the surface bidirectional reflectance distribution function of land surfaces. Remote Sens. Environ. 1997, 62, 201–214. [Google Scholar] [CrossRef]
  15. Privette, J.L.; Eck, T.F.; Deering, D.W. Estimating spectral albedo and nadir reflectance through inversion of simple BRDF models with AVHRR/MODIS-like data. J. Geophys. Res. Atmos. 1997, 102, 29529–29542. [Google Scholar] [CrossRef]
  16. Lucht, W.; Schaaf, C.B.; Strahler, A.H. An algorithm for the retrieval of albedo from space using semiempirical BRDF models. IEEE Trans. Geosci. Remote 2000, 38, 977–998. [Google Scholar] [CrossRef]
  17. Sütterlin, M.; Schaaf, C.B.; Stöckli, R.; Sun, Q.; Hüsler, F.; Neuhaus, C.; Wunderle, S. Albedo and reflectance anisotropy retrieval from AVHRR operated onboard NOAA and MetOp satellites: Algorithm performance and accuracy assessment for Europe. Remote Sens. Environ. 2015, 168, 163–176. [Google Scholar] [CrossRef]
  18. Liang, S. Narrowband to broadband conversions of land surface albedo I Algorithms. Remote Sens. Environ. 2001, 76, 213–238. [Google Scholar] [CrossRef]
  19. Knap, W.H.; Oerlemans, J. The surface albedo of the Greenland ice sheet: Satellite-derived and in situ measurements in the Sondre Stromfjord area during the 1991 melt season. J Glaciol. 1996, 42, 364–374. [Google Scholar] [CrossRef]
  20. Liang, S.; Shuey, C.J.; Russ, A.L.; Fang, H.; Chen, M.; Walthall, C.L.; Daughtry, C.S.; Hunt, R., Jr. Narrowband to broadband conversions of land surface albedo: II. Validation. Remote Sens. Environ. 2003, 84, 25–41. [Google Scholar] [CrossRef]
  21. Shunlin, L. A direct algorithm for estimating land surface broadband albedos from MODIS imagery. IEEE Trans. Geosci. Remote Sens. 2003, 41, 136–145. [Google Scholar] [CrossRef]
  22. Liang, S.; Yu, Y.; Defelice, T.P. VIIRS narrowband to broadband land surface albedo conversion: Formula and validation. Int. J. Remote Sens. 2005, 26, 1019–1025. Available online: http://www.tandfonline.com/doi/abs/10.1080/01431160512331340156 (accessed on 17 January 2020). [CrossRef]
  23. Govaerts, Y.M.; Pinty, B.; Taberner, M.; Lattanzio, A. Spectral Conversion of Surface Albedo Derived From Meteosat First Generation Observations. IEEE Geosci. Remote Sens. Lett. 2006, 3, 23–27. [Google Scholar] [CrossRef]
  24. Peltoniemi, J.I.; Manninen, T.; Suomalainen, J.; Hakala, T.; Puttonen, E.; Riihelä, A. Land Surface Albedos Computed from BRF Measurements with a Study of Conversion Formulae. Remote Sens. 2010, 2, 1918–1940. [Google Scholar] [CrossRef]
  25. Calleja, J.; Recondo, C.; Peón, J.; Fernández, S.; de la Cruz, F.; González-Piqueras, J. A New Method for the Estimation of Broadband Apparent Albedo Using Hyperspectral Airborne Hemispherical Directional Reflectance Factor Values. Remote Sens. 2016, 8, 183. [Google Scholar] [CrossRef]
  26. Bonafoni, S.; Sekertekin, A. Albedo retrieval from Sentinel-2 by new narrow-to-broadband conversion coefficients. IEEE Geosci. Remote Sens. Lett. 2020, 17, 1618–1622. [Google Scholar] [CrossRef]
  27. Greuell, W.; Reijmer, C.H.; Oerlemans, J. Narrowband-to-broadband albedo conversion for glacier ice and snow based on aircraft and near-surface measurements. Remote Sens. Environ. 2002, 82, 48–63. [Google Scholar] [CrossRef]
  28. Greuell, W.; Oerlemans, J. Narrowband-to-broadband albedo conversion for glacier ice and snow: Equations based on modeling and ranges of validity of the equations. Remote Sens. Environ. 2004, 89, 95–105. [Google Scholar] [CrossRef]
  29. Liang, S.; Stroeve, J.; Box, J.E. Mapping daily snow/ice shortwave broadband albedo from Moderate Resolution Imaging Spectroradiometer (MODIS): The improved direct retrieval algorithm and validation with Greenland in situ measurement. J. Geophys. Res. Atmos. 2005, 110. [Google Scholar] [CrossRef]
  30. van Dalum, C.T.; van de Berg, W.J.; Libois, Q.; Picard, G.; van den Broeke, M.R. A module to convert spectral to narrowband snow albedo for use in climate models: SNOWBAL v1.2. Geosci. Model. Dev. 2019, 12, 5157–5175. [Google Scholar] [CrossRef]
  31. Wang, W.; He, C.; Moore, J.; Wang, G.; Niu, G.Y. Physics-Based Narrowband Optical Parameters for Snow Albedo Simulation in Climate Models. J. Adv. Model. Earth Syst. 2022, 14, e2020MS002431. [Google Scholar] [CrossRef]
  32. Zhao, W.; Tamura, M.; Takahashi, H. Atmospheric and spectral corrections for estimating surface albedo from satellite data using 6S code. Remote Sens. Environ. 2001, 76, 202–212. [Google Scholar] [CrossRef]
  33. Sumner, D.M.; Wu, Q.; Pathak, C.S. Variability of Albedo and Utility of the MODIS Albedo Product in Forested Wetlands. Wetlands 2011, 31, 229–237. [Google Scholar] [CrossRef]
  34. Mira, M.; Weiss, M.; Baret, F.; Courault, D.; Hagolle, O.; Gallego-Elvira, B.; Olioso, A. The MODIS (collection V006) BRDF/albedo product MCD43D: Temporal course evaluated over agricultural landscape. Remote Sens. Environ. 2015, 170, 216–228. [Google Scholar] [CrossRef]
  35. Du, J.; Song, K. Validation of global evapotranspiration product (MOD16) using flux tower data from Panjin coastal wetland, Northeast China. Chin. Geogr. Sci. 2018, 28, 420–429. [Google Scholar] [CrossRef]
  36. Jarlan, L.; Mangiarotti, S.; Mougin, E.; Mazzega, P.; Hiernaux, P.; Ledantec, V. Assimilation of SPOT/VEGETATION NDVI data into a sahelian vegetation dynamics model. Remote Sens. Environ. 2008, 112, 1381–1394. [Google Scholar] [CrossRef]
  37. Talib, A.; Desai, A.R.; Huang, J.; Griffis, T.J.; Reed, D.E.; Chen, J. Evaluation of prediction and forecasting models for evapotranspiration of agricultural lands in the Midwest U.S. J. Hydrol. 2021, 600, 126579. [Google Scholar] [CrossRef]
  38. Bonan, G.B. The Land Surface Climatology of the NCAR Land Surface Model Coupled to the NCAR Community Climate Model. J. Clim. 1998, 15, 3123–3149. [Google Scholar] [CrossRef]
  39. Whitfield, B.; Jacobs, J.M.; Judge, J. Intercomparison study of the land surface process model and the common land model for a prairie wetland in Florida. J. Hydrometeorol. 2006, 7, 1247–1258. [Google Scholar] [CrossRef]
  40. Clark, D.B.; Mercado, L.M.; Sitch, S.; Jones, C.D.; Gedney, N.; Best, M.J.; Pryor, M.; Rooney, G.G.; Essery, R.L.H.; Blyth, E.; et al. The Joint UK Land Environment Simulator (JULES), model description—Part 2: Carbon fluxes and vegetation dynamics. Geosci. Model. Dev. 2011, 4, 701–722. [Google Scholar] [CrossRef]
  41. Dumedah, G.; Walker, J.P. Intercomparison of the JULES and CABLE land surface models through assimilation of remotely sensed soil moisture in southeast Australia. Adv. Water Resour. 2014, 74, 231–244. [Google Scholar] [CrossRef]
  42. Wanner, W.; Li, X.; Strahler, A.H. On the derivation of kernels for kernel-driven models of bidirectional reflectance. J. Geophys. Res. Atmos. 1995, 100, 21077–21089. [Google Scholar] [CrossRef]
  43. Jiao, Z.; Ding, A.; Kokhanovsky, A.; Schaaf, C.; Bréon, F.; Dong, Y.; Wang, Z.; Liu, Y.; Zhang, X.; Yin, S. Development of a snow kernel to better model the anisotropic reflectance of pure snow in a kernel-driven BRDF model framework. Remote Sens. Environ. 2019, 221, 198–209. [Google Scholar] [CrossRef]
  44. Fang, H.; Li, W.; Wei, S.; Jiang, C. Seasonal variation of leaf area index (LAI) over paddy rice fields in NE China: Intercomparison of destructive sampling, LAI-2200, digital hemispherical photography (DHP), and AccuPAR methods. Agric. For. Meteorol. 2014, 198–199, 126–141. [Google Scholar] [CrossRef]
  45. Fang, H.; Zhang, Y.; Wei, S.; Li, W.; Ye, Y.; Sun, T.; Liu, W. Validation of global moderate resolution leaf area index (LAI) products over croplands in northeastern China. Remote Sens. Environ. 2019, 233, 111377. [Google Scholar] [CrossRef]
  46. Lucht, W. Expected retrieval accuracies of bidirectional reflectance and albedo from EOS-MODIS and MISR angular sampling. J. Geophys. Res. Atmos. 1998, 103, 8763–8778. [Google Scholar] [CrossRef]
  47. He, T.; Liang, S.; Wang, D.; Cao, Y.; Gao, F.; Yu, Y.; Feng, M. Evaluating land surface albedo estimation from Landsat MSS, TM, ETM +, and OLI data based on the unified direct estimation approach. Remote Sens. Environ. 2018, 204, 181–196. [Google Scholar] [CrossRef]
  48. Lewis, P.; Barnsley, M.J. Influence of the sky radiance distribution on various formulations of the earth surface albedo. In Proceedings of the 6th International Symposium on Physical Measurements and Signatures in Remote Sensing, ISPRS 1994, Val d’Isere, France, 17–21 January 1994; pp. 707–715. [Google Scholar]
  49. Lucht, W.; Hyman, A.H.; Strahler, A.H.; Barnsley, M.J.; Hobson, P.; Muller, J. A Comparison of Satellite-Derived Spectral Albedos to Ground-Based Broadband Albedo Measurements Modeled to Satellite Spatial Scale for a Semidesert Landscape. Remote Sens. Environ. 2000, 74, 85–98. [Google Scholar] [CrossRef]
  50. Cui, Y.; Mitomi, Y.; Takamura, T. An empirical anisotropy correction model for estimating land surface albedo for radiation budget studies. Remote Sens. Environ. 2009, 113, 24–39. [Google Scholar] [CrossRef]
  51. Yue, J.; Tian, J.; Tian, Q.; Xu, K.; Xu, N. Development of soil moisture indices from differences in water absorption between shortwave-infrared bands. ISPRS J. Photogramm. Remote Sens. 2019, 154, 216–230. [Google Scholar] [CrossRef]
  52. Briegleb, B.P.; Minnis, P.; Ramanathan, V.; Harrison, E. Comparison of regional clear-sky albedos inferred from satellite observations and model computations. J. Clim. Appl. Meteorol. 1986, 25, 214–226. [Google Scholar] [CrossRef]
  53. Jacob, F.; Olioso, A. Derivation of diurnal courses of albedo and reflected solar irradiance from airborne POLDER data acquired near solar noon. J. Geophys. Res. Atmos. 2005, 110. [Google Scholar] [CrossRef]
Figure 1. Instruments of directional reflectance measurement (a) and surface albedo observation (b); growing stages of paddy rice (c).
Remotesensing 14 05185 g001
Figure 2. The fraction of vegetation cover (FVC) and plant height of the flooded vegetation growing season.
Remotesensing 14 05185 g002
Figure 3. Variations in sample diurnal albedo (1–10 October) and seasonal daily albedo.
Remotesensing 14 05185 g003
Figure 4. The flowchart of this study.
Remotesensing 14 05185 g004
Figure 5. Relationships between directional reflectance and spectral albedo with different view zenith angles.
Remotesensing 14 05185 g005
Figure 6. Comparison of the broadband albedo of visible (a), infrared (b), and shortwave (c) bands. Shadows indicate growing phases.
Remotesensing 14 05185 g006
Figure 7. Comparisons of the estimated and field-measured broadband albedo.
Remotesensing 14 05185 g007
Figure 8. The SZA dependence for albedo conversion.
Remotesensing 14 05185 g008
Table 1. Statistics of the relationships between reflectance and spectral albedo.
Data InfoCoefficientStatistics
VZAk1k2R2RMSE
60°1.063 −0.003 0.961 0.036
45°0.972 −0.006 0.965 0.031
30°0.879 −0.004 0.964 0.029
15°0.758 −0.001 0.945 0.031
0.711 0.003 0.923 0.035
−15°0.795 0.004 0.928 0.038
−30°0.908 0.006 0.944 0.038
−45°1.025 0.009 0.944 0.043
−60°1.128 0.011 0.947 0.045
Mean values--0.9470.037
Table 2. Broadband albedo conversion coefficients and standard error (SE) (* p < 0.05).
Spectral AlbedoShortwaveInfrared *Visible *
-CoeffSECoeffSECoeffSE
α 470 −1.5240.023--−1.3570.402
α 550 0.1970.693--1.17180.137
α 660 0.1280.282--−0.05280.019
α 850 1.12630.0480.5560.257--
α 1243 0.07130.2660.4070.079--
α 1640 0.08940.0640.2050.138--
α 2151 −0.0230.091−0.0550.121--
Intercept0.0630.0690.0750.0280.05250.012
Table 3. The R2 values of SZA dependence.
VZA and SZAR2
-20°–30°30°–40°40°–50°50°–65°
60°0.9870.9940.9930.984
45°0.9850.9940.9960.986
30°0.9800.9910.9950.993
15°0.9630.9820.9870.992
0.9510.9850.9780.990
−15°0.9670.9820.9820.987
−30°0.9790.9870.9890.989
−45°0.9880.9880.9840.987
−60°0.9940.9930.9810.985
Table 4. Broadband albedo conversion coefficients and standard error (SE).
470 nm550 nm660 nm850 nm1243 nm1640 nm2151 nm
60°1.117 0.981 1.064 0.938 0.913 0.912 0.971
45°1.195 1.125 1.102 1.025 1.020 1.049 1.056
30°1.050 1.177 1.073 1.117 1.135 1.224 1.162
15°1.096 1.303 1.090 1.288 1.295 1.422 1.172
1.099 1.235 1.081 1.335 1.358 1.450 1.159
−15°0.989 1.089 1.005 1.198 1.208 1.285 1.076
−30°0.853 0.931 0.877 1.051 1.065 1.073 0.994
−45°0.814 0.792 0.722 0.933 0.938 0.923 0.892
−60°0.720 0.709 0.654 0.853 0.849 0.816 0.799
Publisher’s Note: MDPI stays neutral with regard to jurisdictional claims in published maps and institutional affiliations.

