Article

Monitoring Megathrust-Earthquake-Cycle-Induced Relative Sea-Level Changes near Phuket, South Thailand, Using (Space) Geodetic Techniques

1
Department of Space Engineering, Faculty of Aerospace Engineering, Delft University of Technology (TUDelft), 2622 HS Delft, The Netherlands
2
Coastal Oceanography and Climate Change Research Center, Marine and Coastal Resources Institution (MACORIN), Prince of Songkla University, Songkla 90110, Thailand
3
Royal Thai Naval Academy (RTNA), Samut Prakan 10270, Thailand
4
Faculty of Science and Health Technology, Navamindradhiraj University, Bangkok 10300, Thailand
5
Marine Ecologist Consultant for the Department of Marine and Coastal Resources (DMCR), Bangkok 10210, Thailand
6
Centre of Studies for Surveying and Geomatics, Universiti Teknologi MARA Cawangan Perlis, Arau 02600, Malaysia
*
Authors to whom correspondence should be addressed.
Remote Sens. 2022, 14(20), 5145; https://doi.org/10.3390/rs14205145
Submission received: 18 August 2022 / Revised: 26 September 2022 / Accepted: 7 October 2022 / Published: 14 October 2022

Abstract

:
Temporal changes in vertical land motion (VLM) in and around Phuket Island in southern Thailand following the great 2004 Sumatra–Andaman megathrust earthquake have impacted the relative sea-level change estimates based on tide-gauge (TG) records. To better monitor the VLM, two new continuous global navigation satellite system (GNSS) stations have been installed in the past 5 years, situated on bedrock both near and at the Koh Taphao Noi Island TG in Phuket, which together with older global positioning system (GPS) data provides a clear insight in the VLM of Phuket Island from 1994 onward. In addition, satellite altimetry (SALT) data has been analyzed since 1992. The VLM (GPS) position and relative (TG) and absolute (SALT) sea-level change time series were successfully combined in pairs to validate each independent result (e.g., SALT − GNSS = TG): prior to the 2004 earthquake, the relative sea-level rise in Phuket was 1.0 ± 0.7 mm/yr, lower by 2.4 ± 0.2 mm/yr than the absolute sea-level rise caused by VLM. After the earthquake, nonlinear post-seismic subsidence has caused the VLM to drop by 10 cm in the past 17 years, resulting, by the end of 2020, in a relative sea-level rise by up to 16 cm. During the same period, other TG stations in south Thailand recorded similar sea-level increases. Combination with SALT further suggests that, prior to 2005, uplift (5.3 ± 1.4 mm/yr) of the coastal region of Ranong (north of Phuket) resulted in a relative sea-level fall, but since then, post-seismic-induced negative VLM may have significantly increased coastal erosion along the entire Andaman Sea coastline.

1. Introduction

Monitoring relative sea-level rise has gained importance in light of global climate change [1]. In addition, tectonic uplift and land subsidence can play temporal roles [2]. Besides traditional tide gauges (TG), vertical land motion (VLM) and absolute sea-level rise from satellite altimetry (SALT) also contribute to relative sea-level monitoring, and these geodetic techniques complement each other [3,4,5]. The VLM in Phuket has been monitored with a global positioning system (GPS) since 1994 and has been affected by the inter- and post-seismic tectonic phases of (megathrust) seismic cycles associated with the subduction of the Australian and Indian plates below Sundaland, on which Thailand is located (Figure 1). As a result, absolute sea-level rise estimates from SALT may not match the (relative) sea-level changes recorded at TG stations since they are subjected to (local) VLM caused by human-induced land subsidence and/or (temporal) tectonic vertical deformation in plate boundary zones. In Thailand, few TG stations have already been equipped with global navigation satellite systems (GNSS), although a nearby coastal GNSS station was installed in July 2017 at the Phuket Marine Biological Center (PMBC) (Figure 1). Subsequently, in August 2019, an additional GNSS station was installed at the KTN tide gauge, operated by the Hydrographic Department of the Royal Thai Navy (HDRTN), near Koh Taphao Noi Island. This allows us to directly monitor the vertical motion of the tide gauge and compare it with both the horizontal and vertical motions of station PMBC and the (regularly resurveyed) PHUK GPS campaign point that was installed in 1994 at Promthep Cape. While we continue studying the impact of the vertical tectonic subsidence of Phuket and surrounding regions succeeding the 2004 Mw 9.2 Sumatra–Andaman earthquake on the relative sea-level changes in this area, we now also have a direct means to validate the TG measurements from Phuket and compare them with absolute sea-level change measurements from SALT. After this proof of concept, we investigate the sea-level change measurements from multiple tide-gauge stations in south Thailand operated by the Thai Marine Department (TMD) to see if we can also observe the same (nonlinear) temporal sea-level rise patterns observed for Phuket, and deduce the VLM from the difference between the absolute and relative sea-level changes that are obtained from respectively SALT and TG. In this article, the motivation behind installing a new GNSS station co-located at the Phuket TG station is first discussed in Section 2, followed by the latest GPS data analysis results and their interpretation in Section 3. We then compare the TG, VLM, and SALT results for the TG at Phuket Island, and look at the TG and SALT results for other locations in south Thailand and discuss the results in Section 4. Finally, in Section 5, we summarize the main results and conclusions.

2. Co-Location of GNSS and Tide Gauge Station and Tectonic Setting Phuket Island

The new KTPH GNSS station was installed at the KTN tide gauge operated by HDRTN near Koh Taphao Noi Island in Phuket (Figure 1 and Figure S1). At that location, a tide gauge has been operational since 1940. The tide gauge measures the sea-level change relative to its own vertical position. That vertical position is supposed to be stable, and the tide gauge is rigidly anchored to the seabed. However, its vertical position (changes) should still be monitored to prevent vertical jumps in the tide-gauge time series (e.g., due to a change of equipment or a re-installation of the tide-gauge benchmark) and vertical motions caused by land subsidence (human induced or as a result of plate tectonic deformation processes). While human-induced land subsidence (because of water extraction) may not play a significant role in this region as Phuket Island is mainly composed of bedrock and relatively thin sediment layers, the region is located (Figure 1) near an active tectonic plate boundary deformation zone that accommodates convergence between the Indian and Australian plates and the Sundaland Block (e.g., Hamilton [9], Wilson et al. [10] and Simons et al. [11]).
Although the impact of seismic activity along the plate boundary of Sundaland and the Australian and Indian plates is mostly restricted to Sumatra Island, the Sumatra subduction zone can generate megathrust earthquakes (Mw 9.0+), as demonstrated by the 2004 Mw 9.2 Sumatra–Andaman earthquake [12]. As a result, Phuket Island (at ~650 km from the 2004 Mw 9.2 epicenter) was instantly moved by ~25 cm horizontally toward the rupture that extended along the trench from northern Sumatra to the Andaman Islands. The (horizontal and vertical) successive deformation stages of plate boundary zones are defined as inter-, co- and post-seismic. Together these sequences make up a megathrust earthquake (seismic) cycle that can have a total duration of up to several hundreds of years [13]. Surface motions, ranging from millimeters to meters, can be accurately measured with geodetic techniques that make use of GNSS, such as GPS. This, as a result, includes vertical surface motions associated with the seismic cycle. These are also of importance for the geophysical modeling of the post-seismic earthquake process in Thailand [14]. Depending on the geographic location of land masses (and tide gauges on them) in the plate boundary deformation zone, both up- and downward plate deformations (millimeters to meters) can occur during a seismic cycle, while also the direction and magnitude of the vertical motion can vary over time.
Although the PMBC station at Cape Panwa (Figure 1) was installed on stable bedrock back in 2017 [2], the station is located ~4 km away from the KTN tide gauge (KTPH in Figure 1 and Figure S1), which itself is located on a concrete platform attached with steel pillars to the seabed in front of Koh Taphao Noi Island. Direct GNSS measurements of the TG benchmark are preferred for validation if the platform is subjected to the same (vertical) motions as the PMBC GNSS station. Although the main purpose of a tide-gauge co-located GNSS station is to register any vertical height changes of the KTN tide-gauge benchmark, it can also be used to co-monitor and validate (with PMBC and PHUK) the still ongoing post-seismic deformations from the 2004 Mw 9.2 Sumatra–Andaman earthquake in Phuket Island. The KTPH GNSS station (Figure S1) was installed in early August of 2019, whereby the GNSS antenna was directly aligned with the KTN tide-gauge benchmark below it. More (technical) details on the KTPH GNSS station are given in the Supplementary Materials.
Following the installation of KTPH, the PHUK GPS point (Figure 1) installed in 1994 at Promthep Cape was also resurveyed for 5 days. This was done using exactly the same GPS equipment and GPS antenna setup as during the past surveys. The purpose of this exercise was twofold. First, it provides an additional check for the baseline (distance tie) between PHUK and PMBC (already demonstrated to be stable reference points [2]). This baseline is used to combine the observations of these two points in a (1994–2021) position time series in Section 3.1. Second, it also allows monitoring of the three baselines in between PHUK, PMBC and KTPH. These distances (also in the vertical direction) should not change if all three points are located or connected to stable bedrock. At these relative short baselines (4 to 15 km), post-seismic motions should be very similar. Only between PHUK and PMBC/KTPH a small horizontal difference in SW direction might develop over time (multiple years to decades) since PHUK is located (12–15 km) closer to the epicenter of the Mw 9.2 Sumatra–Andaman earthquake of 2004. The post-seismic motions, therefore, will be slightly higher at Promthep Cape then they are at Cape Panwa, similar (but then on a micro-scale) to the post-seismic motion differences observed within Thailand by Satirapod et al. [15].

3. Phuket GPS Data Analysis

With the latest GPS data (2017–2021) from Phuket, we first investigated if the 3D surface motions are still affected by the post-seismic phase of the 2004 Mw 9.2 Sumatra–Andaman megathrust earthquake, after we updated the long-term motion of Phuket Island. We also looked at the (vertical) stability of the KTN tide gauge, which has been co-located with GNSS station KTPH. Although the time period spanned by the KTPH data (2 years) is still too short to derive solid scientific conclusions, a first analysis was conducted to provide first insight and also to assess the data quality provided by the new station. Two previous GPS campaign-style observation rounds of the KTN tide-gauge benchmark (April and July 2018, as illustrated in Section 3.3) were also included. Since both PHUK and KTPH record measurements from GPS satellites, only GPS data from all GNSS stations have been processed.
Dual-frequency GPS data (2017.56 to 2021.63) from Phuket (KTPH/PMBC/PHUK) was processed along with additional data from TU Delft and International GNSS Service (IGS) stations in SE Asia: MKNB (Kinabalu, Malaysia), CUSV (IGS) and SPKN (both in Bangkok, Thailand) and NTUS (IGS, Singapore) (Figure 1). The inclusion of the GPS data from these stations is not compulsory, but it allows for an inter-comparison of the daily GPS position results. Additionally, the stations can improve the GPS position solutions for the stations in Phuket because of enhanced (regional) phase-ambiguity fixing.
The GPS data (30 s sampling rate) has been processed using the (zero-differencing) scientific GIPSY-OASIS II software version 6.4 [16] in the global reference frame solution of IGS named IGS14 [17] that is based on the International Terrestrial Reference Frame 2014 (ITRF2014) [18]. This version of the JPL software package was adapted to also process GPS data from the new block III GPS satellites that have become operational since 2019 (GPS 74–78). For this paper, the (post-processing) precise point positioning (PPP) method with (network) ambiguity fixing [19] was used to derive precise daily coordinate results from the GPS data. Precise ephemeris of satellites along with Earth rotation parameters (non-fiducial style, IGS14) were acquired from the Jet Propulsion Laboratory (JPL) and enabled consistent derivation of highly accurate daily absolute GPS positions over the entire analyzed period. Station 3D velocity estimates were obtained using a linear regression method. The GPS data analysis includes evaluating the quality of the KTPH daily position solutions and current tectonic motions of Phuket Island, extending the (1994–2018) GPS position time series from Simons et al. [2] and monitoring the baseline changes between KTPH and PMBC.

3.1. GPS Daily Position Solutions and Velocity Estimates

Non-fiducial (no pre-constrained reference positions) daily position solutions were computed with GIPSY in an identical way as described in Simons et al. [2]. Next, daily transformation parameters are applied to the daily positions, which align the solutions with the IGS14. JPL also provides these transformation parameters and they are referred to as X-files. With this global reference frame transformation technique the same level of accuracy can be achieved as with the traditional mapping technique, whereby GPS data of an IGS steering sub-network needs to be included in the data analysis (e.g., Mustafar et al. [8]). In a final step, weekly averaged station positions were computed. This averaging was performed to screen for any outliers and thereby improve the reliability of the coordinate solutions. The daily repeatabilities (weighted root mean square (WRMS)) of the weekly averaged station coordinates (all in mm) are 0.8/0.9/3.0 (KTPH), 0.8/0.9/3.1 (PMBC) and 1.2/2.3/4.7 (PHUK/campaign mode) in, respectively, the north, east and vertical position components. These are state-of-the-art daily positioning results, considering that the overall coordinate repeatabilities for the additional TU Delft (SPKN/MKNB) and IGS stations (CUSV/NTUS) are very similar in these three directions. Therefore, the GPS data collected by the new KTPH station are suited to monitor tide-gauge station (vertical) motion changes at the mm level. Since all daily station positions were directly mapped in IGS14 with the X-file technique, these RMS values also give a direct indication of the absolute accuracy of the daily station coordinates in this global reference frame.
The weekly averaged coordinate solutions in the IGS14 were then used to estimate the velocities of all stations by applying a 3D linear regression method to the position time series. The total time period spanned by the GPS observations for the new KTPH station (3.3 years including the two campaign-style observations in 2018), however, is still too short to estimate (especially in the vertical direction) reliable absolute velocities of the station. We therefore mainly look at the performance of the PMBC station since it was installed mid-2017, as its observations already spanned 4.1 years. Hence, the station velocities for all six continuous stations in the dataset were estimated for the same observation period (August 2017–August 2021). The linear velocity estimates for all six stations are given in Table 1 and plotted for Phuket stations PMBC and KTPH in Figure 2 (and included for the other four stations in Figure S2 of the Supplementary Materials). For the velocity uncertainties, we use the method (2*WRMS/T) of Simons et al. [11], which makes use of the WRMS of the position misfits and the time period T of the observations to estimate the maximum possible tilt of the trend line with a confidence level of 99.999%. The velocity uncertainties for the new tide-gauge station KTPH (Table 1) are similar to the other five stations although the available (campaign + continuous) GPS data period only spans 3.3 years (of which 2 years are continuous) in comparison to the 4.1 years for the other five stations, which indicates the KTPH weekly averaged position solutions have a low (variation) noise level.
The total RMS of the weekly averaged position misfit with respect to the linear trends typically varies between 1 and 2 mm for the horizontal and 4–5 mm for the vertical positions and similar to the WRMS of the daily positions (in the weekly averaging), which confirms the global accuracy of the daily coordinates. However, they are slightly higher as the linear regression does not take into account any seasonal variations that typically are still present in the GPS position time series [20]. For the vertical motion of Phuket Island, these have been additionally modeled in Figure 3.
In Figure 2, the current horizontal velocities for PMBC already appear reliable, being based on an observation time span of 4.1 years and representing the current tectonic motions of Phuket. The vertical and horizontal motion estimate of KTPH is not as yet accurate, but agrees with that of PMBC within, respectively, one and four standard (error) deviations. This is acceptable as the horizontal motion trend is still changing because of the ongoing post-seismic deformations. However, the horizontal motion of Phuket Island (PMBC and KTPH) is still significantly lower (13 ± 1 mm/yr) in the longitudinal direction than at Bangkok and Singapore (Table 1 and Figure S2), which are also located on the Sundaland plate. Prior to the 2004 Mw 9.2 Sumatra–Andaman earthquake the horizontal velocities of GPS stations in Thailand, peninsular Malaysia and Singapore were around 30 mm/yr ESE [8], all moving at similar velocities as they are part of the same (tectonic) plate. The region of south Thailand on and after 26/12/2004 was especially significantly displaced toward the SW by co- and post-seismic displacements. Although the origin of these post-seismic motions lay 600–700 km away from Phuket, the change in deformation pattern (compression to extension) may have triggered local seismic events on the Khlong Marui Fault Zone back in 2012 [21]. The latest results indicate that post-seismic motions are still ongoing, with stations PMBC and KTPH being more affected as they are located closer to the 2004 Mw 9.2 epicenter. Although the current horizontal motions all look linear, in fact they (all) are still nonlinear, which is more visible over a longer time period (see Figure 3 for the 1994–2021 position time series for Phuket), and eventually should return to their (pre-26/12/2004) inter-seismic rates. Although the vertical post-seismic motions occur on a different time scale and have smaller magnitudes, 3D post-seismic motions are still affecting the south of Thailand. The vertical velocity estimates in Figure 2 suggest slight tectonic subsidence is still ongoing in Phuket.

3.2. Long-Term Tectonic Motion Changes of Phuket Island

The latest GPS results on Phuket are useful to extend the study of the long-term motion (1994–2021) of the island [2]. The PMBC station measurements now cross a time span of 4 years and assist the long-term (multiple decades) study of the (vertical) tectonic motion of Phuket that includes inter-, co- and post-seismic deformation phases over the past 27 years. This has been demonstrated in Simons et al. [2], where the long-term motion of Phuket was reconstructed from a combined (1994–2018) GPS position time series of the stations PHUK, PHKT, PTAC and PMBC.
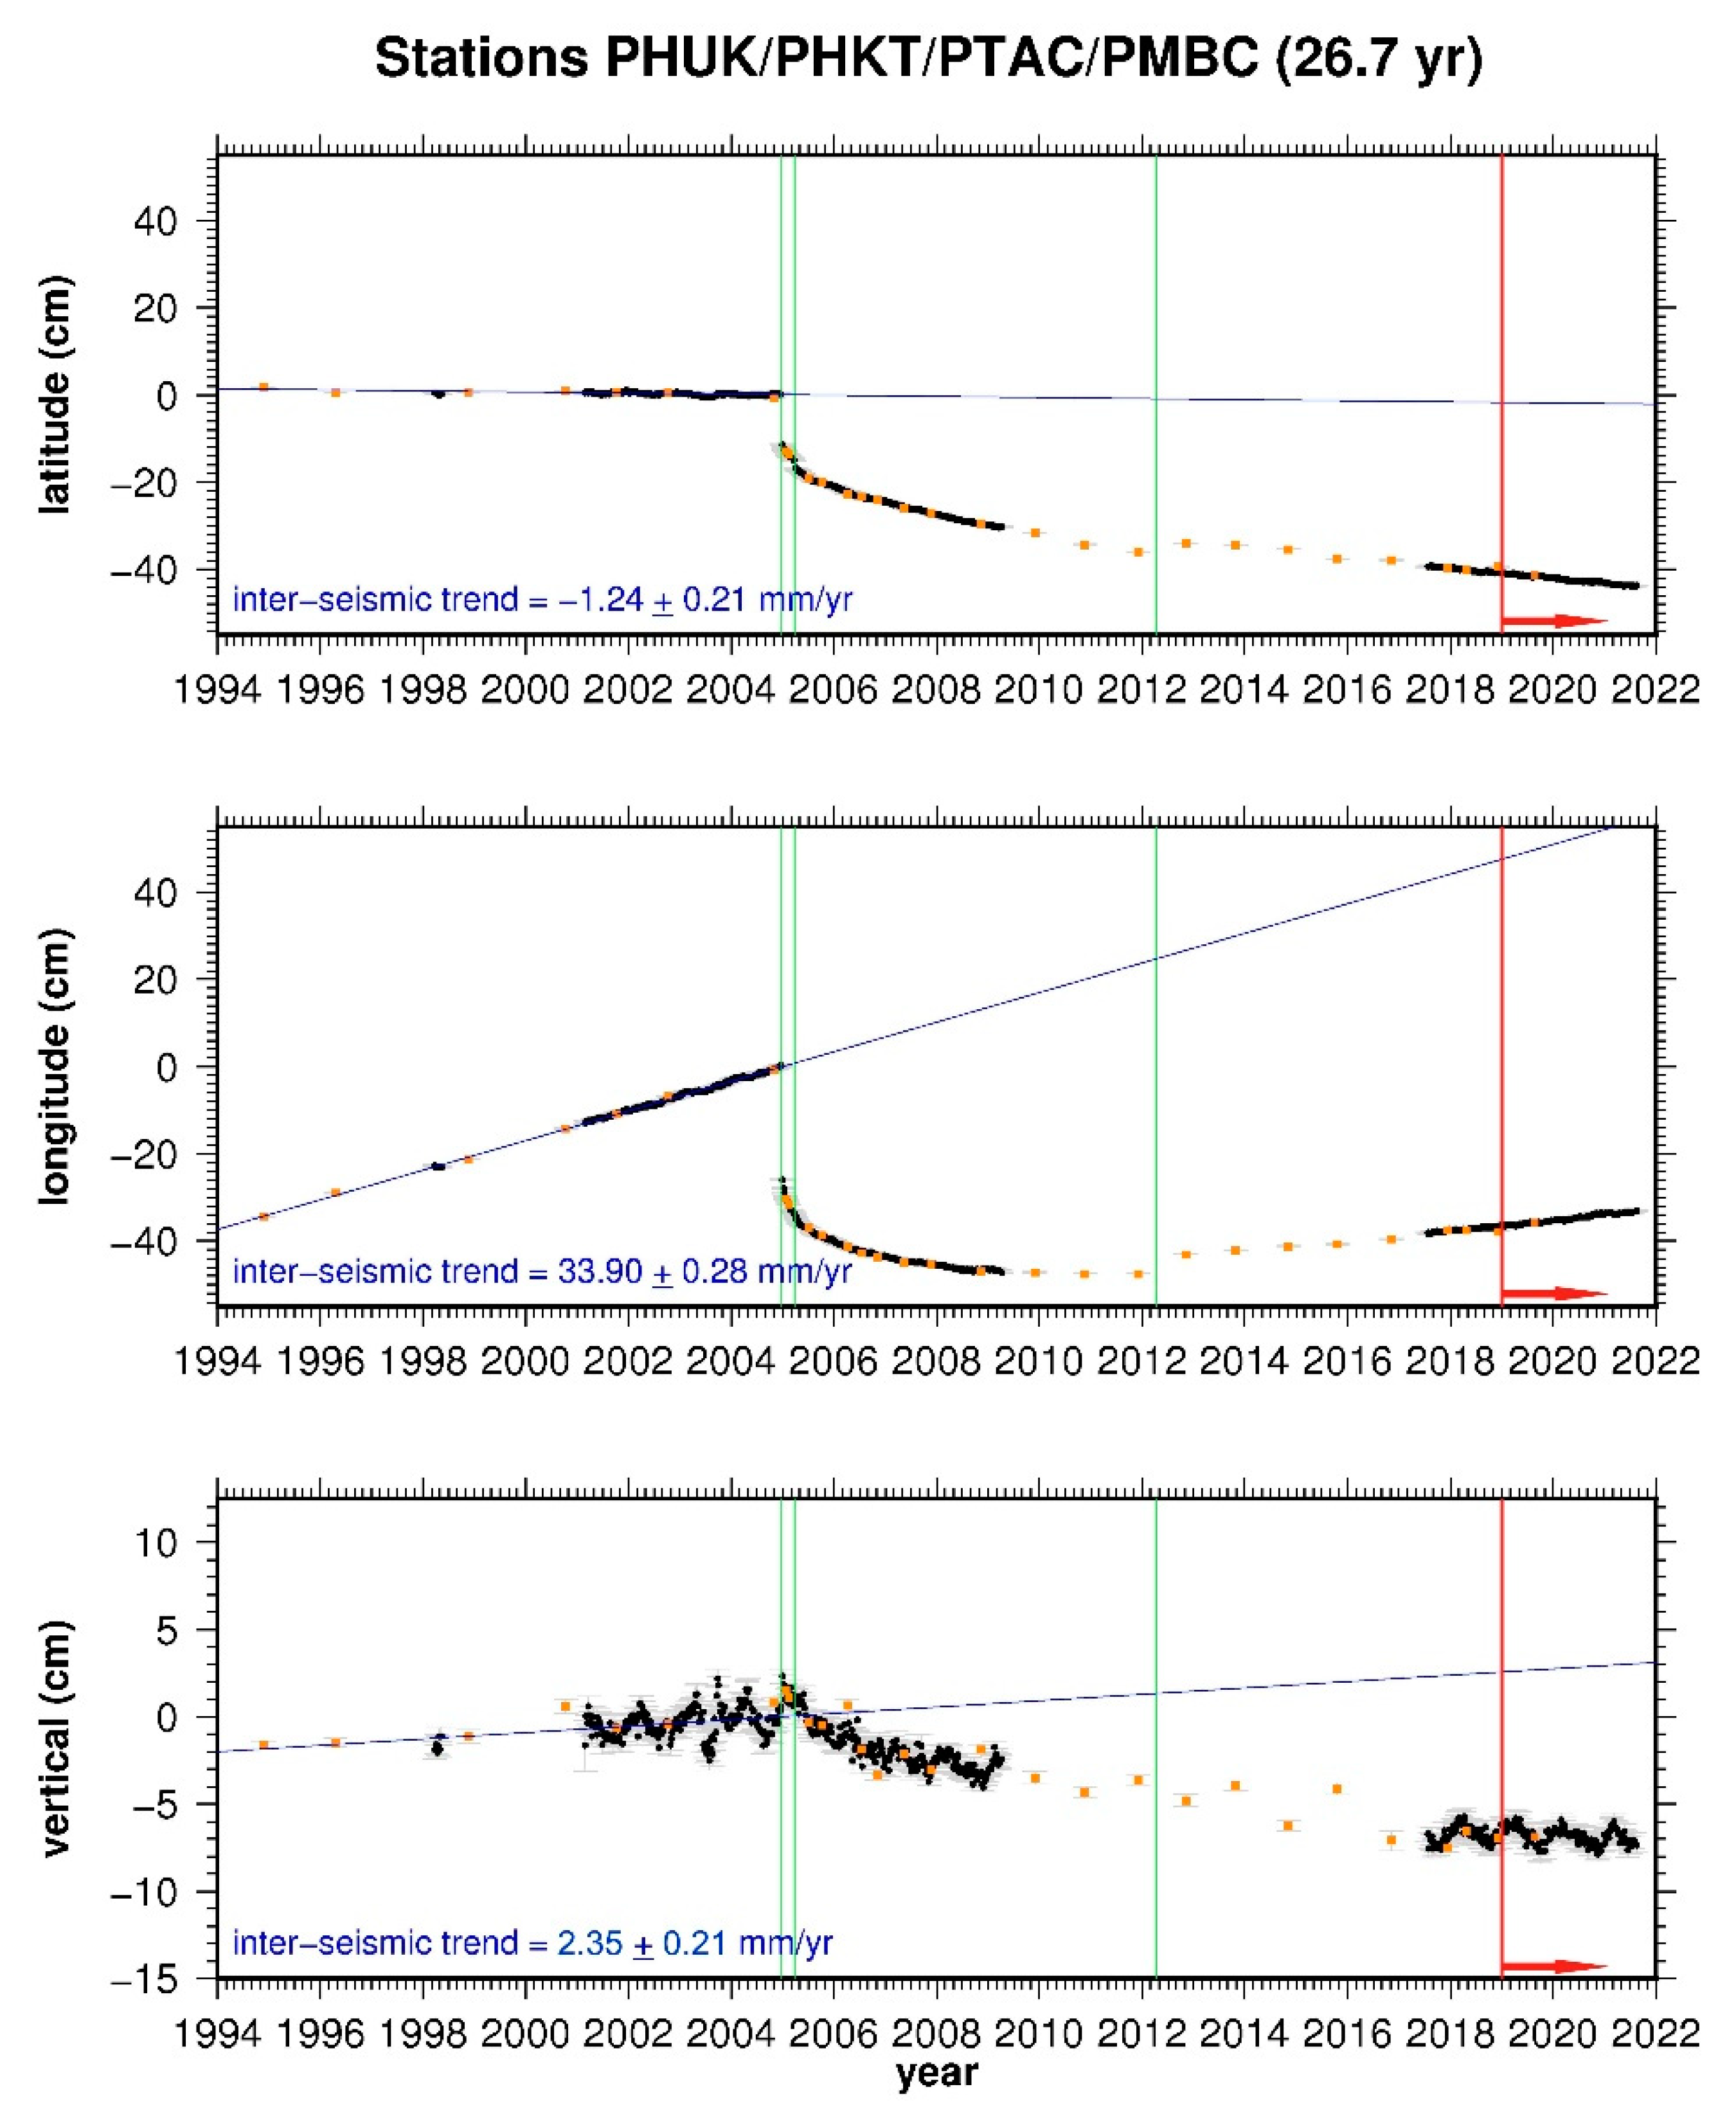
Figure 3 constitutes the extended combined 3D position time series (from Simons et al. [2]), in which the PHUK GPS (campaign) point positions (orange dots between 1994 and 2020) are overlaid. This figure very well-illustrates the transition from inter-seismic to post-seismic motion after a quasi-instantaneous co-seismic horizontal position shift of ~25 cm to the ESE during the Mw 9.2 earthquake. Subsequent (smaller) horizontal co-seismic position jumps from the March 2005 Mw 8.6 Nias and April 2012 Mw 8.6/8.2 Indian Ocean earthquakes are also visible. In the vertical direction, no vertical co-seismic position jumps were detected at any of these earthquake epochs, but clearly the vertical motion trend of Phuket Island drops after the Mw 9.2 event. While the inter-seismic motion is quasi-linear with seasonal variations in the vertical direction, the post-seismic deformations (from the Mw 9.2 event) are nonlinear and subject to (still ongoing) exponential decay.
Figure 3 confirms that the current (2017–2021) horizontal motions for PMBC (Table 1 and Figure 2) are still post-seismic displacement rates that are 10.1 ± 0.3 mm/yr higher to the south and 21.3 ± 0.4 mm/yr slower to the east than the (1994–2004) inter-seismic rates observed at Phuket. For the vertical direction, the tectonic post-seismic subsidence appears to be further diminishing as no significant (non-seasonal) height changes have been observed during the past 4 years. The re-survey of GPS point PHUK in 2019 (last orange dots in Figure 3) also confirms that the PHUK–PMBC baseline has not changed as relative position differences are within 1 mm and 3 mm for, respectively, the horizontal and vertical components of the baseline, which is within the attainable accuracy of the differenced coordinate solutions.

3.3. Phuket Tide-Gauge Platform Stability

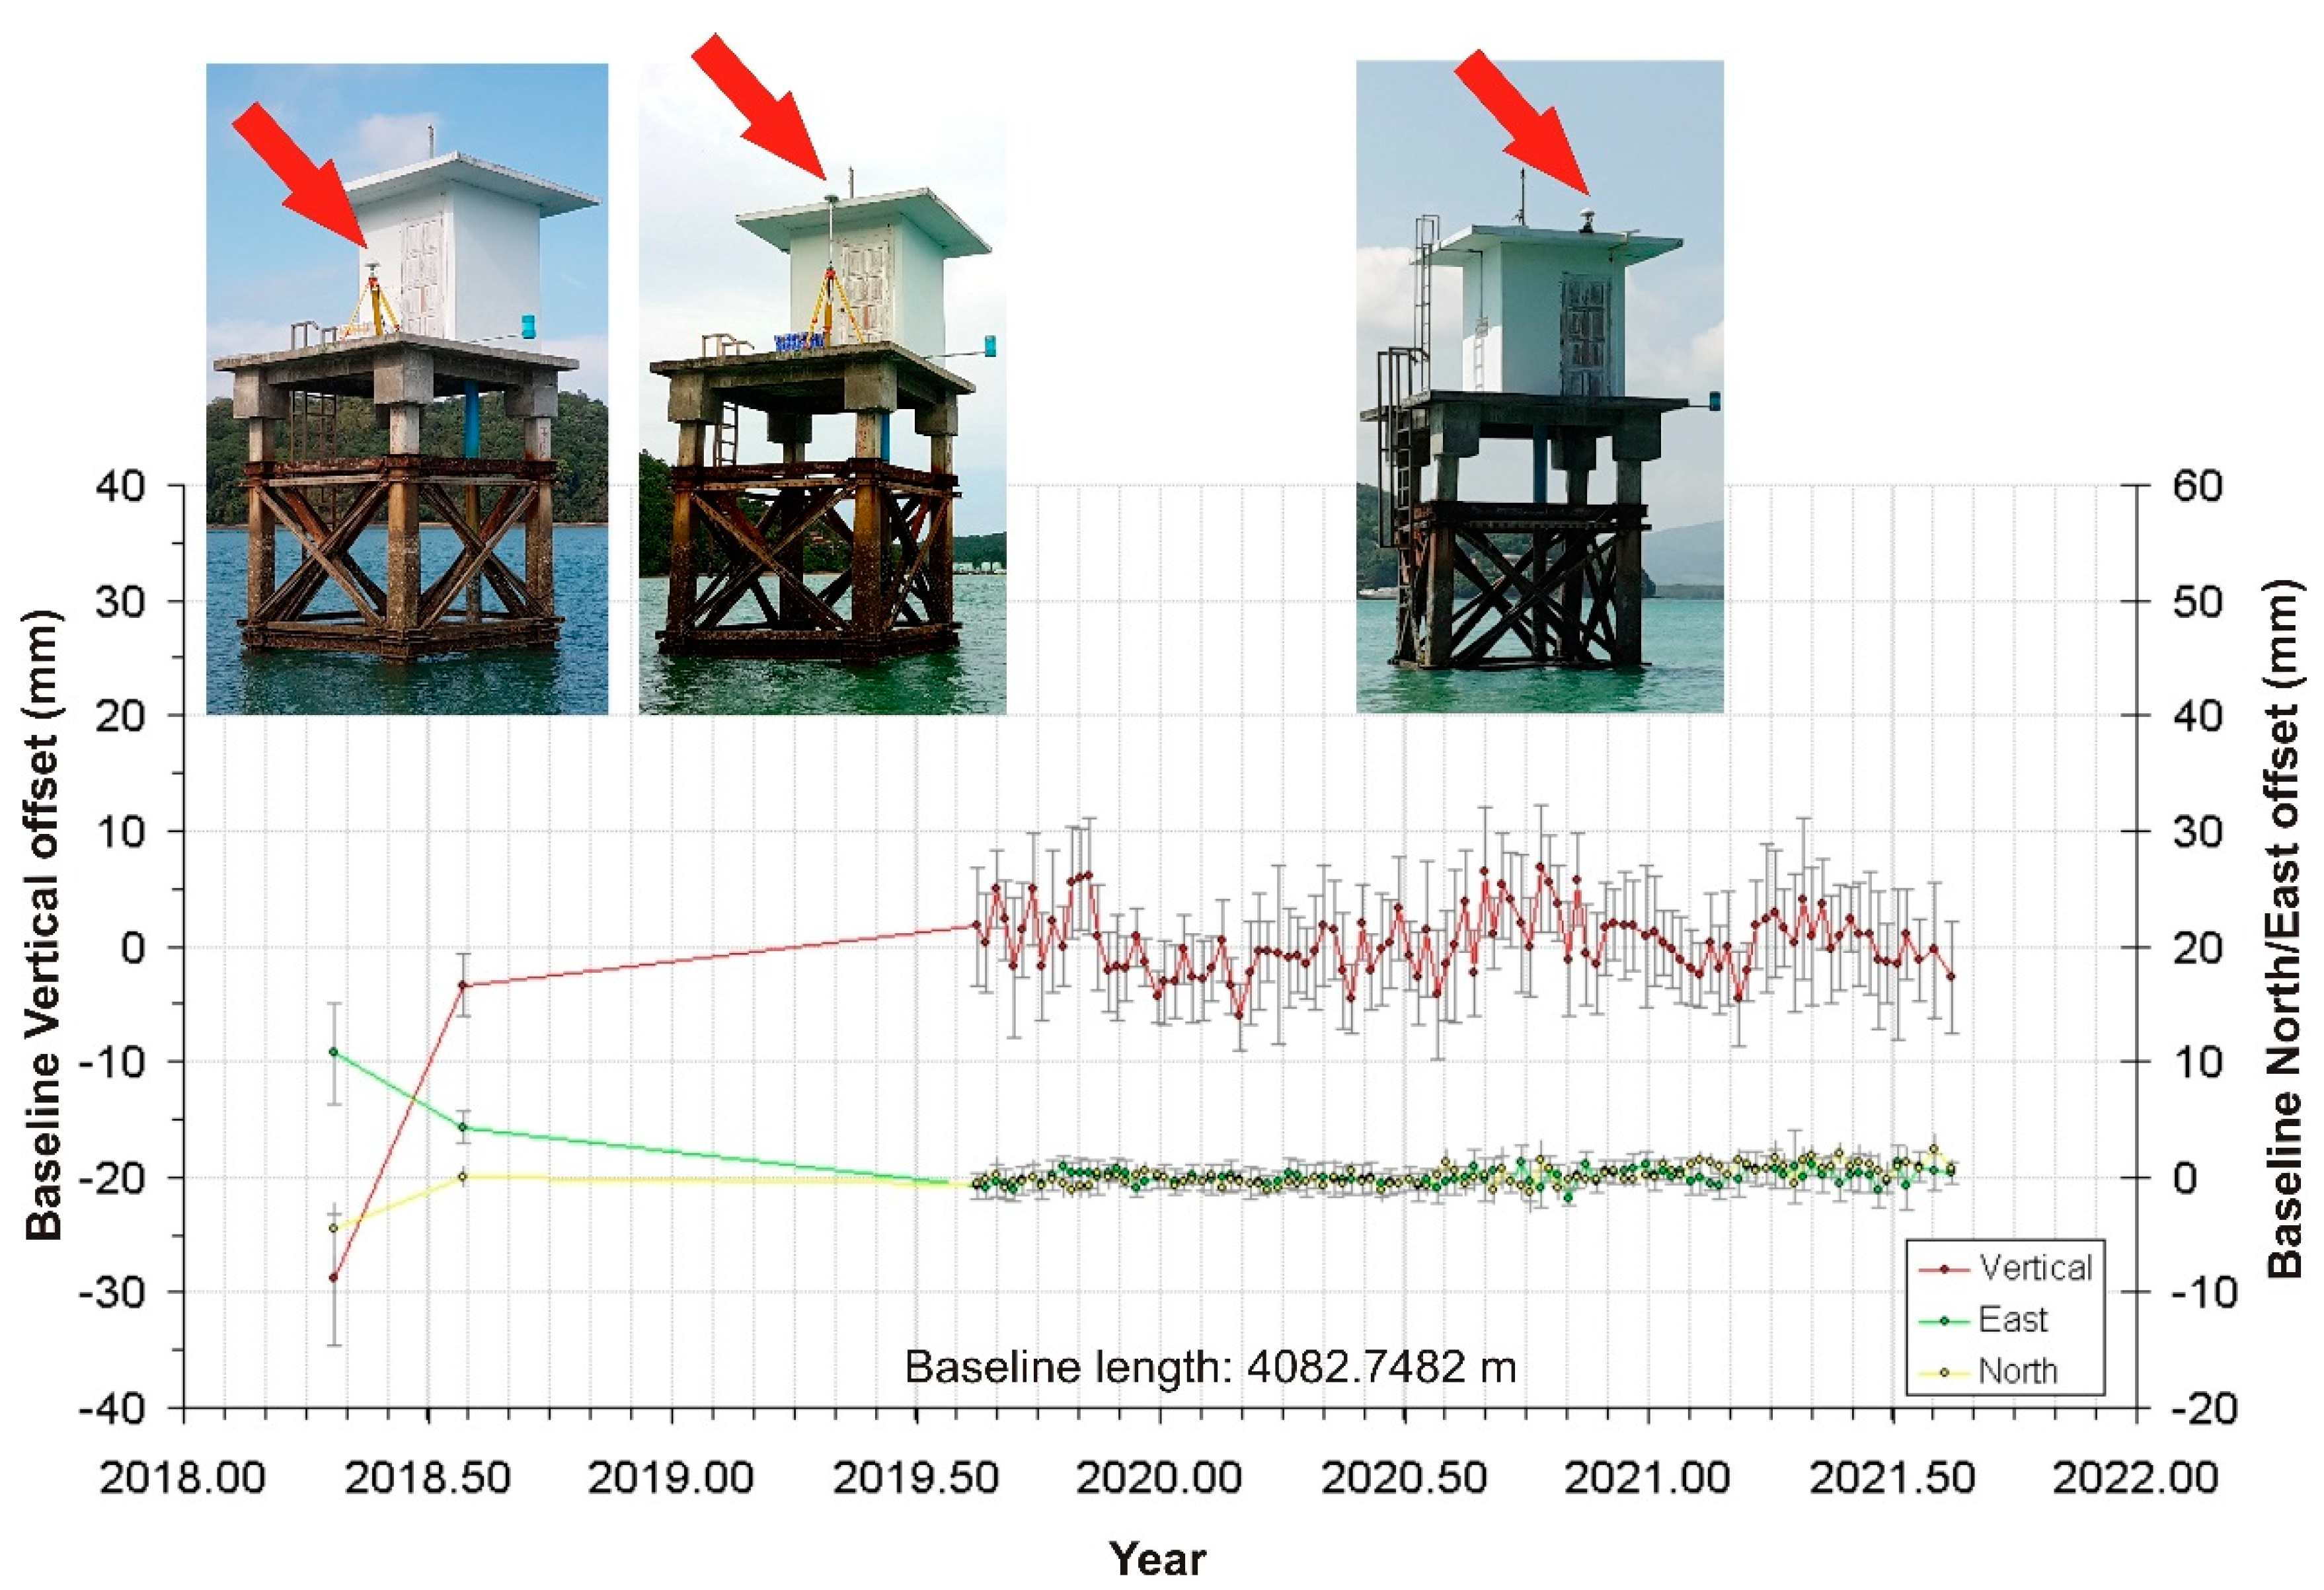
To validate the vertical motion (platform stability) of the KTN tide-gauge station in Phuket on which KTPH has been operational, its baseline to the PMBC station has been monitored. Both stations are located on bedrock (with the KTN tide-gauge (concrete) platform placed (with steel legs) on the seabed) and hence their inter-baseline (~4 km long) in principle should not change. Figure 4 shows the weekly averaged offsets of the baseline in 3D with respect to the baseline average. In addition, the two campaign-style observations in 2018 on the tide-gauge platform prior to the installation of the KTPH station are included. The KTN benchmark was observed twice in 2018 using a tripod setup (with the same antenna and receiver type). The placement of the antenna each time is illustrated by the red arrows in Figure 4. The first setup in 2018 was not ideal as a large part of the horizon to the west (satellite visibility) was blocked by the tide-gauge housing. The second tripod observation already used an extra extension rod to clear the tide-gauge housing. Finally, the continuous antenna setup has the antenna permanently attached above the tide-gauge reference benchmark. The first two measurements should not be interpreted as a true change in the baseline between the stations, but rather a result of the less optimal GNSS antenna setup. For the continuous observations at KTPH (right part of Figure 4 since August 2019), the WRMS of the baseline position offsets are 0.4, 0.5 and 2.6 mm, respectively, in the north, east and vertical directions, and after 2 years of continuous monitoring no significant changes in the relative positioning have been detected (all offsets are within their standard errors).
Figure 4 also illustrates that campaign-style observations do not provide the same level of baseline accuracy, mainly because of a less ideal setup of the GNSS antenna, resulting in GPS signals being blocked, and an unfavorable multipath environment. Although only 2 years of continuous baseline monitoring is available, there appears to be a small yearly seasonal variation (with amplitude ~4 mm) in the vertical direction (red graph line in Figure 4). This might be related to a varying (sea) temperature, which would make the steel construction on which the tide-gauge housing (with KTPH on top of it) was built, expand more (or less) than the concrete pillar at PMBC. Both constructions are anchored to bedrock. The seasonal signal, however, does not correlate with the high season temperatures (January to April). The period of maximal (positive) height difference between KTPH and PMBC is August to November, which typically is also the wettest (and most clouded) period in Phuket. As such, a plausible explanation could be that during the warmer (and more exposure to direct sunlight) months, the TG construction on which the KTPH GNSS antenna is mounted expands less as it is being cooled by the seawater, while the exposed bedrock and GNSS antenna pillar at the PMBC location is warmed up more (on average) during the day. In the more clouded and wet season, the stable sea temperature makes the tide-gauge platform contract less because of the cooler exterior air temperature than the pillar of the land-based PMBC GNSS station (right panel of Figure 1).

4. Combining Tide-Gauge, Satellite Altimetry and Vertical Land-Motion Data

Having established VLM around Phuket, we introduce tide-gauge measurements and satellite altimeter data to both validate the tide gauge data and at the same time study decadal relative sea-level variations and trends around Phuket and other parts of the Andaman Sea. Satellite altimetry is a well-established space geodetic technique that gives an absolute water level with respect to either a reference ellipsoid or a mean sea surface model. For people living close to coastal waters, it is the relative sea level that is of greater importance, relative in the sense of with respect to what the land is doing vertically. Altimetry does not include this information on the land, such as land subsidence that could result from groundwater extraction and soil compaction, or uplift and subsidence in active tectonic regions. This VLM affects the relative sea level and not the absolute per se (though it could be by a change in the geoid [22,23]). Tide gauges, on the contrary, do provide relative sea-level change and have been around for many decades. However, often this type of measurement suffers from a number of uncertainties related to changes in the vertical reference benchmark, whereas (human-induced) land subsidence and sediment compaction (when the TG is not directly attached to the bedrock) complicates their analysis (e.g., Trisirisatayawong et al. [24]). The combination of absolute VLM from GNSS (data starting in the 1990s) can be used to promote satellite altimetry as a tool to measure relative sea level (SALT minus VLM), which in turn can be compared with tide-gauge measurements and used as a tide-gauge measurement where no tide gauges are available. In this way, all measurement techniques can be inter-validated. To understand how this works, we follow the reasoning by Harvey et al. [5] and introduce the relative sea level by the tide gauge RSLTG, the global sea level by altimetry GSLSALT and the vertical land motion by GNSS VLM. Clearly, not every observing system is measuring the same information, especially if we also introduce the global isostatic adjustment (GIA), which has different contributions to RSL, GSL and VLM:
R S L T G r = C M R r + S D r + G I A R S L r V L M r G I A V L M r + R E S r
G I A R S L r = G I A G S L r G I A V L M r
G S L S A L T r = C M R r + S D r + G I A G S L r + R E S r
where r refers to a location at the sea surface, CMR represents contemporary mass redistribution (land-ice melt and changes in terrestrial water storage), SD the sterodynamic trend that is a combination of steric height change caused by density change (water warming up or cooling down) and trends in regional ocean dynamics and RES is the leftover unexplained trend residual for convenience taken as similar for SALT and TG but obviously not necessarily the same. Combining everything together, many of the components cancel from the equations and we are left with:
R S L T G r = G S L S A L T r V L M r
Equation (4) translates to sea level from TG being sea level from SALT minus VLM from GNSS. Basically, this works then for all combinations of TG, SALT and GNSS. With this, the study of both relative and absolute sea-level changes around Phuket since the early 1990s can be improved and made more reliable [25]. For all our analyses concerning tide gauge data and satellite altimetry, we largely follow up on Simons et al. [2], as on the one hand we revisit our Phuket analyses but now with more data, and on the other hand extend the vicinity of Phuket (south Thailand). For more details on the processing, we refer to this earlier study. Here, we mention a few important steps and the deviations from the original processing. Trisirisatayawong et al. [24] also give some details on similar TG and SALT data analysis and trend estimation that are focused on sea-level changes around Bangkok and in the Gulf of Thailand.

4.1. Absolute Sea-Level Changes from Satellite Altimetry

To obtain the satellite altimeter data for our study of recent sea level variations in the Andaman Sea around Phuket (see Figure 1), we employ the TU Delft/NOAA/EUMETSAT Radar Altimeter Database System (RADS) (Scharroo et al. [26]; http://rads.tudelft.nl (accessed on 1 August 2022)). RADS delivers a consistent and continuous observing system that has the complete backlog of all available 1-Hz satellite altimeter observations since the early 1990s.
A satellite altimeter sends short microwave pulses (GHz frequency) and times the reception of the pulse reflected by the sea surface. Understanding this interaction with the sea surface and applying the usual corrections for atmospheric refraction and such, the orbital height of the altimeter referenced to the reference ellipsoid minus the measured reflection distance directly gives the sea surface or sea level w.r.t. that same ellipsoid. This is the so-called absolute sea level measurement, unaffected by land motion, which can be further reduced to dynamic topography by subtracting a geoid model or to sea-level anomaly (SLA) by subtracting a mean sea surface model.
We chose only to use data from the reference missions TOPEX/POSEIDON, Jason-1, Jason-2, and Jason-3 from August 1992 up to and including December 2020, to ensure that we have identical temporal and spatial sampling conditions throughout the total data span and that we have the most accurate altimeter data. All these data have been (cross-) validated and calibrated in RADS and, therefore, can be easily combined without any jumps over time and from one altimeter to the other. The altimetric sea-level anomaly (SLA) is obtained as stated before by subtracting the instrument-corrected measured range from the orbital height, and subtracting the necessary corrections, being the corrections for the dry and wet troposphere, ionosphere, high-frequency dynamic atmosphere correction, ocean tide, solid Earth tide and load tide, pole tide, sea-state bias, and mean sea surface model. We do not apply the static inverse barometer correction because such correction is also not applied to the TG data. The high frequency component of the dynamic atmosphere is needed because it aliases into the altimeter data at much longer wavelengths (under-sampling). High-frequency dynamic atmosphere correction is not needed to be applied to the tide-gauge data because for those it does average out in the tide-gauge monthly means (no under-sampling). For all the corrections, we have used the default values as suggested by RADS: for this, the reader is referred to the RADS data manual available at https://github.com/remkos/rads (accessed on 1 August 2022).
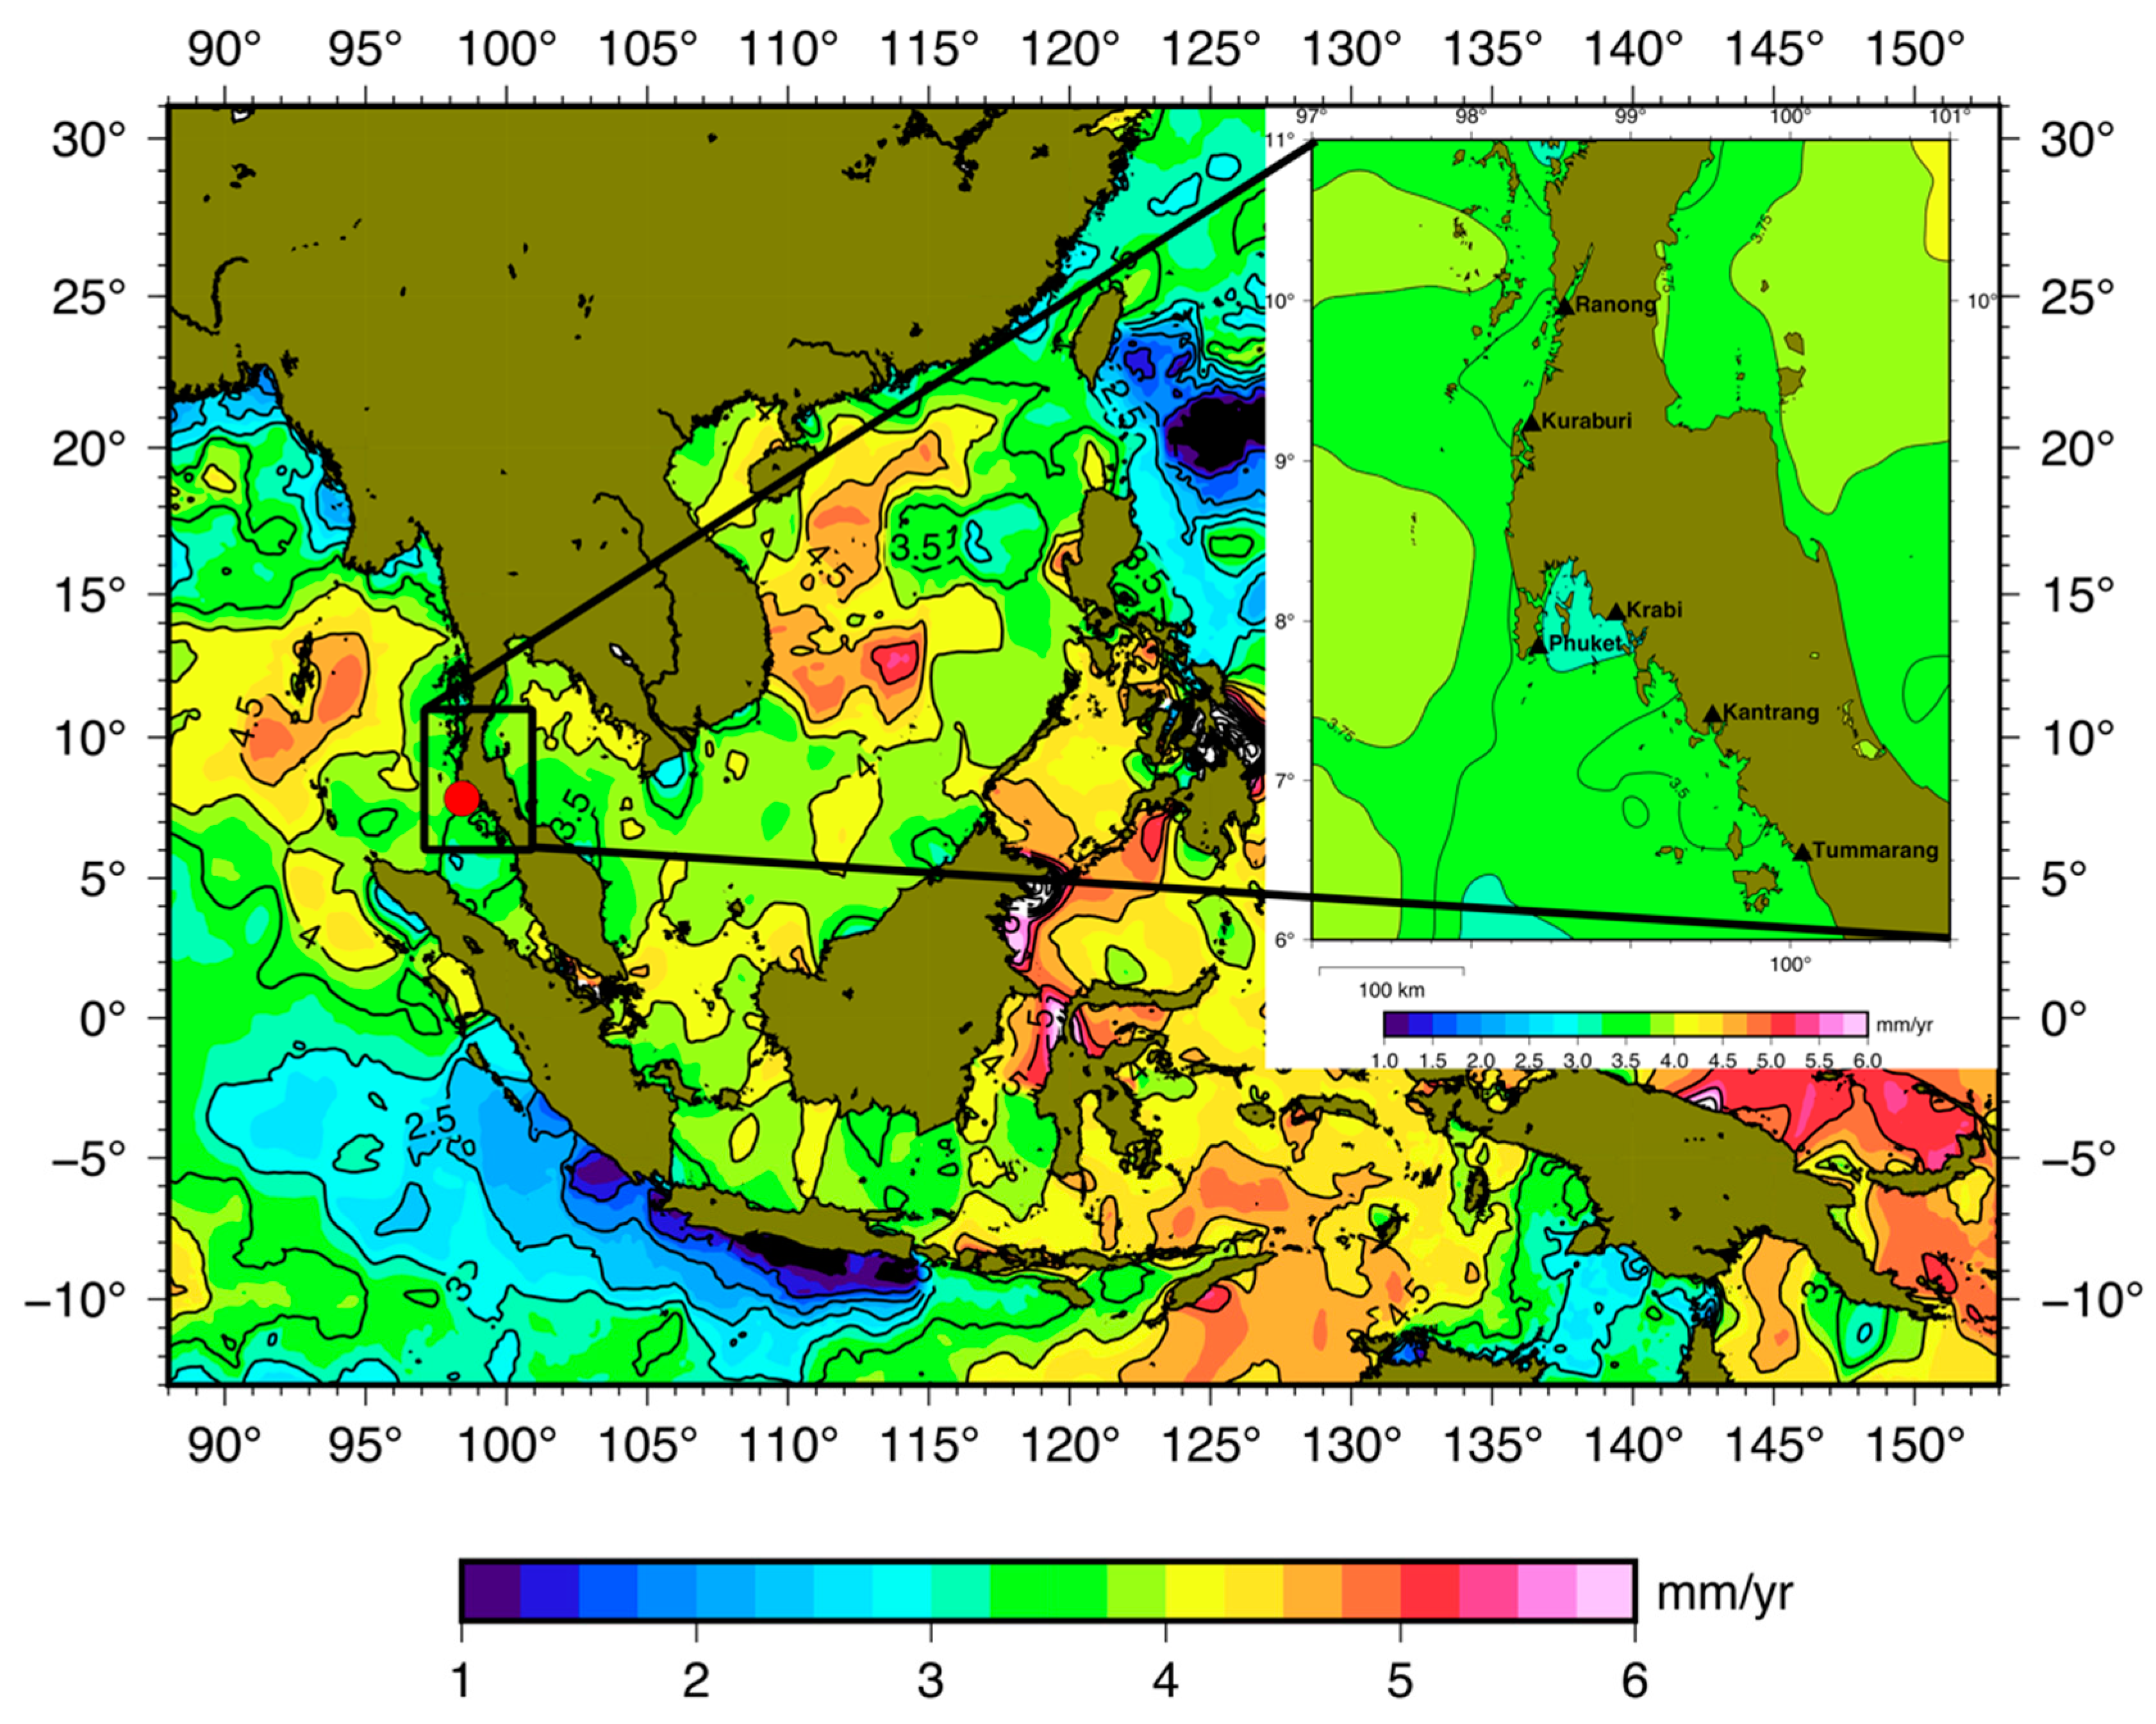
For our study area, which is bounded by 88 and 153 degrees longitude and –13 and 31 degrees latitude, we collected the altimeter data per month, which is about three altimeter cycles of 10 days each, and applied an inverse distance-weighted gridding of power 2 (cells of 0.25 degrees, 0.709 degrees e-folding sigma, and a 3-sigma horizon). The regional map of absolute sea-level trend is obtained by simultaneously fitting a linear trend, bias and two periodic cycles (annual and semi-annual) to the monthly gridded altimeter SLAs (time series) at each grid point separately. The map is displayed in Figure 5. Obviously, our final analysis concerns extracting trends, in the altimetric SLAs as well as in the tide-gauge time series at the locations of the tide gauges near Phuket (Figure 6a,b) and in the south of Thailand (Figure S3 and Section 4.3). This is done by interpolation in the monthly grids to the right locations of the tide gauges and again applying the model fit. Clearly, we need this simultaneous (robust) fit of linear and periodic signals, because the trend estimate can be affected by the presence of periodic signals whenever the data span does not comprise an integer number of these periods. A separate analysis indicated that the annual and semi-annual cycle are the most dominant ones, agreeing with other studies (e.g., Cheng et al. [27]). As indicated, Figure 6a,b show the sea level result for both the co-located altimetric SLA and the TG levels at the Phuket tide-gauge station.
At the six TG locations given in the insert of Figure 5, ranked southwards along the coastline, the SALT results (given in Figure S3) all indicate absolute sea-level rise (no fall over the past 28 years) of 3.4 ± 0.5 mm/yr at Ranong, 3.4 ± 0.4 mm/yr at Kuraburi, 3.3 ± 0.4 mm/yr at Phuket (Figure 6a), 3.2 ± 0.5 mm/yr at Krabi, 3.6 ± 0.5 mm/yr at Kantrang and 3.5 ± 0.5 mm/yr at Tummarang. As expected, the results are similar in the same region of the Andaman Sea, but, still, we find differences up to 0.4 mm/yr (cf. Figure 5) going from one location to the other.

4.2. Validation of the Relative Sea-Level Changes from Tide-Gauge Records in Phuket

In Phuket, we have the HDRTN-operated Ko Taphao Noi (KTN) tide gauge (co-located with KTPH in Figure 1). It was established in 1940 as part of a network of tide gauges operated by the Royal Thai Navy (RTN) and the Thai Marine Department (TMD). It is located 4.1 km from the PMBC GNSS station and is included in the Global Sea-Level Observing System (GLOSS) [28] Core Network (GLOSS station code 42) and in the Permanent Service for Mean Sea-level (PSMSL) [29] (station ID 446). We obtained our hourly tide gauge (TG) data, spanning the period 1980 up to and including 2020, from the Hydrographic Department of the Royal Thai Navy (HDRTN) directly. Be aware that the TG data in 2013 and 2014 (unavailable in the GLOSS/PSMSL database) have been obtained from a close-by temporary TG station at the PMBC jetty that was operated from 2012 to 2016 because the original KTN TG was destroyed after being hit by a fishing boat during a storm in the summer of 2013. Fortunately, HDRTN was able to reinstall KTN at practically almost the same location and the TG was recommissioned in January 2015. The hourly TG data have been reduced to monthly averaged mean sea level (MSL) by averaging all hourly data available within a month, this to filter out most of the tidal constituents (especially diurnal and semi-diurnal). The actual amount of hourly data available in a month divided by the theoretical maximum number is taken as a measure of reliability: a ratio of 2/3 or more is taken as criterion to constitute a valid monthly value. This is a bit stricter than the 15-day rule in PSMSL. In addition, data from 1988 onward were corrected by a vertical datum offset of +14 mm (as documented by PSMSL). We then applied the identical model fit as we did with the altimeter data to be able to compare the tide-gauge result with the altimeter result, and at the same time we introduce the VLM from GNSS on which we performed a similar analysis but for the periodic contribution only estimated an annual cycle as the semi-annual cycle is close to non-existent (the source of the periodic signal in the VLM appears different from the periodic signals in TG and SALT). The result and comparison are shown in Figure 6.
Based on the observed envelope of the vertical land motion of Phuket by GPS (Figure 6c), for the TG time series we also make the distinction between the time prior to the 2004 Mw 9.2 Sumatra–Andaman earthquake and after (Figure 6b). As the tide gauge measures relative sea level, meaning w.r.t. to the land, it indirectly measures the opposite of the vertical land motion (vertically mirrored). The GPS result (Figure 6c) nicely unravels the different vertical land motion characteristic in earthquake prior and following periods.
The SALT results (Figure 6a), on the other hand, observing the absolute sea-level, is not affected by land motion (maybe indirectly it is by a change in geoid, which would change the mean sea surface, but this is a small secondary effect and can be neglected). So, for SALT we can leave out this exponential decay part, but for the rest, the processing methodology is the same for SALT and TG, the same robust fitting, comparable parameterization, and same outlier criterion of 3σ. Table 2 gives an overview of the parameterization used. The exceptional lowering of sea levels in the Andaman Sea was due to the pronounced Indian Ocean Dipole (IOD) of 1997 (a similar coupled ocean-atmosphere dynamics effect to El Nino but quite specific to the Indian Ocean) (e.g., Webster et al. [30], Saji et al. [31]) that also had dire consequences for the shallow water corals [32]. This can be seen in both the SALT and TG time series: these were edited out automatically by the 3σ outlier criterion.
The three panels in Figure 6 give the results of the SALT, TG and GNSS analyses and of the modeling of the different signal contributions after editing and fitting our model mode(s). SALT shows an absolute sea-level rise of 3.3 ± 0.4 mm/yr for the Andaman Sea close to KTN (Phuket). When we subtract the TG result, with a 1.0 ± 0.7 mm/yr trend, from the altimeter result, we find an apparent vertical land motion of 2.3 ± 0.8 mm/yr, which perfectly matches the value obtained (independently) from the GNSS analyses, being 2.4 ± 0.2 mm/yr (check Figure 6c). After 26 December 2004, we cannot directly subtract trends, but a similar (vertically mirrored) behavior is observed in the TG solution (Figure 6b) and in the GNSS result (Figure 6c): the relative sea-level rise accelerated following the Mw 9.2 earthquake (caused by the accelerated post-seismic land subsidence) and has risen up by 16 cm, according to TG, and by 10 cm, according to GNSS. In this, the negative VLM offset (relative sea level rise) is most accurately determined by GNSS and over 17 years translates into an average rate of 6 mm/yr.
While the combination of SALT and TG data has become a well-established method to estimate vertical land motion at the coast [25], Figure 6 shows that in the same manner the combination of SALT and continuous GNSS data from coastal stations (located on bedrock) can act as a substitute for tide gauges, enabling the derivation of accurate relative sea-level change estimates worldwide. These results also allow the validation of existing tide gauges (and detection of potential height offsets), upgrading these valuable long-term sea-level change information sources, unlocking relative sea level changes over the years prior to the satellite earth observation era.
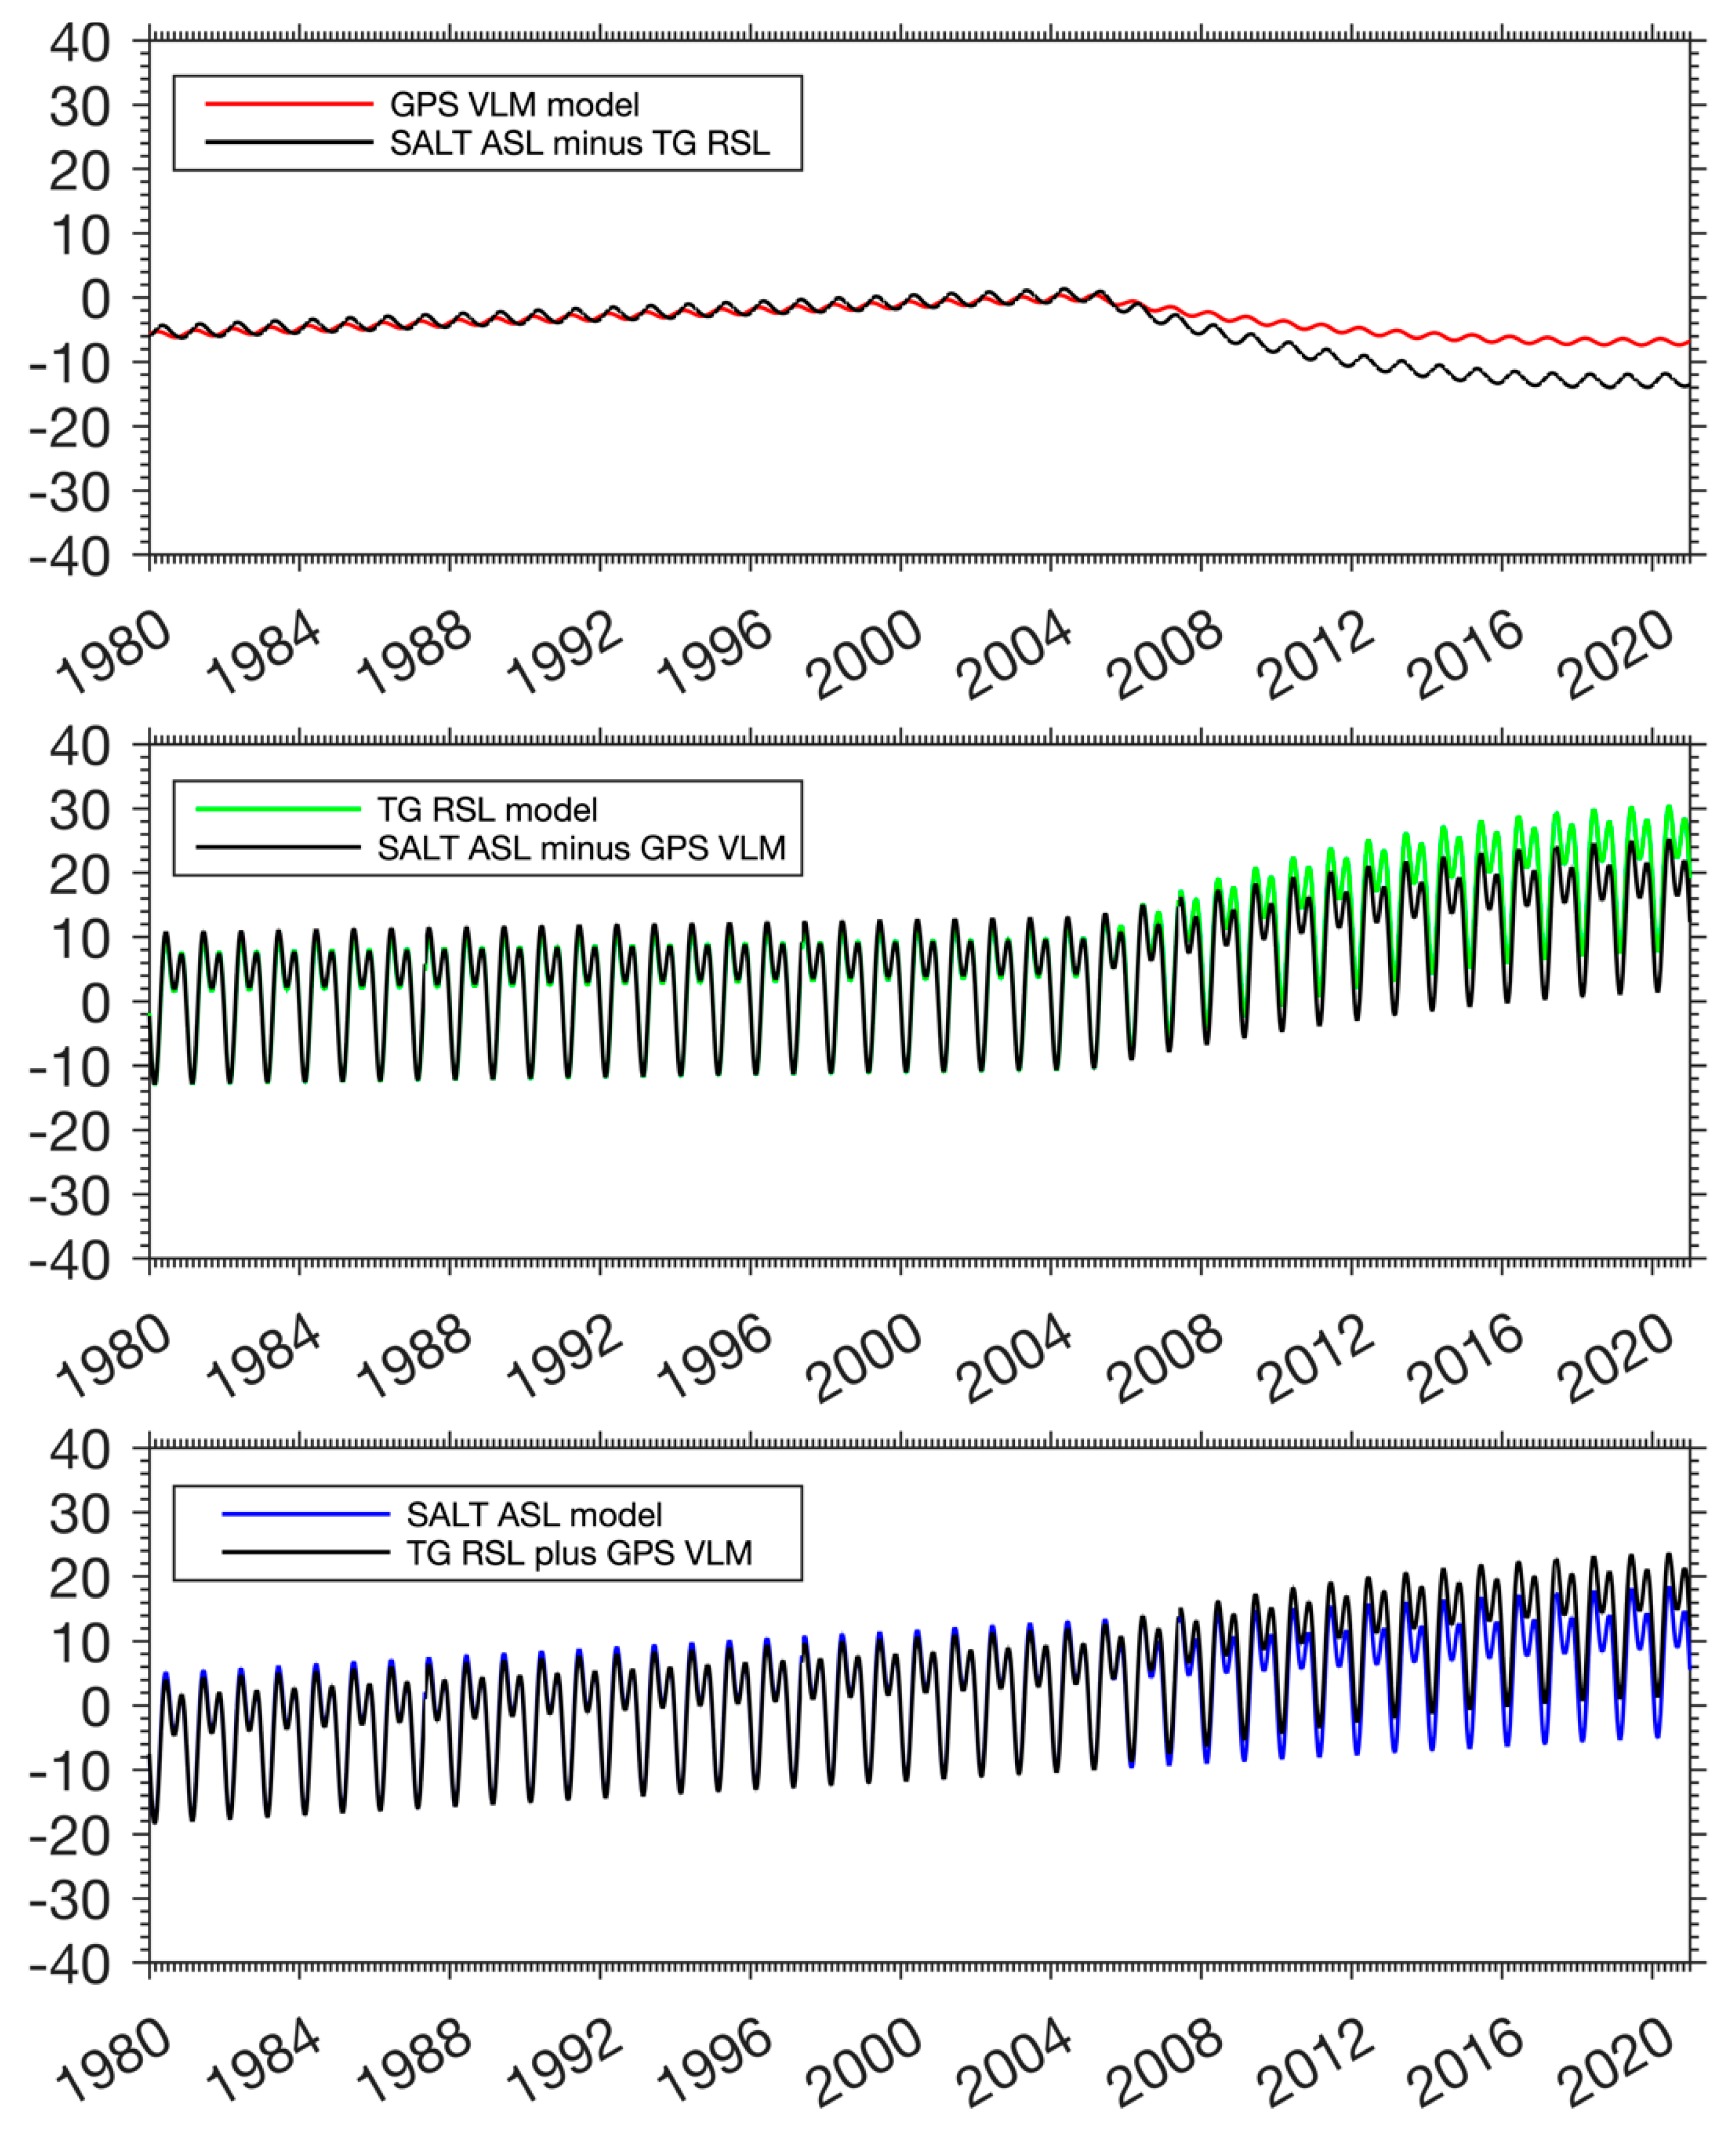
In Figure 7, we explore the combination of our models for absolute sea level (ASL from SALT), relative sea level (RSL from TG) and vertical land motion (VLM from GPS). As we already established from Figure 6, we notice a good fit when we compare the tide-gauge result with the SALT minus VLM result, both a direct indication of the relative sea-level RSL. Before 26 December 2004, the fit is close to perfect and, afterward, we see comparable exponential decay behavior, albeit with different amplitude. In our modeling, we chose the same half-life to keep this behavior for both VLM and RSL because we do not have a direct explanation for this deviation. We do know that there was no vertical shift in the VLM during the earthquake on the basis of our detailed GPS analysis, but, in fact, the tide gauge itself also did not manifest any clear jump. Trying to align both RSL solutions by introducing a jump in the TG data and/or further tuning the models is part of ongoing investigation. It can be that the change in VLM is just part of the RSL change after the earthquake and that other processes play a role in this nonlinear process, like differences in GIA for RSL, for ASL and for VLM. In addition, spatially varying vertical motion on top of the common-mode crustal motion could give rise to less smooth RSL from TG data. It is good to see that the estimated annual and semi-annual cycle for SALT and TG are also a good match. We summarize all the Phuket findings in Table 3.

4.3. Relative Sea-Level Changes from Other Tide-Gauge Records in South Thailand

The observed impact of the post-seismic vertical motions of Phuket on the KTN tide-gauge records was also investigated in the records of five other tide gauges (locations given in Figure 5) in the south of Thailand. None of these tide gauges is equipped with (nearby) GNSS, so we have to resort to the tide-gauge records and absolute sea-level rise estimates from SALT. These tide-gauge records were obtained as monthly averages from TMD with the notice that most of these TGs (Ranong, Kantrang, Krabi and Tummarang) have been relocated in the past 25 years and have a potentially high risk of benchmark height offsets.
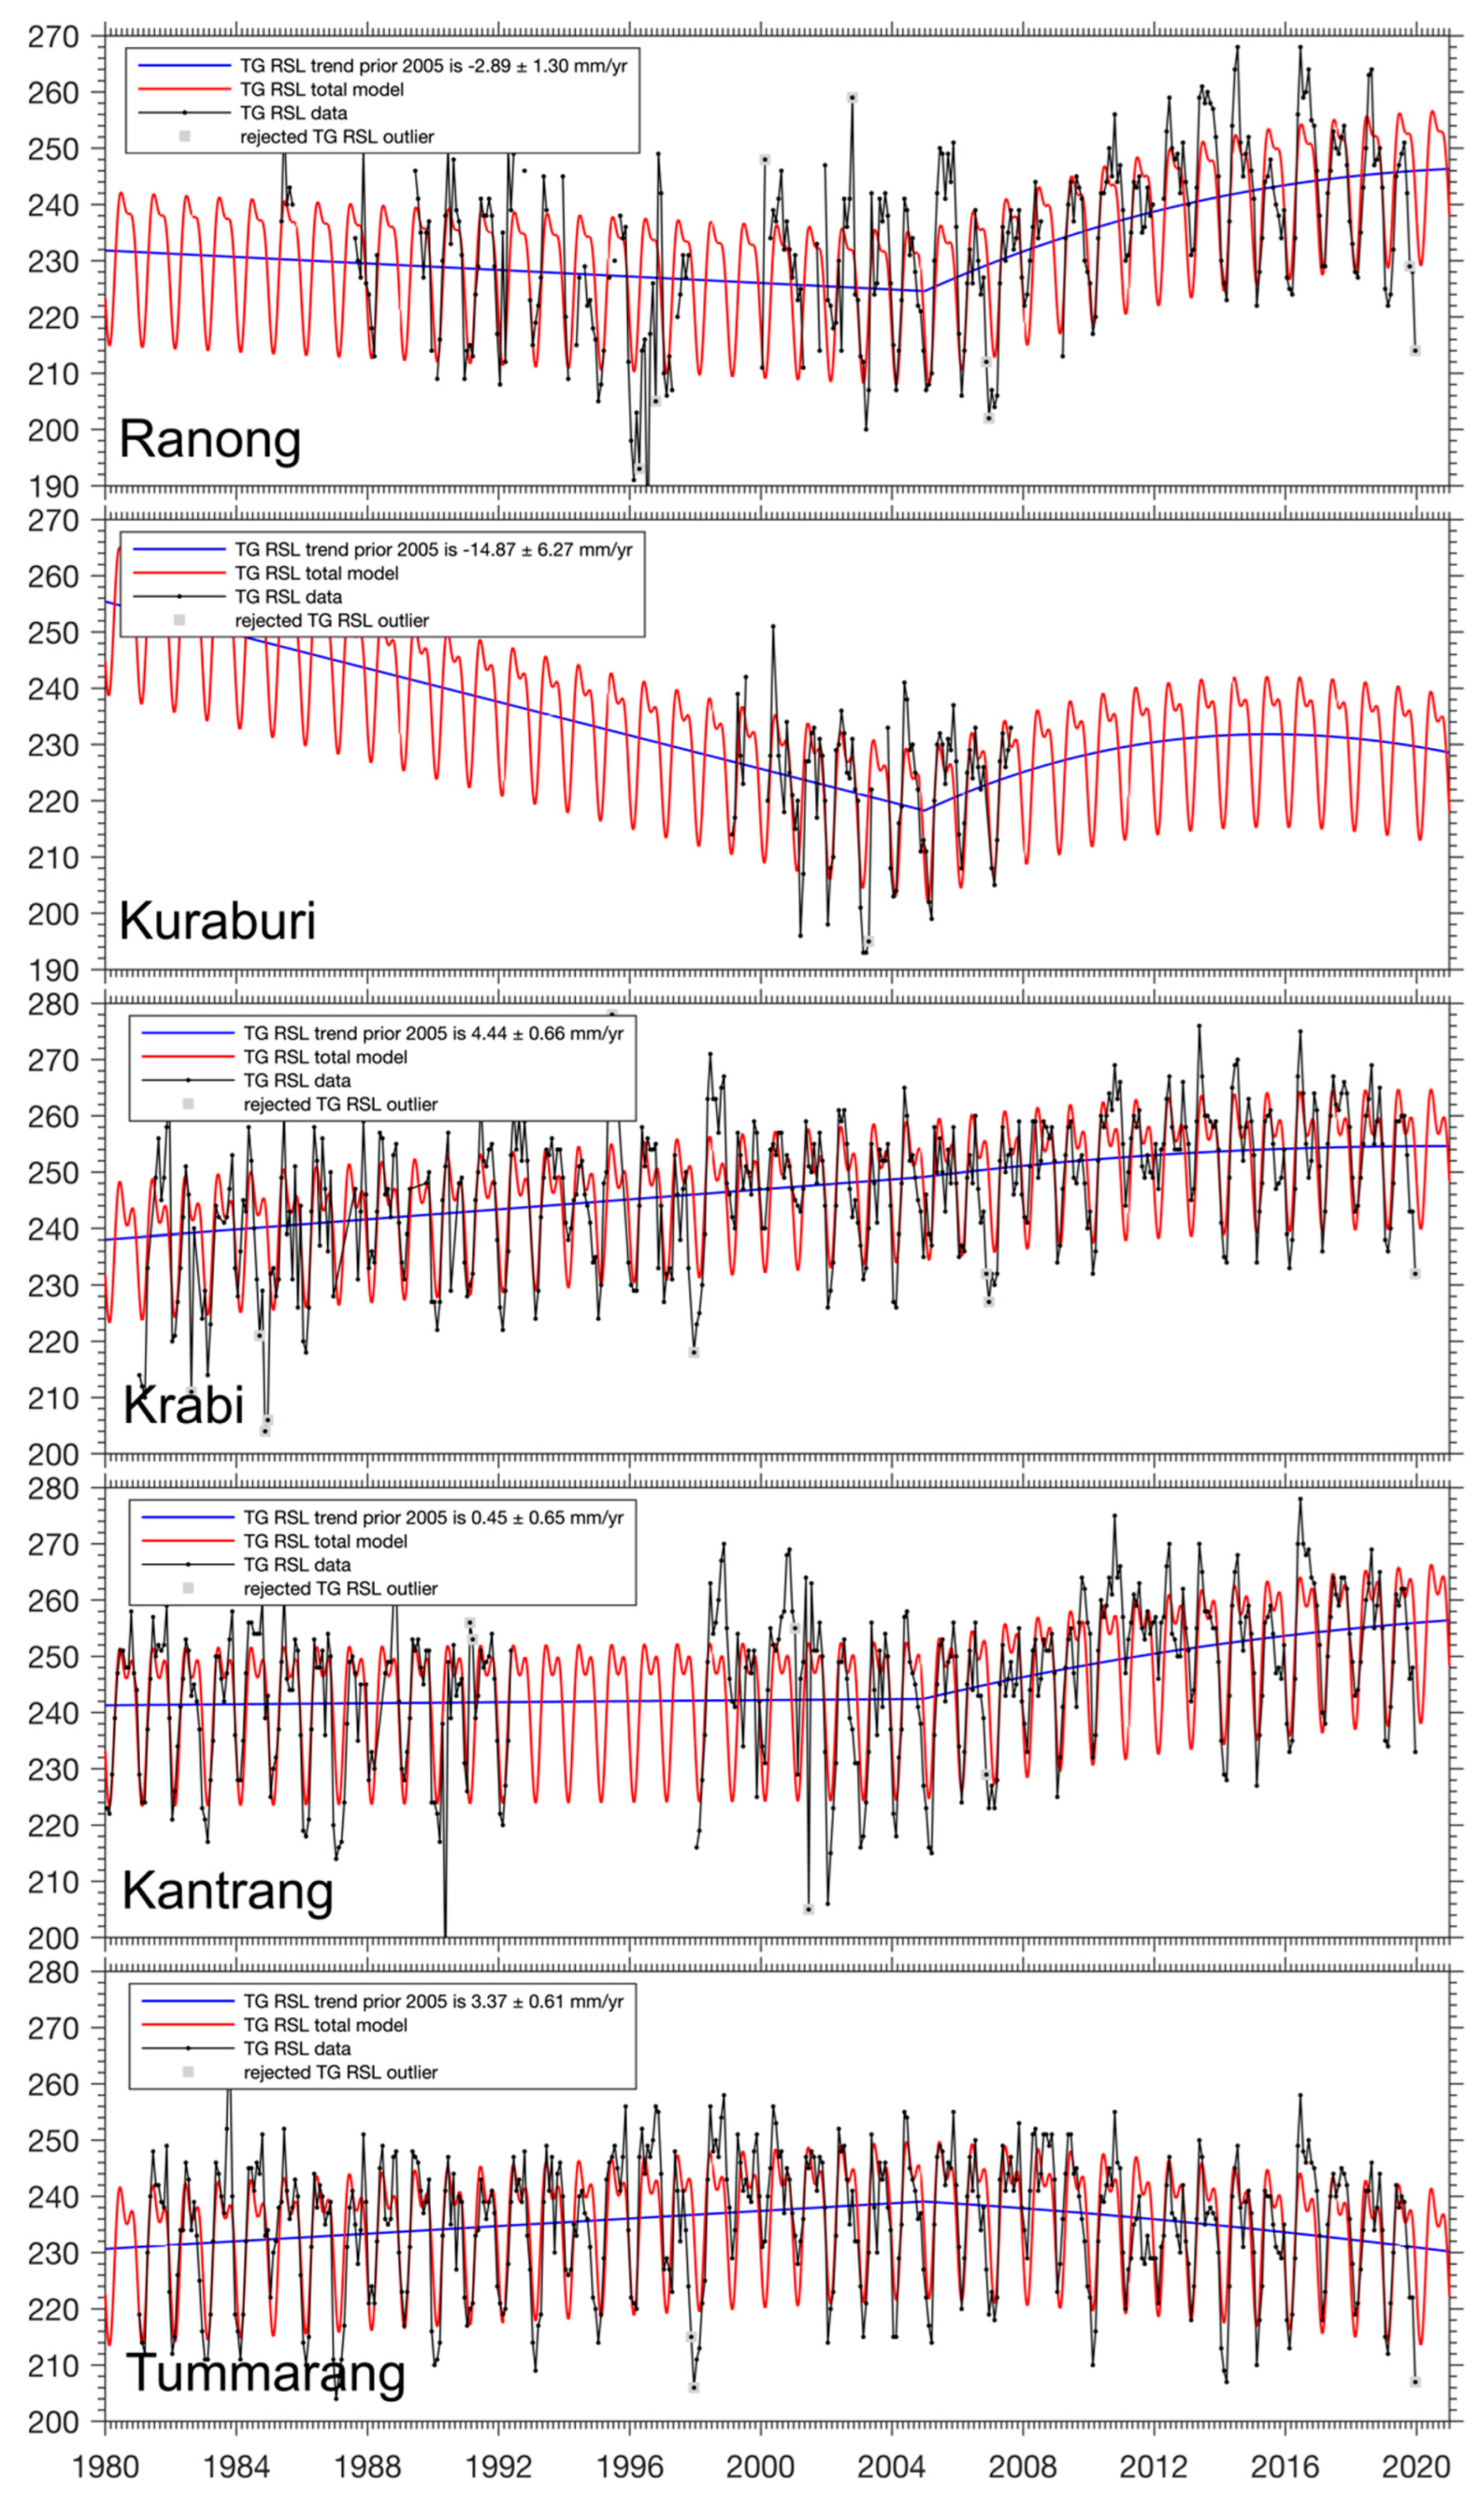
For Ranong, the tide-gauge data analysis shows (Figure 8) some interesting results. A (nonlinear) increase in relative sea-level rise of about 22 cm can be clearly observed here between the end of 2004 and 2020, caused by vertical post-seismic subsidence following the 2004 Mw 9.2 Sumatra–Andaman earthquake. However, the TG records of Ranong indicate this region prior to 2005 was actually experiencing a relative sea-level fall of −2.9 ± 1.3 mm/yr, while in Phuket Island there was a relative sea-level rise (1.0 ± 0.7 mm/yr). The Ranong TG suggests (when combined with the local SALT trend of 3.4 ± 0.5 mm/yr) an inter-seismic vertical tectonic uplift of 5.3 ± 1.4 mm/yr. This is significantly higher than in Phuket and might be related to additional inter-seismic loading and/or activity on the Ranong Fault [33]. In recent years (after 2005), we see the opposite trend and the exponential land subsidence resulted in an extra (exponential) sea-level rise that may have intensified coastal erosion [34,35,36]. The relative sea level currently is still significantly higher than it was in early 2005.
For TG station Kuraburi (still analyzing Figure 8) only a relatively short period of data is available (1999–2007). A period of relative sea-level fall is indicated (−14.9 ± 6.3 mm/yr) until the end of 2004, followed by a sea-level rise of approx. 7 to 8 cm until the end of the TG records in 2007. Combined with the SALT trend, this suggests an inter-seismic VLM tectonic uplift rate of 18.3 ± 6.3 mm/yr. This seems rather unlikely, but within 2-sigma would match the tectonic uplift observed at Ranong. The onset of the post-seismic tectonic subsidence appears to be present nonetheless. The short data span though prohibits a reliable fit.
The TG station in Krabi shows a similar relative sea-level change pattern (inter-seismic rate of 4.4 ± 0.7 mm/yr) as that of the KTN tide gauge in Phuket, be it with a less well-pronounced post-seismic subsidence phase. The VLM estimate here (SALT minus TG trend) suggests an inter-seismic land subsidence rate of −1.2 ± 0.8 mm/yr, which could be attributed to local subsidence of the TG foundations if not firmly attached to bedrock.
TG station Kantrang indicates a relative sea-level rise of 0.5 ± 0.7 mm/yr between 1980 and the end of 2004, which is followed by a temporarily sea-level increase of up to 14 cm in 17 years (with a similar pattern as in Phuket (Figure 6b)) as a result of additional post-seismic subsidence following the 2004 megathrust earthquake. The inter-seismic VLM estimate is negative (−3.1 ± 0.7 mm/yr). The TG stations in Kantrang and Ranong resemble best the post-seismic subsidence pattern observed in Phuket.
Finally, TG station Tummarang shows almost identical absolute and relative sea-level change values (3.5 ± 0.5 and 3.4 ± 0.6 mm/yr), indicating a slight negative (not significant) inter-seismic VLM of −0.1 ± 0.8 mm/yr. However, during the post-seismic phase, a linear sea-level fall of approx. 10 cm is accumulated by the end of 2020, suggesting a sudden (new) uplift rate of 9.4 ± 0.5 mm/yr. It is more likely that an undocumented benchmark height offset (e.g., between 2010 and 2012) resulted in this (compared to all other TG stations in the same region), deviating the sea-level change pattern after 2005.
Unfortunately, no GNSS data are available near any of these TG stations, which makes it harder to detect anomalies in these five TG records. We recommend in the future to put GNSS stations close to these (and other) tide-gauge stations (co-location).

5. Conclusions

A new (dual receiver) continuous GPS station was successfully installed mid-2019 at the KTN tide gauge in Phuket. Scientific analysis of the first (2-year) batch of GPS data from the KTPH station indicates absolute positioning accuracies in the IGS14 (ITRF14) global reference frame that range from sub-millimeter for the horizontal to 2–3 mm for the vertical position. At the same time, the previously installed PMBC GNSS station at Cape Panwa has uninterruptedly collected data since it was installed mid-2017 in a previous project. The updated 3D-position time series confirms that Phuket Island is still undergoing post-seismic deformations following the 2004 Mw 9.2 Sumatra−Andaman earthquake. While the horizontal motions in other regions of Thailand are approaching their inter-seismic rates (~3 cm/yr to ESE as a (stable) part of the Sundaland Block), the island, 16 years later, is still moving horizontally 2.4 ± 0.1 cm/yr slower in an SSW direction (toward the 2004 Mw 9.2 epicenter) than it did before the earthquake. Given that in Thailand, Phuket is located the closest to the Mw 9.2 earthquake epicenter, it also underwent most co- and post-seismic motion in Thailand. The vertical deformation component (tectonically induced inter-seismic uplift before the earthquake, and post-seismic subsidence afterward) appears to be approaching zero in the last 2–3 years.
Although the GPS observation time span from KTPH is still too short to reliably estimate the absolute motion of the station (at and below the 1 mm/yr level for, respectively, the vertical and horizontal directions), the stability of the tide-gauge platform has been assessed by monitoring the baseline changes between PMBC and KTPH. While the initial (campaign-style) GPS observations of the tide-gauge benchmark in 2018 suggest position changes at the centimeter level, these seem to entirely result from the less optimal (obstructed and with vertical alignment errors introduced) antenna setups that were used. The continuous GPS data from KTPH from mid-2019 onward indicate that the baseline to PMBC has virtually remained the same, with no detectable (nonseasonal) position offsets within 1 and 3 mm in, respectively, the horizontal and vertical directions. The new KTPH GPS station’s main purpose is to monitor the stability of the tide-gauge platform and in situ record the absolute vertical motion of the tide-gauge benchmark without requiring (traditional) leveling measurements to be carried out from other benchmarks located on the nearby Koh Taphao Noi Island. Combined with the tide-gauge data, robust observations of both relative (to the land and sea-bottom) and absolute changes of the mean sea-level can be obtained.
The combination of GNSS, TG and SALT data in Phuket demonstrates that these techniques can be used to validate VLM, and improve relative and absolute sea-level rise estimates. For Phuket, the relative sea-level rise (SALT-GPS and TG) between 1980 and 2005 was moderate (1.0 ± 0.7 mm/yr) because of a positive VLM (GPS and SALT-TG) of 2.4 ± 0.2 mm/yr, while the absolute sea-level rise (SALT and TG+GPS) for the Andaman Sea close to Phuket was 3.3 ± 0.4 mm/yr. After 2005, the VLM and TG exhibit a nonlinear (exponentially decaying) pattern that is mirrored for the VLM (tectonic subsidence) and TG (relative sea-level rise) time series. Since both the TG and VLM come from benchmarks located on bedrock, the relative sea-level changes come from tectonic deformation (both inter- and post-seismic) of the Sundaland plate over large distances and, hence, should also be present elsewhere in south Thailand. As a result, the relative sea-level changes in such regions can temporary vary (with a time scale of decades), which in the case of increased sea levels (~16 cm at Phuket since 2005) may cause (additional) coastal erosion. The tide-gauge records in Ranong reveal a temporary change from sea-level fall (−2.9 ± 1.3 mm/yr prior to 2005) to sea-level rise (by ~22 cm) in the past 17 years. This suggests an inter-seismic vertical tectonic uplift (SALT-TG) of 5.3 ± 1.4 mm/yr, more than two times higher than in Phuket (2.4 ± 0.2 mm/yr), which may be due to additional tectonic uplift west of the Ranong Fault zone. This also demonstrates that TG stations can provide estimates of long-term VLM related to tectonic (inter- and intraplate) deformation in the absence of human-induced land subsidence (TG stations located on sedimentation layers versus bedrock). However, TGs record sea-level changes over long time periods with different equipment and sometimes need to be relocated. Although this should be properly documented and the reference benchmark heights should be preserved (within or better than 1 cm), the records of the five TMD TGs suggest that this is probably not always the case. The majority of the TG records, though, do confirm the temporary increase in sea-level rise caused by post-seismic tectonic subsidence of south Thailand following the 2004 Mw 9.2 Sumatra−Andaman earthquake and also show to a certain extent similar exponential decay characteristics.
It is advised to combine TG, SALT and GNSS data time series using the same parameterization and trend estimation method rather than combining results from different (external) sources. Finally, it is recommended to co-locate GNSS at all TG stations in Thailand, so relative sea-level rise estimates can be validated also in combination with independent SALT and VLM results.

Supplementary Materials

The following supporting information can be downloaded at https://www.mdpi.com/article/10.3390/rs14205145/s1. Figure S1: KTPH GNSS station setup; Figure S2: Station GPS position time series SPKN/CUSV/NTUS/MKNB; Figure S3: Satellite altimetry ALT time series TMD stations in South-Thailand.

Author Contributions

Conceptualization, W.J.F.S., S.N. and M.C.N.; data curation, S.N., N.T., W.J.F.S. and M.A.M.; formal analysis, M.C.N., W.J.F.S. and M.A.M.; funding acquisition, S.P., S.N. and W.J.F.S.; investigation, W.J.F.S., M.C.N., S.N. and S.P.; methodology, W.J.F.S. and M.C.N.; project administration: S.P., S.N., W.J.F.S. and P.N.; resources, S.N., S.P., N.T. and W.J.F.S.; software, M.C.N. and W.J.F.S.; supervision, W.J.F.S.; visualization, W.J.F.S. and M.C.N.; writing—original draft, W.J.F.S. and M.C.N.; writing—review and editing M.C.N., W.J.F.S., S.P., P.N. and S.N. All authors have read and agreed to the published version of the manuscript.

Funding

This research was co-funded by Prince of Songkla University, Hat Yai, Thailand, grant number COR6202041S. The GPS data acquisition and research were also partly funded by grants from the Dutch NWO User Support Programme Space Research (2007–2024). The APC was funded by the Delft University of Technology (TU Delft).

Institutional Review Board Statement

Not applicable.

Informed Consent Statement

Not applicable.

Data Availability Statement

The TG data from KTN in Phuket was obtained from HDRTN (by official request letter). Data from the other TG stations can be obtained from TMD (by official request letter). The authors have included all processed TG time series in ASCII format along with the GNSS data (RINEX format) from the TUDelft stations PMBC (2017–2021), KTPH (2019–2021), SPKN (2017–2021) in Thailand in a repository at 4TU.ResearchData (CC BY-NC-SA license): https://doi.org/10.4121/21310380.v2 (accessed on 1 August 2022). The GNSS data from the IGS stations CUSV/NTUS can be freely downloaded from one of the IGS data repositories (e.g., ftp://gdc.cddis.eosdis.nasa.gov/pub/gnss/data/daily (accessed on 1 August 2022)).

Acknowledgments

We would like to extend our special thanks to the Hydrographic Department of the Royal Thai Navy (HDRTN) for their permission and assistance in installing the KTPH GNSS station at their KTN tide-gauge, the Thai Marine Department (TMD) for providing their TG data in South Thailand and to the Royal Thai Survey Department (RTSD) for providing additional GPS data from the GEODYSSEA PHUK point. Part of the GPS data used in this report was collected as part of our cooperation in the EU-ASEAN SEAMERGES (2004–2006) and GEO2TECDI-1/2 projects (2009–2013). We also want to thank the Phuket Marine Biological Centre (PMBC) for their continued excellent hosting of the PMBC GNSS station on their premises and by again providing excellent logistical (boat/staff) and technical support in setting up and inspecting the new KTPH GNSS station. We thank Remko Scharroo (EUMETSAT) and Eric Leuliette (NOAA) for their continued maintenance of the Radar Altimeter Database System. We also like to thank the 4 anonymous reviewers for their constructive comments.

Conflicts of Interest

The authors declare no conflict of interest. The funders had no role in the design of the study, in the collection, analyses, or interpretation of data, in the writing of the manuscript, or in the decision to publish the results.

References

  1. White, N.J. Coastal and global averaged sea level rise for 1950 to 2000. Geophys. Res. Lett. 2005, 32, L01601. [Google Scholar] [CrossRef]
  2. Simons, W.J.F.; Naeije, M.C.; Brown, B.E.; Niemnil, S.; Pradit, S.; Thongtham, N.; Mustafar, M.A.; Towatana, P.; Darnsawasdi, R.; Yucharoen, M.; et al. Vertical motion of Phuket Island (1994–2018) due to the Sumatra-Andaman mega-thrust earthquake cycle: Impact on sea-level and consequences for coral reefs. Mar. Geol. 2019, 414, 92–102. [Google Scholar] [CrossRef]
  3. Kowalczyk, K.; Pajak, K.; Wieczorek, B.; Naumowicz, B. An Analysis of Vertical Crustal Movements along the European Coast from Satellite Altimetry, Tide Gauge, GNSS and Radar Interferometry. Remote Sens. 2021, 13, 2173. [Google Scholar] [CrossRef]
  4. Klos, A.; Kusche, J.; Fenoglio-Marc, L.; Bos, M.S.; Bogusz, J. Introducing a vertical land motion model for improving estimates of sea level rates derived from tide gauge records affected by earthquakes. GPS Solut. 2019, 23, 102. [Google Scholar] [CrossRef] [Green Version]
  5. Harvey, T.C.; Hamlington, B.D.; Frederikse, T.; Nerem, R.S.; Piecuch, C.G.; Hammond, W.C.; Blewitt, G.; Thompson, P.R.; Bekaert, D.P.S.; Landerer, F.W.; et al. Ocean mass, sterodynamic effects, and vertical land motion largely explain US coast relative sea level rise. Commun. Earth Environ. 2021, 2, 233. [Google Scholar] [CrossRef]
  6. Bird, P. An updated digital model of plate boundaries. Geochem. Geophys. Geosyst. 2003, 4, 1027. [Google Scholar] [CrossRef]
  7. Argus, D.F.; Gordon, R.G.; DeMets, C. Geologically current motion of 56 plates relative to the no-net-rotation reference frame. Geochem. Geophys. Geosyst. 2011, 12, Q11001. [Google Scholar] [CrossRef] [Green Version]
  8. Mustafar, M.A.; Simons, W.J.F.; Tongkul, F.; Satirapod, C.; Omar, K.M.; Visser, P.N.A.M. Quantifying deformation in North Borneo with GPS. J. Geod. 2017, 91, 1241–1259. [Google Scholar] [CrossRef] [Green Version]
  9. Hamilton, W.B. Tectonics of the Indonesian Region; USGS: Washington, DC, USA, 1979.
  10. Wilson, P.; Rais, J.; Reigber, C.; Reinhart, E.; Ambrosius, B.A.C.; Le Pichon, X.; Kasser, M.; Suharto, P.; Majid, D.A.; Yaakub, D.; et al. Study provides data on active plate tectonics in southeast Asia region. EOS Trans. Am. Geophys. Union 1998, 79, 545. [Google Scholar] [CrossRef]
  11. Simons, W.J.F.; Socquet, A.; Vigny, C.; Ambrosius, B.A.C.; Haji Abu, S.; Promthong, C.; Subarya, C.; Sarsito, D.A.; Matheussen, S.; Morgan, P.; et al. A decade of GPS in Southeast Asia: Resolving Sundaland motion and boundaries. J. Geophys. Res. 2007, 112, B06420. [Google Scholar] [CrossRef]
  12. Vigny, C.; Simons, W.J.F.; Abu, S.; Bamphenyu, R.; Satirapod, C.; Choosakul, N.; Subarya, C.; Socquet, A.; Omar, K.; Abidin, H.Z.; et al. Insight into the 2004 Sumatra–Andaman earthquake from GPS measurements in southeast Asia. Nature 2005, 436, 201–206. [Google Scholar] [CrossRef] [PubMed]
  13. Philibosian, B.; Meltzner, A.J. Segmentation and supercycles: A catalog of earthquake rupture patterns from the Sumatran Sunda Megathrust and other well-studied faults worldwide. Quat. Sci. Rev. 2020, 241, 106390. [Google Scholar] [CrossRef]
  14. Satirapod, C.; Trisirisatayawong, I.; Fleitout, L.; Garaud, J.D.; Simons, W.J.F. Vertical motions in Thailand after the 2004 Sumatra–Andaman Earthquake from GPS observations and its geophysical modelling. Adv. Space Res. 2013, 51, 1565–1571. [Google Scholar] [CrossRef]
  15. Satirapod, C.; Simons, W.; Promthong, C.; Yousamran, S.; Trisirisatayawong, I. Deformation of Thailand as Detected by GPS Measurements due to the December 26th, 2004 Mega-Thrust Earthquake. Surv. Rev. 2007, 39, 109–115. [Google Scholar] [CrossRef]
  16. Jet Propulsion, L. GNSS-Inferred Positioning System and Orbit Analysis Simulation Software (GIPSY-OASIS). Available online: https://gipsy-oasis.jpl.nasa.gov (accessed on 1 August 2022).
  17. Rebischung, P.; Schmid, R. IGS14/igs14.atx: A New Framework for the IGS Products; American Geophysical Union: Washington, DC, USA, 2016. [Google Scholar]
  18. Altamimi, Z.; Rebischung, P.; Métivier, L.; Collilieux, X. ITRF2014: A new release of the International Terrestrial Reference Frame modeling nonlinear station motions. J. Geophys. Res. Solid Earth 2016, 121, 6109–6131. [Google Scholar] [CrossRef] [Green Version]
  19. Zumberge, J.F.; Heflin, M.B.; Jefferson, D.C.; Watkins, M.M.; Webb, F.H. Precise point positioning for the efficient and robust analysis of GPS data from large networks. J. Geophys. Res. Solid Earth 1997, 102, 5005–5017. [Google Scholar] [CrossRef] [Green Version]
  20. Blewitt, G.; Lavallée, D. Effect of annual signals on geodetic velocity. J. Geophys. Res. Solid Earth 2002, 107, ETG9–ETG11. [Google Scholar] [CrossRef] [Green Version]
  21. Nazaruddin, D.A.; Duerrast, H. 2012 Earthquake Swarm in Phuket, Southern Thailand. Chiang Mai J. Sci. 2021, 48, 648–663. [Google Scholar]
  22. Mazzotti, S.; Jones, C.; Thomson, R.E. Relative and absolute sea level rise in western Canada and northwestern United States from a combined tide gauge-GPS analysis. J. Geophys. Res. 2008, 113, C11019. [Google Scholar] [CrossRef] [Green Version]
  23. Ballu, V.; Bouin, M.-N.; Siméoni, P.; Crawford, W.C.; Calmant, S.; Boré, J.-M.; Kanas, T.; Pelletier, B. Comparing the role of absolute sea-level rise and vertical tectonic motions in coastal flooding, Torres Islands (Vanuatu). Proc. Natl. Acad. Sci. USA 2011, 108, 13019–13022. [Google Scholar] [CrossRef] [Green Version]
  24. Trisirisatayawong, I.; Naeije, M.; Simons, W.; Fenoglio-Marc, L. Sea level change in the Gulf of Thailand from GPS-corrected tide gauge data and multi-satellite altimetry. Glob. Planet. Chang. 2011, 76, 137–151. [Google Scholar] [CrossRef]
  25. Wöppelmann, G.; Marcos, M. Vertical land motion as a key to understanding sea level change and variability. Rev. Geophys. 2016, 54, 64–92. [Google Scholar] [CrossRef] [Green Version]
  26. Scharroo, R.; Leuliette, E.; Lillibridge, J.; Byrne, D.; Naeije, M.; Mitchum, G. RADS: Consistent Multi-Mission Products. In Proceedings of the 20 Years of Progress in Radar Altimetry Symposium, Venice, Italy, 24–29 September 2012; p. 69. [Google Scholar]
  27. Cheng, Y.; Hamlington, B.D.; Plag, H.-P.; Xu, Q. Influence of ENSO on the variation of annual sea level cycle in the South China Sea. Ocean. Eng. 2016, 126, 343–352. [Google Scholar] [CrossRef]
  28. Intergovernmental Oceanographic Commission. The Global Sea-Level Observing System (GLOSS): Implementation Plan, 2012; IOC Technical Series No. 100; UNESCO/IOC: Paris, France, 2012; p. 41. [Google Scholar]
  29. Holgate, S.J.; Matthews, A.; Woodworth, P.L.; Rickards, L.J.; Tamisiea, M.E.; Bradshaw, E.; Foden, P.R.; Gordon, K.M.; Jevrejeva, S.; Pugh, J. New Data Systems and Products at the Permanent Service for Mean Sea Level. J. Coast. Res. 2013, 29, 493–504. [Google Scholar] [CrossRef]
  30. Webster, P.J.; Moore, A.M.; Loschnigg, J.P.; Leben, R.R. Coupled ocean–atmosphere dynamics in the Indian Ocean during 1997–98. Nature 1999, 401, 356–360. [Google Scholar] [CrossRef] [PubMed]
  31. Saji, N.H.; Goswami, B.N.; Vinayachandran, P.N.; Yamagata, T. A dipole mode in the tropical Indian Ocean. Nature 1999, 401, 360–363. [Google Scholar] [CrossRef]
  32. Brown, B.E.; Dunne, R.P.; Somerfield, P.J.; Edwards, A.J.; Simons, W.J.F.; Phongsuwan, N.; Putchim, L.; Anderson, L.; Naeije, M.C. Long-term impacts of rising sea temperature and sea level on shallow water coral communities over a ~40 year period. Sci. Rep. 2019, 9, 8826. [Google Scholar] [CrossRef] [Green Version]
  33. Moreley, C.K.; Charusiri, P.; Watkinson, I.M. Structural geology of Thailand during the Cenozoic. In The Geology of Thailand; Ridd, M.F., Barber, A.J., Crow, M.J., Eds.; The Geological Society of London: London, UK, 2011; pp. 273–334. [Google Scholar]
  34. Pongpiachan, S.; Settacharnwit, T.; Chalangsut, P.; Hirunyatrakul, P.; Kittikoon, I. Impacts and preventative measures against flooding and coastal erosion in Thailand. WIT Trans. Ecol. Environ. 2012, 159, 155–166. [Google Scholar]
  35. Thepsiriamnuay, H.; Pumijumnong, N. Modelling Assessment of Sandy Beaches Erosion in Thailand. Environ. Nat. Resour. J. 2019, 17, 71–86. [Google Scholar] [CrossRef] [Green Version]
  36. Ritphring, S.; Nidhinarangkoon, P.; Udo, K.; Shirakawa, H. The Comparative Study of Adaptation Measure to Sea Level Rise in Thailand. J. Mar. Sci. Eng. 2021, 9, 588. [Google Scholar] [CrossRef]
Figure 1. Left panel: locations of the PMBC and additional (TUDelft/IGS) GNSS stations CUSV, MKNB, and NTUS used in the GPS data analysis (in red) along with the estimated absolute and relative velocities (respectively in yellow and red and in cm/yr) of plates and main blocks surrounding the Sundaland (SU) plate. The approximate plate boundaries (blue lines) are based on Bird [6]. The relative velocities with respect to SU, given at selected locations, were calculated from Morvel56-NNR [7]. The absolute velocities (IGS08/ITRF2008) are based on the SU motion from Mustafar et al. [8] (~3 cm/yr in ESE direction) and the Morvel56-NNR relative to SU plate vectors relative to Sundaland. The major sources of geophysical processes on SU are the converging motions of the Australian, Indian and Philippine Sea plates and its interaction with smaller tectonic blocks (Burma (BU), Banda Sea (BS), Molucca Sea (MS), Timor (TI) and Birds Head (BH)). Along the Philippine trench, the biggest relative motions of up to 10 cm/yr occur. Figure modified from Mustafar et al. [8]. Right panel: locations of the three scientific GNSS points (PHUK (1994) at Promthep Cape) and continuous stations (PMBC (2017-present) at Cape Panwa and KTPH (2019-present) at Koh Taphao Noi Island) in the south of Phuket Island. The KTPH GPS station is co-located with the KTN tide gauge, while the PHUK GPS point has been regularly surveyed by RTSD (since 2000 at least yearly in cooperation with TU Delft). Thai script in the figure are the Thai names of each city/area.
Remotesensing 14 05145 g001
Figure 2. Station position time series (weekly averaged/2017–2021/IGS14) and linear velocity estimates for the stations PMBC and KTPH in Phuket, Thailand. Shown are the velocities in N (latitude), E (longitude) and U (vertical) directions. The time span is 3.3 to 4.1 yr, and position/velocity uncertainties are 1-sigma (68% confidence level) values. The two points for KTPH in 2018 come from two campaign-style observations (using a tripod) prior to installation of the continuous station, whereby the first vertical position solution was marked as an outlier.
Remotesensing 14 05145 g002
Figure 3. Updated (from Simons et al. [2]) combined station GPS (weekly averaged) position time series (1994–2021) for Phuket Island in IGS14. For each direction (N (latitude), E (longitude) and U (vertical)) the inter-seismic (1994–2004) velocity estimates and trend line are shown in blue. The time reference point was everywhere set to 25/12/2004, the last day before the Mw 9.2 earthquake. The orange dots mark the position solutions from the yearly PHUK (3–7 days) GPS point surveys. The PHUK point is also the reference benchmark for the Phuket Island time series. Uncertainties of both the trend estimates and positions are given as 1-sigma standard deviations (SD). Green vertical lines mark the 2004, 2005 and 2012 earthquakes, originating from the Sumatra Trench, which each resulted in significant horizontal co-seismic displacements of Phuket Island. The vertical red line and arrow indicate the part of the time series that has been updated, which also includes one more re-survey of the PHUK GPS point.
Remotesensing 14 05145 g003
Figure 4. KTPH–PMBC 3D baseline changes. Shown are the baseline offsets that follow from subsequent weekly averaged positions differences (in IGS14) between stations KTPH and PMBC. The KTPH–PMBC baseline length was averaged over the first 12-month period (August 2019–August 2021), during which the new continuous GNSS station KTPH was operational at the KTN tide gauge. The weekly baseline offsets (KTPH position minus PMBC position) are shown in yellow, green and red for, respectively, the north (latitude), east (longitude) (on right Y-axis) and vertical (Up) (on left Y-axis) position directions, along with their uncertainties (based on the WRMS of the weekly averaged position for stations PMBC and KTPH).
Remotesensing 14 05145 g004
Figure 5. Regional map of (absolute) sea-level trend from multi-satellite altimetry spanning the period 1992 up to and including 2020. We simultaneously fitted a linear trend, a bias and periodic cycles (annual and semi-annual) to the monthly gridded-altimeter SLAs at each grid point. The zoomed inset shows the sea-level trends in the study region in the south of Thailand, along with the HDRTN (red dot) and TMD (black triangle) TG locations. The SALT trend estimates at all these TG locations (e.g., for the Koh Taphao Noi (KTN) tide gauge given by the red dot at 7.834°N/98.422°E) were obtained similarly by applying the fit to the interpolated location in the monthly grids, providing a good match with the map values.
Remotesensing 14 05145 g005
Figure 6. Top to bottom, at KTN tide-gauge station (Phuket) (Y-axis in cm, X-axis in years), (a) the absolute sea-level (SLA) from altimetry (1992–2020), (b) the relative sea-level heights from the tide gauge (1980–2020), and (c) VLM as measured by GNSS (1994–2020) which is fitted with a seasonal cycle [20]. This seasonal cycle was estimated along with linear and non-linear functions. The green dotted line in the vertical position time series gives the sea-level change trend as estimated from satellite altimetry (SALT). The vertical height reference point was set at the time of the Mw 9.2 earthquake (26/12/2004) as it initiated significant (post-seismic) changes in the vertical position. In all plots, the solid blue lines before 2005 indicate the linear part (trend), which was obtained by a robust fit of a parametric model consisting of bias, trend and annual and semi-annual periodic signals. Directly after the earthquake (after 2005), the trend is replaced with an exponential decay for TG RSL (b) and GNSS VLM (c). For the fit we applied a 3σ outlier criterion to filter out extremes like in 1997 the low sea-level event in the Indian Ocean caused by the Indian Ocean Dipole (IOD). Results have not been corrected for GIA, since its effect is small anyways but also will cancel in all the mutual comparisons between GPS, TG, and SALT.
Remotesensing 14 05145 g006
Figure 7. Top to bottom, the model fits for GPS (VLM), TG (RSL) and SALT (ASL) data at KTN tide-gauge station. They have been plotted in red, green, and blue, respectively. The black lines follow from the synthesized result for VLM (SALT-TG), RSL (SALT-GPS) and ASL (TG plus GPS). It shows the perfect fit up to the time of the Mw 9.2 earthquake (26/12/2004) and a similar but slightly growing deviation after. The vertical axis unit is cm, and the horizontal axis is time in years.
Remotesensing 14 05145 g007
Figure 8. The relative sea-level changes recorded by the TMD TG stations (1980–2020) in the south of Thailand (Y-axis in cm, X-axis in years). Trends are indicated by the blue lines and have been estimated by a robust fit of a parametric model consisting of bias, trend, and annual and semi-annual periodic signals. In addition, here a distinction is made for the tide-gauge data following the Mw 9.2 Sumatra−Andaman earthquake (26/12/2004), where in addition to a linear trend an exponential decay is estimated. Use was made of an outlier criterion of >3σ to filter out extreme coupled ocean−atmosphere dynamics like the 1997 IOD extreme low sea-level event in the Indian Ocean. Results have not been corrected for GIA since its effect in SE Asia is quite small (<0.2 mm/yr), constant over the data time span, and vanishes when TG is subtracted from SALT to get VLM.
Remotesensing 14 05145 g008
Table 1. Linear trend velocity estimates (2017–2021) in the IGS14/ITRF14 global reference frame for the six continuous GNSS stations in Thailand (4), Singapore (1) and eastern Malaysia (1). Shown are (in the N, E and Up directions) the velocity estimates and standard deviations (1-sigma/68% confidence level).
GNSS StationVelocity Estimates (2017–2021/IGS14) mm/yr
North (Latitude)East (Longitude)Up
(Vertical)
KTPH (Phuket, Thailand)−10.6 ± 0.214.8 ± 0.3−0.7 ± 0.5
PMBC (Phuket, Thailand)−11.4 ± 0.112.6 ± 0.2−0.8 ± 0.5
SPKN (Bangkok, Thailand)−9.4 ± 0.125.0 ± 0.2−1.5 ± 0.6
CUSV (IGS, Bangkok, Thailand)−9.6 ± 0.224.9 ± 0.2−2.2 ± 0.7
MKNB (Sabah, East Malaysia)−10.6 ± 0.126.0 ± 0.20.2 ± 0.5
NTUS (IGS, Singapore)−5.6 ± 0.126.8 ± 0.2−0.8 ± 0.5
Table 2. Parameterization summary of the different sources and time periods that was applied to infer reliable trend estimates. The exponential decay function employs an exponential time constant τ of 40 years, corresponding to a half-life of approx. 28 years. This provided a good fit with the VLM given by the GNSS data.
Estimated SignalsBefore the EarthquakeAfter the EarthquakeThroughout the Whole Period the Same
Altimetry SLA (SALT)--Bias, trend, annual and semi-annual period (6 parameters)
Tide gauge water level (TG)Bias and trend
(2 parameters)
Exponential decay
(1 parameter)
Annual and semi-annual period
(4 parameters)
Vertical Land Motion (GNSS)Bias and trend
(2 parameters)
Exponential decay
(1 parameter)
Annual (seasonal) period
(2 parameters)
Table 3. Summary of the model fits through the SALT, TG and GNSS data. First column gives the trend in mm/yr before 2005, the 2nd column the annual cycle (amplitude in cm and phase in days after 1 January), the 3rd column the semi-annual cycle (again amplitude and phase), 4th column the amplitude of the exponential decay after 2005 in cm and the 5th column the residual RMS after the fit (in cm).
Trend < 2005 (mm/yr)Annual Cycle (cm and Days)Semi-Annual (cm–Days)Expon > 2005 (cm)Sigma
(cm)
SALT (ASL)3.32 ± 0.447.23 & 2326.84 & 161-6.22
TG (RSL)0.95 ± 0.667.30 & 2246.81 & 160−275 ± 4.08.94
GNSS (VLM)2.35 ± 0.210.50 & 12-131 ± 0.11.42
Publisher’s Note: MDPI stays neutral with regard to jurisdictional claims in published maps and institutional affiliations.