Article

Analyses of the Impact of Soil Conditions and Soil Degradation on Vegetation Vitality and Crop Productivity Based on Airborne Hyperspectral VNIR–SWIR–TIR Data in a Semi-Arid Rainfed Agricultural Area (Camarena, Central Spain)

1
Helmholtz Center, Potsdam GFZ German Research Centre for Geosciences, 14473 Potsdam, Germany
2
Centro de Investigaciones Energéticas, Medioambientes y Tecnológicas, CIEMAT, 28040 Madrid, Spain
3
Institute of Soil Science, Leibniz University Hannover, 30419 Hannover, Germany
4
Área de Sistemas de Teledetección, INTA, 28850 Torrejón de Ardoz, Spain
5
Department of Desertification and Geoecology, Estación Experimental de Zonas Áridas, EEZA, 04120 Almería, Spain
6
Department of Geography and Human Environment, Tel Aviv University, Tel Aviv 69978, Israel
*
Author to whom correspondence should be addressed.
Remote Sens. 2022, 14(20), 5131; https://doi.org/10.3390/rs14205131
Submission received: 31 August 2022 / Revised: 7 October 2022 / Accepted: 9 October 2022 / Published: 14 October 2022
(This article belongs to the Special Issue Imaging Spectroscopy for Soil and Land Degradation Mapping)

Abstract

:
Soils are an essential factor contributing to the agricultural production of rainfed crops such as barley and triticale cereals. Changing environmental conditions and inadequate land management are endangering soil quality and productivity and, in turn, crop quality and productivity are affected. Advances in hyperspectral remote sensing are of great use for the spatial characterization and monitoring of the soil degradation status, as well as its impact on crop growth and agricultural productivity. In this study, hyperspectral airborne data covering the visible, near-infrared, short-wave infrared, and thermal infrared (VNIR–SWIR–TIR, 0.4–12 µm) were acquired in a Mediterranean agricultural area of central Spain and used to analyze the spatial differences in vegetation vitality and grain yield in relation to the soil degradation status. Specifically, leaf area index (LAI), crop water stress index (CWSI), and the biomass of the crop yield are derived from the remote sensing data and discussed regarding their spatial differences and relationship to a classification of erosion and accumulation stages (SEAS) based on previous remote sensing analyses during bare soil conditions. LAI and harvested crop biomass yield could be well estimated by PLS regression based on the hyperspectral and in situ reference data (R2 of 0.83, r of 0.91, and an RMSE of 0.2 m2 m−2 for LAI and an R2 of 0.85, r of 0.92, and an RMSE of 0.48 t ha−1 for grain yield). In addition, the soil erosion and accumulation stages (SEAS) were successfully predicted based on the canopy spectral signal of vegetated crop fields using a random forest machine learning approach. Overall accuracy was achieved above 71% by combining the VNIR–SWIR–TIR canopy reflectance and emissivity of the growing season with topographic information after reducing the redundancy in the spectral dataset. The results show that the estimated crop traits are spatially related to the soil’s degradation status, with shallow and highly eroded soils, as well as sandy accumulation zones being associated with areas of low LAI, crop yield, and high crop water stress. Overall, the results of this study illustrate the enormous potential of imaging spectroscopy for a combined analysis of the plant-soil system in the frame of land and soil degradation monitoring.

1. Introduction

Soils and vegetation have crucial functions in many Earth system processes, including carbon and water cycling, biogeochemistry, food production, and climate regulation [1]. Plants provide humans with a wide range of important goods and services, whereas healthy soils provide the basis for plant growth. However, the increase in soil degradation severely threatens the soil–plant system and has been recognised as a major threat to food security [2], with soil erosion as one of the main drivers of soil degradation across the globe [3,4]. Soil erosion has also been reported to intensify mainly due to the effects of climate change and land-use and management practices, resulting in a major threat to soil conditions and ecosystem resilience [5,6]. The sustainable use of natural resources, such as soil, is an important part of the UN Sustainable Development Goals (SDGs) to promote the sustainable use of terrestrial ecosystems [7]. In light of this challenging context, there is a strong requirement for monitoring and understanding the crop response to soil degradation in order to assess the impact on the global food system and adapt agriculture management accordingly to prevent negative impacts on soil resources and support sustainable food production. Especially soils in the Mediterranean region, with their long history of intense cultivation and a unique combination of relief, parent material, and climate conditions, have soil loss rates that drastically exceed new soil formation [8,9]. In these sensitive regions prone to soil erosion, there is a call for a systematic assessment and monitoring of soil and crop conditions to adapt land management practices and preserve soil fertility and subsequent crop productivity.
Remote sensing appears to be an essential tool to respond to these mapping and monitoring requirements as it offers a powerful alternative to traditional methods. It can provide a rapid, consistent, repeatable, non-destructive, and objective sampling method to assess the status of soil properties and plant traits based on the optical properties of the land surface [10,11]. Especially imaging spectroscopy or hyperspectral remote sensing in the visible-near and short-wave infrared spectral regions (VNIR–SWIR 0.4–2.5 μm) is well known for its potential to monitor the Earth’s surface accurately and provide valuable information for a better understanding of environmental processes and soil–plant interactions [12,13,14]. Established applications of imaging spectroscopy include the estimation of a wide range of vegetation physiological traits [15,16,17,18], soil properties [19,20], as well as analysis of soil conditions linked to erosion and degradation processes [21,22,23,24]. While hyperspectral remote sensing has been successfully applied in a wide range of agricultural applications, previous studies have mainly focused on either the estimation of crop biochemical and biophysical properties or the investigation of soil status. For a comprehensive evaluation of crop growth-limiting factors and to improve the understanding of the inter-relationship between the bio- and pedosphere, it is important to integrate both the soil and the plant characteristics in the remote sensing assessment [25]. In the past, only a few studies provided a combined remote sensing approach to vegetation and soil degradation assessment [26]. For example, Hill and Schütt (2000) [27] applied concepts taken from pedology and geomorphology to assess land degradation in addition to the vegetation status of Mediterranean ecosystems. In an agricultural setting, Yuzugullu et al. (2020) [28] compared the variability of crop fields to soil management zones defined by differences in soil properties [28]. However, previous studies mostly rely on broadband remote sensing data and multispectral vegetation indices for the investigation of plant vitality, whereas the benefits of hyperspectral narrowband data for the estimation of biophysical properties for agricultural crops are well known [18,25] but not yet fully explored within the combined perspective of soil degradation and crop productivity from field to regional scales [29]. Regarding the estimation of crop properties, the near-infrared (700 to 1100 nm) is a region of high reflectance with limited biochemical absorption. Most absorption in this region involves water (at 870 and 1240 nm) and compounds typical of plant biomass. The latter are primarily cellulose, lignin, and other structural carbohydrates that have broad, weak absorptions across the spectral region. Reflectance is dominated by multiple scattering of photons by the internal structure, air spaces, and air–water interfaces that refract light within the leaves [30]. The shortwave-infrared (1100 to 2500 nm) is another region of low reflectance and strong absorption, primarily by water in green leaves and dominated by the presence of carbon compounds such as cellulose and lignin in dry conditions [31]. In addition to the VNIR–SWIR spectral range, the thermal infrared (TIR) or long-wave infrared LWIR spectral region (8–13 µm) contains complementary information on plant physiology and the land surface temperature (LST) that can improve the analysis of plant and soil conditions linked to soil degradation. The LST is a key parameter for the physical description of the surface energy and water balance processes at the local to global scale [32], which affect the growth phase of crops and crop yields [33]. Therefore, LST can be used to detect water-stressed crops [34] or plant diseases [35], as well as to implement irrigation management strategies [36]. Studies have also shown that the TIR region is more sensitive to acute water stress of crops than the reflectance in VNIR–SWIR spectral range [37,38]. However, the reflective portion of the spectrum responds to plant water status when it produces a change in canopy structure, e.g., wilting or leaf rolling, and whenever there is chronic water stress, that slows growth, and reduces green leaf area [39].
In this frame, the main objective of this study was to assess the impact of soil conditions and soil degradation on vegetation vitality and crop productivity within a semi-arid agricultural environment by exploiting hyperspectral data covering the VNIR–SWIR, as well as the TIR spectral regions. First, we analyze and map the spatial variability of vegetation vitality and crop yield related to crop stress caused by soil degradation. The plant physiological parameters, such as the green leaf area, water stress, and resulting crop yield, are modeled from hyperspectral airborne remote sensing data and qualitatively compared to bare soil conditions classified as the Soil Erosion and Accumulation stages (SEAS) defined by Schmid et al. (2016) [22]. Additionally, the direct estimation of soil degradation stages based on the vegetation canopy spectral signal combined with derived parameters and surface morphology is tested with random forest (RF) non-linear machine learning models. Since soils are regularly covered by vegetation during the growing period, this approach allows for the assessment of soil quality during the growing stage. This combined analysis of the plant–soil system can be included in environmental monitoring concepts and has the potential for regional upscaling considering the recent and upcoming increase in hyperspectral satellite data with a high signal-to-noise ratio (e.g., PRISMA (PRecursore IperSpettrale della Missione Applicativa) [40], EnMAP (Environmental Mapping and Analysis Program) [41], as well as future large-scale mapping missions such as ESA CHIME (Copernicus Hyperspectral Imaging Mission for the Environment) [42] and NASA/JPL SBG (Surface Biology and Geology), that also covers the TIR spectral range [43]). Overall, the increase in available airborne and space-borne hyperspectral imagery is bringing new opportunities for the improved characterization and monitoring of crop fertility linked to soil health and soil quality in agriculture and ecological contexts [25].

2. Materials and Methods

The methodologies framework utilized in this study is divided into two major parts (Figure 1). In the first part, an airborne VNIR–SWIR–TIR dataset acquired in the late growing season was used in conjunction with the field measurements of crop field plots to spatially estimate the crop properties, such as the Leaf Area Index (LAI), Crop Water Stress Index (CWSI), and crop biomass. These spatially modeled plant physiological parameters were then compared to pre-defined soil degradation stages, such as the SEAS from Schmid et al. (2016) [22], to assess the impact of different soil degradation classes on crop vitality and yield. In the second part, the SEAS soil degradation classes were directly estimated based on the crop canopy spectral reflectance, thermal emissivity, and temperature using random forest (RF) non-linear machine learning models. The estimated plant physiological parameters, as well as several terrain parameters derived from a LiDAR digital surface model, were also included in the RF model to predict the SEAS classes and evaluate the impact of different remote sensing covariates on the prediction accuracy. To the authors’ knowledge, this methodological framework represents a novel approach for the assessments of soil quality during the growing stage.

2.1. Study Site

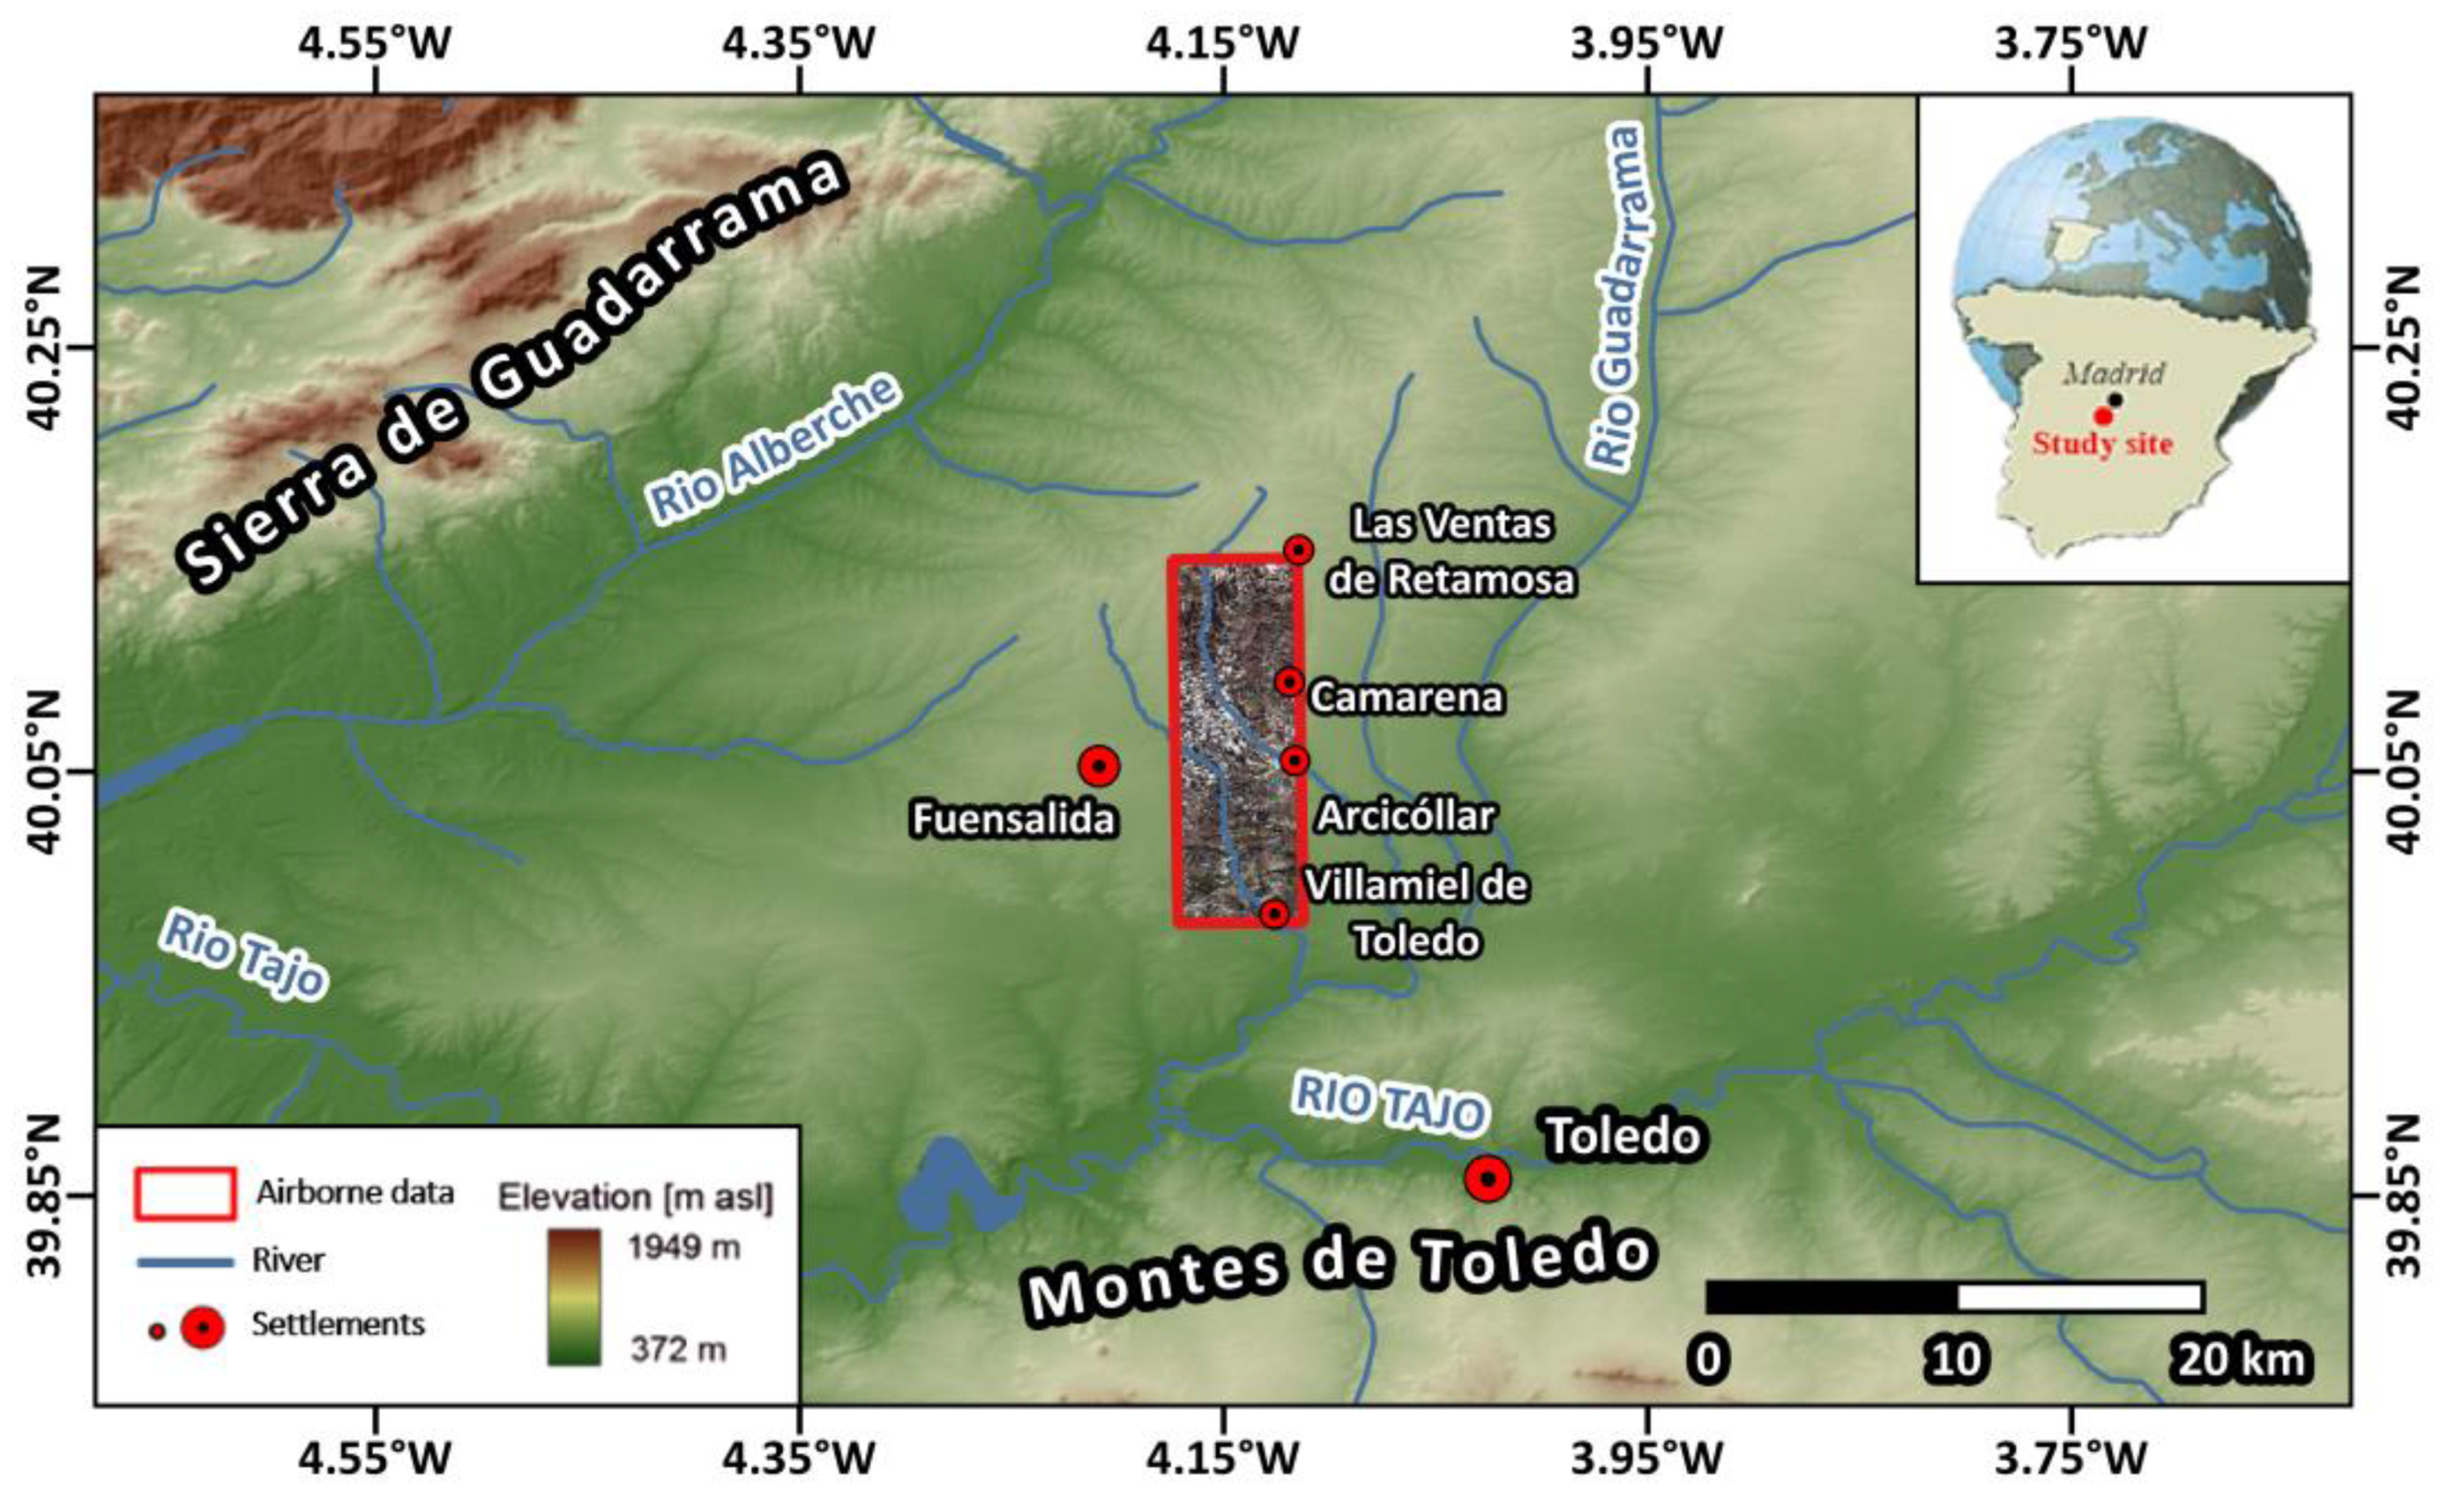
The study site (Figure 2) is located in Central Spain, close to the small town of Camarena in the province of Toledo within the Autonomous Community of Castilla-La Mancha, approximately 50 km Southwest of Madrid. Situated in the Upper Tajo River basin, the region corresponds to the Guadarrama river catchment. Delimited to the north by the Central System Mountain chain and to the south by the Toledo Mountains, the region corresponds to the western part of the Madrid Basin and is part of the South Iberian Meseta. The meteorological station of Las Ventas de Retamosa (Spanish National Network station 3282), situated in the northern limit of the study area, has registered an average monthly temperature in the range of 6.1–24.7 °C with an average annual temperature of 14.6 °C and an average monthly rainfall of 7–56 mm with an average yearly rainfall of 429 mm. The main cultivations grown are rainfed and include cereal crops, such as barley and triticale, grapevines, and olive groves, surrounded by abandoned areas that during the growing season are in fallow or with annual leguminous vegetation to improve the soil nutrients.
The lithological substrate was formed by Miocene arkoses (principally made up of feldspars, quartz, phyllosilicates, and calcite) and Quaternary sediments with geomorphological forms, such as glacis, terraces, and alluvial fans. These substrates and forms are associated with a gently undulating relief at altitudes between 500 and 640 m above sea level (a.s.l.). The dominant soils include Alfisols (Calcic Haploxeralfs, according to the US Soil Taxonomy [44], or Luvisols (Calcic Luvisols, according to the IUSS Working Group [45]).
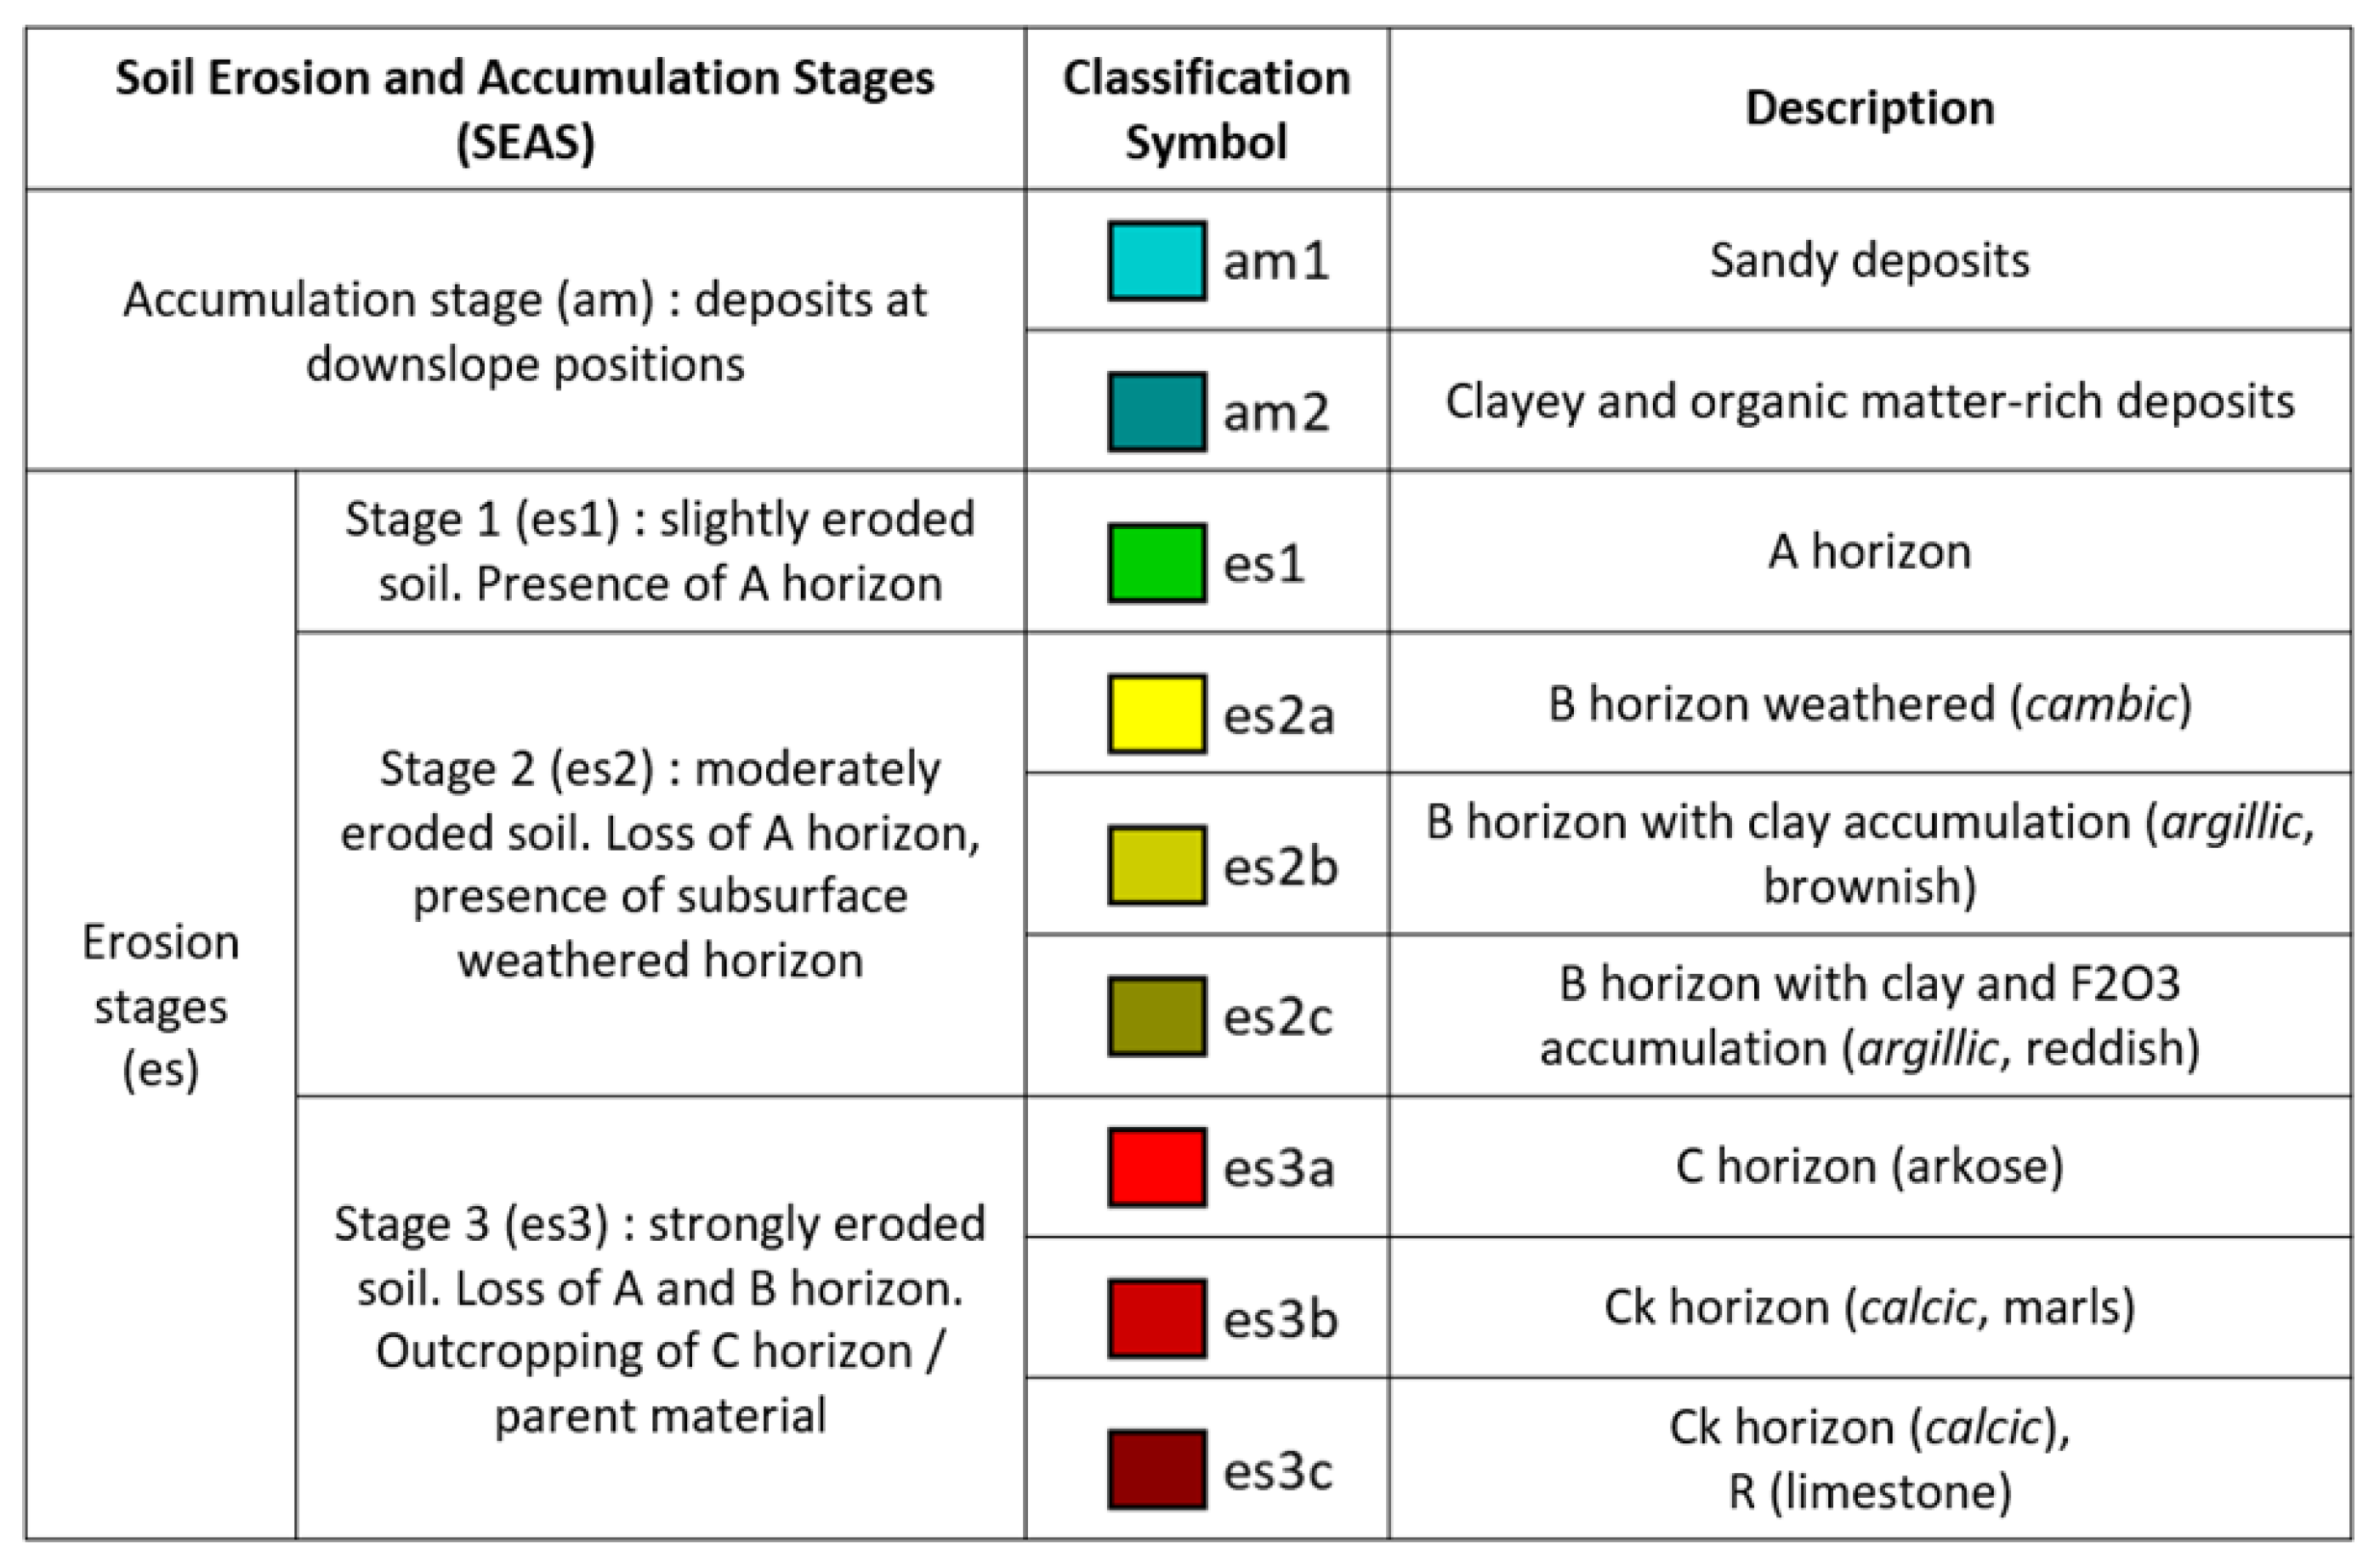
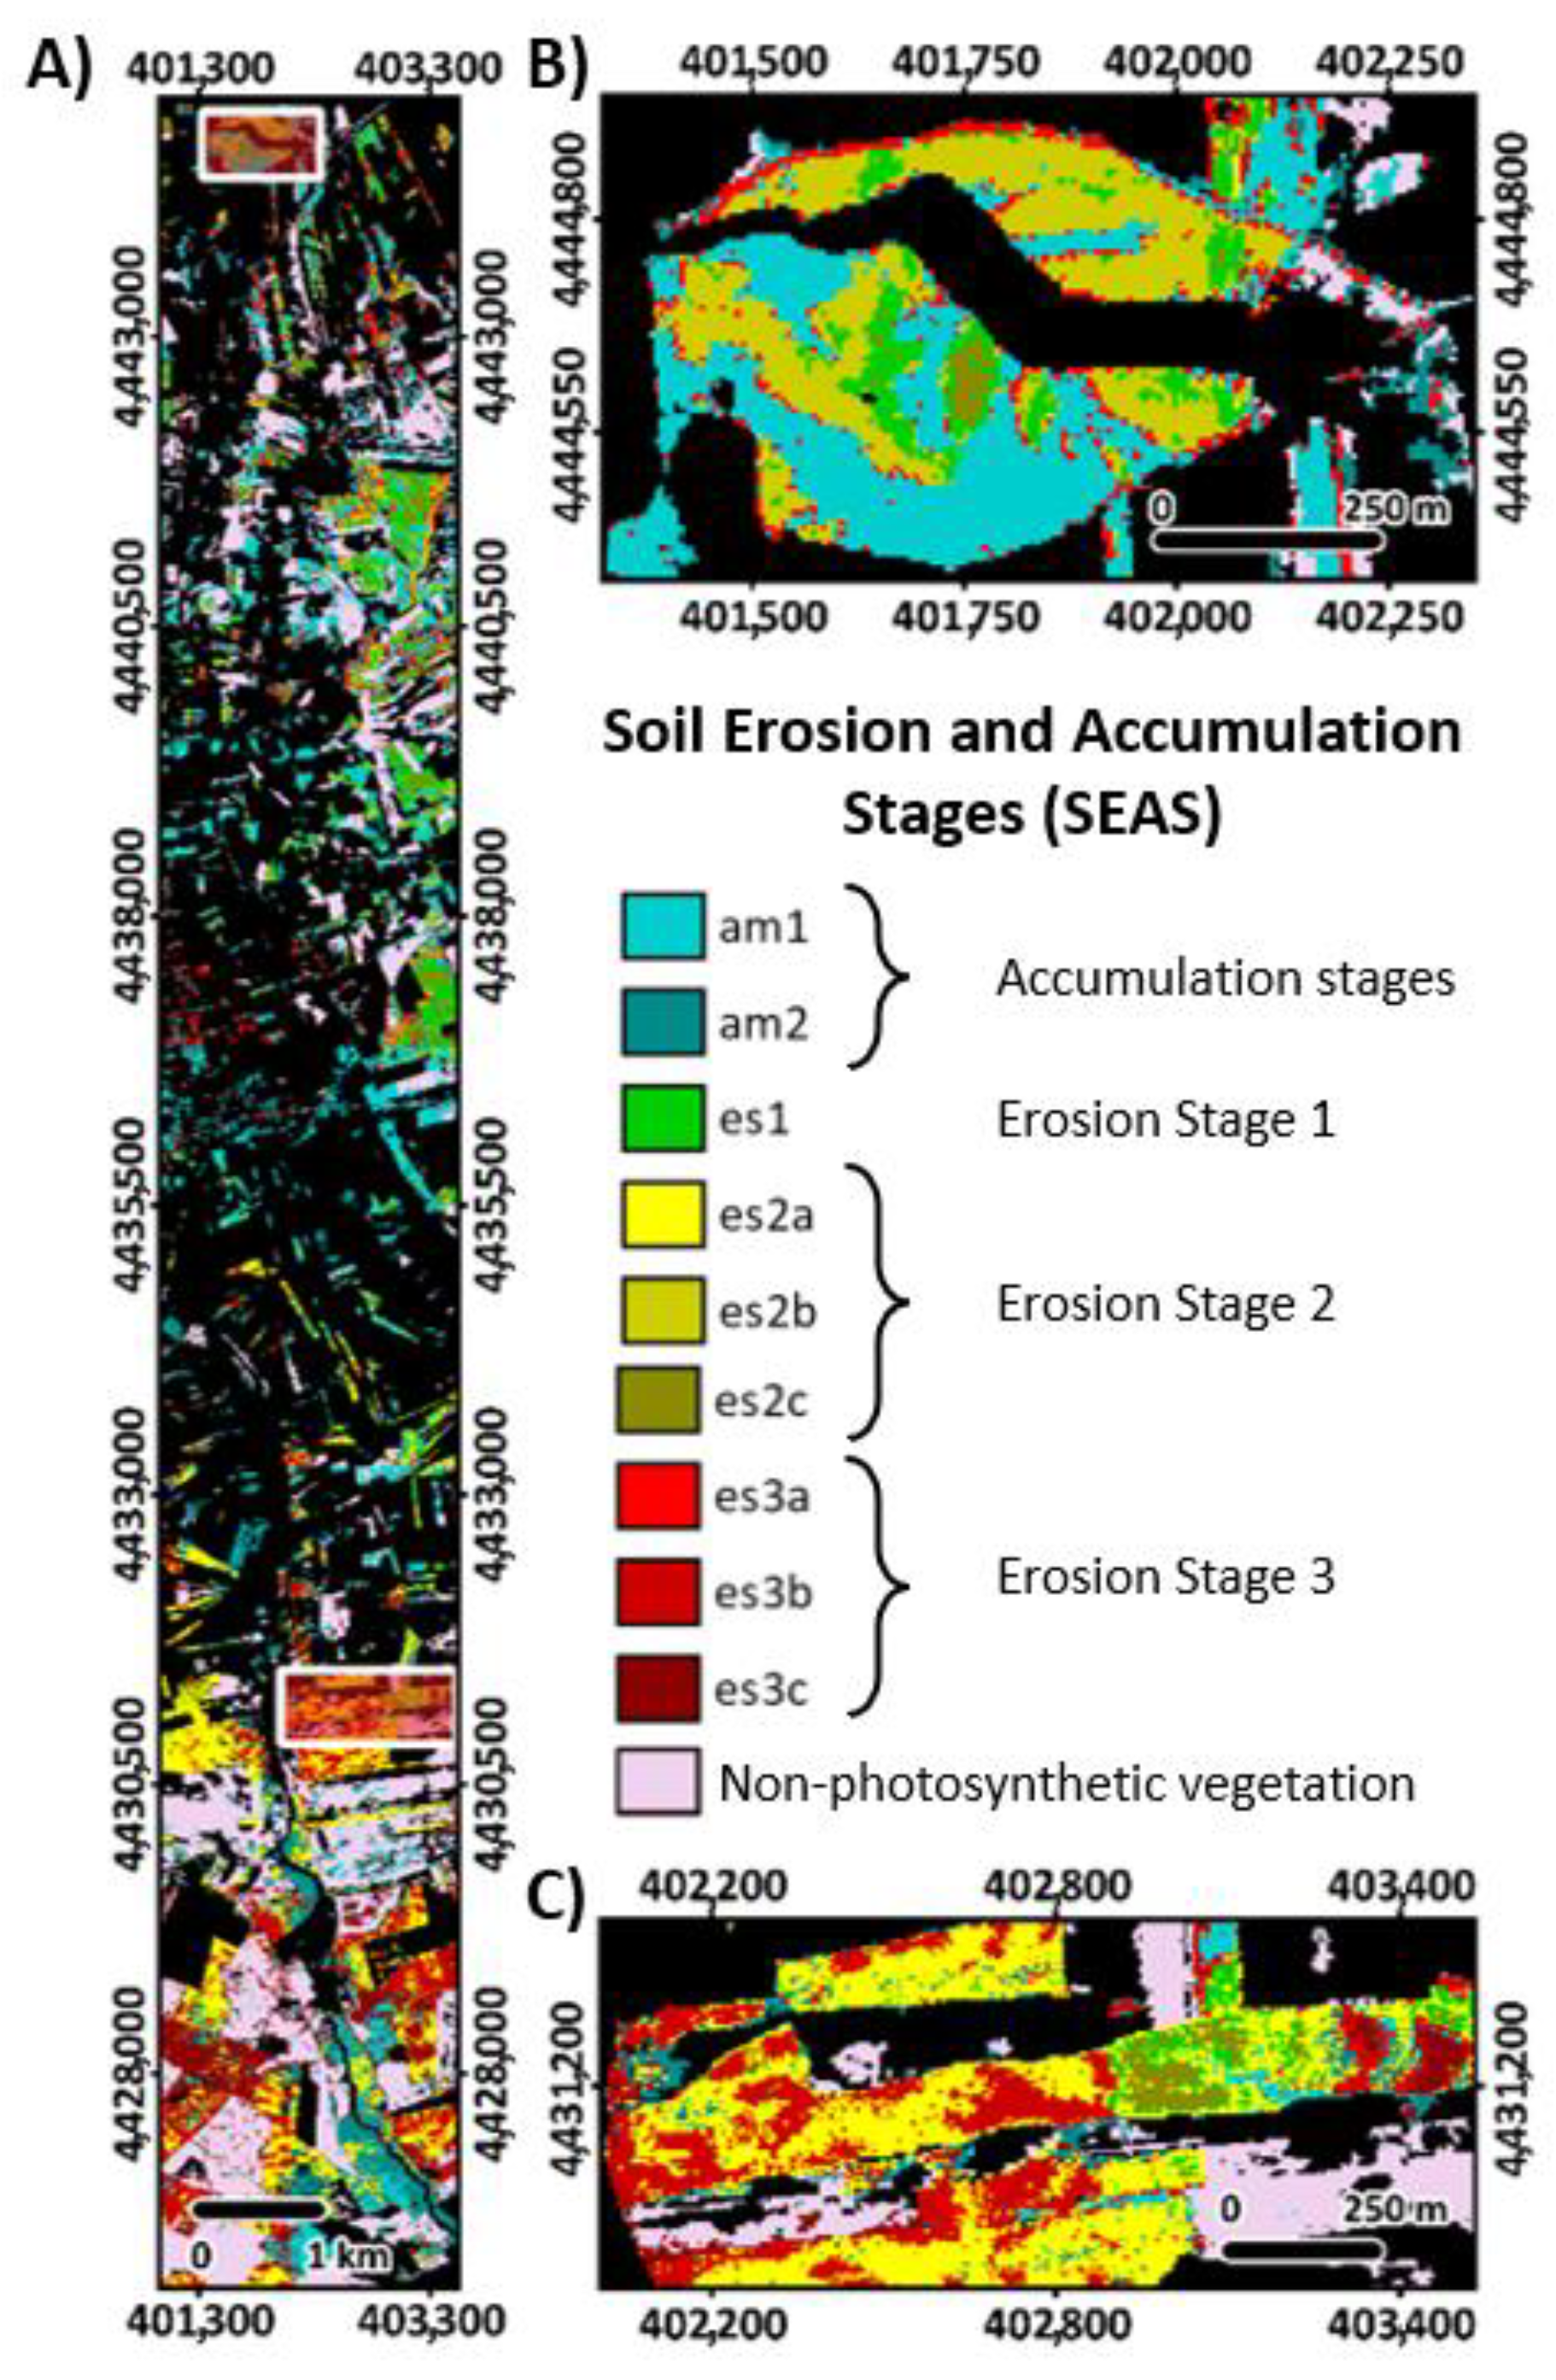
Erosion intensity and ploughing practices in the Camarena area determine the presence of different soil horizons appearing at the surface, with contrasting soil properties. The spatial mapping of the distribution of the soil degradation stages of the test site was performed based on the hyperspectral remote sensing approach associated with field observations and a classification-specific methodology [22]. In their study, Schmid et al. (2016) [22] used an airborne survey from August 2011, when the crop fields were fallow and, therefore, had mostly bare soil surfaces. Soil Erosion and Accumulation Stages (SEAS) have been defined (Figure 3) and established according to the soil properties of exposed agricultural fields and spatially mapped (Figure 4) [22]. The assumption for this classification is that increasing tillage-induced soil erosion brings about the progressive removal of soil horizons and the corresponding accumulation of soil materials at the slope bottoms [46]. Therefore, different stages of increasing erosion were identified with emerging A, Bt/Bw, or C/Ck horizons on the soil surface and the corresponding accumulation stage of soil materials at a downslope position following a conceptual model established by De Alba (2001) [47]. The soil horizons were identified according to their physical and chemical properties, such as color, pH, soil organic matter (SOM), texture, iron-oxides, clay minerals, as well as carbonate content and spectrally mapped using the airborne data in a support vector machine approach [22]. With these variable surface and erosion stages characteristics, the study site represents an excellent test case to assess the impact of soil degradation on vegetation growth, as well as agricultural productivity, and the potential for inverse prediction.

2.2. Airborne Data Acquisition and Processing

The hyperspectral airborne remote sensing data were acquired on the 7 May 2017 over the Camarena test site in the frame of the MASOMED (MApping SOil variability within rainfed MEDiterranean agroecosystems using hyperspectral data) campaign. The campaign resulted from a grant of the EU-FP7 European Facility for Airborne Research (EUFAR) Transnational Access Program that funded a joint field and flight campaign using a CASA 212-200 airplane operated by the Spanish National Institute of Aerospace Technology (Instituto Nacional de Técnica Aeroespacial-INTA). The hyperspectral data were acquired in tandem configuration with the Compact Airborne Spectrographic Imager 1500i (CASI-1500i) and the Airborne Hyperspectral Scanner (AHS) sensors around solar noon with sun elevations between 62° and 66° and under clear sky conditions at 2500 m altitude above ground resulting in a ground sampling distance (GSD) of 5 m for the AHS and 1 m for the CASI sensor. The CASI is a push-broom imaging spectrometer that records the incoming radiance along a spatial and spectral array, whereas the AHS is a whiskbroom system that uses a rotating mirror to direct the surface radiation to the sensor. The CASI-1500i sensor developed by ITRES (Canada) provides 1500 spatial across-track pixels with a Field of View of 40°. The instrument covers the VNIR spectral range of 380–1050 nm with 288 spectral bands and a bandwidth of about 3 nm (see Table 1). For this flight mission, the CASI data have been spectrally binned with a factor of 2 to increase SNR resulting in 144 final spectral bands.
The AHS sensor developed by ArgonST (USA) has 63 bands in the solar reflective part of the electromagnetic spectrum and an additional 10 bands in the thermal or longwave infrared spectral region. The distribution and the width of the spectral bands are different for each spectral subregion, and they are summarized in Table 2. In VNIR–SWIR, the instrument provides 750 pixels per scan line with a relatively large viewing angle of 90°.
For the VNIR and SWIR data, pre-processing to Level-2c (geocoded surface reflectance), including atmospheric correction and orthorectification, was performed by INTA in an operational workflow described in detail for the AHS [49] and CASI data [48]. The imagery of both sensors was geometrically corrected using the in-flight recorded Inertial Navigation System/Global Positioning System (INS/GPS) information and the orthorectification tool PARGE [50], including empirical boresight correction based on Ground Control Points (GCPs) and mosaicking of the flight lines into a single image. The atmospheric correction for both CASI and AHS was performed using ATCOR4, which is an LUT-based implementation of MODTRAN targeted for airborne remote sensing data [51]. Considering the study region and weather conditions, a rural aerosol type and a visibility of 40 km were assumed. The CASI data showed considerable residual “smile” with an average shift of about −1.9 nm (blueward) that was empirically corrected using the atmospheric absorption features. The processing of the AHS TIR data to geocoded surface temperature and surface emissivity was performed by INTA according to the workflow described in De Miguel et al. (2018) [52]. The thermal radiance of the AHS TIR bands was calibrated using two internal, temperature-controlled blackbodies with temperatures set to 10 °C and 45 °C, resulting in an estimated thermal noise below 0.2 °C. The atmospheric influence on the thermal radiance was empirically estimated and corrected based on water surfaces in the area with known emissivity close to a blackbody. The surface temperature was computed using ATCOR4 [51] by applying the constant emissivity approach, in which ε = 0.98 was assumed for the AHS band at 10.16 µm. Once the temperature was derived from the inversion of Planck’s law at this wavelength, the emissivity was estimated for the rest of the AHS bands.

2.3. Field Data Collection

The in situ data collection specifically focused on two regions of interest: the Santa Ursula (SU) field in the southern and the E1 and TS field plots in the northern part of the study area (Figure 5). These fields represent the two most prevailed agricultural exploited soil types of the study region and are characterized by variable top-soil horizons due to soil degradation and management practices. The sampling points on each field were selected along morphological gradients that are linked to erosional patterns in order to capture the variability of the field’s degradation status. The in situ data collection followed the sampling configuration, as described in detail by Schmid et al. (2016) [22]. For each sampling point, four sub-plots were acquired, which were arranged using a central point C and situating an N, SE, and SW sub-plot at a distance of 5 m (one AHS pixel) with an angle of 120° between the corresponding sub-plots. The field measurements of LAI of cereal crops and soil moisture were performed between the 7th and 9th of May 2017, as simultaneous as possible to the date of the hyperspectral data acquisition at selected crop fields. At the time of the data acquisition, the agricultural fields of interest were cultivated with barley and triticale crops, which were already in the advanced growth stage, the “heading” phase, with the head completely emerged, and in some cases, in an initial phase of ripening. At each sub-plot, the green leaves area index (LAI) was determined non-destructively by measuring the photosynthetically active radiation (PAR) simultaneously above and below the crop canopy using the AccuPAR LP-80 (METER Group, Inc., Pullman, WA, USA). For each sub-plot, three LAI measurements were collected and averaged, resulting in a total of 64 subplots, which were sampled across the SU, E1, and TS fields. Additionally, at each location, the volumetric soil moisture was measured using time-domain reflectometry (TDR) sensors with about 10 cm of penetration depth. For the direct measurement of crop biomass, the center of each sub-plot of the SU and E1 fields was marked and revisited after the grain crop was fully mature and harvested in a 1 × 1 m square, resulting in 40 subplots for the yield in situ data. After drying, the grain and straw were manually separated and weighed to determine the crop yield in t ha−1.

2.4. Remote Sensing Data Analysis

2.4.1. Modeling of Crop Properties

The biomass of the crop grain yield and LAI were estimated from the AHS VNIR–SWIR data using Partial Least Square Regression (PLSR) and the in situ LAI and grain yield data (n = 64 for LAI and n = 40 for grain yield). The higher resolution CASI VNIR data were also tested for the regression but led to significantly lower prediction accuracies. PLSR [53] is an established method for the determination of biophysical variables from hyperspectral remote sensing data with in situ data for calibration [54,55]. It utilizes and combines the approach of principal component analysis (PCA) and multiple linear regression analysis. The method finds the components (or latent variables) from the explanatory variables (spectra) that are most relevant for the response variables (LAI, grain yield) and reduces the dimensionality of the dataset [56]. In this study, the optimum number of components for each PLSR model was selected based on the minimum root mean square errors (RMSE) using the leave-one-out cross-validation method to avoid overfitting the model [57]. The performance of the prediction was evaluated by the coefficient of determination (R2), Pearson correlation coefficient®, the root mean squared error (RMSE), as well as bias based on the hold-out samples in leave-one-out validation:
R M S E = i = 1 n ( y p i y o i ) 2 / n ,
R 2 = 1 i = 1 n ( y p i y o i ) 2 / i = 1 n ( y o i y o ^ ) 2 ,
b i a s = i = 1 n ( y p i y o i ) / n ,
with y p i as the predicted and y o i as the observed values of sample i . y o ^ represents the mean of the observed values and n is the number of samples.
After modeling the LAI and grain yield for each pixel of the barley fields SU and E1, the results were grouped by the soil degradation status according to the SEAS classification. The statistical Kruskal–Wallis test was used to investigate whether the distribution of LAI and grain yield of each SEAS was significantly different from each other on a 95% significance level. The Kruskal–Wallis test is a non-parametric statistical test that assesses the differences among three or more independently sampled groups on a single, continuous variable [58]. It represents an extension of the Mann–Whitney test [59] for more than two groups and a continuous variable [60]. In contrast to the commonly used analysis of variance (ANOVA) test [61], the Kruskal–Wallis test is suitable for non-normally distributed variables, which applies to the LAI and grain yield distribution of the SEAS.

2.4.2. CWSI

Plant health and crop yield are highly dependent on an adequate supply of water. Following the inverse correlation between the crop canopy temperature and the leaf stomatal opening, the water stress in plants can be indirectly measured by temperature readings [62]. This relationship led to the definition of the crop water stress index (CWSI), which is the most frequently used method to quantify crop water stress based on canopy surface temperature for different crops and climatic conditions [63]. The CWSI is a normalized form of temperature difference relative to the maximum and minimum temperature boundary, whereas the maximum boundary represents the temperature of a non-transpiring leaf with the stomata completely closed, and the minimum boundary represents the temperature of well-watered plants with fully open stomata [64]. CWSI is defined as follows [65]:
C W S I = ( T C T a i r ) ( T w e t T a i r ) ( T d r y T a i r ) ( T w e t T a i r )
where T C is the canopy temperature, T w e t and T d r y are the respective minimum and maximum boundary temperature, and T a i r represents the air temperature. T a i r was extracted for the Camarena study site from hourly ECMWF ERA5 climate model data [66] for the time of the overflight. Following the empirical approach for CWSI estimation proposed by Krishna et al. (2019) [67], T w e t and T d r y were derived from the AHS TIR data using the lower and upper 5th percentile of the crop field pixel temperatures, respectively. This so-called “virtual” reference substitutes the use of natural or artificially watered and dry reference surfaces [68]. The approach was found to provide good estimations in the field of remote sensing applications, even outperforming other methods for estimations of CWSI [64,69]. In this study, we use the CWSI as a proxy for the assessment of crop water stress of the SU and E1 fields.

2.4.3. Prediction of SEAS Based on the Canopy Spectral Signal

The CASI and AHS data, as well as the auxiliary information, were evaluated in a random forest classification procedure for their potential to describe the underlying SEAS from the spectral response of the crop canopy during the growing season. Such a model, although site-specific, may help to infer the soil degradation stages without the need for bare soils remote sensing data acquisition, which are often difficult to acquire due to the limited time period of bare soil exposure in used agricultural fields. Random Forest (RF) is a decision-tree-based (non-linear) ensemble learning technique developed by Breiman (2001) [70]. The method is well established in the field of remote sensing both for regression and classification applications [71] and shows great potential for digital soil mapping [72,73] and diverse agricultural applications [74,75]. The basic idea of this supervised machine learning algorithm is the (random) resampling of training data into multiple (singular) regression trees. These regression trees build the so-called “forest” and are finally combined in a decision process to cast a vote on the final classification label, in this case, the degradation status for each pixel. The method can also handle the high dimensionality and multicollinearity of hyperspectral data and, furthermore, was found to be both fast and rather insensitive to model overfitting [71].
In this study, the training data for the RF model consisted of the bare soil classification of the SEAS (dependent variable) and a combination of the measured and derived remote sensing data of the vegetation canopy (independent variables). This remote sensing dataset was composed of the spectral data recorded by the CASI and AHS sensors covering the VNIR–SWIR–TIR spectral region, a LiDAR-based digital terrain model (DTM) derived-elevation parameters, such as the topographical derivates of slope, profile, and pan-curvature, as well as the additional parameters modeled in the previous section related to plant physiological conditions (e.g., LAI and CWSI). Spatially, the analysis was carried out on a 6 m regular spatial grid that corresponds to the pixel size of the original bare soil SEAS classification map of the study site [22]. All of the input datasets were resampled to 6 m GSD in order to match the spatial resolution of the dependent variable.
The areas included in the RF model were limited to the fields or image pixels that met the following conditions: (1) These areas had to feature bare soils in the 2011 hyperspectral imagery, and an estimate of erosion and accumulation stage had to be available [22]: (2) These areas were vegetated or semi-vegetated in the 2017 hyperspectral imagery. In the first step, the non-vegetated areas were filtered using a fixed NDVI threshold of 0.2, which usually is well below the 90th NDVI quantile of cropland during the growing season [76]. An NDVI threshold of 0.2 represents a common and rather strict threshold used to differentiate vegetation from bare soils in optical remote sensing analysis [77]. The filtering was followed by a final “clean-up” step that included the removal of minor patches smaller than 5 pixels (125 m2) using morphological filters in a clump and sieve approach and the manual removal of single pixels or small patches outside of crop fields. Finally, the filtered dataset was randomly divided into subsets that included 70% of the pixels (n = 88,696) for model training and 30% of the pixels (n = 38,012) for validation. In order to test the impact of using several remote sensing covariates on the classification accuracy, multiple models were trained, including a different subset of remote sensing data starting from the most basic to the more complex input data. First, only CASI VNIR hyperspectral information was used for training, then a combination of the CASI and AHS VNIR, SWIR, and TIR data were tested. In the next step, the morphological information from a LiDAR DSM was added, and finally, the spectrally derived parameters, such as LAI and CWSI, were added to the variable space. Furthermore, in an additional step, the effect of a reduction in the redundancy of spectral information was tested by applying minimum noise fraction transformation [78] and selecting the most relevant number of components before training the RF classifier. For each run of the RF model, 300 trees were created, and the performance was evaluated by determining the overall accuracy and error matrix using the 30% hold-out validation dataset.

3. Results

3.1. Field Data

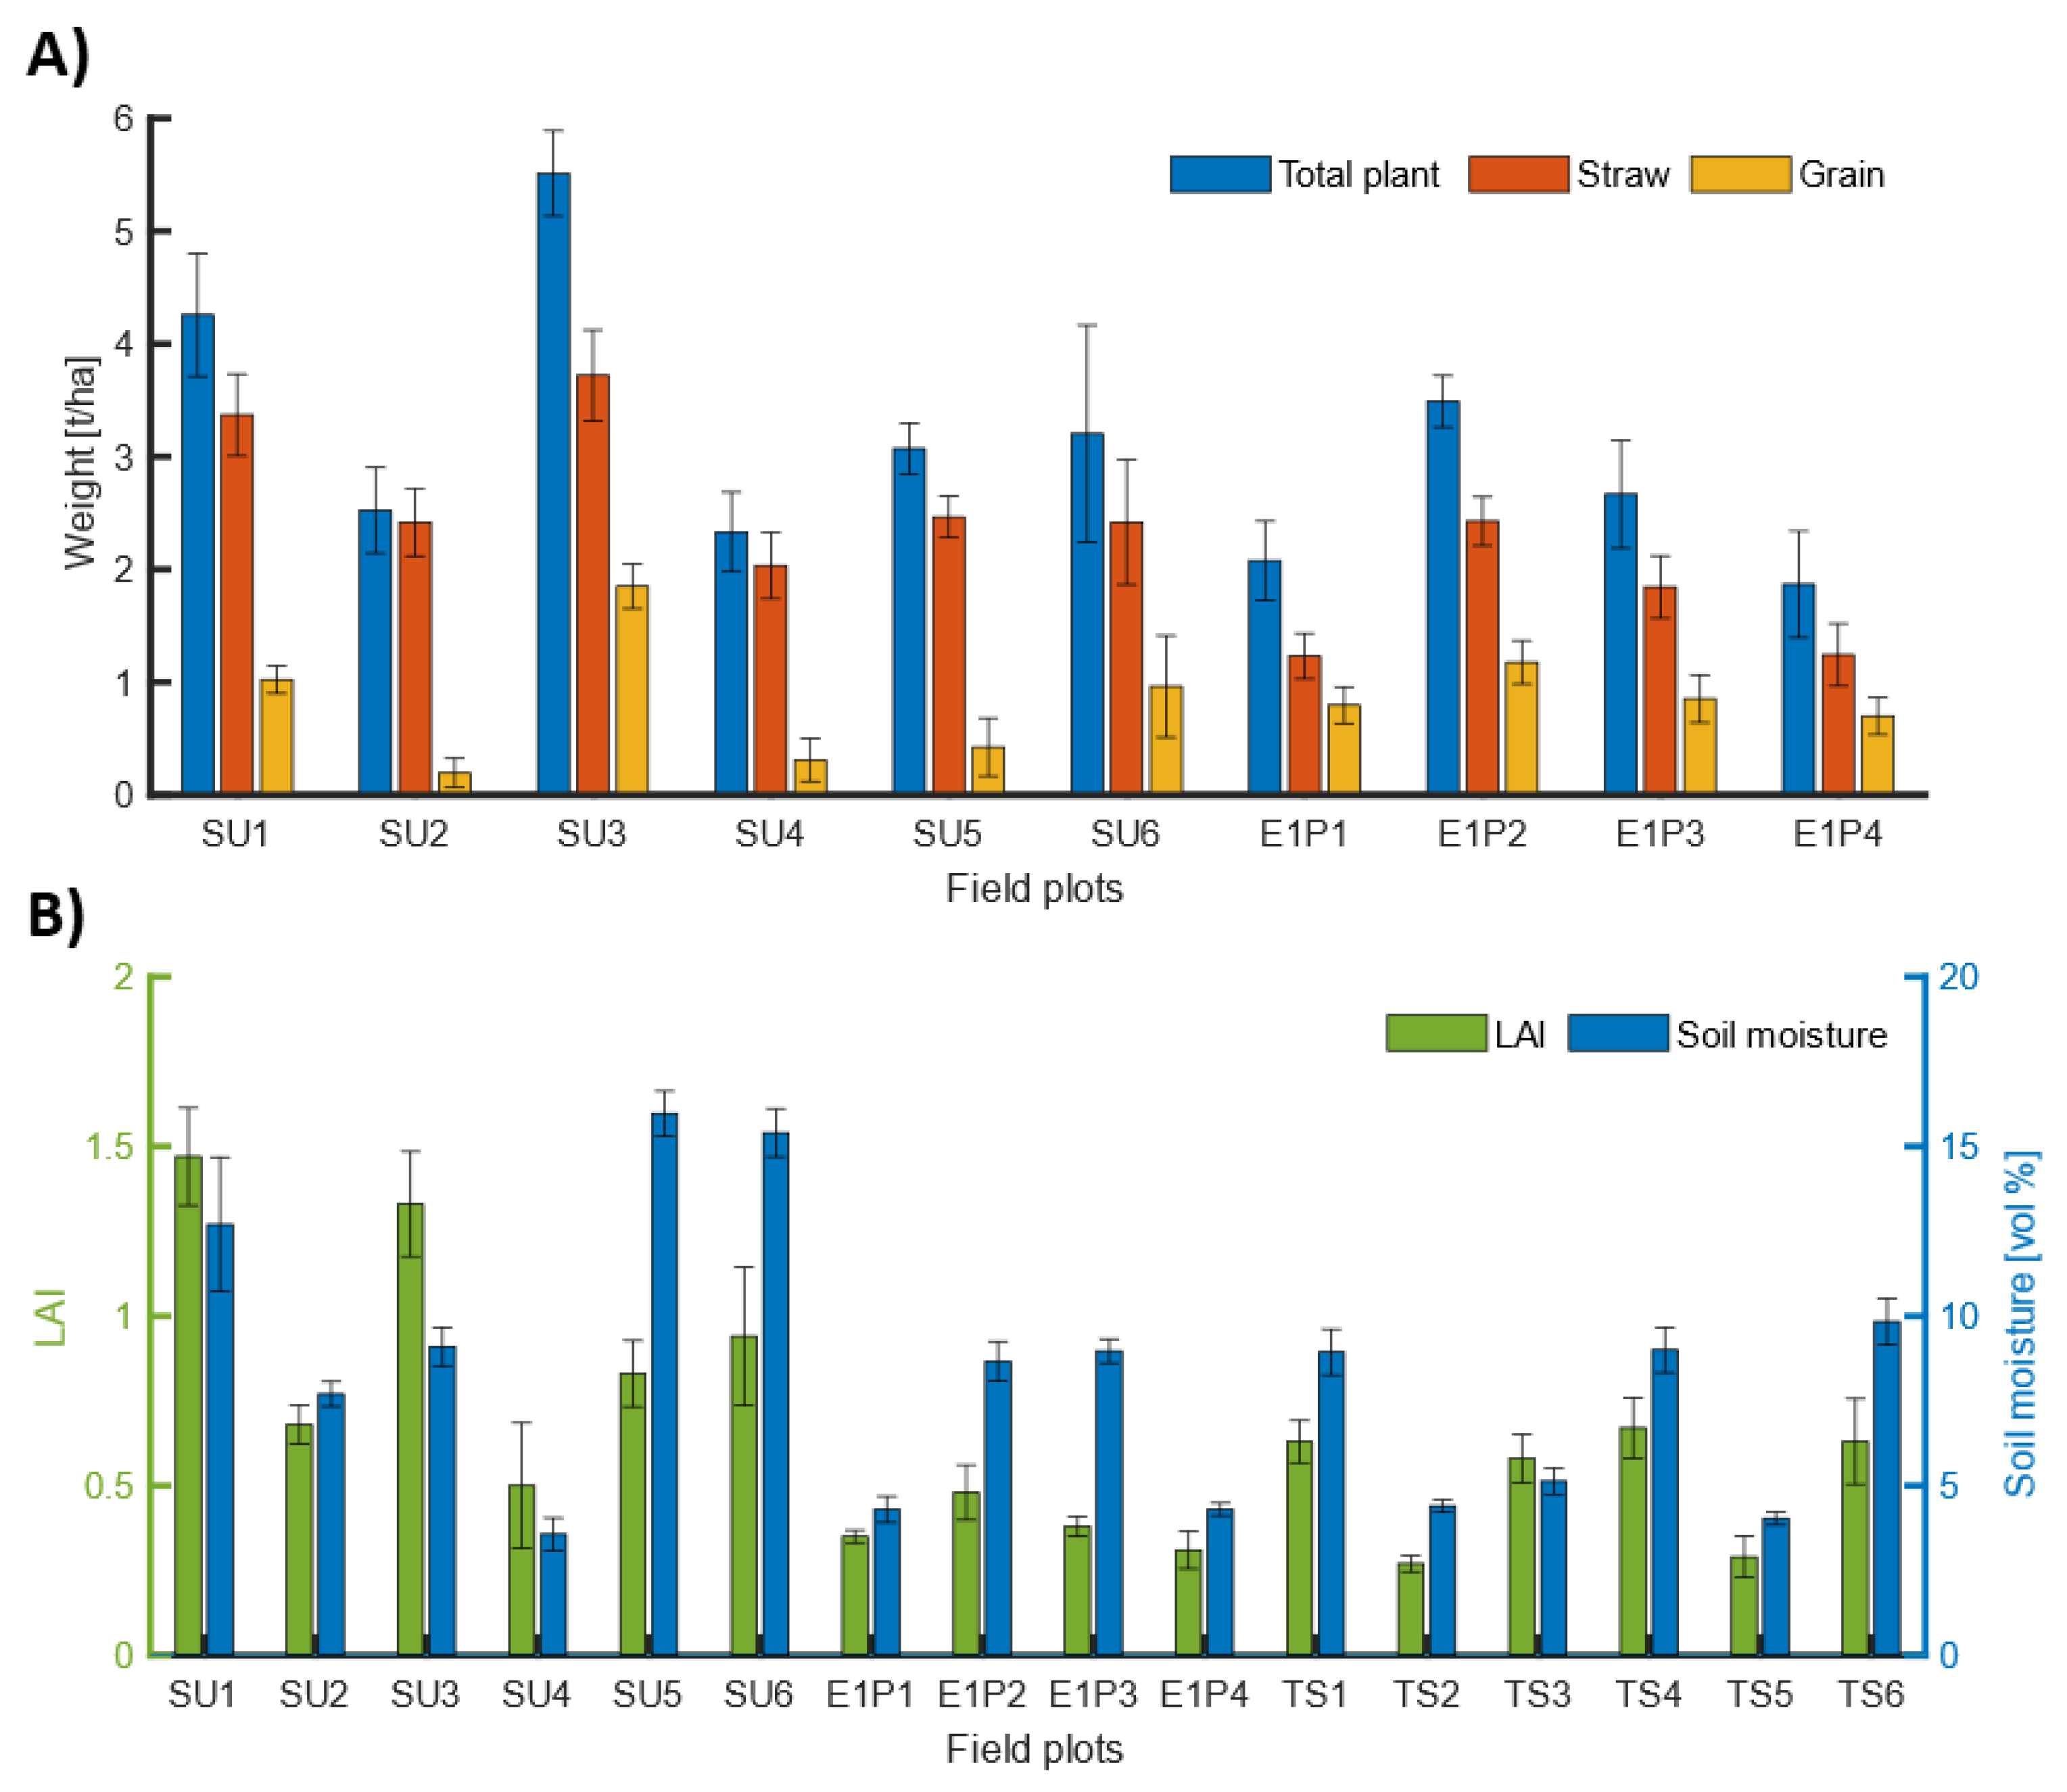
The results of the field measurements for the crop biomass, LAI, and DTR soil moisture indicate large variability both between the different agricultural fields SU, E1, and TS and between the field sampling points (Figure 6 and Table 3). In terms of crop (dry) biomass, the intra-field variability is especially high for the SU field, which shows the lowest and highest grain yield across all of the test plots. Furthermore, the low-yield SU2 site also has the lowest ratio of grain-to-total-plant-weight at 19%, whereas more productive sites, such as SU3, double the grain-to-total-plant-weight relationship with a biomass ratio of 39%. The E1 field plots, on average, support lower biomass, but the intra-field differences are less great compared to the SU site. The LAI measurements across the field plots agree with the results of the total plant biomass after harvest, with the highest LAI for the SU field and, on average, lower LAI for the E1 and TS sites. The soil moisture measurements indicate lower water holding capacity for the E1 and TS fields compared to the SU field, with the exception of sampling point SU4, which has low soil moisture below 5%.

3.2. Prediction of Crop Properties

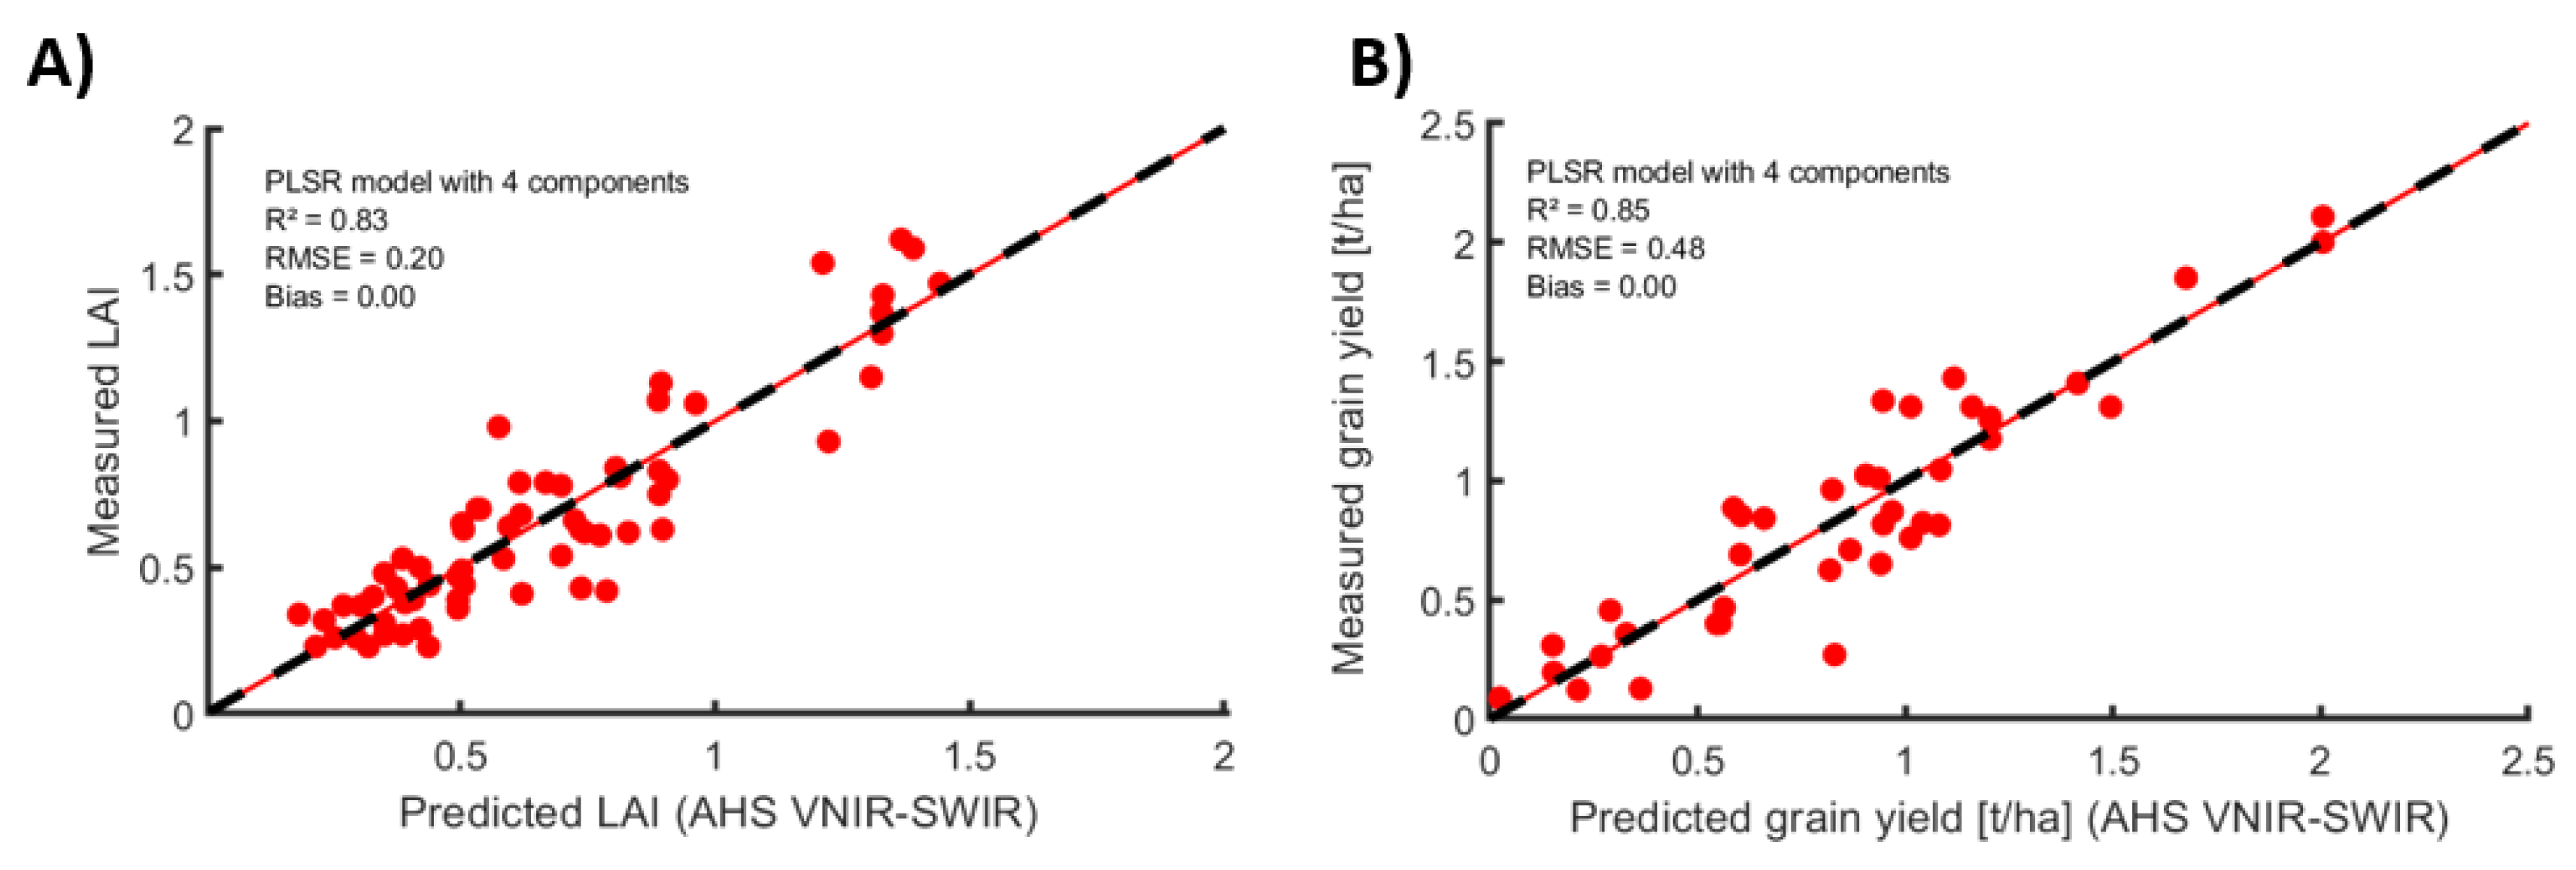
The estimation of LAI and the yield from the AHS VNIR–SWIR imagery received overall good PLS regression results, with an R2 of 0.83 (r of 0.91 with p < 10−24) and an RMSE of 0.2 m2 m−2 for LAI and an R2 of 0.85 (r of 0.92 with p < 10−16), and an RMSE of 0.48 t ha−1 for the grain yield (Figure 7). For both models, four PLSR components were selected based on the minimum RMSE criterion in leave-one-outcross-validation. The models show no significant bias across the value ranges. The variable importance in the projection (VIP) of the PLSR models for the LAI and grain yield prediction is shown in Figure 8. According to the VIP scores, both models placed very high emphasis on the single rather broad band of the AHS sensor in the SWIR I spectral region. In SWIR II, the most significant bands are found around 2100 nm for the LAI model, whereas the grain yield model places a greater emphasis on a wavelength greater than 2400 nm. Further important bands of both models are found in the red and NIR infrared spectral region.
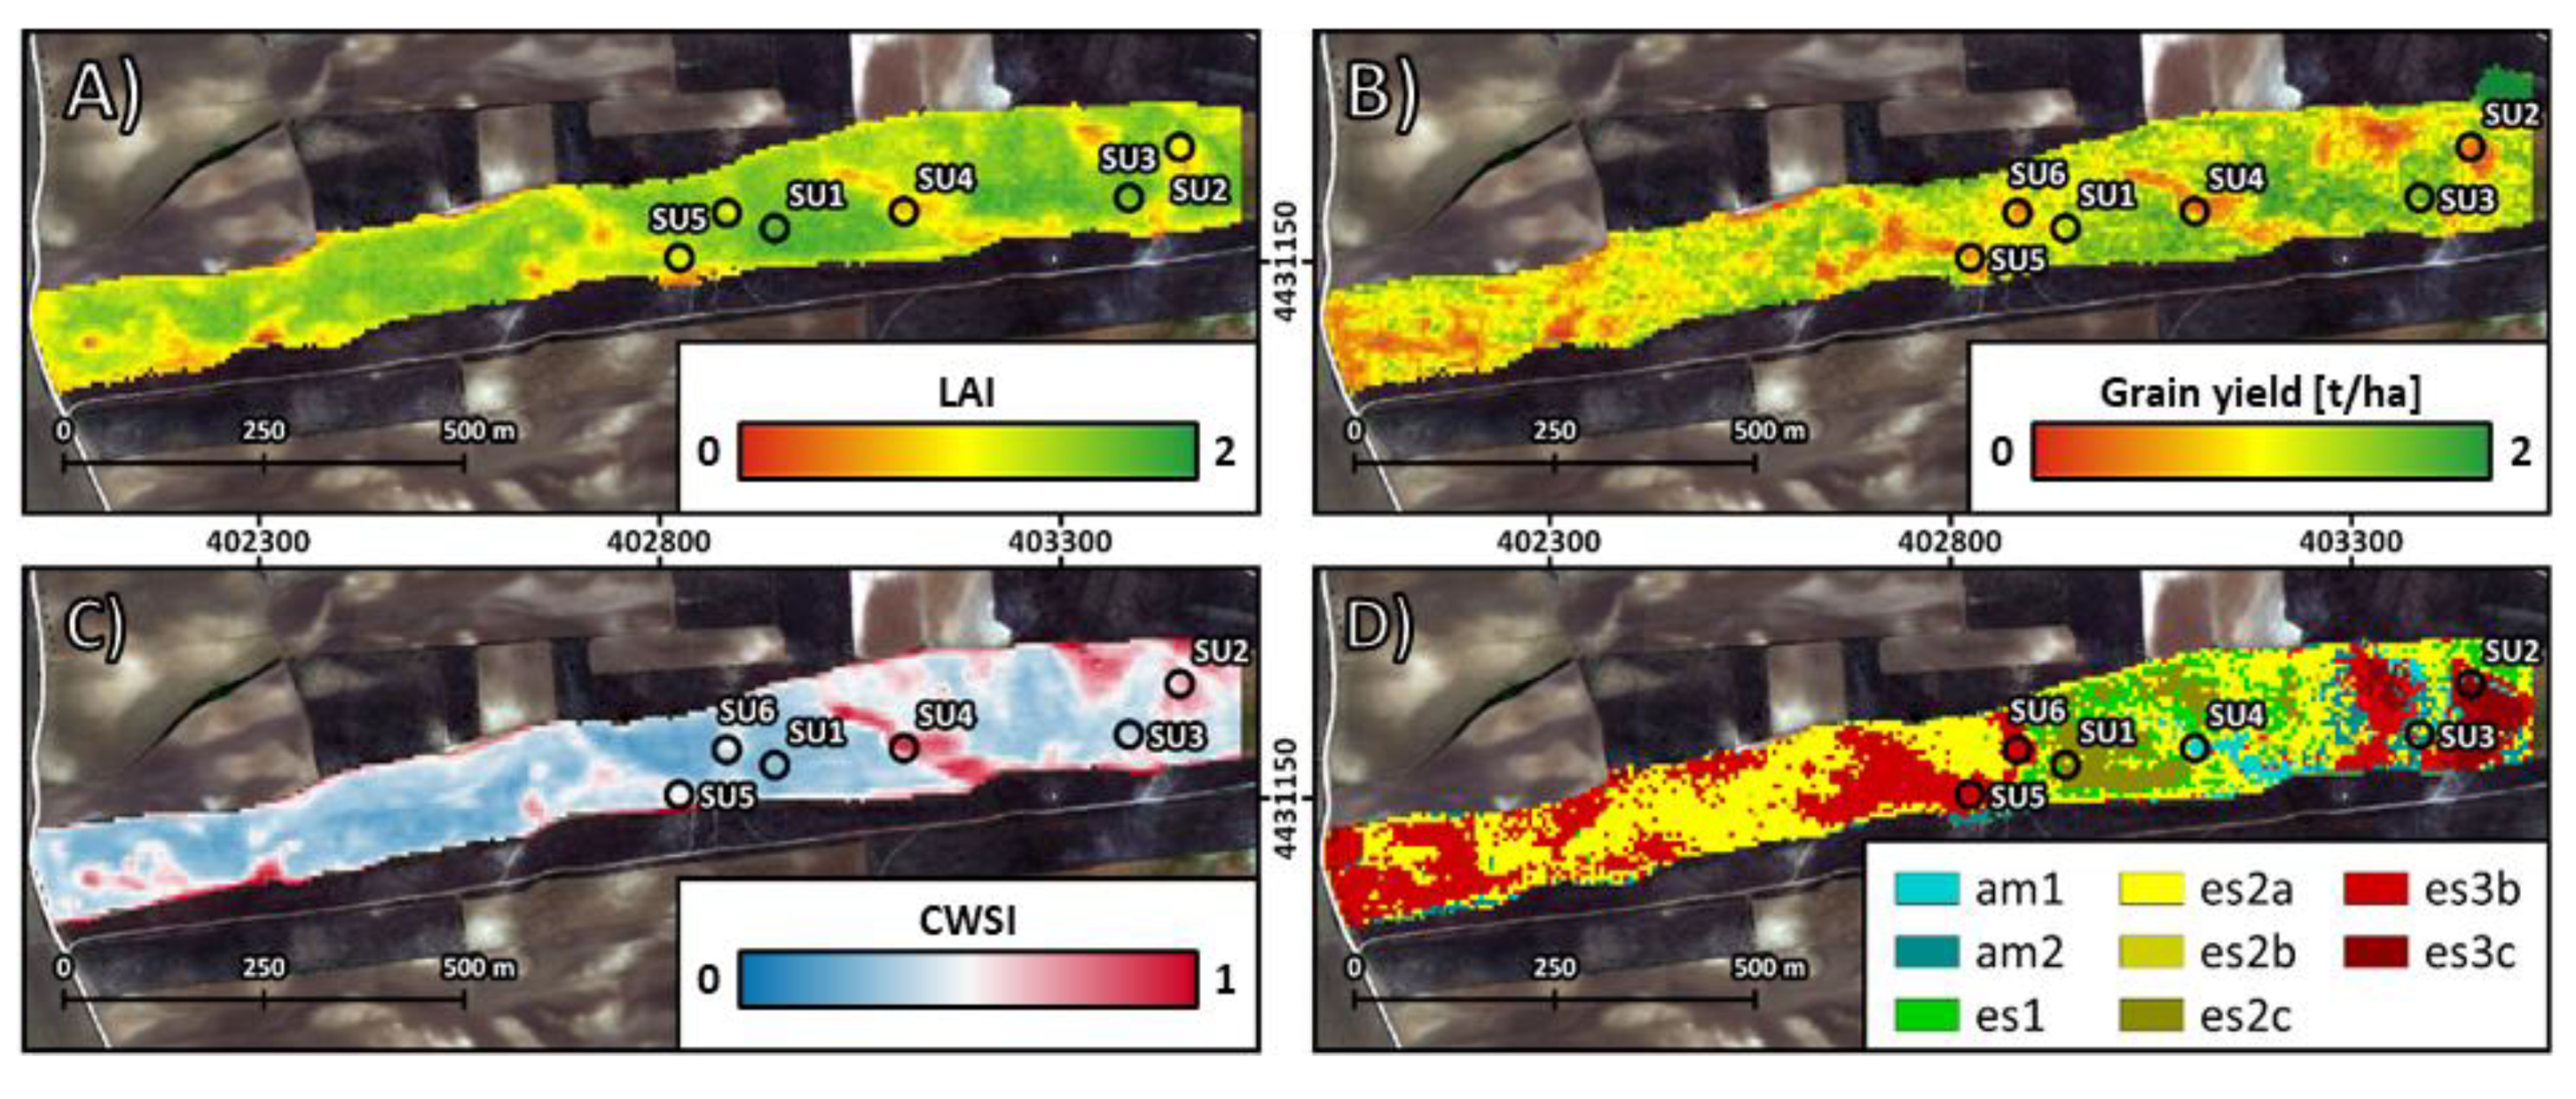
In Figure 9, the spatial distribution of the LAI, grain yield, and crop water stress models are shown together with the bare soil classification of soil accumulation and the erosion stages extracted for the SU field site. The general spatial patterns in LAI variability, grain yield estimation, and CWSI correlate very well over the test site. However, spatially, grain yield estimation is more variable, having more extreme values compared to the LAI prediction. LAI and grain yield are spatially correlated well to water stress; e.g., low LAI and grain yield areas are found close to the sampling points SU2 and SU4, which also show the highest CWSI values. According to the SEAS classification, the SU2 areas represent a strongly eroded soil (es3) at the top slope position with exposed carbonate-rich substratum (Ck-horizon), and the SU4 area forms an accumulation zone (am1) consisting of coarse-grained sandy material. The areas with moderately eroded soils (es1 and es2), e.g., around the sampling point SU3 and SU1 and in the west of the SU area, seem to be the most fertile for the barley crop, with high values for LAI and grain yield and generally lower CWSI.
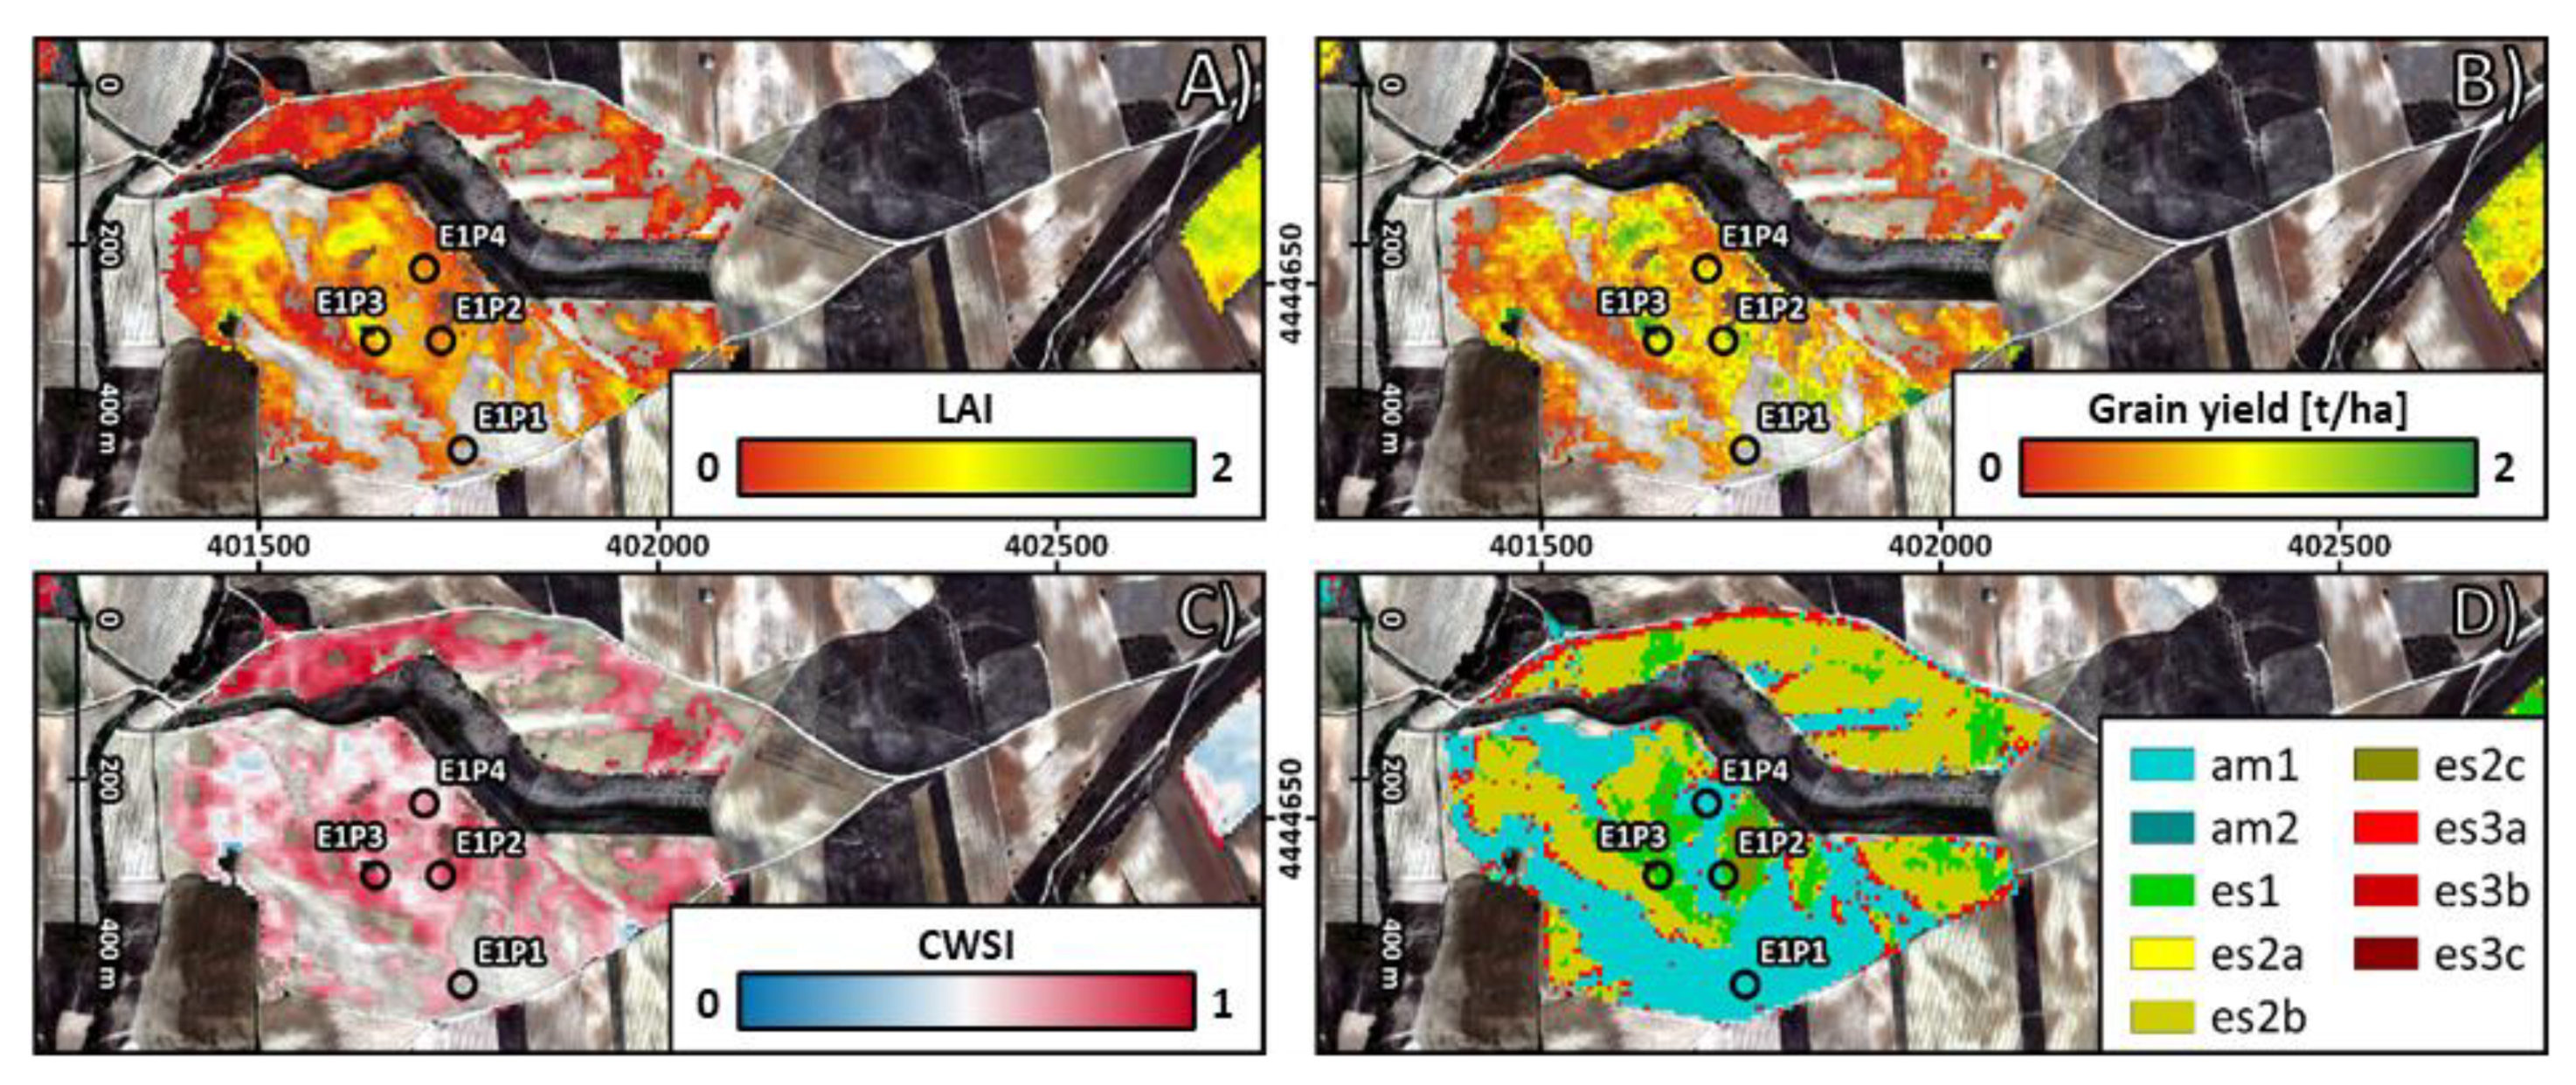
Figure 10 shows the spatial distribution of the estimated LAI, grain yield, and CWSI, together with the bare soil classification of the soil accumulation and erosion stages for the northern field site E1. The predicted LAI and grain yield of E1 are much lower (mean LAI: 0.29 m2 m−2, mean grain yield: 0.22 t ha−1) compared to the SU field site (mean LAI: 1.10 m2 m−2, mean grain yield: 1.43 t ha−1), whereas the crop water stress indicated by the average CWSI is much higher, with 0.72 for E1 and 0.44 for SU. About 35% of the E1 field sites have been masked as they fall under the 0.2 NDVI threshold, which is applied to differentiate bare soils from semi-vegetated and vegetated fields. More than 60% of this masked area with low fractional vegetation cover is classified as a sandy accumulation zone (am1) that can be found in the southern part of the site (around the sampling point E1P1). However, especially in the north part of the field, the moderately eroded soils (es2) are masked as well.
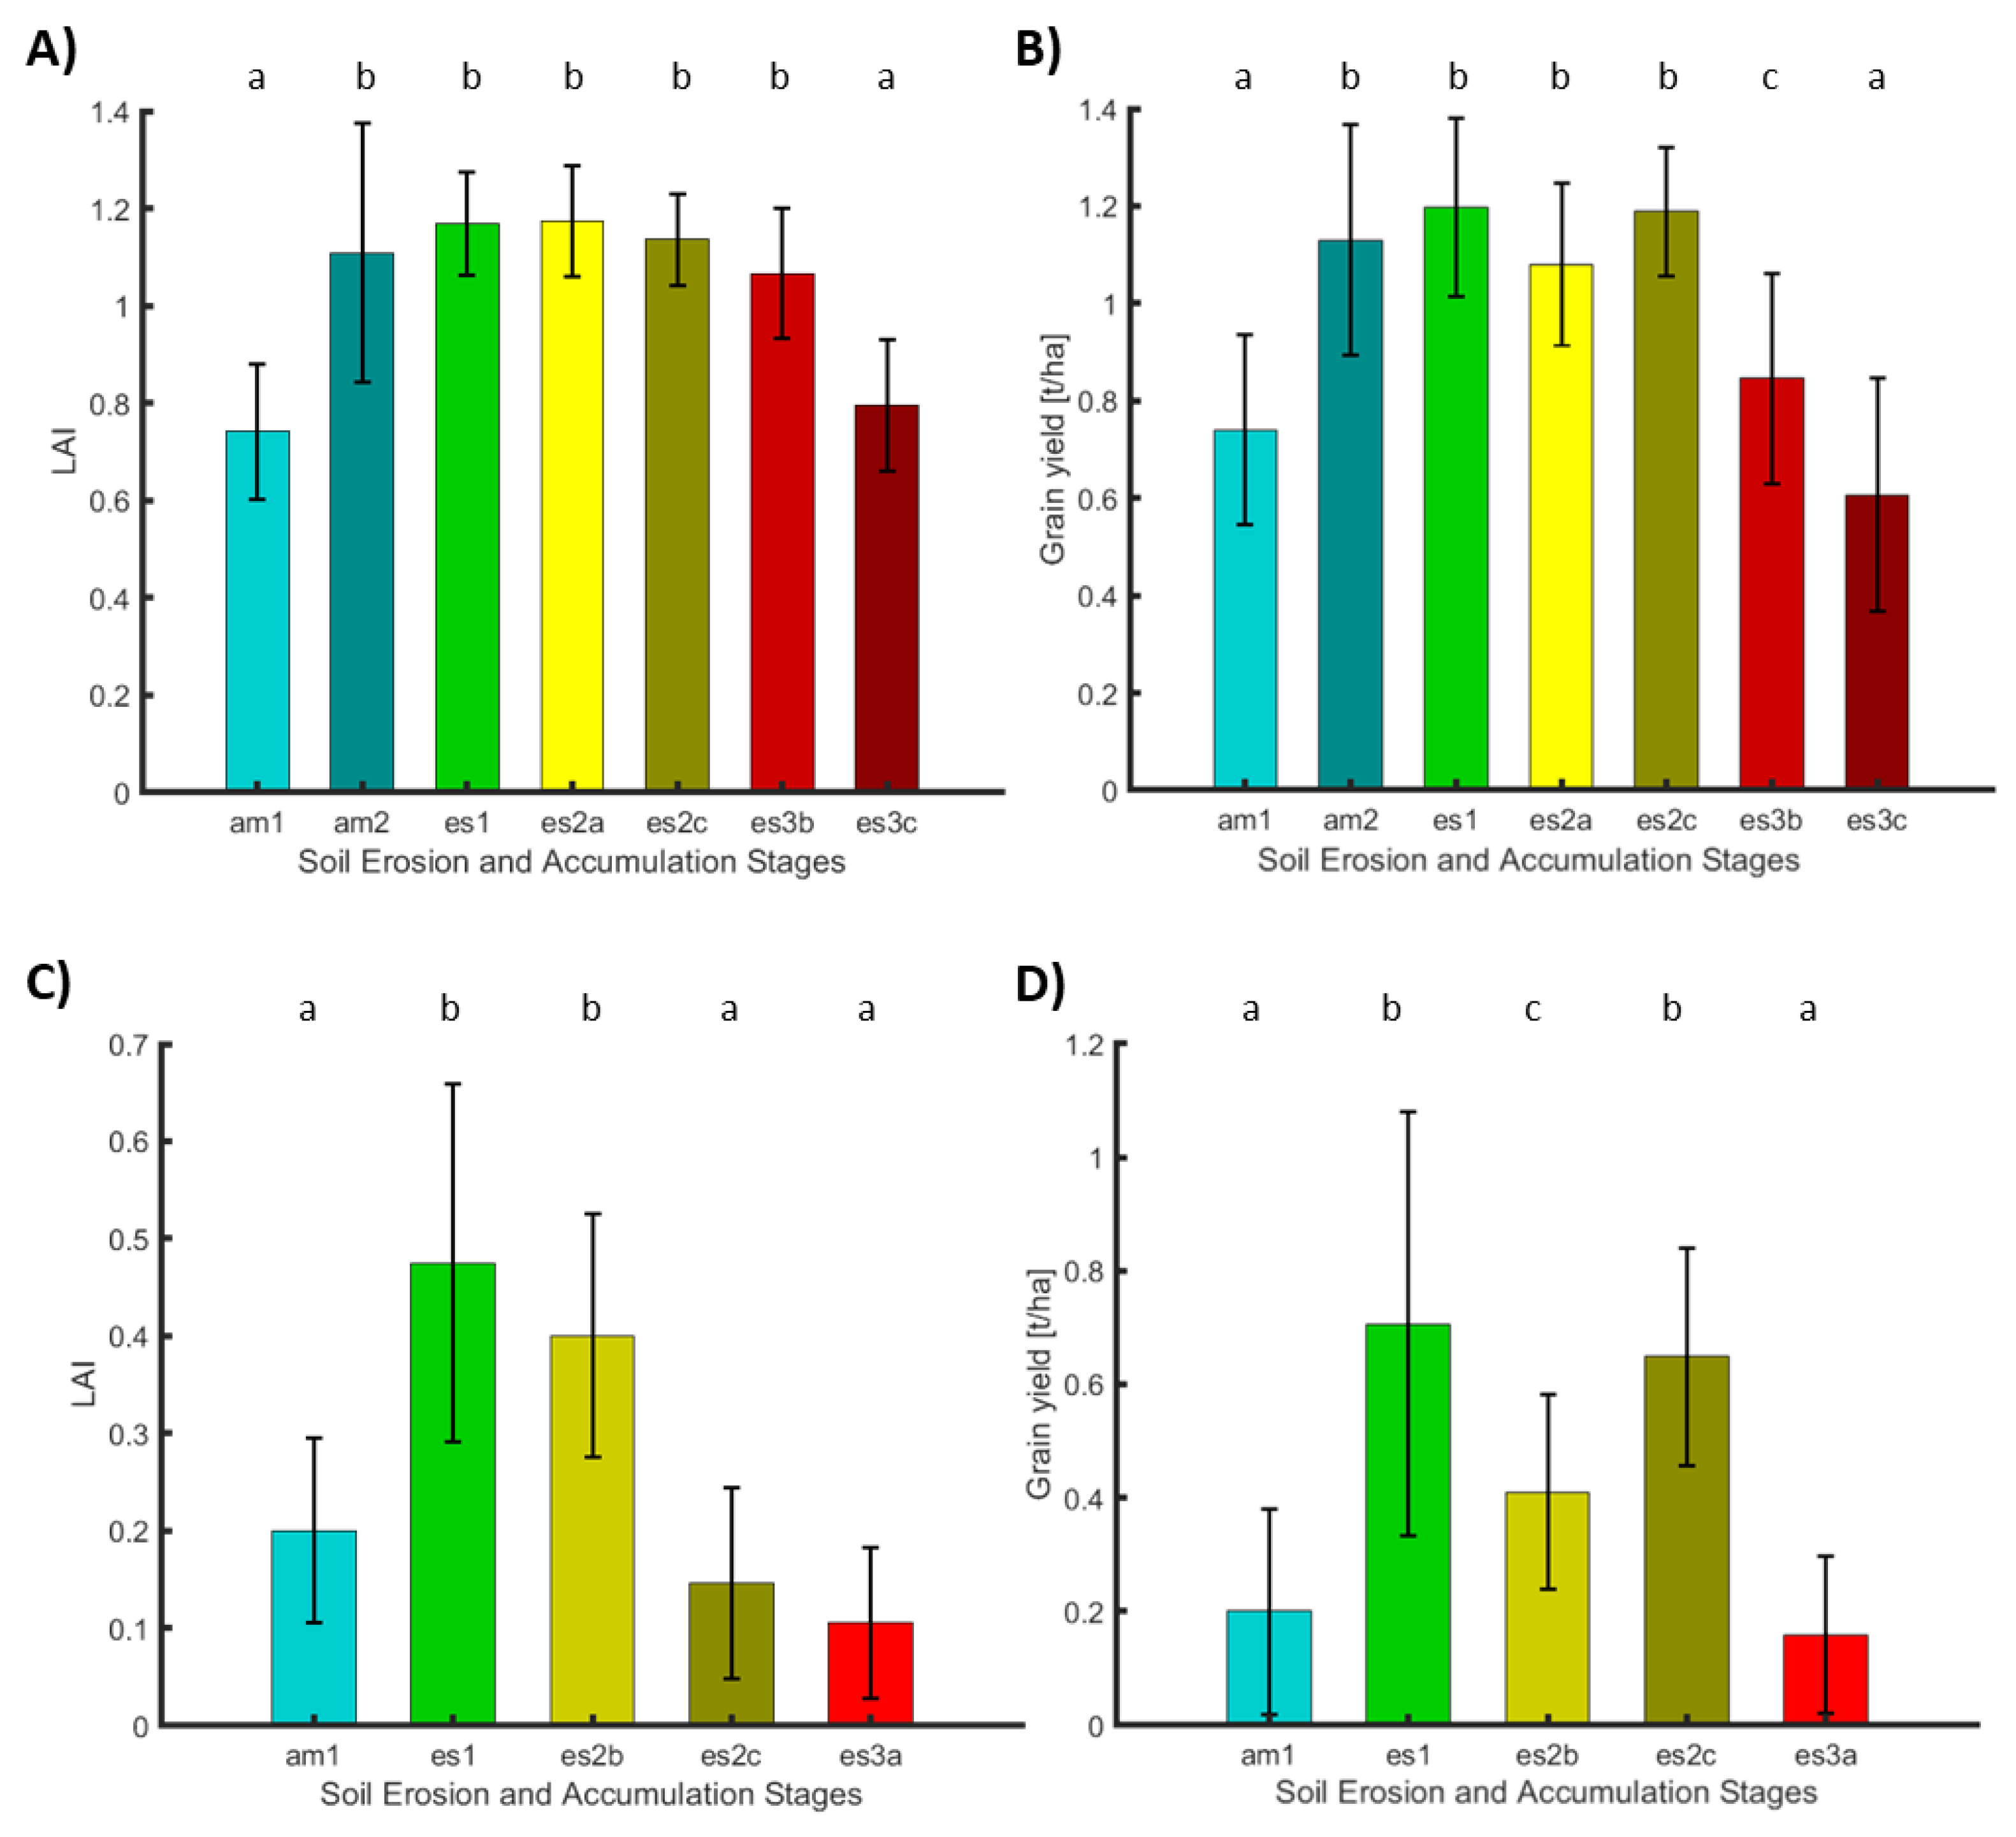
Figure 11 shows the distribution of LAI and grain yield grouped by degradation status according to the SEAS classification of field sites SU and E1. The SU field represents one of the strongly degraded soils with a shallow carbonate-rich bedrock. Here, the lowest LAI is estimated for areas that are classified as most eroded soils with exposed calcic bedrock (es3c), as well as sandy accumulation zone (am1). According to the Kruskal–Wallis test, both SEAS classes belong to the same low median LAI distribution with no statistical difference. The highest median LAI is estimated in areas that belong to the soils with a higher SOM content of 2% related to accumulation stage (am2), as well as the low to moderately eroded soils (es1 and es2) and also the strongly eroded class with marl bedrock (es3b). The SOM content in the accumulation stage (am2) includes pixels with the highest LAI values, but the class also shows a large variance, and no significant difference exists when compared to SEAS es1, es2, and es3b. The after-harvest grain yield of the SU site shows a similar distribution across SEAS compared to growing season LAI with the notable difference that the erosion stage with exposed marls (es3b) has significant lower grain yield that can be differentiated from the low to moderately eroded soils (es1 and es2) and SOM in am2. At the field site of E1, which is representative in the Camarena of degraded soils with an acidic substrate, slightly eroded soil (es1) that have some remaining organic A horizon shows the highest median LAI and grain yield, which is significantly higher compared to the sandy accumulation zone (am1) and the arkosic bedrock outcrops of the highest erosion stage (es3a). For LAI also, the moderately eroded soil es2c is in the lower group, whereas the median for the grain yield rank is significantly higher.

3.3. Prediction of SEAS Based on the Canopy Spectral Signal

The performance of the RF classification of SEAS based on the vegetation spectral response in the growing season show large differences in overall model performance depending on the covariates used (Table 4). The most basic dataset limited to the VNIR spectral bands achieved overall accuracies of 51.3% in SEAS classification for AHS and 55.8% for the CASI sensor, which have 20 bands and 288 spectral bands in the VNIR, respectively. The overall accuracies improve to 60.1% when the AHS SWIR and TIR spectral ranges are included in the RF model, and the combination of high VNIR CASI resolution in addition to the full-resolution AHS data achieved slightly higher overall classification accuracy of 62.5%. A significant improvement in model overall classification accuracy by about ~6% is realized by applying minimum noise fraction transformation (MNF) for all of the spectral data that reduces the highly correlated spectral feature space to 22 uncorrelated components. By also considering morphological information such as terrain elevation, slope, and curvature, a further minor improvement of about 1–2% in overall classification accuracy is achieved, whereas the addition of the modeled parameters of LAI, CWSI, and grain yield only has a minor impact or even lower the classification accuracy.
For the best SEAS model that combines the CASI and AHS information with topographic information, as well as additional modeled parameters, a confusion matrix was established (Figure 12) using the 30% hold-out validation dataset consisting of 38,012 pixels. The overall accuracy obtained by this model is 71.2% for the SEAS RF classification. The individual accuracy of the SEAS classes varies between 59.2% (es3a) and 84.9% (es2c), indicating how well a certain class can be separated by the model. The highest rate of misclassification occurs between the sandy accumulation zone am1 and the highly degraded erosion stage es3a, with 18% of the misclassified validation pixels. Most other misclassification occurs between classes of a similar stage, e.g., moderately to high eroded soils (es2a to es3b with 16%), between slightly and moderately eroded soils (es1 to es2b/es2c with 10% of pixels), and between the sandy and SOM accumulation zones (am1 to am2 with about 8% of pixels).
Figure 13 shows the spatial distribution of the SEAS predicted by the best-performing random forest model driven by the spectral information of the crop canopy acquired during the growing season and auxiliary datasets. The results show that the model is able to reproduce the original classification of the bare soil SEAS map very well and that the general patterns are preserved at the SU and E1 field sites. From the spatial distribution, it is apparent that most of the misclassifications (in black, Figure 13) appear at the class edges, where a clear class distinction is the most difficult, and some fuzziness can be expected. Therefore, most misclassifications appear where class boundaries are in close distance of each other, such as the eastern area of field SU and the more central area of the E1 field.

4. Discussion

  • Prediction of crop properties
The impact of soil degradation on plant growth and vitality was evaluated by estimating the LAI and grain yield, as well as the CWSI from the VNIR–SWIR–TIR remote sensing data and comparing these biophysical characteristics of the crop canopy to the classification of SEAS. To support a fair assessment of the impact of the SEAS on vegetation growth and fertility, an accurate estimation of the biophysical crop canopy parameters is crucial. Regarding crop grain yield, the PLS regression results of this study provide an overall good relationship between the estimated and harvested grain yields with R2 of 0.85 and an RMSE of 0.48 t ha−1 by exploiting the VNIR–SWIR hyperspectral airborne data. These prediction accuracies are comparable to models based on high-quality and well-processed proximal hyperspectral surveys. To that end, Sharabian et al. (2014) [79] reported on the yield estimation of winter wheat that achieved prediction accuracies of R2 = 0.89 and an RMSE = 0.4 after the refinement of the spectral variables and the application of stepwise multiple linear regression. The presented models further outperform the predictions based on field scale multispectral UAV imagery for barley crop yield (e.g., [80] with R2 = 0.72 and RMSE = 1.78 t ha−1), as well as predictions by more general crop simulation tools, such as the FAO AquaCrop model, which assimilates the soil, crop, and climate data for yield prediction [81] and provides estimations with an R2 and an RMSE of 0.82 and 0.55 t ha−1 according to a study by Jin et al. (2016) [82]. Next to the yield biomass, the LAI derived by PLS regression also exhibits fairly good prediction accuracies (R2 = 0.83, and RMSE = 0.2 m2 m−2) compared to similar studies. For example, in a study by Jarmer et al. (2013) [83], the LAI of wheat crops was derived from comparable AISA–DUAL VNIR–SWIR airborne imagery and in situ data with an R2 = 0.9 and an RMSE = 0.22 m2 m−2. In contrast to the estimation for crop biomass, where the exploitation of the hyperspectral data can significantly improve remote sensing-based predictions [84], good prediction accuracies for LAI can already be achieved by low-cost multispectral VNIR or even RGB imagery (e.g., [85] with R2 = 0.92, RMSE = 0.3 m2 m−2).
  • Erosion stages in Camarena and their link to crop properties
The spatial distribution of the estimated crop canopy traits, such as LAI, grain yield, as well as the CWSI, all show high variability at the field scale and across the study site. The performed statistical analysis strongly indicates a link between the soil conditions with respect to their degradation status and crop productivity. The main criteria that influence these field scale soil conditions are the variations in the bedrock substrate, as well as geomorphological properties, such as the slope position that shape the tillage and run-off-based process of soil erosion. With reference to the two test sites of interest, SU and E1, the spatial distribution of SEAS in the northern region E1 is dominated by the accumulation stage am1, whereas for SU, these accumulation zones are limited to the concave toe slope positions. The deposition of sandy-textured eroded materials in the lower areas corresponds to the dominating coarse textures of the arkosic soils within the northern study region. The distribution of the erosion stage (es3a) is mainly determined by the parent material, combined with the morphological position at the hilltops. These areas, dominated by sandy deposition zones (am1), as well as the highly eroded and exposed arkosic C horizon (es3a), show significantly reduced canopy leaf area in the late growing season and reduced grain biomass after harvest and are the most prone to high water stress, as indicated by the high CWSI. As the crop fields in this semi-arid region are mostly rainfed, sandy soils with low water-retention capacity are highly sensitive to intra-annual rainfall variability and dry spells [86]. The thermal-based CWSI mainly reacts to the cooling effect of canopy transpiration and has been found to be closely related to leaf water content, as well as grain yield (e.g., [87,88]); therefore, leading to high CWSI in areas of low vegetation cover. In addition to lower cooling by vegetation transpiration, the CWSI might also be directly influenced by the properties of the exposed soil fraction in the sensors’ field of view for areas with a less dense vegetation canopy. The soils of the sandy accumulation zones are expected to have a faster water depletion rate and a lower soil water content, which further leads to higher soil surface temperatures. Whereas soil with exposed Bt horizon, e.g., the moderately eroded soils (es2), contain significant amounts of clay minerals, leading to a higher water holding capacity. Such soils are expected to have a slower water depletion rate and a higher soil water content that might result in lower land surface temperatures [89]. Next to soil texture, the thickness of the soil cover on the top of the bedrock is a further important site property that is also related to the specific slope position and controls the spatial variability of the water holding capacity, nutrient, and OM availability, as well as crop yield [90,91]. At the study site, highly eroded areas are mostly related to shallow soils with an outcropping of arkosic parent material (es3a) in the north, as well as marls and carbonate-rich outcrops (es3b and es3c) that reach the massive to platy bedrock layer in less than 20 cm depth at some highly eroded areas in the southern parts [22]. These areas with strongly eroded soils overall show the lowest LAI, as well as low grain yield after harvest. The LAI was estimated from the canopy reflectance during the crop’s heading time, which from an agricultural and plant physiological perspective, is considered a key development stage controlling adaptation to the environment with crucial impacts on crop grain yield [92]. Therefore, the LAI of the late growing season is expected to be closely related to the grain yield, e.g., for wheat and barley crops [93]. The results of this study reflect this relationship very well. Especially for the moisture supply-driven conditions often found in semi-arid Mediterranean environments [94], a reduction in LAI and an increase in surface temperature often are expressions of stress symptoms in plants that limit the potential growth of crop canopies [95]. Soil moisture limitation will have negative impacts on crop growth regulated by the leaves’ stomatal conductance [96], leading to premature senescence and a reduction in crop yield [97]. Next to water shortage, further reasons for the stress symptoms of crops are an insufficient nutrient supply, that is often associated with highly eroded soil surfaces [91]. Barley crops of the highly eroded soils in the SU field (es3c) show indications of nutrient deficiency in the form of yellowing of the leaves (chlorosis) [98]. These areas have a very high concentration of carbonate content in the top-soil layer [22], which can cause nutrient deficiency due to the low iron availability [99].
  • Prediction of SEAS based on the canopy spectral signal
The SEAS classification based on the crop canopy reflectance data acquired during the growing season was fairly successful, given the difficulty of the classification scenario with the complex mosaic of erosion and accumulation processes that occur throughout the study region. To the author’s knowledge, this is the first time that such a study has been performed. The most successful SEAS prediction with an overall accuracy above 71% was achieved by combining the CASI and AHS VNIR–SWIR–TIR data with topographic information after MNF transformation. The results show that reducing the redundancy by MNF transformation is a crucial processing step that severely improves the overall classification accuracy by about ~6%, which is the highest gain in accuracy across the tested dataset combinations. Previous studies confirm that the use of the hyperspectral data in the RF models generally improves the classification accuracy [71] but also introduces new challenges related to the increase in dimensionality [100]. The resulting classifiers are often unstable and have poor generalization, especially when the number of variables is very high, and the training data are more limited [101]. The strong increase in classification performance after the selection of the most relevant MNF components is consistent with the findings of other studies [102,103] that found MNF-based feature space reduction to consistently produce improved classification results across different classification approaches and datasets compared to the use of no or other feature selection methods [102,104]. As a side effect, the computational time for training the random forest classifier is more than halved by reducing the spectral bands from 198 spectral bands to 22 MNF components. The incorporation of topographic parameters into the RF model further improved the overall performance by an additional 2%. The highest contribution to model performance can be attributed to the first derivation of the elevation, slope, followed by plain elevation. The slope is well known as a major determining factor that influences the spatial distribution of soil parameters, e.g., in digital soil mapping initiatives [73], and was found to correlate with the regional soil organic carbon estimation from the remote sensing data [105]. It has also been shown that adding elevation information to large-scale multispectral, as well as airborne hyperspectral data in general, increases classification accuracy [106,107,108], primarily due to the vertical structuring of the study area [107]. In this study, a likely benefit of including the absolute elevation is the improved separation between the topographically higher northern and lower southern areas of the study site, specifically the arkosic areas (e.g., E1 at > 600 m a.s.l.) and more carbonate-rich southern area between 530 and 560 m a.s.l. (e.g., the SU field). The addition of spectrally-derived parameters, such as LAI, grain yield, and CWSI to the RF model did not significantly increase the accuracy of the SEAS classification. The explanatory power of these parameters might already be included in the spectral data from which the parameters have been estimated. Regarding the separation of individual SEAS classes, the results show that most erosion stages can be well differentiated with class-specific producer’s and user’s accuracies above 60% and mostly over 70%. However, a high rate of misclassification occurs between the accumulation zone am1 and the highly degraded erosion stage es3a (producer’s accuracy of 45.4%). This is a strong loss in accuracy compared to the SEAS classification of Schmid et al. (2016) [22], which is based on bare soil reflectance and where no significant confusion between these classes was noted. Although these soil surfaces genetically (and spectrally) represent very different soil horizons, the major effects of the soil properties relevant to crop fertility are similar, e.g., with respect to their influence on soil moisture. Both SEAS classes (am1 and es3a) have very coarse, sandy textures and are highly depleted in organic matter, leading to decreased water retention capability and soil fertility, confirmed by the lowest LAI and grain yield across all SEAS. These degraded soil surfaces cannot be reliably separated from each other based on crop canopy reflectance. However, from a soil fertility and crop yield perspective, their differentiation also seems less important as their impact on plant growth is comparable. Further notable confusion exists between the accumulation stages am1 and am2, with about 11% of am2 reference pixels incorrectly attributed to am1. However, this confusion is already present to a comparable extent in the classification results of Schmid et al. (2016) [22] and is, therefore, likely the result of error propagation from the training dataset. In their study, this misclassification is attributed to the close proximity of the overlapping depositional processes in the valley bottoms, where the eroded material accumulates [22]. Based on the spatial distribution of the classification results, it is also apparent that a significant share of the misclassifications occurs around the edges of SEAS zones. This is a well-known general problem of pixel-based classifications mainly caused by mixed pixels in transition zones, general fuzziness of class definitions, and geolocation errors [109,110]. To avoid mixed pixel on the field plot scale, the very-high spatial resolution data provided by the first available models of full hyperspectral (VNIR–SWIR) UAV sensors should be tested, as these systems bear a very high potential for applications in precision agriculture, with cost-effective and flexible deployment capability regarding meteorological conditions [20]. Additionally, the application of cleaning methods, such as morphological filters or object-based approaches, could be applied to further consolidate the pixel-based classification and increase the overall accuracy, as well as map readability. The potential of transferring the SEAS mapping approach to the scale of Earth Observation by exploiting the current generation of spaceborne imaging spectrometers, such as PRISMA (PRecursore IperSpettrale della Missione Applicativa) [40] and EnMAP (Environmental Mapping and Analysis Program) [41], still needs to be evaluated. The success of regional mappings will strongly depend on the data quality (high sensor SNR), as well as the spatial scale of the degradational processes, their heterogeneity, and the size of the studied fields in cultivated areas [111].

5. Conclusions

The Camarena study area represents a striking example of rainfed crops in Mediterranean agricultural areas where variable soil surface characteristics, soil erosion stages, land management, and crop conditions are closely related. The information from the hyperspectral imagery acquired during two different seasons alternating between grain crop (such as barley) rotations and fallow soils, leaving the fields with exposed bare soils or covered with vegetation, have been used to investigate the potential of the VNIR–SWIR–TIR data for the qualitative and quantitative assessment of vegetation vitality and crop harvest yield, linked to the soil degradation. The results show that crop growth is significantly affected by the soil conditions, as shown by LAI and grain biomass modeled from the remote sensing and ground truth data. The main merit of this research is the demonstration of a novel application of hyperspectral optical and thermal remote sensing for the assessment of soil degradation impact based on plant vitality and crop yields in the context of heterogeneous Mediterranean soils. We showed that:
(1)
The soil accumulation and degradation stages derived from hyperspectral remote sensing data are spatially related to crop vitality and yield.
(2)
The most severe stages of soil degradation with exposed bedrock, as well as sandy accumulation zones, do have a strong negative impact on plant vitality and crop yield across the study area.
(3)
The soil degradation status can be directly assessed based on spectral information of the vegetation canopy, using non-linear machine learning models such as a random forest classifier.
(4)
The exploitation of the spectral VNIR–SWIR and TIR information, as well as the auxiliary topographical information, increases the modeling potential for the complex relationship of the vegetation response to soil degradation. Furthermore, the reduction in the redundant spectral information, e.g., by applying an MNF transformation, is a crucial processing step that severely improves the overall classification accuracy.
(5)
Mapping SEAS zones could provide a tool for farmers to estimate the forthcoming yield and optimize field management (e.g., selection of suitable crop types, allocation of fertilizers, irrigation) by considering the detailed degradation status of their field plots.
In summary, this study illustrates the tremendous potential for a combined analysis of the plant-soil system using airborne hyperspectral remote sensing analyses. Further work is necessary to test this framework on the scale of Earth-Observation by exploiting the data provided by the next generation of hyperspectral satellite missions and to assess its potential for regular monitoring of soil resources, land degradation, and agricultural productivity on a larger scale. Considering future climate projections, Mediterranean countries will most likely become drier and hotter compared to today’s conditions, thereby increasing the drought risk and negatively affecting crop yields, specifically for rainfed barley crops [94]. A monitoring framework that is able to combine the assessment of general soil conditions as well as the seasonal crop productivity would be highly beneficial to support informed decision-making for agricultural practice and general land management.

Author Contributions

Conceptualization, R.M., S.C. and T.S.; methodology, R.M.; software, R.M.; validation, R.M. and T.S.; formal analysis, R.M.; investigation, T.S., R.M., S.C., M.J. and M.P.; resources, T.S., S.C. and M.J.; writing—original draft preparation, R.M., S.C. and T.S.; writing—review and editing, R.M., S.C., T.S., P.E., M.P., E.B.-D., M.J.; visualization, R.M.; supervision, R.M., S.C. and T.S.; project administration, S.C. and T.S.; funding acquisition, S.C. and T.S. All authors have read and agreed to the published version of the manuscript.

Funding

The authors acknowledge the grant (No 312609) obtained for the 2017 field and airborne campaign from the EUropean Facility for Airborne Research (EUFAR) Transnational Access program based on the project MASOMED—Mapping SOil variability within rainfed MEDiterranean agroecosystems using hyperspectral data.

Data Availability Statement

The data presented in this study are available on request from the corresponding author. Please contact milewski@gfz-potsdam.

Acknowledgments

The authors thank the EUFAR program for supporting and promoting this work under EU-FP7 EUFAR (European Facility for Airborne Research). We would like to sincerely thank the INTA flight operators and remote sensing group for the support and efficient management of the hyperspectral AHS and CASI data acquisition and pre-processing. Further thanks go to Veronica Sobejano Paz, Andrés Reyes (R.I.P.), and Natalia Ramírez for support with the field work and Daniel Berger for his help with field data handling. We thank the EnMAP science program funded by the German Federal Ministry of Economics and Technology and institutional support by the GFZ Potsdam and CIEMAT for further promoting this work.

Conflicts of Interest

The authors declare no conflict of interest.

References

  1. Lal, R.; Follett, R.F.; Stewart, B.A.; Kimble, J.M. Soil Carbon Sequestration to Mitigate Climate Change and Advance Food Security. Soil Sci. 2007, 172, 943–956. [Google Scholar] [CrossRef]
  2. Montanarella, L.; Pennock, D.J.; McKenzie, N.; Badraoui, M.; Chude, V.; Baptista, I.; Mamo, T.; Yemefack, M.; Singh Aulakh, M.; Yagi, K.; et al. World’s Soils Are under Threat. SOIL 2016, 2, 79–82. [Google Scholar] [CrossRef] [Green Version]
  3. Guerra, C.A.; Rosa, I.M.D.; Valentini, E.; Wolf, F.; Filipponi, F.; Karger, D.N.; Xuan, A.N.; Mathieu, J.; Lavelle, P.; Eisenhauer, N. Global Vulnerability of Soil Ecosystems to Erosion. Landsc. Ecol. 2020, 35, 823–842. [Google Scholar] [CrossRef] [PubMed] [Green Version]
  4. Zhang, X.; Wu, B.; Ling, F.; Zeng, Y.; Yan, N.; Yuan, C. Identification of Priority Areas for Controlling Soil Erosion. CATENA 2010, 83, 76–86. [Google Scholar] [CrossRef]
  5. Lal, R. Soil Erosion and the Global Carbon Budget. Environ. Int. 2003, 29, 437–450. [Google Scholar] [CrossRef]
  6. Paustian, K.; Lehmann, J.; Ogle, S.; Reay, D.; Robertson, G.P.; Smith, P. Climate-Smart Soils. Nature 2016, 532, 49–57. [Google Scholar] [CrossRef] [PubMed] [Green Version]
  7. Keesstra, S.D.; Bouma, J.; Wallinga, J.; Tittonell, P.; Smith, P.; Cerdà, A.; Montanarella, L.; Quinton, J.N.; Pachepsky, Y.; van der Putten, W.H.; et al. The Significance of Soils and Soil Science towards Realization of the United Nations Sustainable Development Goals. SOIL 2016, 2, 111–128. [Google Scholar] [CrossRef] [Green Version]
  8. García-Ruiz, J.M.; Nadal-Romero, E.; Lana-Renault, N.; Beguería, S. Erosion in Mediterranean Landscapes: Changes and Future Challenges. Geomorphology 2013, 198, 20–36. [Google Scholar] [CrossRef] [Green Version]
  9. Raclot, D.; Bissonnais, Y.L.; Annabi, M.; Sabir, M. Sub-Chapter 2.3.3. Challenges for Mitigating Mediterranean Soil Erosion under Global Change. In The Mediterranean Region under Climate Change; Moatti, J.-P., Thiébault, S., Eds.; IRD Éditions: Paris, France, 2016; pp. 311–318. ISBN 978-2-7099-2219-7. [Google Scholar]
  10. Gamon, J.A.; Somers, B.; Malenovský, Z.; Middleton, E.M.; Rascher, U.; Schaepman, M.E. Assessing Vegetation Function with Imaging Spectroscopy. Surv. Geophys. 2019, 40, 489–513. [Google Scholar] [CrossRef] [Green Version]
  11. Lausch, A.; Baade, J.; Bannehr, L.; Borg, E.; Bumberger, J.; Chabrilliat, S.; Dietrich, P.; Gerighausen, H.; Glässer, C.; Hacker, J.M.; et al. Linking Remote Sensing and Geodiversity and Their Traits Relevant to Biodiversity—Part I: Soil Characteristics. Remote Sens. 2019, 11, 2356. [Google Scholar] [CrossRef]
  12. Green, R.O. Lessons and Key Results from 30 Years of Imaging Spectroscopy. In Proceedings of the Imaging Spectrometry XIX. International Society for Optics and Photonics, San Diego, CA, USA, 19 September 2014; Volume 9222, p. 92220B. [Google Scholar]
  13. Sahoo, R.N.; Ray, S.S.; Manjunath, K.R. Hyperspectral Remote Sensing of Agriculture. Curr. Sci. 2015, 108, 848–859. [Google Scholar]
  14. Schaepman, M.E.; Ustin, S.L.; Plaza, A.J.; Painter, T.H.; Verrelst, J.; Liang, S. Earth System Science Related Imaging Spectroscopy—An Assessment. Remote Sens. Environ. 2009, 113, S123–S137. [Google Scholar] [CrossRef]
  15. Asner, G.P. Biophysical and Biochemical Sources of Variability in Canopy Reflectance. Remote Sens. Environ. 1998, 64, 234–253. [Google Scholar] [CrossRef]
  16. Ustin, S.L.; Gitelson, A.A.; Jacquemoud, S.; Schaepman, M.; Asner, G.P.; Gamon, J.A.; Zarco-Tejada, P. Retrieval of Foliar Information about Plant Pigment Systems from High Resolution Spectroscopy. Remote Sens. Environ. 2009, 113, S67–S77. [Google Scholar] [CrossRef] [Green Version]
  17. Verrelst, J.; Malenovský, Z.; Van der Tol, C.; Camps-Valls, G.; Gastellu-Etchegorry, J.-P.; Lewis, P.; North, P.; Moreno, J. Quantifying Vegetation Biophysical Variables from Imaging Spectroscopy Data: A Review on Retrieval Methods. Surv. Geophys. 2019, 40, 589–629. [Google Scholar] [CrossRef] [Green Version]
  18. Thenkabail, P.S.; Smith, R.B.; De Pauw, E. Hyperspectral Vegetation Indices and Their Relationships with Agricultural Crop Characteristics. Remote Sens. Environ. 2000, 71, 158–182. [Google Scholar] [CrossRef]
  19. Ben-Dor, E.; Chabrillat, S.; Demattê, J.A.M.; Taylor, G.R.; Hill, J.; Whiting, M.L.; Sommer, S. Using Imaging Spectroscopy to Study Soil Properties. Remote Sens. Environ. 2009, 113, S38–S55. [Google Scholar] [CrossRef]
  20. Chabrillat, S.; Ben-Dor, E.; Cierniewski, J.; Gomez, C.; Schmid, T.; van Wesemael, B. Imaging Spectroscopy for Soil Mapping and Monitoring. Surv. Geophys. 2019, 40, 361–399. [Google Scholar] [CrossRef] [Green Version]
  21. Paz-Kagan, T.; Zaady, E.; Salbach, C.; Schmidt, A.; Lausch, A.; Zacharias, S.; Notesco, G.; Ben-Dor, E.; Karnieli, A. Mapping the Spectral Soil Quality Index (SSQI) Using Airborne Imaging Spectroscopy. Remote Sens. 2015, 7, 15748–15781. [Google Scholar] [CrossRef] [Green Version]
  22. Schmid, T.; Rodriguez-Rastrero, M.; Escribano, P.; Palacios-Orueta, A.; Ben-Dor, E.; Plaza, A.; Milewski, R.; Huesca, M.; Bracken, A.; Cicuendez, V.; et al. Characterization of Soil Erosion Indicators Using Hyperspectral Data From a Mediterranean Rainfed Cultivated Region. IEEE J. Sel. Top. Appl. Earth Obs. Remote Sens. 2016, 9, 845–860. [Google Scholar] [CrossRef]
  23. Žížala, D.; Zádorová, T.; Kapička, J. Assessment of Soil Degradation by Erosion Based on Analysis of Soil Properties Using Aerial Hyperspectral Images and Ancillary Data, Czech Republic. Remote Sens. 2017, 9, 28. [Google Scholar] [CrossRef]
  24. Goldshleger, N.; Goldshleger, N.; Livene, I.; Chudnovsky, A.; Ben-Dor, E. Integrating Passive and Active Remote Sensing Methods to Assess Soil Salinity: A Case Study from Jezre’el Valley, Israel. Soil Sci. 2012, 177, 392–401. [Google Scholar] [CrossRef]
  25. Lu, B.; Dao, P.D.; Liu, J.; He, Y.; Shang, J. Recent Advances of Hyperspectral Imaging Technology and Applications in Agriculture. Remote Sens. 2020, 12, 2659. [Google Scholar] [CrossRef]
  26. Hill, J.; Hostert, P.; Röder, A. Long-Term Observation of Mediterranean Ecosystems with Satellite Remote Sensing. In Recent Dynamics of the Mediterranean Vegetation and Landscape; John Wiley & Sons, Ltd.: Hoboken, NJ, USA, 2004; pp. 33–43. ISBN 978-0-470-09371-9. [Google Scholar]
  27. Hill, J.; Schütt, B. Mapping Complex Patterns of Erosion and Stability in Dry Mediterranean Ecosystems. Remote Sens. Environ. 2000, 74, 557–569. [Google Scholar] [CrossRef]
  28. Yuzugullu, O.; Lorenz, F.; Fröhlich, P.; Liebisch, F. Understanding Fields by Remote Sensing: Soil Zoning and Property Mapping. Remote Sens. 2020, 12, 1116. [Google Scholar] [CrossRef] [Green Version]
  29. Pascucci, S.; Pignatti, S.; Casa, R.; Darvishzadeh, R.; Huang, W. Special Issue “Hyperspectral Remote Sensing of Agriculture and Vegetation”. Remote Sens. 2020, 12, 3665. [Google Scholar] [CrossRef]
  30. Ustin, S.L.; Roberts, D.A.; Gamon, J.A.; Asner, G.P.; Green, R.O. Using Imaging Spectroscopy to Study Ecosystem Processes and Properties. BioScience 2004, 54, 523–534. [Google Scholar] [CrossRef]
  31. Kokaly, R.F. Investigating a Physical Basis for Spectroscopic Estimates of Leaf Nitrogen Concentration. Remote Sens. Environ. 2001, 75, 153–161. [Google Scholar] [CrossRef]
  32. Li, Z.-L.; Tang, B.-H.; Wu, H.; Ren, H.; Yan, G.; Wan, Z.; Trigo, I.F.; Sobrino, J.A. Satellite-Derived Land Surface Temperature: Current Status and Perspectives. Remote Sens. Environ. 2013, 131, 14–37. [Google Scholar] [CrossRef] [Green Version]
  33. Heinemann, S.; Siegmann, B.; Thonfeld, F.; Muro, J.; Jedmowski, C.; Kemna, A.; Kraska, T.; Muller, O.; Schultz, J.; Udelhoven, T.; et al. Land Surface Temperature Retrieval for Agricultural Areas Using a Novel UAV Platform Equipped with a Thermal Infrared and Multispectral Sensor. Remote Sens. 2020, 12, 1075. [Google Scholar] [CrossRef] [Green Version]
  34. Gerhards, M.; Schlerf, M.; Mallick, K.; Udelhoven, T. Challenges and Future Perspectives of Multi-/Hyperspectral Thermal Infrared Remote Sensing for Crop Water-Stress Detection: A Review. Remote Sens. 2019, 11, 1240. [Google Scholar] [CrossRef]
  35. Calderón, R.; Navas-Cortés, J.A.; Lucena, C.; Zarco-Tejada, P.J. High-Resolution Airborne Hyperspectral and Thermal Imagery for Early Detection of Verticillium Wilt of Olive Using Fluorescence, Temperature and Narrow-Band Spectral Indices. Remote Sens. Environ. 2013, 139, 231–245. [Google Scholar] [CrossRef]
  36. O’Shaughnessy, S.A.; Evett, S.R.; Colaizzi, P.D.; Howell, T.A. A Crop Water Stress Index and Time Threshold for Automatic Irrigation Scheduling of Grain Sorghum. Agric. Water Manag. 2012, 107, 122–132. [Google Scholar] [CrossRef] [Green Version]
  37. Khanal, S.; Fulton, J.; Shearer, S. An Overview of Current and Potential Applications of Thermal Remote Sensing in Precision Agriculture. Comput. Electron. Agric. 2017, 139, 22–32. [Google Scholar] [CrossRef]
  38. Panigada, C.; Rossini, M.; Meroni, M.; Cilia, C.; Busetto, L.; Amaducci, S.; Boschetti, M.; Cogliati, S.; Picchi, V.; Pinto, F.; et al. Fluorescence, PRI and Canopy Temperature for Water Stress Detection in Cereal Crops. Int. J. Appl. Earth Obs. Geoinf. 2014, 30, 167–178. [Google Scholar] [CrossRef]
  39. Pinter, P.J., Jr.; Hatfield, J.L.; Schepers, J.S.; Barnes, E.M.; Moran, M.S.; Daughtry, C.S.T.; Upchurch, D.R. Remote Sensing for Crop Management. Photogramm. Eng. Remote Sens. 2003, 69, 647–664. [Google Scholar] [CrossRef] [Green Version]
  40. Loizzo, R.; Guarini, R.; Longo, F.; Scopa, T.; Formaro, R.; Facchinetti, C.; Varacalli, G. Prisma: The Italian Hyperspectral Mission. In Proceedings of the Igarss 2018—2018 IEEE International Geoscience and Remote Sensing Symposium, Valencia, Spain, 22–27 July 2018; pp. 175–178. [Google Scholar]
  41. Schickling, A.; Chabrillat, S.; Storch, T.; Fischer, S. Enmap: The German Spaceborne Imaging Spectroscopy Mission. In Proceedings of the OSA Optical Sensors and Sensing Congress 2021 (AIS, FTS, HISE, SENSORS, ES) (2021), Washington, DC, USA, 19–23 July 2021; p. HF4E.1. [Google Scholar]
  42. Rast, M.; Nieke, J.; Adams, J.; Isola, C.; Gascon, F. Copernicus Hyperspectral Imaging Mission for the Environment (Chime). In Proceedings of the 2021 IEEE International Geoscience and Remote Sensing Symposium IGARSS, Brussels, Belgium, 11–16 July 2021; pp. 108–111. [Google Scholar]
  43. Thompson, D.R.; Bearden, D.; Brosnan, I.; Cawse-Nicholson, K.; Chrone, J.; Green, R.O.; Glenn, N.; Guild, L.; Hook, S.J.; Kokaly, R.; et al. NASA’s Surface Biology and Geology Concept Study: Status and Next Steps. In Proceedings of the 2021 IEEE International Geoscience and Remote Sensing Symposium (IGARSS), Brussels, Belgium, 11–16 July 2021; pp. 112–114. [Google Scholar]
  44. Keys to Soil Taxonomy; U.S. Department of Agriculture, Natural Resources Conservation Service, National Soil Survey Center: Lincoln, NE, USA, 2015.
  45. Michéli, E.; Schad, P.; Dent, D.; Nachtergaele, F.O.; Spaargaren, O.C. World Reference Base for Soil Resources, 2006; FAO (Food and Agriculture Organization of the United Nations), Ed.; Food and Agriculture Organization of the United Nations: Rome, Italy, 2006. [Google Scholar]
  46. Previtali, F. Pedoenvironments of the Mediterranean Countries: Resources and Threats. In Soil Security for Ecosystem Management: Mediterranean Soil Ecosystems 1; Kapur, S., Erşahin, S., Eds.; SpringerBriefs in Environment, Security, Development and Peace; Springer International Publishing: Cham, Switzerland, 2014; pp. 61–82. ISBN 978-3-319-00699-4. [Google Scholar]
  47. De Alba, S. Modeling the Effects of Complex Topography and Patterns of Tillage on Soil Translocation by Tillage with Mouldboard Plough. J. Soil Water Conserv. 2001, 56, 335–345. [Google Scholar]
  48. De Miguel, E.; Fernandez-Renau, A.; Prado, E.; Jimenez, M.; De La Camara, O.G.; Lines, C.; Gomez, J.A.; Martin, A.I.; Munoz, F. The Processing of CASI-1500i Data at INTA PAF. EARSeL eProc. 2014, 13, 30–37. [Google Scholar]
  49. De Miguel, E.; Fernandez-Renau, A.; Prado, E.; Jimenez, M.; De La Camara, O.G.; Lines, C.; Gomez, J.A.; Martin, A.I.; Munoz, F. A Review of INTA AHS PAF. EARSeL eProc. 2014, 13, 20–29. [Google Scholar]
  50. Schläpfer, D.; Richter, R. Geo-Atmospheric Processing of Airborne Imaging Spectrometry Data—Part 1: Parametric Orthorectification. Int. J. Remote Sens. 2002, 23, 2631–2649. [Google Scholar] [CrossRef]
  51. Richter, R.; Schläpfer, D. Atmospheric/Topographic Correction for Airborne Imagery (ATCOR-4 User Guide, Version 7.4, September 2021); ReSe Applications LLC: Wil, Switzerland, 2014. [Google Scholar]
  52. de Miguel, E.; Carrascosa, V.B.; Lagosr, M.G.; Michavila, M.J.; Schmid, T.; de la Cámara, Ó.G. Quality of INTA-AHS Images for Estimating Apparent Thermal Inertia in Soils. In Proceedings of the IGARSS 2018—2018 IEEE International Geoscience and Remote Sensing Symposium, Valencia, Spain, 22–27 July 2018; pp. 3311–3314. [Google Scholar]
  53. Wold, H. Estimation of Principal Components and Related Models by Iterative Least Squares. In Multivariate Analysis; Academic Press: New York, NY, USA, 1966; pp. 391–420. [Google Scholar]
  54. Chen, J.; Gu, S.; Shen, M.; Tang, Y.; Matsushita, B. Estimating Aboveground Biomass of Grassland Having a High Canopy Cover: An Exploratory Analysis of in Situ Hyperspectral Data. Int. J. Remote Sens. 2009, 30, 6497–6517. [Google Scholar] [CrossRef]
  55. Feilhauer, H.; Asner, G.P.; Martin, R.E.; Schmidtlein, S. Brightness-Normalized Partial Least Squares Regression for Hyperspectral Data. J. Quant. Spectrosc. Radiat. Transf. 2010, 111, 1947–1957. [Google Scholar] [CrossRef]
  56. Abdi, H. Partial Least Squares Regression and Projection on Latent Structure Regression (PLS Regression). WIREs Comput. Stat. 2010, 2, 97–106. [Google Scholar] [CrossRef]
  57. Otto, M. Chemometrics: Statistics and Computer Application in Analytical Chemistry, 3rd ed.; Wiley-VCH: Weinheim, Germany, 2016; ISBN 978-3-527-34097-2. [Google Scholar]
  58. Kruskal, W.H.; Wallis, W.A. Use of Ranks in One-Criterion Variance Analysis. J. Am. Stat. Assoc. 1952, 47, 583–621. [Google Scholar] [CrossRef]
  59. Mann, H.B.; Whitney, D.R. On a Test of Whether One of Two Random Variables Is Stochastically Larger than the Other. Ann. Math. Stat. 1947, 18, 50–60. [Google Scholar] [CrossRef]
  60. McKight, P.E.; Najab, J. Kruskal-Wallis Test. In The Corsini Encyclopedia of Psychology; American Cancer Society, Wiley & Sons: New York, NY, USA, 2010; p. 1. ISBN 978-0-470-47921-6. [Google Scholar]
  61. Fisher, R.A. Statistical Methods for Research Workers. In Breakthroughs in Statistics: Methodology and Distribution; Kotz, S., Johnson, N.L., Eds.; Springer Series in Statistics; Springer: New York, NY, USA, 1992; pp. 66–70. ISBN 978-1-4612-4380-9. [Google Scholar]
  62. Fuchs, M. Infrared Measurement of Canopy Temperature and Detection of Plant Water Stress. Theor. Appl. Climatol. 1990, 42, 253–261. [Google Scholar] [CrossRef]
  63. Alghory, A.; Yazar, A. Evaluation of Crop Water Stress Index and Leaf Water Potential for Deficit Irrigation Management of Sprinkler-Irrigated Wheat. Irrig. Sci. 2019, 37, 61–77. [Google Scholar] [CrossRef]
  64. Rosenberg, O.; Cohen, Y.; Saranga, Y.; Levi, A.; Alchanatis, V. Comparison of Methods for Field Scale Mapping of Plant Water Status Using Aerial Thermal Imagery. In Precision Agriculture ’13; Stafford, J.V., Ed.; Academic Publishers: Wageningen, The Netherlands, 2013; pp. 185–192. [Google Scholar]
  65. Idso, S.B. Non-Water-Stressed Baselines: A Key to Measuring and Interpreting Plant Water Stress. Agric. Meteorol. 1982, 27, 59–70. [Google Scholar] [CrossRef]
  66. Hersbach, H.; Bell, B.; Berrisford, P.; Hirahara, S.; Horányi, A.; Muñoz-Sabater, J.; Nicolas, J.; Peubey, C.; Radu, R.; Schepers, D.; et al. The ERA5 Global Reanalysis. Q. J. R. Meteorol. Soc. 2020, 146, 1999–2049. [Google Scholar] [CrossRef]
  67. Krishna, G.; Sahoo, R.N.; Singh, P.; Patra, H.; Bajpai, V.; Das, B.; Kumar, S.; Dhandapani, R.; Vishwakarma, C.; Pal, M.; et al. Application of Thermal Imaging and Hyperspectral Remote Sensing for Crop Water Deficit Stress Monitoring. Geocarto Int. 2019, 36, 481–498. [Google Scholar] [CrossRef]
  68. Alchanatis, V.; Cohen, Y.; Cohen, S.; Moller, M.; Sprinstin, M.; Meron, M.; Tsipris, J.; Saranga, Y.; Sela, E. Evaluation of Different Approaches for Estimating and Mapping Crop Water Status in Cotton with Thermal Imaging. Precis. Agric. 2010, 11, 27–41. [Google Scholar] [CrossRef]
  69. Bian, J.; Zhang, Z.; Chen, J.; Chen, H.; Cui, C.; Li, X.; Chen, S.; Fu, Q. Simplified Evaluation of Cotton Water Stress Using High Resolution Unmanned Aerial Vehicle Thermal Imagery. Remote Sens. 2019, 11, 267. [Google Scholar] [CrossRef] [Green Version]
  70. Breiman, L. Random Forests. Mach. Learn. 2001, 45, 5–32. [Google Scholar] [CrossRef] [Green Version]
  71. Belgiu, M.; Drăguţ, L. Random Forest in Remote Sensing: A Review of Applications and Future Directions. ISPRS J. Photogramm. Remote Sens. 2016, 114, 24–31. [Google Scholar] [CrossRef]
  72. Gambill, D.R.; Wall, W.A.; Fulton, A.J.; Howard, H.R. Predicting USCS Soil Classification from Soil Property Variables Using Random Forest. J. TerraMech. 2016, 65, 85–92. [Google Scholar] [CrossRef]
  73. Hengl, T.; de Jesus, J.M.; Heuvelink, G.B.M.; Gonzalez, M.R.; Kilibarda, M.; Blagotic, A.; Shangguan, W.; Wright, M.N.; Geng, X.; Bauer-Marschallinger, B.; et al. SoilGrids250m: Global Gridded Soil Information Based on Machine Learning. PLoS ONE 2017, 12, e0169748. [Google Scholar] [CrossRef] [Green Version]
  74. Ok, A.O.; Akar, O.; Gungor, O. Evaluation of Random Forest Method for Agricultural Crop Classification. Eur. J. Remote Sens. 2012, 45, 421–432. [Google Scholar] [CrossRef]
  75. Yue, J.; Yang, G.; Feng, H. Comparative of Remote Sensing Estimation Models of Winter Wheat Biomass Based on Random Forest Algorithm. Trans. Chin. Soc. Agric. Eng. 2016, 32, 175–182. [Google Scholar]
  76. Martín-Sotoca, J.J.; Saa-Requejo, A.; Moratiel, R.; Dalezios, N.; Faraslis, I.; Tarquis, A.M. Statistical Analysis for Satellite-Index-Based Insurance to Define Damaged Pasture Thresholds. Nat. Hazards Earth Syst. Sci. 2019, 19, 1685–1702. [Google Scholar] [CrossRef] [Green Version]
  77. Sobrino, J.A.; Raissouni, N.; Li, Z.-L. A Comparative Study of Land Surface Emissivity Retrieval from NOAA Data. Remote Sens. Environ. 2001, 75, 256–266. [Google Scholar] [CrossRef]
  78. Green, A.A.; Berman, M.; Switzer, P.; Craig, M.D. A Transformation for Ordering Multispectral Data in Terms of Image Quality with Implications for Noise Removal. IEEE Trans. Geosci. Remote Sens. 1988, 26, 65–74. [Google Scholar] [CrossRef] [Green Version]
  79. Sharabian, V.R.; Noguchi, N.; Ishi, K. Significant Wavelengths for Prediction of Winter Wheat Growth Status and Grain Yield Using Multivariate Analysis. Eng. Agric. Environ. Food 2014, 7, 14–21. [Google Scholar] [CrossRef]
  80. Bendig, J.; Bolten, A.; Bennertz, S.; Broscheit, J.; Eichfuss, S.; Bareth, G. Estimating Biomass of Barley Using Crop Surface Models (CSMs) Derived from UAV-Based RGB Imaging. Remote Sens. 2014, 6, 10395–10412. [Google Scholar] [CrossRef] [Green Version]
  81. Steduto, P.; Hsiao, T.C.; Raes, D.; Fereres, E. AquaCrop—The FAO Crop Model to Simulate Yield Response to Water: I. Concepts and Underlying Principles. Agron. J. 2009, 101, 426–437. [Google Scholar] [CrossRef] [Green Version]
  82. Jin, X.; Kumar, L.; Li, Z.; Xu, X.; Yang, G.; Wang, J. Estimation of Winter Wheat Biomass and Yield by Combining the AquaCrop Model and Field Hyperspectral Data. Remote Sens. 2016, 8, 972. [Google Scholar] [CrossRef]
  83. Jarmer, T.; Siegmann, B.; Lilienthal, H.; Höfle, B.; Selige, T.; Richter, N. LAI Assessing of Wheat Stands from AISA-Dual Imagery. In Proceedings of the EARSeL 8th EARSeL SIG-Imaging Spectroscopy Workshop, Nantes, France, 8–10 April 2013; p. 5. [Google Scholar]
  84. Marshall, M.; Thenkabail, P. Advantage of Hyperspectral EO-1 Hyperion over Multispectral IKONOS, GeoEye-1, WorldView-2, Landsat ETM+, and MODIS Vegetation Indices in Crop Biomass Estimation. ISPRS J. Photogramm. Remote Sens. 2015, 108, 205–218. [Google Scholar] [CrossRef] [Green Version]
  85. Wengert, M.; Piepho, H.-P.; Astor, T.; Graß, R.; Wijesingha, J.; Wachendorf, M. Assessing Spatial Variability of Barley Whole Crop Biomass Yield and Leaf Area Index in Silvoarable Agroforestry Systems Using UAV-Borne Remote Sensing. Remote Sens. 2021, 13, 2751. [Google Scholar] [CrossRef]
  86. Ceballos, A.; Martínez-Fernández, J.; Santos, F.; Alonso, P. Soil-Water Behaviour of Sandy Soils under Semi-Arid Conditions in the Duero Basin (Spain). J. Arid Environ. 2002, 51, 501–519. [Google Scholar] [CrossRef]
  87. Pinter, P.J.; Fry, K.E.; Guinn, G.; Mauney, J.R. Infrared Thermometry: A Remote Sensing Technique for Predicting Yield in Water-Stressed Cotton. Agric. Water Manag. 1983, 6, 385–395. [Google Scholar] [CrossRef]
  88. Olufayo, A.; Baldy, C.; Ruelle, P. Sorghum Yield, Water Use and Canopy Temperatures under Different Levels of Irrigation. Agric. Water Manag. 1996, 30, 77–90. [Google Scholar] [CrossRef]
  89. Wang, D.-C.; Zhang, G.-L.; Zhao, M.-S.; Pan, X.-Z.; Zhao, Y.-G.; Li, D.-C.; Macmillan, B. Retrieval and Mapping of Soil Texture Based on Land Surface Diurnal Temperature Range Data from MODIS. PLoS ONE 2015, 10, e0129977. [Google Scholar] [CrossRef] [PubMed]
  90. Berndtsson, R.; Larson, M. Spatial Variability of Infiltration in a Semi-Arid Environment. J. Hydrol. 1987, 90, 117–133. [Google Scholar] [CrossRef]
  91. Kosmas, C.; Gerontidis, S.; Marathianou, M.; Detsis, B.; Zafiriou, T.; Nan Muysen, W.; Govers, G.; Quine, T.; Vanoost, K. The Effects of Tillage Displaced Soil on Soil Properties and Wheat Biomass. Soil Tillage Res. 2001, 58, 31–44. [Google Scholar] [CrossRef]
  92. Cammarano, D.; Ronga, D.; Francia, E.; Akar, T.; Al-Yassin, A.; Benbelkacem, A.; Grando, S.; Romagosa, I.; Stanca, A.M.; Pecchioni, N. Genetic and Management Effects on Barley Yield and Phenology in the Mediterranean Basin. Front. Plant Sci. 2021, 12, 655406. [Google Scholar] [CrossRef]
  93. Serrano, L.; Filella, I.; Peñuelas, J. Remote Sensing of Biomass and Yield of Winter Wheat under Different Nitrogen Supplies. Crop Sci. 2000, 40, 723–731. [Google Scholar] [CrossRef]
  94. Cammarano, D.; Ceccarelli, S.; Grando, S.; Romagosa, I.; Benbelkacem, A.; Akar, T.; Al-Yassin, A.; Pecchioni, N.; Francia, E.; Ronga, D. The Impact of Climate Change on Barley Yield in the Mediterranean Basin. Eur. J. Agron. 2019, 106, 1–11. [Google Scholar] [CrossRef]
  95. Baret, F.; Houlès, V.; Guérif, M. Quantification of Plant Stress Using Remote Sensing Observations and Crop Models: The Case of Nitrogen Management. J. Exp. Bot. 2007, 58, 869–880. [Google Scholar] [CrossRef] [Green Version]
  96. Huntingford, C.; Hugo Lambert, F.; Gash, J.H.C.; Taylor, C.M.; Challinor, A.J. Aspects of Climate Change Prediction Relevant to Crop Productivity. Philos. Trans. R. Soc. B Biol. Sci. 2005, 360, 1999–2009. [Google Scholar] [CrossRef] [PubMed] [Green Version]
  97. Jamieson, P.D.; Martin, R.J.; Francis, G.S.; Wilson, D.R. Drought Effects on Biomass Production and Radiation-Use Efficiency in Barley. Field Crop. Res. 1995, 43, 77–86. [Google Scholar] [CrossRef]
  98. Chabrillat, S.; Schmid, T.; Milewski, R.; Escribano, P.; Garcia, M.; Ben-Dor, E.; Guillaso, S.; Pelayo, M.; Reyes, A.; Sobejano-Paz, V.; et al. Mapping Crop Variability Related to Soil Quality and Crop Stress Within Rainfed Mediterranean Agroecosystems Using Hyperspectral Data. In 2018 9th Workshop on Hyperspectral Image and Signal Processing: Evolution in Remote Sensing (Whispers); IEEE: New York, NY, USA, 2018; ISBN 978-1-72811-581-8. [Google Scholar]
  99. Chapman, G.W. The Relation of Iron and Manganese to Chlorosis in Plants. New Phytol. 1931, 30, 266–283. [Google Scholar] [CrossRef]
  100. Chan, J.C.-W.; Paelinckx, D. Evaluation of Random Forest and Adaboost Tree-Based Ensemble Classification and Spectral Band Selection for Ecotope Mapping Using Airborne Hyperspectral Imagery. Remote Sens. Environ. 2008, 112, 2999–3011. [Google Scholar] [CrossRef]
  101. Ham, J.; Chen, Y.; Crawford, M.M.; Ghosh, J. Investigation of the Random Forest Framework for Classification of Hyperspectral Data. IEEE Trans. Geosci. Remote Sens. 2005, 43, 492–501. [Google Scholar] [CrossRef] [Green Version]
  102. Ibarrola-Ulzurrun, E.; Marcello, J.; Gonzalo-Martin, C. Assessment of Component Selection Strategies in Hyperspectral Imagery. Entropy 2017, 19, 666. [Google Scholar] [CrossRef]
  103. Zhang, C. Combining Hyperspectral and Lidar Data for Vegetation Mapping in the Florida Everglades. Photogramm. Eng. Remote Sens. 2014, 80, 733–743. [Google Scholar] [CrossRef] [Green Version]
  104. Fassnacht, F.E.; Neumann, C.; Förster, M.; Buddenbaum, H.; Ghosh, A.; Clasen, A.; Joshi, P.K.; Koch, B. Comparison of Feature Reduction Algorithms for Classifying Tree Species with Hyperspectral Data on Three Central European Test Sites. IEEE J. Sel. Top. Appl. Earth Obs. Remote Sens. 2014, 7, 2547–2561. [Google Scholar] [CrossRef]
  105. Wang, X.; Zhang, Y.; Atkinson, P.M.; Yao, H. Predicting Soil Organic Carbon Content in Spain by Combining Landsat TM and ALOS PALSAR Images. Int. J. Appl. Earth Obs. Geoinf. 2020, 92, 102182. [Google Scholar] [CrossRef]
  106. Gislason, P.O.; Benediktsson, J.A.; Sveinsson, J.R. Random Forests for Land Cover Classification. Pattern Recognit. Lett. 2006, 27, 294–300. [Google Scholar] [CrossRef]
  107. Kluczek, M.; Zagajewski, B.; Kycko, M. Airborne HySpex Hyperspectral Versus Multitemporal Sentinel-2 Images for Mountain Plant Communities Mapping. Remote Sens. 2022, 14, 1209. [Google Scholar] [CrossRef]
  108. Phan, T.N.; Kuch, V.; Lehnert, L.W. Land Cover Classification Using Google Earth Engine and Random Forest Classifier—The Role of Image Composition. Remote Sens. 2020, 12, 2411. [Google Scholar] [CrossRef]
  109. Stehman, S.V.; Foody, G.M. Key Issues in Rigorous Accuracy Assessment of Land Cover Products. Remote Sens. Environ. 2019, 231, 111199. [Google Scholar] [CrossRef]
  110. Heydari, S.S.; Mountrakis, G. Effect of Classifier Selection, Reference Sample Size, Reference Class Distribution and Scene Heterogeneity in per-Pixel Classification Accuracy Using 26 Landsat Sites. Remote Sens. Environ. 2018, 204, 648–658. [Google Scholar] [CrossRef]
  111. Gomez, C.; Oltra-Carrió, R.; Bacha, S.; Lagacherie, P.; Briottet, X. Evaluating the Sensitivity of Clay Content Prediction to Atmospheric Effects and Degradation of Image Spatial Resolution Using Hyperspectral VNIR/SWIR Imagery. Remote Sens. Environ. 2015, 164, 1–15. [Google Scholar] [CrossRef]
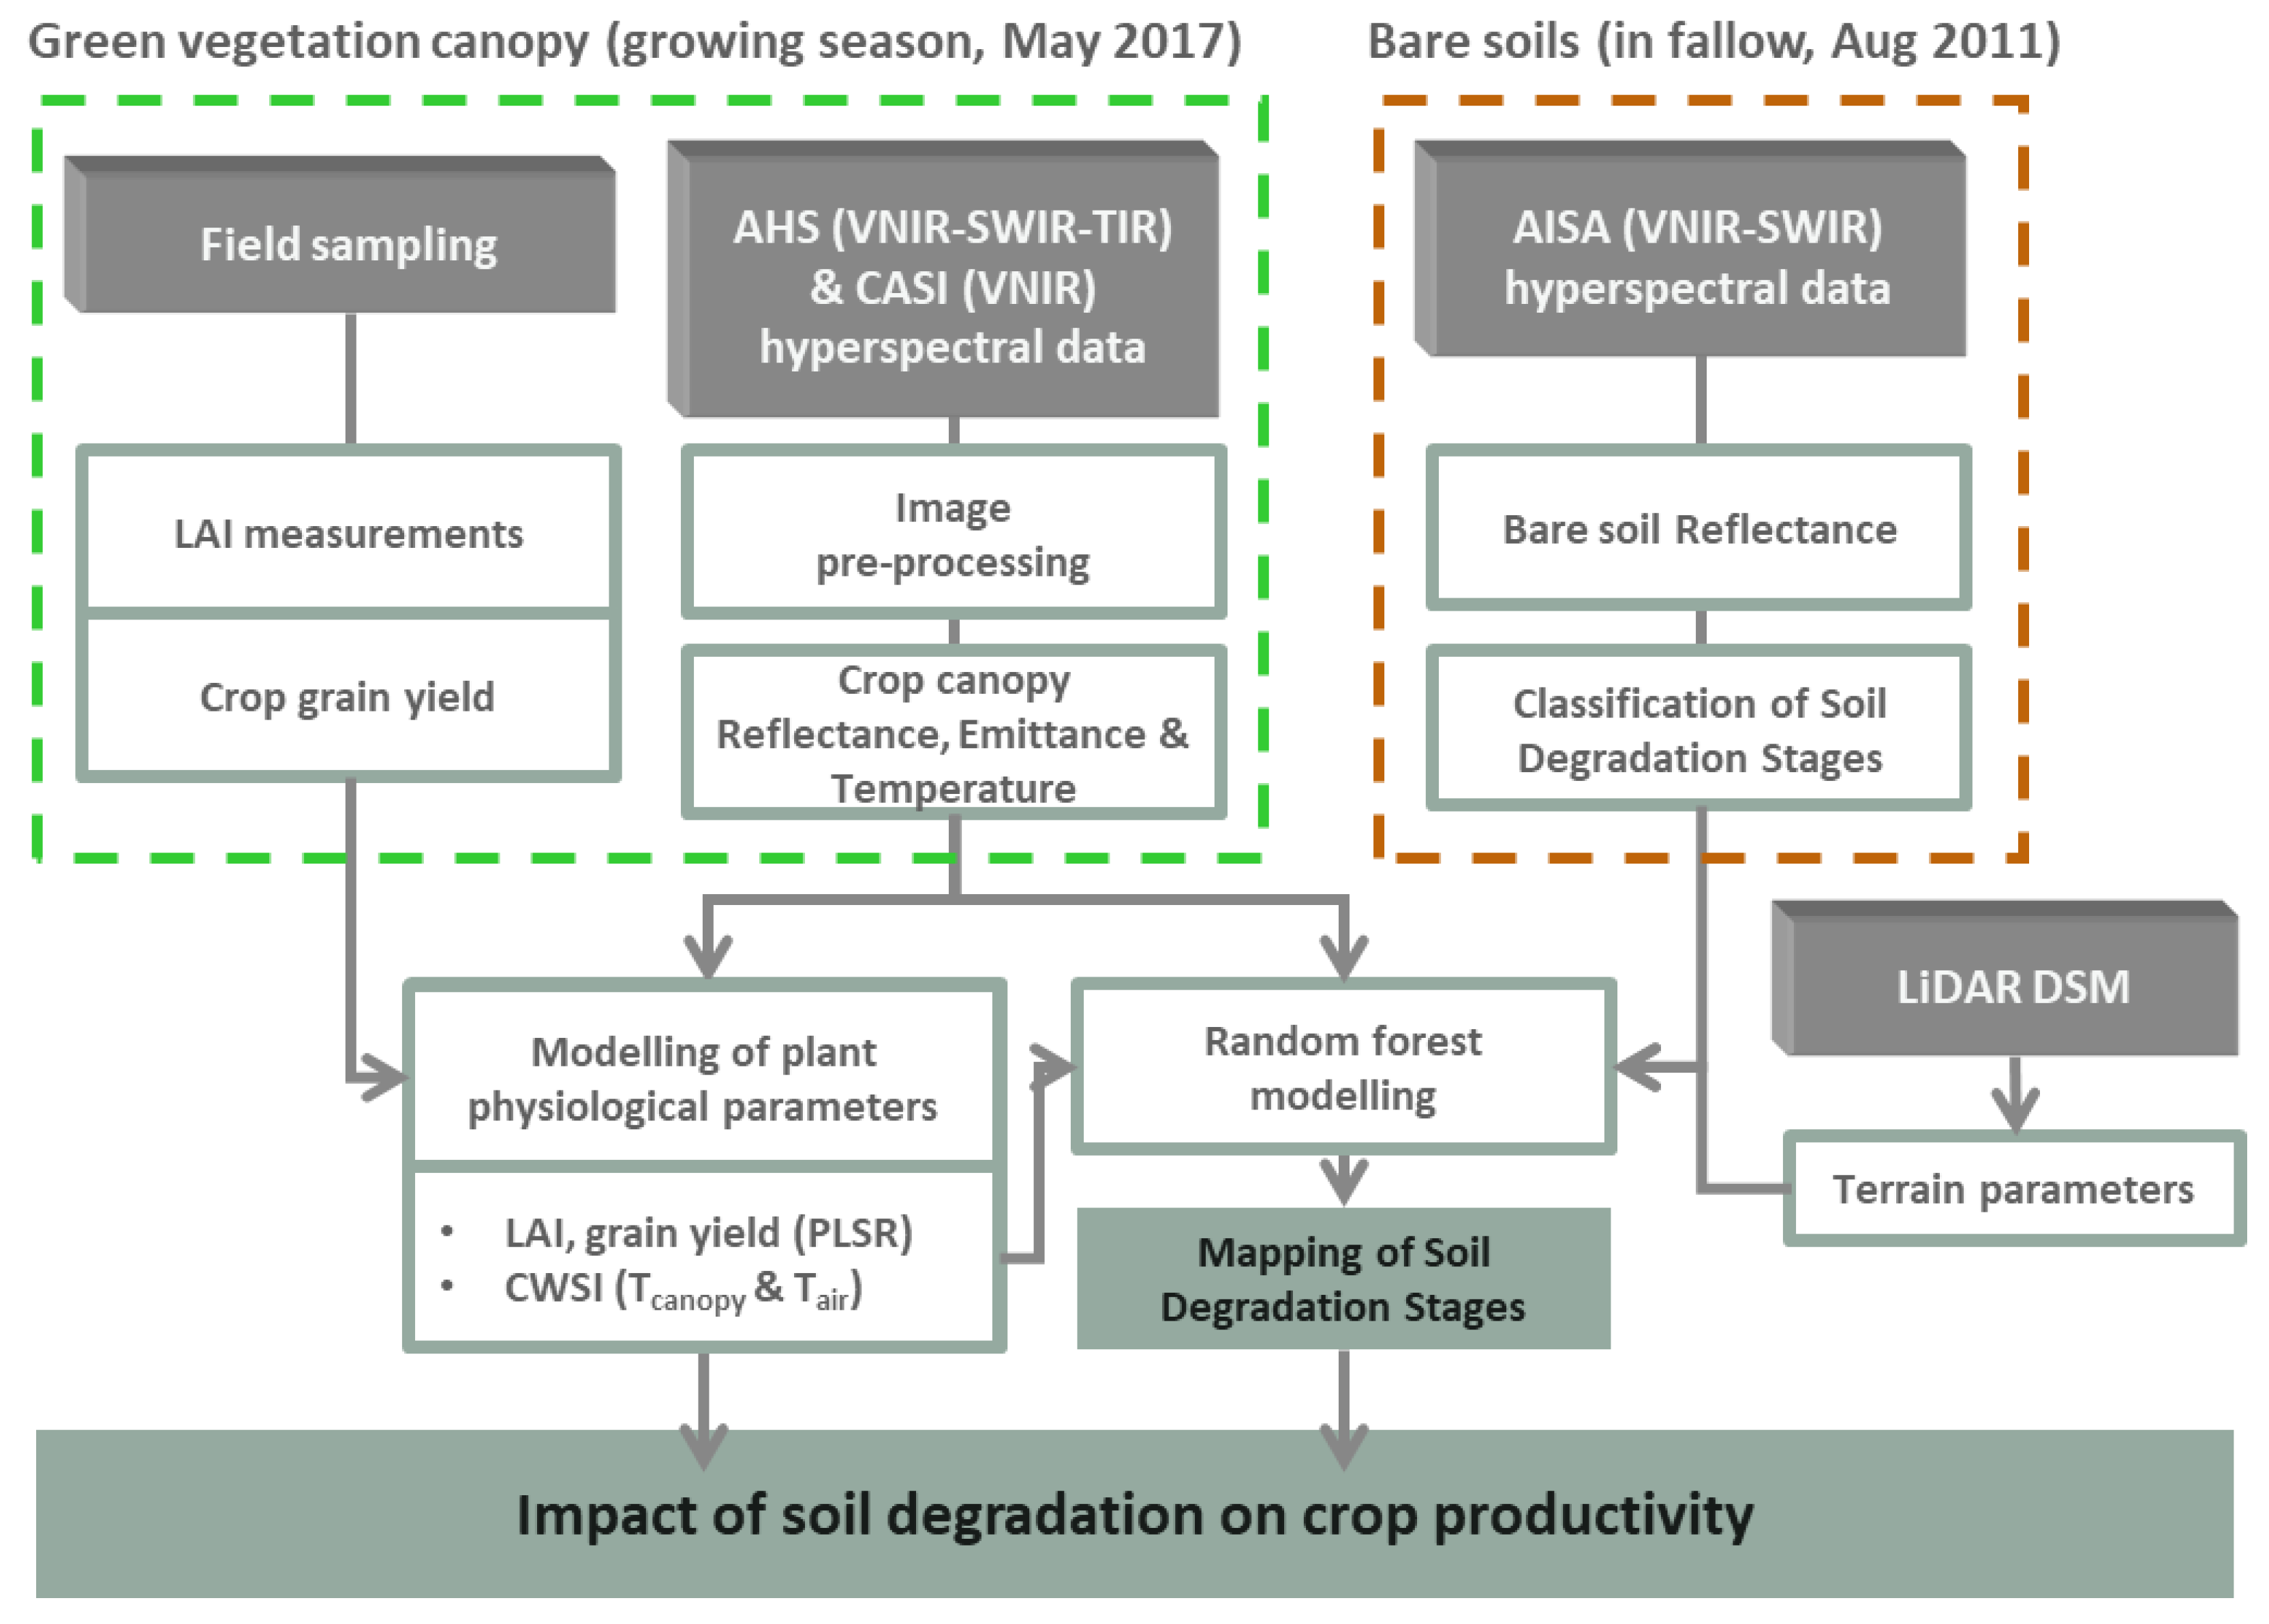
Figure 1. Schematic overview of the methodological framework applied in this study, including acquired datasets, pre-processing, and spectral modelling steps.
Remotesensing 14 05131 g001
Figure 2. Study site region with airborne data coverage.
Remotesensing 14 05131 g002
Figure 3. Description of SEAS symbology based on Schmid et al. (2016) [22].
Remotesensing 14 05131 g003
Figure 4. (A) Mapping of SEAS modified based on Schmid et al. (2016) [19] and highlight of (B) northern and (C) southern crop field sites of interest.
Remotesensing 14 05131 g004
Figure 5. CASI true-color RGB (R: 0.64 µm G: 0.55 µm B: 0.44 µm) mosaic of the area of study with (A) location of the crop fields of interest, (B) zoom on the E1 area, (C) zoom on the SU area. Red dots and labels indicate location of field plots.
Remotesensing 14 05131 g005
Figure 6. Field measurements at agricultural field plots: (A) Crop (dry) biomass weight separately for total plant, straw, and grain, (B) LAI and soil moisture.
Remotesensing 14 05131 g006
Figure 7. Measured versus predicted LAI and grain yield based on PLS regression using AHS VNIR–SWIR data: (A) LAI (n = 64) and (B) grain yield (n = 40).
Remotesensing 14 05131 g007
Figure 8. Variable importance in projection (VIP) of AHS spectral bands obtained by PLS regression for (A) LAI and (B) grain yield estimation.
Remotesensing 14 05131 g008
Figure 9. Field plot SU: Spatial distribution of estimated (A) LAI and (B) Grain yield; (C) CWSI compared with (D) Bare soil classification of SEAS of Schmid et al. (2015).
Remotesensing 14 05131 g009
Figure 10. Field plot E1: Spatial distribution of estimated (A) LAI and (B) Grain yield; (C) CWSI compared with (D) Bare soil classification of SEAS of Schmid et al. (2015).
Remotesensing 14 05131 g010
Figure 11. Median plots of biophysical parameters grouped across SEAS for field site SU (top row): (A) LAI and (B) grain yield, and field site E1 (second row): (C) LAI and (D) grain yield. Different letters on top of bars indicate significant statistical differences of parameters at 5% probability level between SEAS and same letters show no significant differences according to Kruskal–Wallis testing. Whiskers indicate the IQR of the parameter distribution.
Remotesensing 14 05131 g011
Figure 12. Accuracy matrix of best SEAS RF model (OA: 71.2%).
Remotesensing 14 05131 g012
Figure 13. Classification of SEAS based on best RF prediction for field plot SU (left) and E1 (right). Black pixel represents misclassification of the RF model.
Remotesensing 14 05131 g013
Table 1. CASI-1500i spectral configuration [48].
VNIR
Coverage [µm]0.38–1.05
Bandwidth [FWHM]3 nm
Number of Bands288 (144 binned)
Table 2. AHS spectral configuration [49], the MIR bands (3.3–5.4 µm) have not been acquired.
VNIRSWIR ISWIR IITIR
Coverage [µm]0.43–1.031.55–1.651.90–2.558.00–12.70
Bandwidth [FWHM]28 nm90 nm18 nm450 nm
Number of Bands2014210
Table 3. Summary statistics of field data collected at test sites SU, E1, and TS.
Site Name Total Grain [kg/ha]Total Straw [kg/ha]Total Plant [kg/ha]LAI [m2/m2]TDR Moisture [vol%]
SUMin14128012940.333.20
Max2108456166691.6419.73
Mean830277736070.9810.68
Std63079513380.384.61
E1Min2375848200.233.60
Max1509285942690.6310.07
Mean883169925810.396.50
Std3146418890.102.35
TSMin---0.223.43
Max---0.9813.27
Mean---0.526.85
Std---0.192.54
Table 4. Performance of RF classification of SEAS using different sets of covariates.
RF Data BasisOverall Accuracy
MNF of (CASI VNIR + AHS SWIR–TIR) + DEM + MP *71.2
MNF of (CASI VNIR + AHS SWIR–TIR) + DEM71.1
MNF of (CASI VNIR + AHS SWIR–TIR)68.8
MNF of (AHS VNIR–SWIR–TIR) + DEM68.0
MNF of (AHS VNIR–SWIR–TIR)67.9
AHS VNIR–SWIR–TIR + DEM63.9
CASI VNIR + AHS SWIR–TIR62.5
AHS VNIR–SWIR–TIR60.1
AHS VNIR–SWIR56.3
CASI VNIR55.8
AHS VNIR51.3
* MP—modeled parameters (LAI, CWSI, grain yield).
Publisher’s Note: MDPI stays neutral with regard to jurisdictional claims in published maps and institutional affiliations.