Article

AgSAT: A Smart Irrigation Application for Field-Scale Daily Crop ET and Water Requirements Using Satellite Imagery

Department of Agriculture, Faculty of Agricultural and Food Sciences, American University of Beirut, Beirut 2020-1100, Lebanon
*
Author to whom correspondence should be addressed.
Remote Sens. 2022, 14(20), 5090; https://doi.org/10.3390/rs14205090
Submission received: 19 August 2022 / Revised: 28 September 2022 / Accepted: 6 October 2022 / Published: 12 October 2022
(This article belongs to the Special Issue Irrigation Estimates and Management from EO Data)

Abstract

:
With the foreseen increase in population and the reliance on water as a key input for agricultural production, greater demand will be placed on freshwater supplies. The objective of this work was to present the newly developed Android smartphone application to calculate crop evapotranspiration in real-time to support field-scale irrigation management. As part of the answer to water shortage, we embraced technology by developing AgSAT, a Google Earth Engine-based application that optimizes water use for food production. AgSAT uses meteorological data to calculate daily water requirements using the ASCE-Penman–Monteith method (ETref) and vegetation indices from satellite imagery to derive the basal crop growth coefficient, Kcb. The performance of AgSAT to estimate ETref was assessed using climatic data from 18 meteorological stations distributed over several climatic zones worldwide. ETref estimation through the app showed acceptable results with values of 1.27, 0.9, 0.79, 0.95, and 0.5 for root mean square error (RMSE), correlation coefficient (r), modeling efficiency (NSE), concordance index (d), and percentage bias (Pbias), respectively. AgSAT guides gross irrigation requirements for crops and rationalizes water quantities used in agricultural production. AgSAT has been released, is currently in use by research scientists, agricultural producers, and irrigation managers, and is freely accessible from the Google Play and IOS Store and also at agsat.app. Our work is geared towards the development of remote sensing-based technologies that transfer significant benefits to farmers and water-saving efforts.

1. Introduction

About 85% of the total water resources available worldwide are exclusively used for irrigation purposes [1]. Smartly managing these freshwater resources for precision irrigation in agriculture is essential for enhancing crop yield and water productivity, improving irrigation scheduling, and decreasing farming costs while sustaining the environment [2,3,4,5,6,7]. Smart irrigation scheduling has evolved from computer-based tools and programs such as CROPWAT [8], consumptive use program (CUP) [9], and Washington Irrigation Scheduling Expert (WISE) [10], to recently incorporate the Internet of Things (IoT). The IoT emerged as the means for smart water management applications by offering easy-to-use methods and real-time scheduling regarding water availability, crop water requirements, soil and weather conditions, and crop response to stress. In this context, a shift from traditional irrigation methods to real-time smart irrigation automation using low-cost sensors, weather data, and water balance or evapotranspiration modeling approaches is now gaining attention [11].
Many researchers reported using internet and communication tools (ICT) in irrigation applications [12,13]. ICT include cloud-based technologies for data acquisition transmission and management, soil–plant–atmosphere and irrigation performance monitoring, and remote control of the irrigation process [14]. The literature shows a plethora of applications of ICT in irrigation systems at the irrigation district-scale including using remote sensing, crop modeling, linear regressions, and neural approaches for water demand forecast, and remote control of irrigation processes (see, for example, Bartlett et al. [15]; Sesma et al. [16], Pulido-Calvo et al. [17]). Perea et al. [18] established an ICT-based system for scheduling and managing irrigation at the micro-scale level (i.e., a strawberry farm), using the principles of precision irrigation. However, many of these tools remain within the realm of research institutions, and few reach out to farmers for direct field applications, leaving them with limited on-farm technology access and with reliance on traditional irrigation scheduling methods that often reduce yield and water productivity.
There is also growing attention towards the development of web and software-based irrigation scheduling tools for estimating site-specific water requirements at various scales, which has better chances of farmer’s accessibility. One of the most significant advantages of using smartphone applications is that they represent instances of portable and simple-to-use technology, allowing for real-time decision-making. Some of these tools integrate real-time weather data with crop-specific ET or water budgeting methods [19,20,21]. Some web-based applications have also been developed, such as Wateright [22], and Crop Manage [23]. Moreover, several public agencies have developed online irrigation scheduling services, including IRRINET in Italy [24], IrriSatSMS [25] in Australia, IRRISA in France [26], and ISS-ITAP in Spain [27].
Although the earlier mentioned irrigation scheduling systems’ (e.g., ICs, sensors, web platforms, apps, and online irrigation services) costs are generally falling, for growers of moderate- to low-profit crops, this technology may still be cost-unaffordable if it does not significantly increase farmer income [28]. In addition, the computerized irrigation technologies have limited on-field applicability due to the need for desktop computers, which represents one other significant barrier that hampers their adoption by farmers. Such web-based tools may have limited user interaction and rely heavily on frequent user-follow up using a laptop or desktop computer. Farmers readily adopt simple technologies that require limited knowledge and skills, such as auto-steer machinery, irrigation pivots, sprinklers, and others. However, the implementation of information-intensive technologies is often limited. These innovations may require further investments in hiring external services to train farmers [29,30,31]. While the available literature has tended to focus on major advancements in smart irrigation applications, many agricultural regions in the world lack the availability of the above technologies. Less-skilled farmers in countries where agriculture is viewed as a chief economic sector are often held back from the potential adoption of such technologies.
The increased use of smartphones, combined with weather data availability, has created an excellent environment for developing and deploying smartphone applications for calculating crop water requirements in near real-time. Several smart irrigation mobile apps were designed using this approach. In contrast to web-based tools, smartphone applications provide increased operational flexibility, simplicity in control, and continuous user–tool interaction. Smart Irrigation apps (for example, those developed by the Universities of Florida and Georgia) may offer real-time irrigation schedules for commercially valuable seasonal and perennial selected crops, including strawberry, avocado, citrus, peanut, cotton, and vegetables. The irrigation schedule is based on the integration of weather and short-term forecasted data with crop evapotranspiration (ETc) or water balance approach. Such apps are customized according to the users’ practices in terms of the used irrigation systems, splitting irrigation events, water conservation options, and other management methods. While the limitation of these apps is the spatial variability of rainfall, their validation over multiple seasons at field level in water savings for lawn, tomato, and citrus are 57, 33, and 24%, respectively [18,32,33]. Blueleaf is another example of a smartphone application developed in partnership with IAM (Institut Agronomique Méditerannéen) of Bari (Italy), the CNR of Italy, and a consortium of Italian enterprises [12]. Daily soil-water balance is modeled based on station weather data, and farmers need to add a range of required information into the application and install a soil moisture probe, making the app laborious to use. Another example of smartphone apps with similar capabilities is the Colorado State University WISE Irrigation Scheduler [15]. Recently, the EVAPO app was developed that provides reference point ET data based on the NASA-POWER system. However, the grid size of the weather data has a spatial resolution of 1 × 1°, or 12347 km2 (111.12 × 111.12 km) at the equator [34].
Evapotranspiration is a key parameter for hydrological and climatological studies, as well as for agricultural water resources management, such as irrigation management and planning. Several empirical methods to estimate reference evapotranspiration have been developed in the past 50 years, with the ASCE-Penman–Monteith method being the most accurate one under different climatic conditions [35]. The availability of high spatial resolutions of satellite imagery that is publicly available nowadays (such as the Sentinel-2 imagery from the Copernicus mission of the European Space Agency) and the long period of records of Landsat imagery provides opportunities to develop operational and global evapotranspiration (ET) datasets at field scales [36]. Our innovation avoids scalability limitations and diverts from the availability of on-farm weather stations and soil sensors.
We developed the first global smart irrigation application (AgSAT), that relies on remote sensing and gridded global weather data forecasts and, as such, has near real-time operational capability. The application was released to the Google Play store in English and Arabic. The app performs on-demand satellite and climate data processing through Google’s Earth Engine-enabling environment. It provides crop water requirements based on crop growth coefficients derived from remotely sensed vegetation indices at a resolution of 10m and based on reference evapotranspiration calculated every six hours and populated to the daily interval from the coupled rorecast system model version 2 (CFSV2). The objectives of this study were to (1) provide a general overview of the AgSAT app, (2) evaluate the remote-sensing-based approach for calculating ETref through comparison against meteorological data collected from 18 weather stations at various locations in different climatic regions and temporal scales (daily and monthly), and (3) asses the remotely sensed estimates of ETref and Kc at plot scale over an irrigated potato field, located in Lebanon at the Agriculture Research and Education Center (AREC) during the growing season of 12 March–15 July 2020. Therefore, we aimed to demonstrate the operational application of AgSAT to monitor irrigation water use at the field level and global scales.

2. AgSAT App Conceptual Framework

2.1. Model Overview: Crop Water Requirement Based on FAO 56 Approach

Several studies have reported that the FAO-56 Penman–Monteith (FAO-PM) model, which has been tested in many regions of the world, is renowned for being the most accurate under different climatic conditions [35]. The model for crop water requirements used in the AgSAT app is based on the FAO-56 approach. We provided, herein, a brief description of the main calculations. The FAO-56 is based on the concept of reference evapotranspiration for standard, well-watered crops by crop coefficients to account for the influences of ET during the growing season. Therefore, the actual crop evapotranspiration is estimated as follows:
E T = K c b × E T r e f
where ET is the actual evapotranspiration, Kcb is the basal crop coefficient, and ETref is the reference evapotranspiration.
AgSAT calculates the ASCE Standardized Penman–Monteith evapotranspiration product (ETref) using the 6 h CFSV2 gridded (0.2 arc degrees) weather dataset available in Google Earth Engine data generated by the National Centers for Environmental Prediction (NCEP) of the National Oceanic and Atmospheric Administration (NOAA) [36]. The CFSV2 version 2 was developed at the Environmental Modeling Center at NCEP. CFSV2 is a fully coupled model representing the interaction between the Earth’s atmosphere, oceans, land, and sea ice. Currently, CFSV2 is the global weather reanalysis and forecast with the highest temporal and spatial resolution to allow for real-time reference evapotranspiration calculations and forecasts on Google Earth Engine. Other available datasets or systems (e.g., GLDAS, NASA-POWER, ECMWF) are either unavailable in near real-time unless paid for or have a lower resolution. Each grid of the CFSV2 file covers an approximate area of 490 km2. We used the weather variables in Table 1 for deriving ETref after adjusting the wind-speed to 2 m height. In the ASCE-Penman–Monteith equation, the surface resistance rs is computed from the leaf area index (LAI), which is a function of the height specified for the reference type, usually either grass or alfalfa. Algorithms for LAI depend on the reference type. Therefore, the value of rs (and the aerodynamic resistance ra) will change with the height specified for the reference. Based on the ASCE LAI algorithms, the values for rs for 24-hour time steps are rs = 70 s m−1 for 0.12 m tall grass and rs = 45 s m−1 for 0.5 m tall alfalfa. Because the Penman–Monteith equation is well-documented in the scientific literature, we did not repeat its presentation in this paper.
The basal crop coefficient (Kcb) is a major variable determining crop transpiration, and its estimation is necessary to determine crop water use. Crop coefficients have been shown to correlate well with satellite-based vegetation indices, making their remote estimation from operational platforms practical [37,38,39]. The normalized difference vegetation index (NDVI) and other vegetation indices such as the soil-adjusted vegetation index (SAVI) and the enhanced vegetation index (EVI) have been used as the main operational parameters to monitor vegetation status using Earth Observation. These indices rely on the difference in reflectance of vegetation (between the near-infrared band heavily reflected by healthy vegetation and the red-band absorbed for photosynthesis). In 2015, the Copernicus ESA mission made available the highest resolution (10 m) remotely sensed satellite imagery from the Sentinel-2 satellite. Sentinel-2 is now available at 5-day revisit time, making its utilization in vegetation monitoring helpful. We utilized the red (Band 4) and the near-infrared band (Band 8A) of Sentinel-2 to derive the normalized difference vegetation index and the soil-adjusted vegetation index (SAVI). Several researchers have provided empirical equations to derive the crop coefficients from the NDVI and SAVI [38,40,41,42,43]. Kamble, Kilic, and Hubbard [38] developed a simple linear regression model between Kcb calculated from the flux data measured for different crops and cropping practices using AmeriFlux towers and MODIS NDVI. We adopted equations from the literature to derive Kcb according to crop type (Table A1). We used a generic equation to calculate the crop coefficient surrogate for crops that do not have a corresponding NDVI–Kcb relationship. First, NDVI is transformed into a fractional vegetative cover (Fc) via empirical relationships developed by USDA and NASA [37] as follows:
F c = 1.26 × N D V I 0.18
Kcb is determined using the generic equation as established by Melton et al. [44] following methods described by Allen and Pereira [45]:
K c b = 0.4766 × F c 2 + 1.4048 × F c + 0.15
For the derived NDVI/SAVI at 10 m, we masked out pixels of cloud shadow, adjacent cloud, cloud, and cirrus. We interpolated the NDVI/SAVI from the latest available image for masked pixels to a daily time step. The interpolated NDVI/SAVI were then used to calculate the crop growth coefficient. Finally, the crop coefficient is multiplied by the daily reference evapotranspiration for the field location as calculated from the gridded weather data and forecasts for that location.
To calculate irrigation requirements, we prompt the user to input the on-farm irrigation system, from which an irrigation efficiency can be assumed (Table 2), based on [46].
Irrigation efficiencies are used to calculate the gross irrigation requirement only if the user delineates the field area (gross irrigation requirement= (net irrigation requirement/irrigation efficiency) * Area, where net irrigation requirement is the actual crop water requirements calculated with an assumption of zero rainfall). Hence, gross water irrigation requirements are provided under dry weather conditions. Once the user selects the valve size irrigating the field, run-times (run time = total irrigation requirement/ discharge of the water pump) are calculated from flow rates assuming design water flow velocity in closed pipes of 1.5 m/s (which is recommended for flow in pressurized closed conduits). Run-times are not calculated for surface irrigation systems and only refer to the total duration of irrigation needed for the field given the system type, the field area, and the valve size (main or submain pipe size irrigating the field). No leaching requirement is included in adjusting the run-time values, and it is assumed that the irrigation efficiencies will handle necessary leaching, except for saline soils or irrigation water. AgSAT also provides a five-day irrigation volume requirement should the user decide to lump irrigations every five days in case the maximum available water in the root zone permits (applicable in almost all soils expect sandy soils and shallow root-zone crops or crops at the initial stages of development which may require more frequent irrigations with small amounts). The system components and workflow of the app are shown in Figure 1.

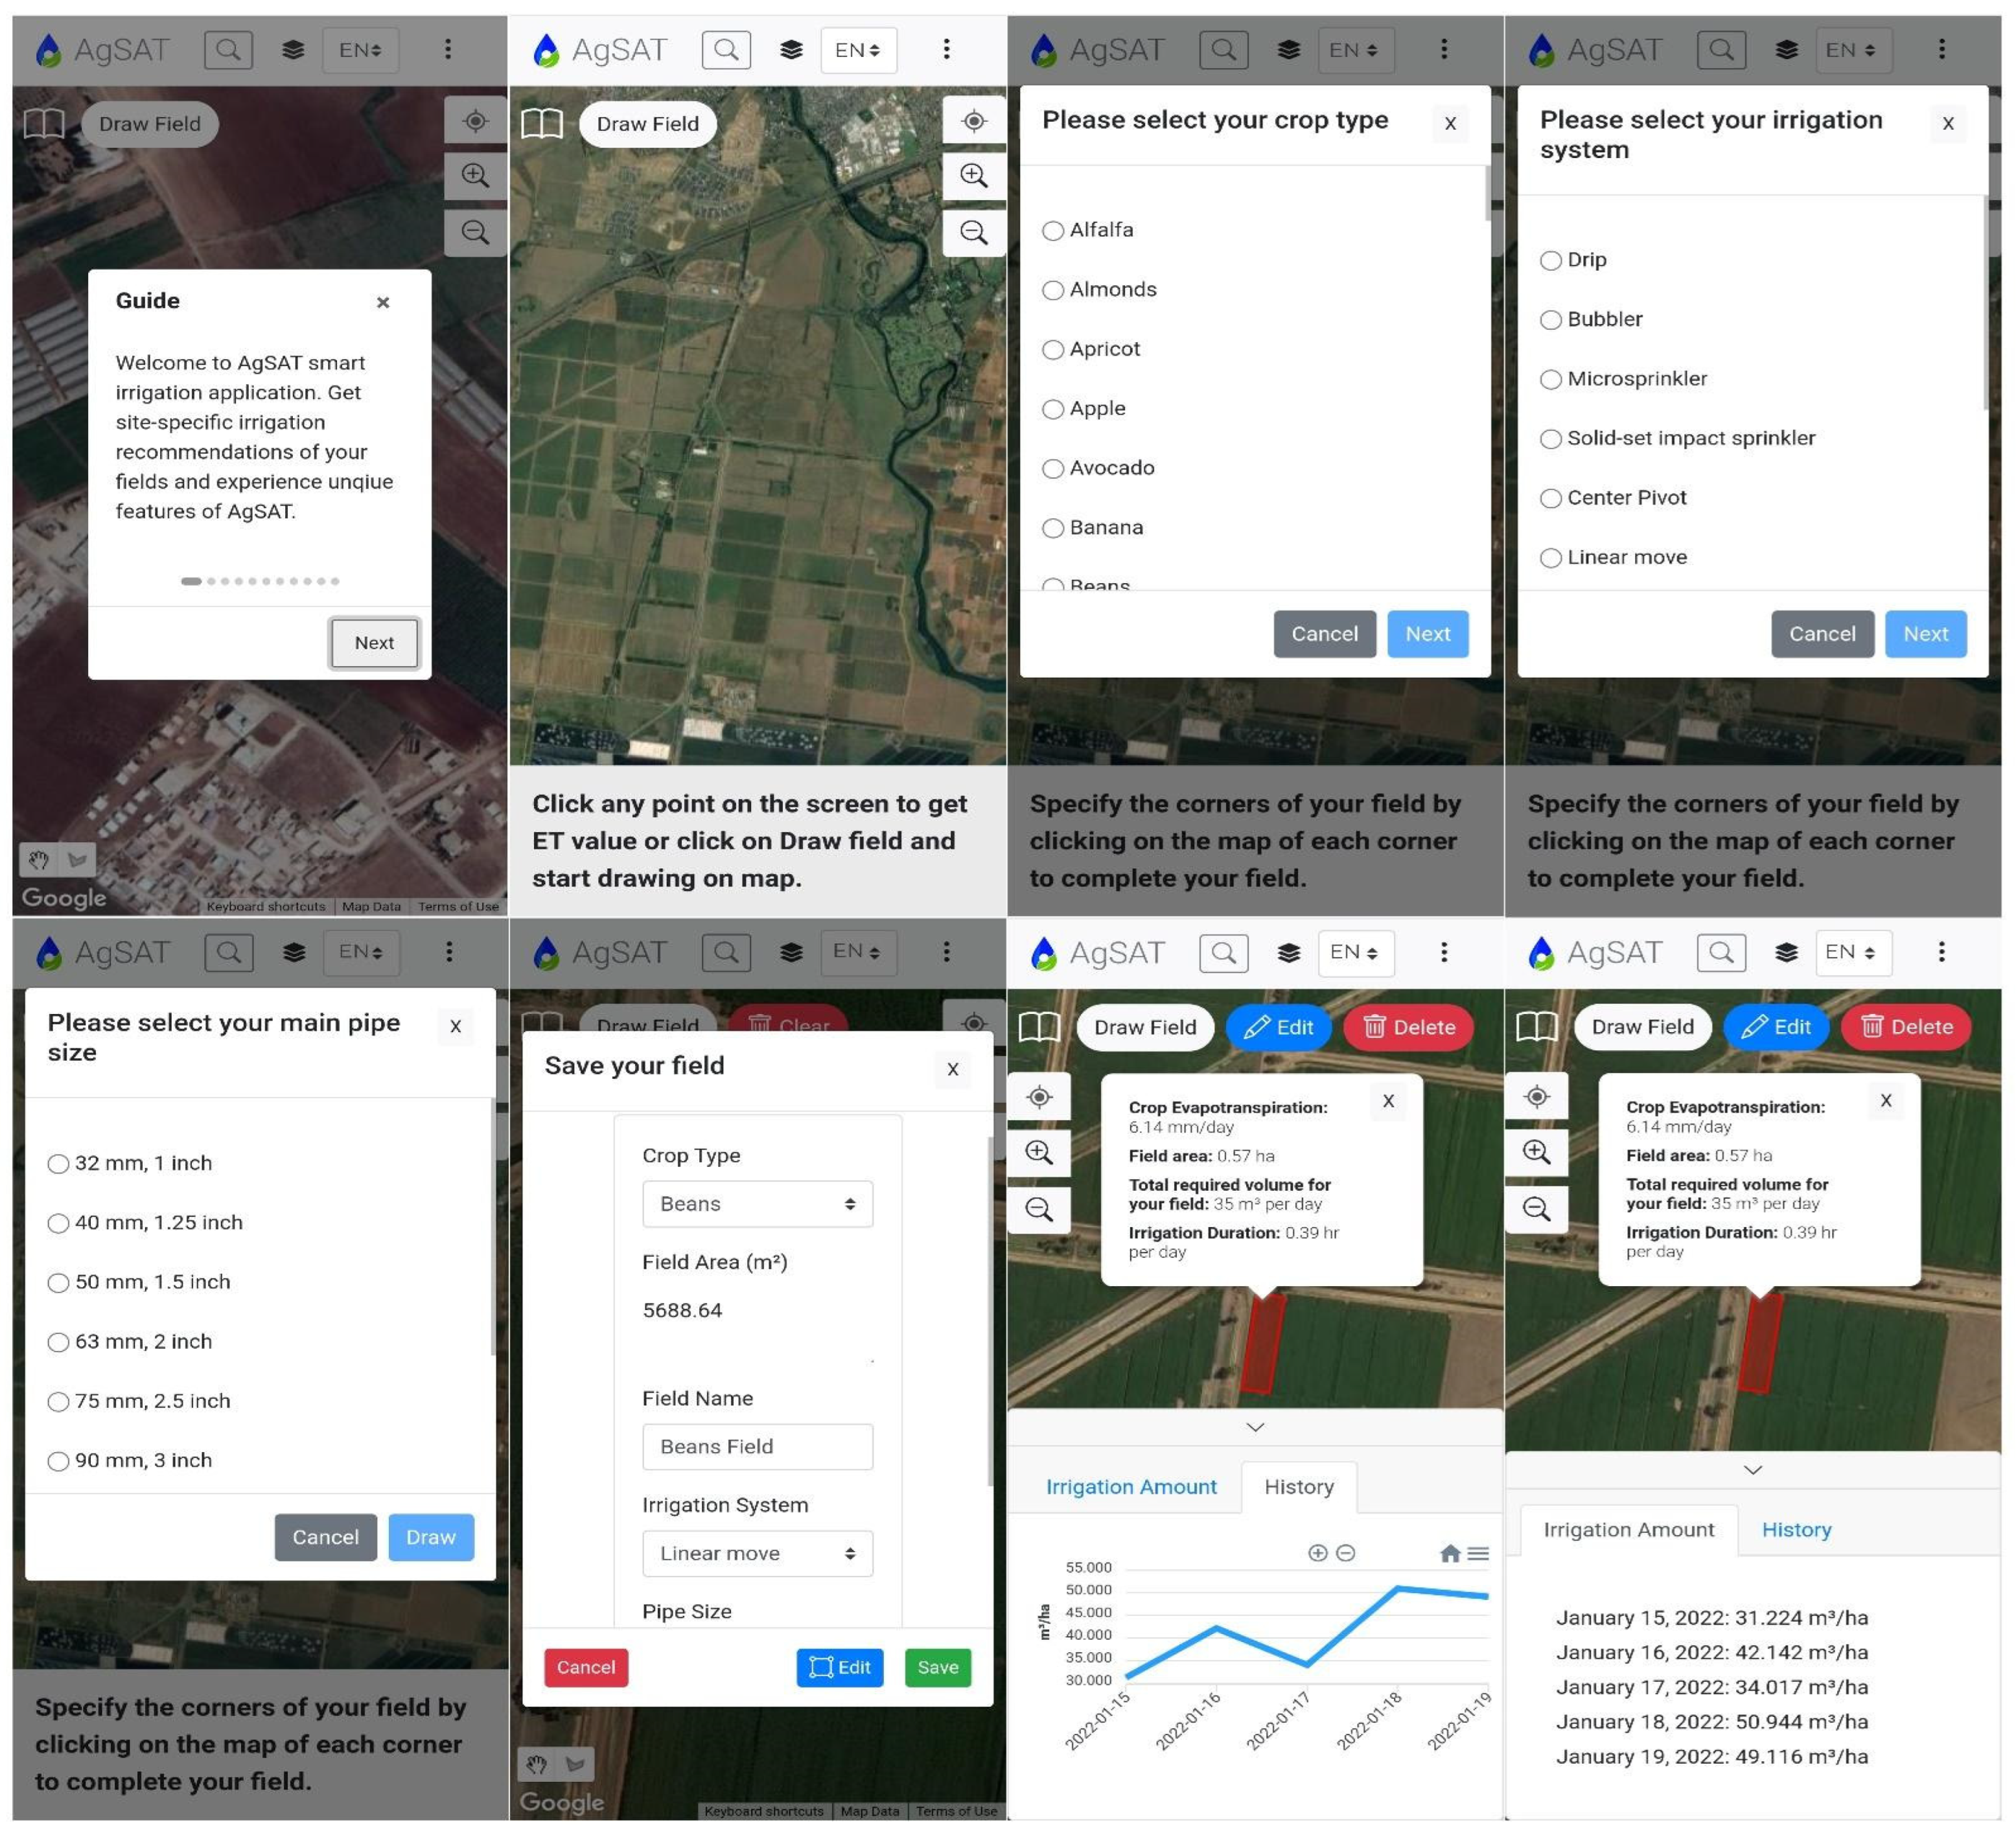
2.2. General Overview of AgSAT App

AgSAT is a smartphone app developed to support irrigation management. This application estimates crop water-use and irrigation demand for several crops at a daily time step. Through a user-friendly interface, farmers can input information specific to their farms. Figure 2 provides a snapshot of the application interface. As the application launches, the user is prompted to grant the app permission to read the location of the device. After that, the user can either pinpoint the field of interest or can simply delineate the field and save it after being prompted to select crop type, irrigation system type (used to estimate irrigation efficiencies), and irrigation pipe size (for delineated fields only, and it ranges from 1′′ to 6′′) from a drop-down list. In conjunction with the data provided by the user, AgSAT provides crop water requirements based on crop growth coefficients derived from remotely sensed vegetation indices (NDVI, SAVI, and Kcb) at a resolution of 10 m and based on reference evapotranspiration calculated every six hours and populated to the daily interval from the coupled forecast system model version 2 (CFSV2). In the ‘history’ tab of the application, five days forecast of irrigation requirements based on ET and Kcb forecasts from preceding satellite imagery is provided. The results are displayed for the user in a popup window with a description for each variable, including crop evapotranspiration (mm/day), the total volume of water requirements (m3/day), and irrigation run-time (based on a system velocity of 1.5 m/s).

2.3. AgSAT Technical Specifications

The app was developed using Java Programming Language for devices with android operational systems. It is available on the Play store for download in two languages (English and Arabic). AgSAT is supported on Android phones with operational system versions 5.1 and above. We used several external libraries to support different functionalities within the app (OKHTTP for support HTTP requests, Firebase AUTH, Firebase Database, Play Core, and MP Android Chart). We used the Firebase Real-Time Database to store and fetch data and Firestore to store assets. Google maps, supported by Maps SDK (Software Development Kit) for Android Utility Library, is the main activity where users can delineate their field(s). AgSAT would require minimum user input to provide precise irrigation values based on advanced back-end computations. Upon clicking the ‘delineate field’ button, the user is prompted to select different field attributes: pipe size (ranging from 1′′ to 6′′), pump strength, and crop type. Once the user selects these details and assigns the corners of the field, the ‘Calculate ET’ button must be clicked to trigger an API request necessary for fetching irrigation usage data for the selected location, considering its latitude and longitude as per Google maps. The returned API results are displayed for the user in a popup window with a description for each value. Additionally, the irrigation forecast along with the irrigation history for already existing fields are displayed in a graph to monitor variations. Another feature of AgSAT is the ability for a user to specify a point location, save it, name a field from the selected point, and get the irrigation value of this point. A field of 50 by 50 m is mimicked for ET calculations by default for a point selection.
The app allows the user to save the selected field information. Once the current field is saved, a screenshot of the delineated field with Google Earth Imagery as the background is captured and stored in the Firebase Database by the users’ device ID. The app allows to list all the selected fields, fetched by device ID as an index. To ensure privacy, users are authenticated anonymously on Firebase with a unique ID. The user is then taken back to the main map page where a new field is selected, and field information is specified. The area of the field and the recommended irrigation duration are calculated in the background.

3. AgSAT ETref Performance Analyses

3.1. Direct Validation of AgSAT ETref against ETref from Various Weather Stations Worldwide

To evaluate the performance of AgSAT, we compared ETref estimated by the AgSAT with the ETref calculated from meteorological data collected from 18 weather stations at various locations in different climatic regions worldwide (USA, South America, Europe, Africa, Asia) (Figure 3). The daily station ETref equation was calculated using the REF-ET software of the University of Idaho. The agrometeorological data used from weather stations were temperature (°C), solar radiation (W m−2), and wind speed (m s−1). Some weather networks included hourly minimum and maximum temperatures. At this step, the daily min/max values were taken as the minimum of the hourly minimum temperatures and a maximum of the hourly maximum temperatures. Clear sky solar radiation was used when solar radiation data was missing. Solar radiation was calculated as recommended in Allen, Walter, Elliott, Howell, Itenfisu, Jensen, and Snyder [36]. Both AgSAT and station ETref evaluations were performed on a daily time step since a day is a typical time period over which ETref is calculated and is generally the shortest period in which irrigation practices are scheduled. The station location, longitude, latitude, elevation, climate zones, and period of record for the available data needed for comparison are shown in Table 3.
Goodness-of-fit parameters, primarily the root mean square error (RMSE), percentage bias (Pbias), correlation coefficient (r), the concordance index (d), and the Nash–Sutcliffe coefficient (NSE), were applied to evaluate modeled ETref against the observed ETref.
The average difference between the ETref from AgSAT and the ETref from the weather stations was described by root mean square error (RMSE) as:
R M S E = i = 1 n ( E s t i m a t e d   E T r e f i M e a s u r e d   E T r e f i ) 2 n
The percentage bias (Pbias) was used to indicate under/over estimations by the ETref derived from AgSAT as:
P b i a s = i = 1 n E s t i m a t e d   E T r e f i M e a s u r e d   E T r e f i i = 1 n E s t i m a t e d   E T r e f i × 100
We also used Pearson’s r, which is the most used parametric correlation coefficient to quantify the strength of the linear relationship between ETref estimated and measured, given by:
r =   i n ( M e a s u r e d   E T r e f i M e a s u r e d   E T r e f i _ ) ( E s t i m a t e d   E T r e f i E s t i m a t e d   E T r e f i _ ) i n ( M e a s u r e d   E T r e f i M e a s u r e d   E T r e f i _ ) 2 × i n ( E s t i m a t e d   E T r f E s t i m a t e d   E T r e f _ ) 2
Then, concordance index (d) which represents the ratio between the mean square error and the potential error. d is a descriptive parameter which varies between 0 and 1, with a value of 1 indicating excellent agreement. d is calculated as:
d = 1 i = 1 n ( M e a s u r e d   E T r e f i E s t i m a t e d   E T r e f i ) 2 i = 1 n ( | E s t i m a t e d   E T r e f i M e a s u r e d   E T r e f i _ | + | M e a s u r e d   E T r e f i M e a s u r e d   E T r e f i _ | ) 2
Additionally, the modeling efficiency (NSE) is a normalized statistical parameter which determined the relative magnitude of residual variance with respect to the measured data variance. The model validity is considered very good for NSE ranges: 0.9–1, good for NSE ranges: 0.8–0.8999, acceptable for NSE: 0.65–0.799, and unsatisfactory for NSE: <0.65.
N S E = 1 i = 1 n ( M e a s u r e d   E T r e f i E s t i m a t e d   E T r e f i ) 2 i = 1 n ( | M e a s u r e d   E T r e f i M e a s u r e d   E T r e f i _ | ) 2

3.2. Field Validation

The app’s performance was tested by experimenting in the Bekaa Valley, the food basket of Lebanon. This valley is one of the country’s most important agricultural production areas where water-use estimates are critical for water management and resilience [47]. The primary driver threatening farmers to use less irrigation water for food production is the valley’s growing water constraint. The experimental field (1-ha) is located at the Agriculture Research and Education Center at AREC and planted with a potato crop during 12 March–15 July 2020: the growing season. The field was irrigated with a micro-sprinkler system (5 × 5 spacing at 200 L/h for a sprinkler) using the AgSAT-app irrigation recommendations. Irrigations were set at 4–5 day intervals with timings populated from the AgSAT app. The irrigation scheduling experiment consisted of four plots of equal size. Each plot had its own flow meter installed on the laterals to monitor the amount of water irrigated. The main weather parameters were taken from a Delta-T Devices weather station located upwind within the field and used to calculate ETref by the FAO Penman–Monteith standard approach. Water lost due to wind drift and evaporation was estimated using a catch-can test at the beginning of the irrigation season. In addition, soil moisture and crop yield measurements were held. A deep soil-water sensor at 60 cm was installed to monitor deep percolation.

4. Results and Discussion

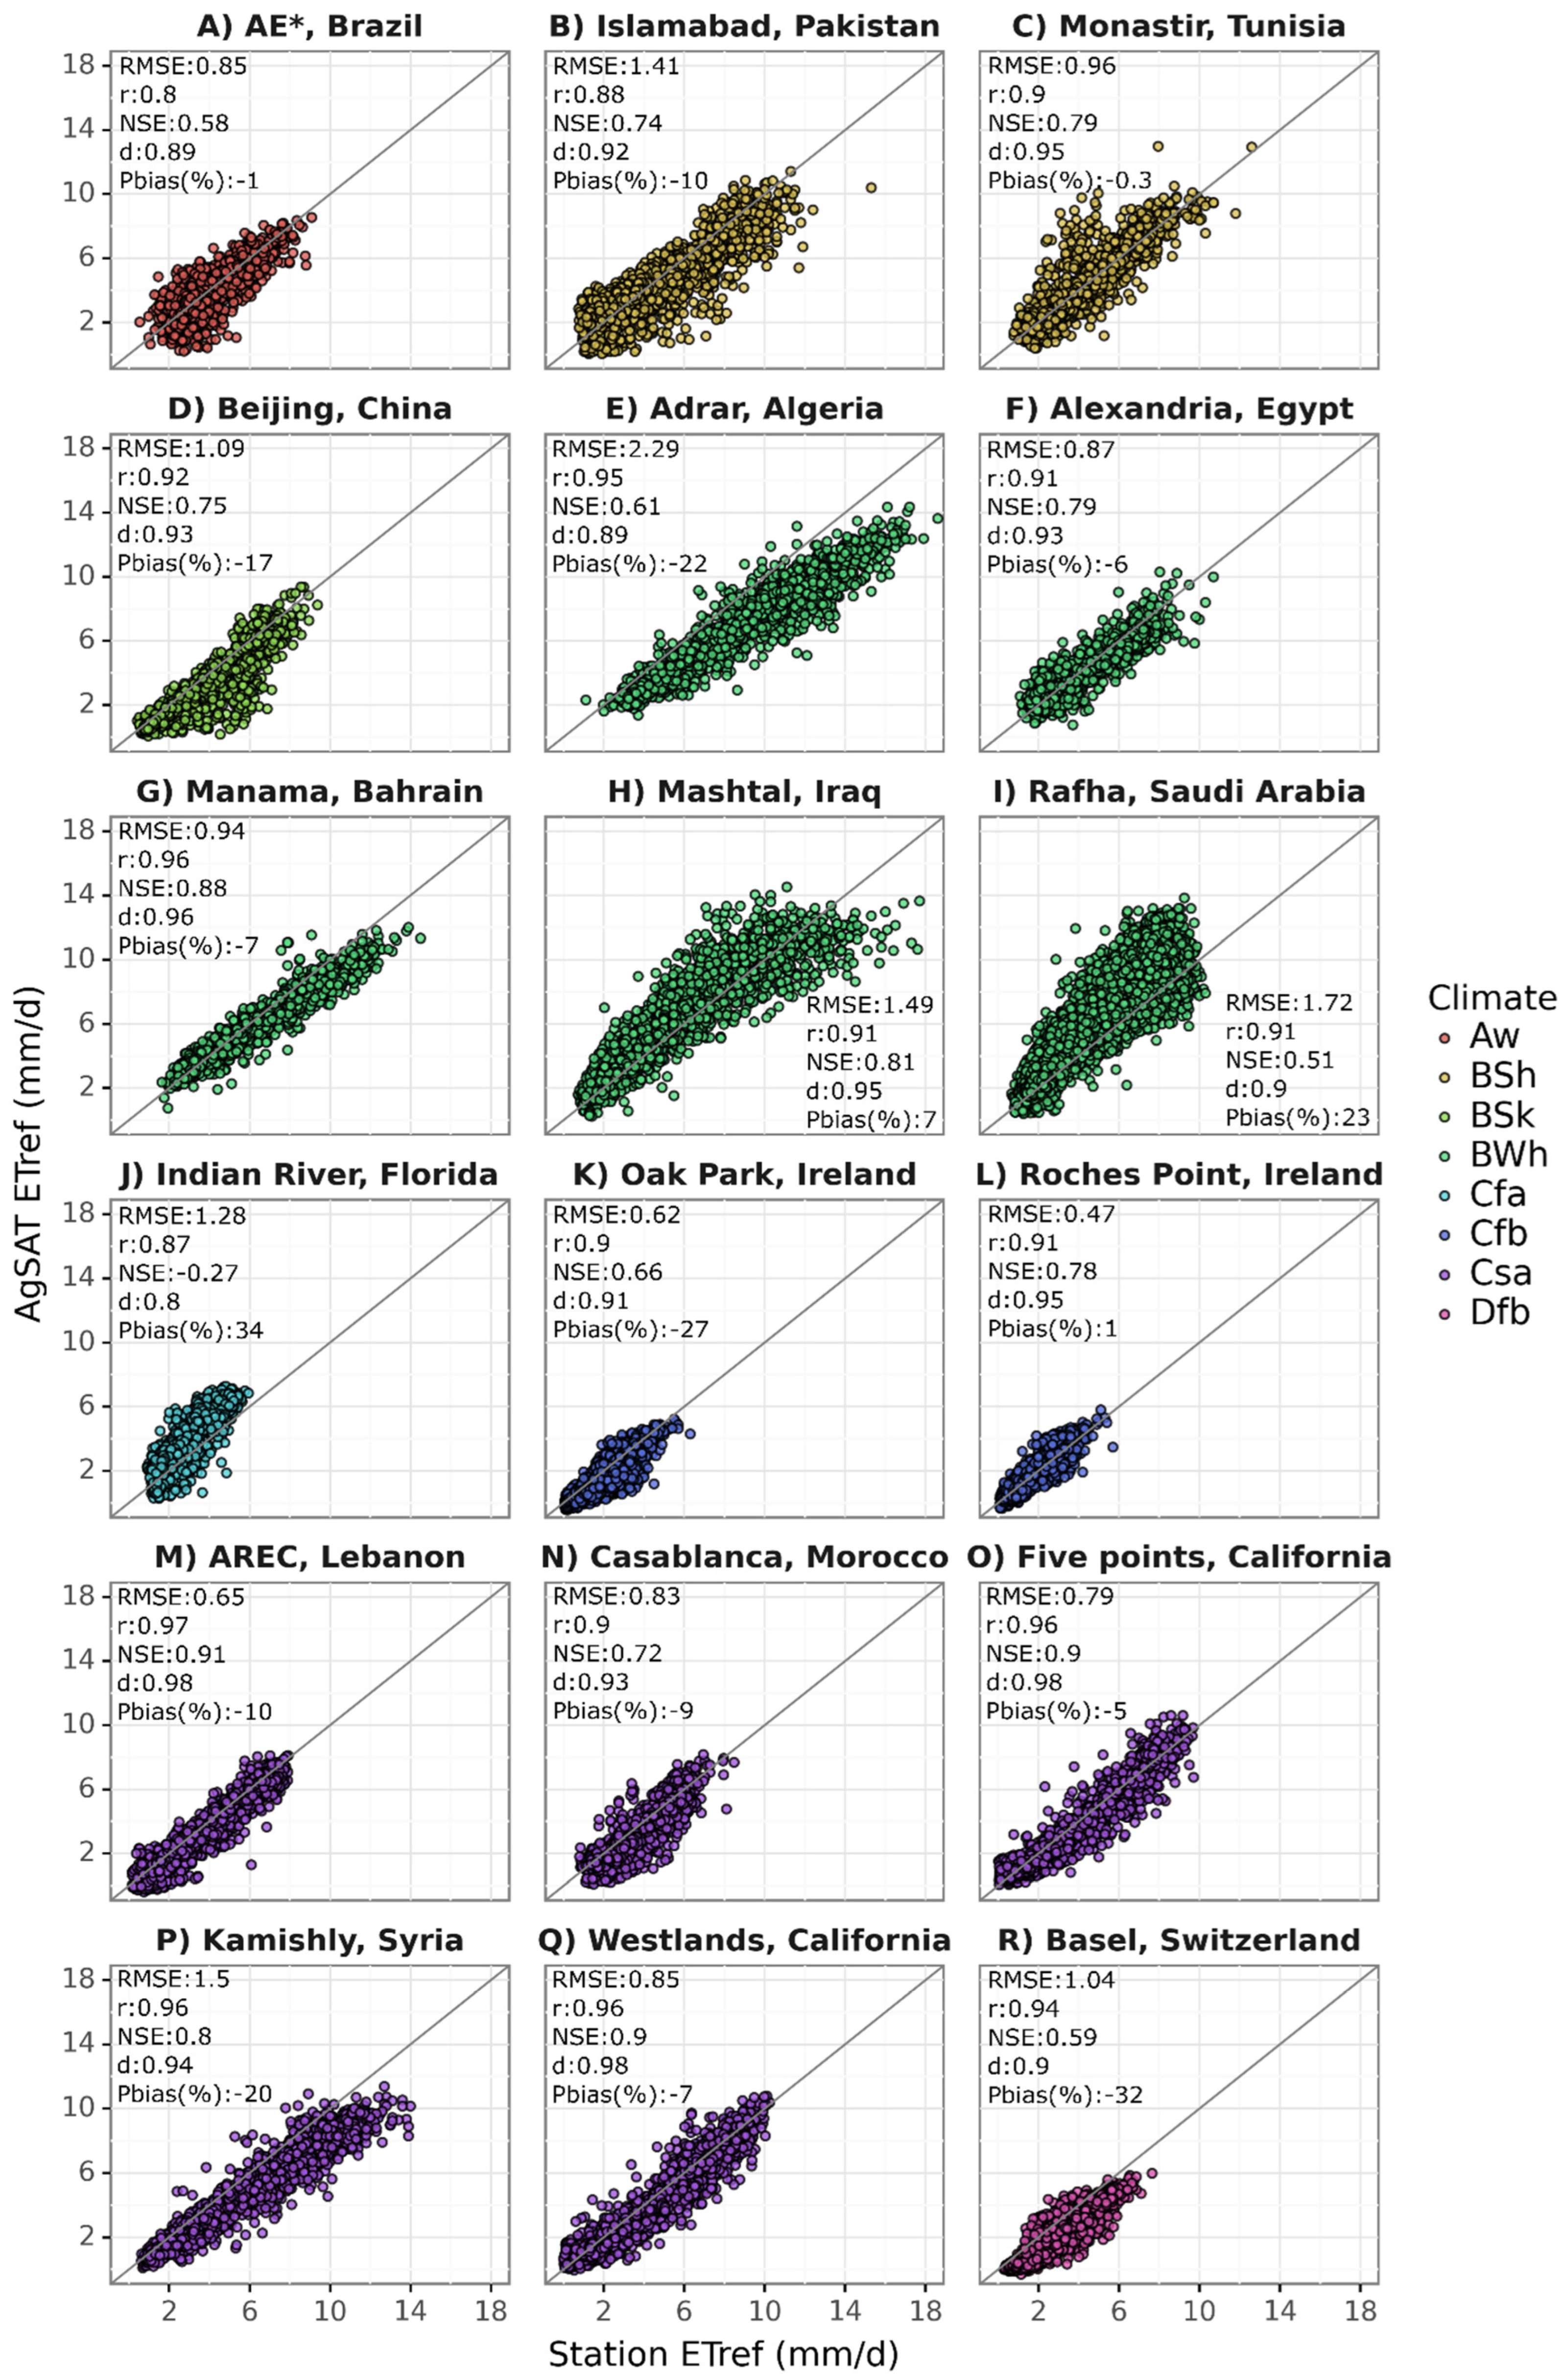
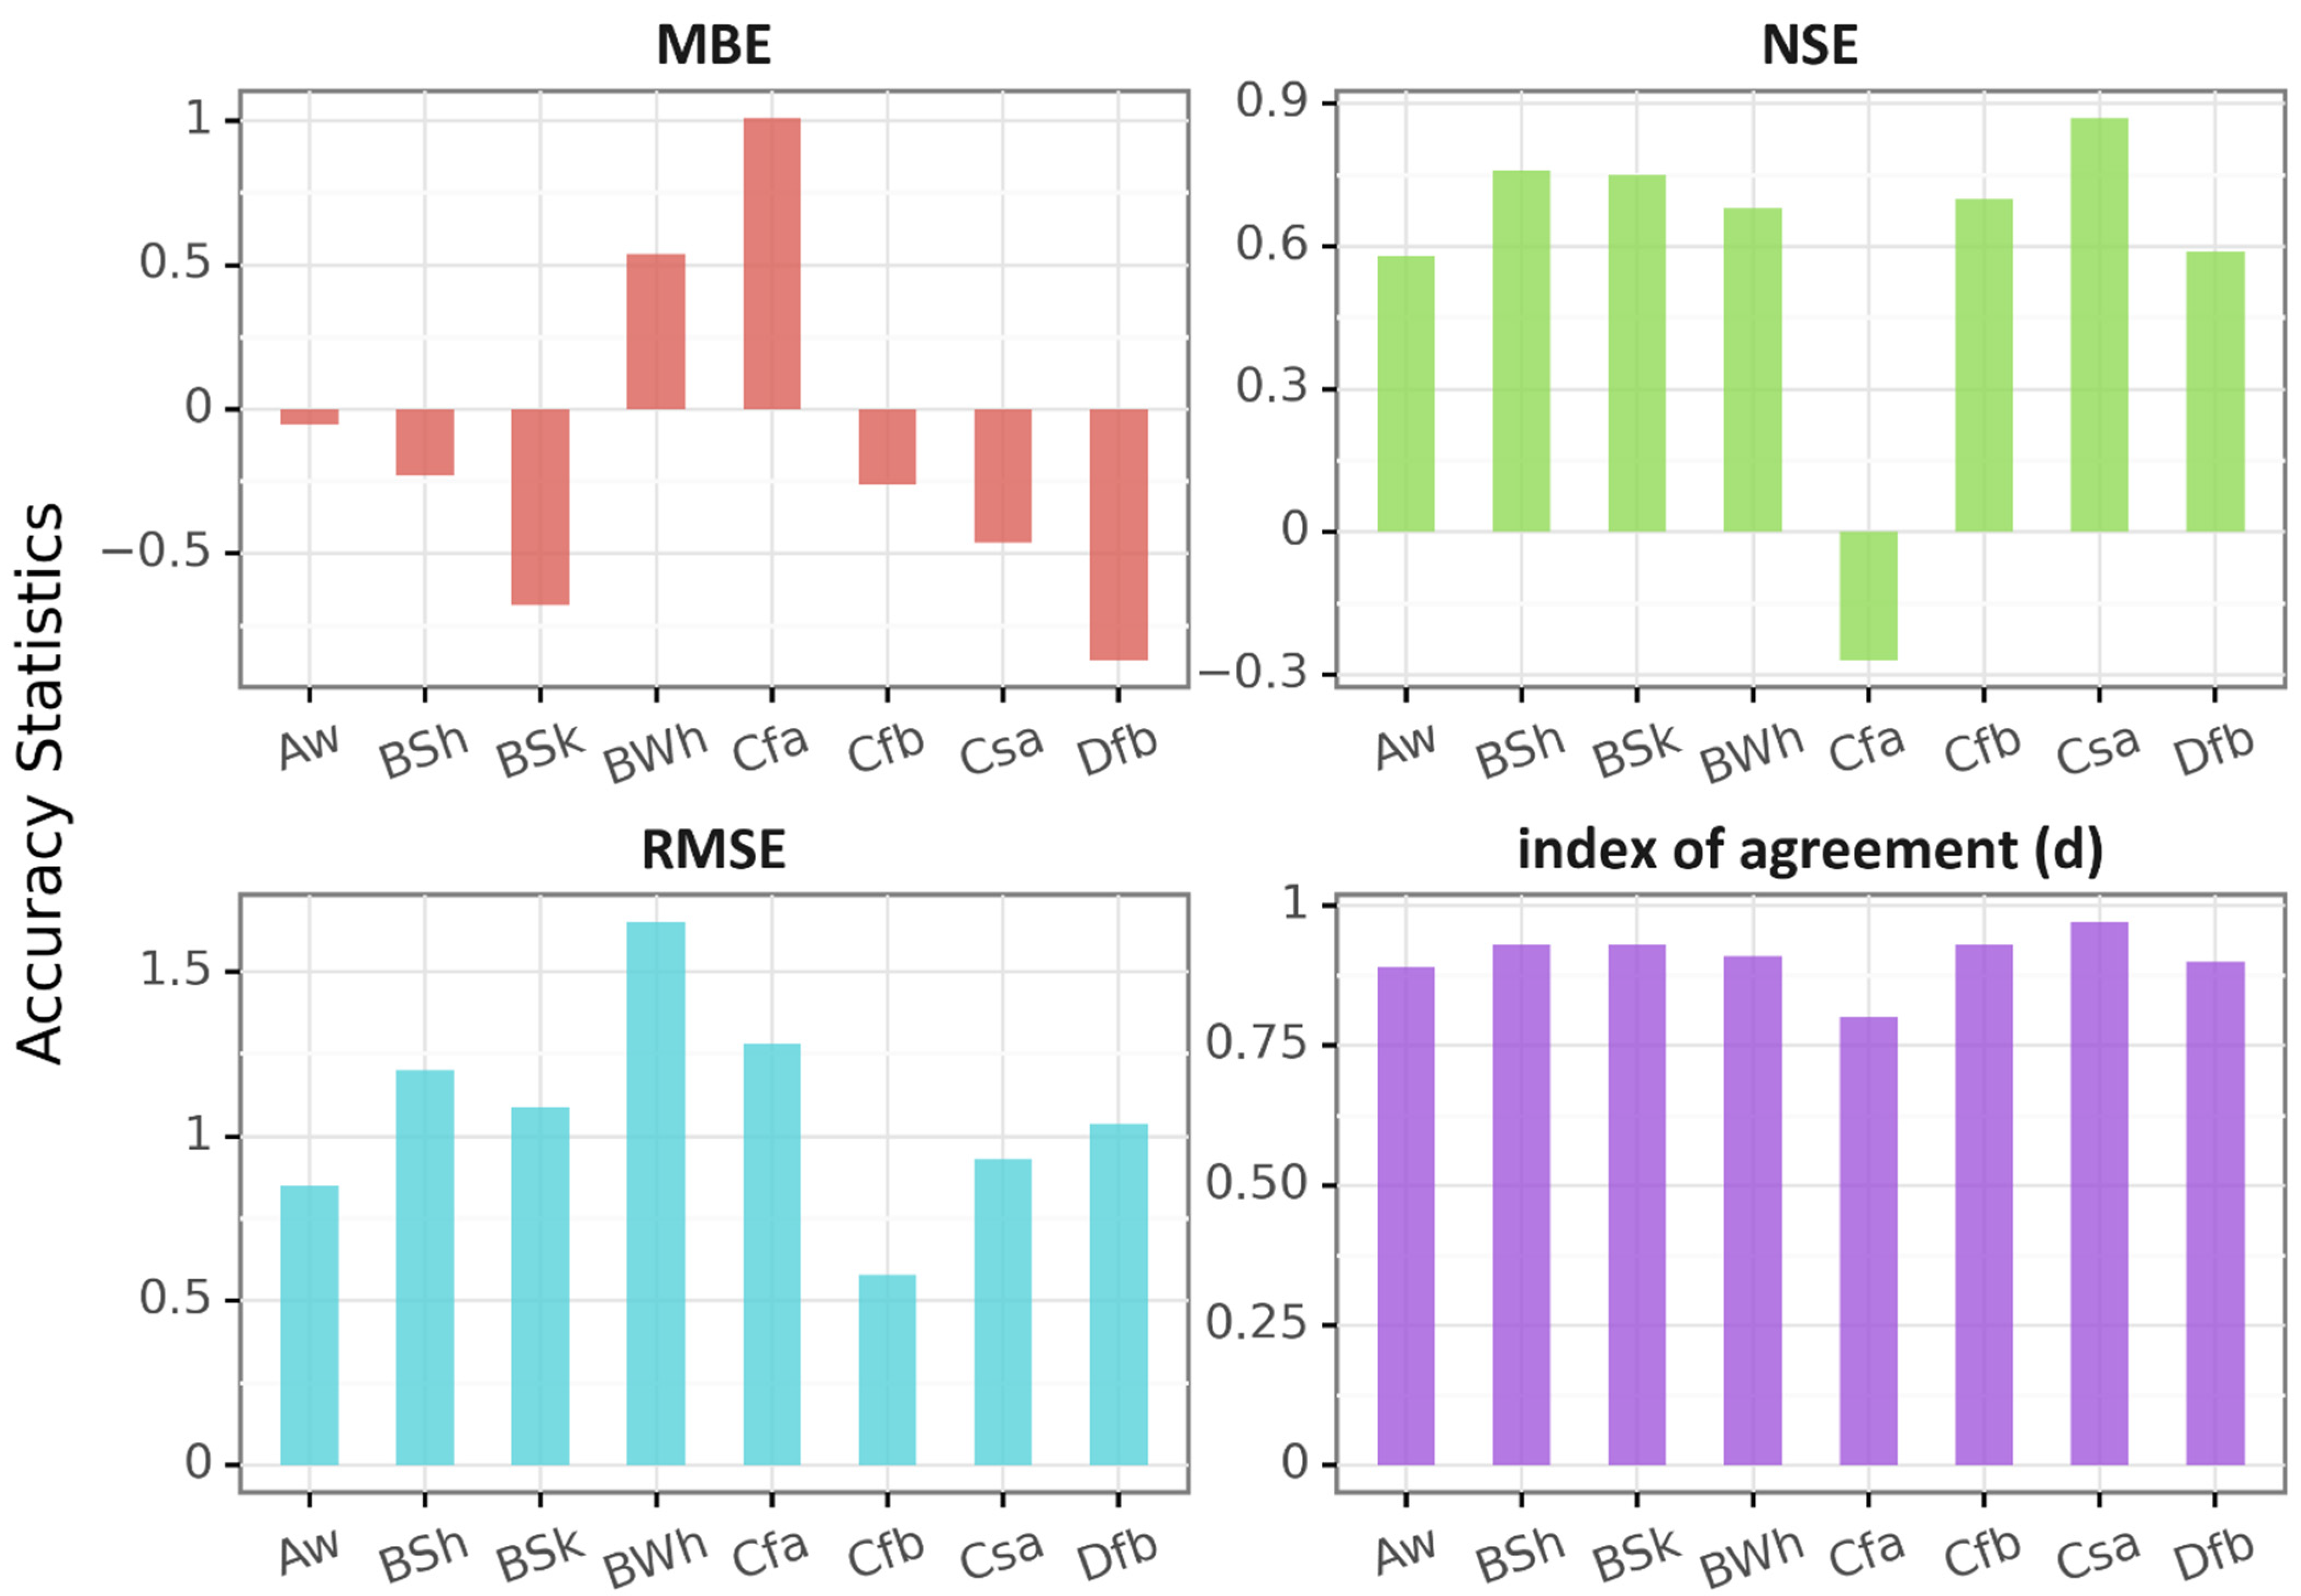
4.1. Global Validation

AgSAT daily ETref aligned with the in situ measurements of reference evapotranspiration from 18 weather stations (n = 46385) worldwide. Daily ETref was reasonably predicted by the AgSAT model, as suggested by the relatively low spread of most points in the scatter plots, close to the 1:1 line (Figure 4). Generally, RMSE was relatively low (1.27 mm/d), with a very small percentage of error (Pbias) (0.5%) driven by a slight positive bias (0.02 mm/d). The NSE value of 0.79 shows that the AgSAT model can be classified as acceptable. The concordance index (d) approaches 1, indicating very good agreement between AgSAT ETref and station ETref. The comparative analysis of the AgSAT and the weather stations’ daily reference evapotranspiration at a site level is shown in Figure A1, colored by climate type. Additional accuracy statistics are shown in Table A2 at a site level, including MAE, MBE, RE, and MAPE. Accuracy statistics of AgSAT ETref comparison with station ETref at the 18 studied sites by climate are shown in Figure A2.
The plot shows that AgSAT ETref agrees very well with the station ETref, with an index of agreement ranging from 0.8 to 0.98. The highest index of agreement was apparent in California and Lebanon, indicating the suitability of AgSAT for use in semi-arid and arid regions where agriculture relies on irrigation water and where water is scarce. The lowest error was obtained at the Ireland station (RMSE of 0.62 mm/d, driven by a slight positive bias of −0.4 mm/d). The most significant error was observed at the Adrar station in Algeria, with the highest RMSE (2.29 mm/d), driven by a negative bias of −1.91 mm/d. AgSAT ETref tended in the opposite direction at a site level, where it overestimated ETref at the Rafha, KSA (by 23%) and underestimated ETref at the Adrar, Algeria stations (by −22%). This could be due to the site hyperaridity where reference conditions were not met; no adjustments were made to correct station data. Very good model skills were observed at most of the stations (e.g., most of the stations such as Monastir, Tunisia, Aguas Emendadas, Brazil, and Roches point, Ireland have very low mean bias error). We did not find any substantial Pbias in the AgSAT ETref estimation at all sites where Pbias remained below 23%. AgSAT ETref was further evaluated across climatic zones. The ETref model revealed variability in model skill (Figure A2). The most notable finding in group-wise analysis based on climate was a general trend in bias, with AgSAT ETref model underestimating ET in Dfb (humid continental) climates and overestimating in humid subtropical (Cfa) climates. Based on nearly all statistical measures, AgSAT ETref performed best in Mediterranean climates (Csa).

4.2. Field Validation

The total water applied during the irrigation season was 590 mm. Water lost to wind drift and evaporation was estimated at 15–20% (depending on the irrigation time and wind speed) of applied water. Total water reaching the soil was estimated at 487 mm. Soil water content at planting was at field capacity following an above-average rainfall at the site. The clay soil-available water in the root zone on 12 March 2020 was 65 mm for 50 cm of the maximum potato root depth measured on-site for the duration of the experiment. No deep percolation was observed during the duration of the experiment. The amount of water used by the crop was estimated at 521 mm. The AgSAT app calculated a total ET of 531 mm for the period May 1–July 31. The resulting potato yield was 60 tons/ha from plot 1, 53 tons/ha from plots 2 and 3, and 46 tons/ha from plot 4 (due to weed infestations), indicating a superb yield. Figure 5 shows the Kcb, ETref, and ETpot (potential evapotranspiration) derived from the app. The Kcb values matched those indicated for the planted potato crop (Figure 6) [35].

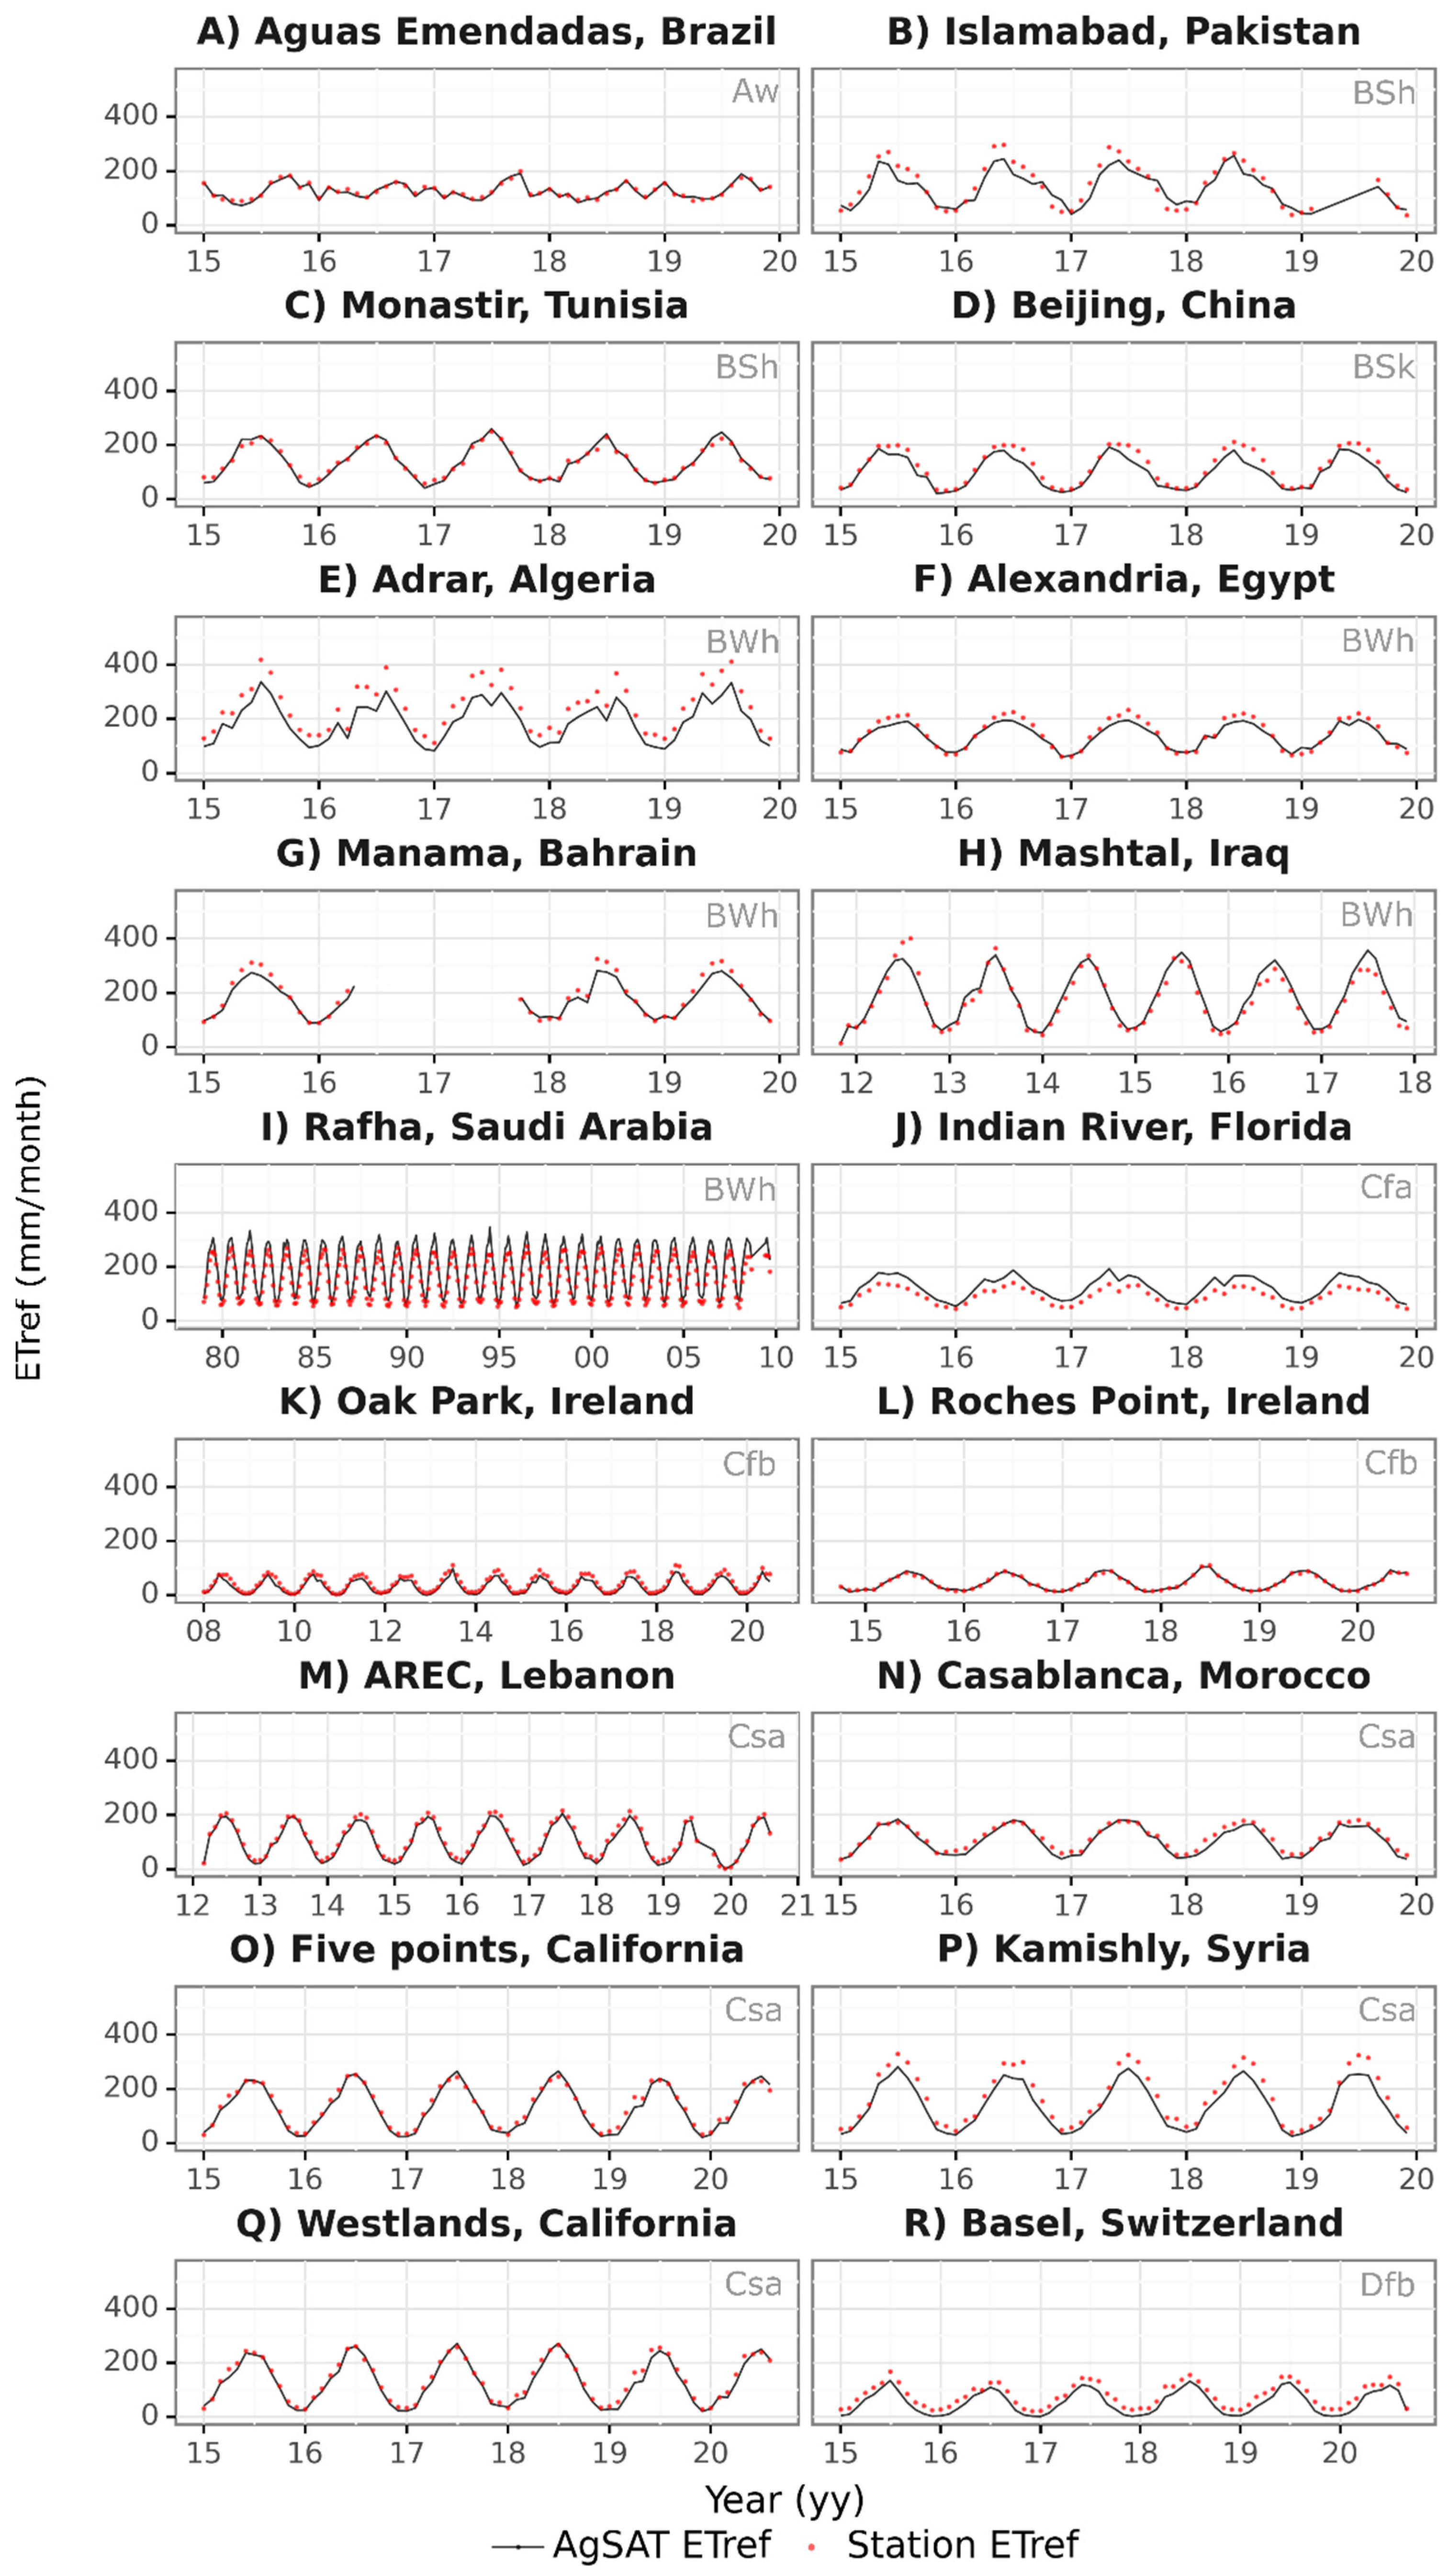
4.3. Daily and Monthly ETref Time Series Analysis

Examples of temporal trends for the eight studied climate zones are shown in Figure 7. A subset of the stations’ data with lower RMSE than the other stations is shown. Aw, BSk, BSh, and BWh climates maintained high AgSAT and station ETref, whereas Cfa, Cfb, and Dfb zones consistently had lower AgSAT and ETref values. AgSAT ET ref deviated from the station ETref by −34 and 32% at the Florida and Switzerland stations, respectively. The strongest agreement of AgSAT with the observed ETref was noted at the Brazil station, with an average daily Etref deviation of only 1%. Consistency in results was noticeable between years for all studied sites. The AgSAT ETref successfully captured the station ETref seasonality at the various climatic regions with an average daily ETref deviation of less than 10%. Generally, the time series figures show a high degree of overlap between the modeled and measured ETref datasets.
The AgSAT ETref was also evaluated for an additional grouping, with daily ETref aggregated to monthly level for all studied sites (Figure 8). This kind of data grouping provides insight into how the error changes seasonally across the years. The monthly aggregation showed a very close agreement between the modeled and the observed ETref at almost all stations in all months across the years, except for some of the locations. For example, at Kamishly in Syria, AgSAT ETref underestimated station ETref by an average of 22%. At Manama in Bahrain, the monthly ETref from AgSAT was only 5% lower than the station ETref. The estimated ETref was lower than the observed at Adrar, Algeria, by 23% in all months, while a higher estimated ETref was observed at Rafha, KSA, by 26% in all months. At Indian River, Florida, AgSAT yielded a higher ETref in all months (34% higher than the station ETref).

4.4. Reasons for Differences between AgSAT ETref and Station ETref

The AgSAT model uses gridded data to estimate ETref, which does not have a small enough spatial resolution to best serve ETref estimation. For ETref computations, weather data should be collected over a reference surface as defined by ASCE-EWRI [48]. In arid areas with irrigated agriculture, the grid cell size in the CFSV2 datasets used in the study could extend well beyond the weather station of interest. The grid cell would thereby combine the microclimatic conditions of an irrigated (representing reference conditions), and dry areas (with non-reference conditions), possibly weakening the validity of the ETref estimate. Another error anticipated in the gridded weather dataset is the assimilation of data. Overestimating temperature and underestimating humidity might occur if irrigation and precipitation data are not used as assimilation input data, especially in arid areas where irrigation is prevalent. This was noticed in the arid-desert-hot (BWh) climate group, specifically at the Rafha, KSA station where AgSAT overestimated the ETref.
Additionally, AgSAT ETref is overestimated in the humid subtropical climate zone spotted in the Indian River, Florida station. Gao [49] mentioned that the Penman–Monteith method is unsuitable for high humidity settings because of the linear assumption of saturated vapor pressure and air temperature. To maintain errors of less than 10–15%, Grignon [50] recommended using non-linear equations in extreme conditions (high humidity). In humid climates, condensation occurs during the night, leading to an overestimated VPD [35], leading to a higher ETref.
Moreover, the CFSV2 datasets generally represent the weather conditions at the average elevation of the grid cell. However, air temperature can change rapidly with elevation at an average lapse rate of −6.5 °C per 1000 m gained [51], leading to some misrepresentation of ETref in areas with complex terrain if the gridded weather temperatures are not adjusted to the weather station elevations. Nevertheless, AgSAT was designed to work in agricultural areas with simple topography.
Gridded weather data also pose a challenge due to their temporal resolution. CFSV2 has a coarse temporal resolution of 6 h, which might be insufficient for representing the substantial variation of the four weather parameters (air temperature, wind speed, humidity, and solar radiation) during a day, potentially reducing the accuracy of ETref estimation. This was indicated by Hupet and Vanclooster [52], who found that errors in daily grass ETref can be as large as 27% even when an hourly sampling rate is used.
Some of the selected weather stations in the study are located at or next to airports where paved surfaces are prevalent. In such surface type, measured temperature and humidity might be higher due to little to no moisture available to vaporize and high energy to heat the air. Among these stations are the Adrar, Algeria, and Kamishly, Syria, stations where AgSAT underestimated the ETref. Both weather station and gridded data have inherent errors and uncertainties in a comparable matter. The weather station measurements typically have errors of 20–30% [53,54], as large as the gridded data errors [55]. The gridded weather datasets overestimate standardized Penman–Monteith ETref from weather stations by as much as 20–30% [56]. Other causes of error are related to the scale and geolocation mismatch (a partial overlap between the area overlap footprint of remote sensing vs. point measurements) [53,57].
Future research could pursue the bias correction for the gridded weather data or decreasing ETref bias directly through statistical models or the use of theoretical adjustments based on the surface to air profiles for temperature, wind, and humidity, as described by [35,58]. Debiasing gridded data would allow the data to be used to its fullest potential, benefiting from temporal, spatial, and global coverage. Although most of the used locations reliably produced low error without bias correction, commonly, the gridded data requires bias correction in regions where a systematic bias exists to improve their accuracy.

4.5. Limitations and Future Work

As with any technological advancement, the development and deployment of AgSAT holds various limitations. Because AgSAT relies on vegetation reflectance data, it is unsuitable for greenhouse farms. However, farmers who plant in greenhouses may still use the weather data from AgSAT and adjust them for greenhouse conditions. Jaafar and Ahmad [59] provided equations to derive in-greenhouse ET from outside ET and weather. Currently, AgSAT does not use a soil-water balance to derive irrigation schedules for farmers, as this approach requires the farmers to input soil moisture data from field sensors. The availability of global gridded soil moisture at the field level is also another constraint. A soil-water balance requires an estimate of irrigation, rainfall, runoff, and deep percolation, all of which now cannot be calculated or derived on the fly. We plan to extend the app to read remotely sensed-based soil moisture once this data becomes useful for agriculture. Currently, only very low-resolution gridded soil moisture data is available, which is not very handy for field-scale applications. Due to the limited availability of reliable rainfall data in real-time, users are encouraged to subtract rainfall amounts from the irrigation water requirements. We plan to add a rainfall dataset to the model when such a dataset becomes available in higher resolution in Google Earth Engine. However, the major strength of the app results from working conjointly with farmers and irrigation managers during the development of AgSAT, with many features outlined and implemented based on their needs and suggestions. Despite the aforementioned constraints, AgSAT has been performing well since its development, with many farmers relying on its guidance on irrigation quantities and transitioning towards increasing water use efficiency in crop production. Adjustments may be necessary in areas where local climate differs from gridded weather data due to complex topography or other specific micro-climatic conditions.

5. Conclusions

This paper presents a novel global smart irrigation app (AgSAT) as an efficient and simple tool calculating crop water requirements in near real-time. The android smartphone application was developed using available Google Earth Engine datasets of both gridded weather data and surface reflectance satellite imagery for calculating reference evapotranspiration and crop NDVI. AgSAT was assessed at the small field level for irrigating a potato crop, and the reference evapotranspiration parameter it relies on was validated globally in various climatic zones in many countries. The main app metrics, crop evapotranspiration referenced to grass as developed by the ASCE-standardized Penman–Monteith equation, were calculated from global climatic data (CFSV2) and have shown very good agreement with the corresponding ET calculated from weather stations worldwide. Local adjustments may be needed in complex topographies and areas with their own microclimate. Our validation, herein, showed that the estimated crop evapotranspiration for AgSAT could be used reliably, enabling the applicability of the developed smart irrigation app. Moreover, the results presented in this study allowed concluding that crop growth coefficients can be derived using the highest publicly available resolution (EAS’s Sentinel-2 at 10 m) and were shown to be valid for agricultural crops in major agricultural regions, including the USA (California). Coverage remains a challenge in cloudy regions where crop phenology changes quickly. This can be addressed in the future by utilizing synthetic aperture RADAR imagery such as Sentinel-1. This study sought to contribute to the topic of smart technologies in irrigation and has demonstrated an illustrative example of an app that cuts back on high costs and the challenges of computerized applications for the technologically challenged farmer. AgSAT brings irrigation technology to the farmer’s phone and provides an opportunity for combatting water scarcity and mitigating the impact of climate change on the world’s dwindling water resources.

Author Contributions

Conceptualization, H.J.; methodology, H.J.; software, H.J.; validation, H.J., R.M., L.S. and R.H.; formal analysis, H.J. and R.M.; resources, H.J.; data curation, H.J., R.M. and L.S.; writing—original draft preparation, H.J. and R.M; writing—review and editing, H.J., R.M., L.S. and R.H.; visualization, H.J. and R.M.; supervision, H.J. and R.H.; project administration, H.J.; funding acquisition, H.J. All authors have read and agreed to the published version of the manuscript.

Funding

This work was funded by the DUPC2 Program—IHE Delft supported by the Ministry of Foreign Affairs, Netherlands, Award#103768, as well as by a grant from Google.org and Tides Foundation, Google AI for Social Good Award#103808.

Acknowledgments

Technical support from Google Earth Engine Team is greatly appreciated.

Conflicts of Interest

The authors declare no conflict of interest.

Appendix A

Table A1. Compilation of Kcb–VI relationships as found in the literature.
CropEquationReference
WheatKcb = 1.64 × NDVI − 0.12[60]
Row vineyardKcb = 1.44 × NDVI − 0.1[61]
Bell pepperKcb = −0.12 × NDVI2 + 1.45 × NDVI − 0.06[37]
BroccoliKcb = −1.48 × NDVI2 + 2.64 × NDVI − 0.17[37]
LettuceKcb = −0.11 × NDVI2 + 1.39 × NDVI + 0.01[37]
CornKcb = 1.77 × SAVI + 0.02[62]
PotatoKcb = 1.36 × SAVI + 0.06[63]
Sugar beetKcb = 1.74 × SAVI − 0.16[64]
CottonKcb = 1.74 × SAVI − 0.16[65]
GarlicKcb = 1.82 × SAVI − 0.16[65]
OliveKcb = 1.59 × SAVI − 0.14[65]
CitrusKcb = 0.99 × SAVI − 0.09[65]
PeachKcb = 1.29 × SAVI − 0.12[65]
Apple treesKcb = 1.82 ± 0.19 × SAVI − 0.07 ± 0.06[66]
Table A2. Comparison between modeled and weather station ETref for the different studied weather stations grouped by region and climate classification.
RegionClimateWeather StationsMAE
(mm)
MBE
(mm)
RE
(%)
MAPE
(%)
AfricaBShMonastir, Tunisia 0.64−0.01−0.318
CsaCasablanca, Morocco0.62−0.36−919
BWhAdrar, Algeria1.95−1.91−2223
BWhAlexandria, Egypt 0.72−0.31-617
AsiaBWhRafha, Saudi Arabia1.431.32531
CsaAREC, Lebanon0.51−0.38−1022
BWhManama, Bahrain0.71−0.42−711
BSkBeijing, China0.77−0.68−1722
CsaKamishly, Syria1.2−1.13−2023
BShIslamabad, Pakistan1.1−0.47−1031
BWhMashtal, Iraq1.070.74723
EuropeCfbOak Park, Ireland0.47−0.4−2744
CfbRoches, Ireland0.350.02130
DfbBasel, Switzerland0.92−0.87−3247
USA and South AmericaCfaFive Points, California0.6−0.25−531
CsaWestlands, California0.64−0.32−730
CfaIndian River, Florida1.121.013440
AwAguas Emendadas, Brazil0.62−0.05−117
Figure A1. Daily AgSAT and station ETref scatterplots comparisons for the 18 studied locations grouped by the climatic region, the grey line represents the 1:1 line. AE*: Aguas Emendadas.
Remotesensing 14 05090 g0a1
Figure A2. Accuracy statistics of AgSAT ETref comparison with station ETref at the 18 studied sites by climate.
Remotesensing 14 05090 g0a2

References

  1. Vaishali, S.; Suraj, S.; Vignesh, G.; Dhivya, S.; Udhayakumar, S. Mobile integrated smart irrigation management and monitoring system using IOT. In Proceedings of the 2017 International Conference on Communication and Signal Processing (ICCSP), Melmaruvathur, India, 6–8 April 2017; pp. 2164–2167. [Google Scholar]
  2. Dobbs, N.A.; Migliaccio, K.W.; Li, Y.; Dukes, M.D.; Morgan, K.T. Evaluating irrigation applied and nitrogen leached using different smart irrigation technologies on bahiagrass (Paspalumnotatum). Irrig. Sci. 2014, 32, 193–203. [Google Scholar] [CrossRef]
  3. Paredes, P.; D’Agostino, D.; Assif, M.; Todorovic, M.; Pereira, L.S. Assessing potato transpiration, yield and water productivity under various water regimes and planting dates using the FAO dual Kc approach. Agric. Water Manag. 2018, 195, 11–24. [Google Scholar] [CrossRef]
  4. Pereira, L.S.; Paredes, P.; Rodrigues, G.C.; Neves, M. Modeling malt barley water use and evapotranspiration partitioning in two contrasting rainfall years. Assessing AquaCrop and SIMDualKc models. Agric. Water Manag. 2015, 159, 239–254. [Google Scholar] [CrossRef]
  5. Rosa, R.D.; Paredes, P.; Rodrigues, G.C.; Fernando, R.M.; Alves, I.; Pereira, L.S.; Allen, R.G. Implementing the dual crop coefficient approach in interactive software: 2. Model testing. Agric. Water Manag. 2012, 103, 62–77. [Google Scholar] [CrossRef]
  6. Seidel, S.J.; Werisch, S.; Barfus, K.; Wagner, M.; Schütze, N.; Laber, H. Field evaluation of irrigation scheduling strategies using a mechanistic crop growth model. Irrig. Drain. 2016, 65, 214–223. [Google Scholar] [CrossRef]
  7. Zotarelli, L.; Dukes, M.; Scholberg, J.; Femminella, K.; Munoz-Carpena, R. Irrigation scheduling for green bell peppers using capacitance soil moisture sensors. J. Irrig. Drain. Eng. 2011, 137, 73–81. [Google Scholar] [CrossRef]
  8. Smith, M. CROPWAT: A Computer Program for Irrigation Planning and Management; Food & Agriculture Org.: Rome, Italy, 1992. [Google Scholar]
  9. Orange, M.; Matyac, J.S.; Snyder, R.L. Consumptive use program (CUP) model. In Proceedings of the IV International Symposium on Irrigation of Horticultural Crops 664, Davis, CA, USA, 1–6 September 2003; pp. 461–468. [Google Scholar]
  10. Leib, B.; Elliott, T. Washington Irrigation Scheduling Expert (WISE) Software. In Proceedings of the National Irrigation Symposium: Proceedings of the 4th Decennial Symposium, Phoenix, AZ, USA, 14–16 November 2000; pp. 14–16. [Google Scholar]
  11. Adeyemi, O.; Grove, I.; Peets, S.; Domun, Y.; Norton, T. Dynamic neural network modelling of soil moisture content for predictive irrigation scheduling. Sensors 2018, 18, 3408. [Google Scholar] [CrossRef] [PubMed] [Green Version]
  12. Todorovic, M.; Riezzo, E.; Buono, V.; Zippitelli, M.; Galiano, A.; Cantore, V. Hydro-Tech: An automated smart-tech Decision Support Tool for eco-efficient irrigation management. Int. Agric. Eng. J. 2016, 25, 44–56. [Google Scholar]
  13. Vellidis, G.; Liakos, V.; Andreis, J.; Perry, C.; Porter, W.; Barnes, E.; Morgan, K.; Fraisse, C.; Migliaccio, K. Development and assessment of a smartphone application for irrigation scheduling in cotton. Comput. Electron. Agric. 2016, 127, 249–259. [Google Scholar] [CrossRef] [Green Version]
  14. Jaafar, H.; Khraizat, Z.; Bashour, I.; Haidar, M. Determining water requirements of biblical hyssop using an ET-based drip irrigation system. Agric. Water Manag. 2017, 180, 107–117. [Google Scholar] [CrossRef]
  15. Bartlett, A.; Andales, A.; Arabi, M.; Bauder, T. A smartphone app to extend use of a cloud-based irrigation scheduling tool. Comput. Electron. Agric. 2015, 111, 127–130. [Google Scholar] [CrossRef]
  16. Sesma, J.; Molina-Martínez, J.; Cavas-Martínez, F.; Fernández-Pacheco, D. A mobile application to calculate optimum drip irrigation laterals. Agric. Water Manag. 2015, 151, 13–18. [Google Scholar] [CrossRef]
  17. Pulido-Calvo, I.; Montesinos, P.; Roldán, J.; Ruiz-Navarro, F. Linear regressions and neural approaches to water demand forecasting in irrigation districts with telemetry systems. Biosyst. Eng. 2007, 97, 283–293. [Google Scholar] [CrossRef]
  18. Perea, R.G.; García, I.F.; Arroyo, M.M.; Díaz, J.R.; Poyato, E.C.; Montesinos, P. Multiplatform application for precision irrigation scheduling in strawberries. Agric. Water Manag. 2017, 183, 194–201. [Google Scholar] [CrossRef]
  19. Kelley, L.; Miller, S. Irrigation Scheduling Tools; Irrigation Fact Sheet 3; Michigan State University Extension: East Lansing, MI, USA, 2011. [Google Scholar]
  20. Malamos, N.; Tsirogiannis, I.L.; Christofides, A.; Anastasiadis, S.; Vanino, S. Main Features and Application of a Web-based Irrigation Management Tool for the Plain of Arta. In Proceedings of the HAICTA, Kavala, Greece, 17–20 September 2015; pp. 174–185. [Google Scholar]
  21. Scherer, T. Web-Based Irrigation Scheduler; North Dakota State University: Fargo, ND, USA, 2014. [Google Scholar]
  22. Thompson, W. Irrigation Scheduling Made Simple (r): Wateright Website Does the Hard Work for You; California Grower: Vista, CA, USA, 1998. [Google Scholar]
  23. Cahn, M.; Smith, R.; Farrara, B.; Hartz, T.; Johnson, L.; Melton, F.; Post, K. Irrigation and nitrogen management decision support tool for vegetables and berries. In Proceedings of the US Committee on Irrigation and Drainage Conference: Groundwater Issues and Water Management—Strategies Addressing the Challenges of Sustainability USCID, Sacramento, CA, USA, 4–5 March 2014; pp. 4–7. [Google Scholar]
  24. Mannini, P.; Genovesi, R.; Letterio, T. IRRINET: Large scale DSS application for on-farm irrigation scheduling. Procedia Environ. Sci. 2013, 19, 823–829. [Google Scholar] [CrossRef] [Green Version]
  25. Car, N.J.; Christen, E.W.; Hornbuckle, J.W.; Moore, G.A. Using a mobile phone Short Messaging Service (SMS) for irrigation scheduling in Australia–Farmers’ participation and utility evaluation. Comput. Electron. Agric. 2012, 84, 132–143. [Google Scholar] [CrossRef]
  26. Deumier, J.; Leroy, P.; Peyremorte, P. Tools for Improving Management of Irrigated Agricultural Crop Systems; Water Reports; FAO: Rome, Italy, 1996. [Google Scholar]
  27. Montoro, A.; López-Fuster, P.; Fereres, E. Improving on-farm water management through an irrigation scheduling service. Irrig. Sci. 2011, 29, 311–319. [Google Scholar] [CrossRef]
  28. Levidow, L.; Zaccaria, D.; Maia, R.; Vivas, E.; Todorovic, M.; Scardigno, A. Improving water-efficient irrigation: Prospects and difficulties of innovative practices. Agric. Water Manag. 2014, 146, 84–94. [Google Scholar] [CrossRef] [Green Version]
  29. Barnes, A.; Soto, I.; Eory, V.; Beck, B.; Balafoutis, A.; Sánchez, B.; Vangeyte, J.; Fountas, S.; van der Wal, T.; Gómez-Barbero, M. Influencing factors and incentives on the intention to adopt precision agricultural technologies within arable farming systems. Environ. Sci. Policy 2018, 93, 66–74. [Google Scholar] [CrossRef]
  30. Barnes, A.; Soto, I.; Eory, V.; Beck, B.; Balafoutis, A.; Sánchez, B.; Vangeyte, J.; Fountas, S.; van der Wal, T.; Gómez-Barbero, M. Exploring the adoption of precision agricultural technologies: A cross regional study of EU farmers. Land Use Policy 2019, 80, 163–174. [Google Scholar] [CrossRef]
  31. Watcharaanantapong, P.; Roberts, R.K.; Lambert, D.M.; Larson, J.A.; Velandia, M.; English, B.C.; Rejesus, R.M.; Wang, C. Timing of precision agriculture technology adoption in US cotton production. Precis. Agric. 2014, 15, 427–446. [Google Scholar] [CrossRef]
  32. Ayankojo, I.T.; Morgan, K.T.; Ozores-Hampton, M.; Migliaccio, K.W. Effects of Real-time Location-specific Drip Irrigation Scheduling on Water Use, Plant Growth, Nutrient Accumulation, and Yield of Florida Fresh-market Tomato. HortScience 2018, 53, 1372–1378. [Google Scholar] [CrossRef] [Green Version]
  33. Kadyampakeni, D.M.; Morgan, K.T.; Zekri, M.; Ferrarezi, R.; Schumann, A.; Obreza, T. Citrus Irrigation Management. EDIS 2017, 2017, 1–6. [Google Scholar] [CrossRef]
  34. Júnior, W.M.; Valeriano, T.T.B.; de Souza Rolim, G. EVAPO: A smartphone application to estimate potential evapotranspiration using cloud gridded meteorological data from NASA-POWER system. Comput. Electron. Agric. 2019, 156, 187–192. [Google Scholar]
  35. Allen, R.G.; Pereira, L.S.; Raes, D.; Smith, M. Crop Evapotranspiration-Guidelines for Computing Crop Water Requirements-FAO Irrigation and Drainage Paper 56; Food and Agriculture Organization of the United Nations: Rome, Italy, 1998; Volume 56, p. e156. [Google Scholar]
  36. Allen, R.; Walter, I.; Elliott, R.; Howell, T.; Itenfisu, D.; Jensen, M.; Snyder, R. The ASCE Standardized Reference Evapotranspiration Equation, American Society of Civil Engineers. In Microclimate: The Biological Environment; John Wiley & Sons: Hoboken, NJ, USA, 2005. [Google Scholar]
  37. Johnson, L.F.; Trout, T.J. Satellite NDVI assisted monitoring of vegetable crop evapotranspiration in California’s San Joaquin Valley. Remote Sens. 2012, 4, 439–455. [Google Scholar] [CrossRef] [Green Version]
  38. Kamble, B.; Kilic, A.; Hubbard, K. Estimating crop coefficients using remote sensing-based vegetation index. Remote Sens. 2013, 5, 1588–1602. [Google Scholar] [CrossRef] [Green Version]
  39. Oliveira, T.C.D.; Ferreira, E.; Dantas, A.A.A. Temporal variation of normalized difference vegetation index (NDVI) and calculation of the crop coefficient (Kc) from NDVI in areas cultivated with irrigated soybean. Ciência Rural 2016, 46, 1683–1688. [Google Scholar] [CrossRef] [Green Version]
  40. French, A.N.; Hunsaker, D.J.; Sanchez, C.A.; Saber, M.; Gonzalez, J.R.; Anderson, R. Satellite-based NDVI crop coefficients and evapotranspiration with eddy covariance validation for multiple durum wheat fields in the US Southwest. Agric. Water Manag. 2020, 239, 106266. [Google Scholar] [CrossRef]
  41. Rawat, K.S.; Singh, S.K.; Bala, A.; Szabó, S. Estimation of crop evapotranspiration through spatial distributed crop coefficient in a semi-arid environment. Agric. Water Manag. 2019, 213, 922–933. [Google Scholar] [CrossRef]
  42. Reyes-González, A.; Kjaersgaard, J.; Trooien, T.; Hay, C.; Ahiablame, L. Estimation of crop evapotranspiration using satellite remote sensing-based vegetation index. Adv. Meteorol. 2018, 2018, 4525021. [Google Scholar] [CrossRef] [Green Version]
  43. Zhang, Y.; Han, W.; Niu, X.; Li, G. Maize Crop Coefficient Estimated from UAV-Measured Multispectral Vegetation Indices. Sensors 2019, 19, 5250. [Google Scholar] [CrossRef] [PubMed] [Green Version]
  44. Melton, F.S.; Johnson, L.F.; Lund, C.P.; Pierce, L.L.; Michaelis, A.R.; Hiatt, S.H.; Guzman, A.; Adhikari, D.D.; Purdy, A.J.; Rosevelt, C. Satellite irrigation management support with the terrestrial observation and prediction system: A framework for integration of satellite and surface observations to support improvements in agricultural water resource management. IEEE J. Sel. Top. Appl. Earth Obs. Remote Sens. 2012, 5, 1709–1721. [Google Scholar] [CrossRef]
  45. Allen, R.G.; Pereira, L.S. Estimating crop coefficients from fraction of ground cover and height. Irrig. Sci. 2009, 28, 17–34. [Google Scholar] [CrossRef] [Green Version]
  46. Hoffman, G.J.; Evans, R.G.; Jensen, M.E.; Martin, D.L.; Elliott, R.L. Design and Operation of Farm Irrigation Systems; American Society of Agricultural and Biological Engineers: St. Joseph, MI, USA, 2007. [Google Scholar]
  47. Jaafar, H.H.; Ahmad, F.A. Time series trends of Landsat-based ET using automated calibration in METRIC and SEBAL: The Bekaa Valley, Lebanon. Remote Sens. Environ. 2020, 238, 111034. [Google Scholar] [CrossRef]
  48. Walter, I.A.; Allen, R.G.; Elliott, R.; Itenfisu, D.; Brown, P.; Jensen, M.E.; Mecham, B.; Howell, T.A.; Snyder, R.; Eching, S. Task Committee on Standardization of Reference Evapotranspiration; ASCE: Reston, VA, USA, 2005. [Google Scholar]
  49. Gao, W. Applications of solutions to non-linear energy budget equations. Agric. For. Meteorol. 1988, 43, 121–145. [Google Scholar]
  50. Grignon, F. A discussion of the Penman form equations and comparisons of some equations to estimate latent energy flux density. Agric. For. Meteorol. 1992, 57, 297–304. [Google Scholar]
  51. Cosgrove, B.A.; Lohmann, D.; Mitchell, K.E.; Houser, P.R.; Wood, E.F.; Schaake, J.C.; Robock, A.; Marshall, C.; Sheffield, J.; Duan, Q. Real-time and retrospective forcing in the North American Land Data Assimilation System (NLDAS) project. J. Geophys. Res. Atmos. 2003, 108, 8842. [Google Scholar] [CrossRef] [Green Version]
  52. Hupet, F.; Vanclooster, M. Effect of the sampling frequency of meteorological variables on the estimation of the reference evapotranspiration. J. Hydrol. 2001, 243, 192–204. [Google Scholar] [CrossRef]
  53. Allen, R.G.; Pereira, L.S.; Howell, T.A.; Jensen, M.E. Evapotranspiration information reporting: I. Factors governing measurement accuracy. Agric. Water Manag. 2011, 98, 899–920. [Google Scholar] [CrossRef] [Green Version]
  54. Blatchford, M.L.; Mannaerts, C.M.; Zeng, Y.; Nouri, H.; Karimi, P. Status of accuracy in remotely sensed and in-situ agricultural water productivity estimates: A review. Remote Sens. Environ. 2019, 234, 111413. [Google Scholar] [CrossRef]
  55. White, J.W.; Hoogenboom, G.; Stackhouse, P.W., Jr.; Hoell, J.M. Evaluation of NASA satellite-and assimilation model-derived long-term daily temperature data over the continental US. Agric. For. Meteorol. 2008, 148, 1574–1584. [Google Scholar] [CrossRef] [Green Version]
  56. Blankenau, P.A. Bias and Other Error in Gridded Weather Data Sets and Their Impacts on Estimating Reference Evapotranspiration. Master’s Thesis, University of Nebraska-Lincoln, Lincoln, NE, USA, 2017. [Google Scholar]
  57. Kishore, P.; Jyothi, S.; Basha, G.; Rao, S.; Rajeevan, M.; Velicogna, I.; Sutterley, T.C. Precipitation climatology over India: Validation with observations and reanalysis datasets and spatial trends. Clim. Dyn. 2016, 46, 541–556. [Google Scholar] [CrossRef] [Green Version]
  58. Allen, R.; Dhungel, R.; Dhungara, B.; Huntington, J.; Kilic, A.; Morton, C. Conditioning point and gridded weather data under aridity conditions during calculation of reference evapotranspiration. Agric. Water Manag. 2020; submitted. [Google Scholar]
  59. Jaafar, H.H.; Ahmad, F. Determining Reference Evapotranspiration in Greenhouses from External Climate. J. Irrig. Drain. Eng. 2019, 145, 04019018. [Google Scholar] [CrossRef] [Green Version]
  60. Duchemin, B.; Hadria, R.; Erraki, S.; Boulet, G.; Maisongrande, P.; Chehbouni, A.; Escadafal, R.; Ezzahar, J.; Hoedjes, J.; Kharrou, M. Monitoring wheat phenology and irrigation in Central Morocco: On the use of relationships between evapotranspiration, crops coefficients, leaf area index and remotely-sensed vegetation indices. Agric. Water Manag. 2006, 79, 1–27. [Google Scholar] [CrossRef]
  61. Campos, I.; Neale, C.M.; Calera, A.; Balbontín, C.; González-Piqueras, J. Assessing satellite-based basal crop coefficients for irrigated grapes (Vitis vinifera L.). Agric. Water Manag. 2010, 98, 45–54. [Google Scholar] [CrossRef]
  62. Bausch, W.C. Soil background effects on reflectance-based crop coefficients for corn. Remote Sens. Environ. 1993, 46, 213–222. [Google Scholar] [CrossRef]
  63. Jayanthi, H.; Neale, C.M.; Wright, J.L. Development and validation of canopy reflectance-based crop coefficient for potato. Agric. Water Manag. 2007, 88, 235–246. [Google Scholar] [CrossRef]
  64. González-Dugo, M.; Mateos, L. Spectral vegetation indices for benchmarking water productivity of irrigated cotton and sugarbeet crops. Agric. Water Manag. 2008, 95, 48–58. [Google Scholar] [CrossRef]
  65. Mateos, L.; González-Dugo, M.; Testi, L.; Villalobos, F. Monitoring evapotranspiration of irrigated crops using crop coefficients derived from time series of satellite images. I. Method validation. Agric. Water Manag. 2013, 125, 81–91. [Google Scholar] [CrossRef]
  66. Odi-Lara, M.; Campos, I.; Neale, C.M.; Ortega-Farías, S.; Poblete-Echeverría, C.; Balbontín, C.; Calera, A. Estimating evapotranspiration of an apple orchard using a remote sensing-based soil water balance. Remote Sens. 2016, 8, 253. [Google Scholar] [CrossRef]
Figure 1. The workflow of the AgSAT application.
Remotesensing 14 05090 g001
Figure 2. The mobile user interface of the AgSAT Android smartphone application.
Remotesensing 14 05090 g002
Figure 3. Location of the 18 weather stations used in the study.
Remotesensing 14 05090 g003
Figure 4. AgSAT reference evapotranspiration comparison with in situ measurements of reference evapotranspiration from 18 weather stations.
Remotesensing 14 05090 g004
Figure 5. Time series of potential water requirements, Kcb, and reference evapotranspiration for the AgSAT validation experiment at AREC. Kcb matched well with FAO56 Kcb’s.
Remotesensing 14 05090 g005
Figure 6. Images of potato growth stages in the field used to validate the app (from right to left: 6 May, 26 May, 9 June, and 29 June).
Remotesensing 14 05090 g006
Figure 7. Daily AgSAT and station ETref over the study period of eight weather stations selected from each climate groups: Aw: wet tropical-savanna, BSk: cold semi-arid, Cfa: humid subtropical, Dfb: humid continental, BSh: hot semi-arid, Cfb: oceanic, Csa: Mediterranean, and BWh: arid-desert-hot. The station ETref is in red and AgSAT ETref is in black.
Remotesensing 14 05090 g007
Figure 8. Cumulative monthly AgSAT and station ETref over the study period of 18 weather stations.
Remotesensing 14 05090 g008
Table 1. Agrometeorological data from CFSV2, used for estimating the potential evapotranspiration (PET) (a product of the reference evapotranspiration (ETref) and the basal crop coefficient (Kcb)) computed using the standardized ASCE-Penman–Monteith equation.
Agrometeorological DataDescriptionUnit
TempTemperature 2 m above groundKelvin
U-windU-component of wind 10 m above groundm s−1
V-windV-component of wind 10 m above groundm s−1
RsDownward short-wave radiation flux at surface, 6-hour averageW m−2
RH_spec.Specific humidity 2 m above groundkg kg−1
Pressure_surfacePressure at surfacePa
Table 2. Suggested irrigation efficiencies based on pressurized irrigation system types.
Irrigation SystemSuggested Efficiency
Hand-move or portable or side roll70%
Traveling gun 65%
Center and Linear move85%
Solid-set75%
Drip or bubbler85%
Micro-sprinkler80%
SurfaceN/A
Table 3. Coordinates, altitude, elevation, wind speed height, climate, and source of studied sites.
LocationLatitudeLongitudeElevation
(m)
SourceClimatePeriod of
Record
Aguas Emendadas, Brazil15°35′47″S47°37′32″W1030INMETAw2015–2019
Monastir, Tunisia35°45′59″N10°49′59″E12Rp5BSh2015–2019
Islamabad, Pakistan33°37′0″N73°6′0″E507Rp5BSh2015–2019
Beijing, China39°56′59″N116°17′ 59″E57Rp5BSk2015–2019
Manama, Bahrain26°12′59″N50°34′59″E8Rp5BWh2015–2019
Adrar, Algeria27°50′0″N0°11′0″W280Rp5BWh2015–2019
Alexandria, Egypt31°11′1″N29°56′56″E−8Rp5BWh2015–2019
Mashtal, Iraq33°19′18″N44°29′11″E39MOA, IqBWh2011–2017
Rafha, Saudi Arabia29°37′33″N43°29′25″E448MOC, KSABWh1979–2009
Indian River, Florida27°37′9″N80°34′21″W7FAWNCfa2015–2019
Oak Park, Ireland52°51′38″N6°54’54″W62Met ÉireannCfb2008–2020
Roches Point, Ireland51°47′34″N8°14′38″W40Met ÉireannCfb2014–2020
Five Points, California36°20′10″N120°6′46″W87CIMISCsa2015–2020
Westlands, California36°38′3″N120°22′54″W58CIMISCsa2015–2020
Casablanca, Morocco33°34′0″N7°40′0″W52Rp5Csa2015–2019
Kamishly, Syria37°1′59″N41°11′59″E447Rp5Csa2015–2019
AREC, Lebanon33°55′31″N36°4′27″E993AUBCsa2012–2020
Basel, Switzerland47°32′48″N7°34′8″E284MeteoblueDfb2015–2020
Following the Köppen and Geiger climate classification (1939). Aw: wet tropical-savanna; BSh: hot semi-arid; BSk: cold semi-arid; BWh: arid-desert-hot; Cfa: humid subtropical; Cfb: oceanic; Csa: Mediterranean; Dfb: humid continental. Source Legend: CIMIS, California Irrigation Management Information System; FAWN, Florida Automated Weather Network; Met Éireann Forecast, The Irish Meteorological Service; Meteoblue, University of Basel, Switzerland; INMET, Instituto Nacional de Meteorologia; Rp5, rp5.co.za weather in the world; MOA, Iq, Ministry of Agriculture, Iraq; MOC: ministry of communication, Saudi Arabia; AUB: American University of Beirut.
Publisher’s Note: MDPI stays neutral with regard to jurisdictional claims in published maps and institutional affiliations.

