Abstract
Two measurement campaigns were conducted at Thessaloniki, an urban station, (40.5°N, 22.9°E; 60 m) in the frame of the PANhellenic infrastructure for Atmospheric Composition and climatEchAnge (PANACEA) project. The first one covers the period from July to August 2019 and the second one from January to February An overview of the aerosol optical properties (columnar and height resolved), acquired with the remote sensing infrastructure of the Laboratory of Atmospheric Physics (LAP) of the Aristotle University of Thessaloniki (AUTH), as well as the additional instrumentation that participated during the PANACEA campaigns is presented. The majority of the detected layers (16 out of 40, ranged between 0.8 and 4.5 km) are classified as biomass burning aerosols, attributed to either city sources or long range transport. Concerning the other aerosol types, the Clean Continental cluster has an occurrence ratio of 23%, while dust layers and mixtures with urban particles transported to Thessaloniki are also identified. Our findings are discussed along with the surface information, i.e., the particulate matter (PM2.5 and PM10) concentrations and the black carbon (BC) concentration, separated into fossil fuel (BCff) and biomass/wood burning (BCwb) fractions. This is the first time that collocated in situ and remote sensing instruments are deployed in Thessaloniki in order to assess the presence of aerosols and the predominant aerosol type both in situ and at elevated heights. Overall, our study showed that the BCwb contribution to the BC values in Thessaloniki is quite low (11%), whilst the majority of the biomass burning layers identified with the lidar system, are also linked with enhanced BC contribution and high Fine Mode Fraction values.
1. Introduction
Aerosols represent an important component of the Earth’s system with a significant impact on climate [1], weather [2], air quality [3], biogeochemical cycles [4], and health [5]. Systematic observations of the aerosol load are regularly performed and dedicated field campaigns have been carried out for monitoring the aerosol properties and the predominant aerosol type using combined observations from in-situ and active and passive remote sensing instruments [6]. A number of field campaigns have been also carried out during the last years in the Eastern Mediterranean region (e.g., CyCARE, https://www.tropos.de/institut/abteilungen/fernerkundung-atmosphaerischer-prozesse-neu/ag-bodengebundene-fernerkundung/cyprus-clouds-aerosols-and-rain-experiment-cycare (accessed on 6 October 2022) PRE-TECT, http://pre-tect.space.noa.gr/ (accessed on 6 October 2022)), an area that is acknowledged as a hot spot for climate change [7,8]. However, for the first time, a coordinated initiative with the goal of studying the atmospheric composition and the climate change within Greece, was established and carried out, under the PANhellenic infrastructure for Atmospheric Composition and climatEchAnge (PANACEA). Under this frame, dedicated campaigns were performed, using a set of in-situ and remote sensing instruments at numerous Greek selected cities, along summer in 2019 [9] and winter 2020 [10], aiming to: (i) monitor air pollution and the resulting human exposure to the atmospheric pollution in Greece and (ii) to advance the knowledge of the PM characterization. The overall outcome is the provision of services with collaboration of the existing national facilities, to crucial national economy sectors that are affected by air pollution and climate change, such as public health, agriculture/food security, tourism, shipping and energy sources.
During the 2019 PANACEA summer campaign (PANACEA 2019) and the 2020 PANACEA winter campaign (PANACEA 2020), simultaneous measurements of the aerosol load and their health relevant properties were performed in or close to six big urban centers of Greece (i.e., Athens, Thessaloniki, Volos, Ioannina, Xanthi and Patras) and the regional background station of Finokalia in Crete. Aim of the campaigns was primarily to monitor the particulate air pollution and secondly the resulting human exposure to the atmospheric pollution in these regions. One of the urban centers where PANACEA measurements took place is the Laboratory of Atmospheric Physics that is located in the Physics Department of the Aristotle University of Thessaloniki (40.5°N, 22.9°E; 60 m). The Laboratory operates a wide range of instrumentation, including a multiwavelength Raman Depolarization Lidar (Thessaloniki Lidar System—THELISYS) and a CIMEL sunphotometer. Along with the permanent instrumentation during the two campaigns, LAP was further equipped with an Aethalometer.
Thessaloniki station was chosen among others, since variable aerosol types have been systematically observed with high temporal and spatial distribution over the city [11,12,13,14]. Mineral dust intrusions, originating from the Sahara desert are dominant during summer and autumn [13,15], whilst, intense biomass burning episodes tend to occur during summer in the free troposphere, mainly associated with wildfires [13]. Continental aerosol layers are frequently observed and attributed to mixtures of anthropogenic pollution and particles from natural sources, while marine particles are produced at the sea surface and usually exist in the lowest troposphere. Voudouri et al. [14] concluded that the Polluted Smoke and the Clean Continental categories are the main sources of the aerosol layers observed in 3 years of nighttime lidar measurements over Thessaloniki accounting for 43–47% and 18–24%, correspondingly, while pure Dusty layers accounts for about 10–17% of the cases. Another climatologically aerosol classification study over Thessaloniki, based on the Brewer spectrophotometer dataset for the period 1998-2017 [16], reveals that Fine non absorbing (FNA) mixtures are generally prevalent and they appear more frequently before 2007 [17], while after 2007 the Black Carbon (BC) and Dust mixtures seem to appear more frequently [17]. The occurrence ratio of BC mixtures is found generally higher in winter, mainly associated with the increased use of wood and pellets emissions from domestic heating and the lower boundary layer [17].
This is the first time that collocated in situ and remote sensing instruments are deployed in Thessaloniki in order to assess the presence of aerosols and the predominant aerosol type both insitu at the surface and at elevated heights and investigate possible dependencies. Whilst the identification of the aerosol type in individual layers is possible with lidars, this is not the case for sunphotometric measurements that provide information on the whole atmospheric column. Moreover, insitu instruments are excellent in identifying the aerosol components near the earth’s surface, where the lidar system’s overlap is limiting the aerosol retrievals. Thus, the main objectives of the study are summarized as: (i) to analyze the temporal variability of the insitu and columnar measurements during the two PANACEA campaigns that include a wide range of atmospheric conditions over Thessaloniki, (ii) to examine the dependency between the insitu and columnar measurements with the multispectral information acquired with the lidar system and (iii) to identify the shortcomings of the insitu and columnar instruments to provide aerosol typing especially when aerosol layers of different origin and type are observed with the collocated lidar instrument.
The article is structured as follows: the instrumentation and the derived optical products of the collocated measurements for Thessaloniki station is presented in Section The automatic aerosol classification method and the methodology used to characterize the layers into basic aerosol types are presented in Section In Section 4 the retrievals from the two PANACEA campaigns are presented and the temporal distribution of the aerosol optical properties is discussed in terms of the variability of surface and column and layers. Finally, Section 5 contains the summary and main conclusions of this article.
2. Instrumentation and Products
2.1. Thessaloniki LIdar SYStem (THELISYS)
THELISYS is being operated for the aerosol particles detection as member station of the European Aerosol Research Lidar NETwork (EARLINET) [18] since 2000 and now as member of the Aerosols, Clouds, and Trace gases Research InfraStructure (ACTRIS; https://www.actris.eu/ (accessed on 6 October 2022)). Systematic measurements are performed following the EARLINET’s schedule (i.e., every Monday morning, and every Monday and Thursday evening after sunset), whilst complementary measurements are performed during Saharan dust outbreaks, smoke advection from biomass burning, volcano eruptions, and satellite collocated and coincident measurements (e.g., Cloud-Aerosol Lidar and Infrared Pathfinder Satellite Observation, CALIPSO [19] and ESA’s AEOLUS wind mission [20]). The system is based on the first (1064 nm), second (532 nm), and third harmonic (355 nm) frequency of a compact, pulsed Nd:YAG laser which emittes with a 10 Hz repetition rate. THELISYS setup includes three elastic backscatter channels at 355nm, 532 and 1064 nm, two nitrogen Raman channels at 387 nm and 607 nm and two polarization sensitive channels one parallel and one cross-polarization channel at 532 nm. The retrieved optical products are the backscatter coefficient profiles at 355, 532 and 1064 nm, the extinction coefficient profiles at 355 and 532 nm and the linear depolarization ratio at 532 nm. The full overlap height of THELISYS is reached at 800m above ground level. A detailed description of THELISYS technical characteristics and the processing of the aerosol optical products can be found in Siomos et al. [13] and Voudouri et al. [21], correspondingly. THELISYS dataset is quality assured, following all the QA procedures within EARLINET and is publicly available upon request at https://www.earlinet.org/ (accessed on 6 October 2022).
2.2. Cimel Sunphotometer
THELISYS is collocated with a multiband sunphometer [22], which provides automatically and almost continuously measurements since 2003, as part of the Aerosol Robotic Network network global network (AERONET). The sunphotometer observations allow the retrieval of the aerosol optical depth (AOD) for up to 9 wavelengths (i.e., 340, 380, 440, 500, 670, 870, 1020 and 1640 nm). Measurements are automatically gathered, processed, and distributed by AERONET at https://aeronet.gsfc.nasa.gov/ (accessed on 6 October 2022). The AOD and the fine mode AOD values at all available wavelengths, as well as the Single Scattering Albedo (SSA) at 440 nm are provided directly from the standard AERONET algorithms. The Fine Mode Fraction (FMF) product is based on the spectral deconvolution (SDA) method [23,24,25]. In our analysis, we used Version 3 level 2.0 [26] data (quality-assured data), and Level 1.5 products (cloud-screened and quality controlled data) whenever the Level 2.0 were not available. The availability of the Level 1.5 products reaches up to 100% of the total data during the summer period, and the 76% of the total data during the winter period. The sunphotometer measurements have already been compared both on a short term period [27] and on a climatological base [13] with Thessaloniki’s EARLINET lidar dataset.
2.3. Aethalometer
Real-time data of aerosol absorption at seven wavelengths (370, 470, 520, 590, 660, 880 and 950 nm) and of equivalent black carbon (eBC) at 880 nm were collected from a 7-wavelength aethalometer (Rack Mount Aethalometer Model AE31, Magee Scientific Corp., Berkeley, CA, USA). Black carbon particles originating from incomplete combustion are particularly potential absorbers of solar radiation and comprise a complex part of the climate system [28]. The Aethalometer provides continuous Black Carbon concentrations, at 5 min resolution. The 5-min resolution BC measurements are then averaged on an hourly basis. Source specific BC fractions, namely those related to wood burning (BCwb) and fossil fuel combustion (BCff) were calculated by Aethalometer, based on the absorption Ångstrom exponent (AAE470-950) values, assuming a fixed value for wood burning (AAEwb = 2) and fossil fuel combustion (AAEff = 1). This assumption is also applied in previous studies that support that these AAE values for fossil fuel and wood burning assumptions for BC absorption are considered fairly robust [29].
2.4. MP101M
The MP101M of ENVEA (Environnement-sa, https://www.envea.global/ (accessed on 6 October 2022)) is a continuously monitoring system that measures suspended particulate matter in ambient air, part of the municipality network. The analyzer is based on the beta ray attenuation measurement technique; it determines the PM10 concentration by measuring the amount of radiation that a sample, collected on a fiber tape, absorbs when exposed to a radioactive source. Low energy beta rays are absorbed by collision with electrons, whose number is proportional to density. Absorption is thus a function of the mass of the irradiated material, independently of its physicochemical nature. Combined with the optional CPM (Optical Particulate Monitor) module, the monitor allows a precise and real time evaluation of PM2.5 and PMThe principle of CPM module (photometry) is based on the measurement of the light scattered by the particles. A light source generates a laser beam, which horizontally crosses the sampling tube. When a particulate crosses the beam, light is scattered and the photodiode receives a pulse, which intensity depends on the size of the particulate. An algorithm (developed in co-operation with French CNRS) is applied to continuously convert the signal into mass concentration of particles.
3. Methodology
A summary of the methodology applied in this study is described in Figure 1. The lidar derived aerosol typing and the column-integrated properties are discussed along with the in situ retrievals; i.e., the particulate matter (PM) concentrations and the total black carbon (BC) concentrations along with the respective contribution of the fossil fuel and the biomass/wood burning.
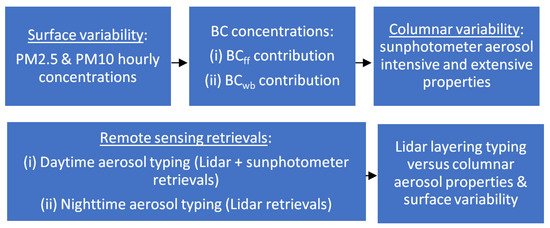
Figure 1.
Schematic flowchart showing the methodology and the dataset used in the study.
3.1. In Situ and Columnar Properties
The AOD and the fine mode AOD values at all available wavelengths, as well as the SSA at 440 nm and the FMF at 500 nm are provided directly with the standard AERONET algorithms [30]. These products are presented as 24-h averaged intervals. The Black Carbon concentrations divided in black carbon from wood burning (BCwb) and the fossil fuel (BCff) are provided by the Aethalometer, also averaged at 24-h intervals. Moreover, the PM2.5 and PM10, along with the PM2.5/PM10 ratio are also provided at 24-h intervals. Thus, in the analysis below, 24-h averages have been used for all products to ensure compatibility between the instruments. The availability of the dataset is presented below in Table 1.

Table 1.
Availability of the dataset of the instrumentation that participated in the two PANACEA campaigns.
3.2. Layering Properties
Apart from the vertical aerosol coefficient profiles derived by a lidar system, the layering aerosol optical properties can be derived from the multiwavelength lidar products [13,14]. The wavelet covariance transform method (WCT) is used for the automatic aerosol layers’ geometrical properties (i.e., base, top, and center of mass), based on the methodology of Siomos et al. [13]. Local extrema of the WCT profiles indicate points of monotonic increase/decrease in the applied backscatter/extinction profiles and as a result, at least one peak is included in the profiles within the layer boundaries. Masking threshold values that exclude undesired layers (i.e., low backscatter values) are applied. The layers identified above are used in order to be classified in specific aerosol types, based on their optical properties.
The intensive properties per layer (i.e., the aerosol type-sensitive properties), relevant to this study are the extinction-related Ångström exponent (AE), the backscatter-related Ångström exponent (BAE), the ratio of the backscatter coefficients profiles (color ratios—CRs), the lidar ratio (LR), and the ratio of the lidar ratios (RLR). The former depends mainly on the aerosol size distribution, while the latter depends mostly on the absorption and scattering aerosol properties.
All nighttime lidar profiles are processed with the Raman inversion [31], providing the full information of the intensive aerosol properties inside the aerosol layers. From the other hand, for the daytime lidar retrievals, the combined information from the sunphotometer and the daytime lidar measurements is processed by LIRIC code (LIdar-Radiometer Inversion Code, [32,33]), in order to retrieve the daytime extinction coefficient profiles. LIRIC uses the range corrected signal at 355, 532 and 1064 nm and the AOD values and sky radiance (almucantar scan) both at 440, 675, 870 and 1020 nm from AERONET version 3 level 1. With this configuration, LIRIC allows the vertical retrieval of the aerosol properties for both fine and coarse modes separately. Besides, LIRIC provides the vertically-resolved profiles of the extinction, absorption and scattering coefficients. LIRIC retrievals have been tested for a variety of aerosol types and their mixtures, e.g., for dust, dust-pollution, smoke, smoke-pollution and mixtures [34,35]. LIRIC has also been used to study dust transport events and dust modelling performance over Europe [36], as well as to evaluate air quality models [16].
3.3. Typing Procedures
The applied typing technique is based on the Mahalanobis distance metric [37] which is rather common in cluster analysis. It has already been applied for the classification of columnar aerosol data acquired by a Brewer spectrometer [38] and of aerosol individual layers detected by lidar systems [14,39]. Mahalanobis typing algorithm provides its classification of each aerosol layer by calculating the Mahalanobis distance of an observation from predefined reference classes and by attributing each observation to a specific class based on the minimum distance [39]. The Mahalanobis distance is given by the following equation:
MDi,j corresponds to the Mahalanobis distance of the point i from the reference clusters j. The vectors and consist of pairs of the mean-layer-intensive optical parameters retrieved with lidar (i.e., lidar ratio at 532 nm, Ångström exponent, color ratio (CLR532/355)), while contains the mean values per cluster j and includes the respective pairs per measurement i. is the variance co-variance matrix per cluster j. By identifying the reference dataset, any case can be attributed to one of the clusters based on a number of threshold criteria [39].
The MD method was applied for the identification of five predominant aerosol types, corresponding to the following aerosol clusters: (i) large particles with medium lidar ratios (i.e., dust-like particles), (ii) large particles with low lidar ratios (i.e., maritime particles), (iii) small particles with high lidar ratios (i.e., pollution and/or smoke particles), (iv) small particles with low to medium lidar ratios (i.e., clean continental particles) and (v) small spherical particles, medium absorbing (i.e., Polluted continental). The method has already been evaluated for aerosol typing on the lidar dataset of Thessaloniki [14].
4. Results
The results for each measured parameter are presented in this section. The PM surface variability and the black carbon mass concentration levels are discussed in Section 4.1. Section 4.2 displays the aerosol columnar properties, while Section 4.3 includes the dominant aerosol types observed over Thessaloniki during the summer and winter PANACEA campaigns and the results of two selected case studies.
4.1. Surface Variability
The particulate matter (PM) measurements show average daily concentrations during the summer campaign much lower than those of the winter season, with extreme values observed in winter (Figure 2). The PM2.5 daily concentrations ranged between 8 to 25 μg/m3, with a mean value of 14 ± 5 μg/m3 during the summer campaign and between 2 and 55 μg/m3 during the winter campaign, with a mean value of 18 ± 12 μg/m. On the other hand, the PM10 average daily concentrations ranged between 13 to 31 μg/m3 during the summer period and between 8 to 67 μg/m3 during the winter period with a mean value of 20 ± 5 μg/m3 and 28 ± 13 μg/m3, correspondingly. Generally, the PM concentrations are found within the range reported for typical urban areas in the Eastern Mediterranean [40,41,42]. In general, PM10 concentrations escalate during the cold period of the year (November–February), while lower levels have been observed during the summer season. In addition, considerably higher winter (27.4 ± 8.7 μg/m3) than summer (14.7 ± 1.2 μg/m3) PM2.5 concentrations were reported at an urban background site in Athens from a 3 years study [43]. The higher PM levels during winter are attributed, on one hand to enhanced emissions related to residential heating (mostly wood burning during the last years), and on the other, to the lower boundary layer that traps the pollutants near the surface and thus limiting dilution and dispersion [43,44]. Figure 2 presents the daily mean PM concentrations monitored during the summer (Figure 2a) and the winter period (Figure 2b). The levels of the particulate matter concentrations at ground level were found within the 24-h mean limits (for the majority of the days) which are set equal to 15 and 45 μg/m3, for the PM2.5 and PM10, respectively (WHO 2006).
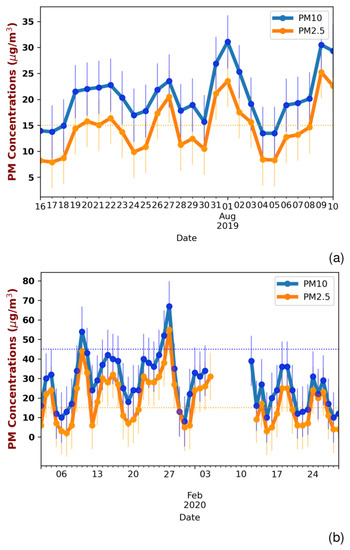
Figure 2.
Daily mean variation, along with the standard deviation of the PM2.5 and PM10 concentrations monitored during (a) the summer and (b) winter PANACEA campaigns in Thessaloniki station. The PM2.5 and PM10 24-h mean limits, according to the WHO are also marked with dotted lines.
Significant differences are detected in the PM2.5/PM10 ratios between the two PANACEA campaigns (Figure 3). PM2.5/PM10 ratios exhibit higher variability during the winter period, reaching higher values (even up to 1.0) linked with urban pollution. However the PM2.5/PM10 ratios decreased significantly (around 0.3–0.4), during Saharan dust events [45,46], reported during January and February of In general, large PM2.5/PM10 ratios are mostly reported for urban sites [42,47], whereas the ratio values are lower at regional/background sites [48].
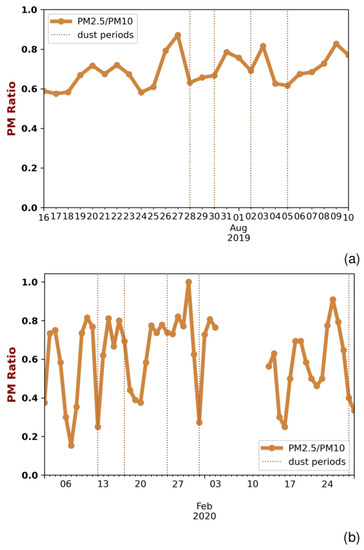
Figure 3.
PM2.5 and PM10 ratio monitored during (a) the summer and (b) winter PANACEA campaigns in Thessaloniki station. The periods with transported dust particles, according to the Hybrid Single Particle Lagrangian Integrated Trajectory model (HYSPLIT; https://www.arl.noaa.gov/hysplit/ (accessed on 6 October 2022)) are also plotted with dashed lines.
The equivalent black carbon mass concentration levels, along with the BC contribution of the fossil fuel and wood burning to the total BC mass concentrations measured by the Aethalometer is presented in Figure 4. The total BC values are found to be ranging between 0.64 and 3.5 μg/m3, with a mean value of 1.9 μg/m3, while the daily mean Black Carbon concentration is found equal to 0.8 ± 0.5 μg/m3 during summer and 1.6 ± 1 μg/m3 during the winter campaign. In general, the cycle is more pronounced during the winter period. Moreover, a weekly cycle of minima and maxima is marked (dashed lines in Figure 4), mainly attributed to the decreased number of vehicles during the weekend.
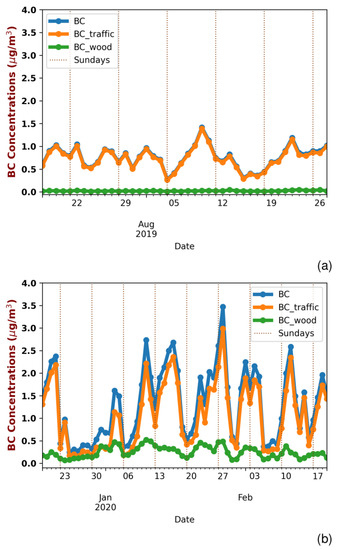
Figure 4.
Daily mean variation of the BC mass concentrations (μg/m3) along with the contribution of the fossil fuel and wood burning to the total BC mass concentrations, during (a) the summer and (b) winter PANACEA campaign in Thessaloniki station. Sundays are also marked with dashed lines.
The participation of the fossil fuel in the BC mass concentration values is generally high (even up to 100%) throughout the two PANACEA campaigns over Thessaloniki, indicating the high presence of fossil fuel activities, in the majority of the days in the campaigns. At the same time, the wood burning mass concentration is almost negligible during the summer campaign and low to moderate during the winter campaign (up to 11%), linked to the biomass burning activities for domestic heating purposes during the winter period.Similar analyses of the BC source apportionment in Athens revealed a dominance of the fossil-fuel combustion component (BCff), but with a significant contribution of wood-burning emissions to the total BC mass (BCwb fraction) in the range between 25% and 35% during wintertime [49,50].
The monitored BC levels are quite similar to another urban background [44], while are characterized as low to moderate, compared to the values reported in similar studies during the same measuring period [10]. For example, Liakakou et al. [44] found the average BC concentration to be equal to 1.9 ± 2.5 μg/m3 (ranging from 0.1 to 32.7 μg/m3; hourly values), based on a 4 year Aethalometer measurements over Athens. The BC value found to exhibit a well-defined seasonality from 1.3 ± 1.1 μg/m3 in summer to 3.0 ± 4.0 μg/m3 in winter. Similar BC pattern, with winter maximum and summer minimum, are also found at urban environments along the central and western Mediterranean [49].
In what follows, we examine the diurnal variability of the BC, BCff and BCwb concentrations during the two campaigns (Figure 5). Two peaks of higher BC and BCff concentrations are found during the summer PANACEA campaign, one between 06:00 and 07:00 (local time) and the second one between 20:00 and 22:00 (local time). Two peaks are also found during the winter campaign, however at different time intervals (i.e., between 08:00 and 10:00, and 18:00 and 20:00, local time). Both of them are linked with the traffic intensity and the corresponding rush hours during the daytime and nighttime activities. On the contrary, the BCwb diurnal cycle is more pronounced only during the winter period, after 16 UTC, highlighting the increased use of wood and pellets emissions from domestic heating, which is typically operated during the night hours. The wood burning contribution is found to remain at relatively high levels until about the next morning owing mostly to the shallow nocturnal boundary layer.
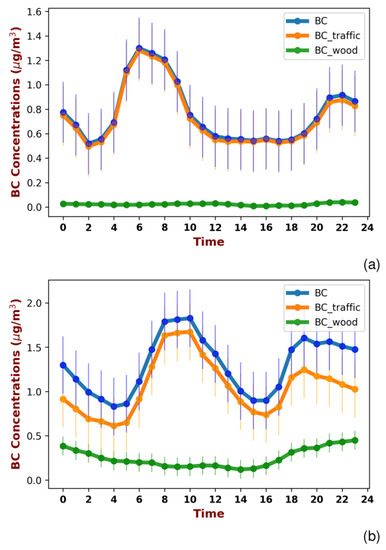
Figure 5.
Diurnal mean variation and standard deviation of the BC mass concentrations (μg/m3) along with the contribution of the fossil fuel and wood burning to the total BC mass concentrations, during (a) the summer and (b) winter PANACEA campaign in Thessaloniki station.
According to existing studies [51], pronounced BC peaks were observed during the morning and evening (secondarily) traffic hours at an urban cite, but with very low contribution of the wood-burning emissions. Additionally, Liakakou et al. [44] reported that the fossil-fuel combustion (BCff) component (traffic emissions and domestic heating) dominates during summer (83%) and in the morning hours, whilst the BCwb exhibits higher contribution in winter (32%), especially during the night hours (39%), based on a climatologically study over an urban site in Athens.
4.2. Columnar Variability
The temporal variability of the columnar Ångström exponent, Aerosol Optical Depth at 500 nm and the Fine Mode Fraction at 500nm from the AERONET version 3 retrievals during the two PANACEA campaigns is shown in Figure 6.The gaps in the time series during the winter period are caused due to the cloudy skies. During the summer period, the Ångström exponent varied from 0.87 to 2.03 with a mean value of 1.66 ± 0.18, while the AOD at 500 nm has mean value of 0.24 ± 0.During the winter period, the Ångström exponent varied from 0.99 to 1.91 with a mean value of 1.49 ± 0.19, while the AOD at 500 nm has mean value of 0.14 ± 0. The AODs and Ångström exponent’s values observed are typical for the study area [13]. Additionally, the FMF is indicative of the aerosol size. High values, close to 1, indicate dominant fine aerosol mixtures, while low values, close to zero indicate dominant coarse aerosol mixtures. The FMF values ranged between 0.53 and 0.96 during the summer campaign and between 0.47 and 0.97 during the winter campaign, revealing the dominance both of coarse particles and high anthropogenic emissions. Large AODs and low FMF values (0.53) as those observed on 3rd August 2019 are related to Saharan dust outbreaks, while large AODs and AE values as those observed on 25th August 2019 are related to a biomass burning transport.
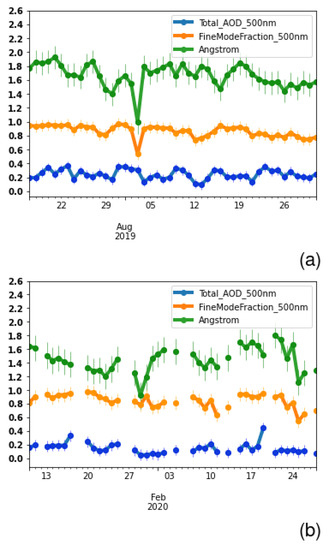
Figure 6.
Temporal evolution of aerosol optical depth (AOD) at 500 nm, Fine mode fraction at 500 nm and Ångström exponent, along with their standard deviation retrieved by the sunphotometer measurements during (a) the summer and (b) winter PANACEA campaigns in Thessaloniki station.
Concerning the columnar Lidar Ratio (LR) values, high values are observed during both the summer and winter campaigns (up to 90 sr at 440 nm). During the summer period, the LR at 440 nm had a mean value of 70 ± 9 sr, while the winter period the mean LR at 440 nm was found equal to 73 ± 14 sr. Generally, the LR values at a given wavelength depend on both the chemical composition and the particle shapes, with higher values representative for the existence of more absorbing aerosols.
Moreover, low mean columnar linear particle depolarization ratio during the campaigns are marked (mostly spherical particles observed), with higher values (up to 90.19) during the Saharan dust event (non spherical particles) observed on 30 January 2020.
4.3. Aerosol Typing
In the period from 5 July to 30 August, 16 days were recorded with episodes of low to strong dust transport from the Saharan desert (confirmed with BSC-DREAM8b model; [52]). During the winter period from 30 December to 5 March, transported dust layers were observed for 16 days, in total. The majority of them were characterized as episodes with low intensity (<50 μg/m3), while two days were characterized as moderate to strong intensity episodes. Moderate to high values of BC contributions were found both during the summer and winter periods. Especially, during the winter campaign, a total of 9 days exceeded the mean value of total BC concentration (>2.0 μg/m3) and during the summer campaign, BC concentrations were found above 1.0 μg/m3 for 5 days.
In order to identify the shortcomings of the columnar instruments for automated aerosol typing, especially when aerosol layers of different origin and type are observed with a collocated lidar instrument, the dominant aerosol type observed over Thessaloniki during the two PANACEA campaigns are presented below. Additionally, the aerosol typing retrievals for two case studies are discussed, along with the surface information, i.e., the particulate matter and the black carbon concentrations. These include a case of transported pollution that took place on 5 August 2019 and a long-range transported Saharan dust layer, on 25 January 2020.
4.3.1. Dominant Aerosol Types Observed over Thessaloniki during the Summer and Winter PANACEA Campaigns
Figure 7a presents the geometrical boundaries of the detected elevated aerosol layers. The majority of these layers are observed above 0.8 up to 4.2 km height a.s.l. The PBL top height is used in order to separate the boundary layer and the free troposphere (FT). The upper boundary PBL is identified in approximately 80% of the cases. The mean PBL height is found 1.3 ± 0.3 km for the months January to February, whilst the mean PBL height for the summer months (i.e., July to August) is found 1.6 ± 0.8 km.
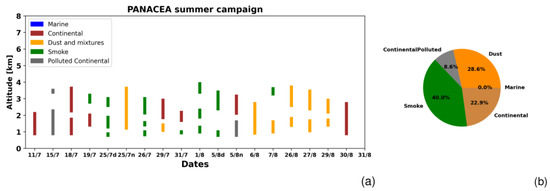
Figure 7.
(a) Geometrical boundaries of the aerosol layers identified and (b) percentages of the typed aerosol layers during the summer campaign from the daytime and nighttime Raman measurements, over Thessaloniki.
The boundaries of the aerosol layers during the summer campaign are found between 0.7 and 4.2 km, with mean geometrical thickness of 1.5 ± 0.7 km, and the majority (more than 60%) being in the lower Free Troposphere (LFT). The identified layers in the winter campaign are found at lower altitude levels (between 0.7 and 3 km), with the layer geometrical thickness being equal to 0.9 ± 0.57 km.
Figure 7b presents the percentages of the total typed layers (35 layers) into the defined aerosol classes with the Mahalanobis classifier during the summer campaign. The majority of the detected layers (above PBL height) during the summer campaign (up to 40%) are attributed to biomass burning aerosols (Smoke category, highly absorbing particles) from city sources or from remote sources (e.g., wildfires and agricultural fires). The Dust (pure and mixtures) cluster comes next with an occurrence ratio of 29% during the summer period. Clean continental particles are mainly observed during the summer campaign (with a percentage up to 23%). Our results are in accordance with the typing retrievals from the same time period over another urban city, Volos [9], where the majority of the detected layers found to be both smoke and urban originated, during the summer PANACEA campaign 2019.
The typing results from the winter campaign are not presented here, due to the limited number of the identified layers (existence of medium to low level clouds), as in most of the cases only the PBL height was identified from the lidar signal. However, the biomass burning particles are also the dominant components during the winter period, mainly attributed to the increasing use of wood.
Table 2 summarizes the mean aerosol geometrical and optical properties and the surface information found during the two PANACEA campaigns, along with the dominant aerosol type over Thessaloniki station.

Table 2.
Mean insitu, layering and columnar retrievals, along with their standard deviation during the two PANACEA campaigns.
In order to verify whether Smoke particles are the dominant aerosol type, the BC contribution (%) of the fossil fuel and the biomass/wood burning, along with the PM2.5/PM10 ratio and the optical thickness (of the first layer) and the lidar derived aerosol typing of up to first three detected layers (layers above the PBL height) over Thessaloniki during the PANACEA campaigns is presented in Figure 8. In total 15 cases (C#) have been identified and analyzed (days with simultaneous measurements with THELISYS, MP101M and Aethalometer).
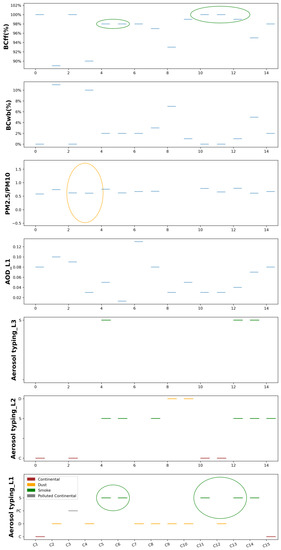
Figure 8.
Black Carbon contribution of the fossil fuel and the biomass/wood burning, along with the PM2.5/PM10 ratio and the optical thickness (of the first layer) and the aerosol typing of up to three detected layers over Thessaloniki during the PANACEA campaigns are presented. In total 15 cases (C#) have been identified (days with simultaneous measurements with THELISYS, MP101M and Aethalometer).
In the lower altitude ranges (first and second detected layer), equal percentage of appearance of aerosols types (pure and mixtures) are present, mainly attributed to local sources. Two regions with the highest fossil fuel contribution are marked (green circle). These high BCff percentages are also linked with biomass burning particles identified in the low troposphere (first layer) from the lidar retrievals and with high PM2.5/PM10 ratio measured by MP101M. On the other hand, PM2.5/PM10 ratios decreased significant, during Saharan dust events. Additionally, only smoke layers are detected as elevated layers (third layer) in the FT, mainly transported from agricultural fires in the Balkans, Belarus, and European Russia [13] during the summer period. The mean AOD value for the first aerosol layer is found 0.068 ± 0.04, denoting the rather thin first aerosol layer identified by the lidar in the lower Troposphere.
The dependency on the first layer lidar retrieved aerosol type with the total BC contribution and the Fine Mode Fraction at 500 nm is further examined in Figure 9. The results are retrieved from the synergistic information of the 3 instruments (i.e., Sunphotometer, Aethalometer and THELISYS) that performed collocated measurements during the PANACEA campaigns.
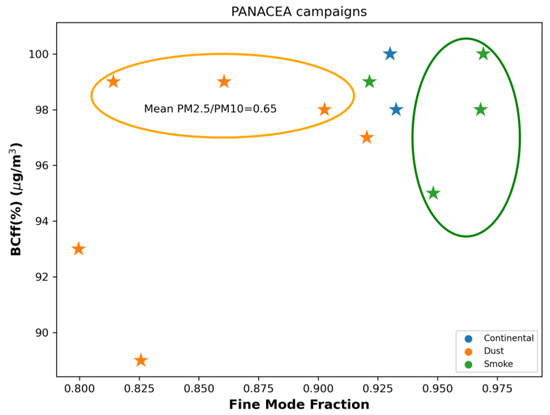
Figure 9.
Dependence on the first typed aerosol layer identified with THELISYS with the Black Carbon percentages of the fossil fuel (BCff) to the Total Black Carbon contribution and the Fine Mode Fraction at 500 nm, from the synergistic information of the 3 instruments (i.e., Sunphotometer, Aethalometer and THELISYS) that performed measurements during the PANACEA campaigns.
Figure 9 shows that the highest values of the columnar FMF correspond to absorbing aerosol layers (i.e., pure biomass burning and mixtures with dust or continental particles) and general high BCff concentrations. According to Figure 9, FMF values below 0.92 correspond to dominant coarse aerosols while values above 0.92 to dominant fine ones. The green marked ellipsoid marks the biomass burning layers identified with THELISYS, linked also with generally high BC contribution and FMF values above 0. However, the BC concentrations cannot be used as an evaluation source of the smoke presence retrieved from the automated lidar based typing, in all atmospheric situations, as the biomass layers and urban mixtures with moderate absorbing particles observed by the lidar system are usually found as elevated layers in the FT. Additionally, two clusters of dust are marked; one with high BCff concentrations (the yellow marked ellipsoid) and a second one with lower BCff concentrations, both linked with lower FMF values (<0.9) and low PM2.5/PM10 ratioMoreover, clustering continental layers based on the BC values is quite challenging as BC can still be present to a certain degree in continental layers [38].
4.3.2. Nighttime Retrievals of Transported Pollution, on 5 of August 2019: Case Ι
A case of transported pollution that occurred on 5 August 2019 is analyzed. Figure 10a illustrates the temporal evolution of the range corrected signal at 1064 nm, from 0.6 up to 6km height a.s.l, over Thessaloniki, between 18:15 and 18:56 UTC. The color scale on the right side of the figure indicates the range corrected signal in arbitrary units. The 5-day backward trajectories calculated using the HYSPLIT in conjunction with fire spots from MODIS satellite product FIRMS (Fire Information for Resource Management System; https://firms.modaps.eosdis.nasa.gov/map/ (accessed on 6 October 2022)) indicate the areas of the air parcels traveling below 3.5 km before reaching the study area. Continental particles, along with biomass burning particles, were transported from central Europe in the region of Thessaloniki (Figure 10b).

Figure 10.
(a) Temporal evolution of the 1064nm range corrected signal obtained with THELISYS in Thessaloniki on 5 August 2019, 18:15–18:50 UTC. The two layer boundaries are marked with black line. (b) The HYSPLIT 5-day air mass backward trajectories arriving at 1, 2 and 3.5 km at 15:00 UTC at Thessaloniki.
The measurement is characterized by two particle layers: the first one is between 0.7 and 1.7 km (Layer 1) and the second one between 2.03 and 3.25 km (Layer 2). The mean lidar ratio is calculated as 20 ± 9 for 355 nm and 12 ± 5 for 532 nm (Layer 1) and for Layer 2 it is 44 ± 5sr for 355 nm and 47 ± 12 sr for 532 nm. The ratio of the lidar ratio values (LR532/LR355) for Layer 1 is 0.6 ± 0.004 and for Layer 2 it is 1.06 ± 0.The mean AOD at 355nm for each layer is estimated at 0.013 (Layer 1) and 0.1 (Layer 2), whilst the mean backscatter-related Ångström exponent (BAE) at 355-1064 nm is 1.83 ± 0.15 (Layer 1) and 1.54 ± 0.16 (Layer 2), respectively. The first layer is characterized by the Mahalanobis typing algorithm as a Polluted Continental layer (pollution from local particles and biomass burning aerosols) and the second one, as a Continental one (urban particles).
At ground level, the PM10 mass concentrations exhibit values of 13 μg/m3, whilst the PM2.5 mass concentrations are found moderate at that day, equal to 8 μg/m. The equivalent black carbon mass concentration levels, along with the BC contribution of the fossil fuel and the wood burning to the total BC mass concentrations are further analyzed and presented in Figure 11. The total BC values ranged between 0.09 and 0.91 μg/m3, through the day, with a mean value of 0.4 μg/m. The contribution of the BCwb concentrations to the total BC concentrations is extremely low, whereas the contribution of the BCff concentrations is almost equal to the total BC concentrations. The event is generally not characterized by the highest Black Carbon concentrations during the summer PANACEA campaign. The BC concentrations seem to be in accordance with the Polluted Continental layer (mixed urban layers with moderate absorbing aerosol layers) identified by THELISYS, in the LFT.
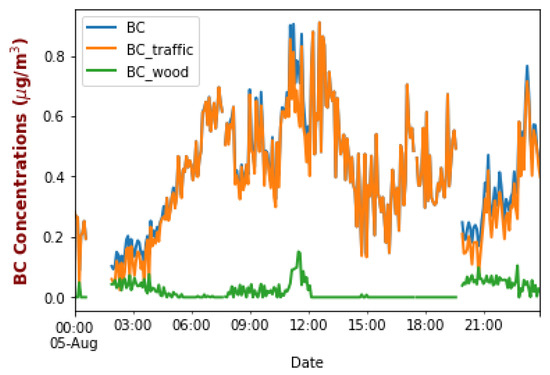
Figure 11.
Temporal variation of the BC mass concentrations (μg/m3) along with the contribution of the fossil fuel and wood burning to the total BC mass concentration on 5 August 2019.
4.3.3. Daytime Retrievals of a Transported Dust Episode on 25 of January 2020: Case ΙI
The second case refers to the occurrence of a dust plume over the station of Thessaloniki on 21 January Figure 12a illustrates the temporal evolution of the range corrected signal at 1064 nm, from 0.6 up to 6 km height a.s.l, over Thessaloniki, between 16:25 and 16:55 UTC. The color scale on the right side of the figure indicates the range corrected signal in arbitrary units. The 5-day backward trajectories from HYSPLIT in conjunction with the BSC-DREAM8b model are used to verify the long-range transport of Saharan dust over Thessaloniki (Figure 12b). The measurement is characterized by one thick layer between 1.9 and 3.0 km (layer boundaries colored with white lines), whilst the PBL height is found at 0.86 km. The mean lidar ratio is calculated as 45 ± 1 for 355 nm and 58 ± 3 for 532 nm. The ratio of the lidar ratio values (LR532/LR355) is 1.3 ± 0. The mean AOD at 355 nm for the layer is estimated at 0.21, whilst the mean Ångström exponent at 355–532 nm is −0.15 ± 0. The retrieved values indicate the presence of coarse particles (Dust layer), being in agreement with the typical dust values observed over Thessaloniki [13].
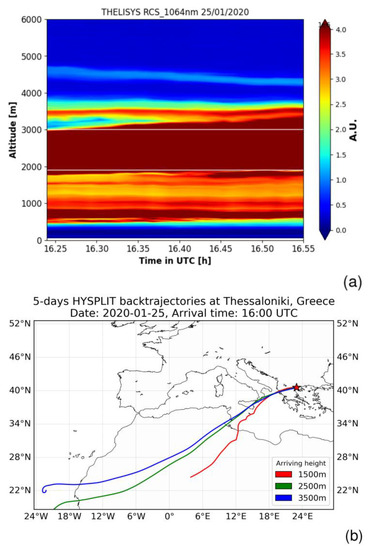
Figure 12.
(a) Temporal evolution of the 1064 nm range corrected signal obtained with THELISYS in Thessaloniki on 25 January 2020, 16:25–16:55 UTC. The layer boundaries are marked with black line. (b) The HYSPLIT 5-day air mass backward trajectories arriving at 1.5, 2.5 and 3.5 km at 16:00 UTC at Thessaloniki.
At ground level, the PM10 mass concentrations exhibit high values of 42 μg/m3, whilst the PM2.5 mass concentrations are found moderate to high at that day, equal to 31 μg/m. The equivalent black carbon mass concentration levels, along with the BC contribution of the fossil fuel and wood burning to the total BC mass concentrations measured by the Aethalometer is presented in Figure 13. The BC values are found to be ranging between 0.64 and 3.5 μg/m3, with a mean value of 1.9 μg/m3, and high BCff contribution to the total BC (80%), indicating the high presence of fossil fuel burning activity during that day. Even if the monitored layer is identified as an elevated one in the FT, both THELISYS retrievals and PM concentration show the dominance of coarse particles.
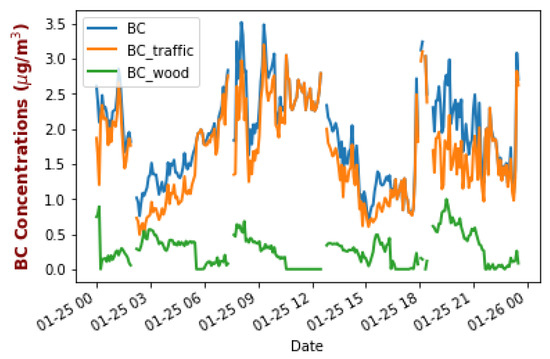
Figure 13.
Temporal variation of the BC mass concentrations (μg/m3) along with the contribution of the fossil fuel and wood burning to the total BC mass concentration on 25 January 2020.
5. Conclusions
Continuous observations of the aerosol properties over Thessaloniki station, during two distinct PANACEA campaign periods, with collocated in situ and remote sensing instruments allow us to perform an assessment of the aerosol load, based on the optical properties and the chemical composition.
At ground level, the PM2.5 daily concentrations ranged between 8 to 25 μg/m3 during the summer campaign and between 2 and 55 μg/m3 during the winter campaign, mainly associated with biomass burning particles. On the other hand, the PM10 average daily concentrations ranged between 13 to 30 μg/m3 during the summer period and between 8 and 67 μg/m3 during the winter period, mainly attributed to transported dust aerosols. The average Black Carbon (BC) concentration is found to be 0.8 ± 0.5 μg/m3 during summer and 1.6 ± 1 μg/m3 during the winter campaign. In general, the BC concentrations are affected by both the BC emissions, however, measurements show the predominance of combustion-related aerosol from burning fossil fuels and a rather low to moderate enhancement of the domestic wood burning contribution (11%) during the winter period over Thessaloniki.
Concerning the aerosol layers identified in the Lower Free Troposphere in the vertical lidar profiles, in total 40 aerosol layers are typed (out of 44). The majority of the detected layers are classified as biomass burning aerosols (with percentages up to 40% and 25% during the summer and the winter period, respectively) attributed to either city sources or remote sources (e.g., wildfires and agricultural fires). Pure dusty layers or mixtures with urban particles are also identified during the summer and the winter period (with percentages up to 28% and 25%, respectively), whilst the Clean Continental cluster follows with an occurrence ratio of 23%, mainly observed during the summer campaign.
The general convergence between the columnar and layering analysis are regarded as a signature of reliability of the dominant aerosol component. Thessaloniki is a coastal metropolitan area, with urban aerosols affecting the lower layers and being present during both the summer and winter season. Overall, our study showed that the majority of the biomass burning layers identified with THELISYS, are also linked with enhanced BC contribution and enhanced Fine Mode Fraction values. Thus, BC concentrations can be used as a signature of biomass burning presence over the station of Thessaloniki, especially when the biomass burning particles are present in the Lower Troposphere and not as elevated layers.
Overall, the PANACEA campaigns highlight the importance of the synergistic use of the remote sensing and the in-situ instrumentation to perform a full characterization of the aerosol load, based on the extensive and intensive aerosol properties and the chemical composition.
Author Contributions
D.B., N.S., K.A.V. and K.M. performed lidar measurements during the PANACEA campaigns. All of them participated in the maintenance and calibration of the lidar system throughout these years. K.A.V. prepared the manuscript with contributions from A.C., G.K., P.T., A.K., N.M. and D.B. is the PI of the lidar station and directed the preparation of the manuscript. All authors have read and agreed to the published version of the manuscript.
Funding
This research was funded by the PANhellenic infrastructure for Atmospheric Composition and climatE change (PANACEA) research project (MIS 5021516), implemented under the Action Reinforcement of the Research and Innovation Infrastructure, and the Operational Program Competitiveness, Entrepreneurship, and Innovation (NSRF 2014–2020), co-financed by Greece and the European Union (European Regional Development Fund).
Data Availability Statement
The lidar data used in this study are available upon registration at https://www.earlinet.org/index.php?id=125 (accessed on 6 October 2022). The AERONET sun-photometer data for Thessaloniki are publicly available at https://aeronet.gsfc.nasa.gov/ (accessed on 6 October 2022).
Conflicts of Interest
The authors declare no conflict of interest.
References
- Seinfeld, J.H.; Bretherton, C.; Carslaw, K.S.; Coe, H.; DeMott, P.J.; Dunlea, E.J.; Feingold, G.; Ghan, S.; Guenther, A.B.; Kahn, R.; et al. Improving our fundamental understanding of the role of aerosol-cloud interactions in the climate system. Proc. Natl. Acad. Sci. USA 2016, 113, 5781–5790. [Google Scholar] [CrossRef] [PubMed]
- Marinescu, P.J.; van den Heever, S.; Saleeby, S.M.; Kreidenweis, S.M.; DeMott, P.J. The microphysical roles of lower-tropospheric versus midtropospheric aerosol particles in mature-stage MCS precipitation. J. Atmos. Sci. 2017, 74, 3657–3678. [Google Scholar] [CrossRef]
- Fuzzi, S.; Baltensperger, U.; Carslaw, K.; Decesari, S.; Van Der Gon, H.D.; Facchini, M.C.; Fowler, D.; Koren, I.; Langford, B.; Lohmann, U.; et al. Particulate matter, air quality and climate: Lessons learned and future needs. Atmos. Chem. Phys. 2015, 15, 8217–8299. [Google Scholar] [CrossRef]
- Mahowald, N.M.; Scanza, R.; Brahney, J.; Goodale, C.L.; Hess, P.G.; Moore, J.K.; Neff, J. Aerosol Deposition Impacts on Land and Ocean Carbon Cycles. Curr. Clim. Chang. Rep. 2017, 3, 16–31. [Google Scholar] [CrossRef]
- Trippetta, S.; Sabia, S.; Caggiano, R. Fine aerosol particles (PM1): Natural and anthropogenic contributions and health risk assessment. Air Qual. Atmos. Health 2016, 9, 621–629. [Google Scholar] [CrossRef]
- Benavent-Oltra, J.A.; Casquero-Vera, J.A.; Román, R.; Lyamani, H.; Pérez-Ramírez, D.; Granados-Muñoz, M.J.; Herrera, M.; Cazorla, A.; Titos, G.; Ortiz-Amezcua, P.; et al. Overview of the SLOPE I and II campaigns: Aerosol properties retrieved with lidar and sun–sky photometer measurements. Atmos. Chem. Phys. 2021, 21, 9269–9287. [Google Scholar] [CrossRef]
- Lionello, P.; Scarascia, L. The relation between climate change in the Mediterranean region and global warming. Reg. Environ. Chang. 2018, 18, 1481–1493. [Google Scholar] [CrossRef]
- Zittis, G.; Hadjinicolaou, P.; Klangidou, M.; Proestos, Y.; Lelieveld, J. A multi-model, multi-scenario, and multi-domain analysis of regional climate projections for the Mediterranean. Reg. Environ. Chang. 2019, 19, 2621–2635. [Google Scholar] [CrossRef]
- Mylonaki, M.; Papayannis, A.; Papanikolaou, C.-A.; Foskinis, R.; Soupiona, O.; Maroufidis, G.; Anagnou, D.; Kralli, E. Tro-pospheric vertical profiling of the aerosol backscatter coefficient and the particle linear depolarization ratio for different aerosol mixtures during the PANACEA campaign in July 2019 at Volos, Greece. Atmos. Environ. 2021, 247, 118184. [Google Scholar] [CrossRef]
- Papanikolaou, C.-A.; Papayannis, A.; Mylonaki, M.; Foskinis, R.; Kokkalis, P.; Liakakou, E.; Stavroulas, I.; Soupiona, O.; Hatzianastassiou, N.; Gavrouzou, M.; et al. Vertical Profiling of Fresh Biomass Burning Aerosol Optical Properties over the Greek Urban City of Ioannina, during the PANACEA Winter Campaign. Atmosphere 2022, 13, 94. [Google Scholar] [CrossRef]
- Amiridis, V.; Balis, D.S.; Giannakaki, E.; Stohl, A.; Kazadzis, S.; Koukouli, M.E.; Zanis, P. Optical characteristics of biomass burning aerosols over Southeastern Europe determined from UV-Raman lidar measurements. Atmos. Chem. Phys. 2009, 9, 2431–2440. [Google Scholar] [CrossRef]
- Giannakaki, E.; Balis, D.S.; Amiridis, V.; Zerefos, C. Optical properties of different aerosol types: Seven years of combined Raman-elastic backscatter lidar measurements in Thessaloniki, Greece. Atmos. Meas. Tech. 2010, 3, 569–578. [Google Scholar] [CrossRef]
- Siomos, N.; Balis, D.S.; Voudouri, K.A.; Giannakaki, E.; Filioglou, M.; Amiridis, V.; Papayannis, A.; Fragkos, K. Are EARLINET and AERONET climatologies consistent? The case of Thessaloniki, Greece. Atmos. Chem. Phys. 2018, 18, 11885–11903. [Google Scholar] [CrossRef]
- Voudouri, K.A.; Siomos, N.; Michailidis, K.; Papagiannopoulos, N.; Mona, L.; Cornacchia, C.; Nicolae, D.; Balis, D. Comparison of two automated aerosol typing methods and their application to an EARLINET station. Atmos. Chem. Phys. 2019, 19, 10961–10980. [Google Scholar] [CrossRef]
- Marinou, E.; Amiridis, V.; Binietoglou, I.; Tsikerdekis, A.; Solomos, S.; Proestakis, E.; Konsta, D.; Papagiannopoulos, N.; Tsekeri, A.; Vlastou, G.; et al. Three-dimensional evolution of Saharan dust transport towards Europe based on a 9-year EARLINET-optimized CALIPSO dataset. Atmos. Chem. Phys. 2017, 17, 5893–5919. [Google Scholar] [CrossRef]
- Siomos, N.; Balis, D.S.; Poupkou, A.; Liora, N.; Dimopoulos, S.; Melas, D.; Giannakaki, E.; Filioglou, M.; Basart, S.; Chaikovsky, A. Investigating the quality of modeled aerosol profiles based on combined lidar and sunphotometer data. Atmos. Chem. Phys. 2017, 17, 7003–7023. [Google Scholar] [CrossRef]
- Fountoulakis, I.; Natsis, A.; Siomos, N.; Drosoglou, T.; Bais, A.F. Deriving Aerosol Absorption Properties from Solar Ultraviolet Radiation Spectral Measurements at Thessaloniki, Greece. Remote Sens. 2019, 11, 2179. [Google Scholar] [CrossRef]
- Pappalardo, G.; Amodeo, A.; Apituley, A.; Comeron, A.; Freudenthaler, V.; Linné, H.; Ansmann, A.; Bösenberg, J.; D’Amico, G.; Mattis, I.; et al. EARLINET: Towards an advanced sustainable European aerosol lidar network. Atmos. Meas. Tech. 2014, 7, 2389–2409. [Google Scholar] [CrossRef]
- Pappalardo, G.; Wandinger, U.; Mona, L.; Hiebsch, A.; Mattis, I.; Amodeo, A.; Ansmann, A.; Seifert, P.; Linné, H.; Apituley, A.; et al. EARLINET correlative measurements for CALIPSO: First intercomparison results. J. Geophys. Res. 2010, 115, D00H19. [Google Scholar] [CrossRef]
- Stoffelen, A.; Pailleux, J.; Källén, E.; Vaughan, J.M.; Isaksen, L.; Flamant, P.; Wergen, W.; Andersson, E.; Schyberg, H.; Culoma, A.; et al. The atmospheric dynamics mission for global wind field measurement. Bull. Am. Meteorol. Soc. 2005, 86, 73–88. [Google Scholar] [CrossRef]
- Voudouri, K.A.; Siomos, N.; Michailidis, K.; D’Amico, G.; Mattis, I.; Balis, D. Consistency of the Single Calculus Chain Optical Products with Archived Measurements from an EARLINET Lidar Station. Remote Sens. 2020, 12, 3969. [Google Scholar] [CrossRef]
- Holben, B.N.; Eck, T.F.; Slutsker, I.; Tanré, D.; Buis, J.P.; Setzer, A.; Vermote, E.; Reagan, J.A.; Kaufman, Y.J.; Nakajima, T.; et al. AERONET—A Federated Instrument Network and Data Archive for Aerosol Characterization. Remote Sens. Environ. 1998, 66, 1–16. [Google Scholar] [CrossRef]
- O’Neill, N.T.; Dubovik, O.; Eck, T.F. Modified Ångström exponent for the characterization of submicrometer aerosols. Appl. Opt. 2001, 40, 2368–2375. [Google Scholar] [CrossRef] [PubMed]
- O’Neill, N.T.; Eck, T.F.; Holben, B.N.; Smirnov, A.; Dubovik, O.; Royer, A. Bimodal size distribution influences on the variation of Angstrom derivatives in spectral and optical depth space. J. Geophys. Res. Atmos. 2001, 106, 9787–9806. [Google Scholar] [CrossRef]
- O’Neill, N.T.; Eck, T.F.; Smirnov, A.; Holben, B.N.; Thulasiraman, S. Spectral discrimination of coarse and fine mode optical depth. J. Geophys. Res. 2003, 108, 4559–4573. [Google Scholar] [CrossRef]
- Giles, D.M.; Sinyuk, A.; Sorokin, M.G.; Schafer, J.S.; Smirnov, A.; Slutsker, I.; Eck, T.F.; Holben, B.N.; Lewis, J.R.; Campbell, J.R.; et al. Advancements in the Aerosol Robotic Network (AERONET) Version 3 database—Automated near-real-time quality control algorithm with improved cloud screening for Sun photometer aerosol optical depth (AOD) measurements. Atmos. Meas. Tech. 2019, 12, 169–209. [Google Scholar] [CrossRef]
- Voudouri, K.A.; Siomos, N.; Giannakaki, E.; Amiridis, V.; D’Amico, G.; Balis, D. Long-Term Comparison of Lidar Derived Aerosol Optical Depth Between Two Operational Algorithms and Sun Photometer Measurements for Thessaloniki, Greece. In Perspectives on Atmospheric Sciences; Springer: Cham, Switzerland, 2017; Available online: https://link.springer.com/chapter/10.1007/978-3-319-35095-0_113 (accessed on 6 October 2022).
- Bond, T.C.; Doherty, S.J.; Fahey, D.W.; Forster, P.M.; Berntsen, T.; DeAngelo, B.J.; Flanner, M.G.; Ghan, S.; Kärcher, B.; Koch, D.; et al. Bounding the role of black carbon in the climate system: A scientific assessment. J. Geophys. Res. Atmos. 2013, 118, 5380–5552. [Google Scholar] [CrossRef]
- Kaskaoutis, D.; Grivas, G.; Stavroulas, I.; Bougiatioti, A.; Liakakou, E.; Dumka, U.; Gerasopoulos, E.; Mihalopoulos, N. Apportionment of black and brown carbon spectral absorption sources in the urban environment of Athens, Greece, during winter. Sci. Total Environ. 2021, 801, 149739. [Google Scholar] [CrossRef]
- Dubovik, O.; King, M.D. A flexible inversion algorithm for retrieval of aerosol optical properties from Sun and sky radiance measurements. J. Geophys. Res. Atmos. 2000, 105, 20673–20696. [Google Scholar] [CrossRef]
- Ansmann, A.; Wandinger, U.; Riebesell, M.; Weitkamp, C.; Michaelis, W. Independent measurement of extinction and backscatter profiles in cirrus clouds by using a combined Raman elastic-backscatter lidar. Appl. Opt. 1992, 31, 7113–7131. [Google Scholar] [CrossRef] [PubMed]
- Chaikovsky, A.; Dubovik, O.; Goloub, P.; Balashevich, N.; Lopatsin, A.; Karol, Y.; Denisov, S.; Lapyonok, T. Software Package for the Retrieval of Aerosol Microphysical Properties in the Vertical Column Using Combined Lidar/Photometer Data (Test Version); Technical Report; Institute of Physics, National Academy of Sciences of Belarus: Minsk, Belarus, 2008. [Google Scholar]
- Chaikovsky, A.; Dubovik, O.; Holben, B.; Bril, A.; Goloub, P.; Tanré, D.; Pappalardo, G.; Wandinger, U.; Chaikovskaya, L.; Denisov, S.; et al. Lidar-Radiometer Inversion Code (LIRIC) for the retrieval of vertical aerosol properties from combined lidar/radiometer data: Development and distribution in EARLINET. Atmos. Meas. Tech. 2016, 9, 1181–1205. [Google Scholar] [CrossRef]
- Tsekeri, A.; Amiridis, V.; Kokkalis, P.; Basart, S.; Chaikovsky, A.; Dubovik, O.; Mamouri, R.E.; Papayannis, A.; Baldasano, J.M. Application of a Synergetic Lidar and Sunphotometer Algorithm for the Characterization of a Dust Event Over Athens, Greece. Br. J. Environ. Clim. Chang. 2013, 3, 531–546. [Google Scholar] [CrossRef][Green Version]
- Kokkalis, P.; Amiridis, V.; Allan, J.D.; Papayannis, A.; Solomos, S.; Binietoglou, I.; Bougiatioti, A.; Tsekeri, A.; Nenes, A.; Rosenberg, P.D.; et al. Validation of {LIRIC} aerosol concentration retrievals using airborne measurements during a biomass burning episode over Athens. Atmos. Res. 2017, 183, 255–267. [Google Scholar] [CrossRef]
- Binietoglou, I.; Basart, S.; Alados-Arboledas, L.; Amiridis, V.; Argyrouli, A.; Baars, H.; Baldasano, J.M.; Balis, D.; Belegante, L.; Bravo-Aranda, J.A.; et al. A methodology for investigating dust model performance using synergistic EARLINET/AERONET dust concentration retrievals. Atmos. Meas. Tech. 2015, 8, 3577–3600. [Google Scholar] [CrossRef]
- Mahalanobis, P.C. On the Generalized Distance in Statistics; National Institute of Science of India: Odisha, IN, USA, 1936; Volume 12, pp. 49–55. [Google Scholar]
- Siomos, N.; Fountoulakis, I.; Natsis, A.; Drosoglou, T.; Bais, A. Automated Aerosol Classification from Spectral UV Measurements Using Machine Learning Clustering. Remote Sens. 2020, 12, 965. [Google Scholar] [CrossRef]
- Papagiannopoulos, N.; Mona, L.; Amodeo, A.; D’Amico, G.; Claramunt, P.G.; Pappalardo, G.; Alados-Arboledas, L.; Guerrero-Rascado, J.L.; Amiridis, V.; Kokkalis, P.; et al. An automatic observation-based aerosol typing method for EARLINET. Atmos. Chem. Phys. 2018, 18, 15879–15901. [Google Scholar] [CrossRef]
- Saliba, N.A.; El Jam, F.; El Tayar, G.; Obeid, W.; Roumie, M. Origin and variability of particulate matter (PM10 and PM2.5) mass concentrations over an Eastern Mediterranean city. Atmos. Res. 2010, 97, 106–114. [Google Scholar] [CrossRef]
- Pikridas, M.; Vrekoussis, M.; Sciare, J.; Kleanthous, S.; Vasiliadou, E.; Kizas, C.; Savvides, C.; Mihalopoulos, N. Spatial and temporal (short and long-term) variability of submicron, fine and sub-10 μm particulate matter (PM1, PM2.5, PM10) in Cyprus. Atmos. Environ. 2018, 191, 79–93. [Google Scholar] [CrossRef]
- Diapouli, E.; Manousakas, M.; Vratolis, S.; Vasilatou, V.; Maggos, T.; Saraga, D.; Grigoratos, T.; Argyropoulos, G.; Voutsa, D.; Samara, C.; et al. Evolution of air pollution source contributions over one decade, derived by PM10 and PM2.5 source apportionment in two metropolitan urban areas in Greece. Atmos. Environ. 2017, 164, 416–430. [Google Scholar] [CrossRef]
- Theodosi, C.; Tsagkaraki, M.; Zarmpas, P.; Grivas, G.; Liakakou, E.; Paraskevopoulou, D.; Lianou, M.; Gerasopoulos, E.; Mihalopoulos, N. Multi-year chemical composition of the fine-aerosol fraction in Athens, Greece, with emphasis on wintertime residential heating. Atmos. Chem. Phys. 2018, 18, 14371–14391. [Google Scholar] [CrossRef]
- Liakakou, E.; Stavroulas, I.; Kaskaoutis, D.; Grivas, G.; Paraskevopoulou, D.; Dumka, U.; Tsagkaraki, M.; Bougiatioti, A.; Oikonomou, K.; Sciare, J.; et al. Long-term variability, source apportionment and spectral properties of black carbon at an urban background site in Athens, Greece. Atmos. Environ. 2020, 222, 117137. [Google Scholar] [CrossRef]
- Gerasopoulos, E.; Kouvarakis, G.; Babasakalis, P.; Vrekoussis, M.; Putaud, J.-P.; Mihalopoulos, N. Origin and variability of particulate matter (PM10) mass concentrations over the Eastern Mediterranean. Atmos. Environ. 2006, 40, 4679–4690. [Google Scholar] [CrossRef]
- Conte, M.; Merico, E.; Cesari, D.; Dinoi, A.; Grasso, F.M.; Donateo, A.; Guascito, M.R.; Contini, D. Long-term characterisation of African dust advection in south-eastern Italy: Influence on fine and coarse particle concentrations, size distributions, and carbon content. Atmos. Res. 2020, 233, 104690. [Google Scholar] [CrossRef]
- Samara, C.; Voutsa, D.; Kouras, A.; Eleftheriadis, K.; Maggos, T.; Saraga, D.; Petrakakis, M. Organic and elemental carbon associated to PM10 and PM2.5 at urban sites of northern Greece. Environ. Sci. Pollut. Res. 2014, 21, 1769–1785. [Google Scholar] [CrossRef] [PubMed]
- Paraskevopoulou, D.; Liakakou, E.; Gerasopoulos, E.; Mihalopoulos, N. Sources of atmospheric aerosol from long-term measurements (5 years) of chemical composition in Athens, Greece. Sci. Total Environ. 2015, 527–528, 165–178. [Google Scholar] [CrossRef]
- Diapouli, E.; Kalogridis, A.-C.; Markantonaki, C.; Vratolis, S.; Fetfatzis, P.; Colombi, C.; Eleftheriadis, K. Annual Variability of Black Carbon Concentrations Originating from Biomass and Fossil Fuel Combustion for the Suburban Aerosol in Athens, Greece. Atmosphere 2017, 8, 234. [Google Scholar] [CrossRef]
- Kalogridis, A.-C.; Vratolis, S.; Liakakou, E.; Gerasopoulos, E.; Mihalopoulos, N.; Eleftheriadis, K. Assessment of wood burning versus fossil fuel contribution to wintertime black carbon and carbon monoxide concentrations in Athens, Greece. Atmos. Chem. Phys. 2018, 18, 10219–10236. [Google Scholar] [CrossRef]
- Becerril-Valle, M.; Coz, E.; Prévôt, A.S.H.; Močnik, G.; Pandis, S.; de la Campa, A.M.S.; Alastuey, A.; Díaz, E.; Pérez, R.; Artíñano, B. Characterization of atmospheric black carbon and co-pollutants in urban and rural areas of Spain. Atmos. Environ. 2017, 169, 36–53. [Google Scholar] [CrossRef]
- Basart, S.; Pérez, C.; Nickovic, S.; Cuevas, E.; Baldasano, J.M. Development and evaluation of the BSC-DREAM8b dust regional model over Northern Africa, the Mediterranean and the Middle East. Tellus B Chem. Phys. Meteorol. 2012, 64, 18539. [Google Scholar] [CrossRef]
Publisher’s Note: MDPI stays neutral with regard to jurisdictional claims in published maps and institutional affiliations. |
© 2022 by the authors. Licensee MDPI, Basel, Switzerland. This article is an open access article distributed under the terms and conditions of the Creative Commons Attribution (CC BY) license (https://creativecommons.org/licenses/by/4.0/).