Article

Medium-Resolution Mapping of Evapotranspiration at the Catchment Scale Based on Thermal Infrared MODIS Data and ERA-Interim Reanalysis over North Africa

1
Digital 4 Research Labs (D4R), Mohammed VI Polytechnic University (UM6P), Lot 660, Hay Moulay Rachid, Ben Guerir 43150, Morocco
2
Centre d’Etudes Spatiales de la BIOsphère (CESBIO), 31400 Toulouse, France
3
LMFE, Faculty of Sciences Semlalia, Cadi Ayyad University, Marrakech 40000, Morocco
4
Center for Remote Sensing Applications (CRSA), Mohammed VI Polytechnic University (UM6P), Lot 660, Hay Moulay Rachid, Ben Guerir 43150, Morocco
5
ProcEDE/AgroBiotech Center, Department of Applied Physics, Faculty of Sciences and Techniques, Cadi Ayyad University, Marrakech 40000, Morocco
6
National Institute for Agronomic Research (INRA), Rabat 10000, Morocco
7
Office Régional de Mise en Valeur Agricole du Haouz (ORMVAH), bd Hassan II Guéliz Marrakech, Marrakech 40000, Morocco
*
Author to whom correspondence should be addressed.
Remote Sens. 2022, 14(20), 5071; https://doi.org/10.3390/rs14205071
Submission received: 16 August 2022 / Revised: 26 September 2022 / Accepted: 4 October 2022 / Published: 11 October 2022

Abstract

:
Accurate quantification of evapotranspiration (ET) at the watershed scale remains an important research challenge for managing water resources in arid and semiarid areas. In this study, daily latent heat flux (LE) maps at the kilometer scale were derived from the two-source energy budget (TSEB) model fed by the MODIS leaf area index (LAI), land surface temperature (LST) products, and meteorological data from ERA-Interim reanalysis from 2001 to 2015 on the Tensift catchment (center of Morocco). As a preliminary step, both ERA-Interim and predicted LE at the time of the satellite overpass are evaluated in comparison to a large database of in situ meteorological measurements and eddy covariance (EC) observations, respectively. ERA-Interim compared reasonably well to in situ measurements, but a positive bias on air temperature was highlighted because meteorological stations used for the evaluation were mainly installed on irrigated fields while the grid point of ERA-Interim is representative of larger areas including bare (and hot) soil. Likewise, the predicted LE was in good agreement with the EC measurements gathered on the main crops of the region during 15 agricultural seasons with a correlation coefficient r = 0.70 and a reasonable bias of 30 W/m2. After extrapolating the instantaneous LE estimates to ET daily values, monthly ET was then assessed in comparison to monthly irrigation water amounts provided by the local agricultural office added to CRU precipitation dataset with a reasonable agreement; the relative error was more than 89% but the correlation coefficient r reached 0.80. Seasonal and interannual evapotranspiration was analyzed in relation to local climate and land use. Lastly, the potential use for improving the early prediction of grain yield, as well as detecting newly irrigated areas for arboriculture, is also discussed. The proposed method provides a relatively simple way for obtaining spatially distributed daily estimates of ET at the watershed scale, especially for not ungauged catchments.

1. Introduction

Sustainable water resources management is a key issue in regions such as North Africa suffering historically from water scarcity and, in recent years, from an increase in drought frequency [1] and drastic changes in agricultural practices, leading to an increase in irrigation water demand [2,3,4,5,6]. Evapotranspiration (ET), which includes soil evaporation and plant transpiration, is a key component for the understanding of global water cycle [7], for catchment hydrology and streamflow prediction [8], as well as for agronomical studies, as it represents the crop water use [9,10]. However, vegetation ET and its partition is largely unknown at a global scale [11], particularly for highly anthropized catchments composed of heterogeneous agricultural landscapes mixing a large range of crops with complex structure [12] with various development stage and hydric conditions [13]. There is, thus, an imperious need for the development of methods to map ET at the catchment scale that are easy to implement in order to help water managers in their day-to-day decision-making processes.
In situ measurements are usually carried out using eddy covariance stations [14] or scintillometers [15]. While such instruments provide accurate measurements of ET at an infra-daily timestep, they require very specific skills, they are costly in human force and funding, and their measurements have a limited spatial representativity. By contrast, significant progress has been made in the last three decades on the mapping of ET based on remote sensing observations and modeling [16]. While ET as a water flux (or its energy-equivalent, the latent heat flux) cannot be directly observed from space, several approaches combining surface parameters and variables derived from remote sensing data with land surface models have been developed following basically two directions [17,18,19]: (1) the first is hereafter called the “water budget” approach, aimed at predicting the vertical profile of water availability for the plant within the root zone by solving a soil water budget. Several methods combine remote sensing products with land surface models of various complexity from concepts such as the FAO-56 double coefficient [3,20] to complex physically based soil–vegetation–atmosphere transfer (SVAT) models [21,22]. Nevertheless, solving a water budget model on a complex agricultural and irrigated landscape relies on a good knowledge of the irrigation water inputs, information that is largely unknown for large areas at the field scale [23,24,25,26]; (2) the second approach hereafter called “energy budget” is based on surface energy budget models fed by remotely sensed land surface temperature (LST) observations taken as a proxy of the crop hydric conditions when water availability is limited [27]. Indeed, when the plant undergoes stress, the stomata start closing and the energy dissipation through the transpiration processes is limited, leading to an increase in the crop temperature. In this context, several approaches based on LST have been developed to retrieve ET [17,28,29,30,31]: (1) contextual approaches mapping evapotranspiration by projecting each pixel of an image in a two-dimensional space, consisting of surface temperature and the NDVI or the albedo [27,32]; (2) residual approaches which estimate the evapotranspiration as the residual of the surface energy balance [33,34,35]. These latter approaches showed good performance for reliable estimation of evapotranspiration over semiarid areas [36,37] and crop water stress [18,38,39]. Among the numerous residual models (SEBAL [40]; TSEB [35]; ALEXI [41]; DTD [42]; SPARSE [38]; METRIC [43]; ETEML [44]), the two-source energy balance (TSEB) model [35] has proven to be fairly robust for a wide range of landscapes [36,45,46] and weather conditions [9,27,28] and has already been calibrated, evaluated, and validated at our study site [18,19,47,48].
The recent advance in the free availability of satellite land surface products at different spatial and temporal resolutions, together with the future launch of sensors combining high resolution and revisit time in the thermal infrared domain (the Copernicus “Land Surface Temperature Monitoring” mission—LSTM onboard Sentinel-8 to be launched in 2028 and the Indo-French “Thermal Infrared Imaging Satellite for High-Resolution Natural Resource Assessment”—TRISHNA mission to be launched in 2024), has further the its potential for water management application. Among those products, medium-resolution Moderate-Resolution Imaging Spectroradiometer (MODIS) products provide globally, since the beginning of the 2000s, most of the physical parameters for surface energy balance models including leaf area index (LAI), albedo, and LST [29,30,31]. They are also freely available from two sensors (Terra and Aqua), thus enhancing temporal resolution. Likewise, meteorological forcings are currently available at the global scale with a good accuracy thanks to the ongoing progress of reanalysis systems. Among them, ERA-Interim [49] reanalysis, a single 32 year global land surface reanalysis dataset covering the period 1979–2010, has proven to be a good candidate for climate monitoring in various part of the world. Jones et al. [50] showed excellent agreement for global- and continental-scale trends in surface air temperatures over land with conventional station-based datasets. Simmons et al. [51] demonstrated the quality of ERA-Interim near-surface fields by comparing with observation-only climatic data records. The incoming solar radiation provided by the ERA-Interim reanalysis with ground-based measurements was evaluated over France by Szczypta [52]. They showed a slight positive bias, with a modest impact on land surface simulations. These studies demonstrate that reanalyses have the specific advantage of being spatially and temporally complete through the process of physical/dynamic representation of the climate system, which provides internally consistent fields across most surface atmospheric variables, as well as in the atmospheric column up to the stratosphere [53].
The main objective of this work is to present a regional mapping evapotranspiration system based on forcing data available at the global scale and freely distributed (MODIS products and the ERA-Interim reanalysis data). This system is evaluated over the 2001–2015 period thanks to the longtime meteorological and micrometeorological network of the Tensift Observatory [54,55]. As a preliminary step, the quality of the ERA-Interim meteorological forcing is assessed compared to the Tensift Observatory meteorological stations. The predicted components of the energy budget are then compared to eddy covariance station measurements at the time of the satellite overpass. Two complementary indirect assessment are conducted: (1) by comparing predicted monthly ET to precipitation + irrigation water amounts provided at the monthly scale by the office in charge of the agricultural water management in the region (Office Régional de Mise en Valeur du Haouz—ORMVAH) at the scale of the main irrigated perimeter of the catchment; (2) by comparing integrated ET data during the growing season to crop yield statistics. Lastly, the seasonal and interannual variability of the ET in relation to the climatic variability of the region and the agricultural practices are analyzed.

2. Materials and Methods

2.1. Study Area

The Tensift Al Haouz region, which is considered as a typical watershed of the Southern Mediterranean, is a semiarid watershed (20,450 km2) located in the center of Morocco (region of Marrakech-Safi) (Figure 1). Located between 30°50′ and 32°1′ north and 7°12′ and 9°25′ west, the mountainous part of the catchment culminating at 4000 m with the “Jbel Toubkal” is located to the south. The northern border is composed of lower mountains less than 1000 m in elevation called "Jbilet". In the east, the little marked water parting separates the ouadi of Tensift from that of Tessaout and Oum ErR'bia and borders the Atlantic Ocean in the west, known as its release place. Annual crops (wheat, barley, and alfalfa), olive groves, and citrus are the dominant crops (approximately 80% of arable land) in the Tensift area [56,57,58]. The cereal production, which occupies approximately 15,000 km2, presents an efficiency of 15 quintals per hectare (qt/ha) on average [59,60,61], a relatively low and variable production from 1 year to the next [62,63,64] with strong discrepancies between the rainfed and irrigated areas, where the production can reach 75 qt/ha. The climate of the watershed is mainly continental semiarid, with specificities on the coastal fringe (influenced by the cold flow form Canary Islands) and on the mountain range of the High Atlas in the south, where most rainfall is concentrated. The rainfall is globally weak in the plain with a strong spatiotemporal variability. The average annual rainfall in the plain is 250 mm, concentrated between November and April, and it can exceed 600 mm in the High Atlas [54].

2.2. Fields Measurements

The measured data fluxes and meteorological datasets used in this study were provided by the Tensift Observatory composed of a network of meteorological, micrometeorological, and hydrological stations covering the Tensift watershed since 2002. Concerning micrometeorological measurements, most of the eddy covariance stations are located in irrigated areas (named Agafay, Agdal, R3, and Saada; Figure 1), and the instruments (Table 1) are compliant with the FLUXNET standards [65]. They are equipped with commercially available instrumentation: (1) a Krypton hygrometer (model KH2O—Campbell Scientific Inc., Logan, UT, USA) measuring the water vapor sampled at a rate of 20 Hz, and a 3D sonic anemometer (CSAT3, Campbell Scientific Ltd.) measuring the wind speed at high frequency; both data are used to derive the sensible H and latent LE heat fluxes (W/m2) with a half hourly time; (2) air temperature (K) and relative humidity (%) are measured using an HMP45C, Vaisala, Finland; (3) incoming and outgoing solar radiation in the short- and longwave domain is measured using a CNR1 (Kipp & Zonen, Delft, The Netherlands). Details related to the processing, including the quality compared to lysimeter and sap-flow measurement, were given by Diarra et al. [18], Duchemin et al. [66], Elfarkh et al. [47], Ezzahar et al. [67], and Simonneaux et al. [68]. To maintain the integrity of the observations, no gap-filling was performed for these data. Concerning meteorological observations, the network (Table 1) is equipped with standard Campbell Scientific measurement sensors for the measurement of hourly rainfall, global radiation, temperature, relative humidity, and wind speed. The daily latent heat flux observations are computed daily with no missing data by aggregating the 48 half-hourly observations.

2.3. MODIS Data

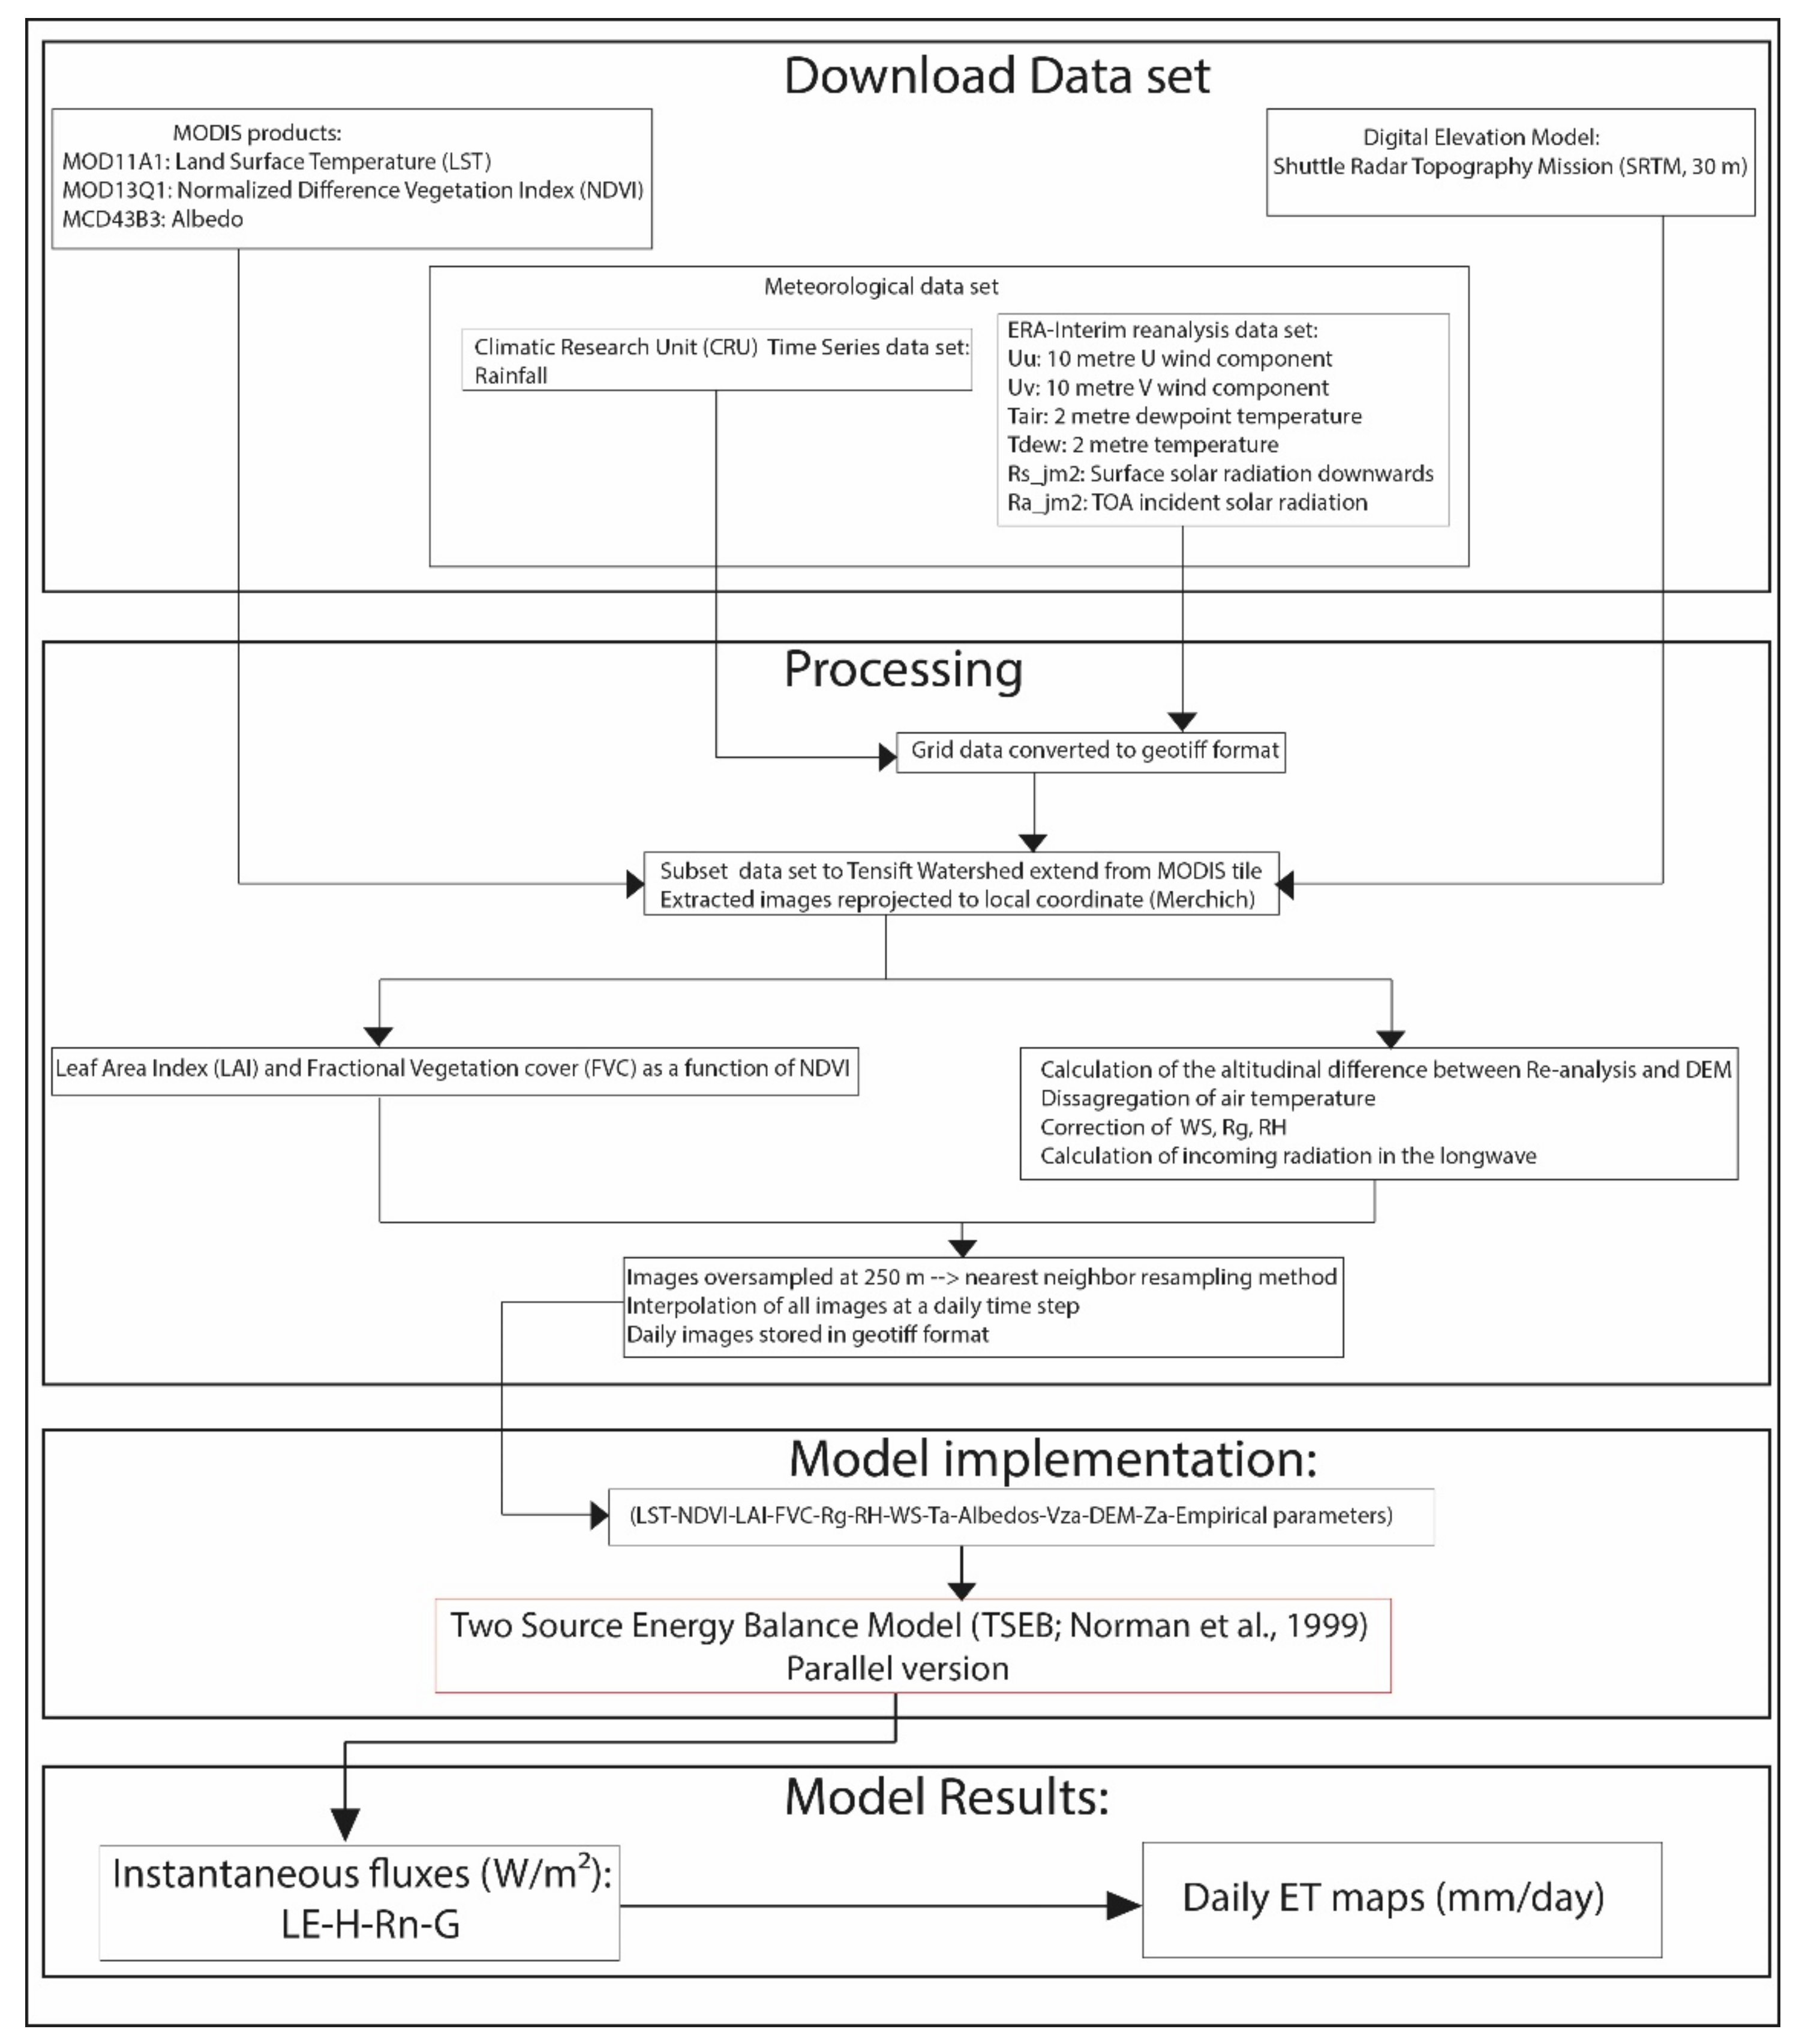
Collection 6 products of Moderate-Resolution Imaging Spectroradiometer (MODIS) onboard the Terra satellite were used to feed the TSEB model. NDVI is provided by MOD13Q1 product, with 250 m/16 days spatiotemporal resolution. Albedo is provided by MCD43A3 product, with 500 m/8 days spatiotemporal resolution. LST from the Terra sensors (MOD11A1 product) is provided at daily and 1 km spatiotemporal resolution at the time over the satellite overpass. Albedos and vegetation indices are interpolated at the daily timestep. The leaf area index (LAI), height of the vegetation, and the fractional vegetation cover (FVC) were obtained from the NDVI thanks to empirical relations. FVC was computed on the basis of the methodology proposed by Gutman and Ignatov [69] and further improved by Zeng et al. [70]. All the variables were finally oversampled at 250 m using the nearest neighbor resampling method (Figure 2). MODIS products are freely available from Atmosphere Archive and Distribution System (LAADS) Distributed Active Archive Center (DAAC): https://ladsweb.modaps.eosdis.nasa.gov/ (accessed on 31 July 2022).

2.4. ERA-Interim Dataset

The meteorological variables for the resolution of the surface energy budget are the temperature and the humidity of the air at 2 m, the wind speed, and the incoming radiation in the short- and longwave [33]. In this study, the meteorological variables (air temperature, incoming radiation in the shortwave domain, air humidity, and wind speed) came from ERA-Interim reanalysis [49] for the period of availability of MODIS products (2001–2015). The spatial resolution of the dataset is approximately 80 km with a 3 h temporal resolution, and the last version of the ERA-Interim dataset published by the European agency website was used (e.g., Beck et al. [71]).
The air temperature at 2 m and wind speed are key input variables for TSEB (see, among others, the sensitivity study of Bigeard et al. [19]. In particular, the main factors governing the variability of the air temperatures are the elevation and the water and energy exchanges between the surface and the atmosphere, which both depend on soil and vegetation conditions, as well as on advection. In this study, air temperature was disaggregated using the digital elevation model from the Shuttle Radar Topography Mission (SRTM, 30 m) to correct for the difference between the elevation of the last level of the European center model and the real elevation of the surface (Figure 2), following Gao et al. [72].
Likewise, the wind speed was corrected for the difference in elevation assuming a logarithmic profile. The incoming radiation in the longwave was computed using the formula of Brutsaert [73]. The relative humidity was then computed from the temperature at the dew point and from the disaggregated air temperature. Lastly, all the variables were temporally interpolated at the time of the satellite overpass from the ERA-Interim three hourly basis using a simple linear interpolation, and gridded on the MODIS grid at 250 m resolution using the nearest neighbor resampling method.
Long-term estimates of precipitation named climatic research unit (CRU) timeseries are also used in version 3.24 released in 2017 [74]. The CRU precipitation dataset is based on monthly observational data. The data are available at a monthly temporal resolution and at a spatial scale of 0.5° for the period 1901–present. This dataset was used to indirectly assess the predicted ET at the monthly timescale by comparison to rainfall plus irrigation water amounts. It is preferred to ERA-Interim reanalysis rainfall estimates for two reasons: (1) it is an independent dataset from the ERA-Interim that is used as input of TSEB; (2) significant bias and errors on ERA-Interim rainfall have been highlighted by comparison to observational datasets [75].

2.5. Irrigation Water Amounts and Yields Statistics

Ancillary data including monthly irrigation water amounts and cereal grain yields statistics were also gathered to assess indirectly the quality of the ET estimates, particularly their monthly and interannual variabilities, respectively. Irrigation water amounts are provided at the monthly timescale by our partner in charge of the management of the agricultural water for the year 2011. They gather information at the monthly timescale for each irrigation perimeter equipped with concrete channel. The considered irrigated perimeters are reported in Figure 1. Data on cereal productions over the study period 2001–2011 at the administrative provincial scale of the Tensift were kindly made available by the Economic Services of the Ministry of Agriculture in Morocco (https://www.agriculture.gov.ma/, accessed on 31 July 2022), which gathers production of the main cereals cropped in the region (Soft wheat, barley, and durum wheat). More details about the cereal yield data are provided in Balaghi et al. [59], Bouras et al. [60,76], and Jarlan et al. [61].

2.6. The Two-Source Energy Balance Model

The TSEB model was described in detail in Norman et al. [35] and Kustas and Norman [77]. Latent and sensible heat fluxes arise from two sources: soil and canopy. The model estimates the turbulent fluxes by simultaneously solving the energy balance composed of two energy balance equations for soil and canopy and two equations of continuity for latent and sensible heat fluxes to the aerodynamic level:
R n s = H s + LE s + G ,
R n c = H c + LE c ,
H = H c + H s ,
LE = LE c + LE s ,
where R n is net radiation (W/m2), G is the soil heat flux (W/m2), H is the sensible heat flux (W/m2), and L E is the latent heat flux (W/m2); superscripts s and c denote “soil” and “canopy”, respectively. The TSEB model uses a single-time observation of radiometric surface temperature T r a d   to solve the double-energy balance at the time of the satellite overpass. Soil and vegetation temperatures contribute to T r a d in proportion to the fraction of the radiometer view occupied by each component as follows:
T rad = [   f c ( θ )   T c 4 + 1     f c ( θ )   T s 4 ] 1 / 4 ,
where T c and T s are the canopy and soil temperatures (K), respectively, f c θ is the fractional vegetation cover observed at the radiometer view angle θ . For a canopy with a spherical leaf angle distribution, f c θ can be expressed as
f c ( θ ) = 1     e ( 0.5     LAI cos θ ) ,
where Ω, the Kappa factor, indicates the degree to which vegetation is clumped. The Ω value ranges from 0.4 to 0.9 [78]. A value of 0.45 corresponding to no clumping conditions was used in this study. This value was shown to provide the best estimates of LE in our study region by Diarra et al. [18], after a sensitivity analysis.
The net radiation R n is computed using
R n =   1     α R g + ε R atm     ε σ ( 1     f c ( θ ) T s 4     f c ( θ ) T c 4 ) ,
where R g and R a t m are the short- and longwave incident radiation (W/m2), respectively, the emissivity ε is equal to 0.98, and the albedo α evolves seasonally with the vegetation cover fraction through a weighted average of a soil and a vegetation albedo (taken equal to 0.15 and 0.2, respectively in this study); σ is the Stefan–Boltzman constant (5.67 × 10⁻⁸ W/m2/K4).
The net radiation at the soil surface is computed assuming an extinction coefficient of 0.45 [35].
R n s = R n   e ( 0.45   LAI ) .
The leaf area index (LAI) is derived from an empirical relationship using the NDVI (see Section 2.3).
There are two versions of the TSEB model, depending on the connection scheme of the resistance network. The parallel version assumes that both components are located side by side and that the ET from both sources is computed separately. The series version represents the crops as a layer of vegetation above the soil with interactions in terms of radiative and convective fluxes [31]. In this study, the parallel version was selected. With this resistance network, the sensible heat fluxes from the soil H s and canopy H c were computed as follows:
H s = ρ Cp   Ts     Ta r ah + r sh ,
H c = ρ Cp   Tc     Ta r ah ,
where ρ Cp is the volumetric heat capacity (J/m3/K) of air, T a is the air temperature (K) measured at 2 m, r a h is the aerodynamic resistance (s/m) to heat transport (e.g., Brutsaert and Reidel [79]), and r s h is the resistance (s/m) to heat flow in the boundary layer immediately above the soil surface. The second formulation for computing H s and H c , by permitting the soil and vegetated canopy fluxes to interact, is the series resistance arrangement (see Appendix A in Norman et al. [35]).
The conduction flux in the soil is expressed as a function of the net radiation at the soil surface R n s :
  G = Γ   R n s ,
were Γ is an empirical coefficient equal to 0.35 [80].
Lastly, the resolution of this set of equations relies on the (strong) assumption that, most of the time, the vegetation transpires at a potential rate. The Priestley–Taylor equation [81], with the parameter α P T   nominally equal to 1.26 for unstressed conditions, gives a first estimation of L E c :
LE c = α PT f g Δ Δ + ϒ R n c ,
where R n c   is the net radiation to the canopy (W/m2), α PT   is the Priestley–Taylor parameter ( α PT ≈ 1.26), ∆ is the slope of the saturation vapor pressure–temperature relation (kPa/°C), ϒ is the psychrometric constant (kPa/°C), and the sign convention is positive toward the canopy.
H c is then computed as a residual of the vegetation energy balance (Equation (2)). T c   is derived from H c ; T s   is derived from Equation (5); H s   is computed from T s   and L E s as a residual of the soil energy balance (Equation (1)). If L E s is found negative, indicating condensation of water on the soil surface, which is very unlikely during the day, the assumption of vegetation transpiration at the potential rate is bypassed. L E s is set to zero, and a new value of L E c is computed. Likewise, if L E c is found negative, L E is set to zero. Further details on the resolution are given in French [82] (see Figure 2.6 p.39).

2.7. Extrapolation to Daily Value and Monthly Values

In order to extrapolate LE estimates at the time of the satellite overpass to the daily value of ET in mm/day, several approaches have been developed. Delogu et al. [83] among others intercompared different methods of daily extrapolation. Most methods rely on the daily preservation of the evaporative fraction scaling up evapotranspiration with the daily cycle of available energy or are based on the extrapolation of a stress factor with the help of instantaneous potential evapotranspiration value. In this study, a method simply based on the daily course of incoming solar radiation was chosen. The approach was proposed and described in Ryu et al. [84]. This method, particularly simple to implement because incoming solar radiation has a low spatial variability and can be measured easily, is particularly interesting in the view of a practical application by managers. It was evaluated on our region of study by [18], who highlighted a limited RMSE of 0.52 mm in comparison to eddy covariance measurements. In practice, the 48 half-hourly values are cumulated and divided by the water latent heat of vaporization. Monthly values are obtained thanks to a simple average.

3. Results

As a preliminary step, ERA-Interim meteorological variables were evaluated in comparison to the data acquired by the network of meteorological stations located in the Tensift watershed. The components of the energy budget predicted by TSEB were then compared to the eddy covariance measurements.

3.1. Evaluation of ERA-Interim

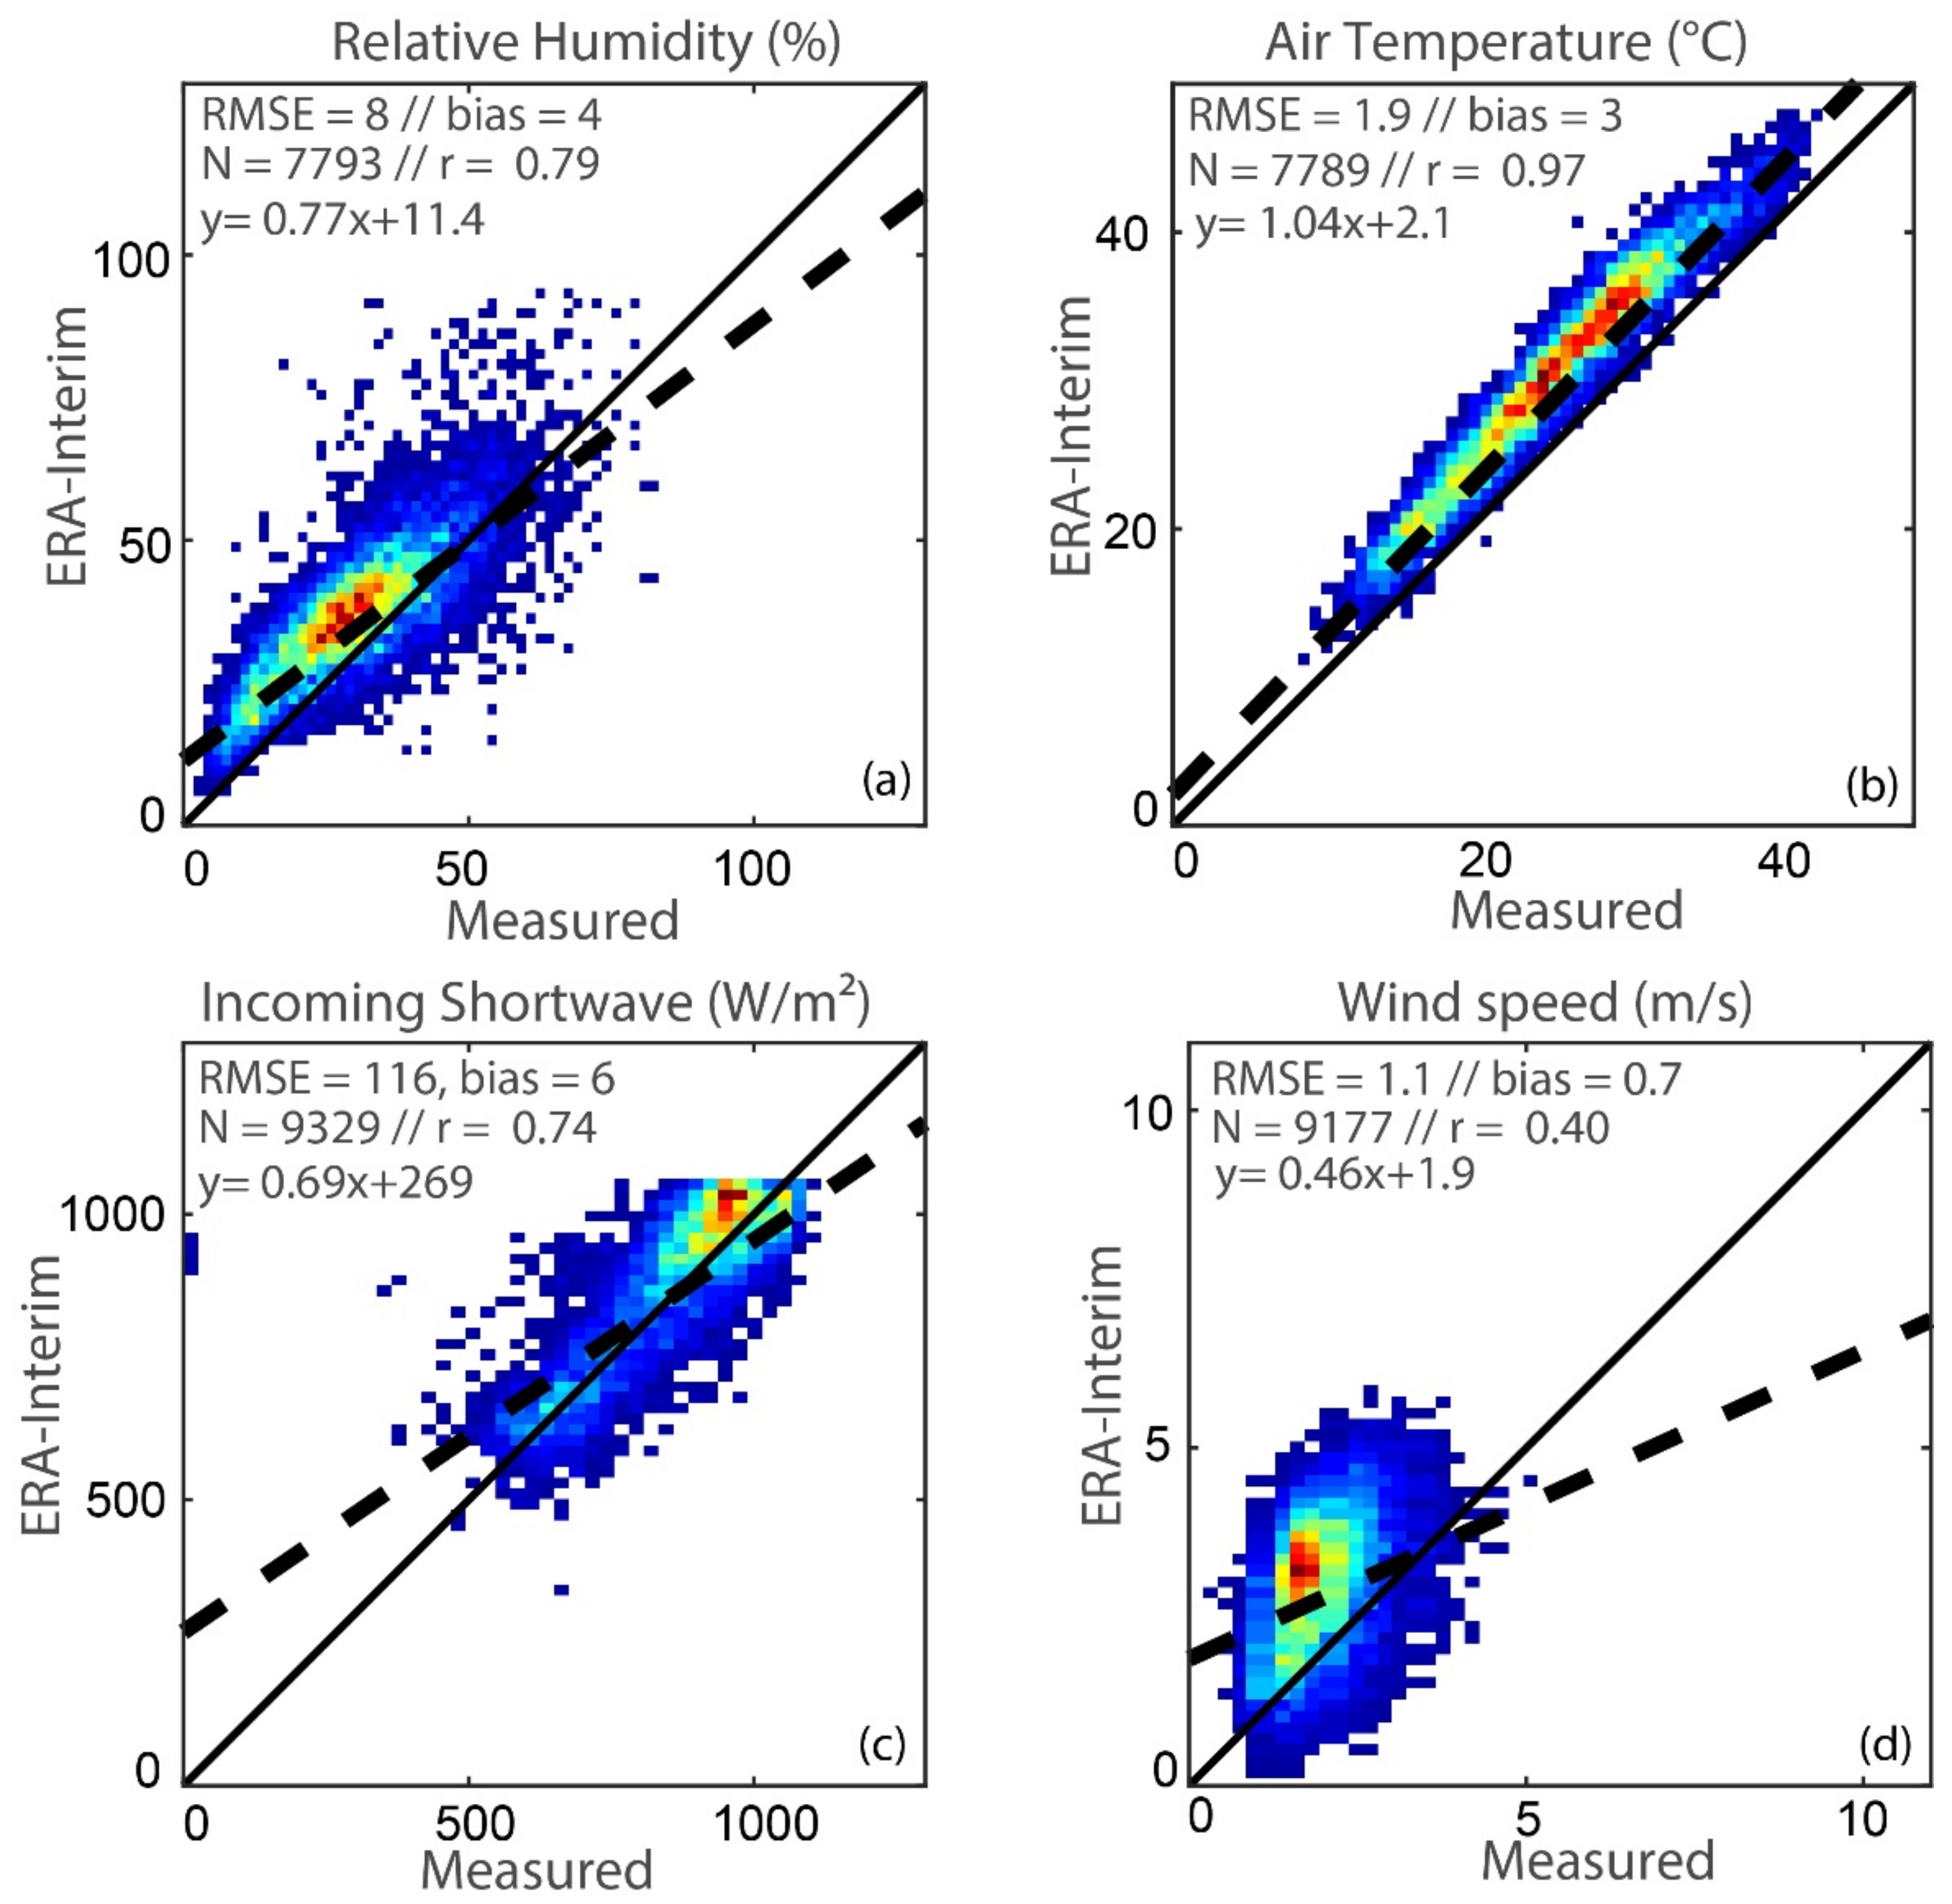
Table 2 reports the statistical metrics related to the comparison between ERA-Interim reanalysis data after disaggregation and meteorological stations data from the Tensift Observatory at the time of the Terra satellite overpass.
The wind speed was unsurprisingly the worst reproduced variable. Indeed, this is one of the meteorological variables, with rainfall, that is most difficult to be retrieved by the weather forecast and climate models, even if the models are driven by observations as for reanalysis systems, because of the strong influence of the local environment (i.e., presence of high vegetation, buildings, a marked orography, and possible advective flux). This difference between ERA-Interim wind speed and weather station data has already been reported by other authors as Liu et al. [85] and Srivastava et al. [86]. In our study, the coefficient of correlation was low (although significant at 99%), but the bias (0.7 m/s) was reasonable and demonstrated the added value of the correction of elevation applied. Indeed, the simplified representation of the orography by ERA-Interim at the 80 km resolution has been shown to be one of the main causes of discrepancy with local observations. Szczypta et al. [87], in particular, who evaluated the ERA-Interim meteorological variables in comparison to the SAFRAN reanalysis over France, highlighted a bias slightly higher (0.9 m/s) except for the mountainous regions.
Despite a relatively high RMSE with 116 W/m2 (Figure 3), the incoming radiation was also reasonably biased (+6 W/m2). This result is in agreement with the results of Szczypta et al. [87], who highlighted a bias of 10 W/m2 over France. By contrast, the relative humidity is in excellent agreement with the observations with low RMSE and bias.
Lastly, the air temperature dynamic, closely linked to that of the air humidity, was also correctly reproduced with r = 0.97 for all the stations (Table 2). Simmons et al. [88] also showed high levels of correlation (r > 0.94) between ERA-Interim and the CRU dataset for air temperature at the global scale [89]. Szczypta et al. [87] showed that ERA-Interim highlighted a lower diurnal amplitude over France with an overestimation at night (at 12:00 and 6:00 a.m. UTC) and an underestimation around midday. The positive bias of +3° highlighted here is closely linked to the underlying the network of meteorological station. Indeed, as the Tensift Observatory stations are used to compute the FAO-56 reference evapotranspiration [10], they are installed on irrigated fields with fully developed vegetation cover. This leads to observed temperatures cooler than the average values of the ERA-Interim grid point, which is mostly occupied by hotter areas of bare soils. Several points strengthen this hypothesis. First, this hot bias is as strong as the plant cover is dense. Indeed, on the site of Agafay, which is occupied by fully developed irrigated citrus while the surroundings are mainly bare soil, the bias was 5.2 °C, while it was only 2.4 °C for R3_2012, a station with a much more homogeneous surrounding mainly composed of wheat. Likewise, the Chichaoua station surrounded by bare soil also exhibited a hot bias (4 °C). For the relative humidity, biases were much more limited with a maximum value of +7% on Agdal, and it was reasonably estimated on mostly all stations. However, the errors raised in this study are in line with the literature [72,87,88,90] and remain acceptable.
As a conclusion, the quality of the ERA-Interim dataset compared to meteorological measurement is reasonable, although some discrepancies can be observed in specific conditions.

3.2. Energy Budget Component from TSEB

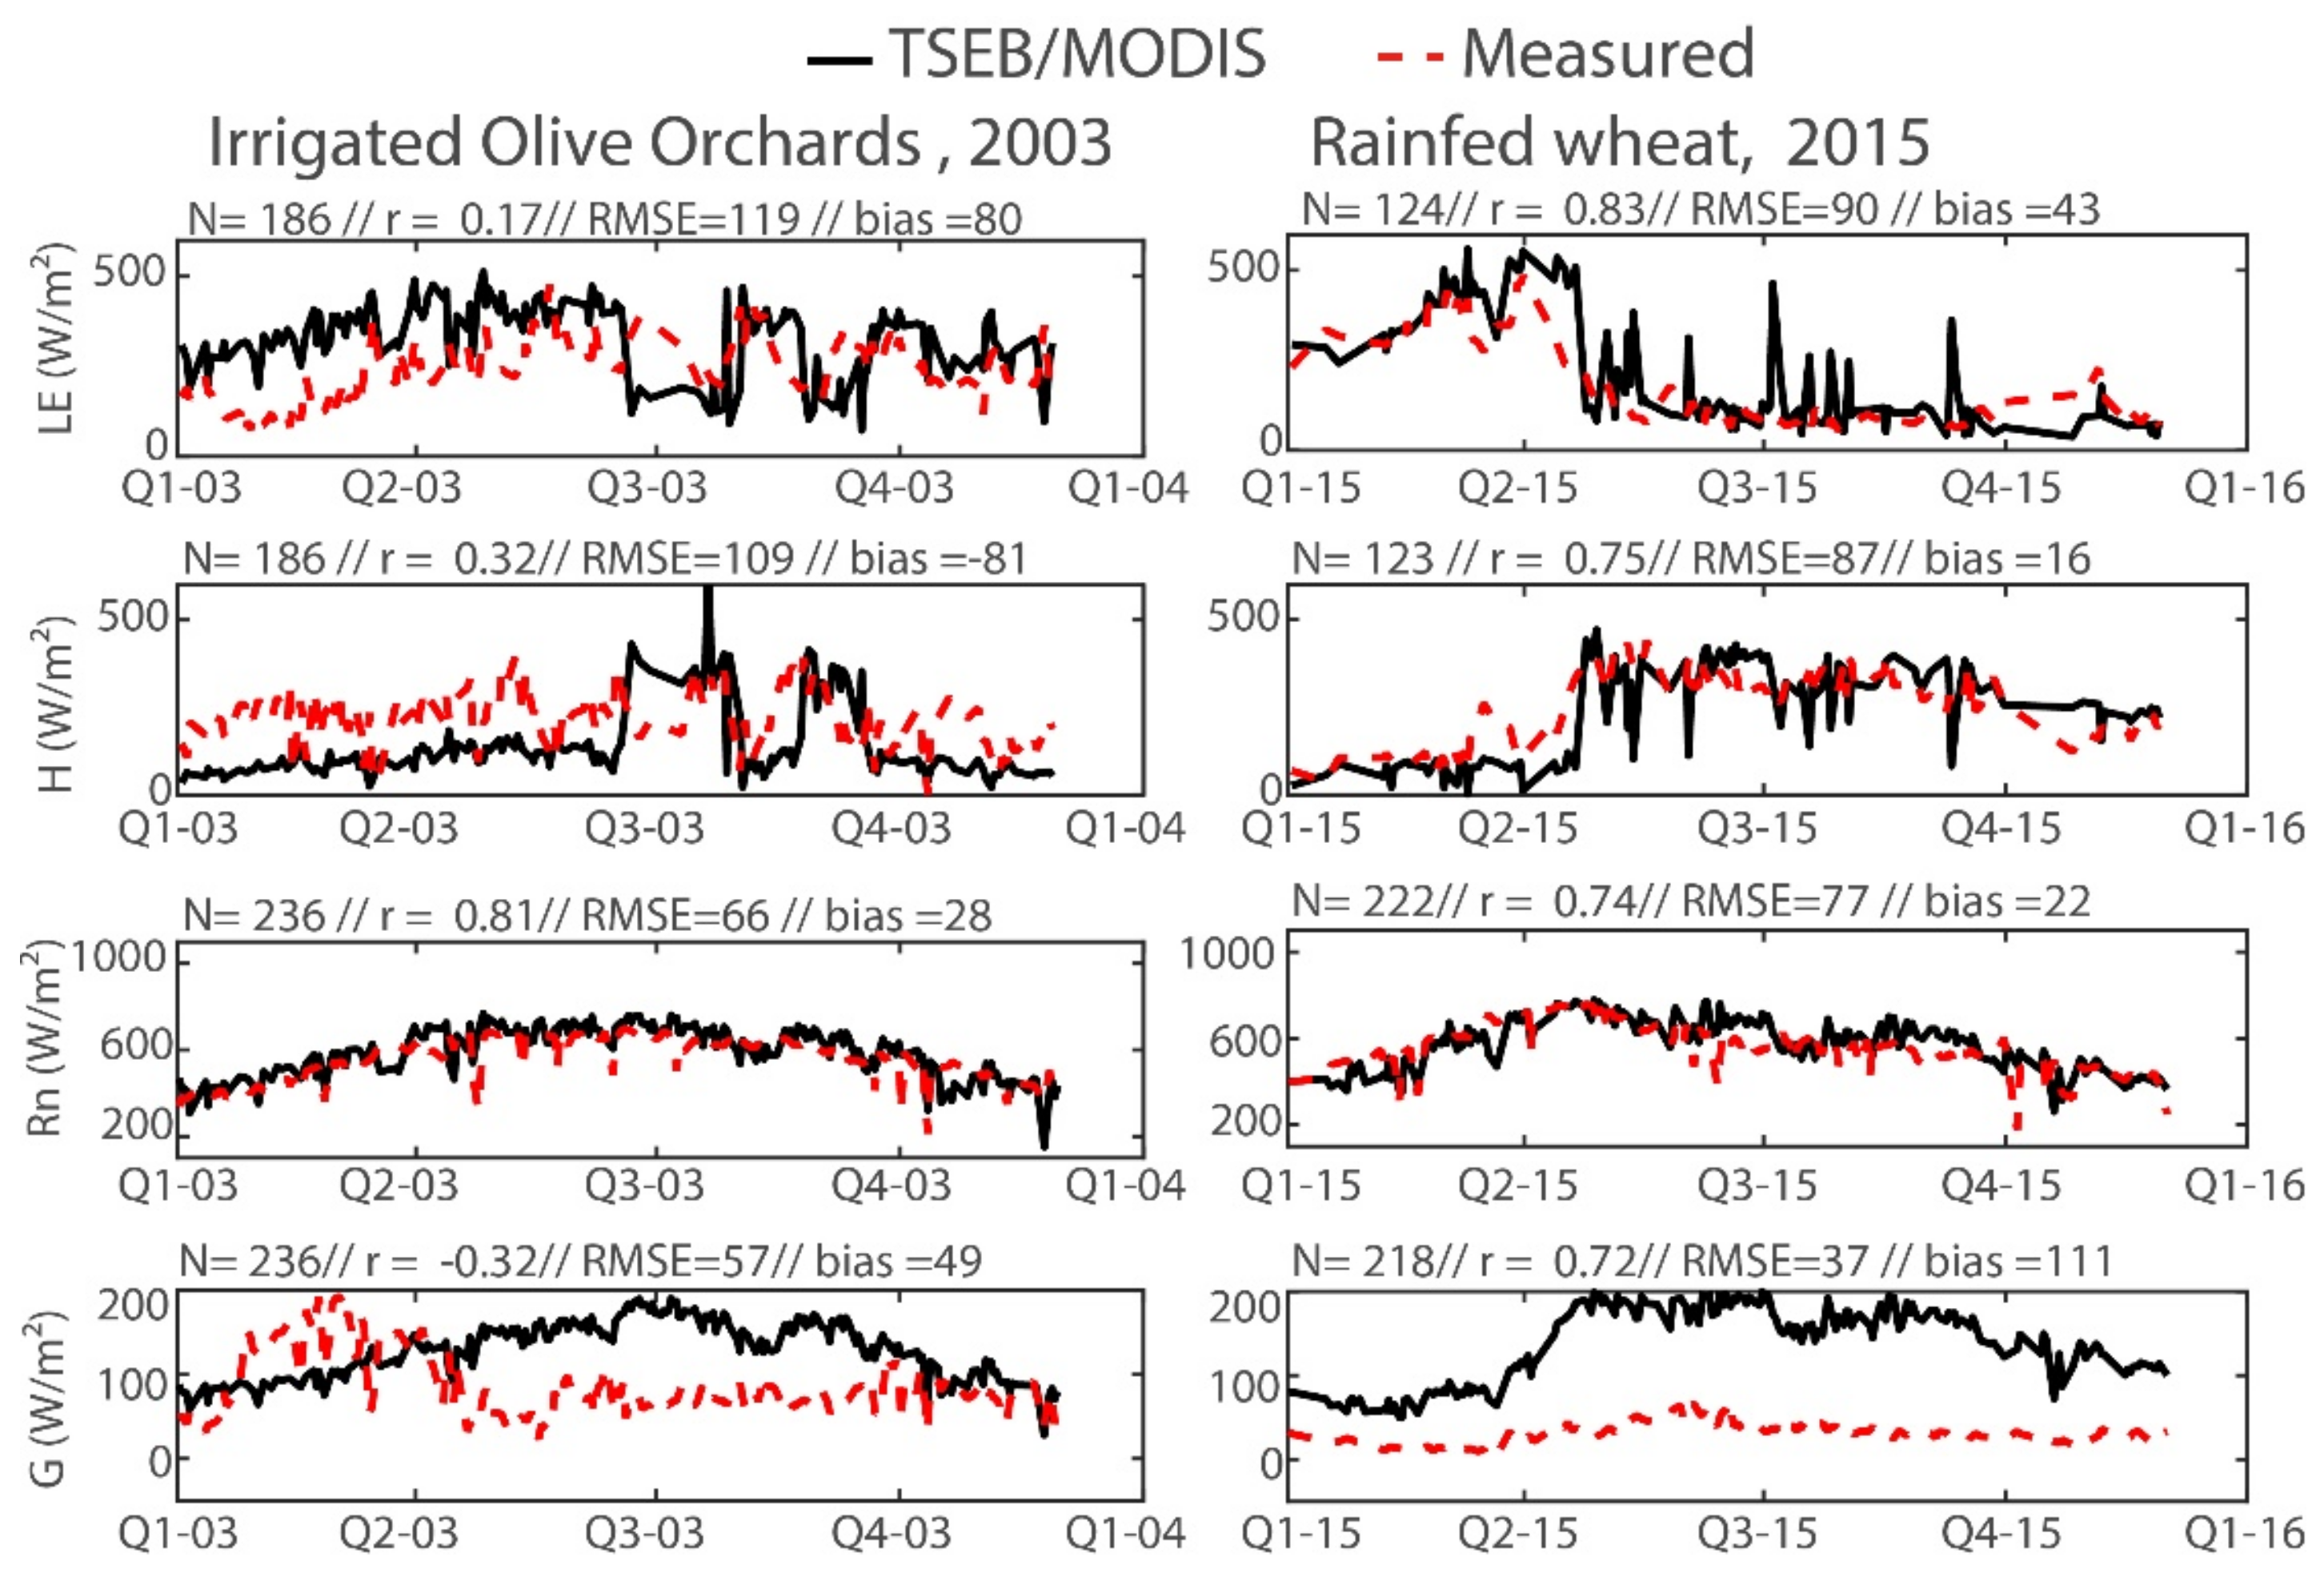
To estimate the quality of the predictions of TSEB forced by ERA-Interim and MODIS products, we evaluated the instantaneous energy components predicted by TSEB at the time of the satellite overpass in comparison to the EC measurements. Firstly, our focus was on the seasonal variation of the four components of the energy budget over two contrasted sites (Figure 4). These were an irrigated olive orchard in 2003 and a rainfed wheat in 2015.
On both sites, the seasonal cycle of Rn was very well reproduced with a coefficient r = 0.81 on olive and r = 0.74 on rainfed wheat, although a slight positive bias was observed on both sites. The conduction flux G, in contrast, was rather poorly simulated, especially on the olive orchard with almost no correlation. On the rainfed wheat site, despite a strong overestimation of TSEB with a bias of 111 W/m2, the correlation was quite good with r = 0.72. This can be explained by several reasons. In the TSEB model, G is directly related to the energy available at the ground level. The partition of this energy between the ground and the vegetation depends on the fraction of the vegetation cover and a divergence coefficient which is itself linked to the distribution of leaves and the clumping effect of the vegetation. Thus, differences can be significant, especially when the cover fraction is not representative of the surrounding conditions. Indeed, the MODIS NDVI has a resolution of 250 m. In addition, it should be stressed that the divergence coefficient assumption is not always verified, as discussed by Anderson et al. [91], especially over tree crop. Moreover, the soil heat flux is the most difficult variable of the energy budget to estimate. Several studies have pointed out the difficulty of comparing predicted G to point-scale measurements, especially in the study area, with row tree crops leading to contrasted illumination soil conditions [18,48,92].
The performance of the model in reproducing the partition of energy between sensible and latent heat fluxes was very consistent. This partition is strongly dependent on the surface water status, which was very variable from one site to another, between the irrigated perimeters where most experiments were carried out, and the surrounding dry soils. Between the two sites, the model performed better on the rainfed wheat site. The switch between latent and sensible heat fluxes at harvest time (between Q2 and Q3) was, in particular, rather well reproduced. On the olive orchards, we observed an overestimation of LE with a bias of 43 W/m2. The overestimation can be explained by the fact that LE is a residual term affected by errors in estimated Rn, G, and H. In addition, the raw EC data, which are known to underestimate LE fluxes by about 20% [14], were used without correction for the energy balance closure. The application of the Bowen ratio method would have certainly reduced this bias by increasing the observed fluxes by about 50 W/m2. Zhang et al. [30] reported errors of the same order of magnitude on the LE without using the energy balance closure. In contrast, the sensible heat flux was remarkably well simulated on rainfed wheat. This can be explained by the relative homogeneity of the site around the instrumented plot considering the difference in scale between the footprint of the eddy covariance (around 100 m), on one hand, and the size of the MODIS pixel (250 m) and a spatial representativity larger for ERA-Interim reanalysis even if disaggregation was applied for some variables, on the other hand. Indeed, the rainfed field is located within a rainy area covering about 1 km2, while the irrigated olive perimeter is surrounded by dry soils. Likewise, regarding the bias, choosing a lower value of the Priestley–Taylor coefficient could most certainly improve these results because it has been shown that the value of the Priestley–Taylor coefficient should be reduced under dry conditions from its nominal value of 1.26 to a value of 0.8 [44]. An encouraging result, however, is the energy shift observed in Q4 at the Agdal site in 2003. This site was affected by a strong water stress at this time of the year; a technical problem preventing irrigation. This switch between latent and sensible heat flux, although a little too strong compared to the observations, was well observed by the TSEB model. These different points allow us to confirm that the TSEB model can follow the phenology of crops as already mentioned by Chirouze et al. [93], Diarra et al. [18], and Zhang et al. [30].
Considering the good performance of TSEB over the rainfed site, we benchmarked the four components of the energy balance over the period 2001–2015 on all wheat sites (Figure 5). Results evidence large discrepancies between modeled and observed components, but reasonable statistics were found on average, with a particularly good reproduction of the available energy with a correlation coefficient r = 0.72 and a very slight positive bias of 3 W/m2. The G-flux was always the least well reproduced. We also always observed an overestimation of the latent heat flux with a positive bias of 37 W/m2 and an underestimation of the sensible heat flux with a negative bias of –34 W/m2. This is a well-known drawback. As mentioned above, a large part of this difference can be explained by the significant scale mismatch between the EC footprint (on the order of 100 m) and the TSEB predictions. Nevertheless, as reported by Castelli et al. [94], a sensitivity analysis performed on TSEB demonstrated that additional sources of error may be related to inaccuracies in remote sensing and meteorological input data.

3.2.1. Comparison to the Water Inputs + Precipitation

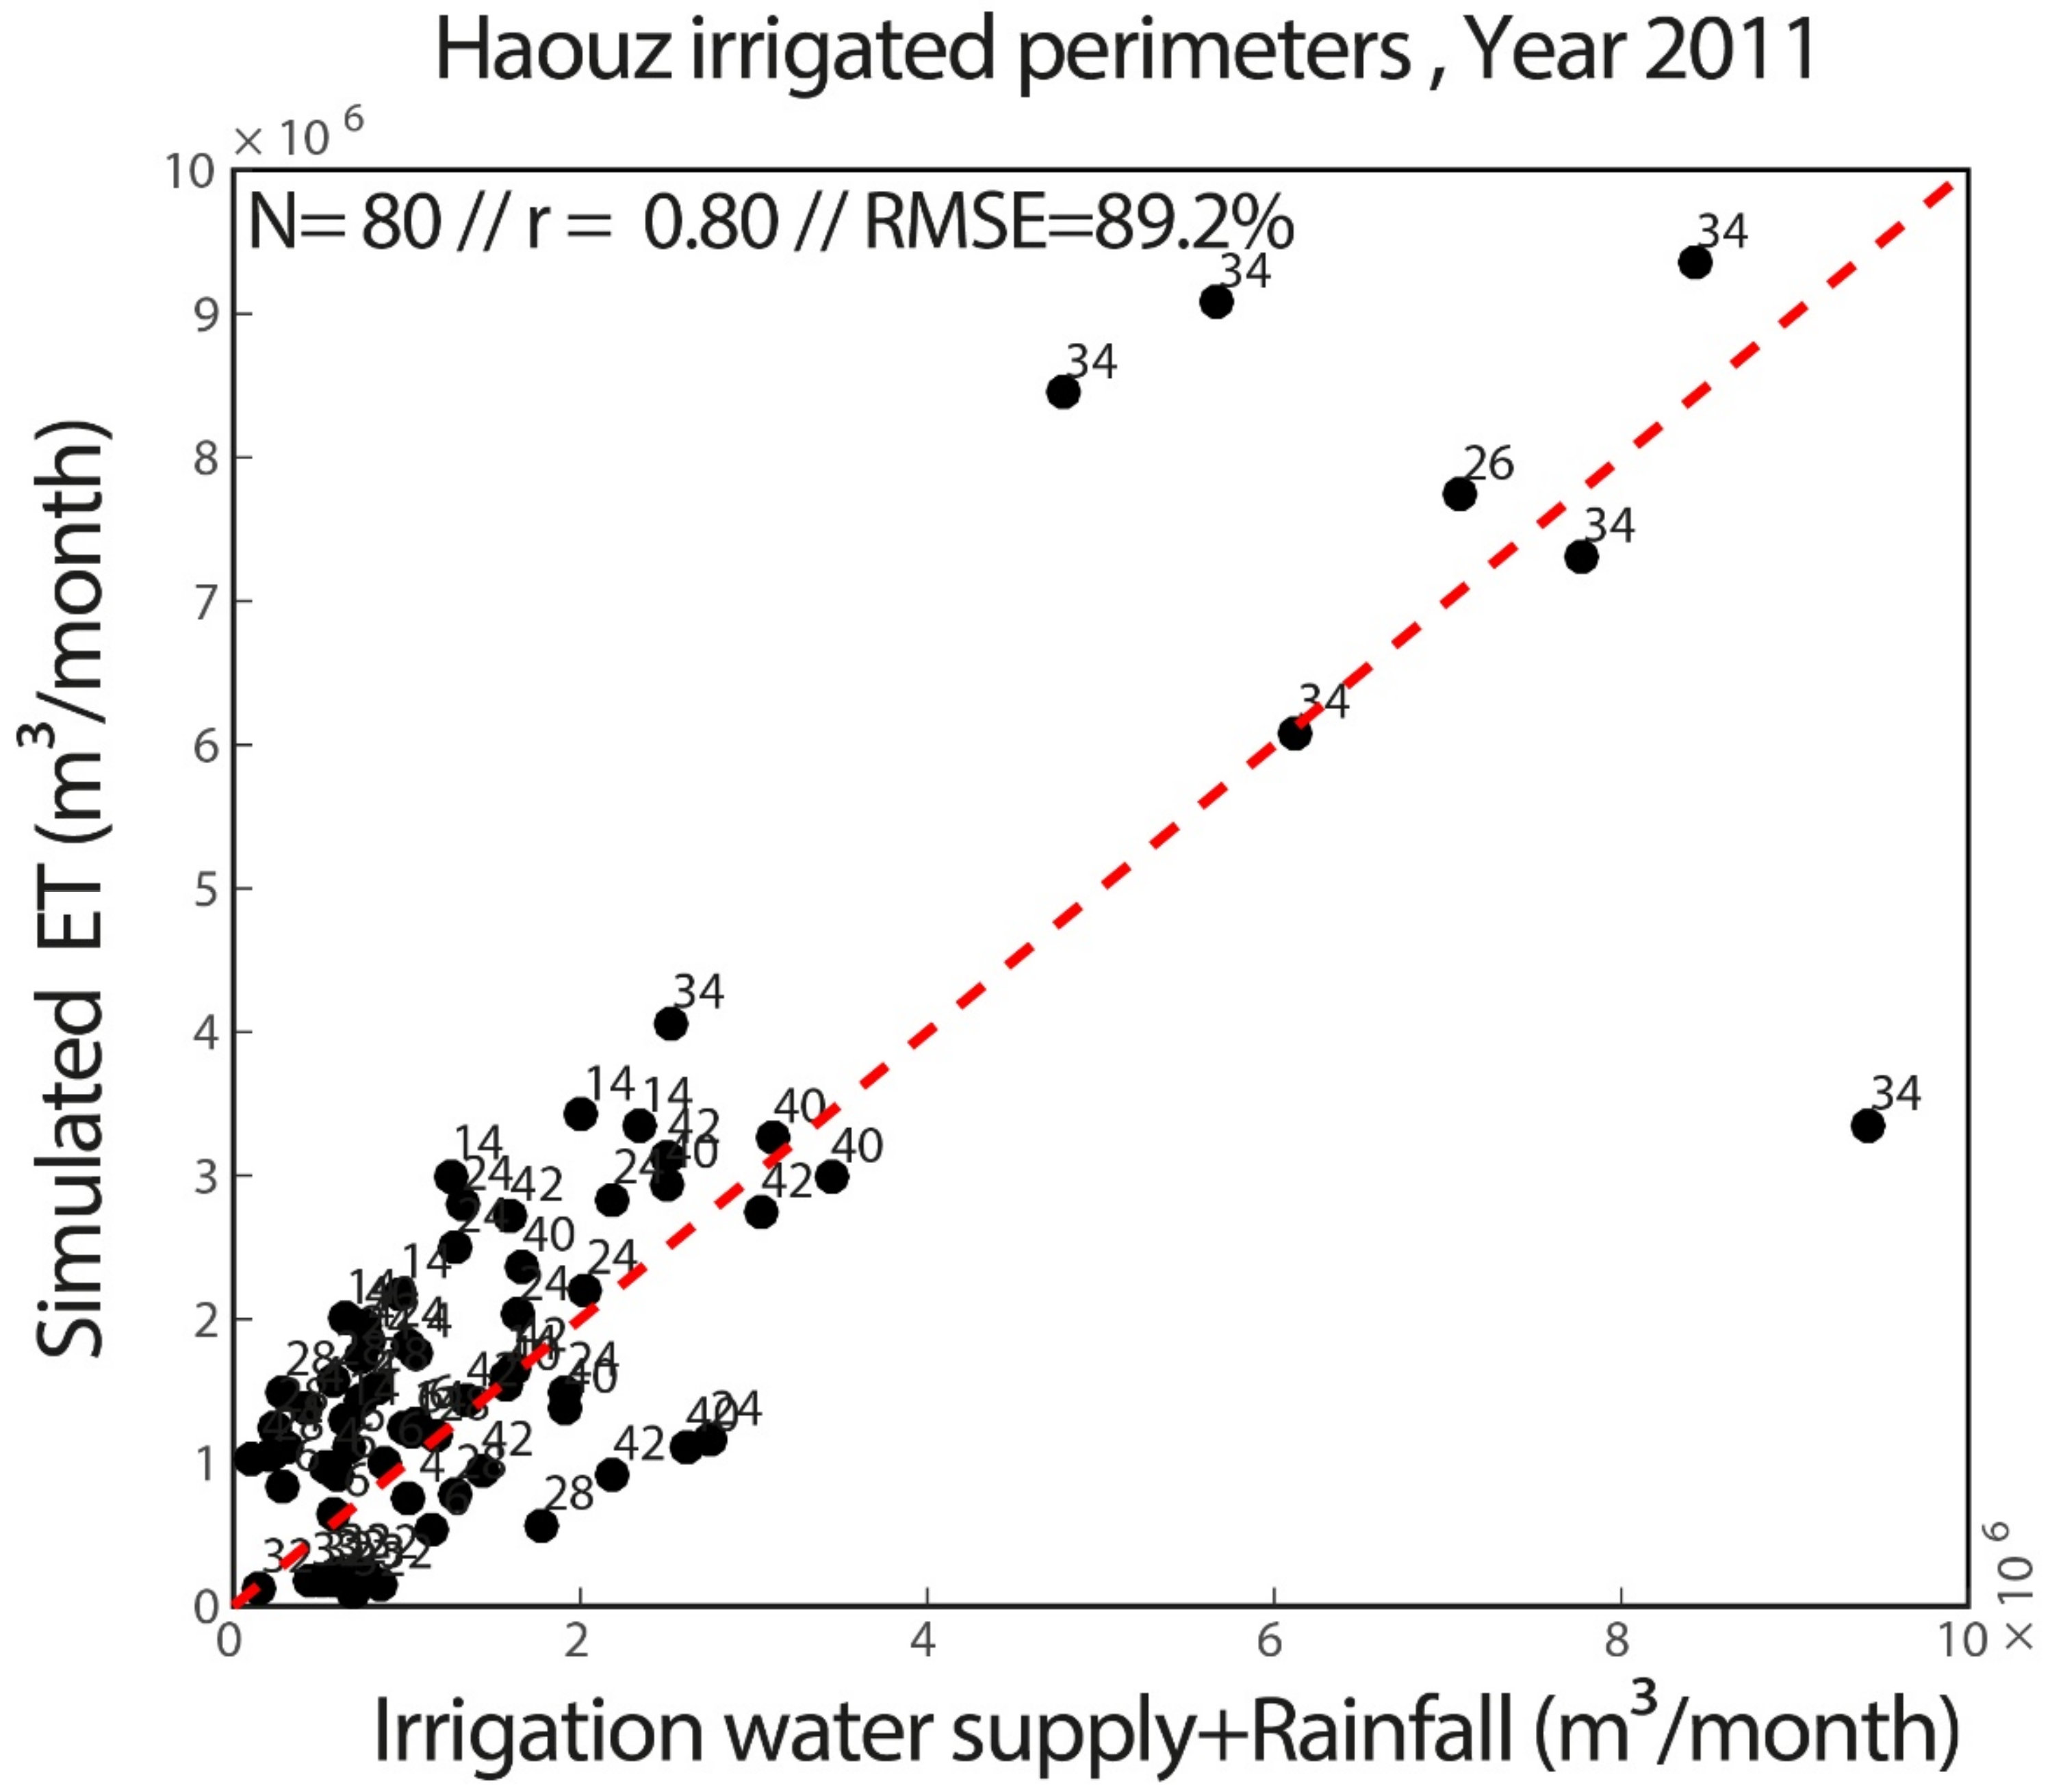
Cumulated CRU precipitation + irrigation water amounts were compared to monthly evapotranspiration estimates for some irrigated perimeters of the Tensift watershed. The monthly evapotranspiration was obtained from the extrapolation of instantaneous estimates at the time of the satellite overpass to daily values converted to mm/day. Table 3 lists the statistics per perimeter and the total statistics for year 2011.
Figure 6 represents the comparison of the monthly ET cumulated at the perimeter scale and the monthly water supply composed of irrigation + CRU rainfall throughout all perimeters during the year 2011. It emerges from the analysis of these results that if the dynamics were correctly reproduced, and a systematic overestimation was highlighted, indicating that ET was higher than the water supply. This systematic overestimation of 60% on average for all irrigated perimeters is further discussed in Section 4.
Another striking result is the good performance of our approach when mapping ET to match water supply for the irrigated perimeters dominated by cereal crops such as the Z1 or R3 perimeter. This result is of course not new because the TSEB model has shown good performance on wheat (see the study case in this manuscript, together with [18,95] among others). Of course, clustering effects affect TSEB performance in areas dominated by tree crop production. The coefficients of correlation are on the same order of magnitude as those obtained by Saadi et al. [3], who led a similar study on a Tunisian irrigated perimeter but using the FAO-56 double crop coefficient approach. The scatter plot of Figure 6 shows a remarkable agreement, but the gaps seem to be more important for large perimeters such as the RG or H2 perimeter. In general, the RMSE appears to be high, but this is largely attributed to the positive bias, as already mentioned. The coefficient of correlation is greatly satisfactory. These initial and very encouraging results were confirmed by investigations in Nassah et al. [96]. However, they deserve to be expanded over the years and analyzed much more finely in collaboration with our management partners regarding the dominant types of crops and known seeding densities.

3.2.2. Comparison to Grain Yield

The evapotranspiration is closely related to crop growth and production, as shown by Semmens et al. [97] for vineyards or Abtew and Melessa [98] and Melesse and Nangia [99] for wheat, among others. This tight linkage is also the basic principle of the Aquacrop model to predict above ground biomass and grain yields [100]. In order to analyze the interannual variability of the ET maps, Figure 7 shows the annual cereal production over the Marrakech agricultural province and the timeseries of calculated ET anomalies over the cereal growth period cumulated from January to April in mm/day over the 2001–2011 period.
With a coefficient of correlation r = 0.92, this work shows that the interannual variability of ET integrated over the wheat season is in close agreement with the yield statistics. In particular, the stronger anomalies of cereal production match the stronger anomalies of cumulated ET such as the below-normal season 2007–2008 and the above-normal conditions in 2008–2009 further analyzed in Section 3.3.2. A narrow link exists between evapotranspiration and the water consumed by plants to produce and maintain their raw material and the production in grain. This close relationship has been studied and confirmed by several authors in our study site [60,63,101]. Significant correlations were also highlighted with yields and productions of three cereals taken separately (not shown).

3.3. Spatial Variability of Evapotranspiration

3.3.1. Climatology

On the basis of this performance assessment, we mapped the ET over the entire Tensift watershed, over the period 2001–2015. The instantaneous values at the time of the satellite overpass were aggregated to the daily scale. The daily values were then averaged monthly.
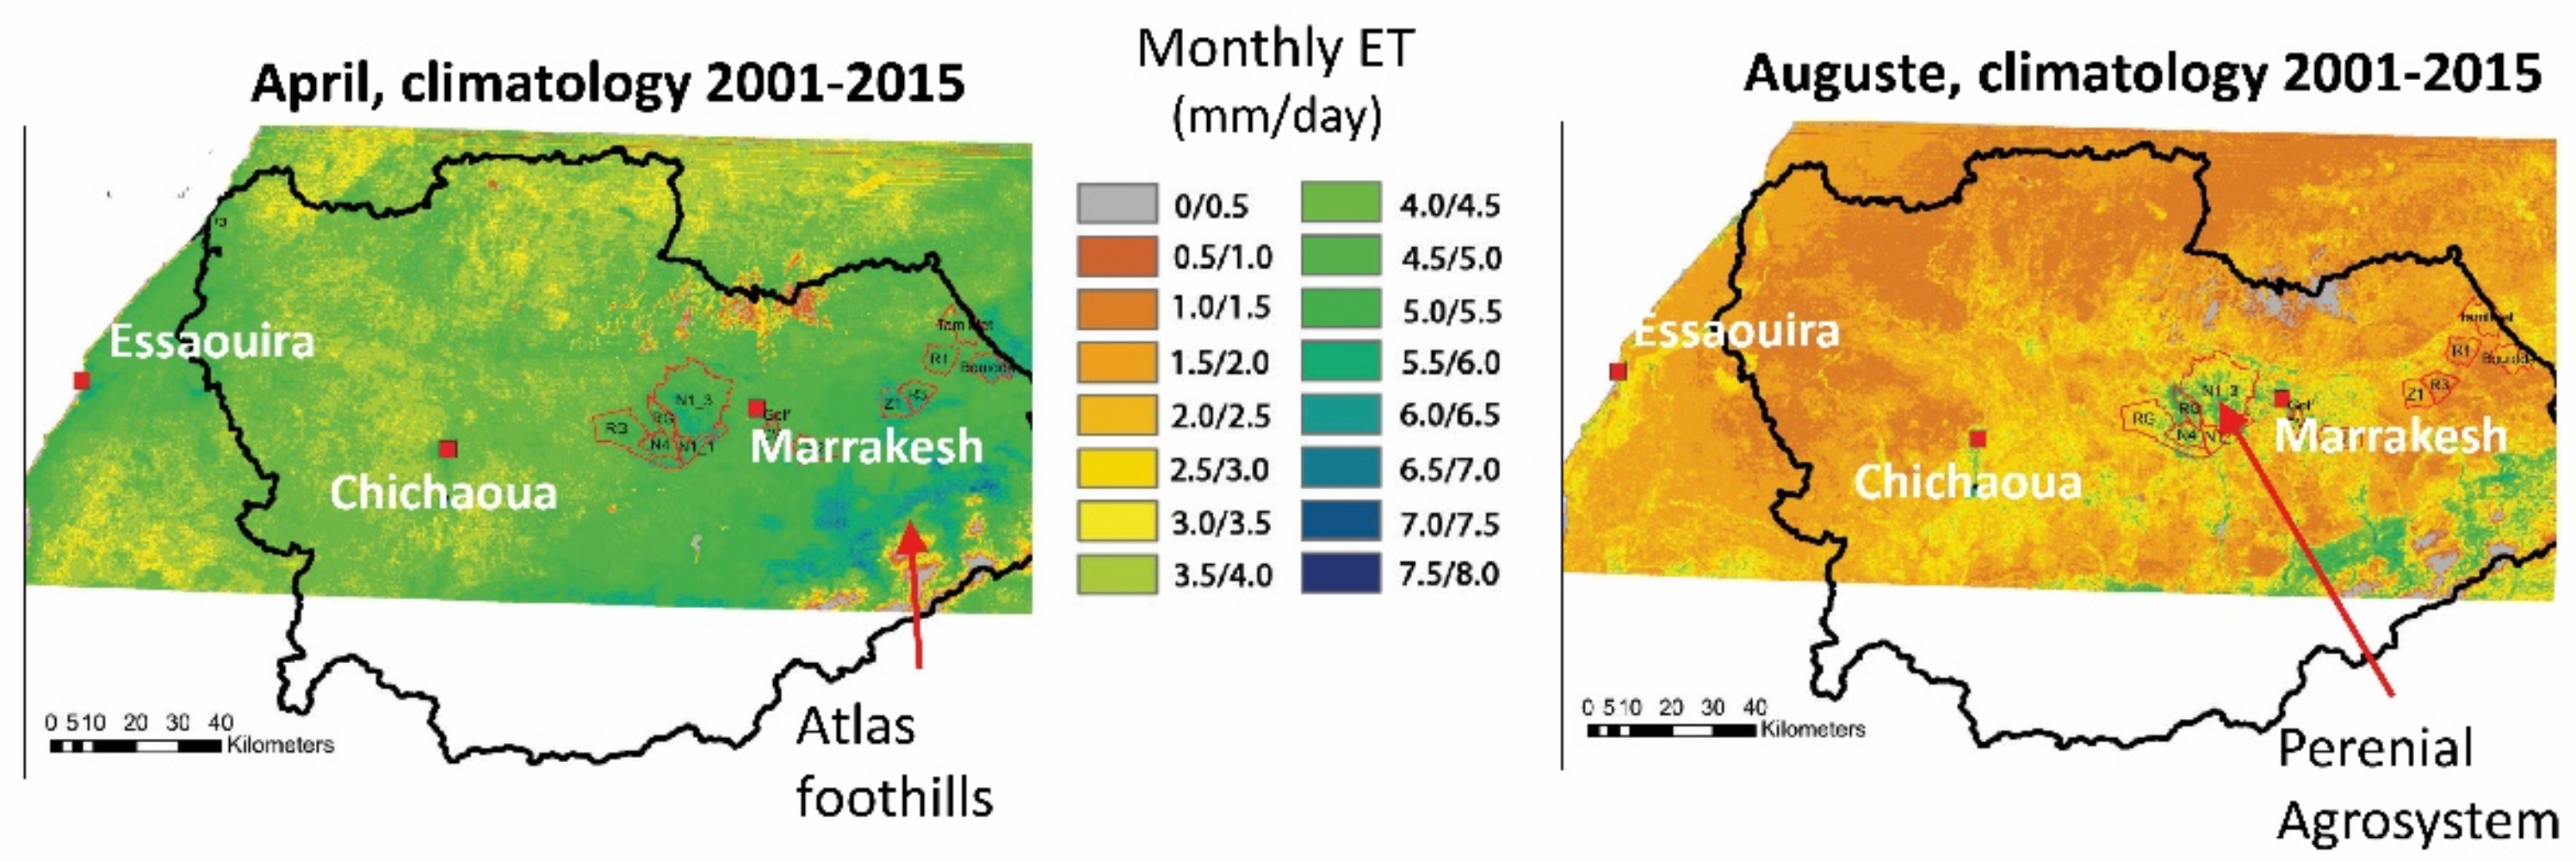
Figure 8 shows the monthly climatology of simulated evapotranspiration on the Tensift (2001–2015) watershed during April and August; April represents the peak of plant development for the annuals including the wheat, while August is the driest month during which only the irrigated tree crops are green.
Observed spatial variability perfectly fits what we know of the hydrological functioning of the region. The most watered oceanic coasts show significantly higher values of evapotranspiration than the inland region. Likewise, foothills of the Atlas in the southeast part of the Tensift receive higher rainfall than the plain areas, and irrigation can be applied throughout the year by deriving the water of nearby ouadi, which also exhibited higher evapotranspiration throughout the year, as reported by Elfarkh et al. [47] and Ouassanouan et al. [102]. The region on both sides of Marrakech which groups many of the irrigated perimeters and presents high values of evapotranspiration thanks to irrigation. Lastly, for the central region of Tensift, around the city of Chichaoua, which is much less watered than Marrakech, evapotranspiration is much lower. The temporal variability also agrees well with the climate of the region, where most rainfall is concentrated in the winter months. Annual ET is correlated to this cycle, with significant evapotranspiration values in winter spring corresponding to the annual development peak of crops such as wheat and many other crops in the region, as reported by Kharrou [103] and Diarra et al. [18]. The pattern located at the center of the maps, which presents highly persistent evapotranspiration in August, corresponds to irrigated tree crops which are very present over this irrigated perimeter.

3.3.2. Interannual Variability of Evapotranspiration

These monthly ET maps allow us to calculate monthly anomalies of ET over the Tensift watershed. Figure 9 shows the anomalies for two contrasted years during February 2009 and March 2012. The 2008–2009 agricultural campaign was marked by very high rainfall at the start of the season in November all around Morocco, and numerous deadly floods affected the north of the country. Favorable conditions for the crops persisted during the season with above-normal rainfall regularly distributed. The cereal production was exceptional with more than 100 million quintals, a record for Morocco (Economic Services of the Ministry of Agriculture in Morocco: https://www.agriculture.gov.ma/, accessed on 31 July 2021).
These favorable conditions were well reproduced on the anomaly maps of February 2009, with values reaching 1.5 mm/day. The most important anomalies are observed in rainfed zones (the west of Marrakech) where the farmers practice opportunist agriculture according to the distribution of rains in the beginning of season. In November, heavy rainfall extensively encouraged the farmers to sow, and the development was regular afterward thanks to the good hydric conditions. This above-normal ET in the rainfed areas persisted up to the peak of development (at the end of March). It was a little less spectacular in the irrigated zones where the contributions of water are guaranteed well enough, even during the loss-making years. By contrast, year 2012 was marked by a deficit of precipitation in spring. Following rather neutral conditions in January, the hydric deficit becomes more marked in reaching its maximum at the time of the peak of development, which often coincides with the phenological filling stage of the grains, during which hydric and thermal stress must be avoided. These strong anomalies at this key stage of the development of the wheat very certainly penalized the production, because it was very low for the 2011–2012 campaign (Economic Services of the Ministry of Agriculture in Morocco: https://www.agriculture.gov.ma/, accessed on 31 July 2022).

3.3.3. Detection of New Irrigated Area

The irrigated zones developed considerably during the last decades mainly because of easy access to underground water, aggravated by periods of recurring droughts, which led to an extension of the amount of drilling in the southern part of the Mediterranean [104]. Especially in the northern zone of Marrakech, we observed a change in the landscape with the appearance of private farms exclusively based on extensive tree crops irrigated through groundwater pumping. The location and the maps of these new irrigated zones are essential information for the study of the watershed hydrological functioning, as well as for the local managers of the water resource. Nevertheless, the maps of irrigated zones resulting from international organizations such as MIRCA2000 [105] or the world map of irrigated zones [106] do not report the fast dynamics of changes in irrigated zones, and they provide coarse-scale information, which limits their utility. Several studies have already mentioned the potential of using ET maps to analyze the evolution of agricultural areas [107] and oases [108].
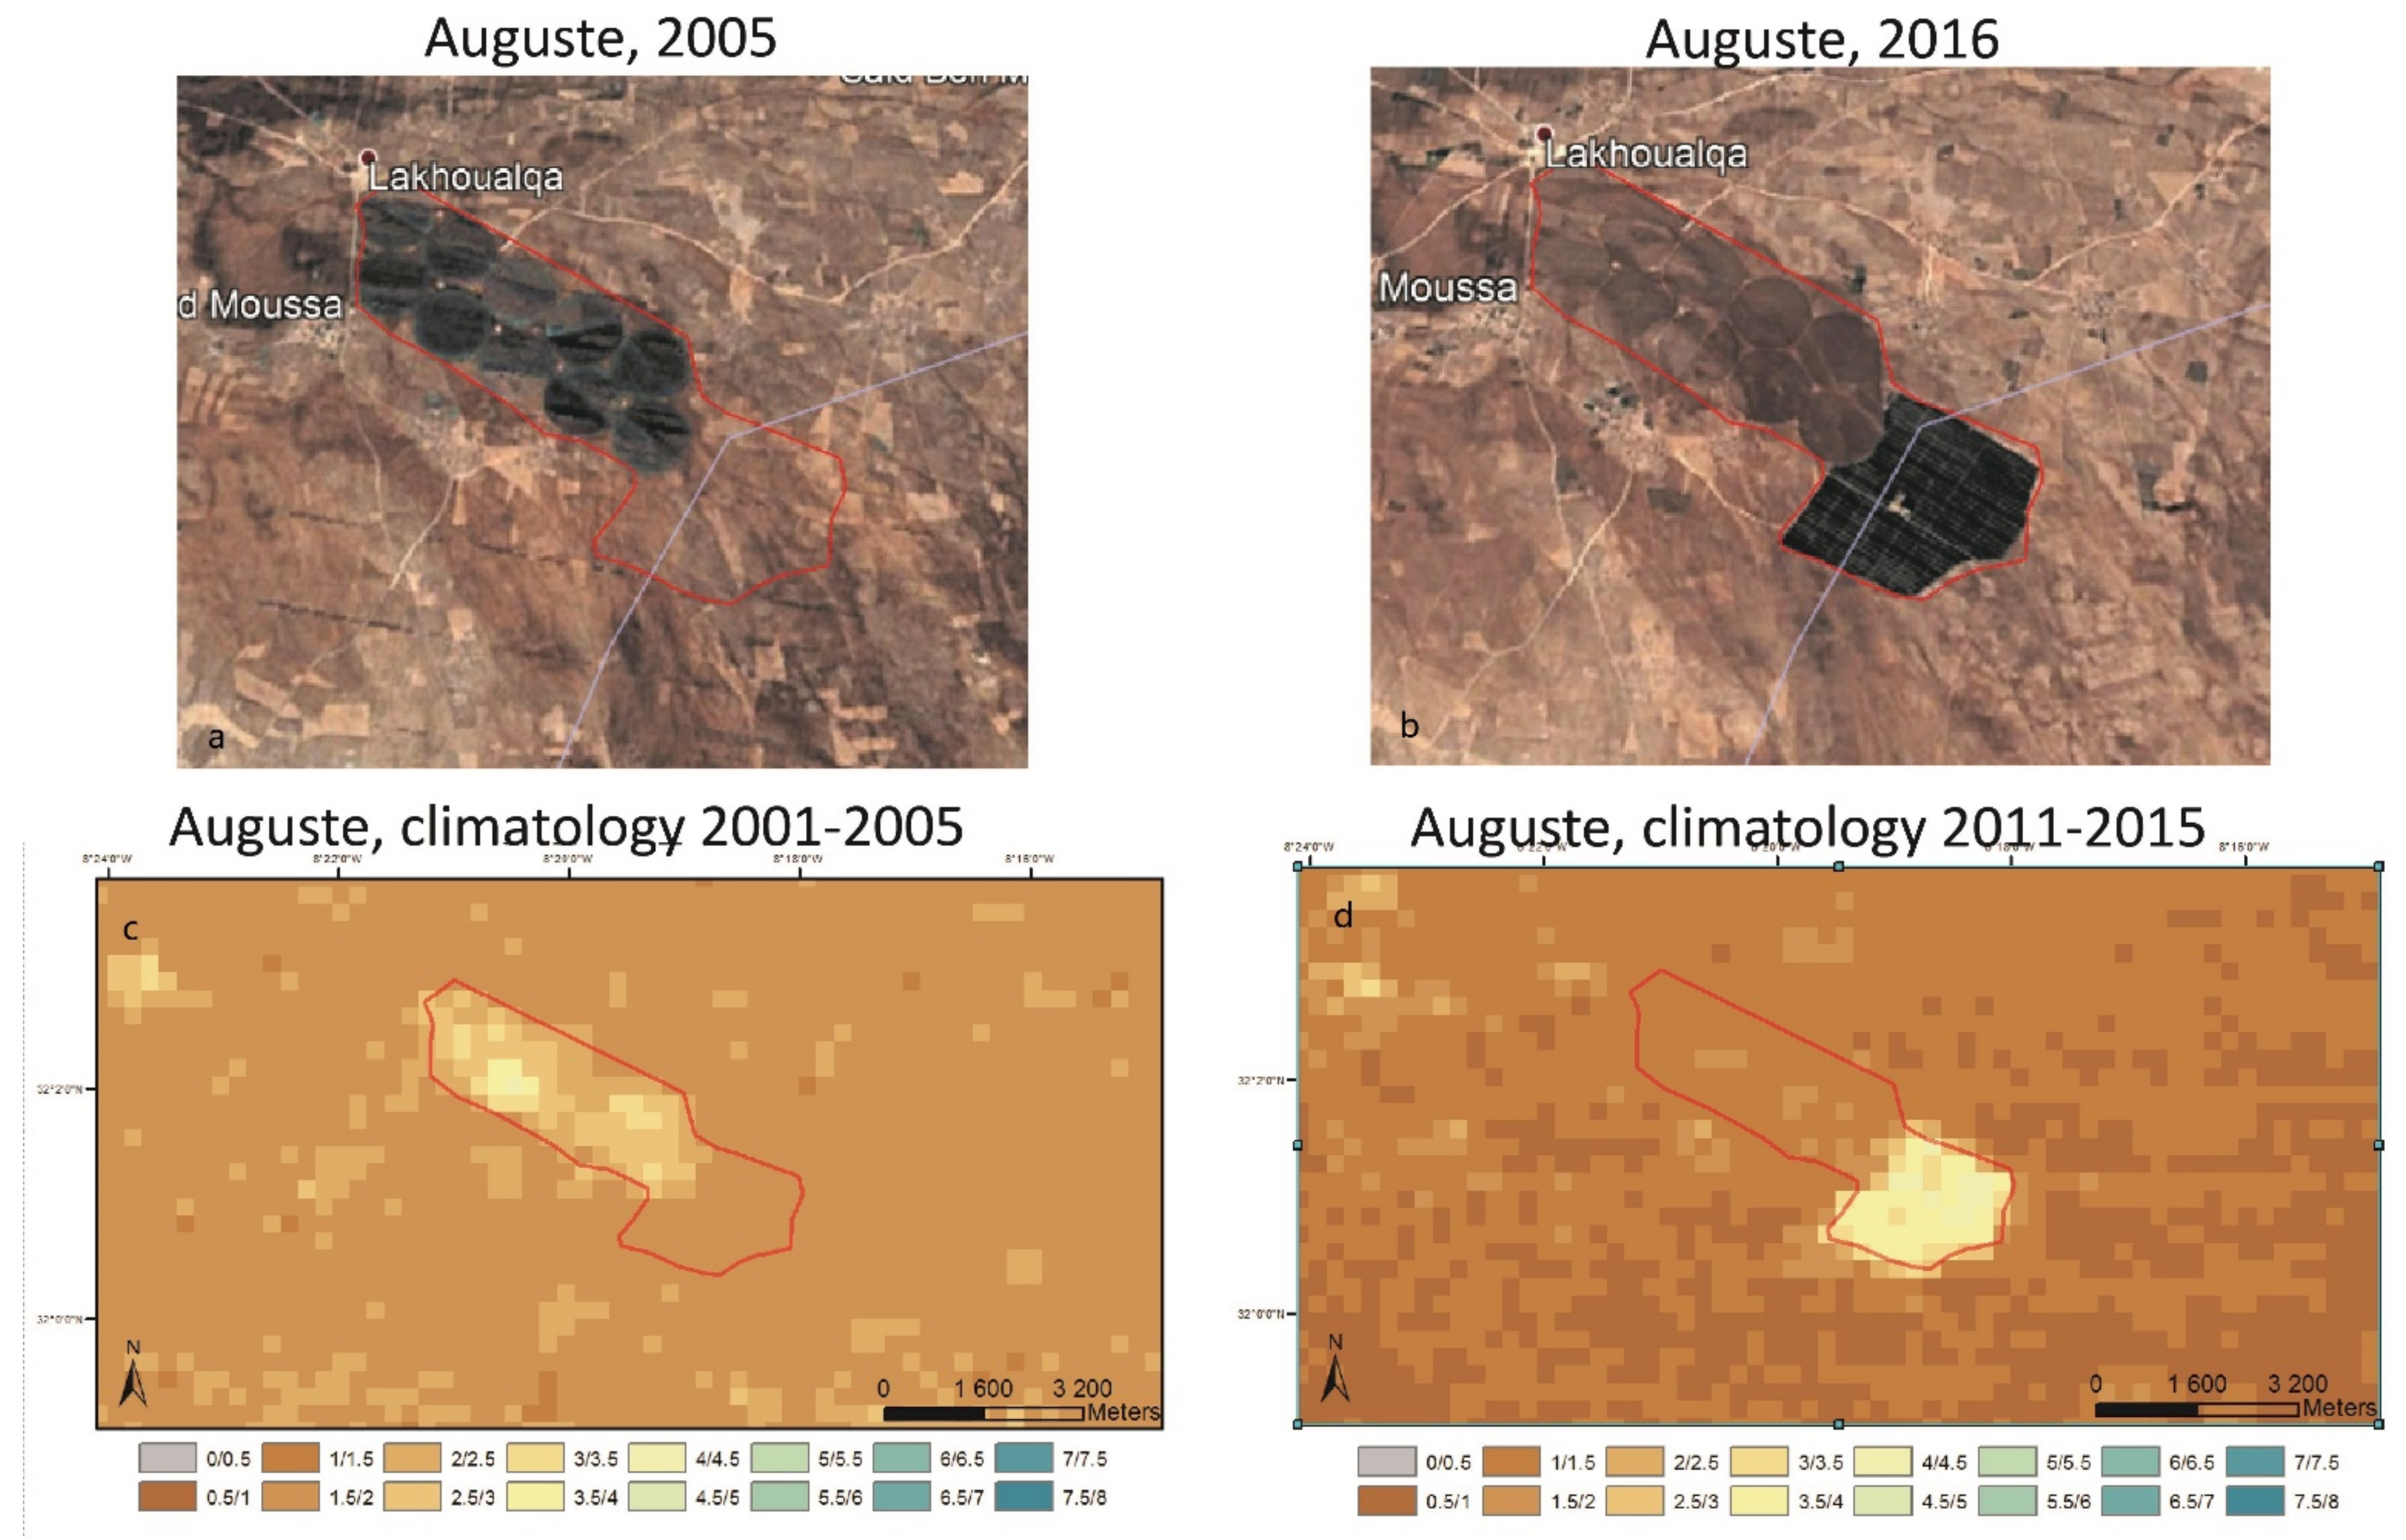
Our daily regional mapping of ET could allow strengthening these systems of irrigated zone mapping by bringing further information to the existing tools mostly based on spectral indices such as the NDVI. Figure 10 compares a Google Earth© image targeting a farm near Laknoualga village (northeast of Marrakech city) in August 2005 and in August 2015 with the corresponding maps of evapotranspiration (climatology of August for the periods 2001–2005 and 2011–2015). In the early 2000s, this farm was equipped with pivots, most probably exploited for the irrigation of cereal crops. At the beginning of 2010 and with the Green Morocco Plan (GMP), for Moroccan agriculture that was fostered through incentive funding with conversion to drip irrigation as the main driver, the southeast region of the area was replaced by citrus crop characterized by much higher water needs than more traditional wheat crop [102]. The maps of evapotranspiration allow not only detecting the changes in land use but also quantifying the changes in water consumption, as the average daily consumption in August increased from 2.5–3 to 4–4.5 mm/day.

4. Discussion

As demonstrated by several sensitivity analysis studies [18,19], meteorological variables including air temperature and wind speed are key inputs of the TSEB model. The new ERA5 [109] and ERA-land reanalysis [110] recently released, as well as the general ongoing improvement of reanalysis datasets, open perspectives for more accurate ET mapping. Indeed, they present a better spatio-temporal resolution (31 km vs. 80 km) leading to significant improvements in the representation of the land surface variables (LSVs) linked to the terrestrial water cycle such us turbulent fluxes [22].
Lastly, this work could be of interest for some important finalized issues. Considering the importance of the production of wheat for the Moroccan economy, it is important for decision makers to be able to have precise information on the production of wheat early in the season to anticipate importation needs and to take up their position on markets [59]. The methodological developments for agricultural yield seasonal forecast follow two main approaches: (1) empirical models relating the yields to environmental indicators (temperature, precipitation, and vegetation index), and (2) crop models fed by the seasonal climatic forecast [111,112]. The latter tools nevertheless suffer from (1) the high demand of input data in the models [112], (2) the uncertainties about the seasonal climatic forecasts [113], and (3) the disparity of the spatial and temporal scales between the climatic forecasts and the expectations of model growth [114]. The limitations evoked above have led most countries to adopt the empirical approach. Most of these studies are based on a series of local predictors such as temperature, rainfall, or information about the crop cover activity through vegetation indices measured from space. Balaghi et al. [59] demonstrated over Morocco that good-quality forecasted yields can be obtained approximately 1 month before harvest. Nevertheless, these approaches, in the south of the Mediterranean area, suffer from a low density of the meteorological network. This work illustrates the potential of evapotranspiration estimates for the early forecast of cereal yields. These daily maps could, for instance, be integrated into key crop phenological stages to develop key predictors closer to the physiological functioning of plants than traditional vegetation indices in order to strengthen early warning systems in the region such as the MEDI system (Mediterranean Drought Index) developed by CESBIO (http://osr-cesbio.ups-tlse.fr/medi/, accessed on 31 July 2022 [115]).
Considering the growing number of farms relying on groundwater pumping in the whole mediterranean region, the daily estimates of ET on a continuous basis provided within this study could be an important information for water managers to quantify groundwater pumping that is largely unknown by lack of accurate drill inventory as most of them are dig outside any legal framework.
In addition, considering the 1 km scale of ET estimates provided in this study, focus was put on the water management at the catchment scale as basin hydraulic agency doesn’t need fine information at the field scale. By contrast, another important application of evapotranspiration maps could be irrigation scheduling. Such application is limited considering the sensors acquiring LST into orbit nowadays that provides either data at coarse scale such as MODIS or with a low revisit time such as LANDSAT. Nevertheless, several thermal infrared missions are currently under preparation including TRISHNA and LSTM that will provide both high spatial resolution and revisit time (about 50m and 3 days for TRISHNA). This will open perspective for the application of “energy budget” approaches such as the one presented in this study to irrigation scheduling at the field scale on a day-to-day basis as an alternative of the traditional “water budget” approach based on the FAO-56 method usually used to this objective. Further steps would be to mix both approaches through data assimilation of snapshot estimate of ET into the FAO-56 model.

5. Conclusions

In this study, we presented a method that allows for daily, spatially distributed, and contiguous estimates of ET. On the basis of the results of Diarra et al. [18], which showed the good performances of the TSEB model in reproducing the energy budget components on the cereal crops in the south of the Mediterranean area, we developed a prototype for the regional cartography of evapotranspiration only based on MODIS and ERA-Interim reanalysis products. These data are freely distributed and are, thus, accessible to all: farmers, watershed managers, and policymakers. This system was directly compared to the Tensift observatory flux tower data (acquired since 2002 on the main crops of the region) and indirectly compared to consumer water on the irrigated surface, provided by the Haouz plain agricultural office (ORMVAH), as well as yields statistics. The main conclusions are as follows:
(a)
Despite some differences, particularly a positive bias on the air temperature, the ERA-Interim meteorological data constitutes a true solution of forcing of the models compared to the stations of measurements for the areas where meteorological station networks are scarce.
(b)
TSEB, forced by a low-resolution remote sensing dataset, can reproduce four components of the energy budget reasonably well. Rn is correctly reproduced (r = 0.63 and RMSE = 73 W/m2), while the partition between sensible and latent heat seems very difficult to evaluate given the scale mismatch between the "satellite" predictions and the eddy correlation footprint. Nevertheless, the main trends of the latent heat fluxes seem to be properly reproduced, including the switch of energy occurring after harvest or the occurrence of a stress period.
(c)
For monthly water consumption of irrigated crops, the approach presents a strong overestimation (almost a factor of 2) compared to the water supply (equal to the irrigation water amounts provided by ORMVAH, the office in charge of the agricultural water in the region plus rainfall from an independent dataset). The first explanation is linked to the trend over the last few years of uncontrolled drilling that has affected the region. Farmers are supplementing ORMVAH water supplies with their own wells in order to secure the harvest, regardless of the crop's actual needs. A similar result was shown in Tunisia by Saadi et al. [3].
(d)
Daily mapping allows for anomaly analysis of intra- and interannual climate variability at the watershed scale. This allows understanding the distribution of cultivation practices.
(e)
This simple tool provides information, supported by yield data, to better understand the variability of grain production. This is information of the highest importance in the current climatic context and also provides a simple approach to detect new irrigated areas.
This modeling framework that does not rely on any in situ data also has potential for application to similar agricultural regions over North Africa, which would facilitate regional water budget assessments, drought monitoring, and other hydrologic research and applications such as identifying the areas where irrigation water management is better conducted than in their poorly efficient counterparts. Lastly, as a wider objective, such simple approaches quite easy to implement could contribute to analyzing the efficiency of irrigation water use and providing objective information to managers to help them rationalize agricultural water.

Author Contributions

Conceptualization, A.D. and L.J.; methodology, A.D. and L.J.; software, A.D., L.J., M.L.P. and R.E.A.; resources, M.L.P., R.B. and S.C.; investigation, A.D. and L.J.; data curation, A.D. and L.J.; writing—original draft preparation, A.D. and L.J.; writing—review and editing, A.D., L.J., M.L.P., S.E.-R., S.K., A.C. and R.E.A.; supervision, L.J., S.E.-R. and S.K. All authors have read and agreed to the published version of the manuscript.

Funding

This work was carried out within the framework of the Joint International Laboratory TREMA (http://lmi-trema.ma, accessed on 31 July 2022). Financial support for the experiment was provided by the Institut de Recherche pour le Développement (IRD), the ERANET-MED 03-62 CHAAMS project, and the H2020 RISE ACCWA project (grant agreement no. 823965). H2020 PRIMA IDEWA is also acknowledged for addition funding. M. Diarra received a PhD grant from the Programme Doctoral International “Modélisation des Systeme complexe” or (PDI MSC) associated with the IRD and the Pierre et Marie Curie University or UPMC (Paris, France).

Data Availability Statement

The data presented in this study are available on request from the corresponding author.

Acknowledgments

The authors acknowledge the Economic Services of the Ministry of Agriculture of Morocco for providing the crop production statistics and the Regional Office of Agricultural Development of the Haouz plain (ORMVAH) for providing the statistics on water input over Haouz irrigated areas. The authors are also grateful for the valuable and constructive comments from the anonymous reviewers.

Conflicts of Interest

The authors declare no conflict of interest.

References

  1. Tramblay, Y.; Koutroulis, A.; Samaniego, L.; Vicente-Serrano, S.M.; Volaire, F.; Boone, A.; Le Page, M.; Llasat, M.C.; Albergel, C.; Burak, S.; et al. Challenges for Drought Assessment in the Mediterranean Region under Future Climate Scenarios. Earth-Sci. Rev. 2020, 210, 103348. [Google Scholar] [CrossRef]
  2. Pereira, L.S.; Oweis, T.; Zairi, A. Irrigation Management under Water Scarcity. Agric. Water Manag. 2002, 57, 175–206. [Google Scholar] [CrossRef]
  3. Saadi, S.; Simonneaux, V.; Boulet, G.; Raimbault, B.; Mougenot, B.; Fanise, P.; Ayari, H.; Lili-Chabaane, Z. Monitoring Irrigation Consumption Using High Resolution NDVI Image Time Series: Calibration and Validation in the Kairouan Plain (Tunisia). Remote Sens. 2015, 7, 13005–13028. [Google Scholar] [CrossRef] [Green Version]
  4. Fader, M.; Shi, S.; Von Bloh, W.; Bondeau, A.; Cramer, W. Mediterranean Irrigation under Climate Change: More Efficient Irrigation Needed to Compensate for Increases in Irrigation Water Requirements. Hydrol. Earth Syst. Sci. 2016, 20, 953–973. [Google Scholar] [CrossRef] [Green Version]
  5. Jarlan, L.; Khabba, S.; Szczypta, C.; Lili-Chabaane, Z.; Driouech, F.; Le Page, M.; Hanich, L.; Fakir, Y.; Boone, A.; Boulet, G. Water Resources in South Mediterranean Catchments Assessing Climatic Drivers and Impacts. Mediterr. Reg. Clim. Chang. 2016, 2010, 303–309. [Google Scholar]
  6. Kuper, M.; Ameur, F.; Hammani, A. Unraveling the Enduring Paradox of Increased Pressure on Groundwater through Efficient Drip Irrigation. In Drip Irrigation Agriculture; Routledge: London, UK, 2018; pp. 85–104. [Google Scholar] [CrossRef]
  7. Liu, S.; Han, Y.; Su, H. Regional Evapotranspiration Estimation by the Improved MOD16-Sm Model and Its Application in Central China. Water 2022, 14, 1491. [Google Scholar] [CrossRef]
  8. Milly, P.C. Climate, Soil Water Storage, and the Average Annual Water Balance. Water Resour. Res. 1994, 30, 2143–2156. [Google Scholar] [CrossRef]
  9. Allen, R.G.; Pereira, L.S.; Howell, T.A.; Jensen, M.E. Evapotranspiration Information Reporting: I. Factors Governing Measurement Accuracy. Agric. Water Manag. 2011, 98, 899–920. [Google Scholar] [CrossRef] [Green Version]
  10. Allen, R.G.; Pereira, L.S.; Raes, D.; Smith, M. Crop Evapotranspiration (Guidelines for Computing Crop Water Requirements). Agronomy 1998, 300, D05109. [Google Scholar] [CrossRef] [Green Version]
  11. Jasechko, S.; Sharp, Z.D.; Gibson, J.J.; Birks, S.J.; Yi, Y.; Fawcett, P.J. Terrestrial Water Fluxes Dominated by Transpiration. Nature 2013, 496, 347–350. [Google Scholar] [CrossRef]
  12. Aouade, G.; Jarlan, L.; Ezzahar, J.; Er-Raki, S.; Napoly, A.; Benkaddour, A.; Khabba, S.; Boulet, G.; Garrigues, S.; Chehbouni, A.; et al. Evapotranspiration Partition Using the Multiple Energy Balance Version of the ISBA-A-Gs Land Surface Model over Two Irrigated Crops in a Semi-Arid Mediterranean Region (Marrakech, Morocco). Hydrol. Earth Syst. Sci. 2020, 24, 3789–3814. [Google Scholar] [CrossRef]
  13. Boulet, G.; Jarlan, L.; Olioso, A.; Nieto, H. Evapotranspiration in the Mediterranean Region; Elsevier Inc.: Amsterdam, The Netherlands, 2020; ISBN 9780128180860. [Google Scholar]
  14. Twine, T.E.; Kustas, W.P.; Norman, J.M.; Cook, D.R.; Houser, P.R.; Meyers, T.P.; Prueger, J.H.; Starks, P.J.; Wesely, M.L. Correcting Eddy-Covariance Flux Underestimates over a Grassland. Agric. For. Meteorol. 2000, 103, 279–300. [Google Scholar] [CrossRef] [Green Version]
  15. Ezzahar, J.; Chehbouni, A.; Hoedjes, J.C.B.; Chehbouni, A. On the Application of Scintillometry over Heterogeneous Grids. J. Hydrol. 2007, 334, 493–501. [Google Scholar] [CrossRef] [Green Version]
  16. Zhang, K.; Kimball, J.S.; Running, S.W. A Review of Remote Sensing Based Actual Evapotranspiration Estimation. Wiley Interdiscip. Rev. Water 2016, 3, 834–853. [Google Scholar] [CrossRef]
  17. Courault, D.; Seguin, B.; Olioso, A. Review on Estimation of Evapotranspiration from Remote Sensing Data: From Empirical to Numerical Modeling Approaches. Irrig. Drain. Syst. 2005, 19, 223–249. [Google Scholar] [CrossRef]
  18. Diarra, A.; Jarlan, L.; Er-Raki, S.; Le Page, M.; Aouade, G.; Tavernier, A.; Boulet, G.; Ezzahar, J.; Merlin, O.; Khabba, S. Performance of the Two-Source Energy Budget (TSEB) Model for the Monitoring of Evapotranspiration over Irrigated Annual Crops in North Africa. Agric. Water Manag. 2017, 193, 71–88. [Google Scholar] [CrossRef]
  19. Bigeard, G.; Coudert, B.; Chirouze, J.; Er-Raki, S.; Boulet, G.; Ceschia, E.; Jarlan, L. Ability of a Soil-Vegetation-Atmosphere Transfer Model and a Two-Source Energy Balance Model to Predict Evapotranspiration for Several Crops and Climate Conditions. Hydrol. Earth Syst. Sci. 2019, 23, 5033–5058. [Google Scholar] [CrossRef] [Green Version]
  20. Er-Raki, S.; Chehbouni, A.; Hoedjes, J.; Ezzahar, J.; Duchemin, B.; Jacob, F. Improvement of FAO-56 Method for Olive Orchards through Sequential Assimilation of Thermal Infrared-Based Estimates of ET. Agric. Water Manag. 2008, 95, 309–321. [Google Scholar] [CrossRef]
  21. Albergel, C.; Calvet, J.C.; Mahfouf, J.F.; Rüdiger, C.; Barbu, A.L.; Lafont, S.; Roujean, J.L.; Walker, J.P.; Crapeau, M.; Wigneron, J.P. Monitoring of Water and Carbon Fluxes Using a Land Data Assimilation System: A Case Study for Southwestern France. Hydrol. Earth Syst. Sci. 2010, 14, 1109–1124. [Google Scholar] [CrossRef] [Green Version]
  22. Albergel, C.; Dutra, E.; Munier, S.; Calvet, J.C.; Munoz-Sabater, J.; De Rosnay, P.; Balsamo, G. ERA-5 and ERA-Interim Driven ISBA Land Surface Model Simulations: Which One Performs Better? Hydrol. Earth Syst. Sci. 2018, 22, 3515–3532. [Google Scholar] [CrossRef]
  23. Anderson, M.C.; Kustas, W.P.; Norman, J.M.; Hain, C.R.; Mecikalski, J.R.; Schultz, L.; González-Dugo, M.P.; Cammalleri, C.; D’Urso, G.; Pimstein, A.; et al. Mapping Daily Evapotranspiration at Field to Continental Scales Using Geostationary and Polar Orbiting Satellite Imagery. Hydrol. Earth Syst. Sci. 2011, 15, 223–239. [Google Scholar] [CrossRef] [Green Version]
  24. Massari, C.; Modanesi, S.; Dari, J.; Gruber, A.; De Lannoy, G.J.M.; Girotto, M.; Quintana-Seguí, P.; Le Page, M.; Jarlan, L.; Zribi, M.; et al. A Review of Irrigation Information Retrievals from Space and Their Utility for Users. Remote Sens. 2021, 13, 4112. [Google Scholar] [CrossRef]
  25. Le Page, M.; Jarlan, L.; El Hajj, M.M.; Zribi, M.; Baghdadi, N.; Boone, A. Potential for the Detection of Irrigation Events on Maize Plots Using Sentinel-1 Soil Moisture Products. Remote Sens. 2020, 12, 1621. [Google Scholar] [CrossRef]
  26. Ouaadi, N.; Jarlan, L.; Khabba, S.; Ezzahar, J.; Le Page, M.; Merlin, O. Irrigation Amounts and Timing Retrieval through Data Assimilation of Surface Soil Moisture into the Fao-56 Approach in the South Mediterranean Region. Remote Sens. 2021, 13, 2667. [Google Scholar] [CrossRef]
  27. Moran, M.S.; Clarke, T.R.; Inoue, Y.; Vidal, A. Estimating Crop Water Deficit Using the Relation between Surface-Air Temperature and Spectral Vegetation Index. Remote Sens. Environ. 1994, 49, 246–263. [Google Scholar] [CrossRef]
  28. Kalma, J.D.; McVicar, T.R.; McCabe, M.F. Estimating Land Surface Evaporation: A Review of Methods Using Remotely Sensed Surface Temperature Data. Surv. Geophys. 2008, 29, 421–469. [Google Scholar] [CrossRef]
  29. Brenner, C.; Zeeman, M.; Bernhardt, M.; Schulz, K. Estimation of Evapotranspiration of Temperate Grassland Based on High-Resolution Thermal and Visible Range Imagery from Unmanned Aerial Systems. Int. J. Remote Sens. 2018, 39, 5141–5174. [Google Scholar] [CrossRef] [PubMed] [Green Version]
  30. Zhang, C.; Long, D.; Zhang, Y.; Anderson, M.C.; Kustas, W.P.; Yang, Y. A Decadal (2008–2017) Daily Evapotranspiration Data Set of 1 Km Spatial Resolution and Spatial Completeness across the North China Plain Using TSEB and Data Fusion. Remote Sens. Environ. 2021, 262. [Google Scholar] [CrossRef]
  31. Guzinski, R.; Nieto, H.; Sandholt, I.; Karamitilios, G. Modelling High-Resolution Actual Evapotranspiration through Sentinel-2 and Sentinel-3 Data Fusion. Remote Sens. 2020, 12, 1433. [Google Scholar] [CrossRef]
  32. Merlin, O.; Duchemin, B.; Hagolle, O.; Jacob, F.; Coudert, B.; Chehbouni, G.; Dedieu, G.; Garatuza, J.; Kerr, Y. Disaggregation of MODIS Surface Temperature over an Agricultural Area Using a Time Series of Formosat-2 Images. Remote Sens. Environ. 2010, 114, 2500–2512. [Google Scholar] [CrossRef]
  33. Anderson, M.C.; Norman, J.M.; Diak, G.R.; Kustas, W.P.; Mecikalski, J.R.; Anderson, M.C. A Two-Source Time-Integrated Model for Estimating Surface Fluxes Using Thermal Infrared Remote Sensing; Elsevier Science Inc.: Amsterdam, The Netherlands, 1997; Volume 60. [Google Scholar]
  34. Su, Z. Application of Simplified Surface Energy Balance Index (S-SEBI) for Crop Evapotranspiration Using Landsat 8. Hydrol. Earth Syst. Sci. 2002, 61, 85–99. [Google Scholar] [CrossRef]
  35. Norman, J.M.; Kustas, W.P.; Humes, K.S. Source Approach for Estimating Soil and Vegetation Energy Fluxes in Observations of Directional Radiometric Surface Temperature. Agric. For. Meteorol. 1995, 77, 263–293. [Google Scholar] [CrossRef]
  36. Chirouze, J.; Boulet, G.; Jarlan, L.; Fieuzal, R.; Rodriguez, J.C.; Ezzahar, J.; Er-Raki, S.; Bigeard, G.; Merlin, O.; Garatuza, J.; et al. Inter-Comparison of Four Remote Sensing Based Surface Energy Balance Methods Hydrology and Earth System Sciences Discussions. Hydrol. Earth Syst. Sci. Discuss 2013, 10, 895–963. [Google Scholar] [CrossRef]
  37. Kustas, W.P.; Norman, J.M. Reply to Comments about the Basic Equations of Dual-Source Vegetation-Atmosphere Transfer Models. Agric. For. Meteorol. 1999, 94, 275–278. [Google Scholar] [CrossRef]
  38. Boulet, G.; Mougenot, B.; Lhomme, J.P.; Fanise, P.; Lili-Chabaane, Z.; Olioso, A.; Bahir, M.; Rivalland, V.; Jarlan, L.; Merlin, O.; et al. The SPARSE Model for the Prediction of Water Stress and Evapotranspiration Components from Thermal Infra-Red Data and Its Evaluation over Irrigated and Rainfed Wheat. Hydrol. Earth Syst. Sci. 2015, 19, 4653–4672. [Google Scholar] [CrossRef] [Green Version]
  39. Amazirh, A.; Er-Raki, S.; Chehbouni, A.; Rivalland, V.; Diarra, A.; Khabba, S.; Ezzahar, J.; Merlin, O. Modified Penman–Monteith Equation for Monitoring Evapotranspiration of Wheat Crop: Relationship between the Surface Resistance and Remotely Sensed Stress Index. Biosyst. Eng. 2017, 164, 68–84. [Google Scholar] [CrossRef]
  40. Bastiaanssen, W.G.M.; Menenti, M.; Feddes, R.A.; Holtslag, A.A.M. A Remote Sensing Surface Energy Balance Algorithm for Land (SEBAL) 1. Formulation. J. Hydrol. 1998, 212–213, 198–212. [Google Scholar] [CrossRef]
  41. Mecikalski, J.R.; Diak, G.R.; Anderson, M.C.; Norman, J.M. Estimating Fluxes on Continental Scales Using Remotely Sensed Data in an Atmospheric-Land Exchange Model. J. Appl. Meteorol. 1999, 38, 1352–1369. [Google Scholar] [CrossRef]
  42. Kustas, W.P.; Norman, J.M. A Two-Source Energy Balance Approach Using Directional Radiometric Temperature Observations for Sparse Canopy Covered Surfaces. Agron. J. 2000, 92, 847–854. [Google Scholar] [CrossRef]
  43. Allen, R.G.; Tasumi, M.; Morse, A.; Trezza, R.; Wright, J.L.; Bastiaanssen, W.; Kramber, W.; Lorite, I.; Robison, C.W. Satellite-Based Energy Balance for Mapping Evapotranspiration with Internalized Calibration (METRIC)—Applications. J. Irrig. Drain. Eng. 2007, 133, 395–406. [Google Scholar] [CrossRef]
  44. Yang, Y.; Su, H.; Zhang, R.; Tian, J.; Li, L. An Enhanced Two-Source Evapotranspiration Model for Land (ETEML): Algorithm and Evaluation. Remote Sens. Environ. 2015, 168, 54–65. [Google Scholar] [CrossRef]
  45. Choi, M.; Kustas, W.P.; Anderson, M.C.; Allen, R.G.; Li, F.; Kjaersgaard, J.H. An Intercomparison of Three Remote Sensing-Based Surface Energy Balance Algorithms over a Corn and Soybean Production Region (Iowa, U.S.) during SMACEX. Agric. For. Meteorol. 2009, 149, 2082–2097. [Google Scholar] [CrossRef]
  46. Timmermans, W.J.; Kustas, W.P.; Anderson, M.C.; French, A.N. An Intercomparison of the Surface Energy Balance Algorithm for Land (SEBAL) and the Two-Source Energy Balance (TSEB) Modeling Schemes. Remote Sens. Environ. 2007, 108, 369–384. [Google Scholar] [CrossRef]
  47. Elfarkh, J.; Ezzahar, J.; Er-Raki, S.; Simonneaux, V.; Hssaine, B.A.; Rachidi, S.; Brut, A.; Rivalland, V.; Khabba, S.; Chehbouni, A.; et al. Multi-Scale Evaluation of the TSEB Model over a Complex Agricultural Landscape in Morocco. Remote Sens. 2020, 12, 1181. [Google Scholar] [CrossRef] [Green Version]
  48. Hssaine, B.A.; Merlin, O.; Rafi, Z.; Ezzahar, J.; Jarlan, L.; Khabba, S.; Er-Raki, S. Calibrating an Evapotranspiration Model Using Radiometric Surface Temperature, Vegetation Cover Fraction and near-Surface Soil Moisture Data. Agric. For. Meteorol. 2018, 256–257, 104–115. [Google Scholar] [CrossRef] [Green Version]
  49. Dee, D.P.; Uppala, S.M.; Simmons, A.J.; Berrisford, P.; Poli, P.; Kobayashi, S.; Andrae, U.; Balmaseda, M.A.; Balsamo, G.; Bauer, P.; et al. The ERA-Interim Reanalysis: Configuration and Performance of the Data Assimilation System. Q. J. R. Meteorol. Soc. 2011, 137, 553–597. [Google Scholar] [CrossRef]
  50. Jones, P.D.; Harpham, C.; Troccoli, A.; Gschwind, B.; Ranchin, T.; Wald, L.; Goodess, C.M.; Dorling, S. Using ERA-Interim Reanalysis for Creating Datasets of Energy-Relevant Climate Variables. Earth Syst. Sci. Data 2017, 9, 471–495. [Google Scholar] [CrossRef] [Green Version]
  51. Simmons, A.J.; Poli, P.; Dee, D.P.; Berrisford, P.; Hersbach, H.; Kobayashi, S.; Peubey, C. Estimating Low-Frequency Variability and Trends in Atmospheric Temperature Using ERA-Interim. Q. J. R. Meteorol. Soc. 2014, 140, 329–353. [Google Scholar] [CrossRef]
  52. Szczypta, C. Hydrologie Spatiale Pour Le Suivi Des Sécheresses Du Bassin Méditerranéen. Ph.D. Thesis, Institut National Polytechnique de Toulouse (INPT), Toulouse, France, 2012; pp. 1–197. [Google Scholar]
  53. Compo, G.P.; Whitaker, J.S.; Sardeshmukh, P.D.; Matsui, N.; Allan, R.J.; Yin, X.; Gleason, B.E.; Vose, R.S.; Rutledge, G.; Bessemoulin, P.; et al. The Twentieth Century Reanalysis Project. Q. J. R. Meteorol. Soc. 2011, 137, 1–28. [Google Scholar] [CrossRef] [Green Version]
  54. Chehbouni, A.; Escadafal, R.; Duchemin, B.; Boulet, G.; Simonneaux, V.; Dedieu, G.; Mougenot, B.; Khabba, S.; Kharrou, H.; Maisongrande, P.; et al. An Integrated Modelling and Remote Sensing Approach for Hydrological Study in Arid and Semi-Arid Regions: The SUDMED Programme. Int. J. Remote Sens. 2008, 29, 5161–5181. [Google Scholar] [CrossRef]
  55. Jarlan, L.; Khabba, S.; Er-Raki, S.; Le Page, M.; Hanich, L.; Fakir, Y.; Merlin, O.; Mangiarotti, S.; Gascoin, S.; Ezzahar, J.; et al. Remote Sensing of Water Resources in Semi-Arid Mediterranean Areas: The Joint International Laboratory TREMA. Int. J. Remote Sens. 2015, 36, 4879–4917. [Google Scholar] [CrossRef]
  56. Duchemin, B.; Hadria, R.; Erraki, S.; Boulet, G.; Maisongrande, P.; Chehbouni, A.; Escadafal, R.; Ezzahar, J.; Hoedjes, J.C.B.; Kharrou, M.H.; et al. Monitoring Wheat Phenology and Irrigation in Central Morocco: On the Use of Relationships between Evapotranspiration, Crops Coefficients, Leaf Area Index and Remotely-Sensed Vegetation Indices. Agric. Water Manag. 2006, 79, 1–27. [Google Scholar] [CrossRef]
  57. Duchemin, B.; Hagolle, O.; Mougenot, B.; Benhadj, I.; Hadria, R.; Simonneaux, V.; Ezzahar, J.; Hoedjes, J.; Khabba, S.; Kharrou, M.H.; et al. Agrometerological Study of Semi-Ard Areas: An Experiment for Analysing the Potential of Time Series of FORMOSAT-2 Images (Tensift-Marrakech Plain). Int. J. Remote Sens. 2008, 29, 5291–5299. [Google Scholar] [CrossRef] [Green Version]
  58. Benhadj, I.; Duchemin, B.; Maisongrande, P.; Simonneaux, V.; Khabba, S.; Chehbouni, A. Automatic Unmixing of MODIS Multi-Temporal Data for Inter-Annual Monitoring of Land Use at a Regional Scale (Tensift, Morocco). Int. J. Remote Sens. 2012, 33, 1325–1348. [Google Scholar] [CrossRef]
  59. Balaghi, R.; Tychon, B.; Eerens, H.; Jlibene, M. Empirical Regression Models Using NDVI, Rainfall and Temperature Data for the Early Prediction of Wheat Grain Yields in Morocco. Int. J. Appl. Earth Obs. Geoinf. 2008, 10, 438–452. [Google Scholar] [CrossRef] [Green Version]
  60. Bouras, E.H.; Jarlan, L.; Er-Raki, S.; Balaghi, R.; Amazirh, A.; Richard, B.; Khabba, S. Cereal Yield Forecasting with Satellite Drought-Based Indices, Weather Data and Regional Climate Indices Using Machine Learning in Morocco. Remote Sens. 2021, 13, 3101. [Google Scholar] [CrossRef]
  61. Jarlan, L.; Abaoui, J.; Duchemin, B.; Ouldbba, A.; Tourre, Y.M.; Khabba, S.; Le Page, M.; Balaghi, R.; Mokssit, A.; Chehbouni, G. Linkages between Common Wheat Yields and Climate in Morocco (1982-2008). Int. J. Biometeorol. 2014, 58, 1489–1502. [Google Scholar] [CrossRef]
  62. Er-Raki, S.; Chehbouni, A.; Guemouria, N.; Duchemin, B.; Ezzahar, J.; Hadria, R. Combining FAO-56 Model and Ground-Based Remote Sensing to Estimate Water Consumptions of Wheat Crops in a Semi-Arid Region. Agric. Water Manag. 2007, 87, 41–54. [Google Scholar] [CrossRef] [Green Version]
  63. Toumi, J.; Er-Raki, S.; Ezzahar, J.; Khabba, S.; Jarlan, L.; Chehbouni, A. Performance Assessment of AquaCrop Model for Estimating Evapotranspiration, Soil Water Content and Grain Yield of Winter Wheat in Tensift Al Haouz (Morocco): Application to Irrigation Management. Agric. Water Manag. 2016, 163, 219–235. [Google Scholar] [CrossRef]
  64. Khabba, S.; Er-raki, S.; Toumi, J.; Ezzahar, J.; Hssaine, B.A.; Le Page, M.; Chehbouni, A. Agronomy A Simple Light-Use-E Ffi Ciency Model to Estimate Wheat Yield in the Semi-Arid Areas. Agronomy 2020, 10, 1524. [Google Scholar] [CrossRef]
  65. Wang, P.; Song, X.; Han, D.; Zhang, Y.; Zhang, B. Determination of Evaporation, Transpiration and Deep Percolation of Summer Corn and Winter Wheat after Irrigation. Agric. Water Manag. 2012, 105, 32–37. [Google Scholar] [CrossRef]
  66. Duchemin, B.; Er-Raki, S.; Gentine, P.; Maisongrande, P.; Coret, L.; Boulet, G.; Rodriguez, J.C.; Simonneaux, V.; Chehbouni, A.; Dedieu, G.; et al. Estimating Cereal Evapotranspiration Using a Simple Model Driven by Satellite Data. Int. Geosci. Remote Sens. Symp. 2003, 4, 2762–2764. [Google Scholar] [CrossRef]
  67. Ezzahar, J.; Chehbouni, A.; Hoedjes, J.C.B.; Er-Raki, S.; Chehbouni, A.; Boulet, G.; Bonnefond, J.M.; De Bruin, H.A.R. The Use of the Scintillation Technique for Monitoring Seasonal Water Consumption of Olive Orchards in a Semi-Arid Region. Agric. Water Manag. 2007, 89, 173–184. [Google Scholar] [CrossRef] [Green Version]
  68. Simonneaux, V.; Duchemin, B.; Helson, D.; Er-Raki, S.; Olioso, A.; Chehbouni, A.G. The Use of High-Resolution Image Time Series for Crop Classification and Evapotranspiration Estimate over an Irrigated Area in Central Morocco. Int. J. Remote Sens. 2008, 29, 95–116. [Google Scholar] [CrossRef] [Green Version]
  69. Gutman, G.; Ignatov, A. The Derivation of the Green Vegetation Fraction from NOAA/AVHRR Data for Use in Numerical Weather Prediction Models. Int. J. Remote Sens. 1998, 19, 1533–1543. [Google Scholar] [CrossRef]
  70. Zeng, X.; Dickinson, R.E.; Walker, A.; Shaikh, M.; Defries, R.S.; Qi, J. Derivation and Evaluation of Global 1-Km Fractional Vegetation Cover Data for Land Modeling. J. Appl. Meteorol. 2000, 39, 826–839. [Google Scholar] [CrossRef]
  71. Beck, H.E.; Wood, E.F.; Pan, M.; Fisher, C.K.; Miralles, D.G.; Van Dijk, A.I.J.M.; McVicar, T.R.; Adler, R.F. MSWep v2 Global 3-Hourly 0.1° Precipitation: Methodology and Quantitative Assessment. Bull. Am. Meteorol. Soc. 2019, 100, 473–500. [Google Scholar] [CrossRef] [Green Version]
  72. Gao, P.; Xu, X.; Zhang, X. On the Relationship between the QBO/ENSO and Atmospheric Temperature Using COSMIC Radio Occultation Data. J. Atmos. Solar-Terr. Phys. 2017, 156, 103–110. [Google Scholar] [CrossRef]
  73. Brutsaert, W. Evaporation into the Atmosphere; Springer: Berlin/Heidelberg, Germany, 1982; ISBN 9789401714976. [Google Scholar]
  74. Harris, I.; Jones, P.D.; Osborn, T.J.; Lister, D.H. Updated High-Resolution Grids of Monthly Climatic Observations–The CRU TS3.10 Dataset. Int. J. Climatol. 2014, 34, 623–642. [Google Scholar] [CrossRef] [Green Version]
  75. Nogueira, M. Inter-Comparison of ERA-5, ERA-Interim and GPCP Rainfall over the Last 40 Years: Process-Based Analysis of Systematic and Random Differences. J. Hydrol. 2020, 583, 124632. [Google Scholar] [CrossRef]
  76. Bouras, E.H.; Jarlan, L.; Er-Raki, S.; Albergel, C.; Richard, B.; Balaghi, R.; Khabba, S. Linkages between Rainfed Cereal Production and Agricultural Drought through Remote Sensing Indices and a Land Data Assimilation System: A Case Study in Morocco. Remote Sens. 2020, 12, 4018. [Google Scholar] [CrossRef]
  77. Kustas, W.P.; Norman, J.M. Evaluation of Soil and Vegetation Heat Flux Predictions Using a Simple Two-Source Model with Radiometric Temperatures for Partial Canopy Cover. Agric. For. Meteorol. 1999, 94, 13–29. [Google Scholar] [CrossRef]
  78. Kustas, W.P.; Alfieri, J.G.; Anderson, M.C.; Colaizzi, P.D.; Prueger, J.H.; Evett, S.R.; Neale, C.M.U.; French, A.N.; Hipps, L.E.; Chávez, J.L.; et al. Evaluating the Two-Source Energy Balance Model Using Local Thermal and Surface Flux Observations in a Strongly Advective Irrigated Agricultural Area. Adv. Water Resour. 2012, 50, 120–133. [Google Scholar] [CrossRef] [Green Version]
  79. Brutsaert, W.H.; Reidel, D. Evaporation into the Atmosphere: Theory, History, and Applications. Q. J. R. Meteorol. Soc. 1983, 109, 267. [Google Scholar] [CrossRef]
  80. Choudhury, B.J.; Monteith, J.L. A Four-Layer Model for the Heat Budget of Homogeneous Land Surfaces; Royal Meteorological Society: Oxford, UK, 1988; Volume 114. [Google Scholar]
  81. Priestley, C.H.B.; Taylor, R.J.; Physics, R.J.T.A. On the Assessment of Surface Heat Flux and Evaporation Using Large-Scale Parameters. Mon. Weather Rev. 1972, 100, 81–92. [Google Scholar] [CrossRef]
  82. French, A.N. Scaling of Surface Energy Fluxes Unsing Remotely Sensed Data. Ph D. Thesis, University of Maryland, College Park, MD, USA, 2001. [Google Scholar]
  83. Delogu, E.; Boulet, G.; Olioso, A.; Coudert, B.; Chirouze, J.; Ceschia, E.; Le Dantec, V.; Marloie, O.; Chehbouni, G.; Lagouarde, J.P. Reconstruction of Temporal Variations of Evapotranspiration Using Instantaneous Estimates at the Time of Satellite Overpass. Hydrol. Earth Syst. Sci. 2012, 16, 2995–3010. [Google Scholar] [CrossRef] [Green Version]
  84. Ryu, Y.; Baldocchi, D.D.; Black, T.A.; Detto, M.; Law, B.E.; Leuning, R.; Miyata, A.; Reichstein, M.; Vargas, R.; Ammann, C.; et al. On the Temporal Upscaling of Evapotranspiration from Instantaneous Remote Sensing Measurements to 8-Day Mean Daily-Sums. Agric. For. Meteorol. 2012, 152, 212–222. [Google Scholar] [CrossRef] [Green Version]
  85. Liu, R.; Wen, J.; Wang, X.; Wang, Z. Validation of Evapotranspiration and Its Long-Term Trends in the Yellow River Source Region. J. Water Clim. Chang. 2017, 8, 495–509. [Google Scholar] [CrossRef] [Green Version]
  86. Srivastava, P.K.; Han, D.; Islam, T.; Petropoulos, G.P.; Gupta, M.; Dai, Q. Seasonal Evaluation of Evapotranspiration Fluxes from MODIS Satellite and Mesoscale Model Downscaled Global Reanalysis Datasets. Theor. Appl. Climatol. 2016, 124, 461–473. [Google Scholar] [CrossRef]
  87. Szczypta, C.; Calvet, J.C.; Albergel, C.; Balsamo, G.; Boussetta, S.; Carrer, D.; Lafont, S.; Meurey, C. Verification of the New ECMWF ERA-Interim Reanalysis over France. Hydrol. Earth Syst. Sci. 2011, 15, 647–666. [Google Scholar] [CrossRef]
  88. Simmons, A.J.; Willett, K.M.; Jones, P.D.; Thorne, P.W.; Dee, D.P. Low-Frequency Variations in Surface Atmospheric Humidity, Temperature, and Precipitation: Inferences from Reanalyses and Monthly Gridded Observational Data Sets. J. Geophys. Res. Atmos. 2010, 115, 1–21. [Google Scholar] [CrossRef] [Green Version]
  89. Brohan, P.; Kennedy, J.J.; Harris, I.; Tett, S.F.B.; Jones, P.D. Uncertainty Estimates in Regional and Global Observed Temperature Changes: A New Data Set from 1850. J. Geophys. Res. Atmos. 2006, 111. [Google Scholar] [CrossRef] [Green Version]
  90. Guzinski, R.; Nieto, H.; Jensen, R.; Mendiguren, G. Remotely Sensed Land-Surface Energy Fluxes at Sub-Field Scale in Heterogeneous Agricultural Landscape and Coniferous Plantation. Biogeosciences 2014, 11, 5021–5046. [Google Scholar] [CrossRef] [Green Version]
  91. Anderson, M.C.; Cammalleri, C.; Hain, C.R.; Otkin, J.; Zhan, X.; Kustas, W. Using a Diagnostic Soil-Plant-Atmosphere Model for Monitoring Drought at Field to Continental Scales. Procedia Environ. Sci. 2013, 19, 47–56. [Google Scholar] [CrossRef] [Green Version]
  92. Ezzahar, J.; Chehbouni, A.; Er-Raki, S.; Hanich, L. Combining a Large Aperture Scintillometer and Estimates of Available Energy to Derive Evapotranspiration over Several Agricultural Fields in a Semi-Arid Region. Plant Biosyst. 2009, 143, 209–221. [Google Scholar] [CrossRef] [Green Version]
  93. Chirouze, J.; Boulet, G.; Jarlan, L.; Fieuzal, R.; Rodriguez, J.C.; Ezzahar, J.; Er-Raki, S.; Bigeard, G.; Merlin, O.; Garatuza-Payan, J.; et al. Intercomparison of Four Remote-Sensing-Based Energy Balance Methods to Retrieve Surface Evapotranspiration and Water Stress of Irrigated Fields in Semi-Arid Climate. Hydrol. Earth Syst. Sci. 2014, 18, 1165–1188. [Google Scholar] [CrossRef] [Green Version]
  94. Castelli, M.; Anderson, M.C.; Yang, Y.; Wohlfahrt, G.; Bertoldi, G.; Niedrist, G.; Hammerle, A.; Zhao, P.; Zebisch, M.; Notarnicola, C. Two-Source Energy Balance Modeling of Evapotranspiration in Alpine Grasslands. Remote Sens. Environ. 2018, 209, 327–342. [Google Scholar] [CrossRef]
  95. Gómez-Candón, D.; Bellvert, J.; Royo, C. Performance of the Two-Source Energy Balance (TSEB) Model as a Tool for Monitoring the Response of Durum Wheat to Drought by High-Throughput Field Phenotyping. Front. Plant Sci. 2021, 12, 658357. [Google Scholar] [CrossRef]
  96. Nassah, H.; Er-Raki, S.; Khabba, S.; Fakir, Y.; Raibi, F.; Merlin, O.; Mougenot, B. Evaluation and Analysis of Deep Percolation Losses of Drip Irrigated Citrus Crops under Non-Saline and Saline Conditions in a Semi-Arid Area. Biosyst. Eng. 2018, 165, 10–24. [Google Scholar] [CrossRef]
  97. Semmens, K.A.; Anderson, M.C.; Kustas, W.P.; Gao, F.; Alfieri, J.G.; McKee, L.; Prueger, J.H.; Hain, C.R.; Cammalleri, C.; Yang, Y.; et al. Monitoring Daily Evapotranspiration over Two California Vineyards Using Landsat 8 in a Multi-Sensor Data Fusion Approach. Remote Sens. Environ. 2016, 185, 155–170. [Google Scholar] [CrossRef]
  98. Abtew, W.; Melesse, A. Evaporation and Evapotranspiration: Measurements and Estimations. Evaporation Evapotranspiration Measurements and Estimation; Springer: Berlin/Heidelberg, Germany, 2013; Volume 11, pp. 61–175. [Google Scholar] [CrossRef]
  99. Melesse, A.M.; Nangia, V. Estimation of Spatially Distributed Surface Energy Fluxes Using Remotely-Sensed Data for Agricultural Fields. Hydrol. Process. 2005, 19, 2653–2670. [Google Scholar] [CrossRef]
  100. Steduto, P.; Hsiao, T.C.; Raes, D.; Fereres, E. Aquacrop-the FAO Crop Model to Simulate Yield Response to Water: I. Concepts and Underlying Principles. Agron. J. 2009, 101, 426–437. [Google Scholar] [CrossRef] [Green Version]
  101. Kharrou, M.H.; Er-Raki, S.; Chehbouni, A.; Duchemin, B.; Simonneaux, V.; LePage, M.; Ouzine, L.; Jarlan, L. Water Use Efficiency and Yield of Winter Wheat under Different Irrigation Regimes in a Semi-Arid Region. Agric. Sci. 2011, 02, 273–282. [Google Scholar] [CrossRef] [Green Version]
  102. Ouassanouan, Y.; Fakir, Y.; Simonneaux, V.; Kharrou, M.H.; Bouimouass, H.; Najar, I.; Benrhanem, M.; Sguir, F.; Chehbouni, A. Multi-Decadal Analysis of Water Resources and Agricultural Change in a Mediterranean Semiarid Irrigated Piedmont under Water Scarcity and Human Interaction. Sci. Total Environ. 2022, 834, 155328. [Google Scholar] [CrossRef] [PubMed]
  103. Kharrou, H. Apport de La Teledetection Spatiale a l’analyse de La Performance Des Systemes d’irrigation En Zones Semi-Arides. Ph.D. Thesis, Cadi Ayyad Univesity, Marrakech, Morocco, 2014. [Google Scholar]
  104. Elwan, E.; Le Page, M.; Jarlan, L.; Baghdadi, N.; Brocca, L.; Modanesi, S.; Dari, J.; Segui, P.Q.; Zribi, M. Irrigation Mapping on Two Contrasted Climatic Contexts Using Sentinel-1 and Sentinel-2 Data. Water 2022, 14, 804. [Google Scholar] [CrossRef]
  105. Portmann, F.T.; Siebert, S.; Döll, P. MIRCA2000-Global Monthly Irrigated and Rainfed Crop Areas around the Year 2000: A New High-Resolution Data Set for Agricultural and Hydrological Modeling. Global Biogeochem. Cycles 2010, 24, GB1011. [Google Scholar] [CrossRef]
  106. Siebert, S.; Döll, P. Quantifying Blue and Green Virtual Water Contents in Global Crop Production as Well as Potential Production Losses without Irrigation. J. Hydrol. 2010, 384, 198–217. [Google Scholar] [CrossRef]
  107. Abbasi, N.; Nouri, H.; Didan, K.; Barreto-Muñoz, A.; Borujeni, S.C.; Salemi, H.; Opp, C.; Siebert, S.; Nagler, P. Estimating Actual Evapotranspiration over Croplands Using Vegetation Index Methods and Dynamic Harvested Area. Remote Sens. 2021, 13, 5167. [Google Scholar] [CrossRef]
  108. Bai, J.; Chen, X.; Li, L.; Luo, G.; Yu, Q. Quantifying the Contributions of Agricultural Oasis Expansion, Management Practices and Climate Change to Net Primary Production and Evapotranspiration in Croplands in Arid Northwest China. J. Arid Environ. 2014, 100–101, 31–41. [Google Scholar] [CrossRef]
  109. Hersbach, H.; Bell, B.; Berrisford, P.; Hirahara, S.; Horányi, A.; Muñoz-Sabater, J.; Nicolas, J.; Peubey, C.; Radu, R.; Schepers, D.; et al. The ERA5 Global Reanalysis. Q. J. R. Meteorol. Soc. 2020, 146, 1999–2049. [Google Scholar] [CrossRef]
  110. Muñoz-sabater, J.; Dutra, E.; Agustí-panareda, A.; Albergel, C.; Hersbach, H.; Martens, B.; Miralles, D.G.; Piles, M.; Rodríguez-fernández, N.J. ERA5-Land : A State-of-the-Art Global Reanalysis Dataset for Land Applications. Earth Syst. Sci. Data. 2021, 13, 4349–4383. [Google Scholar] [CrossRef]
  111. Baigorria, G.A.; Hansen, J.W.; Ward, N.; Jones, J.W.; O’Brien, J.J. Assessing Predictability of Cotton Yields in the Southeastern United States Based on Regional Atmospheric Circulation and Surface Temperatures. J. Appl. Meteorol. Climatol. 2008, 47, 76–91. [Google Scholar] [CrossRef]
  112. Brisson, N.; Mary, B.; Ripoche, D.; Jeuffroy, M.H.; Ruget, F.; Nicoullaud, B.; Gate, P.; Devienne-Barret, F.; Antonioletti, R.; Durr, C.; et al. STICS: A Generic Model for the Simulation of Crops and Their Water and Nitrogen Balances. I. Theory and Parameterization Applied to Wheat and Corn. Agronomie 1998, 18, 311–346. [Google Scholar] [CrossRef] [Green Version]
  113. Hansen, J.W.; Jones, J.W.; Irmak, A.; Royce, F. El Niño-Southern Oscillation Impacts on Crop Production in the Southeast United States. In Impacts of El Niño and Climate Variability on Agriculture; Frontiers Media: Lausanne, Switzerland, 2001. [Google Scholar] [CrossRef]
  114. Hansen, J.W.; Challinor, A.; Ines, A.; Wheeler, T.; Moron, V. Translating Climate Forecasts into Agricultural Terms: Advances and Challenges. Clim. Res. 2006, 33, 27–41. [Google Scholar] [CrossRef]
  115. Le Page, M.; Zribi, M. Analysis and Predictability of Drought In Northwest Africa Using Optical and Microwave Satellite Remote Sensing Products. Sci. Rep. 2019, 9, 1466. [Google Scholar] [CrossRef] [PubMed]
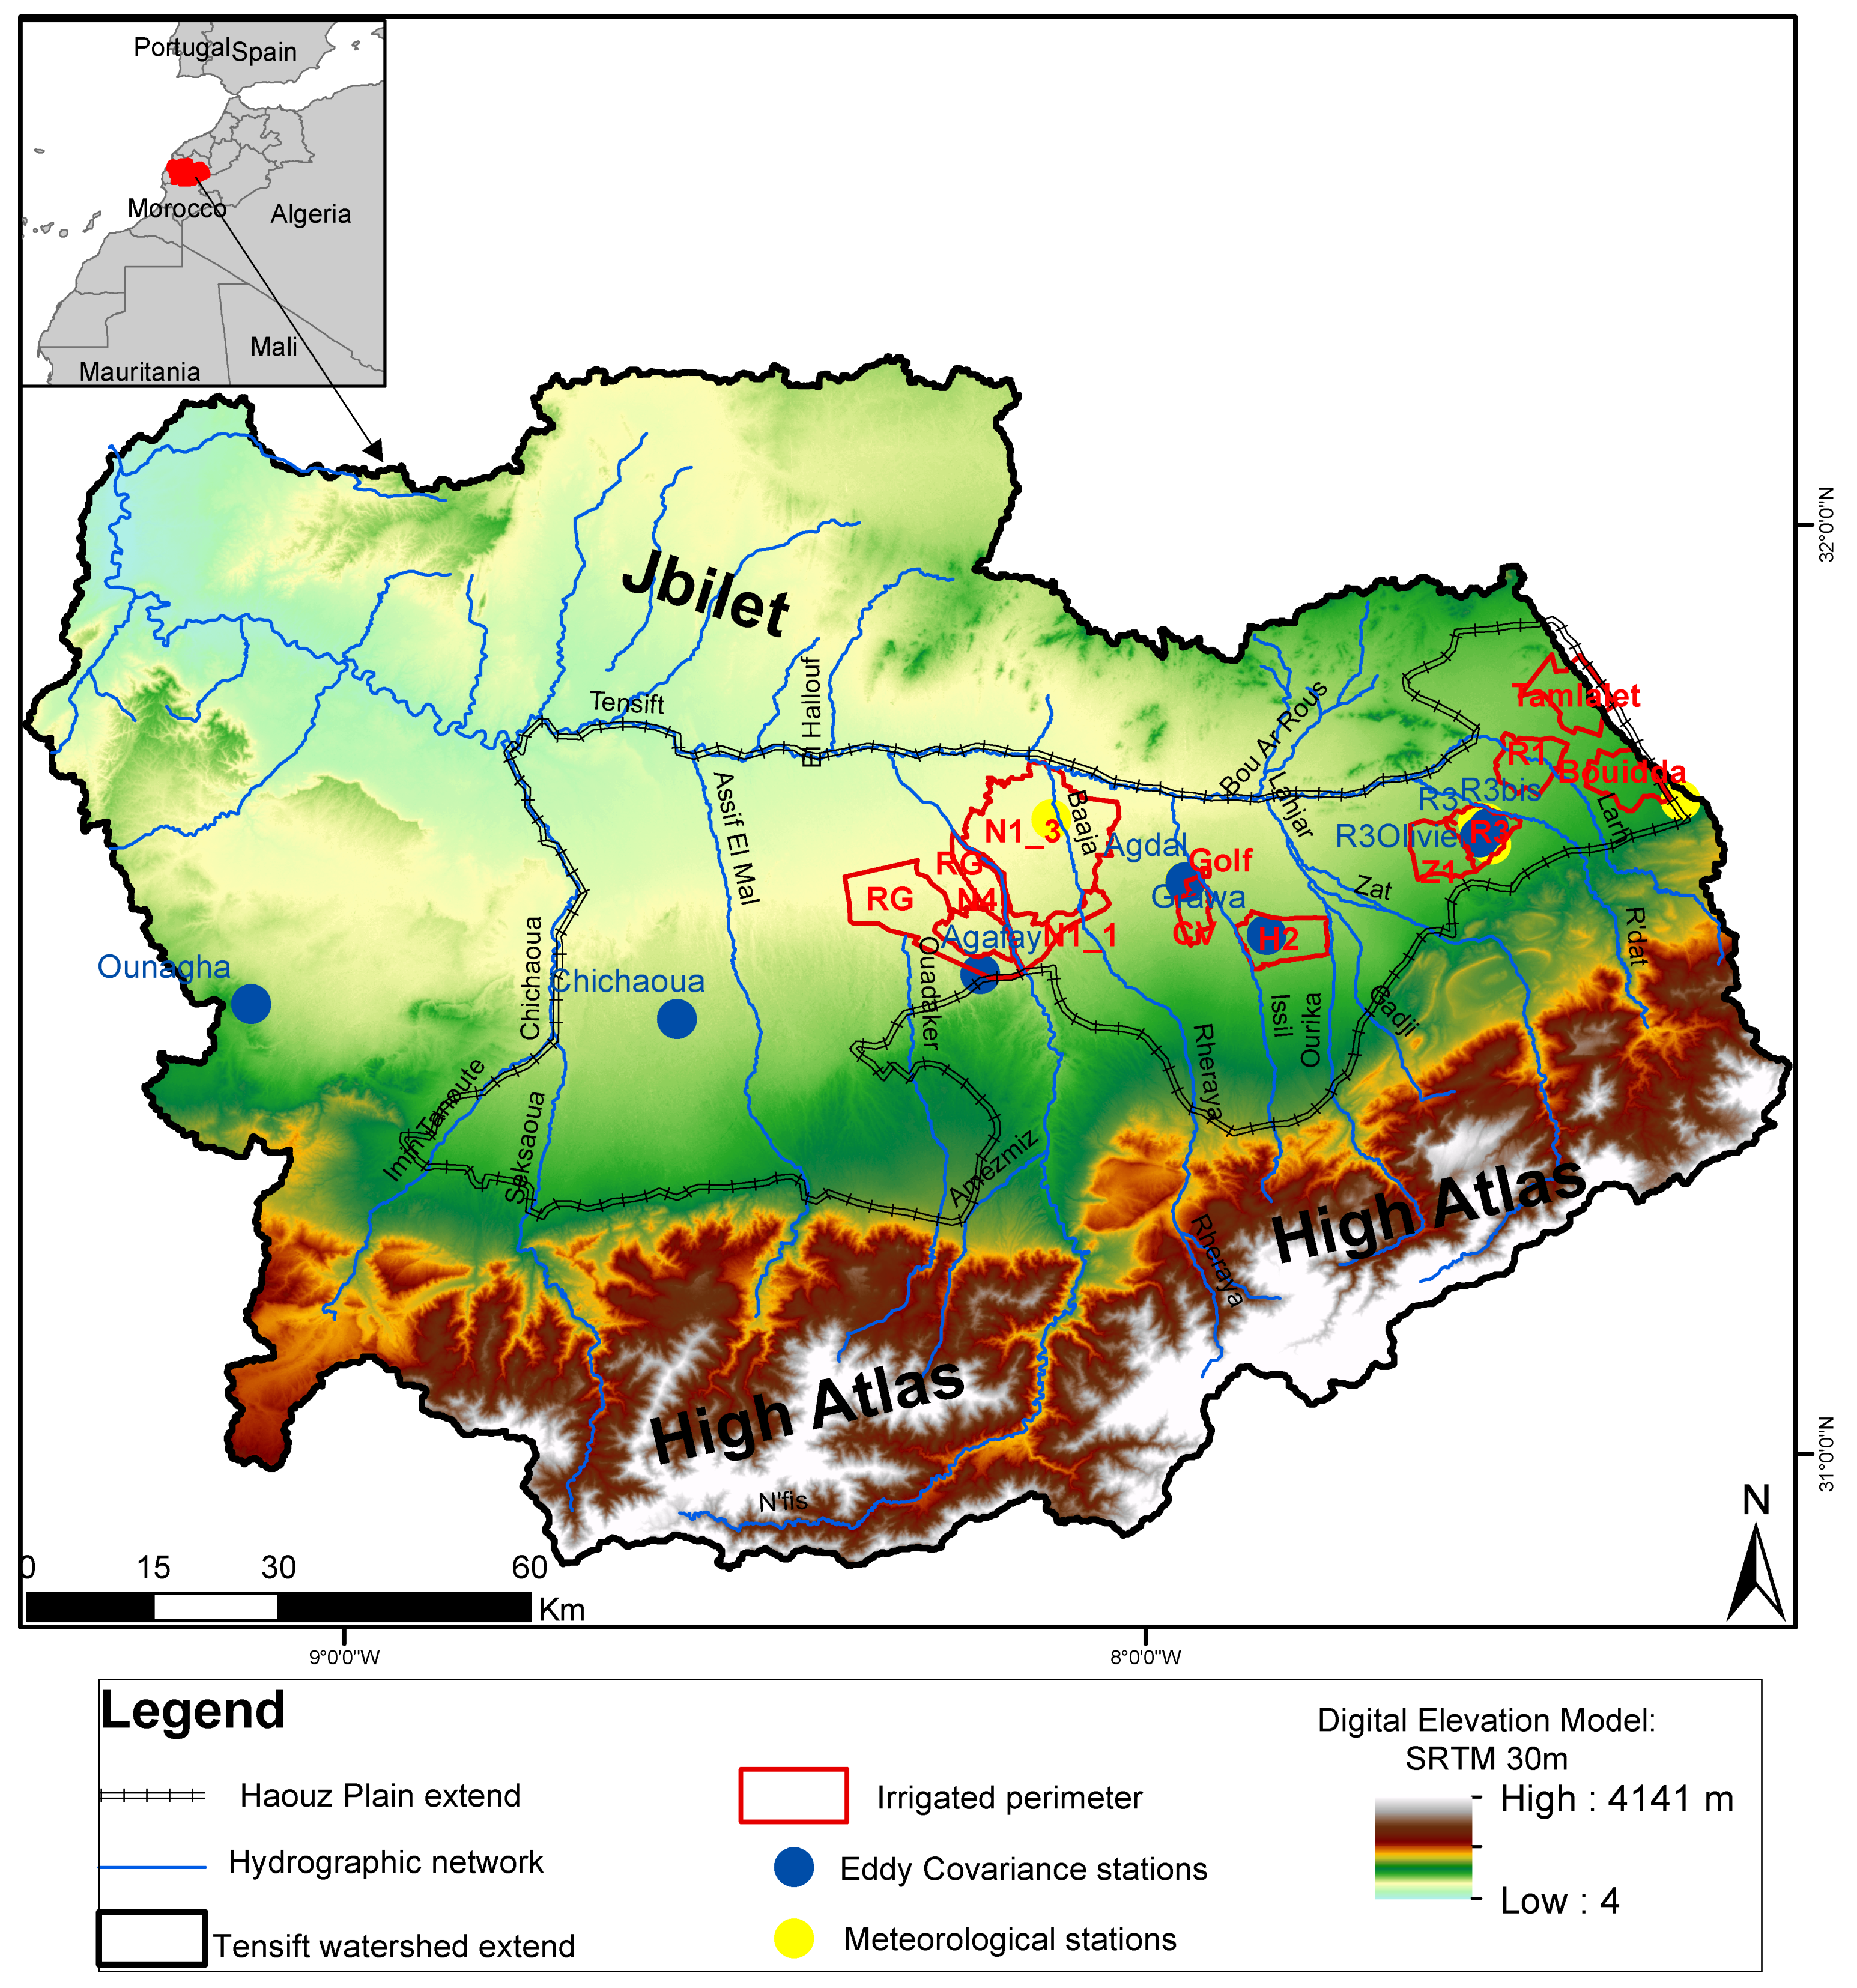
Figure 1. The Tensift catchment within the Tensift Observatory network and the irrigated perimeters. Please note that R3 stations are not installed on the same fields and crops (see Table 1); however, for ease of visualization, only one point is reported on the map.
Remotesensing 14 05071 g001
Figure 2. Flowchart of the methodology used in this study. Ts = surface temperature (°C); Ta = air temperature (°C); RH = relative humidity (%); Rg = global radiation (W/m2); WS = wind speed (m/s); Rn = net radiation (W/m2); G = soil conduction (W/m2); H = sensible heat flux (W/m2); LE = latent heat flux (W/m2).
Remotesensing 14 05071 g002
Figure 3. Comparison of the ERA-Interim meteorological variables with measured station datasets (ad).
Remotesensing 14 05071 g003
Figure 4. Seasonal variation of the four components of the energy budget (LE, H, Rn, and G) predicted by TSEB compared to measured values over two contrasted agricultural areas: irrigated olive orchards during 2003 and rainfed wheat during 2015. Q corresponds to a quarter (3 months). Statistical metrics RMSE and bias are expressed in W/m2.
Remotesensing 14 05071 g004
Figure 5. Benchmark of the four component of energy budget (LE, H, Rn, and G) compared to wheat site flux tower measurements. Statistical metrics RMSE and bias are expressed in W/m2.
Remotesensing 14 05071 g005
Figure 6. Confrontations between monthly evapotranspiration cumulated at the perimeter scale and the monthly water supply composed of irrigation + CRU rainfall throughout all these perimeters during the year 2011. The number near each dot corresponds to the index of irrigated area presented in Table 3.
Remotesensing 14 05071 g006
Figure 7. Comparison of evapotranspiration anomalies (monthly anomalies during the January–February–March–April growing season) in relation to cereal production (in tons) in the Tensift region over the 2001–2011 period.
Remotesensing 14 05071 g007
Figure 8. Monthly evapotranspiration climatology (2001–2015) on the Haouz plain for April (a) and for August (b). The main irrigated perimeters of the plain were superimposed for comparison.
Remotesensing 14 05071 g008
Figure 9. Monthly evapotranspiration anomalies with regard to the 2001–2015 climatology: (a) February 2009; (b) March 2012. The main irrigated perimeters of the plain are overlaid for comparison.
Remotesensing 14 05071 g009
Figure 10. Evolution of the irrigated areas in the north of Marrakech city: (a) Google Earth image of August 2005); (b) Google Earth image of August 2016; (c) monthly evapotranspiration averages through August for the 2001–2005 period; (d) monthly evapotranspiration averages through August for the 2011–2015 period.
Remotesensing 14 05071 g010
Table 1. List, location, and acquisition period of the Tensift observatory eddy covariance tower and meteorological stations used in this study for evaluating the predicted energy budget components and for the evaluation of ERA-Interim analysis dataset. * Please note that each equipment and each variable are found at each site. However, for ease, they are reported only once in the table.
Site IDLonLatAltEquipment *Variable *CropsPeriod
Eddy Covariance Stations
Agafay–8.228131.4964506Hygrometer Krypton (KH2O)
Three-dimensional sonic anemometer (CSAT) Vaisala (HMP45C)
Latent heat flux LE (W/m2)
Sensible heat flux H (W/m2)
Irrigated citrus2006–2009
Agdal–7.973931.6014479Olive orchard2003–2004
R3_2003–7.595331.6669593Irrigated wheat2003
R3_2004–7.595931.6725593Irrigated wheat2004
R3_2012–7.607131.6728591Net radiometer (CNR1)Net radiation
Rn (W/m2)
Irrigated wheat2012
R3 Olive tree–7.632031.6618590Olive orchard2005–2006
R3_2013–7.589131.6494593Irrigated wheat2013
Sidi Rahal_2014–7.589131.6494580Flux plates (HPF01)Soil conduction
G (W/m2)
Rainfed wheat2014
Sidi Rahal_2015–7.352331.7009564Rainfed wheat2015
Saada–7.607131.6728415Irrigated citrus2004–2005
Meteorological Stations
Agdal–7.973831.6012506Pyranometer (CM3) Incident radiation
Rg (W/m2)
Olive orchard2004
Agafay–8.228031.4964479Vaisala (HMP45C)
Anemometer (A100R)
Wind speed
WS (m/s)
Relative humidity RH (%)
Air temperature Ta (°C)
Grass Tall2003
Chichaoua–8.607831.4392517Rainfed wheat2012
Grawa–7.870031.5469523Irrigated wheat2006
Ounagha–9.282631.4430430Alfafa2008
R3–7.605031.6570593Rain gauge (FSS500)Rain
P (mm/day)
Irrigated wheat2003
R3 Olive tree–7.593331.6675593Olive orchard2015
R3bis–7.593331.6675593Alfafa2004–2005
Table 2. Statistics of the comparison between ERA-Interim reanalysis and the measures of the meteorological stations of the Tensift Observatory network at the time of the Terra satellite overpass.
VariablesNrRMSEbias
Air temperature (°C)77890.971.93.0
Relative humidity (%)77930.798.04.0
Radiation incident (W/m2)93290.741166.0
Wind speed (m/s)91770.401.10.7
Table 3. Comparison between added CRU rainfall + irrigation and TSEB/MODIS monthly evapotranspiration estimates at the irrigated perimeters for 2011 agricultural season.
CVR1R3Z1H2RGRDN1Total
Index440421426343228-
r0.540.520.630.730.190.480.310.400.8
RMSE (%)1154143885537656189
bias (%)6555677411845585260
Publisher’s Note: MDPI stays neutral with regard to jurisdictional claims in published maps and institutional affiliations.