Abstract
Accurate nitrogen (N) diagnosis early in the growing season across diverse soil, weather, and management conditions is challenging. Strategies using multi-source data are hypothesized to perform significantly better than approaches using crop sensing information alone. The objective of this study was to evaluate, across diverse environments, the potential for integrating genetic (e.g., comparative relative maturity and growing degree units to key developmental growth stages), environmental (e.g., soil and weather), and management (e.g., seeding rate, irrigation, previous crop, and preplant N rate) information with active canopy sensor data for improved corn N nutrition index (NNI) prediction using machine learning methods. Thirteen site-year corn (Zea mays L.) N rate experiments involving eight N treatments conducted in four US Midwest states in 2015 and 2016 were used for this study. A proximal RapidSCAN CS-45 active canopy sensor was used to collect corn canopy reflectance data around the V9 developmental growth stage. The utility of vegetation indices and ancillary data for predicting corn aboveground biomass, plant N concentration, plant N uptake, and NNI was evaluated using singular variable regression and machine learning methods. The results indicated that when the genetic, environmental, and management data were used together with the active canopy sensor data, corn N status indicators could be more reliably predicted either using support vector regression (R2 = 0.74–0.90 for prediction) or random forest regression models (R2 = 0.84–0.93 for prediction), as compared with using the best-performing single vegetation index or using a normalized difference vegetation index (NDVI) and normalized difference red edge (NDRE) together (R2 < 0.30). The N diagnostic accuracy based on the NNI was 87% using the data fusion approach with random forest regression (kappa statistic = 0.75), which was better than the result of a support vector regression model using the same inputs. The NDRE index was consistently ranked as the most important variable for predicting all the four corn N status indicators, followed by the preplant N rate. It is concluded that incorporating genetic, environmental, and management information with canopy sensing data can significantly improve in-season corn N status prediction and diagnosis across diverse soil and weather conditions.
1. Introduction
Proper nitrogen (N) management is critical for optimizing corn (Zea mays L.) yield and quality, farmer’s profitability, and sustainable development [1,2,3,4]. In addition, crop N management is challenging, due to its dynamic nature. The combination of these factors results in complex interactions driving N dynamics and the spatial and temporal variability in both soil N supply and crop N demand [2,5]. Mismanaging N can significantly impact food security, environmental sustainability, human health, and climate change [1,2,3]. Precision N management aims to match N supply and crop N demand in both space and time and has the potential to improve N use efficiency and reduce negative environmental impacts [2,4]. Technologies that can be used to reliably and efficiently diagnose crop N status over space and time in a timely manner are urgently needed to guide in-season site-specific N management.
One potential method for assessing corn N status is using a N nutrition index (NNI). The NNI is the ratio of measured plant N concentration (PNC) over an established critical PNC value (Nc)—defined as the minimum PNC that can produce maximum aboveground biomass (AGB) [6]. The Nc changes throughout the growing season as the concentration of adequate N becomes diluted (i.e., declines) with increasing AGB. The relationship between Nc and AGB can be described by a negative power function commonly referred to as a critical N dilution curve [6]. Various such curves have been established for different crops, including corn [7], wheat (Triticum aestivum L.) [8], rice (Oryza sativa L.) [9], and potato (Solanum tuberosum L.) [10]. Utilizing established dilution curves allows one to calculate the Nc of a crop at any given AGB and further calculate the NNI based on the measured PNC. The NNI will inform the user if the crop N status is deficient (NNI < 1), optimum (NNI = 1), or surplus (NNI >1) [6]. However, the NNI values representing optimum N can vary (e.g., optimum N status is when 0.95 ≥ NNI ≤ 1.05) [11]. In-season N application rates can be increased if NNI is less than 1 or 0.95 and reduced if NNI is greater than 1 or 1.05. More quantitative in-season N recommendation algorithms have been developed using NNI [12] or plant N uptake (PNU) and critical PNU calculated from AGB and a critical N dilution curve [13], leading to improved N use efficiency over conventional fixed rate and time applications. However, the drawback of this method is that it requires destructive sampling and chemical analysis, which has limited its implementation for on-farm precision N management.
A promising strategy to overcome this method’s shortcomings is to use proximal and/or remote sensing technologies to non-destructively estimate NNI [11,13]. Passive sensing technologies are limited by poor weather or poor lighting conditions. As a result, active canopy sensors may be more useful for precision N management, because they provide their own light sources and are not limited by environmental light conditions, and therefore can be used at any time of the day [11,14,15]. These sensors measure reflected light in several wavelengths, including red, near-infrared, and red edge wavelengths. Combining these measurements into vegetation indices—such as the normalized difference vegetation index (NDVI) or the normalized difference red edge (NDRE)—are good estimators of AGB, leaf area index, and PNU [11,14,15]. However, predictions of PNC and NNI are generally not satisfactory using commonly used vegetation indices and more efforts are needed to further improve their non-destructive predictions, especially across diverse soil, weather, and management conditions [11,15,16].
One approach to improve the prediction of PNC and NNI is to include multiple vegetation indices in the prediction models. Previous studies indicated that a combination of different vegetation indices using stepwise multiple linear regression or machine learning methods could significantly improve the prediction of crop N status indicators [17,18,19]. In general, machine learning models performed better than multiple linear regression models due to their capability to model complicated non-linear relationships. Support vector regression (SVR) and random forest regression (RFR) models generally performed better than other tested models [17,18].
Further improvement could occur by accounting for genetics (e.g., crop varieties), environmental conditions (e.g., soil and weather conditions), and management practices (e.g., preplant N fertilizer application rates, planting density, rotations, irrigation, and tillage practices, etc.). With most of the current studies limited to a single region or province (e.g., a US state), it is difficult to determine how genetic, environmental, and management factors impact the performance of active canopy sensors on a regional level. One approach to overcome the influences of genetic, environmental, and management factors is to use N-rich plots or strips as references or virtual references (naturally better crop growth areas in a field) to calculate N sufficiency or N response indices for N status diagnosis or making N recommendations [11,20,21,22,23]. However, the location of the reference plots, strips, or areas can influence the diagnosis results or N recommendations, and no consensus has been reached about where to put the references and how many will be needed [24,25]. Another approach is to incorporate soil and weather information to improve crop sensor-based N recommendation or the prediction of crop variables [26,27,28,29,30,31]. A recent study found that incorporating soil and weather information improved the performance of a crop sensor-based N recommendation algorithm developed by the University of Missouri and tested across the US Midwest, reducing the difference between sensor-recommended N rates and economic optimum N rate by ~25 kg ha−1 [26]. Additional improvement with this process was observed when using some machine learning algorithms (e.g., RFR, decision tree, and elastic net) [27,28,29,30].
To date, there has been some effort at predicting crop N status and the economic optimum N rate using environmental and management information [15,27,28,30]. However, studies focusing on NNI prediction using canopy reflectance sensing that incorporates genetic, environmental, and management information have not been reported. Being able to predict NNI would help farmers assess their crop N status and make in-season N management decisions [12,13]. Therefore, the objective of this study was to use different machine learning methods to evaluate, across diverse environments, the potential for integrating genetic, environmental, and management factors with active canopy sensor data for improving predictions of corn N status indicators. A sub-objective was to evaluate the relationship between previously published vegetation indices and corn N status indicators.
2. Materials and Methods
2.1. Experimental Design
Data were collected through a research collaboration between Corteva Agrisciences and eight US Midwest universities across an array of soil, weather, and management conditions of the US Corn Belt [31]. Although comprehensive data were collected during this project, corn AGB and PNC data were only available at the V9 ± 1 developmental growth stage [32] at 13 site-years from four states (Illinois, Iowa, Missouri, and Nebraska) from the 2015 and 2016 growing seasons. The V9 ± 1 developmental growth stage is the key stage for side-dress N application for most farmers and is a focus of this study. The average plot dimension was 3 m wide and 15 m long [33]. Each N response experiment had 16 N fertilizer treatments, with 4 replications in a randomized complete block design. Eight N application rate treatments (0–315 kg N ha−1 in 45 kg ha−1 increments) applied at the planting stage were used for this analysis. More site characteristic information, data descriptions, and data can be found in previous publications [31,33].
2.2. Measured Features
The corn canopy reflectance was measured using the RapidSCAN CS-45 proximal active canopy sensor (Holland Scientific, Lincoln, NE, USA) with wavelengths centered at 670, 730, and 780 nm. The sensor data were collected at the V9 ± 1 developmental growth stage. The sensor was held 60 cm above the corn canopy and walked at about 4 km h−1 to collect reflectance data from the two middle rows of each plot, collecting an average of 120 observations per plot. The reflectance data (i.e., red, near-infrared, and red edge wavelengths) were averaged to represent each plot. Based on previous research and preliminary analysis, 6 vegetation indices (Table 1) were calculated using the average wavelengths. The NDVI and NDRE indices were defined as sensor-provided vegetation indices in this study, because the RapidSCAN sensor can automatically calculate these indices.

Table 1.
The formulas and references for the vegetation indices used in this study.
After sensor data collection, six representative corn plants (entire aboveground plant) were taken from the middle two rows of each plot. The plant samples were dried at 60–70 °C to a constant weight, weighed to determine dry biomass, and then ground to pass through a <1 mm sieve. The PNC was determined using the Dumas combustion method with an Elementar Rapid N Cube (Elementar Analysensyteme GmbH, Langenselbold, Germany) by Agvise Laboratory (Northwood, ND, USA). The PNU was calculated by multiplying AGB and PNC. The AGB and PNU are not typically used as corn N status indicators, but because they are used to calculate or are related to PNC and NNI, they are termed “corn N status indicators” in this study.
Hobo U30 automatic weather stations (Onset Computer Corporation, Bourne, MA, USA) adjacent to each trial site [31] collected precipitation and temperature on a 15 min interval. Irrigation was not part of the precipitation measurement. Weather measurements were used to calculate additional weather variables from the time of planting to the time of sensing, including total precipitation (ranging from 95 to 426 mm), corn heat units (CHU; ranging from 943 to 1543), growing degree days (GDD; ranging from 407 to 662), Shannon diversity index (SDI; ranging from 0.52 to 0.75), and abundant and well-distributed rainfall (AWDR; ranging from 53 to 251) (see Table 2 for calculations and Table 3 for descriptions of the weather variables).
Table 2.
The weather variables and the calculation formulas used in this study.
Table 3.
The description of soil texture and weather variables for each site-year used in this study.
Soil texture was determined from core samples taken at a depth of 1.2 m. Each diagnostic horizon was analyzed for sand, silt, and clay (pipette method) by the University of Missouri’s Soil Health Assessment Center. For this analysis, data were weighed by soil depth to obtain an average value for 0–30 cm [31,33]. Soil texture for the top 30 cm included clay (ranging from 3 to 40%), silt (ranging from 7 to 71%), and sand (ranging from 5 to 91%) (Table 3).
Management information included preplant N rate (ranging from 0 to 315 kg ha−1), seeding rate (ranging from 80,000 to 90,000 seeds ha−1), previous crop (with 1 and 0 representing soybean and non-soybean, respectively), tillage (with 1 and 0 representing tillage and no-till systems, respectively), irrigation (with 1 and 0 representing irrigated and non-irrigated sites, respectively) (Table 4).
Table 4.
Description of hybrid and management information for each site used in this study.
Hybrid genetic information was obtained from Corteva Agriscience (Corteva, Johnston, Iowa, USA) and included comparative relative maturity (ranging from 105 to 114 days), silk comparative relative maturity (ranging from 106 to 113 days), growing degree units (GDUs) to silk (ranging from 716 to 760 °C), and GDUs to physiological maturity (ranging from 1416 to 1499 °C) (Table 4).
2.3. Feature Engineering
The NNI was calculated as the ratio of PNC over Nc, derived using the critical N dilution curve developed by Plénet and Lemaire [7] for an AGB greater than 1 t ha−1 following Equation (1):
where Nc is the critical N concentration and W is the dry AGB in t ha−1.
Nc = 34.0W−0.37
The first step of the analysis was determining the relationship between single vegetation indices and crop N status indicators (AGB, PNC, PNU, and NNI). Next, machine learning algorithms were used to predict each of the corn N status indicators using vegetation indices alone and with genetic, environmental, and management data. In the preliminary analysis, including more vegetation indices than the sensor-provided ones (NDVI and NDRE) did little to enhance prediction of corn N status indicators. Therefore, only the sensor-provided vegetation indices were used in the further analysis. The final step was validating the different models for predicting NNI. Model accuracy was based on classifying NNI as either deficient, optimal, or surplus. In these analyses, data (n = 414; 2 missing plots) from 13 different site-years were pooled together, with 75% of the data being used for model calibration and 25% for prediction. For the first step, to determine the relationship between each vegetation index and N status indicators, singular regression models were developed using Microsoft Excel 2016 (Microsoft Inc., Seattle, WA, USA). For the second step, two machine learning algorithms (SVR and RFR) were used to predict each of the four corn N status indicators. The SVR and RFR models were developed using the scikit-learn Python machine learning library [40,41]. The agreement between the observed and predicted parameters was evaluated using the coefficient of determination (R2), root mean square errors (RMSE), and mean absolute errors (MAE) generated during prediction. The Gini coefficients were also derived from the RFR models to describe the importance of each of the variables considered.
The final step was to evaluate the performance of different modeling approaches to predict NNI. The NNI diagnostic results from the singular regression and machine learning models were compared to those based on the NNI that was destructively determined in the prediction dataset (n = 104). The following diagnostic criteria were used: N was deficient, optimal, and surplus when NNI < 0.95, 0.95 ≤ NNI ≤ 1.05, and NNI > 1.05, respectively [11]. The diagnostic accuracy was evaluated using accuracy (%), precision (%), recall (%), F1_scale (%) [41], and the kappa statistic [42]. Accuracy was calculated by finding the total number of correctly classified items and dividing that by the total number of items. Precision was calculated as the number of true positives divided by the total number of true positives and false positives. Recall was calculated as the sum of true positives across all classes divided by the sum of true positives and false negatives across all classes. F1 score is the harmonic mean of precision and recall [41]. The kappa statistic corrects the agreement that occurs by chance and is a more robust measure of the agreement of two classifications [42]. A kappa value of 1 indicates perfect agreement between two categorization systems, while kappa values ≥ 0.60, 0.4–0.6, and < 0.4 indicate satisfactory, moderate, and weak agreement, respectively [42].
3. Results
3.1. Variability of Corn N Status Indicators
Across site-years, AGB had the highest variability, followed by PNU, PNC, and NNI in the calibration dataset (Table 5). The prediction dataset had similar variability (Table 5).
Table 5.
Descriptive statistics of corn N status indicators at around V9 growth stages across site-years.
3.2. Best Vegetation Indices for Predicating Corn N Status Indicators
The pairwise Pearson correlation coefficients (r) for relationships between vegetation indices and corn N status indicators are presented in Figure 1. The correlation coefficients between AGB or PNC and VIs were relatively low. NDRE (r = 0.74, p < 0.05) and the difference vegetation index (DVI) (r = 0.73, p < 0.05) were more strongly correlated with PNU than other vegetation indices. The Maccioni index (MACC) (r = 0.73, p < 0.05) and NDRE (r = 0.72, p < 0.05) had stronger correlations with NNI.
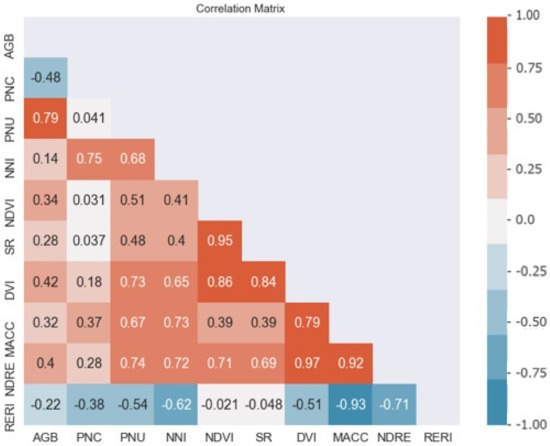
Figure 1.
The Pearson correlation coefficient metric between five vegetation indices (Table 1) and corn N status indicators (AGB = aboveground biomass, PNC = plant N content, PNU = plant N uptake, and NNI = N nutrition index).
The best performing singular models using a single vegetation index are presented in Table 6. PNU and NNI were best estimated with exponential models using NDRE and MACC, respectively. However, the R2 for calibration and prediction was all ≤ 0.30. For AGB and PNC, no significant models were identified.
Table 6.
The performance of singular variable regression models developed for predicting four different N status indicators.
3.3. Using Machine Learning for Predicting Corn N Indicators
The performance of the machine learning models developed using the two sensor-provided vegetation indices (NDVI and NDRE) with/without genetic, environmental, and management information are shown in Table 7. No models performed well using the sensor-provided vegetation indices alone.
Table 7.
The calibration and prediction results of support vector regression (SVR) and random forest regression (RFR) models using different input variables for predicting corn aboveground biomass, plant N concentration, plant N uptake, and N nutrition index across site-years at around the V9 growth stage. Here, G, E, and M refer to genetic, environmental, and management information, respectively.
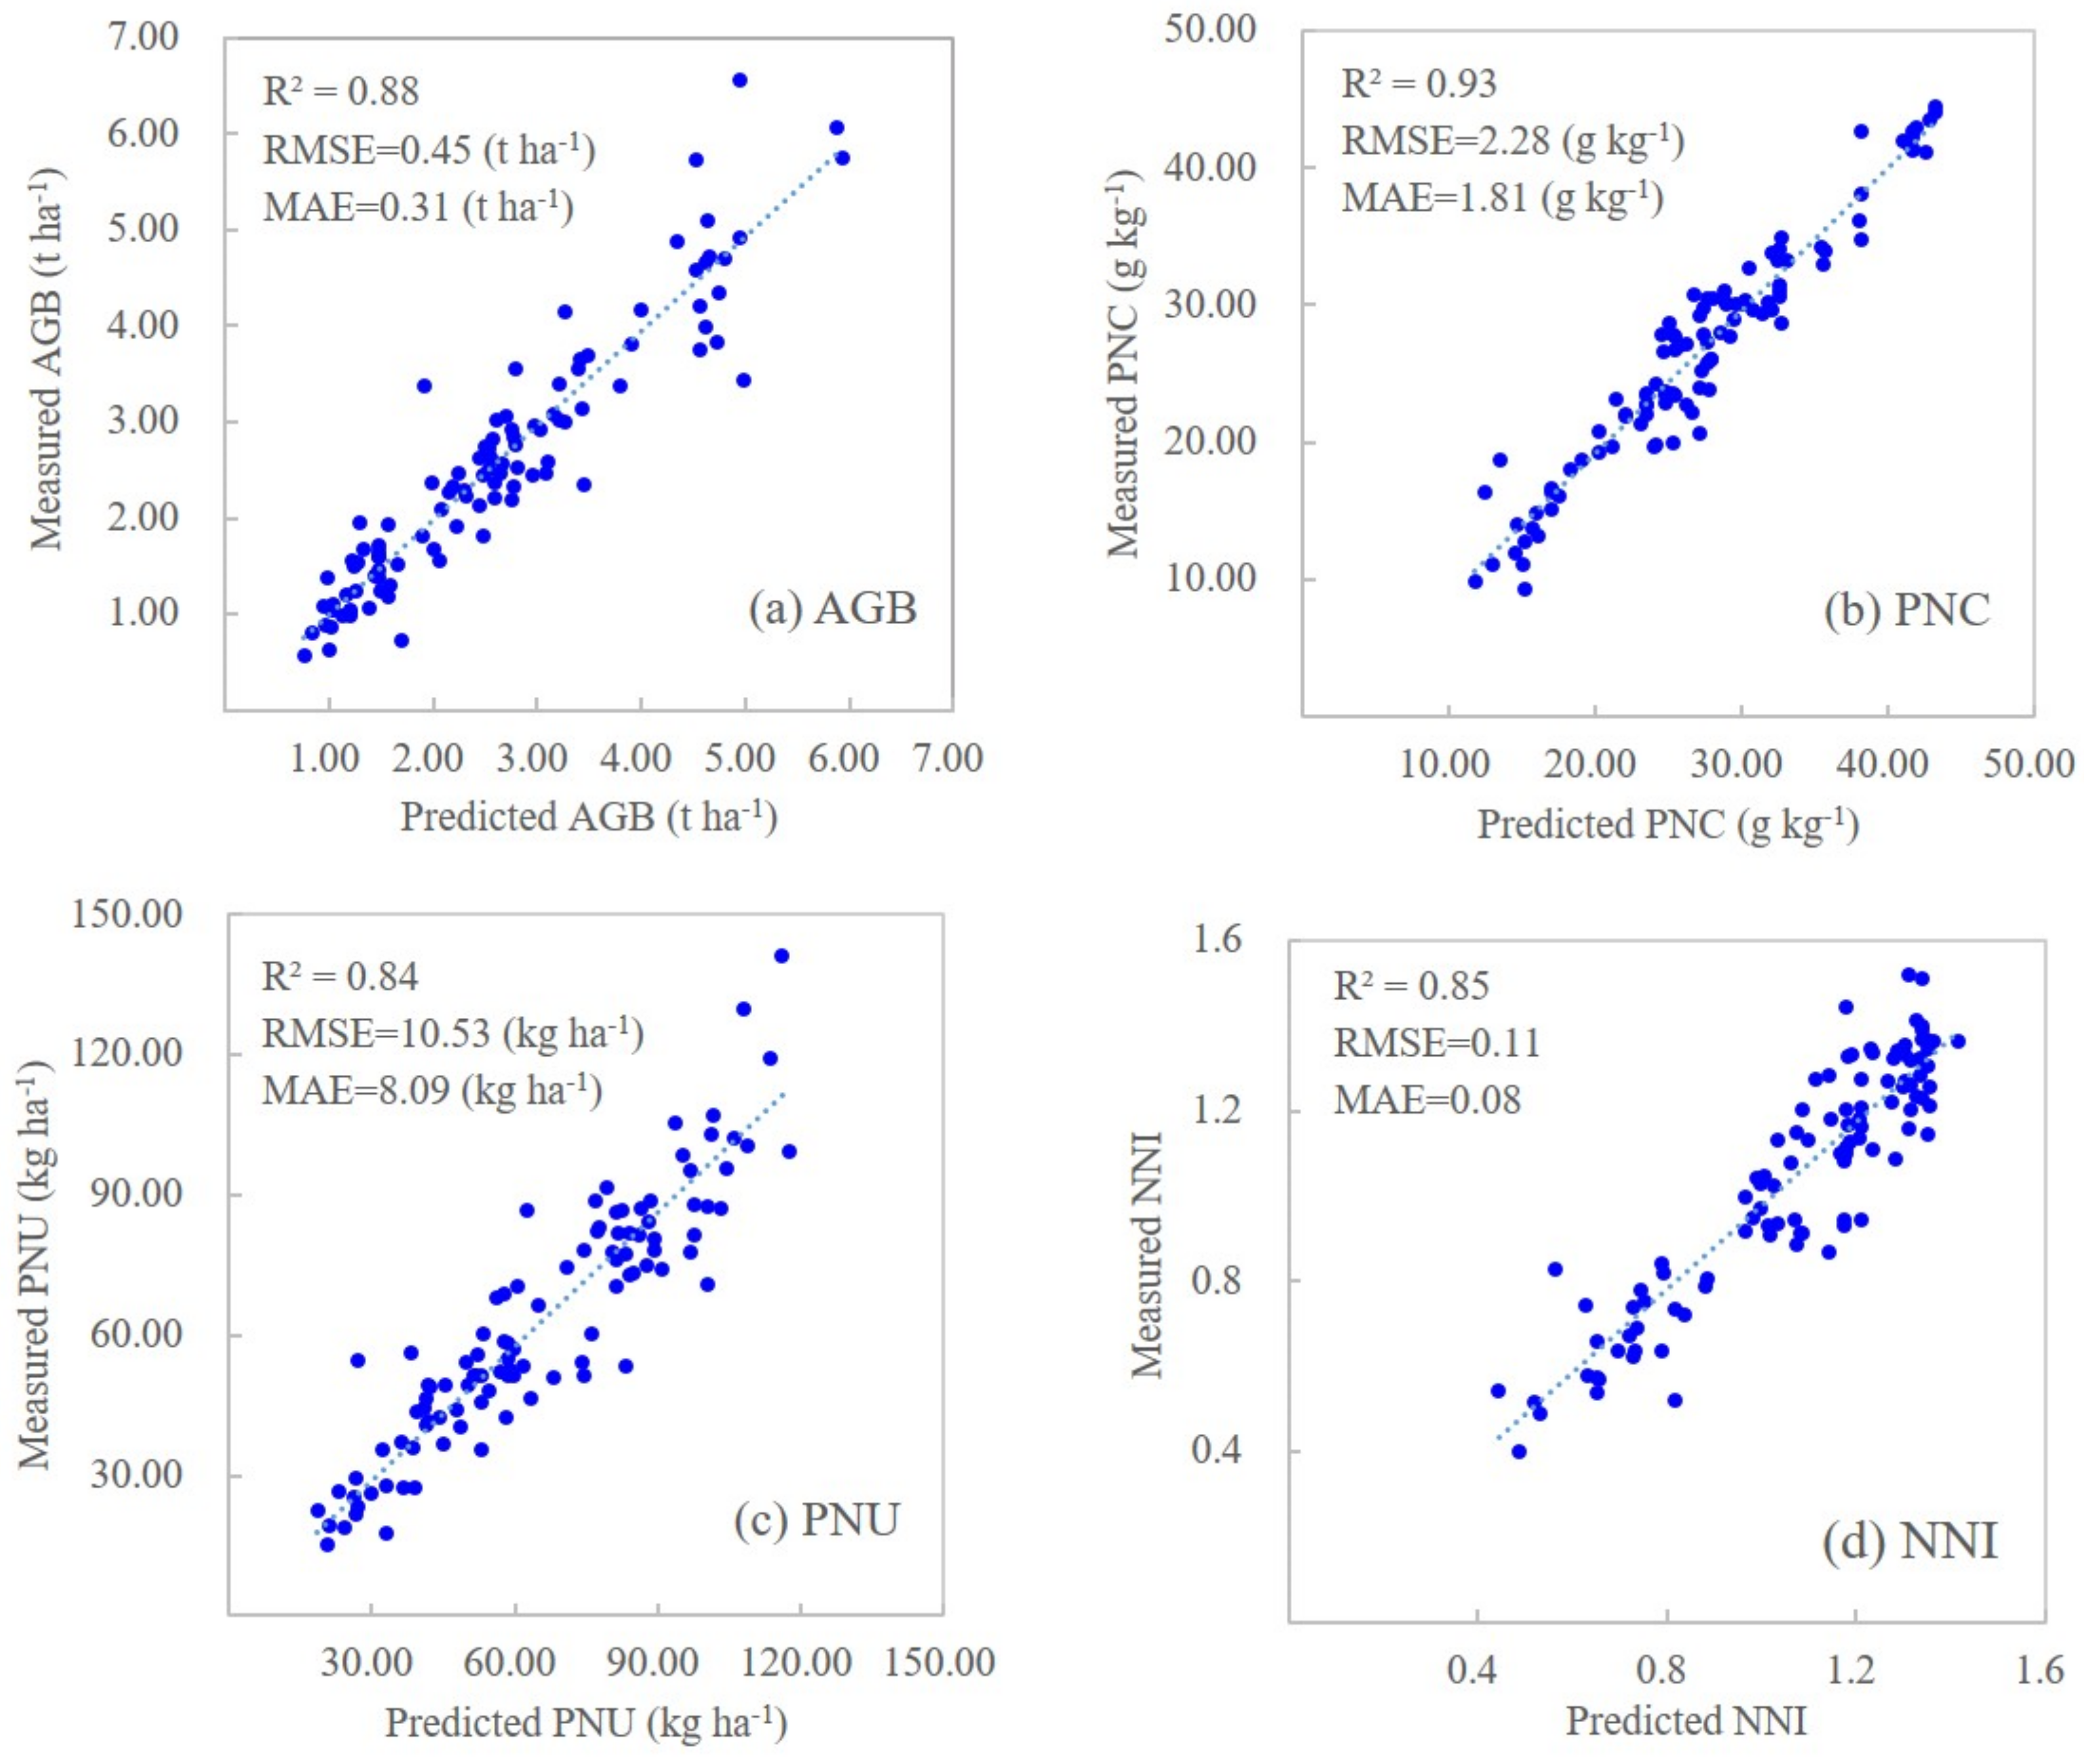
When combining NDVI and NDRE with genetic, environmental, and management information, both machine learning models significantly improved their prediction results (Table 7). The RFR models performed slightly better during calibration (R2 = 0.93–0.97) than the SVR models (R2 = 0.85–0.95), but both performed similarly with the prediction dataset. Because the RFR models showed improved performance metrics, the remainder of this paper will focus on these results. The scatter plots of measured and predicted corn N status indicators for the prediction dataset using sensor-provided vegetation indices and genetic, environmental, and management information based on the RFR models are shown in Figure 2.
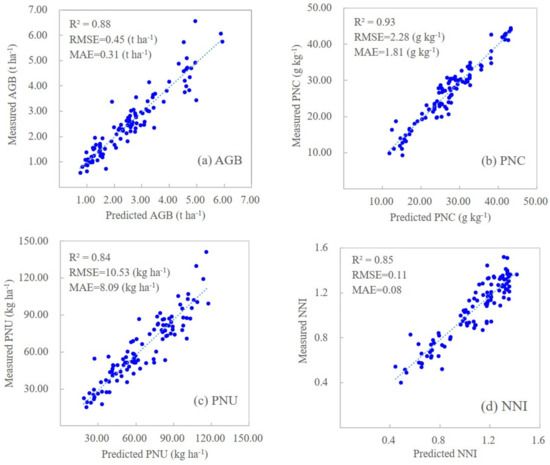
Figure 2.
Scatterplots of measured and predicted corn N indicators for prediction dataset (n = 104) based on random forest regression models using NDVI and NDRE together with genetic, environmental (soil and climatic) and management variables for predicting aboveground biomass (a), plant N concentration (b), plant N uptake (c), and N nutrition index (d).
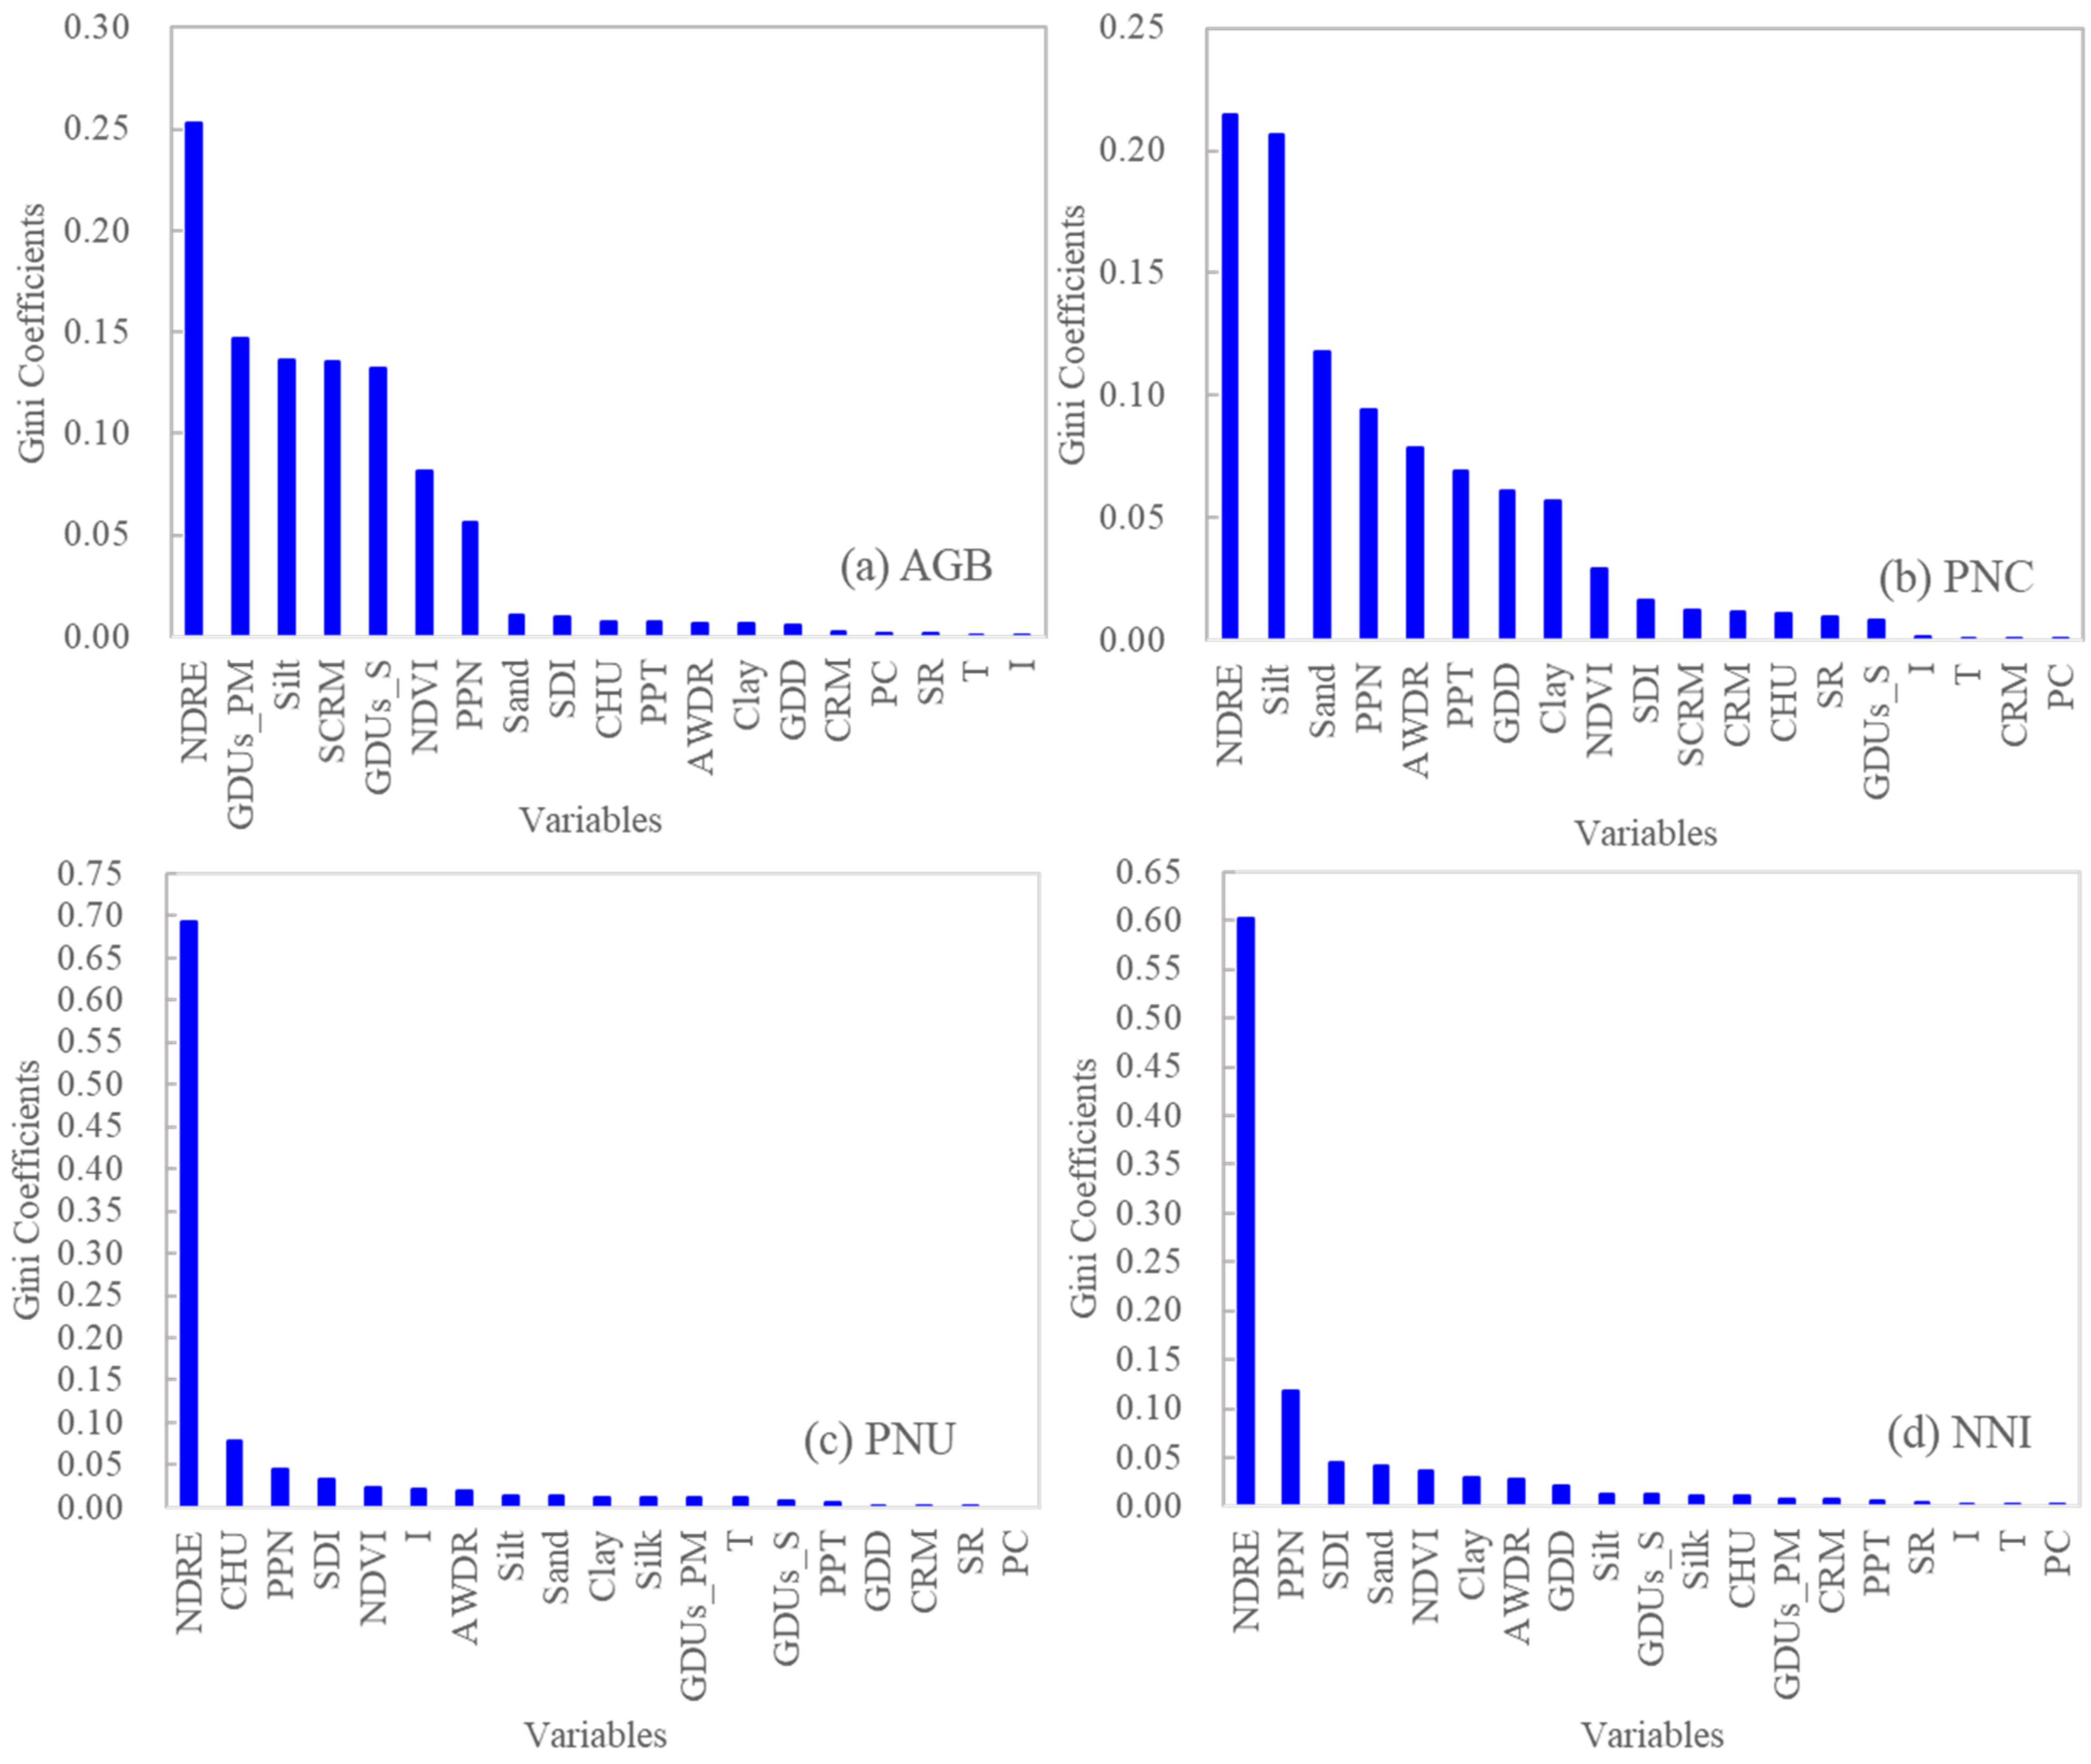
For RFR models, the Gini coefficient analysis showed that NDRE was consistently the most important variable for predicting all four N status indicators (Figure 3). For AGB, the second, third, and fourth important variables were all related to hybrid differences (GDUs, silk comparative relative maturity, and GDUs to silk), followed by silt, NDVI, and preplant N rate, with Gini coefficients ≥0.05. For PNC, silt, sand, preplant N rate, and AWDR were the most important variables, followed by cumulative precipitation, GDD and clay content (with Gini coefficients ≥0.05). For PNU, NDRE and CHU were the two most important variables. For NNI, NDRE and preplant N rate were the main factors.
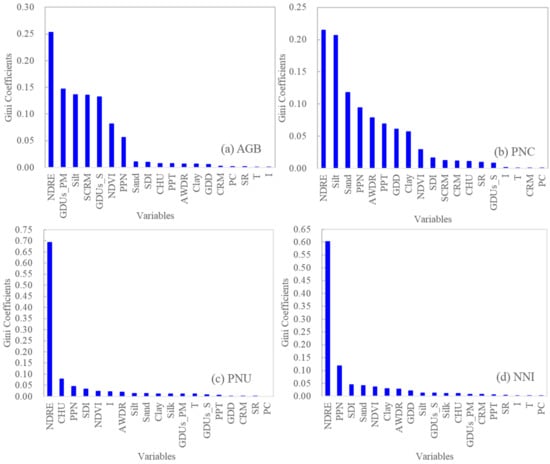
Figure 3.
Relative importance represented by Gini coefficients of different input variables used in the random forest regression models using sensor-provided vegetation indices (NDVI and NDRE) and genetic, environmental, and management variables for predicting aboveground biomass (AGB) (a), plant N concentration (PNC) (b), plant N uptake (PNU) (c), and N nutrition index (NNI) (d). Note: NDRE: normalized difference red edge. NDVI: normalized difference vegetation index. CRM: comparative relative maturity. SCRM: silk comparative relative maturity. GDUs_S: growing degree units to silk. GDUs_PM: growing degree units to physiological maturity. PPT: total precipitation from planting to sensing. SDI: Shannon diversity index. AWDR: abundant and well-distributed rainfall. CHU: corn heat units. GDD: growing degree days. PPN: preplant N rate. I: irrigation. T: tillage. SR: seeding rate. PC: previous crop.
Previous crop, irrigation, and seeding rate were consistently unimportant for all four N status indicators.
3.4. Accuracy of N Status Diagnosis
The machine learning models using NDVI and NDRE together with genetic, environmental, and management information had the overall accuracy of 67–87% (Table 8), with the RFR model performing better than the SVR model.
Table 8.
Corn N status diagnostic results based on the predicted N nutrition index (NNI) using support vector regression (SVR) and random forest regression (RFR) with NDRE, NDVI plus genetic, environmental, and management data for the prediction dataset (n = 104).
4. Discussion
4.1. The Importance of Using Multi-Source Data Fusion for In-Season Corn N Status Prediction
While the RapidSCAN sensor has NDVI and NDRE as sensor-provided vegetation indices, NDRE was consistently identified as the more important variable for in-season N status prediction. This is consistent with what others have reported [14,15,16]. However, some researchers also found that NDVI performed similarly to or slightly better than NDRE for predicting crop AGB, NNI, or yield [15,43,44]. Typically, NDVI performs well at predicting AGB and PNU during the early growth stages before canopy closure, but at moderate to high biomass, the near-infrared reflectance can continue to increase with biomass, while the red reflectance does not change much with biomass. The result is that the NDVI becomes saturated with canopy closure [14]. This is mainly because visible light has low transmittance through leaves and is only influenced by the top layers of the crop canopy, especially after canopy closure, while the near-infrared light has higher transmittance through leaves and can penetrate deeper into the crop canopy [45,46]. In contrast, red edge and near-infrared bands penetrate the crop canopy similarly, so vegetation indices using these bands (e.g., NDRE) can better overcome the saturation problem, and red edge-based vegetation indices have been found to perform better than the NDVI at later growth stages for predicting crop yield, biomass, leaf area index, PNU, etc. [14,16]. While we found NDRE to be more consistent, it was advantageous to include both vegetation indices in the prediction models for them to function across diverse conditions (e.g., differences in crop heights and canopy closure).
When genetic, environmental, and management information was combined with vegetation indices, 74% or more of the variability in corn N status indicators could be predicted. This was true for both the calibration and prediction datasets, either using the SVR or RFR method. The RFR-based NNI prediction model performed the best, with the overall diagnostic accuracy being 87%, and the kappa statistics being 0.75. This result was better than most of the results reported by other researchers for small plot research using GreenSeeker sensor information on corn (kappa values of 0.36–0.66) [11], RapidSCAN on rice (kappa values of 0.14–0.56) [16], the Crop Circle Phenom sensor on corn (kappa values of 0.22–0.54) [15], and canopy fluorescence sensor Multiplex 3 on rice (kappa values of 0.23–0.84) [47]. These results were all based on small plot experiments at the same site with similar soil and climatic conditions. In a study using unmanned aerial vehicle (UAV) remote sensing to diagnose wheat N status across different fields with variable hybrids, soils, and management practices in a village, the kappa statistics were only 0.28 to 0.37 [23].
Compared with previous research, this study was unique in that it incorporated different hybrids, soils, climatic conditions, and management practices across a wide geographic region (four US Midwest states). All these results demonstrated the importance of combining genetic, environmental, and management information with crop sensing data for in-season prediction and the diagnosis of crop N status.
4.2. Important Factors for N Indicator Estimation
The amount of fertilizer N applied at planting was identified as the second most important factor for predicting NNI, the third for predicting PNC, the fourth for PNU, and the seventh for predicting AGB in this study. The preplant N rate varied from 0 to 315 kg N ha−1 in this study, which can significantly influence corn N status. This result was supported by a previous study which indicated that the preplant N rate was the most important input variable based on extreme gradient boosting models incorporating Crop Circle Phenom sensor data and management data for predicting corn PNC, PNU, and NNI [15]. The preplant N rate may be less important for a specific commercial field if a uniform preplant N fertilizer rate was applied across the field. However, preplant N fertilizer rates can vary from field to field, and within a commercial field if variable-rate N was applied before planting. Therefore, it will be important for the models predicting crop N status to include preplant N rate information. Such data can be easily obtained from as-applied data.
Soil texture can affect soil water flow, soil organic matter N mineralization, nutrient dynamics, and N availability [48]. It has been found that soil texture has a dominant effect on corn response to N application, with a greater response in fine-textured soils than in medium-textured soils [49]. This study used the percentages of clay, silt, and sand content to represent soil texture to make it easier to incorporate soil texture information in machine learning models. This study indicated all three soil texture variables were among the top 10 important variables for predicting PNC, PNU, and NNI. It has been found that active canopy sensor-based in-season N recommendations were improved similarly when adjusted using either measured or Soil Survey Geographic database (SSURGO) soil texture data (clay content) [26]. Soil texture data can be easily retrieved from the SSURGO database, making it very practical to include such data in N status prediction models.
Weather conditions during the growing season, especially rainfall patterns and temperature accumulation, can influence soil biological activity, soil organic matter decomposition, mineralization, soil N supply and losses, and therefore crop N status and growth [50,51,52]. The Shannon diversity index was identified as the most important climatic variable for predicting both PNU and NNI, while abundant and well-distributed rainfall and total precipitation were identified as the most important climatic variables for predicting PNC and AGB, respectively. High rainfall can cause significant N losses, and thus lead to higher responses to N fertilization; the influence can vary depending on the distribution of rainfall, represented by both the Shannon diversity index and the abundant and well-distributed rainfall measure [50]. Crop growth and development also depends on temperature, with faster growth under warmer conditions and no growth beyond a threshold temperature [51]. The GDD variable has been used to predict crop phenological stages [51], N release from crop residues and amendments [52], and grain yield [53]. It can also guide in-season N, irrigation, and pesticide management [54]. Higher heat accumulation can cause a higher rate of N mineralization and more N volatilization, crop growth, and PNU, and as a result, higher CHU can lead to greater responses to N fertilization [51]. Temperature was comparatively less important than rainfall patterns in this study, with CHU being important for predicting PNU and NNI, and GDD important for PNC and AGB. We conclude that it is important to include these variables to better indicate the timing of in-season sensor data collection and reflect the temperature situation of each site-year [20,54].
Corn hybrids differ in growth, yield components, responses to N fertilization, N uptake efficiency, and N use efficiency [55,56,57,58]. Corn hybrids have different abilities to maintain yield under N or water stress, and hybrid differences can account for one third of grain N concentration variation [5], but it is difficult to account for hybrid differences due to the large number of hybrids on the market [5,58,59]. In this study, we used comparative relative maturity, silk comparative relative maturity, growing degree units to silk, and growing degree units to physiological maturity to represent hybrid differences. Corn hybrid comparative relative maturity ratings are based on hybrid comparisons with maturity checks from grain harvest moisture level and at flowering stage [60]. This gives growers a “relative” idea of how hybrids from the same company will advance through the different reproductive stages (e.g., flowering, grain filling and maturity, etc.) [60]. The results of this study indicated that hybrid information was most important for AGB prediction, with growing degree units to physiological maturity, silk comparative relative maturity, and growing degree units to silk being the second, third, and fourth most important variables, respectively. For other N status indicators, hybrid-related variables were not ranked among the top 10 important variables. In general, comparative relative maturity was less important than other hybrid-related variables. The hybrid data are not provided by all seed companies and are not comparable between companies. It will be important for seed companies to provide such data, derived using the same methodology, for hybrid data to be practically used for N status prediction and improved N management.
Tillage was relatively more important for predicting AGB and PNU than for PNC and NNI. Previous studies indicated that more N fertilizer will be needed in no-till or minimum tillage systems to produce the same level of corn grain yield as conventional tillage systems [61,62,63]. Edalat et al. [63] found that corn leaf N concentrations were significantly higher in minimum tillage systems than in conventional tillage systems, possibly caused by higher water use efficiency or a dilution effect. In addition, NDVI values were found to be higher in conventional tillage plots than in minimum tillage plots, possibly due to differences in plant N nutrition and/or soil conditions [63]. More studies are needed to further evaluate the importance of including tillage information in the prediction models.
In general, the information on previous crop, irrigation, and seeding rate was not important for predicting any of the N status indicators. Others found that in rainfed agriculture, N supply from chemical fertilizers or the legume N of the previous crop can be similar, while the results can be different in irrigated agriculture [64]. The seeding rate is an important factor influencing corn yield because it influences stalk diameter, intercepted photosynthetically active radiation, leaf area index, and lodging, etc. [65]. Yet at times, corn PNC, AGB, and grain yield may not be affected by the seeding rate [66]. The seeding rate in this study had a narrow range (80,000 to 90,000 seeds ha−1), all recommended to be in the optimal range for these growing conditions. Irrigation can be an important factor influencing corn yield and responses to N fertilizers in dry areas [67]. However, in this study, irrigation was only used for sites with sandy soils, and the site-years that did not receive irrigation had enough precipitation so that water stress during the growing season was minimal. Thus, irrigation information in this study was not identified as important. Removing the irrigation information from the data did not change the performance of the models for predicting PNC and NNI (data not shown). However, since these data are easily available, keeping them in the models is advisable to make them more stable when they are applied across diverse conditions that include both rainfed and irrigated fields.
Although more detailed soil data are available in this study and can further improve the performance of the models, only variables typically used and easily available to farmers were included to make the models practical, and the results are very encouraging.
4.3. Model Selection
The RFR algorithm is a non-parametric statistical technique consisting of a combination of trees. Each tree is generated by bootstrap samples, leaving about one third of the overall sample for prediction. Each split of the tree is determined using a randomized subset of the predictors at each node. The final outcome is the average of the results of all the trees [68]. The random forest is capable of synthesizing regression functions based on discrete or continuous datasets and has the ability to deal with complex relationships between predictors due to the noise and large amount of data [68]. It has been reported that RFR can handle high data dimensionality and multicollinearity and is fast and insensitive to over-fitting [69].
The SVR algorithm is a nonlinear novel small sample learning method with a proven theoretical foundation, and the final decision function is determined by only a few support vectors [70]. The computational complexity depends on the number of support vectors, rather than the dimension of the sample space. This not only helps capture key samples and cull many redundant samples, but also makes the algorithm simple and robust [70]. In this study, SVR model performance was quite stable, with smaller differences between calibration and prediction results than the RFR model.
Feature selection and relevance can benefit the performance and interpretation of machine learning algorithms. Rogers and Gunn [71] indicated that the lack of implicit features within RFR had an adverse effect on the accuracy and efficiency of the algorithm. The randomization in both bagging samples and feature selection can cause the trees in the forest to select uninformative features for node splitting, especially in high-dimensional data [71,72]. The main cause is that, in growing a tree from the bagged sample data, the subspace of features randomly sampled from thousands of features to split a node of the tree is often dominated by uninformative features (or noise), and the tree grown from such a bagged subspace of features will have a low prediction accuracy with RFR models [72]. The SVR algorithm based on the structural risk minimization principle can minimize the expected error of learning and reduce the problem of over-fitting. Therefore, the selection of models is problem dependent. The results of this study indicated that, with limited input variables and a small dataset, the SVR models were more stable. When multi-source data are used, the differences between SVR and RFR were reduced compared with using sensor-provided vegetation indices alone, and the RFR models were preferred.
In summary, this study highlighted the importance of combining genetic, environmental, and management data with crop sensing data using machine learning models to predict and diagnose corn N status during the growing season across diverse growing and management conditions. This information can help growers to make in-season side-dress N application decisions [12,13,30]. More data need to be collected to evaluate more advanced machine learning algorithms to determine the potential to further improve in-season crop N status prediction and diagnosis across diverse on-farm conditions, such as deep learning models [73,74] and ensembles of models [75]. At the same time, studies are also needed to evaluate the potential of developing simpler models using fewer variables while retaining comparable performance for practical applications.
5. Conclusions
This study evaluated the potential of using machine learning methods to integrate easily available genetic, environmental, and management information with active canopy sensing data for corn N status prediction and diagnosis across 13 site-year environmental conditions. When genetic, environmental, and management information was used together with the RapidSCAN sensor data, corn AGB, PNC, PNU, and NNI could be reliably predicted (R2 > 0.80) either using SVR or RFR models. It is concluded that incorporating genetic, environmental, and management information with crop sensing data will provide more reliable in-season corn N status prediction and diagnosis across diverse conditions than using canopy sensor data alone. The NDRE index was consistently the most important variable for predicting all four corn N status indicators. The preplant N rate was the second, third, fourth, and seventh important variable for predicting NNI, PNU, PNC, and AGB, respectively. Hybrid difference and soil texture information was more important for AGB prediction, while soil texture and weather variables were more important for PNC and NNI predictions. For PNU prediction, weather variables (CHU and SDI) were more important than other variables. Further studies are needed to evaluate the potential of multi-source data fusion strategies for on-farm, in-season N status diagnosis using large datasets from commercial farms and more advanced machine learning methods. Additional effort is needed to develop simpler models using less easily obtainable variables that have comparable performances for practical on-farm applications.
Author Contributions
Y.M. and D.L. conceptualized and designed the research, D.L. performed the data analysis, Y.M. interpreted the results, D.L. and Y.M. wrote the original manuscript. C.J.R., N.R.K., G.M.B., F.G.F., J.J.C., P.R.C., R.B.F., D.W.F., C.A.M.L., E.D.N., J.E.S. and J.F.S. conceptualized and designed the field experiments, coordinated the data collection, and reviewed and revised the manuscript. All authors have read and agreed to the published version of the manuscript.
Funding
The field research and data collection was supported by Corteva Agriscience, and the data analysis and paper writing was funded by Guangdong Province Agricultural Science and Technology Innovation and Promotion Project (2021KJ102), GDAS’ Project of Science and Technology Development (2020GDASYL-20200302001), Minnesota Department of Agriculture/Agricultural Fertilizer Research and Education Council (AFREC) (R2019-20, R2020-32, R2021-32), the Minnesota Robotics Institute Seed Grant (MNR-12), and the USDA National Institute of Food and Agriculture (State project 1016571).
Institutional Review Board Statement
Not applicable.
Informed Consent Statement
Informed consent was obtained from all subjects involved in the study.
Data Availability Statement
The data presented in this study are available on request from the corresponding author. The data can also be obtained from the Dryad repository: https://doi.org/10.5061/dryad.66t1g1k2g (accessed on 11 December 2021).
Conflicts of Interest
The authors declare no conflict of interest.
Abbreviations
| AGB | aboveground biomass |
| AWDR | abundant and well-distributed rainfall |
| CHU | corn heat units |
| CRM | comparative relative maturity |
| DVI | difference vegetation index |
| GDD | growing degree days |
| GDUs | growing degree units |
| GDUs_S | GDUs to silk |
| GDUs_PM | GDUs to physiological maturity |
| MACC | Maccioni index |
| MAE | mean absolute error |
| N | Nitrogen |
| NDVI | normalized difference vegetation index |
| NDRE | normalized difference red edge |
| NNI | nitrogen nutrition index |
| PNC | plant nitrogen concentration |
| PNU | plant nitrogen uptake |
| PPT | total precipitation |
| R2 | coefficient of determination |
| RERI | red edge relative index |
| RFR | random forest regression |
| RMSE | root mean square error |
| SCRM | silk comparative relative maturity |
| SDI | Shannon diversity index |
| SRI | simple ratio index |
| SVR | support vector regression |
References
- Zhang, X.; Davidson, E.A.; Mauzerall, D.L.; Searchinger, T.D.; Dumas, P.; Shen, Y. Managing nitrogen for sustainable development. Nature 2015, 528, 51–59. [Google Scholar] [CrossRef] [PubMed] [Green Version]
- Cao, Q.; Miao, Y.; Feng, G.; Gao, X.; Liu, B.; Liu, Y.; Li, F.; Khosla, R.; Mulla, D.J.; Zhang, F. Improving nitrogen use efficiency with minimal environmental risks using an active canopy sensor in a wheat-maize cropping system. Field Crops Res. 2017, 214, 365–372. [Google Scholar] [CrossRef]
- Yu, C.; Huang, X.; Chen, H.; Godfray, H.C.J.; Wright, J.S.; Hall, J.W.; Gong, P.; Ni, S.; Qiao, S.; Huang, G.; et al. Managing nitrogen to restore water quality in China. Nature 2019, 567, 516–520. [Google Scholar] [CrossRef] [PubMed]
- Miao, Y.; Mulla, D.J.; Hernandez, J.A.; Wiebers, M.; Robert, P.C. Potential impact of precision nitrogen management on corn yield, protein content, and test weight. Soil Sci. Soc. Am. J. 2007, 71, 1490–1499. [Google Scholar] [CrossRef]
- Tenorio, F.A.M.; Eagle, A.J.; McLellan, E.L.; Cassman, K.G.; Howard, R.; Below, F.E.; Clay, D.E.; Coulter, J.A.; Geyer, A.B.; Joos, D.K.; et al. Assessing variation in maize grain nitrogen concentration and its implications for estimating nitrogen balance in the US North Central region. Field Crops Res. 2019, 240, 185–193. [Google Scholar] [CrossRef] [Green Version]
- Lemaire, G.; Jeuffroy, M.-H.; Gastal, F. Diagnosis tool for plant and crop N status in vegetative stage: Theory and practices for crop N management. Eur. J. Agron. 2008, 28, 614–624. [Google Scholar] [CrossRef]
- Plénet, D.; Lemaire, G. Relationships between dynamics of nitrogen uptake and dry matter accumulation in maize crops. Determination of critical N concentration. Plant Soil 1999, 216, 65–82. [Google Scholar] [CrossRef]
- Justes, E.; Mary, B.; Meynard, J.M.; Machet, J.M.; Thelier-Huche, L. Determination of a critical nitrogen dilution curve for winter wheat crops. Ann. Bot. 1994, 74, 397–407. [Google Scholar] [CrossRef]
- Huang, S.; Miao, Y.; Cao, Q.; Yao, Y.; Zhao, G.; Yu, W.; Shen, J.; Yu, K.; Bareth, G. A new critical nitrogen dilution curve for rice nitrogen status diagnosis in Northeast China. Pedosphere 2018, 28, 814–822. [Google Scholar] [CrossRef]
- Giletto, C.M.; Reussi Calvo, N.I.; Sandaña, P.; Echeverría, H.E.; Bélanger, G. Shoot- and tuber-based critical nitrogen dilution curves for the prediction of the N status in potato. Eur. J. Agron. 2020, 119, 126114. [Google Scholar] [CrossRef]
- Xia, T.; Miao, Y.; Wu, D.; Shao, H.; Khosla, R.; Mi, G. Active optical sensing of spring maize for in-season diagnosis of nitrogen status based on nitrogen nutrition index. Remote Sens. 2016, 8, 605. [Google Scholar] [CrossRef] [Green Version]
- Zhang, K.; Yuan, Z.; Yang, T.; Lu, Z.; Cao, Q.; Tian, Y.; Zhu, Y.; Cao, W.; Liu, X. Chlorophyll meter-based nitrogen fertilizer optimization algorithm and nitrogen nutrition index for in-season fertilization of paddy rice. Agron. J. 2020, 112, 288–300. [Google Scholar] [CrossRef]
- Cilia, C.; Panigada, C.; Rossini, M.; Meroni, M.; Busetto, L.; Amaducci, S.; Boschetti, M.; Picchi, V.; Colombo, R. Nitrogen status assessment for variable rate fertilization in maize through hyperspectral imagery. Remote Sens. 2014, 6, 6549–6565. [Google Scholar] [CrossRef] [Green Version]
- Cao, Q.; Miao, Y.; Feng, G.; Gao, X.; Li, F.; Liu, B.; Yue, S.; Cheng, S.; Ustin, S.L.; Khosla, R. Active canopy sensing of winter wheat nitrogen status: An evaluation of two sensor systems. Comput. Electron. Agric. 2015, 112, 54–67. [Google Scholar] [CrossRef]
- Cummings, C.; Miao, Y.; Paiao, G.D.; Kang, S.; Fernández, F.G. Corn nitrogen status diagnosis with an innovative multi-parameter Crop Circle Phenom sensing system. Remote Sens. 2021, 13, 401. [Google Scholar] [CrossRef]
- Lu, J.; Miao, Y.; Shi, W.; Li, J.; Yuan, F. Evaluating different approaches to non-destructive nitrogen status diagnosis of rice using portable RapidSCAN active canopy sensor. Sci. Rep. 2017, 7, 14073. [Google Scholar] [CrossRef] [PubMed]
- Prado Osco, L.; Marques Ramos, A.P.; Roberto Pereira, D.; Akemi Saito Moriya, É.; Nobuhiro Imai, N.; Takashi Matsubara, E.; Estrabis, N.; De Souza, M.; Marcato Junior, J.; Gonçalves, W.N.; et al. Predicting canopy nitrogen content in citrus-trees using random forest algorithm associated to spectral vegetation indices from UAV-imagery. Remote Sens. 2019, 11, 2925. [Google Scholar] [CrossRef] [Green Version]
- Zha, H.; Miao, Y.; Wang, T.; Li, Y.; Zhang, J.; Sun, W.; Feng, Z.; Kusnierek, K. Improving unmanned aerial vehicle remote sensing-based rice nitrogen nutrition index prediction with machine learning. Remote Sens. 2020, 12, 215. [Google Scholar] [CrossRef] [Green Version]
- Yao, X.; Huang, Y.; Shang, G.; Zhou, C.; Cheng, T.; Tian, Y.; Cao, W.; Zhu, Y. Evaluation of six algorithms to monitor wheat leaf nitrogen concentration. Remote Sens. 2015, 7, 14939–14966. [Google Scholar] [CrossRef] [Green Version]
- Raun, W.R.; Solie, J.B.; Stone, M.L.; Martin, K.L.; Freeman, K.W.; Mullen, R.W.; Zhang, H.; Schepers, J.S.; Johnson, G.V. Optical sensor-based algorithm for crop nitrogen fertilization. Commun. Soil Sci. Plant. Anal. 2005, 36, 2759–2781. [Google Scholar] [CrossRef] [Green Version]
- Samborski, S.M.; Tremblay, N.; Fallon, E. Strategies to make use of plant sensors-based diagnostic information for nitrogen recommendations. Agron. J. 2009, 101, 800–816. [Google Scholar] [CrossRef]
- Holland, K.H.; Schepers, J.S. Use of a virtual-reference concept to interpret active crop canopy sensor data. Precis. Agric. 2013, 14, 71–85. [Google Scholar] [CrossRef]
- Chen, Z.; Miao, Y.; Lu, J.; Zhou, L.; Li, Y.; Zhang, H.; Lou, W.; Zhang, Z.; Kusnierek, K.; Liu, C. In-season diagnosis of winter wheat nitrogen status in smallholder farmer fields across a village using unmanned aerial vehicle-based remote sensing. Agronomy 2019, 9, 619. [Google Scholar] [CrossRef] [Green Version]
- Roberts, D.C.; Brorsen, B.W.; Taylor, R.K.; Solie, J.B.; Raun, W.R. Replicability of nitrogen recommendations from ramped calibration strips in winter wheat. Precis. Agric. 2011, 12, 653–665. [Google Scholar] [CrossRef] [Green Version]
- Stanisław, M.S.; Dariusz, G.; Olga, S.W.; Peter, K.; Michał, S. Sensitivity of sensor-based nitrogen rates to selection of within-field calibration strips in winter wheat. Crop. Pasture Sci. 2017, 68, 101–114. [Google Scholar] [CrossRef]
- Bean, G.M.; Kitchen, N.R.; Camberato, J.J.; Ferguson, R.B.; Fernandez, F.G.; Franzen, D.W.; Laboski, C.A.M.; Nafziger, E.D.; Sawyer, J.E.; Scharf, P.C.; et al. Improving an active-optical reflectance sensor algorithm using soil and weather information. Agron. J. 2018, 110, 2541–2551. [Google Scholar] [CrossRef] [Green Version]
- Qin, Z.; Myers, D.B.; Ransom, C.J.; Kitchen, N.R.; Liang, S.-Z.; Camberato, J.J.; Carter, P.R.; Ferguson, R.B.; Fernandez, F.G.; Franzen, D.W.; et al. Application of machine learning methodologies for predicting corn economic optimal nitrogen rate. Agron. J. 2018, 110, 2596–2607. [Google Scholar] [CrossRef] [Green Version]
- Ransom, C.J.; Kitchen, N.R.; Camberato, J.J.; Carter, P.R.; Ferguson, R.B.; Fernández, F.G.; Franzen, D.W.; Laboski, C.A.M.; Myers, D.B.; Nafziger, E.D.; et al. Statistical and machine learning methods evaluated for incorporating soil and weather into corn nitrogen recommendations. Comput. Electron. Agric. 2019, 164, 104872. [Google Scholar] [CrossRef] [Green Version]
- Pullanagari, R.; Kereszturi, G.; Yule, I. Integrating airborne hyperspectral, topographic, and soil data for estimating pasture quality using recursive feature elimination with random forest regression. Remote Sens. 2018, 10, 1117. [Google Scholar] [CrossRef] [Green Version]
- Wang, X.; Miao, Y.; Dong, R.; Zha, H.; Xia, T.; Chen, Z.; Kusnierek, K.; Mi, G.; Sun, H.; Li, M. Machine learning-based in-season nitrogen status diagnosis and side-dress nitrogen recommendation for corn. Eur. J. Agron. 2021, 123, 126193. [Google Scholar] [CrossRef]
- Kitchen, N.R.; Shanahan, J.F.; Ransom, C.J.; Bandura, C.J.; Bean, G.M.; Camberato, J.J.; Carter, P.R.; Clark, J.D.; Ferguson, R.B.; Fernández, F.G.; et al. A public–industry partnership for enhancing corn nitrogen research and datasets: Project description, methodology, and outcomes. Agron. J. 2017, 109, 2371–2389. [Google Scholar] [CrossRef] [Green Version]
- Abendroth, L.J.; Elmore, R.W.; Boyer, M.J.; Marley, S.K. Corn Growth and Development (Extension Publication PM 1009); Iowa State University Extension: Ames, IA, USA, 2011. [Google Scholar]
- Ransom, C.J.; Kitchen, N.R.; Camberato, J.J.; Carter, P.R.; Ferguson, R.B.; Fernández, F.G.; Franzen, D.W.; Laboski, C.A.; Nafziger, E.D.; Sawyer, J.E.; et al. Corn nitrogen rate recommendation tools’ performance across eight US Midwest corn belt states. Agron. J. 2020, 112, 470–492. [Google Scholar] [CrossRef] [Green Version]
- Rouse, J.W.; Haas, R.H.; Schell, J.A.; Deering, D.W. Monitoring vegetation systems in the Great Plains with ERTS. In Proceedings of the Third ERTS Symposium, Washington, DC, USA, 10–14 December 1973; NASA: Washington, DC, USA, 1973; pp. 309–317. [Google Scholar]
- Jordan, C.F. Derivation of leaf-area index from quality of light on the forest floor. Ecology 1969, 50, 663–666. [Google Scholar] [CrossRef]
- Gitelson, A.A.; Merzlyak, M.N.; Chivkunova, O.B. Optical properties and nondestructive estimation of anthocyanin content in plant leaves. Photochem. Photobiol. 2001, 74, 38–45. [Google Scholar] [CrossRef]
- Maccioni, A.; Agati, G.; Mazzinghi, P. New vegetation indices for remote measurement of chlorophylls based on leaf directional reflectance spectra. J. Photochem. Photobiol. B 2001, 61, 52–61. [Google Scholar] [CrossRef]
- Xu, M.; Liu, R.; Chen, J.M.; Liu, Y.; Shang, R.; Ju, W.; Wu, C.; Huang, W. Retrieving leaf chlorophyll content using a matrix-based vegetation index combination approach. Remote Sens. Environ. 2019, 224, 60–73. [Google Scholar] [CrossRef]
- Tremblay, N.; Bouroubi, Y.M.; Bélec, C.; Mullen, R.W.; Kitchen, N.R.; Thomason, W.E.; Ebelhar, S.; Mengel, D.B.; Raun, W.R.; Francis, D.D.; et al. Corn response to nitrogen is influenced by soil texture and weather. Agron. J. 2012, 104, 1658–1671. [Google Scholar] [CrossRef] [Green Version]
- Abraham, A.; Pedregosa, F.; Eickenberg, M.; Gervais, P.; Mueller, A.; Kossaifi, J.; Gramfort, A.; Thirion, B.; Varoquaux, G. Machine learning for neuroimaging with scikit-learn. Front. Neuroinform. 2014, 8, 14. [Google Scholar] [CrossRef] [Green Version]
- Pedregosa, F.; Varoquaux, G.; Gramfort, A.; Michel, V.; Thirion, B.; Grisel, O.; Blondel, M.; Prettenhofer, P.; Weiss, R.; Dubourg, V.; et al. Scikit-learn: Machine learning in Python. J. Mach. Learn. Res. 2011, 12, 2825–2830. [Google Scholar]
- Landis, J.R.; Koch, G.G. The measurement of observer agreement for categorical data. Biometrics 1977, 33, 159–174. [Google Scholar] [CrossRef] [Green Version]
- Aranguren, M.; Castellón, A.; Aizpurua, A. Crop sensor based non-destructive estimation of nitrogen nutritional status, yield, and grain protein content in wheat. Agriculture 2020, 10, 148. [Google Scholar] [CrossRef]
- Bonfil, D.J. Wheat phenomics in the field by RapidScan: NDVI vs. NDRE. Israel J. Plant Sci. 2017, 64, 41–54. [Google Scholar] [CrossRef]
- Niel, T.G.V.; McVicar, T.R. Current and potential uses of optical remote sensing in rice-based irrigation systems: A review. Aust. J. Agric. Res. 2004, 55, 155. [Google Scholar] [CrossRef]
- Knipling, E.B. Physical and physiological basis for the reflectance of visible and near-infrared radiation from vegetation. Remote Sens. Environ. 1970, 1, 155–159. [Google Scholar] [CrossRef]
- Huang, S.; Miao, Y.; Yuan, F.; Cao, Q.; Ye, H.; Lenz-Wiedemann, V.I.S.; Bareth, G. In-season diagnosis of rice nitrogen status using proximal fluorescence canopy sensor at different growth stages. Remote Sens. 2019, 11, 1847. [Google Scholar] [CrossRef] [Green Version]
- Rabot, E.; Wiesmeier, M.; Schlüter, S.; Vogel, H.J. Soil structure as an indicator of soil functions: A review. Geoderma 2018, 314, 122–137. [Google Scholar] [CrossRef]
- Bolinder, M.A.; Andrén, O.; Kätterer, T.; De Jong, R.; VandenBygaart, A.J.; Angers, D.A.; Parent, L.E.; Gregorich, E.G. Soil carbon dynamics in Canadian Agricultural Ecoregions: Quantifying climatic influence on soil biological activity. Agric. Ecosyst. Environ. 2007, 122, 461–470. [Google Scholar] [CrossRef]
- Shanahan, J.F.; Kitchen, N.R.; Raun, W.R.; Schepers, J.S. Responsive in-season nitrogen management for cereals. Comput. Electron. Agric. 2008, 61, 51–62. [Google Scholar] [CrossRef] [Green Version]
- Anandhi, A. Growing degree days—Ecosystem indicator for changing diurnal temperatures and their impact on corn growth stages in Kansas. Ecol. Indic. 2016, 61, 149–158. [Google Scholar] [CrossRef] [Green Version]
- Griffin, T.S.; Honeycutt, C.W. Using growing degree days to predict nitrogen availability from livestock manures. Soil Sci. Soc. Am. J. 2000, 64, 1876–1882. [Google Scholar] [CrossRef] [Green Version]
- Lu, H.Y.; Lu, C.T.; Chan, L.F.; Wei, M.L. Seasonal variation in linear increase of Taro harvest index explained by growing degree days. Agron. J. 2001, 93, 1136–1141. [Google Scholar] [CrossRef]
- Dhillon, J.S.; Figueiredo, B.M.; Eickhoff, E.M.; Raun, W.R. Applied use of growing degree days to refine optimum times for nitrogen stress sensing in winter wheat. Agron. J. 2020, 112, 537–549. [Google Scholar] [CrossRef] [Green Version]
- Khaliq, T.; Ahmad, A.; Hussain, A.; Ali, M.A. Maize hybrids response to nitrogen rates at multiple locations in semiarid environment. Pak. J. Bot. 2009, 41, 207–224. [Google Scholar]
- Dwyer, L.M.; Anderson, A.M.; Stewart, D.W.; Ma, B.L.; Tollenaar, M. Changes in maize hybrid photosynthetic response to leaf nitrogen, from pre-anthesis to grain fill. Agron. J. 1995, 87, 1221–1225. [Google Scholar] [CrossRef]
- D’Andrea, K.E.; Otegui, M.E.; Cirilo, A.G. Kernel number determination differs among maize hybrids in response to nitrogen. Field Crops Res. 2008, 105, 228–239. [Google Scholar] [CrossRef]
- Haegele, J.W.; Cook, K.A.; Nichols, D.M.; Below, F.E. Changes in nitrogen use traits associated with genetic improvement for grain yield of maize hybrids released in different decades. Crop Sci. 2013, 53, 1256–1268. [Google Scholar] [CrossRef] [Green Version]
- Assefa, Y.; Prasad, P.V.V.; Carter, P.; Hinds, M.; Bhalla, G.; Schon, R.; Jeschke, M.; Paszkiewicz, S.; Ciampitti, I.A. A new insight into corn yield: Trends from 1987 through 2015. Crop Sci. 2017, 57, 2799–2811. [Google Scholar] [CrossRef] [Green Version]
- Pioneer, C.A. Tips to Compare Corn Maturity. Available online: https://www.pioneer.com/us/agronomy/compare-corn-maturity.html (accessed on 11 December 2021).
- Archer, D.W.; Halvorson, A.D.; Reule, C.A. Economics of irrigated continuous corn under conventional-till and no-till in Northern Colorado. Agron. J. 2008, 100, 1166–1172. [Google Scholar] [CrossRef]
- Randall, G.W.; Bandel, V.A. Overview of nitrogen management for conservation tillage system: An overview. In Effect of Conservation Tillage on Groundwater Quality-Nitrate and Pesticides; Logan, T.J., Ed.; Lewis Publishers: Chelsea, MI, USA, 1987; pp. 39–64. [Google Scholar]
- Edalat, M.; Naderi, R.; Egan, T.P. Corn nitrogen management using NDVI and SPAD sensor-based data under conventional vs. reduced tillage systems. J. Plant Nutr. 2019, 42, 2310–2322. [Google Scholar] [CrossRef]
- Crews, T.E.; Peoples, M.B. Can the synchrony of nitrogen supply and crop demand be improved in legume and fertilizer-based agroecosystems? A review. Nutr. Cycl. Agroecosyst. 2005, 72, 101–120. [Google Scholar] [CrossRef]
- Van Roekel, R.J.; Coulter, J.A. Agronomic responses of corn to planting date and plant density. Agron. J. 2011, 103, 1414–1422. [Google Scholar] [CrossRef]
- Shapiro, C.A.; Wortmann, C.S. Corn response to nitrogen rate, row spacing, and plant density in Eastern Nebraska. Agron. J. 2006, 98, 529–535. [Google Scholar] [CrossRef] [Green Version]
- Lo, T.H.; Rudnick, D.R.; Krienke, B.T.; Heeren, D.M.; Ge, Y.; Shaver, T.M. Water effects on optical canopy sensing for late-season site-specific nitrogen management of maize. Comput. Electron. Agric. 2019, 162, 154–164. [Google Scholar] [CrossRef] [Green Version]
- Oliveira, S.; Oehler, F.; San-Miguel-Ayanz, J.; Camia, A.; Pereira, J.M.C. Modeling spatial patterns of fire occurrence in Mediterranean Europe using multiple regression and random forest. For. Ecol. Manag. 2012, 275, 117–129. [Google Scholar] [CrossRef]
- Belgiu, M.; Drăguţ, L. Random forest in remote sensing: A review of applications and future directions. ISPRS J. Photogramm. Remote Sens. 2016, 114, 24–31. [Google Scholar] [CrossRef]
- Mountrakis, G.; Im, J.; Ogole, C. Support vector machines in remote sensing: A review. ISPRS J. Photogramm. Remote Sens. 2011, 66, 247–259. [Google Scholar] [CrossRef]
- Rogers, J.; Gunn, S. Identifying Feature Relevance Using a Random Forest. In Subspace, Latent Structure and Feature Selection; Springer: Bohinj, Slovenia, 2006; pp. 173–184. [Google Scholar]
- Nguyen, T.T.; Huang, J.Z.; Nguyen, T.T. Unbiased feature selection in learning random forests for high-dimensional data. Sci. World J. 2015, 471371. [Google Scholar] [CrossRef]
- Ferentinos, K.P. Deep learning models for plant disease detection and diagnosis. Comput. Electron. Agric. 2018, 145, 311–318. [Google Scholar] [CrossRef]
- Saleem, M.H.; Potgieter, J.; Arif, K.M. Automation in agriculture by machine and deep learning techniques: A review of recent developments. Precis. Agric. 2021, 22, 2053–2091. [Google Scholar] [CrossRef]
- Feng, L.; Zhang, Z.; Ma, Y.; Du, Q.; Williams, P.; Drewry, J.; Luck, B. Alfalfa yield prediction using UAV-based hyperspectral imagery and ensemble learning. Remote Sens. 2020, 12, 2028. [Google Scholar] [CrossRef]

Publisher’s Note: MDPI stays neutral with regard to jurisdictional claims in published maps and institutional affiliations. |
© 2022 by the authors. Licensee MDPI, Basel, Switzerland. This article is an open access article distributed under the terms and conditions of the Creative Commons Attribution (CC BY) license (https://creativecommons.org/licenses/by/4.0/).