Article

Mapping Large-Scale Plateau Forest in Sanjiangyuan Using High-Resolution Satellite Imagery and Few-Shot Learning

1
Faculty of Information Technology, Beijing University of Technology, Beijing 100021, China
2
School of Earth and Space Sciences, Peking University, Beijing 100871, China
3
Beijing Laboratory of Advanced Information Network, Beijing 100021, China
4
Department of Computer Science, University of Pittsburgh, Pittsburgh, PA 15260, USA
5
Institute of Physics and Electronic Information Engineering, Qinghai Nationalities University, Xining 810007, China
6
Twenty First Century Aerospace Technology Co., Ltd., Beijing 100096, China
*
Author to whom correspondence should be addressed.
Remote Sens. 2022, 14(2), 388; https://doi.org/10.3390/rs14020388
Submission received: 6 December 2021 / Revised: 12 January 2022 / Accepted: 13 January 2022 / Published: 14 January 2022
(This article belongs to the Special Issue Advanced Earth Observations of Forest and Wetland Environment)

Abstract

:
Monitoring the extent of plateau forests has drawn much attention from governments given the fact that the plateau forests play a key role in global carbon circulation. Despite the recent advances in the remote-sensing applications of satellite imagery over large regions, accurate mapping of plateau forest remains challenging due to limited ground truth information and high uncertainties in their spatial distribution. In this paper, we aim to generate a better segmentation map for plateau forests using high-resolution satellite imagery with limited ground-truth data. We present the first 2 m spatial resolution large-scale plateau forest dataset of Sanjiangyuan National Nature Reserve, including 38,708 plateau forest imagery samples and 1187 handmade accurate plateau forest ground truth masks. We then propose an few-shot learning method for mapping plateau forests. The proposed method is conducted in two stages, including unsupervised feature extraction by leveraging domain knowledge, and model fine-tuning using limited ground truth data. The proposed few-shot learning method reached an F1-score of 84.23%, and outperformed the state-of-the-art object segmentation methods. The result proves the proposed few-shot learning model could help large-scale plateau forest monitoring. The dataset proposed in this paper will soon be available online for the public.

Graphical Abstract

1. Introduction

A plateau forest plays an important role in high altitude area carbon circulation and is therefore an important natural solution for mitigating global climate change [1]. Monitoring a plateau forest is able to help us better understand climate change influences at local, regional and global levels [2], and thus has drawn a lot of attention from governments and companies. Among all plateau forest areas in the world, Sanjiangyuan National Nature Reserve located in China has the highest altitude and the richest plateau forest communities, with a total area of 390,000 km2 [3].
High-resolution satellite imagery has recently become available for large-scale high-altitude plateau forest monitoring [4]. On the one hand, many object detection studies driven by satellite data are utilizing threshold-based vegetation indices [5], such as the normalized difference vegetation index (NDVI) first proposed in the 1990s [6] and ratio vegetation index (RVI) [7]. Many studies have been focusing on improving the threshold-based indices in recent decades. Wang et al. proposed a surface vegetation detection and trend analysis method based on Moderate-resolution Imaging Spectroradiometer normalized difference vegetation index (MODIS NDVI) and a digital elevation model (DEM) [8]. Hasegawa et al. proposed an improved NDVI method, called the normalized hotspot-signature vegetation index (NHVI), which could better estimate the quantitative of leaf area index (LAI) [9]. Chen et al. designed an improved NDVI-based land cover updating method by downscaling the NDVI based on a NDVI linear mixing growth model [10]. Gim et al. improved the change detection method based on NDVI of the Advanced Very High-Resolution Radiometers (AVHRRs) data [11]. Furthermore, regarding the forest mapping task, Martinuzzi et al. utilized the combined NDVI information to validate the status of tropical dry forest habitats; the combined NDVI information is generated from Landsat, topographic information, and high-resolution Ikonos imagery [12]. Singh et al. proposed an improved NDVI-based proxy leaf-fall indicator to analyse the rainfall sensitivity of deciduousness among the central Indian forests [13]. However, the reflectance characteristics depend on the surrounding environment in different regions, resulting in high dependence of the research regions [14]. On the other hand, the use of vegetation indices could lead to a similar representation between grass, forest and bush, thus the forest monitoring mission is a challenging task [15]. Also, a forest located in a different region could show different characteristics such as distribution density and different spectral characteristics among months and years, which require further study and research.
Traditional machine learning-based object detection method such as SVM [16], and random forest [17] have also been used in satellite data analysis. Bruzzone et al. proposed an transductive SVM method for satellite imagery based on the idea of semi-supervised classification [18]. Pal et al. designed a multi-class SVM model for multispectral and hyperspectral data classification [19]. Zheng et al. proposed a multiscale mapped least-squares support vector machine (LS-SVM) model for the panchromatic sharpening of the multispectral bands task [20]. Chi et al. improved the SVM based on alternative implementation technique, and applied the model on small size training data task [21]. Gislason et al. proposed an improved random forest model for multisource satellite data [22]. Canovas-Garcia et al. improved the random forest method toward remote sensing data classification task by overcoming the statistical dependence problems [23]. Moreover, Hayes et al. proposed a random forest structure for high-resolution satellite imagery classification, including forest detection for willow and aspen [24]. These models can learn vegetation patterns from multi-spectral data, but are limited in extracting complex non-linear relationships to distinguish between forests and their surrounding land covers [25,26].
Recently, there has been growing interest in using deep learning models such as fully convolutional neural networks (FCNN) [27] and UNET [28] for image segmentation. Jia et al. proposed a spatial context-aware network for land cover detection using remote-sensing imagery [29]. Pelletier et al. introduced a temporal convolutional neural network for satellite imagery classification [30]. Waldner et al. proposed a convolutional neural network structure for field boundary extraction within remote-sensing imagery [31]. Omer et al. introduced an artificial neural network-based tree mapping approach for endangered tree species monitoring, using WorldView-2 data [32]. The concept of a receptive field introduced by these models has significantly improved the deep learning structure performance by capturing the spatial relationship between each single pixel and its neighborhood [33] and non-linear relationships from multi-spectral data to land covers [34].
However, accurate mapping of the extent of plateau forest still remains challenging for several reasons [35]. Firstly, training machine learning models, especially deep learning models, commonly requires a large amount of ground-truth labeled information corresponding to the data [36,37]. However, in situ natural plateau forest distribution data are rarely available due to the heavy needs of manpower and material resources [38]. Secondly, traditional forest mapping methods cannot precisely map natural plateau forest due to the heterogeneous nature of its spatial distribution and the variability of its surrounding environments [39]. For example, Figure 1 shows three typical forest communities located in the Sanjiangyuan Nature Reserve. The image visualization is generated using ZY-3 satellite imagery, based on the red, green and blue band within the satellite data [40]. We can easily observe that forests in different regions have different densities, and they are also surrounded with many different types of land cover such as natural river, wetland, and mountain. Moreover, due to the limited quantity of the ground-truth data toward plateau forest over different spatial regions, it becomes even more difficult to capture the heterogeneous nature of plateau forests [41,42,43].
In this paper, we develop an few-shot learning based method for mapping plateau forests using limited ground-truth data. We first build a ZY-3 satellite imagery-based large-scale plateau forest dataset for Sanjiangyuan National Nature Reserve, with 38,708 image samples and 1187 manually delineated plateau forest labels. This is the first 2 m spatial resolution plateau forest mapping dataset in the region of Sanjiangyuan National Nature Reserve. Then we propose a few-shot plateau forest mapping method. In particular, we first pre-train the deep learning model using auxiliary domain knowledge in an unsupervised fashion. The idea is that the model can get much closer to its optimal state after the pre-training process, and thus require much fewer ground truth labeled data to refine itself to perform accurate mapping.
The rest of the paper is organized as follows. Section 2 describes the dataset and method. Section 3 discuss the results. Section 4 concludes this paper.

2. Materials and Methods

2.1. Study Area and Data

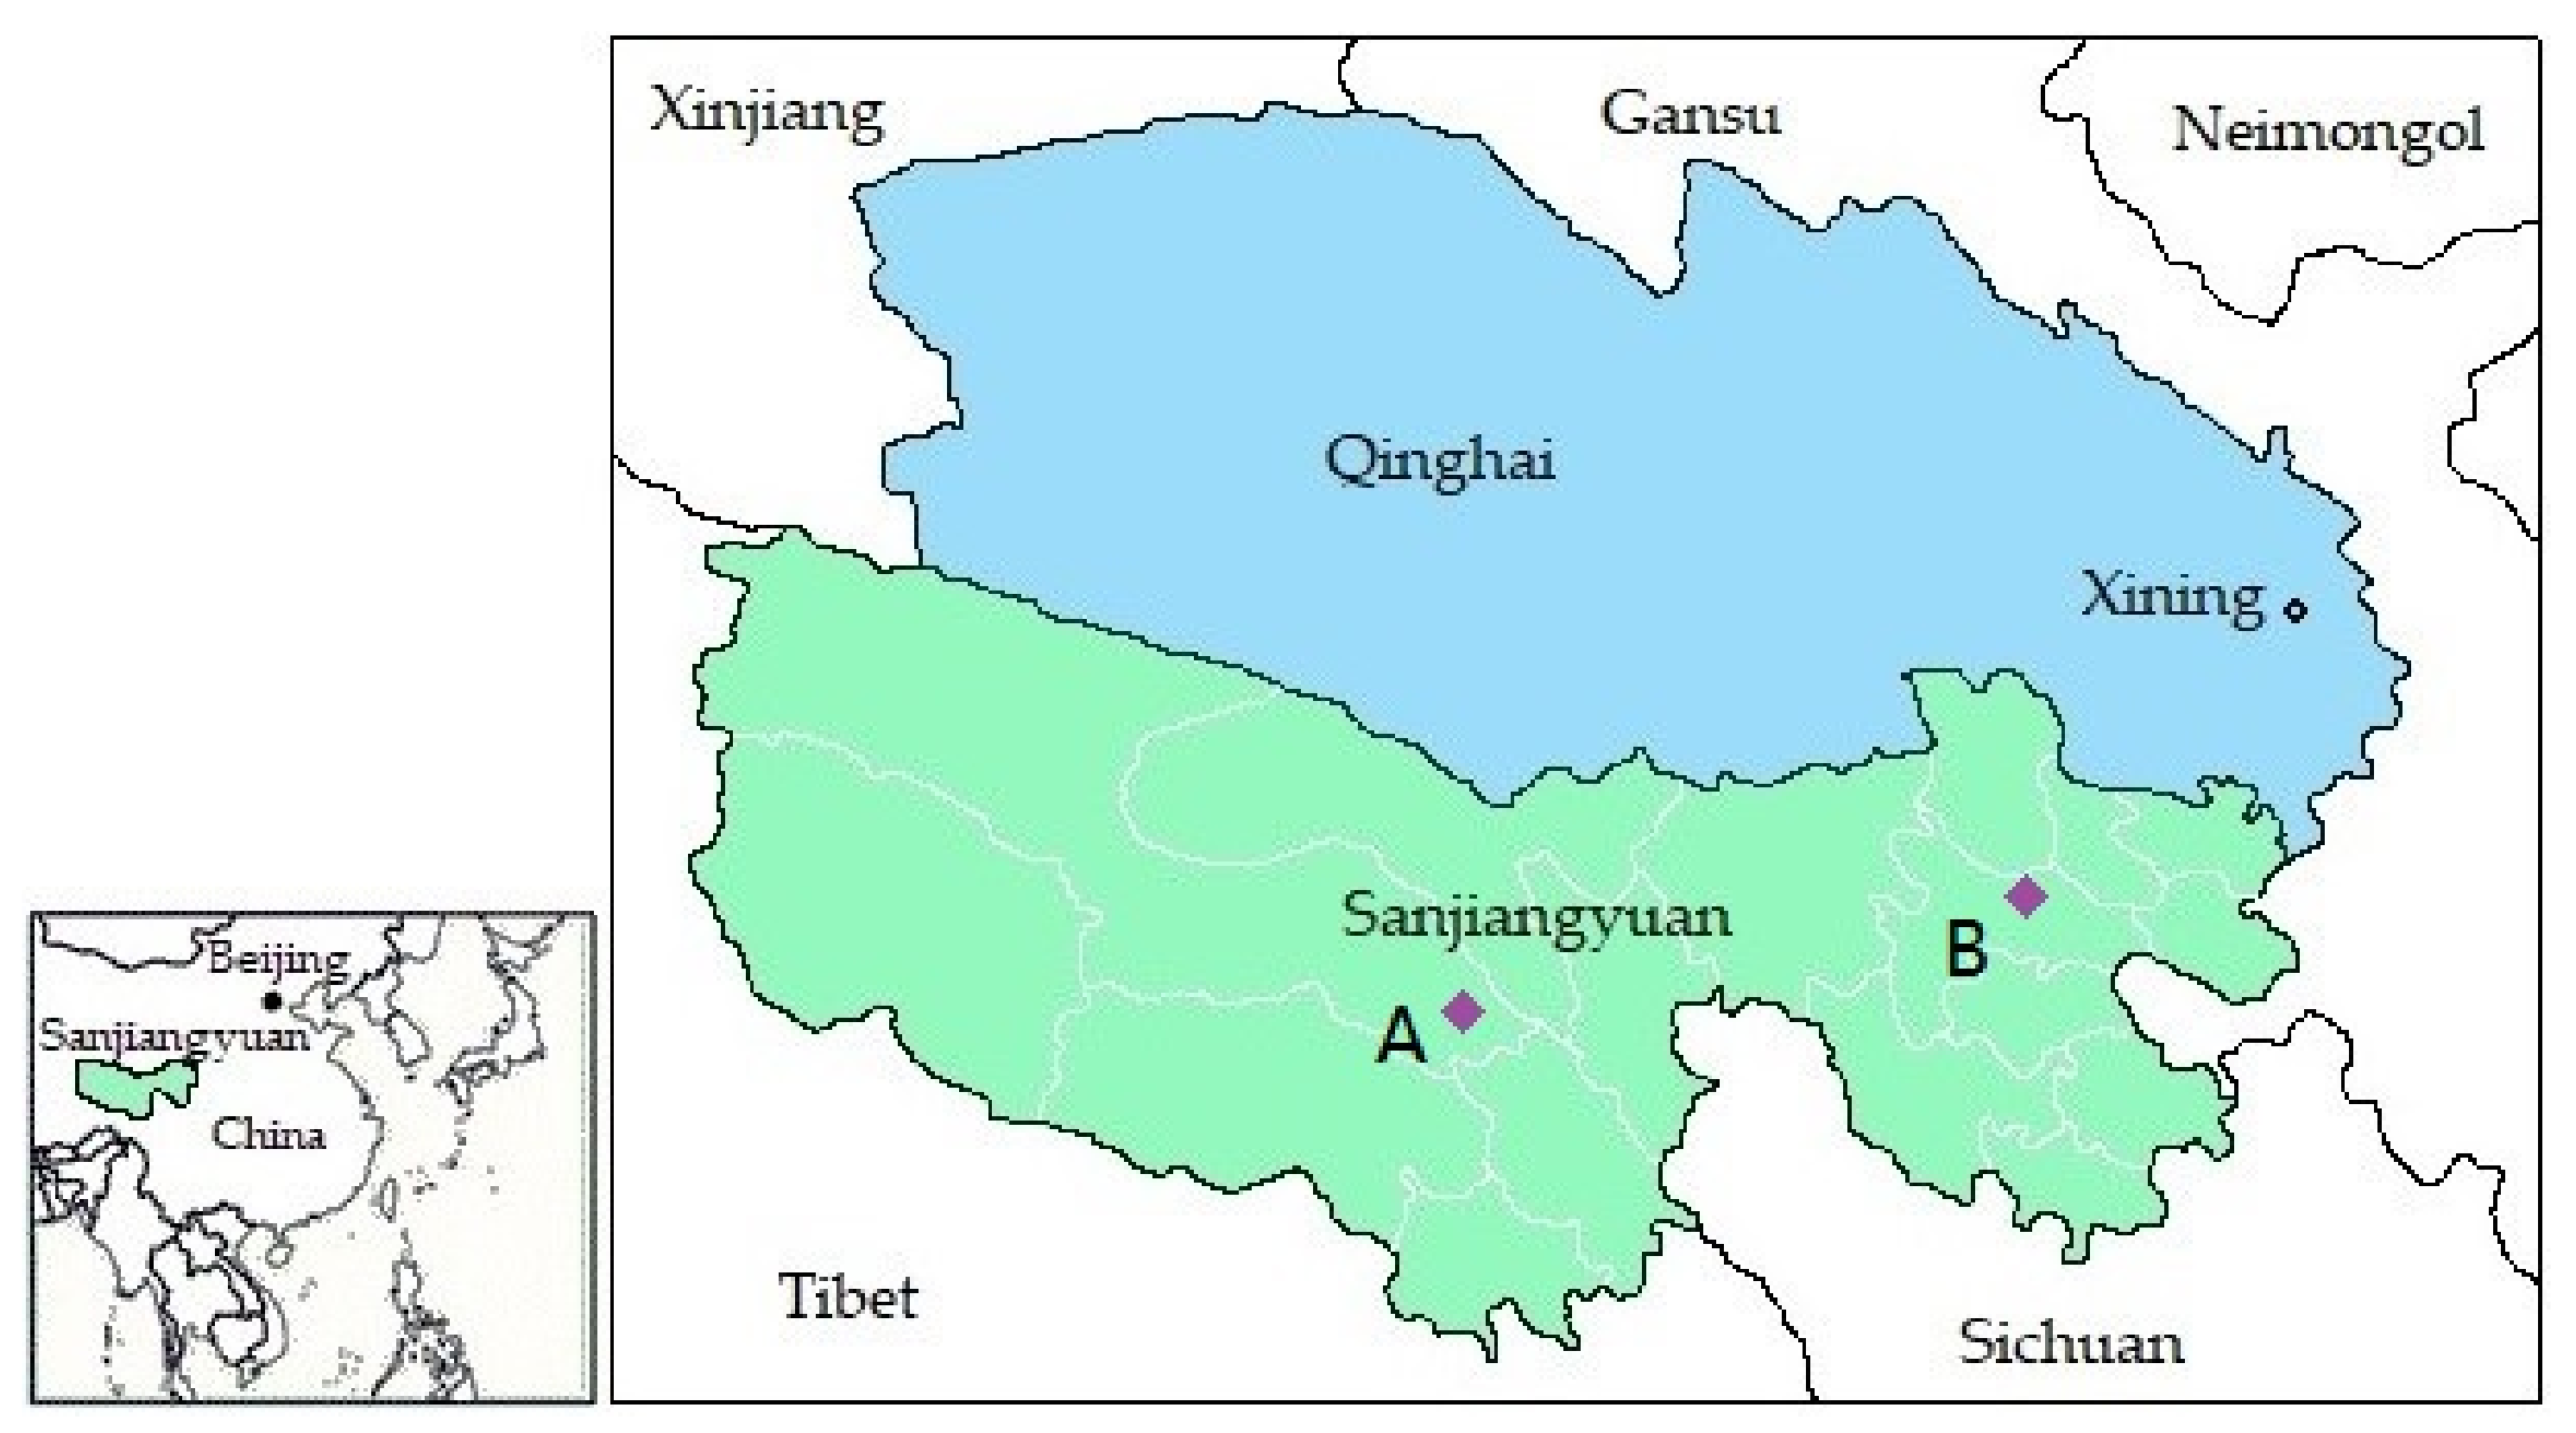
Our study area is the Sanjiangyuan National Nature Reserve located in the southern part of Qinghai Province, China. As shown in Figure 2, Sanjiangyuan region contains 18 sub-areas, and covers an area of 390,000 km2. Due to large scale forest monitoring challenges, in situ natural plateau forest distribution ground truth is extremely limited for the Sanjiangyuan region. Here, we present the first plateau forest accurate segmentation dataset toward Sanjiangyuan National Nature Reserve using 2 m spatial resolution ZY-3 satellite imagery.
Table 1 shows the detail information of the ZY-3 satellite data.
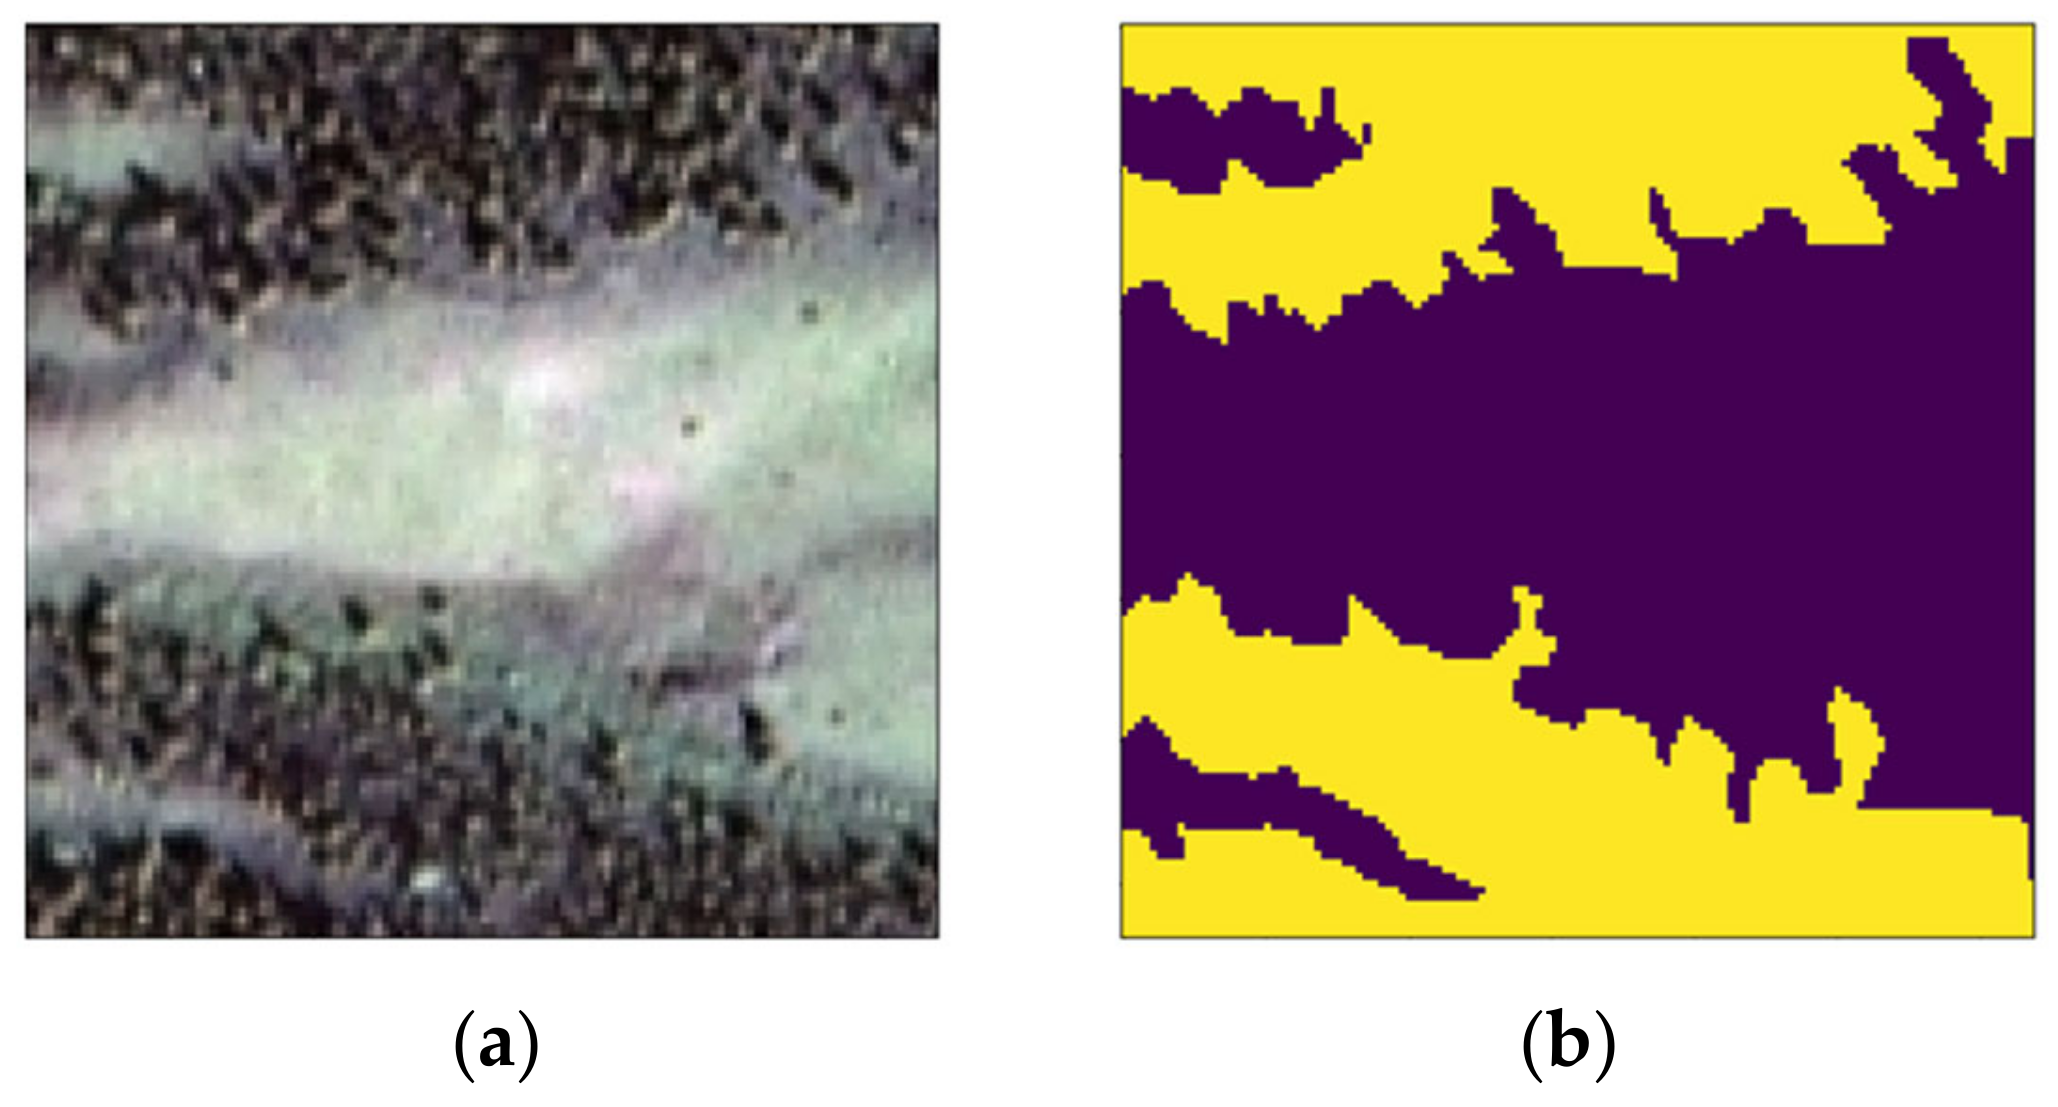
Details of the proposed dataset is shown in Table 2. In current version of the dataset, the satellite imageries are selected from two regions with rich type of the forest community. This could help the proposed dataset to include different types of forest distribution information. The proposed large-scale plateau forest dataset contains 38,708 ZY-3 plateau forest imagery samples of 128 × 128 pixels. Furthermore, in order to generate reasonable forest segmentation labels, we spent several months manually labeling the forest imagery samples in the false color style, using a dataset visualization tool named Labelme created in Python language and running in the Windows 10 environment. Thus, a total 1187 accurate forest segmentation manual ground truth data at 2 m spatial resolution were produced in the current version of the dataset.
Figure 3 shows the visualization of the proposed dataset, including the sample and ground truth.
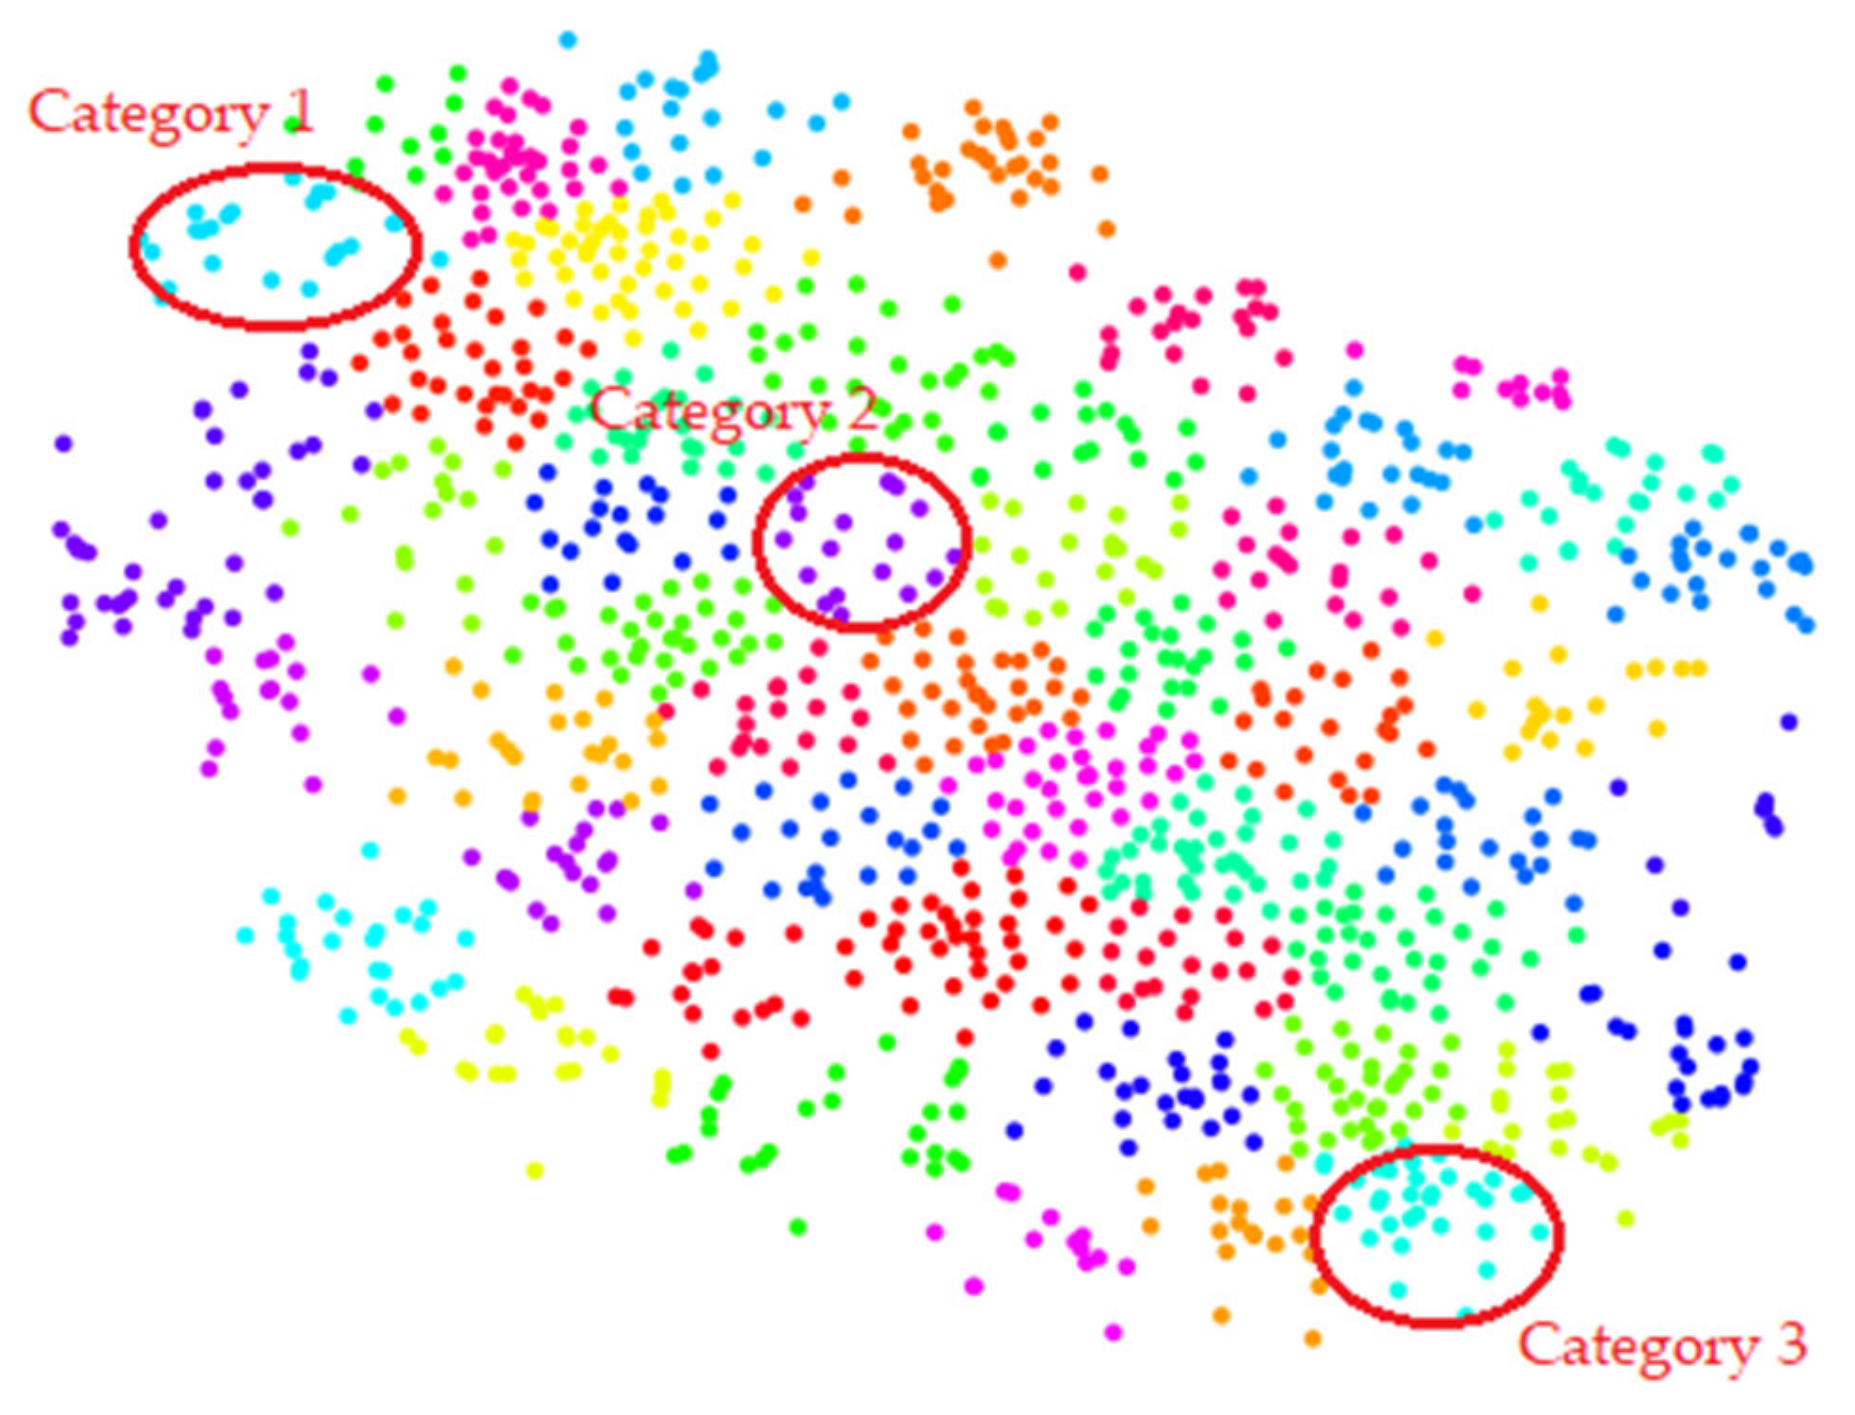
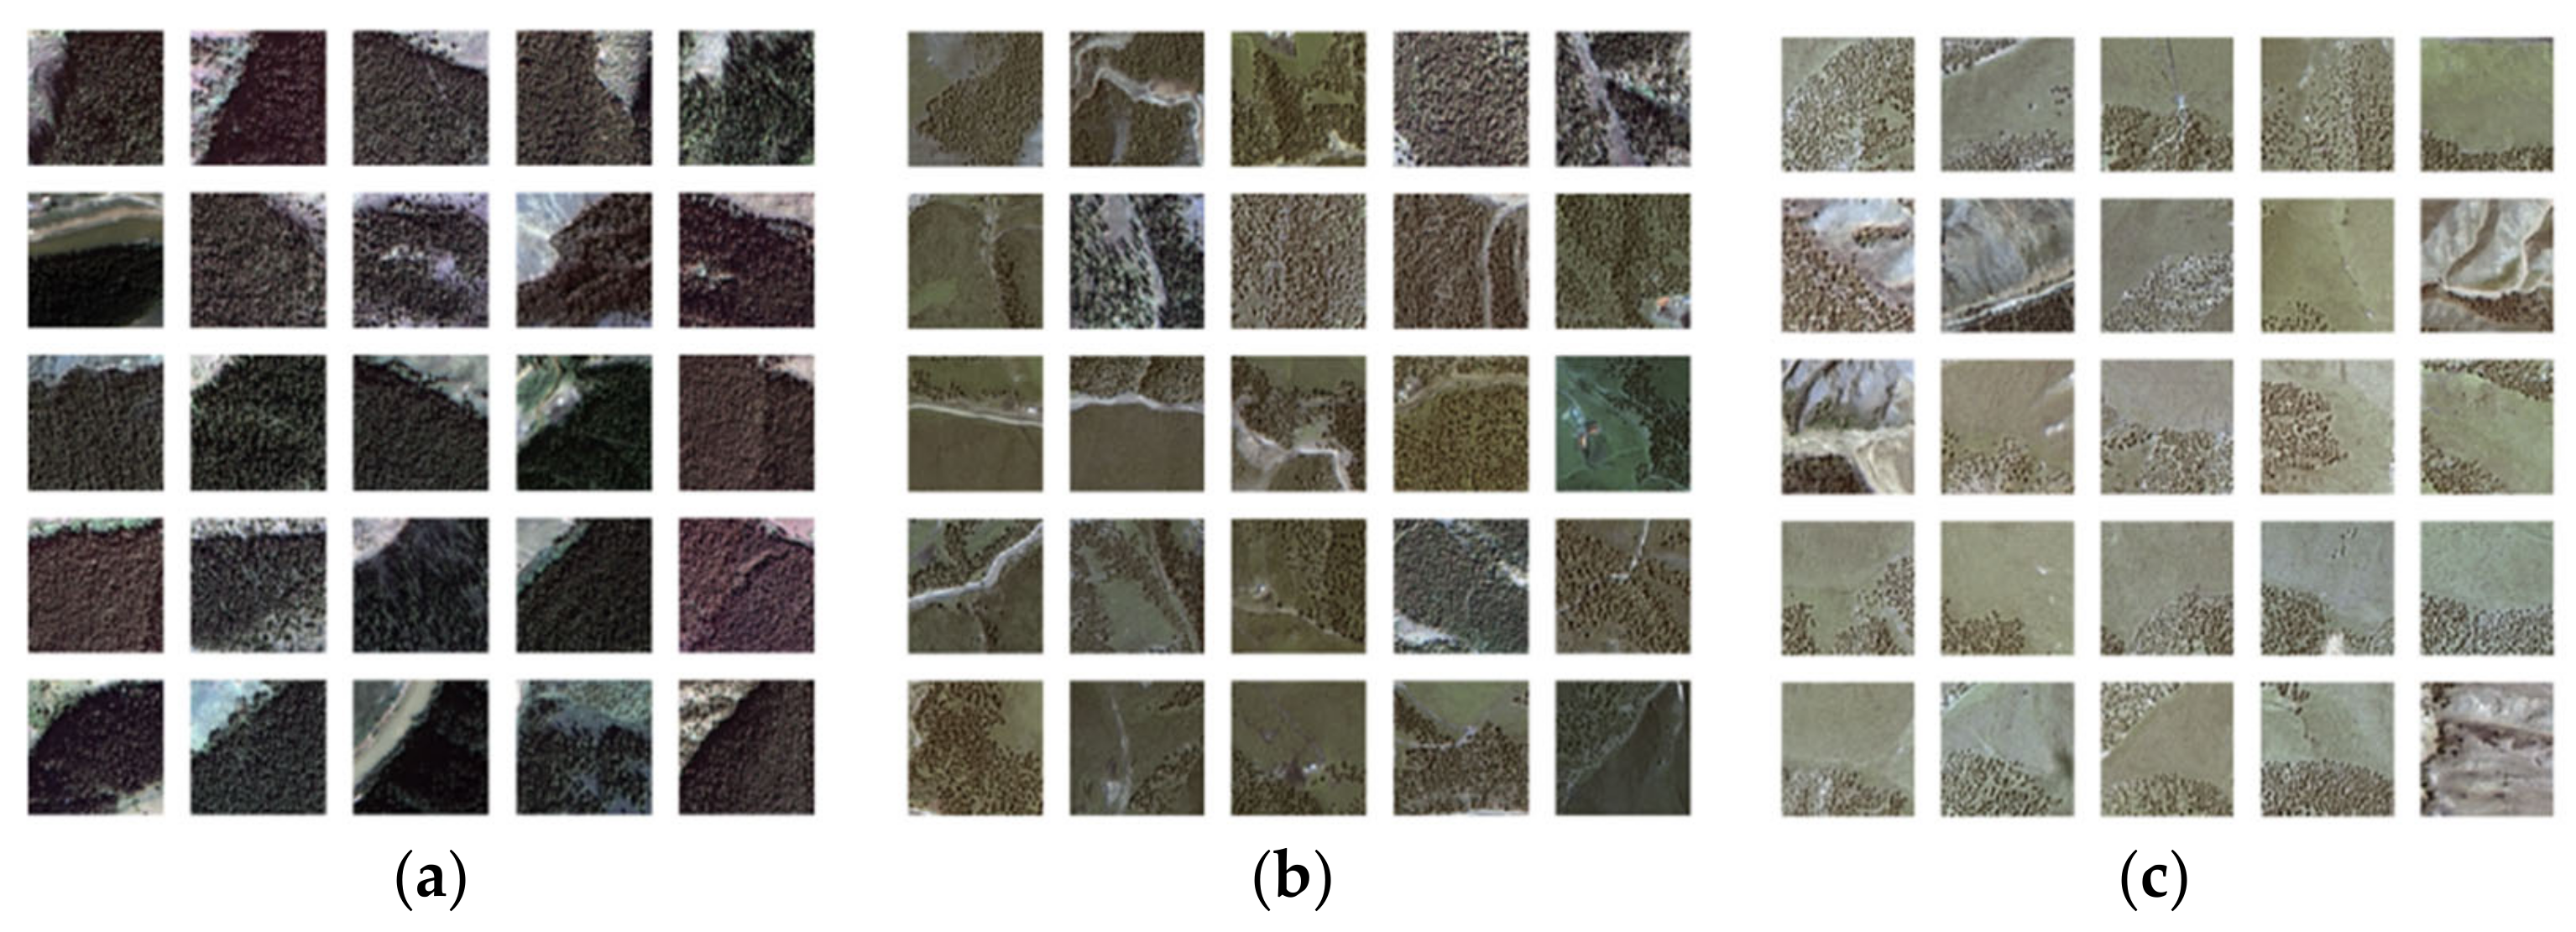
To further visualize the rich types of plateau forest within the proposed dataset, we first apply t-distributed stochastic neighbor embedding (TSNE) to reduce the data dimension and use K-means to further cluster the samples into different categories. Figure 4 shows different categories of the samples. As shown in Figure 4, the labeled samples can be divided into different categories. Furthermore, we visualize each clustering category by generating the category members’ false color composite images.
In order to present the various spatial distribution types of forests within our dataset, we random select three categories from the clustering result, and visualize in Figure 5. Figure 5 shows three selected typical categories’ visualization results. We can easily observe that the members within a single category contains a similar density of the forest, as well as the surrounding land cover environment. Also, different densities of the plateau forest communities and land covers can be found between different categories. This illustrates the rich types of plateau forest within the proposed dataset.

2.2. Proposed Method

Here, we describe the main steps of the proposed plateau forest monitoring task, as shown in Figure 6. Figure 6 shows the proposed methods structure. The inputs for the proposed methods are defined as follow: X = p 1 , p 2 , , p i representing the samples within the proposed plateau forest dataset, including X a X that have been labeled by an accurate forest segmentation ground truth, and X b X that haven’t been labeled. During the proposed plateau forest segmentation process, an unsupervised learning based model is firstly designed for the domain knowledge extraction using X b X . Then, a semi-supervised learning-based model, along with a fine-tuning method are proposed to transform the knowledge from the unsupervised learning based model to its own encoding part, and then to better learn the knowledge within the labeled ground truth data using X a X .

2.2.1. Unsupervised Learning Based Model for Domain Knowledge Extraction

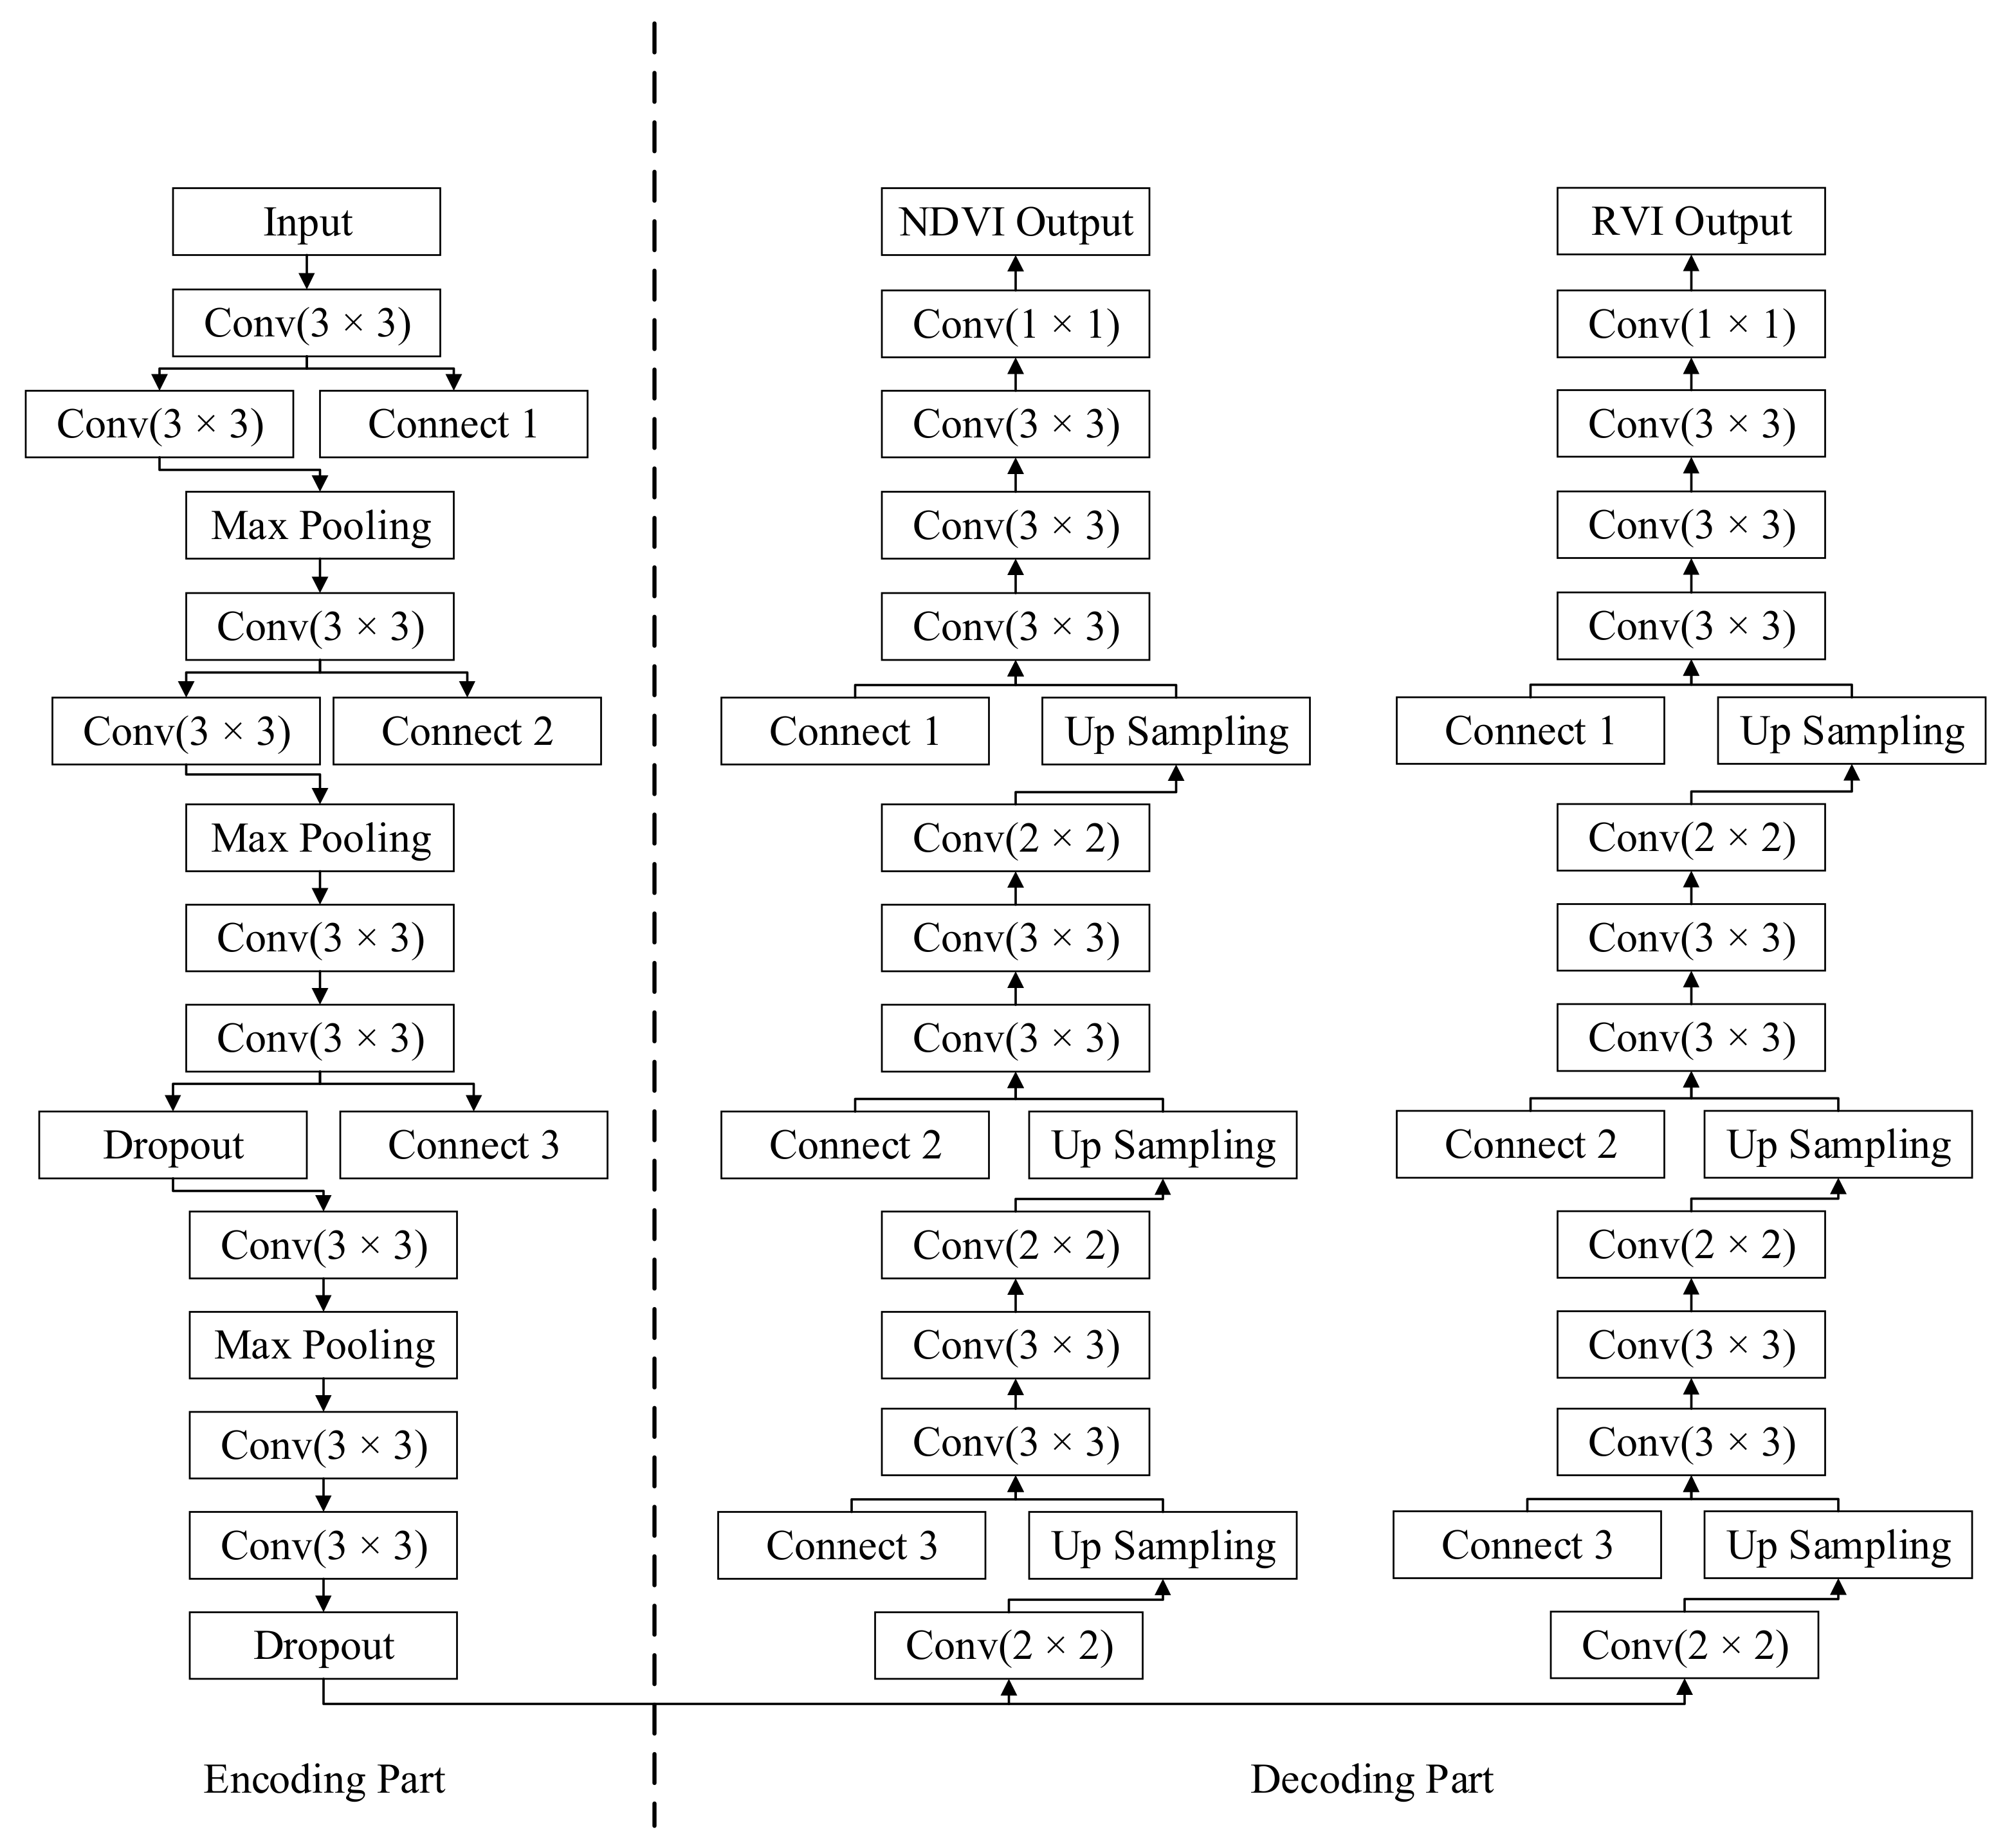
Here, the domain knowledge from unlabeled the plateau forest satellite imagery is extracted. The structure of the unsupervised learning-based model is shown in Figure 7.
The model follows the encoding-decoding structure. We utilize unlabeled data X b X as the model input, vegetation indices NDVI and RVI as model output, and thus let the model learn the vegetation knowledge through the unsupervised process. During the encoding process, in order to better build the high-dimension feature located in the last layer of the encoding part, we utilize four resolution stages by using multi convolution layer and sampling layer. In addition, we add the connecting layer idea from the UNET structure. Furthermore, we utilized the drop-out technic to avoid over-fitting [25].
During the decoding process, two different decoding path is designed, including the unsupervised learning NDVI target y ^ and RVI target z ^ . In order to achieve a multi learning target, the model loss is defined in (1):
l o s s = n 1 i = 1 n y ^ i y i 2 + n 1 i = 1 n z ^ i z i 2
Here, we set the model loss as the sum of the NDVI path’s the mean-square error for current model output y ^ i and expectation output y i , along with the RVI path’s the mean-square error between current model output z ^ i and expectation output z i . Thus, during the training process, the high-resolution satellite imageries are used as the input of the model, and the calculated NDVI and RVI toward corresponding satellite imageries are used as the outputs. Thus, the model automatically follows the loss in Equation (1) to achieve self-training.

2.2.2. Semi-Supervised Learning-Based Model Fine-Tuning

The main purpose of this method is better adjust the model for better segment the plateau forest using limited ground-truth data, using the knowledge transformed from the unsupervised learning-based model. The proposed structure of semi-supervised learning based model for plateau forest segmentation is shown in Figure 8.
The proposed structure contains an encoding part and a segmentation part. The encoding part follows the same four resolution stages style as mentioned in the previous unsupervised learning-based model. The segmentation part utilizes the multi convolution layer and sampling layer, along with different kernel sizes, ranging from 3 × 3 to 1 × 1. In order to achieve the segmentation task, we apply the sigmoid as the activation function which defined in Equation (2):
S z = 1 + e z 1
Here, the kernel input z is transformed though the activation function, and the kernel output is S z .
The binary cross entropy is set as the model loss which defined in Equation (3):
l o s s = i = 1 n ^ i y ^ i   l o g   y i + 1 y ^ i l o g
Here, the cross entropy between current model output y ^ i and expectation output y i is calculated and used as the training guidance.
Before the model shown in Figure 8 starts training, we first modify the model by transforming the decoding part parameters from unsupervised learning-based model mentioned in Section 2.2.1 to the encoding part of the semi-supervised learning based model in Figure 8. This parameter transform process can let the encoding part of the model better understanding the vegetation object knowledge, and extract reasonable high-dimension features in the last layer of the encoding part within the semi-supervised learning based model, with limited labeled ground truth information. Furthermore, the high-resolution satellite imageries are used as the input of the model, and the manual ground truth toward corresponding satellite imageries are used as the output of the model. Then, the model follows the loss in Equation (3) to automatically achieve self-training.

2.3. Comparsion Methods

The experiments are set up in the Window 10, Python 2.7 and GTX3080 environment.
In order to validate the proposed structure performance, we validated the results with several state-of-the-art algorithms including normalized difference vegetation index (NDVI), ratio vegetation index (RVI), random forest (RF), support vector machine (SVM) and a supervised method, U-Net (UNET). NDVI and RVI are traditional remote-sensing analysis indices. Random forest and SVM are well-known machine learning-based pattern recognition methods. UNET is a supervised learning-based object detection method, and has been widely used in image segmentation tasks.
Table 3 shows the detail of the model training process.

3. Results

3.1. Result of Unsupervised Learning-Based Model for Domain Knowledge Extraction

The unsupervised learning-based model for domain knowledge extraction results is shown as follows.
Figure 9 shows the training curve of the unsupervised learning-based model, which follows the structure as shown in Figure 7. Here, the curve of the NDVI Loss and RVI Loss represent the loss of the NDVI path and RVI path. The Global Loss represents the loss mentioned in (1). It can be observed that both the NDVI path loss and the RVI path loss reach a reasonable level after 20 epoch trainings, and the global loss follows the same trend of the individual loss decreasing.
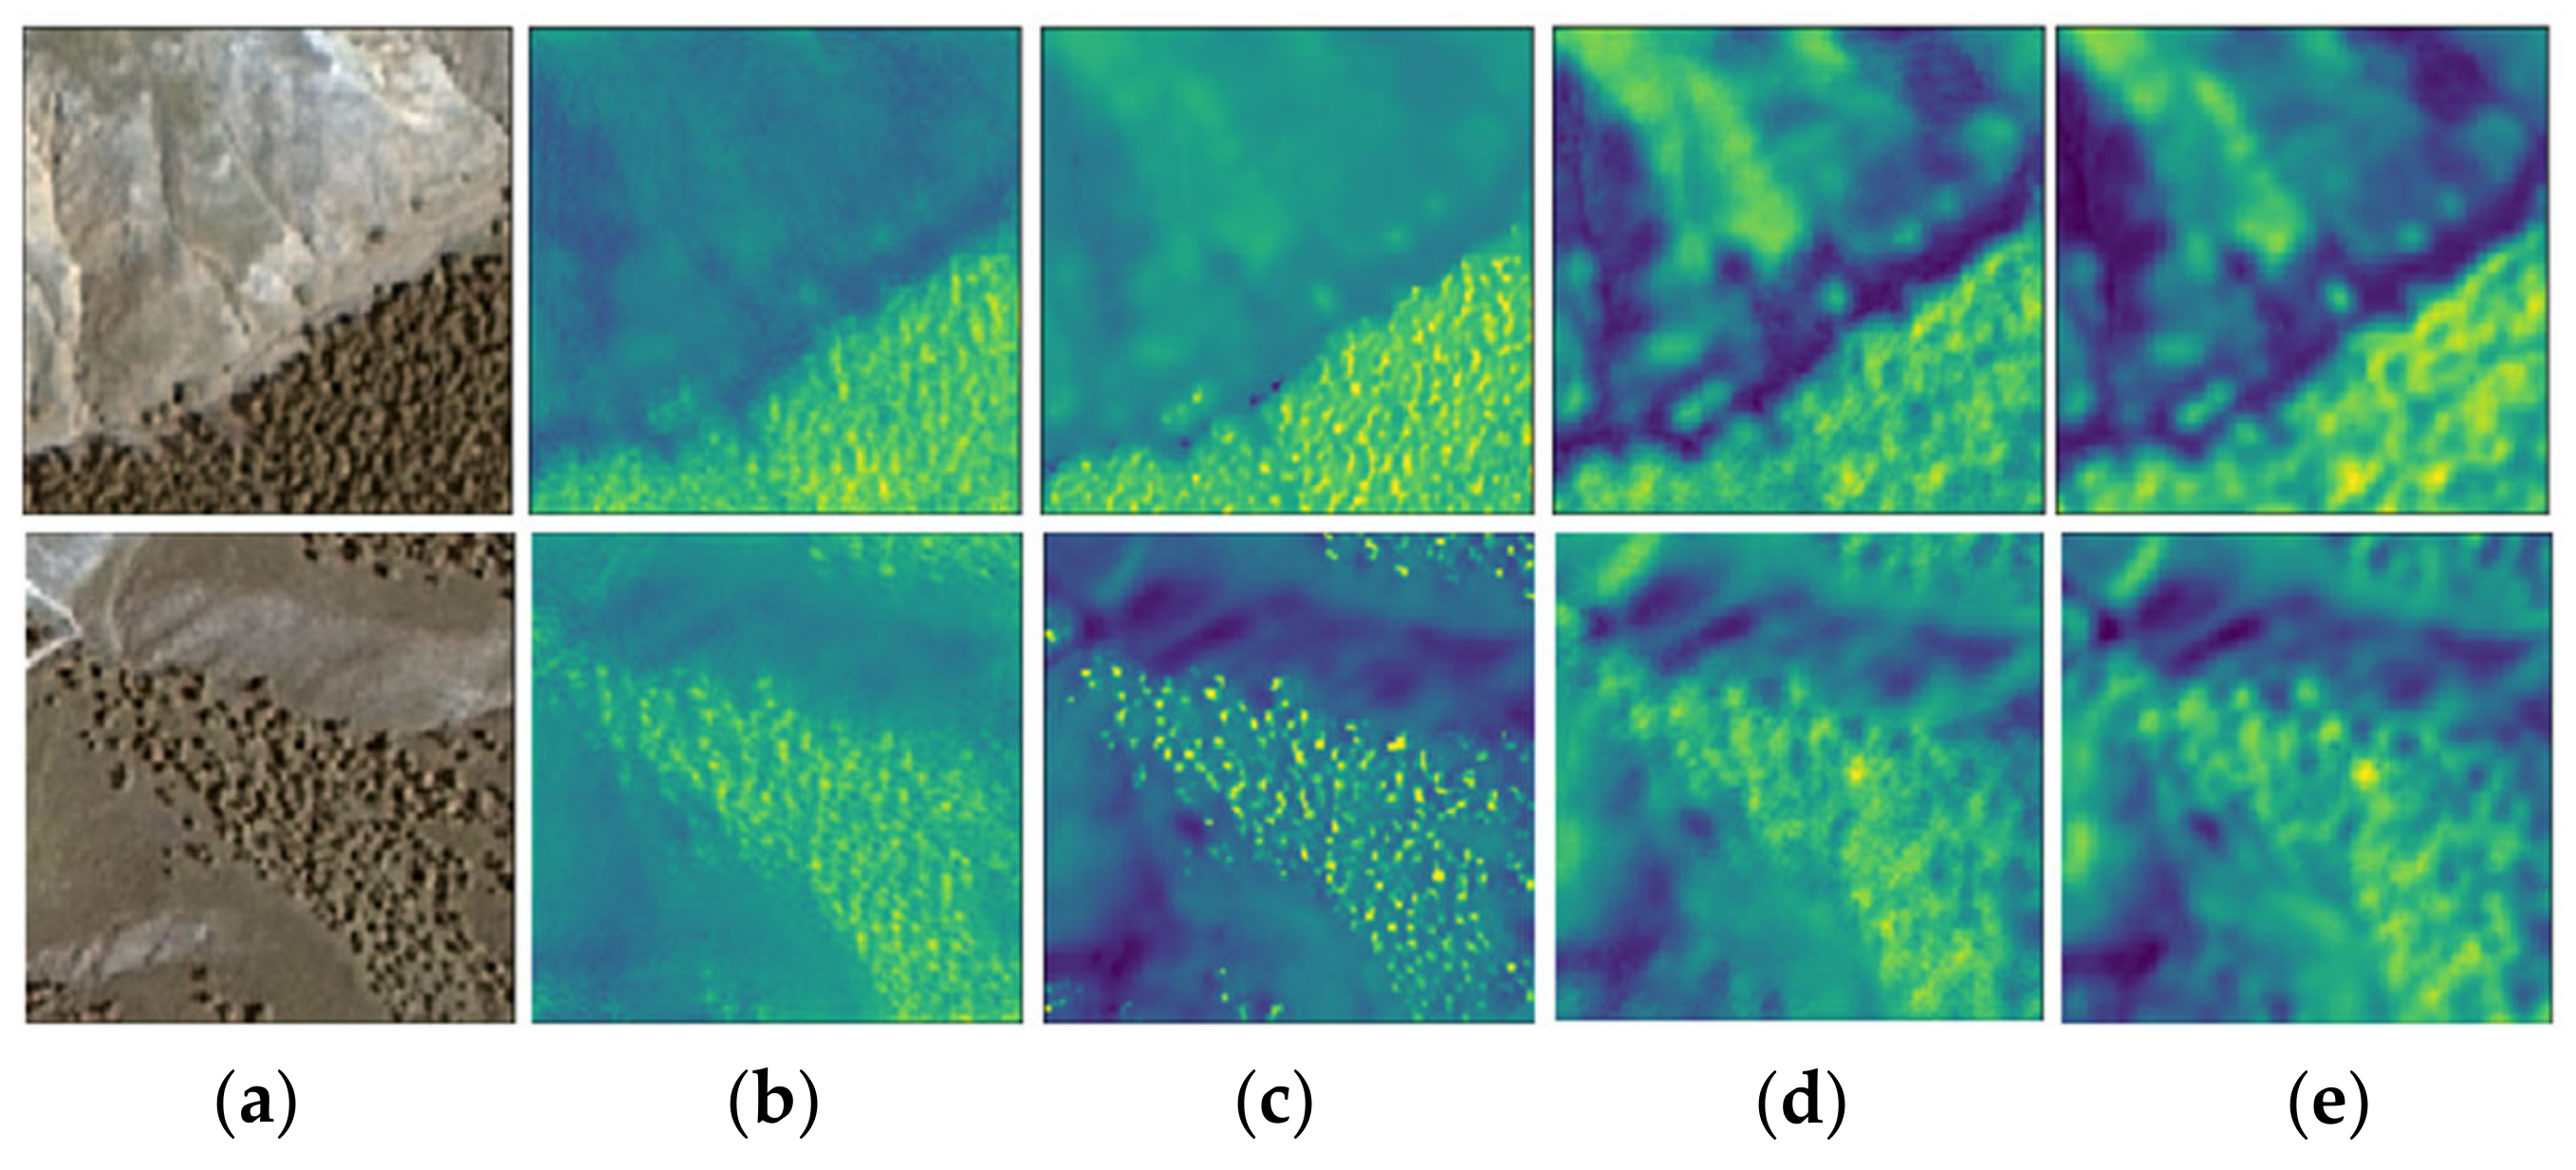
Then, during the model testing process, we use the unlabeled samples as the model input, and generate the model output based on the well-trained model. Specifically, we selected two testing samples with different densities of the plateau forest, as shown in Figure 10.
Figure 10 shows the model prediction for a high-density forest sample and a low-density forest sample. We can observe that the output of the model follows the same trend as the ground truth NDVI and RVI output.

3.2. Results of Semi-Supervised Learning-Based Model Fine-Tuning

The performance of the semi-supervised learning based model fine-tuning is compared with serval state-of-the-art object segmentation methods.
In order to estimate the methods performance under the few-shot issue, we randomly divide the labeled samples into a training-testing samples set, as 100–1087, 300–887, 500–687, 700–487. The training and testing results are shown as follows.
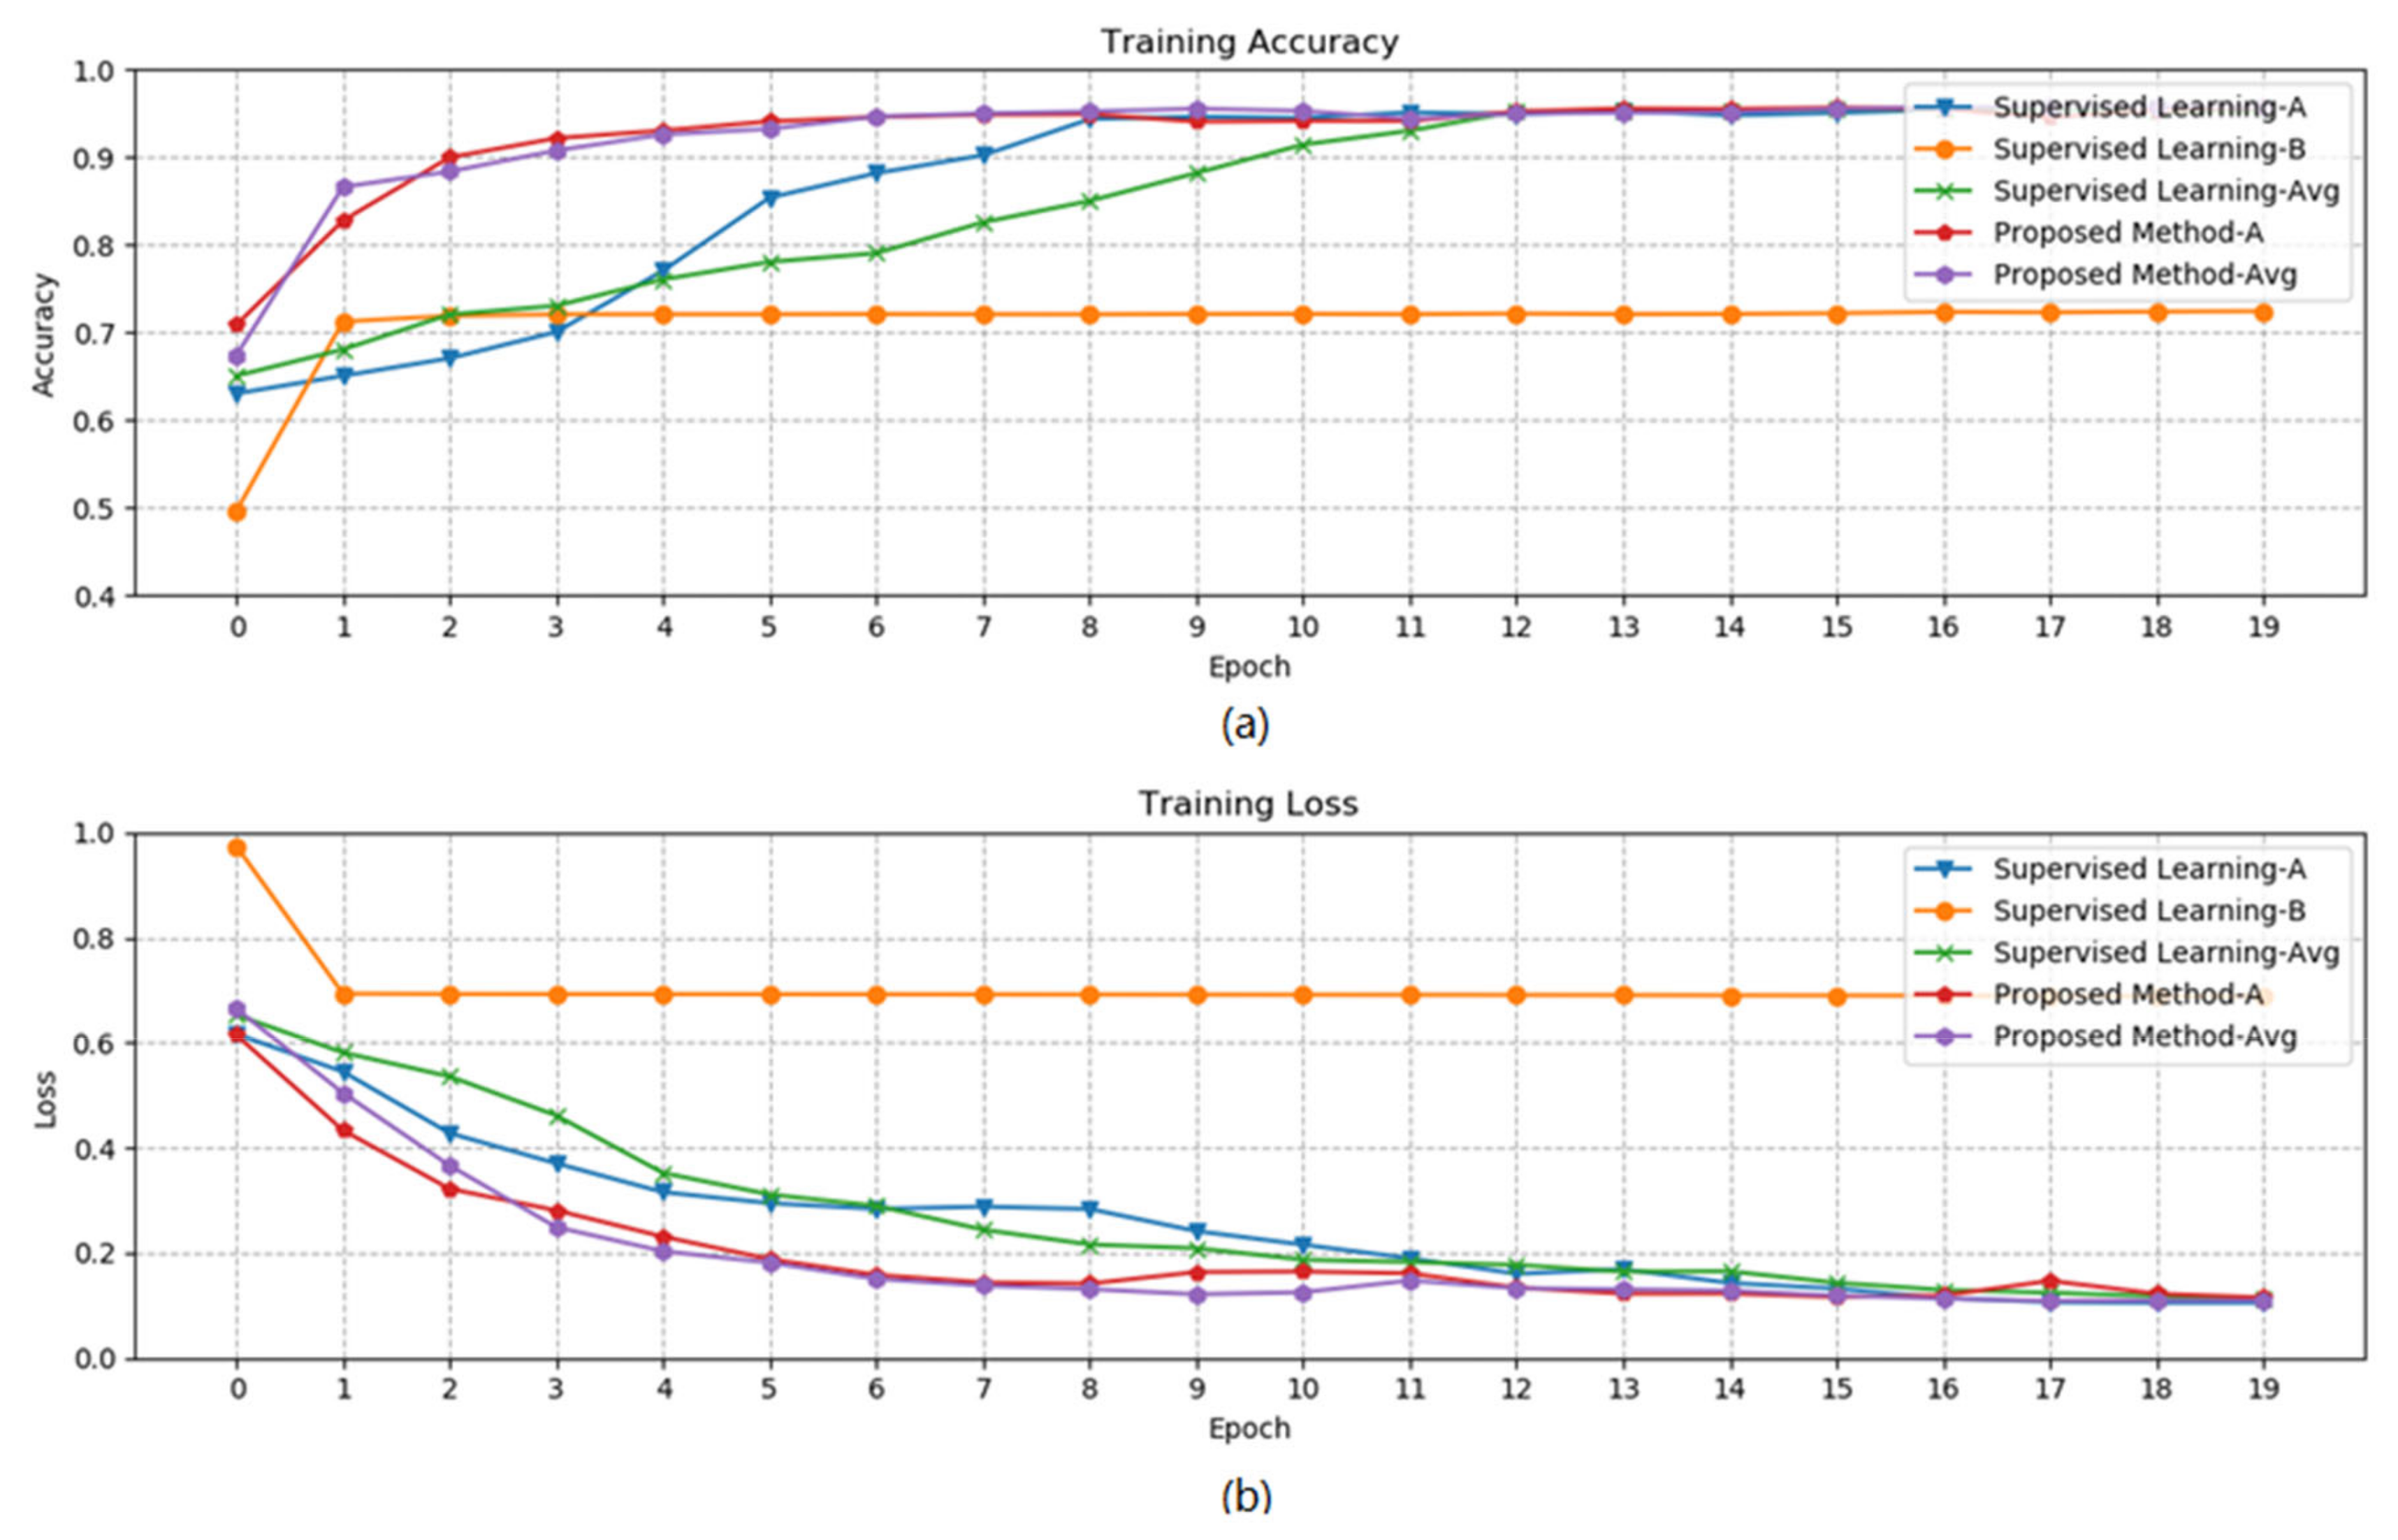
Figure 11 shows the different training curves based on the proposed method and baseline methods using 100 training samples. We repeatedly trained models 10 times following supervised learning UNET method and proposed semi-supervised method, and calculated the average training accuracy and training loss curves. The ‘Supervised Learning-A’ represents a good training curve with a good accuracy trend and loss trend. The ‘Supervised Learning-B’ curve represents a badly training process, where the accuracy and loss is not good enough for the segmentation task. The ‘Proposed Method-A’ represents a good training process with reasonable accuracy trend and loss trend. Finally, the ‘Supervised Learning-Avg’ and ‘Proposed Method-Avg’ represents the average curve based on model training process conducted 10 times. It can be observed that the accurate and loss of the proposed method changing faster on average, compared with the supervised learning baseline method. These can prove that the proposed method is able to better handle the local minimum during the training process.
Then, serval state-of-the-art algorithms including NDVI, RVI, SVM and UNET are compared with the proposed method, under different training-testing sample sets, as shown in Table 4.
It can be observed from Table 4 that NDVI and RVI is not able to reach the goal of the few-shot plateau forest segmentation task, due to their threshold limitations. The supervised learning method UNET shows better performance compared with the machine learning method SVM and threshold methods. Above all, the proposed semi-supervised method shows better performance compared with the baseline method in terms of precision, recall and F1 score. This shows that the proposed model structure can better understanding the forest distribution knowledge within limited ground truth data, and proves that the encoding part transform process can provide valuable information to the plateau forest segmentation process. Furthermore, the less the training sample is used, the better the proposed method performs, compared with the UNET method and other comparison methods. This proves that the proposed semi-supervised learning-based model fine-tuning method outperforms comparison methods, and could better handle the few-shot issue.
Details of the segmentation results comparison are further visualized in Figure 12.
In Figure 12, the (c) NDVI and (d) RVI methods are missing most of the forest area within the scene. The (e) RF and (f) SVM methods recognize more forest area compared with the threshold methods, but also marked many grassland as forest, which shows a high false positive rate. The (g) UNET is able to recognize most forest areas, and correctly understand the difference between grassland and forest, but still some detailed parts of the forest are missing, especially for the forest boundaries. The (h) proposed method recognizes more accurate forest area for both the main forest area and the boundary details, and thus shows more robust performance for large-scale plateau forest mapping.

3.3. Extracted Feature Visualization

In order to better understanding the achievement of the structure within the proposed model shown in Figure 8, the weight matrixes within the layers of the proposed model during the testing process are being visualized as follows. Firstly, we randomly select a testing sample from the testing set, and produce the forest segmentation result. Thus, Figure 13 shows the false color image, ground truth and proposed method segmentation result of the testing sample.
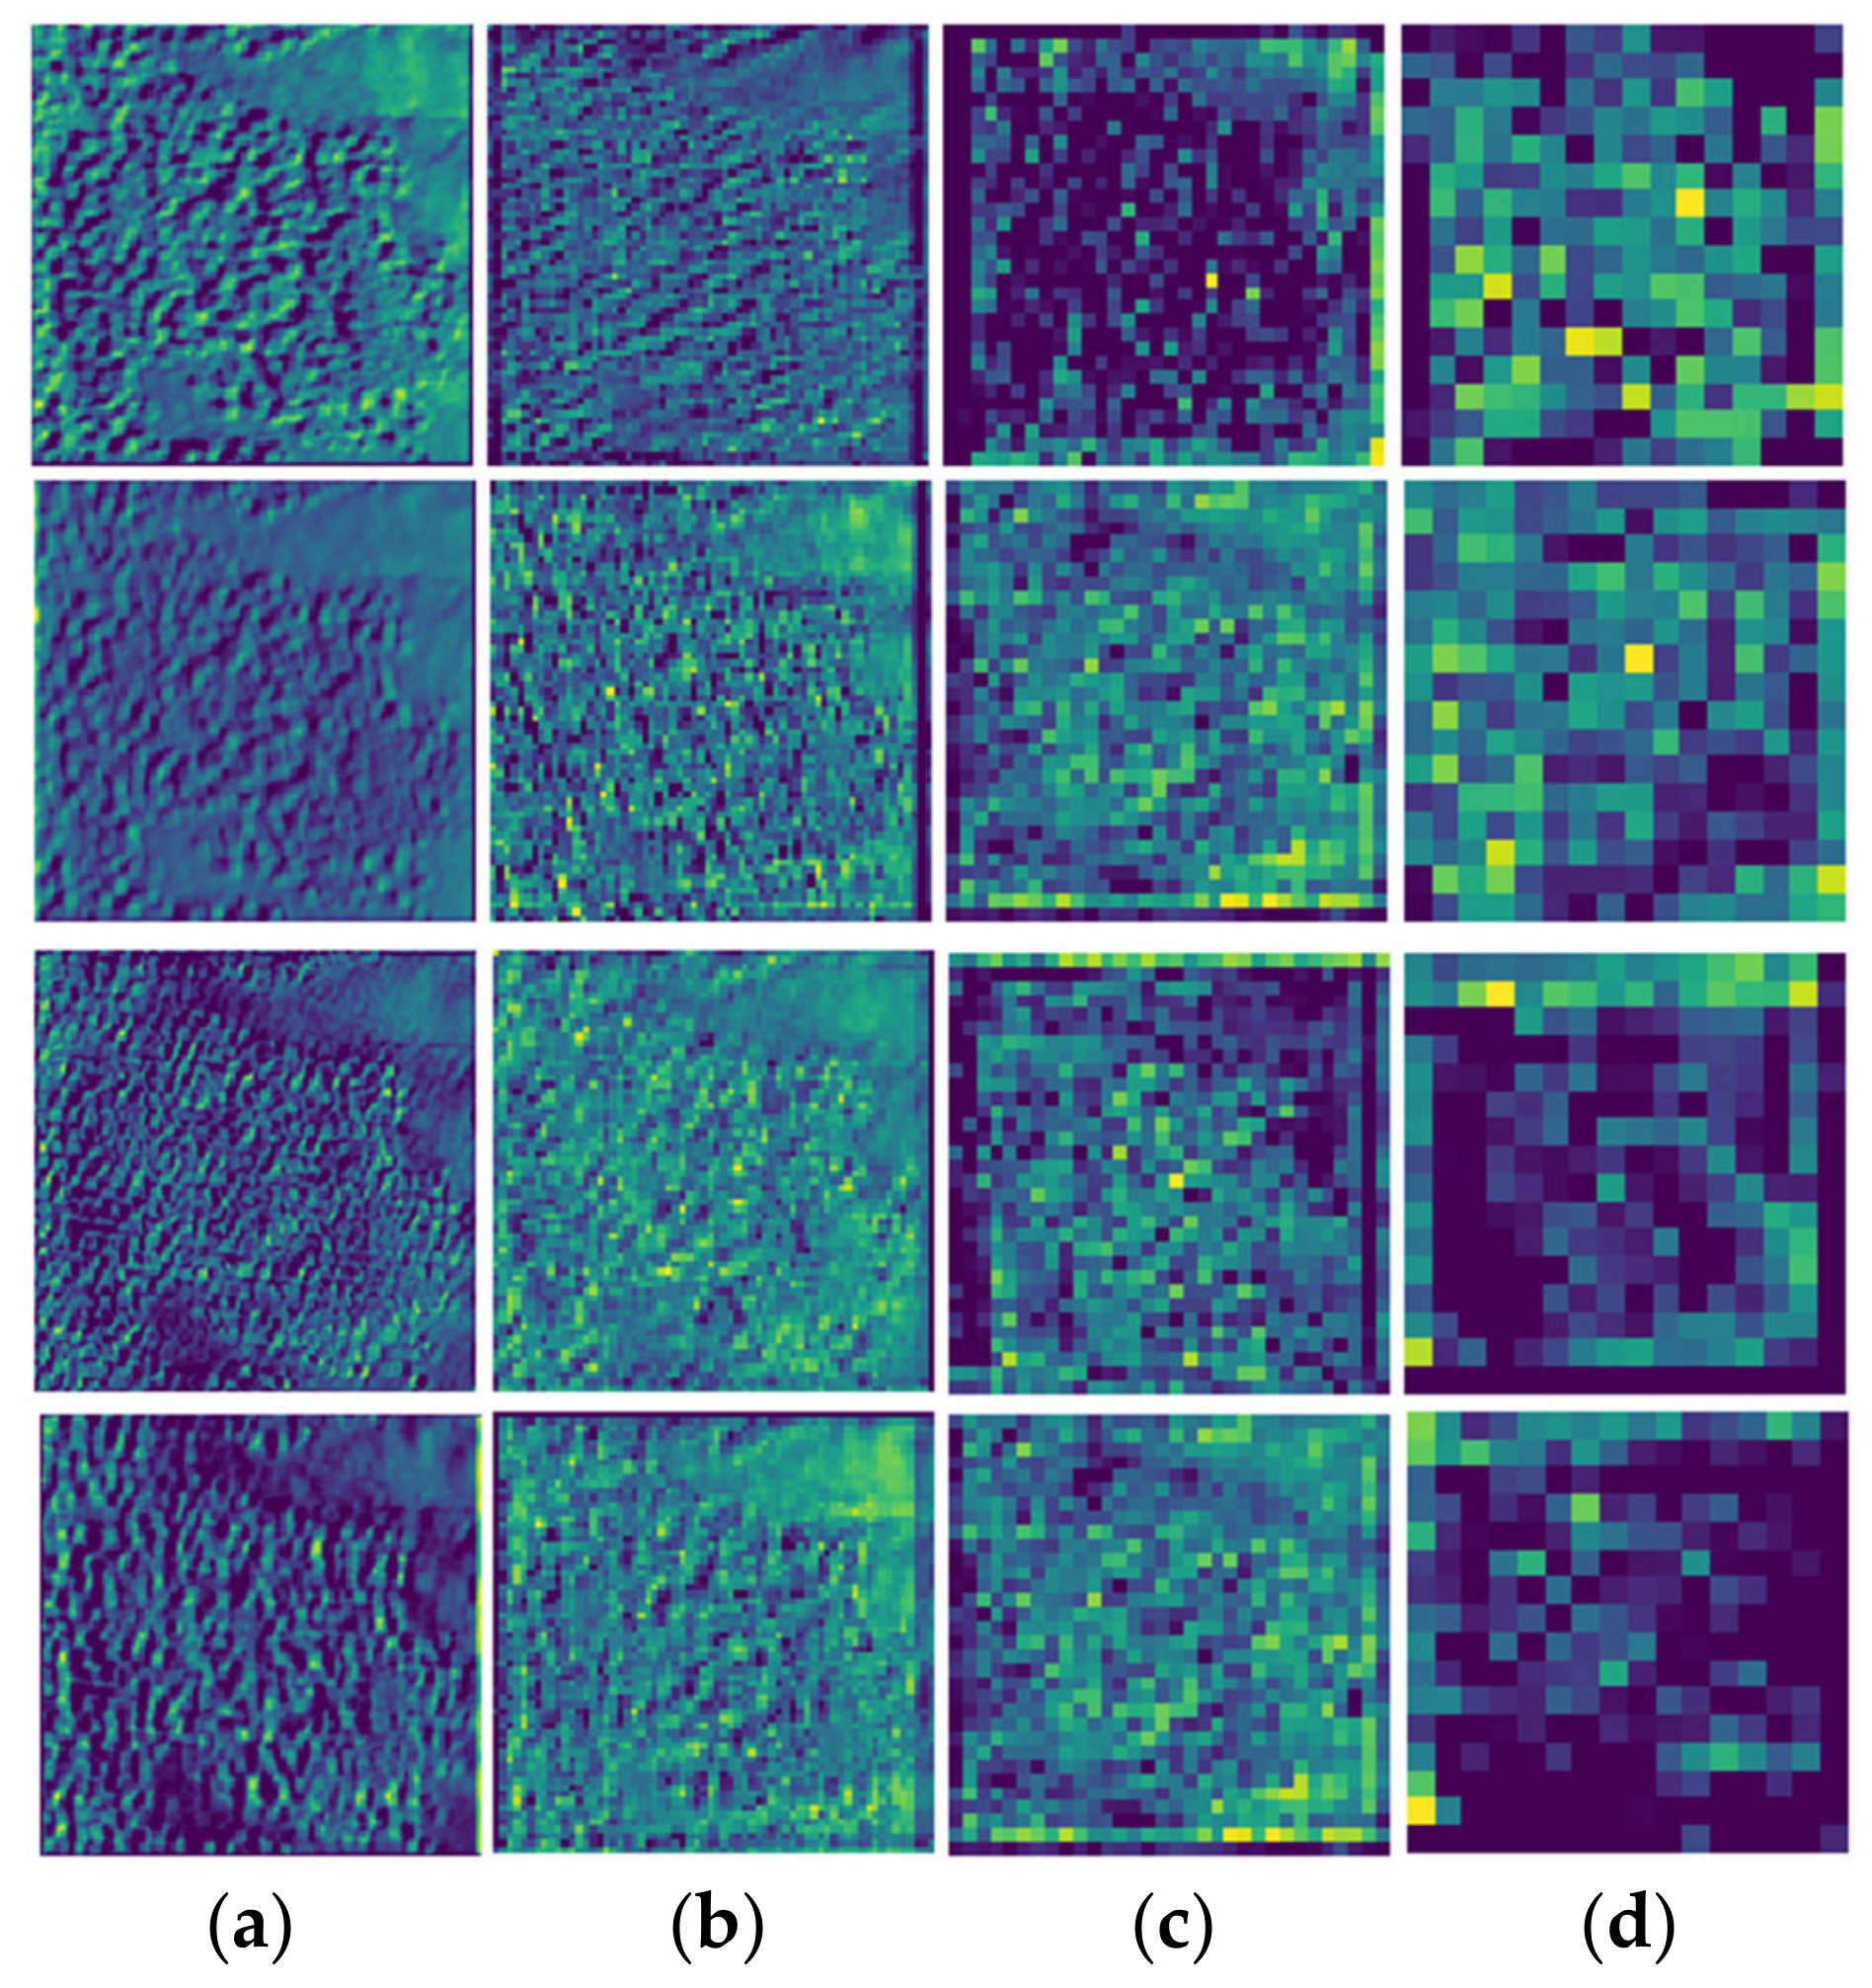
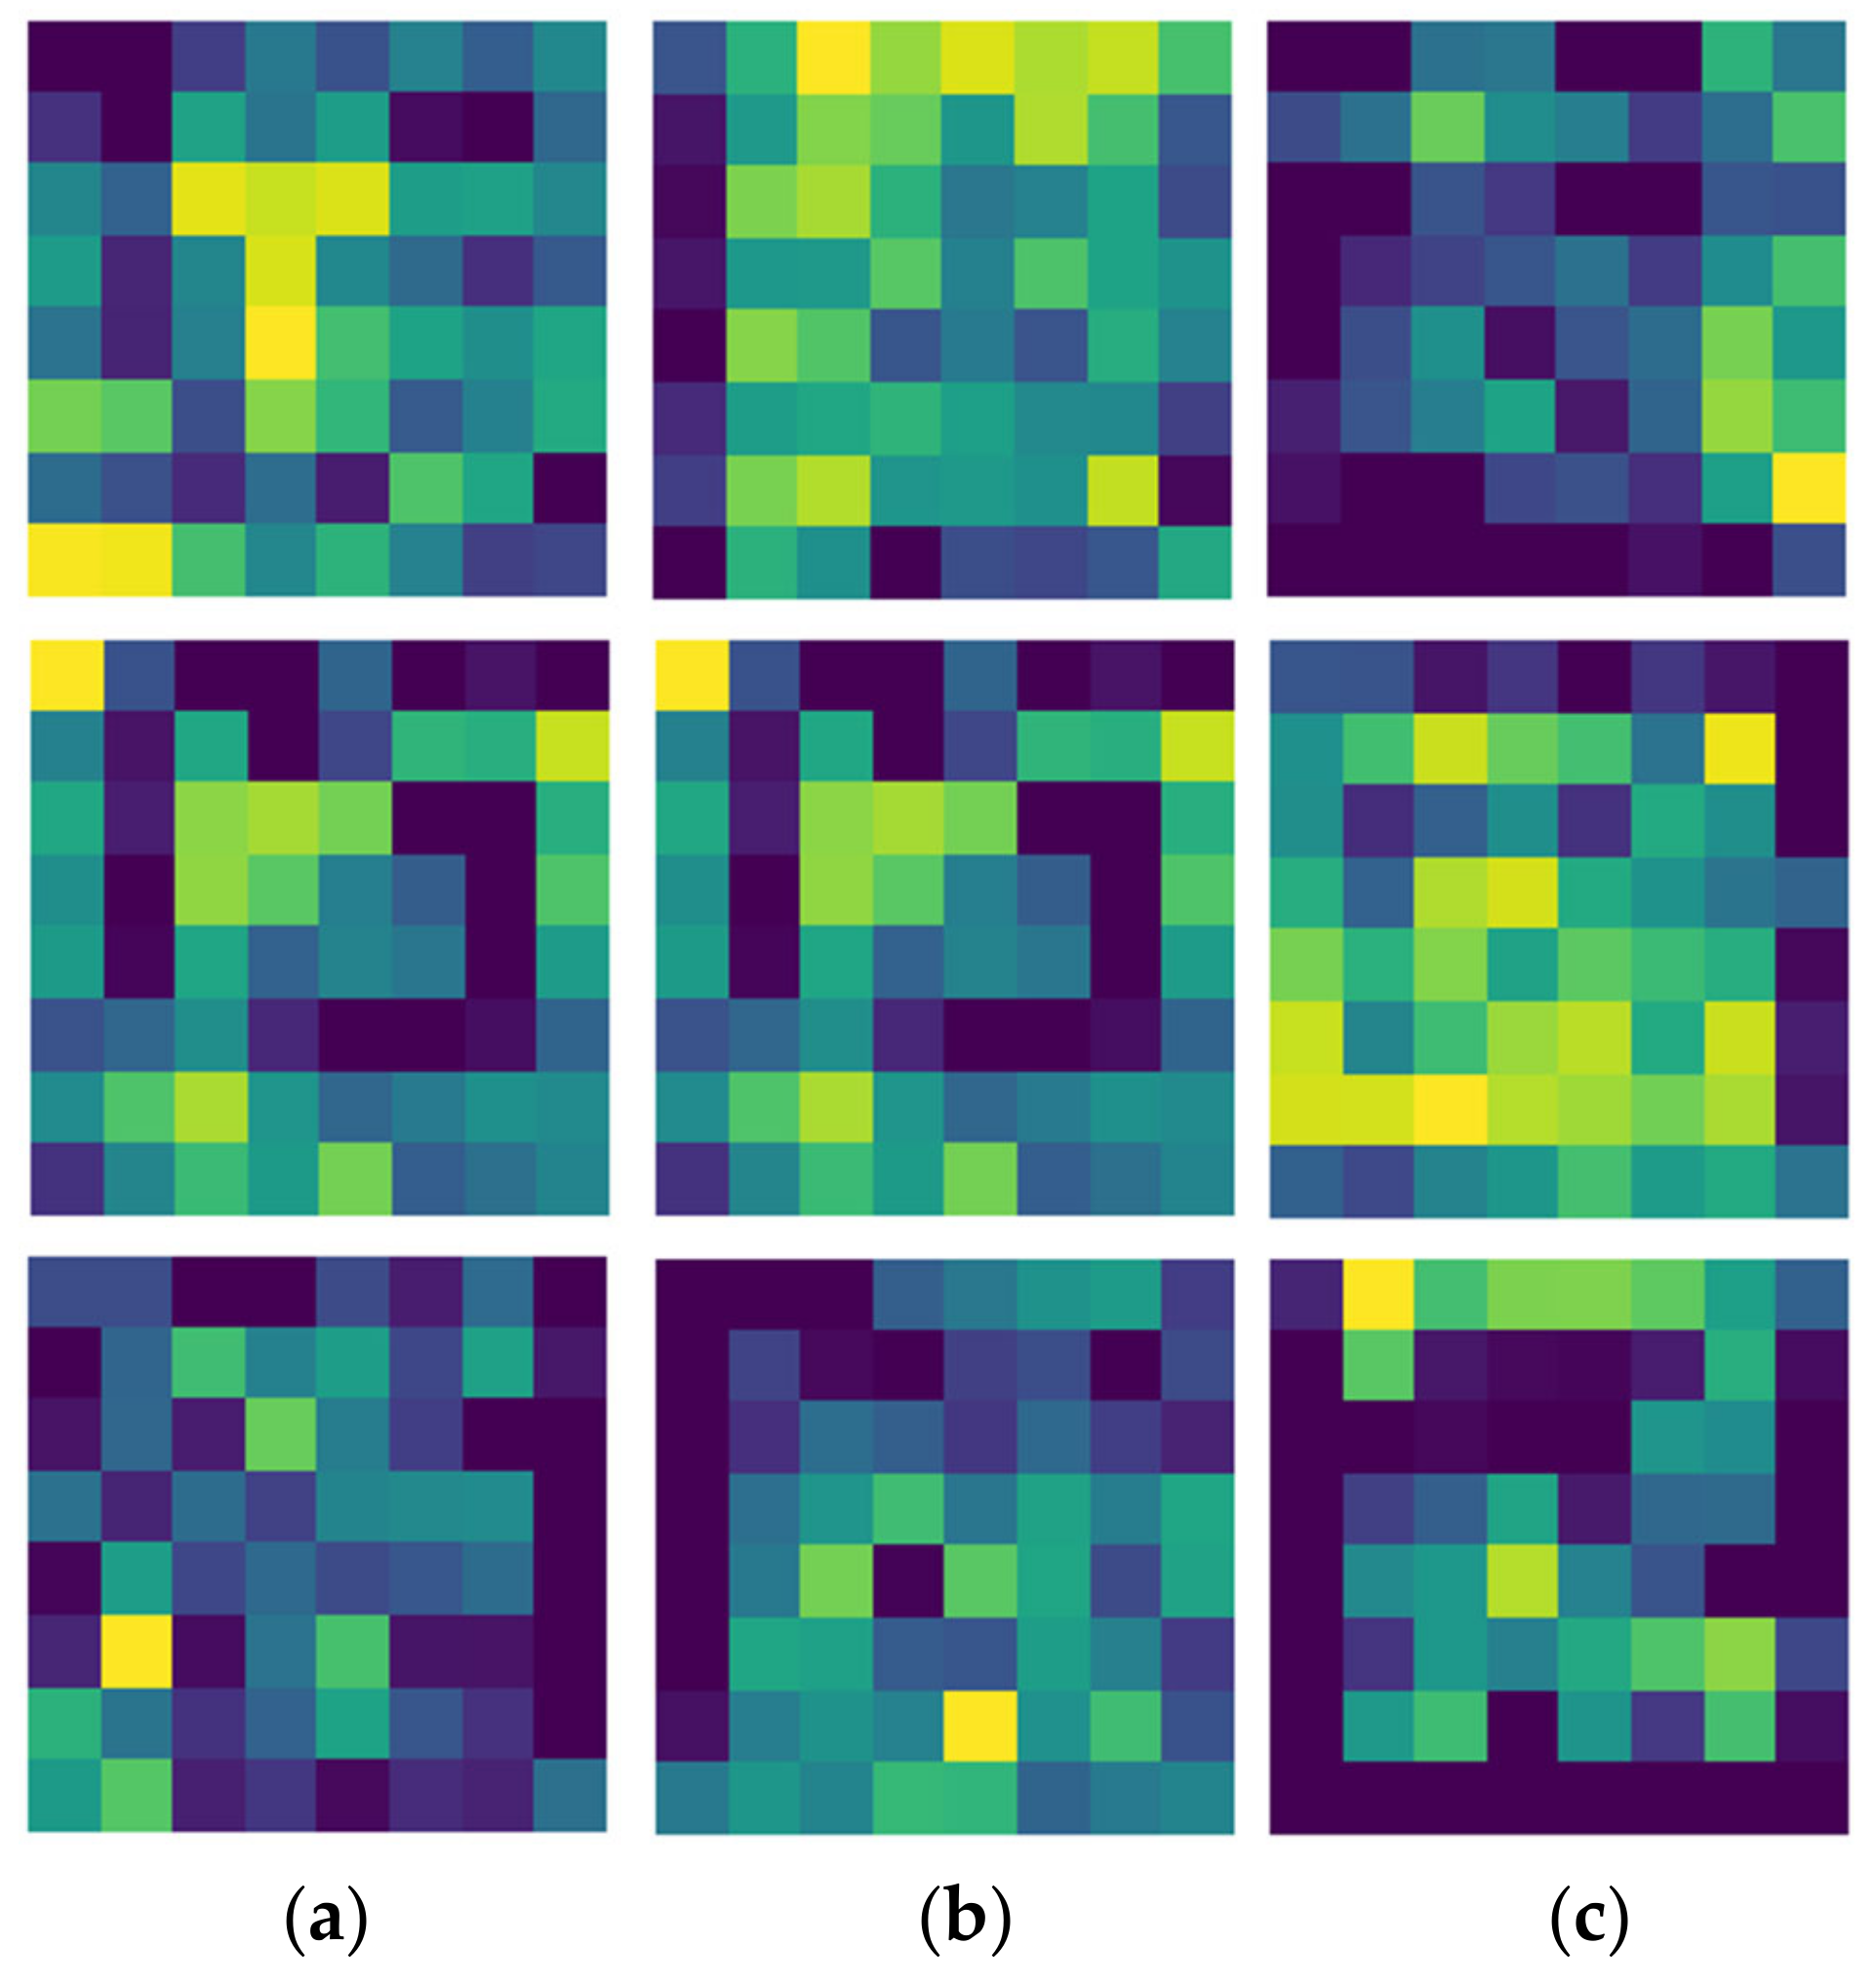
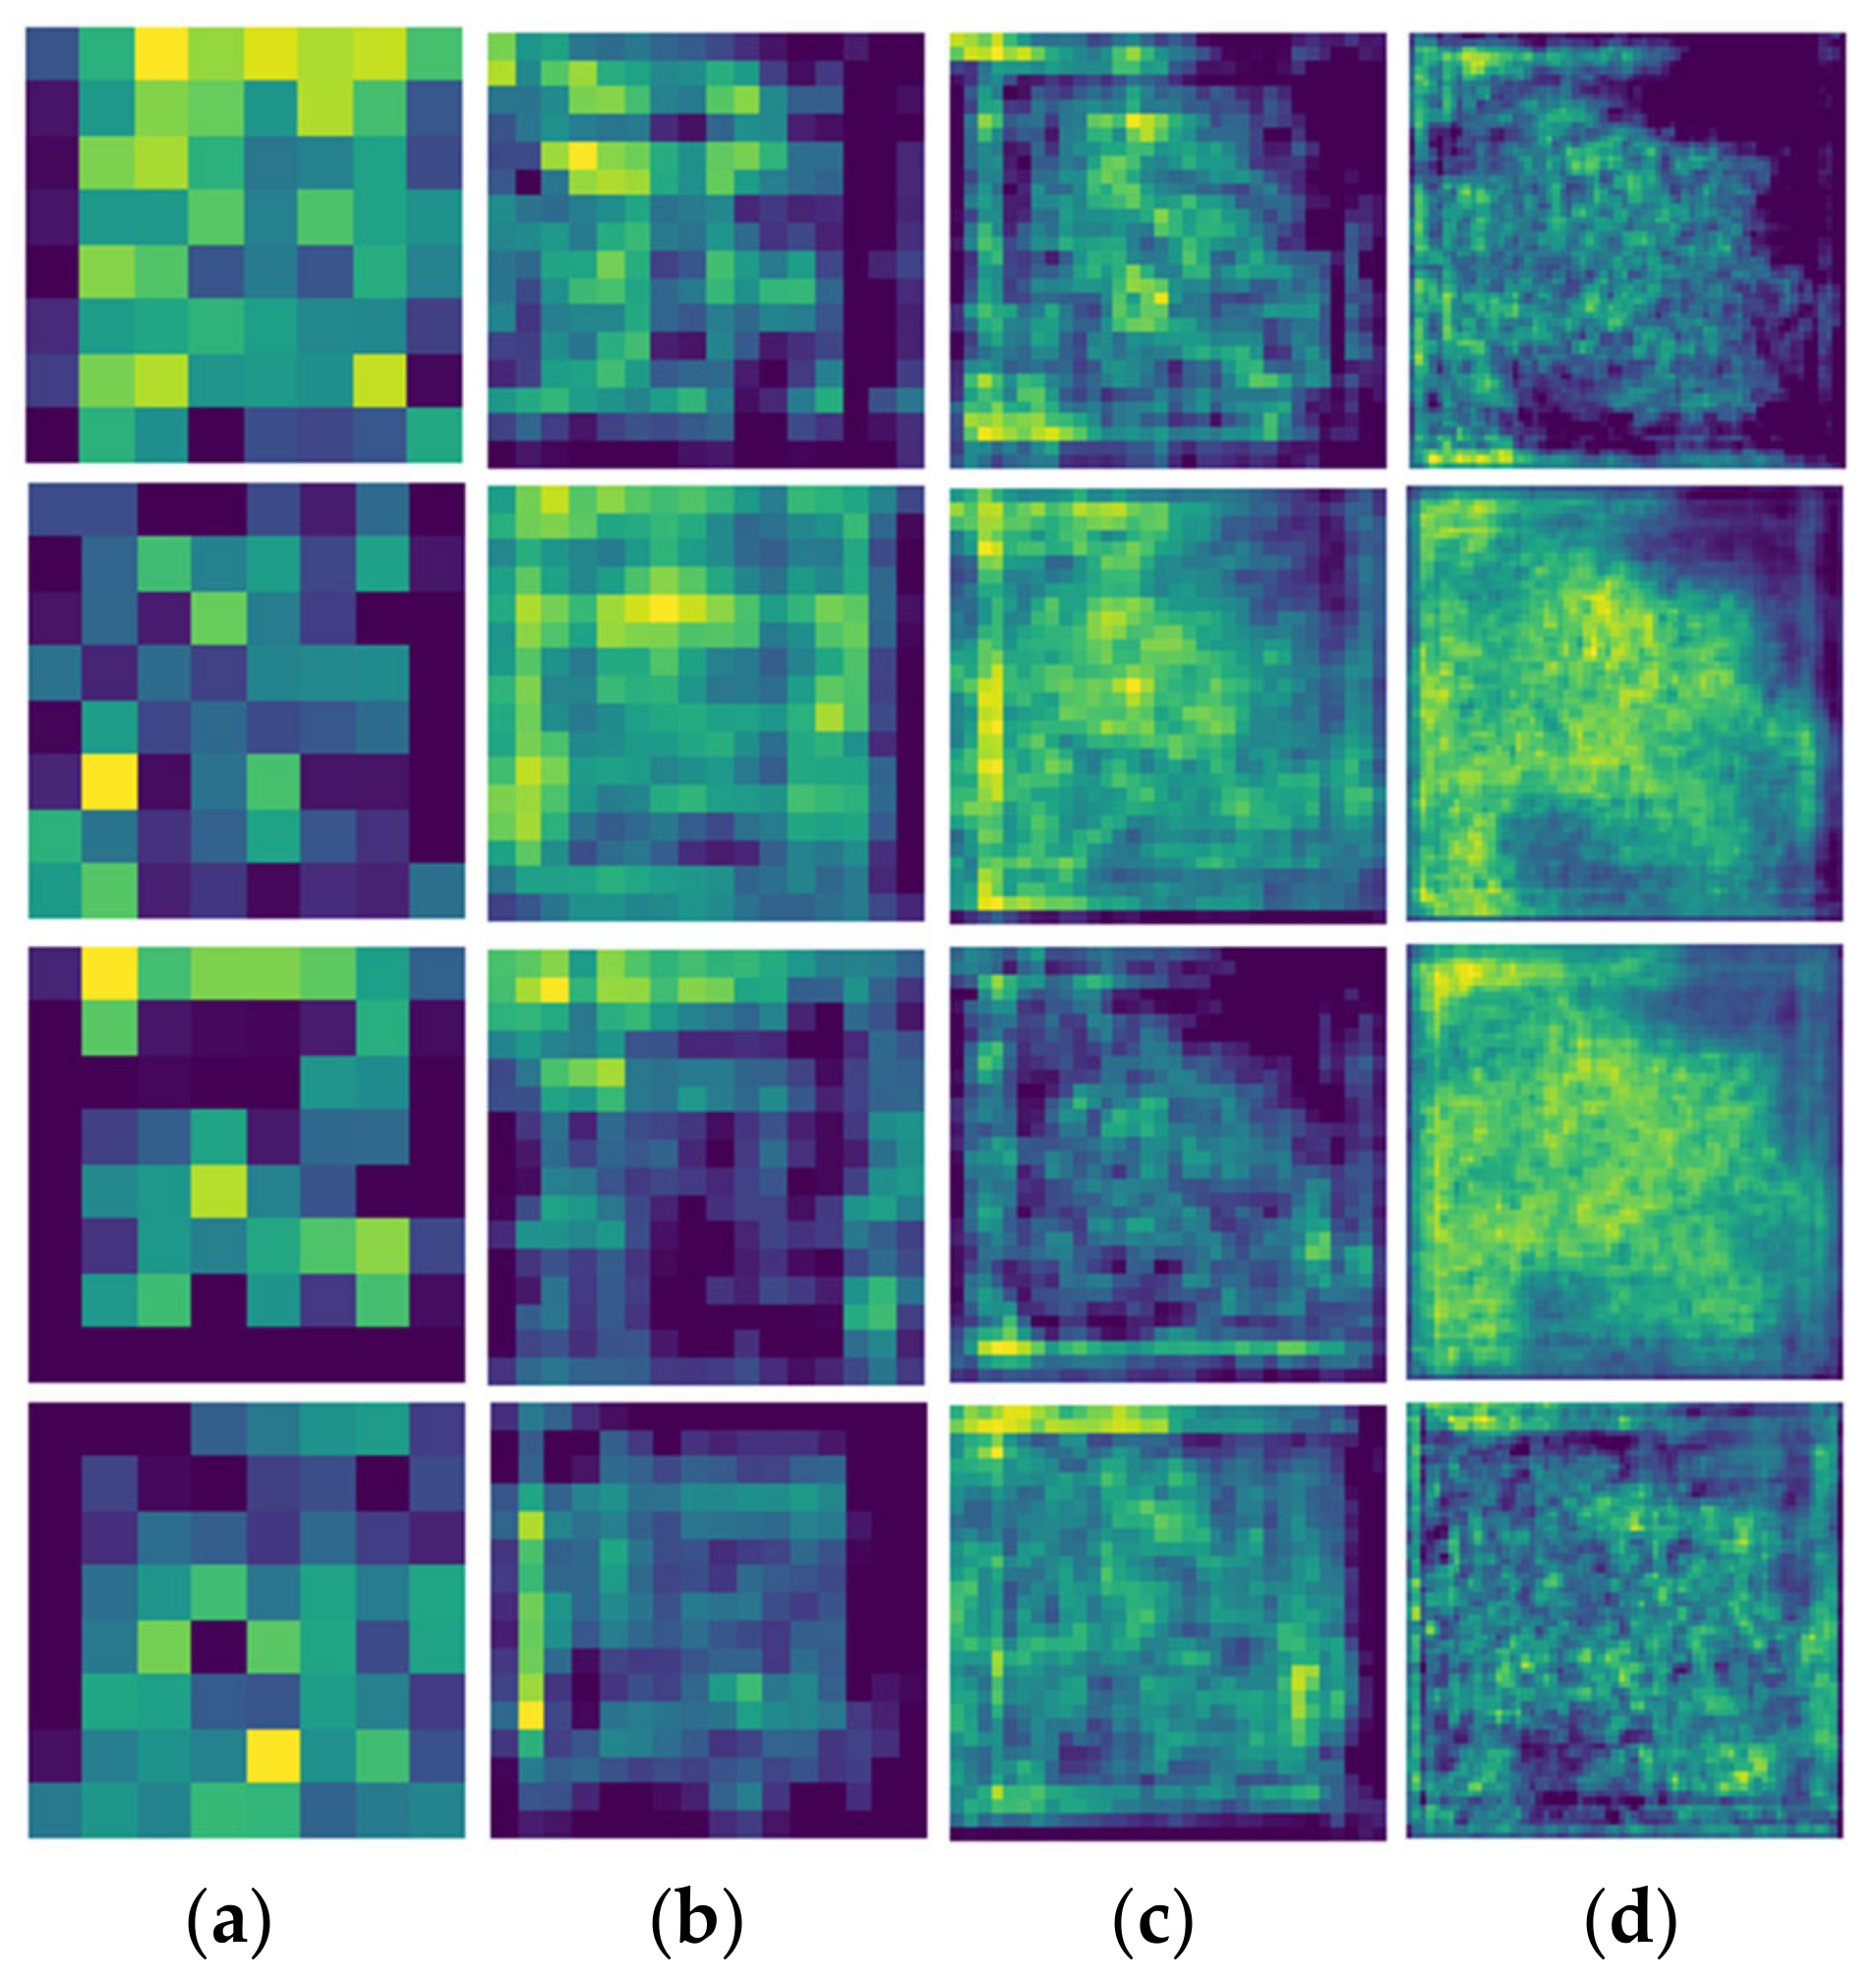
Then, during the production process, we record each layer’s weight matrix and visualize them by false color map style visualization. Specifically, the visualization of the four resolution stage’s feature maps in the encoding part, the high-dimension feature output, the four resolution stage’s feature maps in the segmentation part of the proposed method are shown in Figure 14, Figure 15 and Figure 16. Each subplot within the figures represents a weight matrix randomly selected from the corresponding layer. Furthermore, each element within a single weight matrix is colored based on the value, the element colored in light yellow means it is a kernel neuron with high weight. The element colored in dark blue means it is a kernel neuron with low weight. As shown in Figure 14, the weight matrices within each random selected layers show different spatial weight distribution. Moreover, a weight distribution similar to the forest distribution within the test sample visualization shown in Figure 13a can be observed in Figure 14a. This similar distribution becomes abstract along with the rising dimension after each max sampling layer, as shown in Figure 14b–d. Then, Figure 15 shows the high-dimension feature map, extracted from the last layer of the encoding part shown in Figure 8. The information within each subplot of Figure 15 shows the high dimension weight matrix distribution. Finally, the high-dimension information contained in the high-dimension weight matrix are decoded through the up-sampling layers. It can be observed from Figure 16 that the distributions of the weight matrixes gradually become similar to the forest distribution within the ground truth of the testing forest sample shown in Figure 13c. These feature extractions and visualizations could help us to understand how the model is working to gradually produce the expected information from the input testing sample.

3.4. Forest Mapping for Large Region Based on Proposed Method

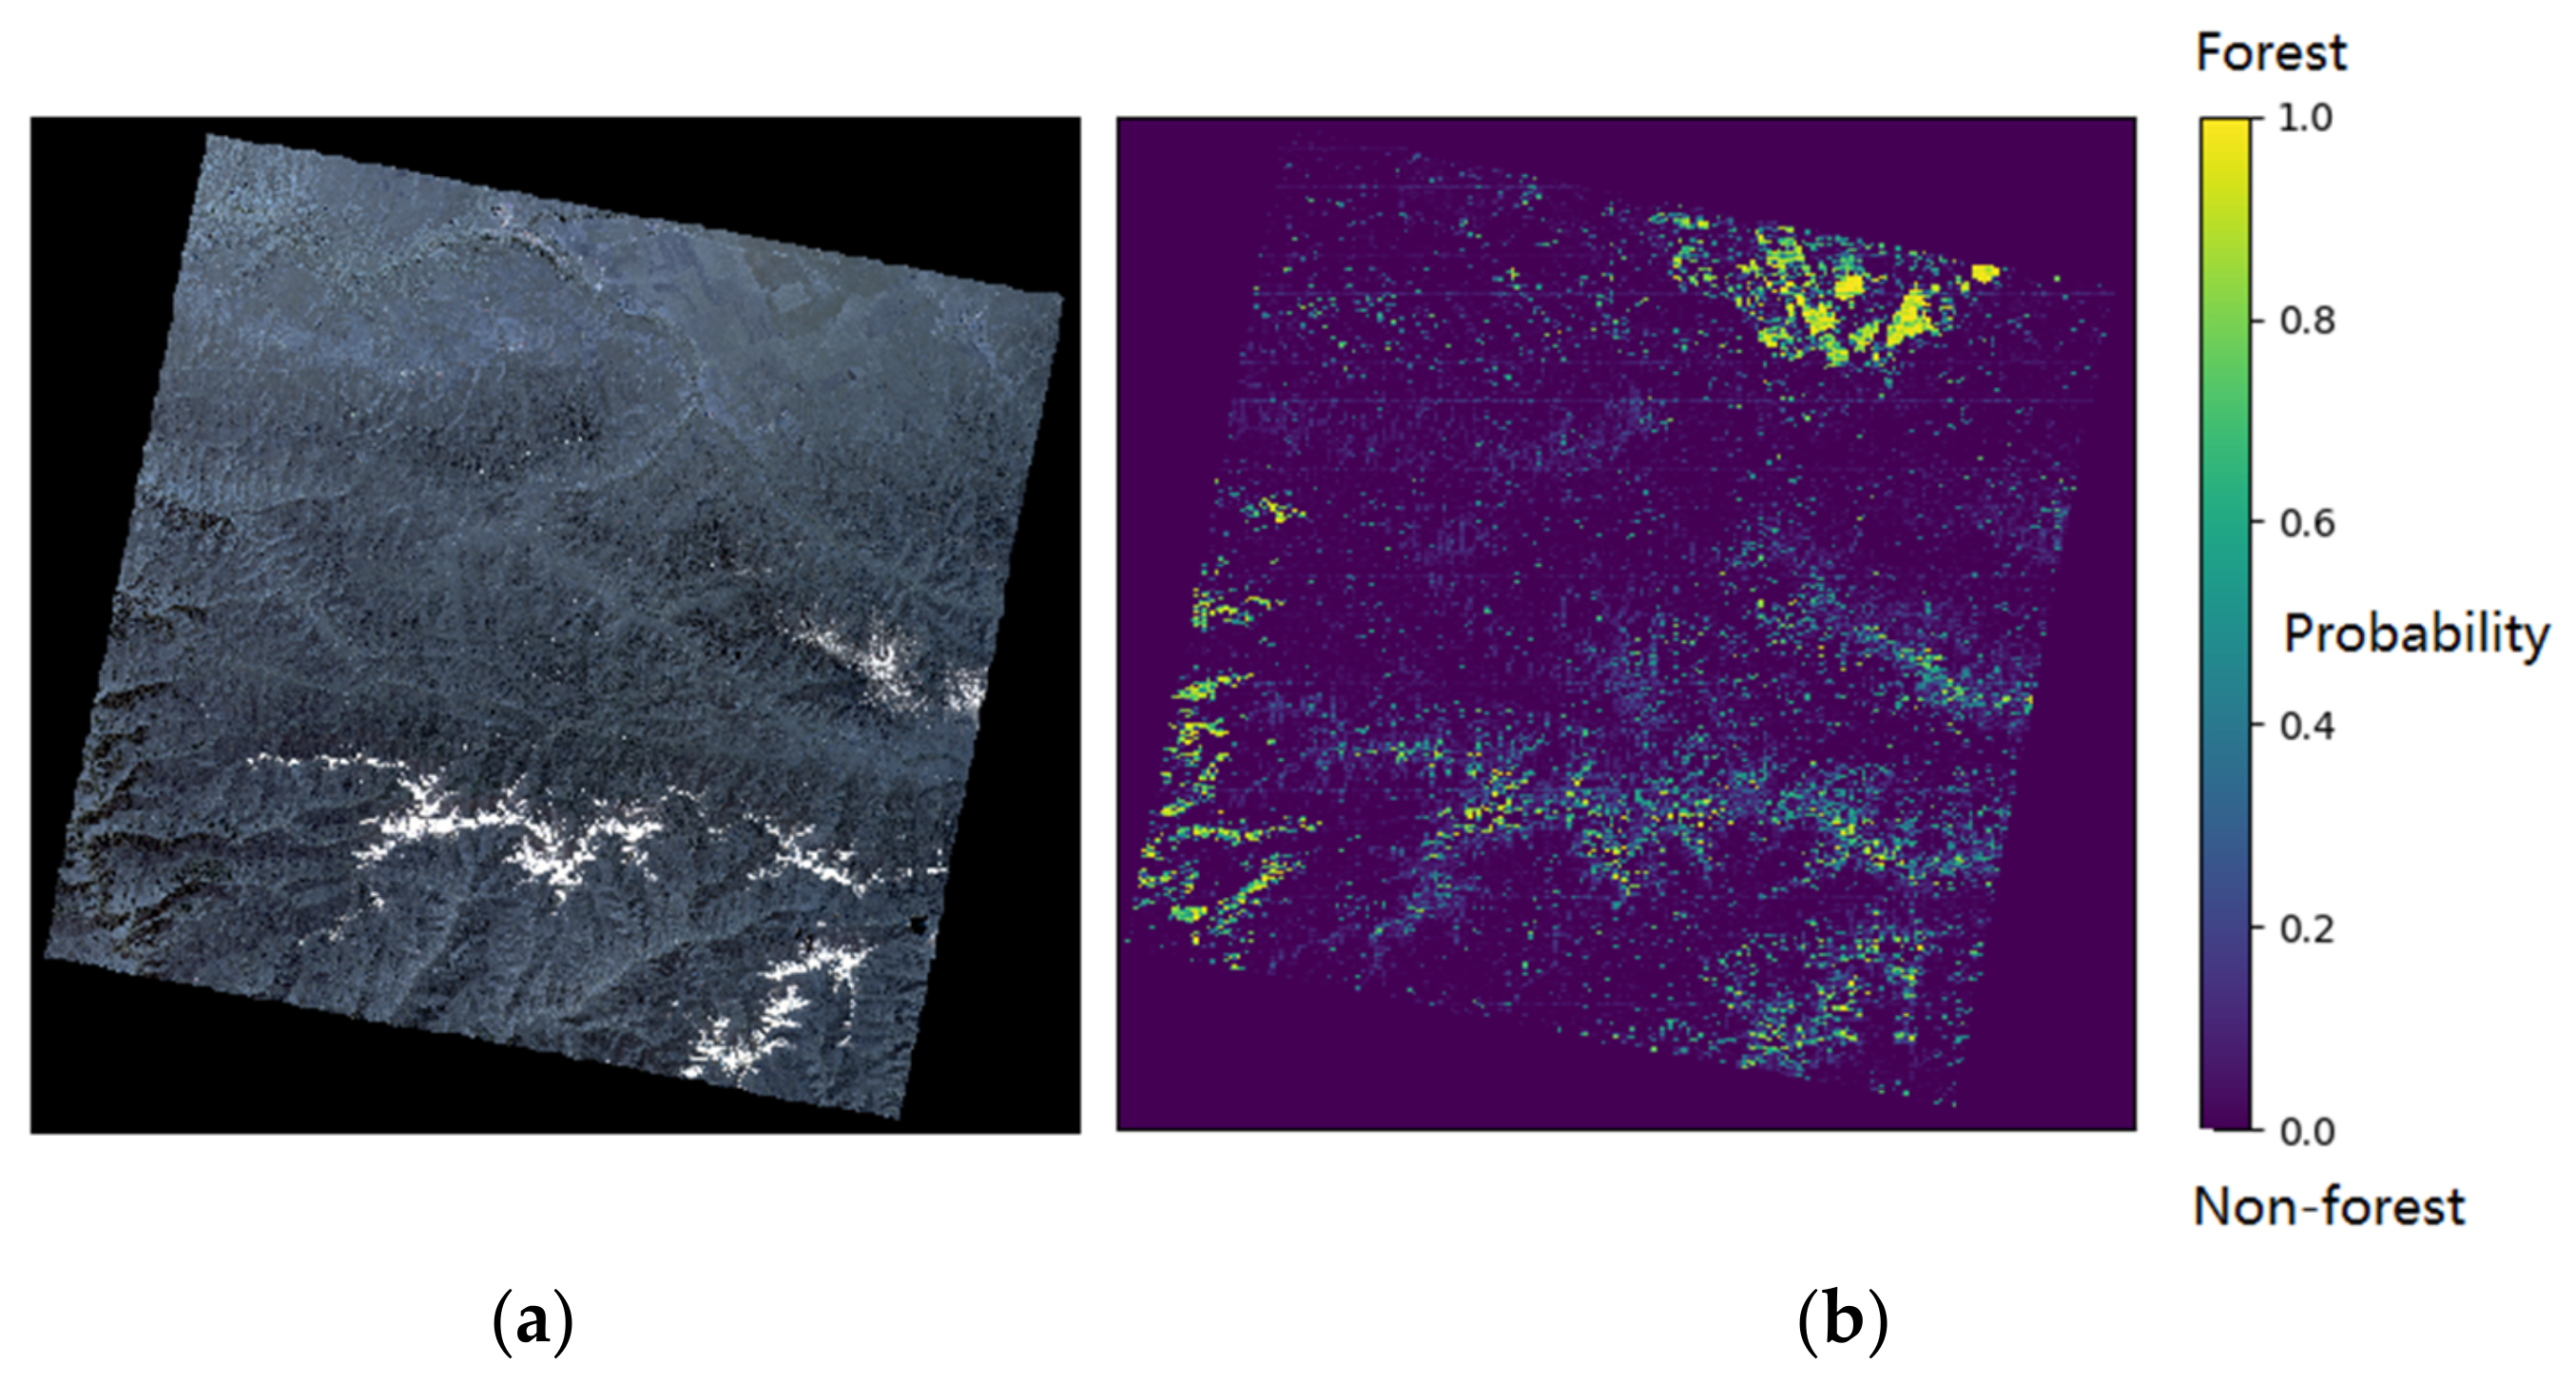
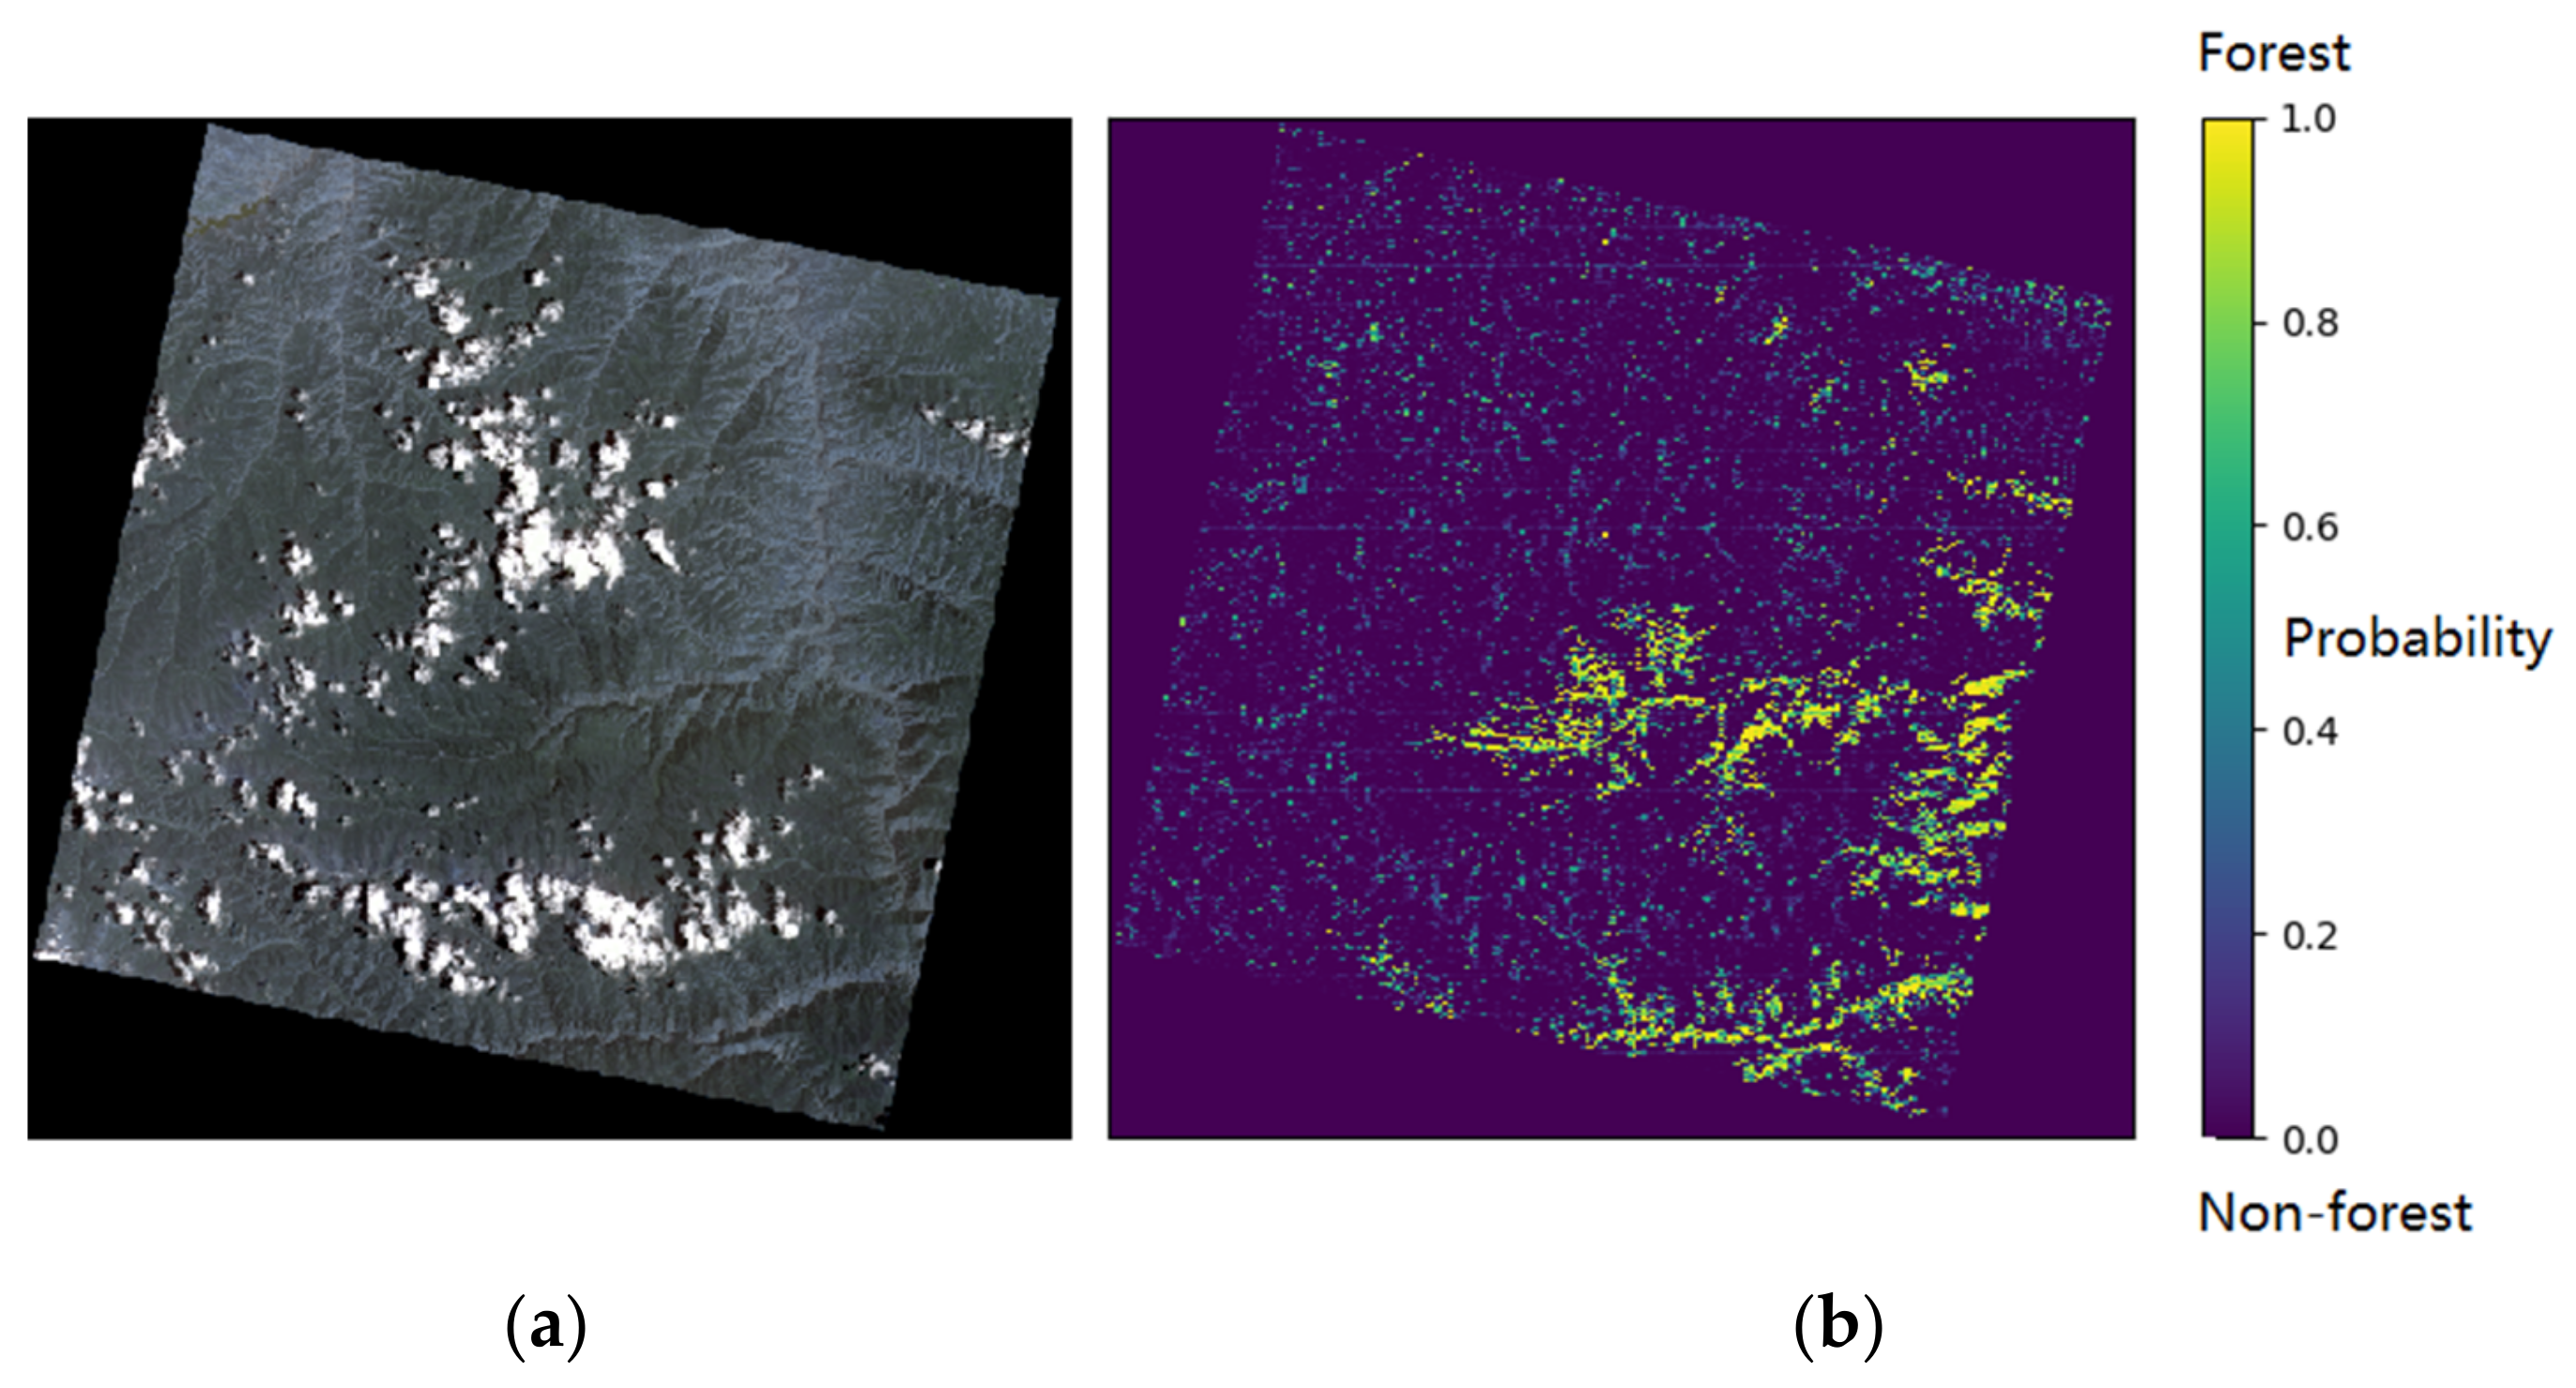
Here, we apply our proposed method to Sanjiangyuan Nature Reserve region based on ZY-3 satellite imagery, and accomplish large-scale plateau forest mapping. Figure 17, Figure 18 and Figure 19 show three examples for the mapping result in part of the Sanjiangyuan National Nature Reserve region. Specifically, Figure 17 and Figure 18 are randomly selected from the Sanjiangyuan, during May to June 2017. Each figure contains two sub-figures (a) and (b). Sub-figure (a) shows the visualization of the satellite image, in a false color style. Sub-figure (b) is the segmentation result generated by the proposed method. Especially, we utilized the sliding window style to generate large-scale satellite imagery segmentation result by using the proposed segmentation model. Here, each sub-figure (b) is composed of multiple segmentation results in the size of 128 × 128 pixels. Therefore, the size of each sub-figure (a) and each sub-figure (b) within Figure 17, Figure 18 and Figure 19 are consistent. Here, the unit of the value for each pixel within the sub-figure (b) is the probability of the forest. The value of the probability is range from 0 to 1, where 0 represents the non-forest region, and 1 represents the forest region. Thus, the closer the pixel value is to 1, the more likely the pixel is to be a forest region. Also, the closer the pixel value is to 0, the more likely the pixel is to be a non-forest region. It can be observed that most plateau forests marked in yellow are located on the mountain side, which matches the natural course in which most precipitation occurs near the mountainside, and provides reasonable mapping results for large-scale plateau forest monitoring.
Furthermore, we select the winter season in January of the same region toward Figure 18, and produce the forest mapping pipeline toward this imagery. It can be observed that the forest area previously shown in Figure 18 shows similar distribution in Figure 19. Also, we can observe some low-density yellow dots among the mountains, which are further discussed below.

4. Discussion

In this study, we design a semi-supervised based forest segmentation model, along with a large-scale plateau forest satellite imagery dataset.
We examine the model pre-training idea, by transforming the pre-training weight from the unsupervised model into the supervised segmentation model. Firstly, the performance of the model training process shows that the semi-supervised model combining the additional information transformed from the unlabeled data, could be trained faster, and better deals with the local minimum issue. Secondly, the comparison between the proposed and state-of-the-art object segmentation methods shows that the additional information acquired from the unlabeled satellite imagery could better help the semi-supervised model to segment the forest within the plateau region. Thirdly, by utilizing the proposed plateau forest dataset through the model training and testing process, the quality of the ground truth is validated and proves the dataset can provide useful information for the plateau forest community.
However, there are still some limitations. In the current version of the proposed dataset, the time period of the data covers each month in 2017. Due to the lack of the plateau forest satellite imagery ground truth, we manually create the ground truth for the data range from May to June in 2017 by visualizing and marking the forest region within the false color style satellite imagery. Thus, those samples under snowy weather have not been considered during the labeling process due to the difficulty of visualizing the tree covered by snow, and could cause locally low performance for the snow-covered region during the winter. One possible solution could be utilizing the multi-spatial satellite time series to locate the forest region without snow, and approximately label the region in the snowy season. Other possible solutions could be using multi-source satellite imagery to fill the gaps of the snow cover challenge.

5. Conclusions

Large-scale plateau forest mapping is an essential step for plateau forest monitoring. To overcome the challenges including the paucity of labeled data for plateau forests, and imbalance between the labeled and unlabeled data, we present a few-shot learning method for large-scale plateau forest mapping. Firstly, we design an unsupervised learning based model for domain knowledge extraction. Secondly, we propose a model fine-tuning method with semi-supervised learning for plateau forest segmentation using limited ground-truth data. Experiments show that our proposed few-shot learning method outperforms several state-of-the-art algorithms. These prove the idea that the proposed domain knowledge extraction and model fine-tuning processes could reasonably extract the information from the unlabeled data, and better help the large-scale plateau forest monitoring.
Most importantly, we represent the first 2 m resolution ZY-3 based Sanjiangyuan plateau forest segmentation dataset, including 38,708 plateau forest imagery samples and 1187 handmade accurate plateau forest ground truth masks. The dataset will be soon available online for the public. We believe this dataset could provide more labeled data information for the plateau forest monitoring community.
We also anticipate better segmentation results for long-term plateau forest monitoring if more accurate ground truth information during different seasons and locations is available for the training process. This can be further explored in our future work.

Author Contributions

Research conceptualization and methodology, Z.W. and X.J.; research resources and data curation, Z.W., K.J., P.L., Y.M., T.C. and G.F.; writing—original draft preparation, Z.W.; writing—review and editing, Z.W., K.J. and X.J.; supervision, K.J.; All authors have read and agreed to the published version of the manuscript.

Funding

This research was funded by the Basic Research Program of Qinghai Province, grant number 2020-ZJ-709, the Project for the National Natural Science Foundation of China, grant number 61672064, and Beijing Laboratory of Advanced Information Networks, grant number 0040000546319003 and PXM2019_014204_500029.

Institutional Review Board Statement

Not applicable.

Informed Consent Statement

Not applicable.

Data Availability Statement

Not applicable.

Acknowledgments

We thank Jiaqi Zhang and Tao Wang from Beijing University of Technology for the ground truth data labeling.

Conflicts of Interest

The authors declare no conflict of interest.

References

  1. Agarwal, S.; Vailshery, L.S.; Jaganmohan, M.; Nagendra, H. Mapping urban tree species using very high resolution satellite imagery: Comparing pixel-based and objectbased approaches. ISPRS Int. J. Geo.-Inf. 2013, 2, 220–236. [Google Scholar] [CrossRef]
  2. Belgiu, M.; Drăgu, L. Random forest in remote sensing: A review of applications and future directions. ISPRS J. Photogramm. Remote Sens. 2016, 114, 24–31. [Google Scholar] [CrossRef]
  3. Li, L.; Li, F.X.; Guo, A.H. Study on the climate change trend and its catastrophe over “Sanjiangyuan” region in recent 43 years. J. Nat. Res. 2006, 21, 79–85. [Google Scholar]
  4. Duro, D.C.; Coops, N.C.; Wulder, M.A.; Han, T. Development of a large area biodiversity monitoring system driven by remote sensing. Prog. Phys. Geog. 2007, 31, 235–260. [Google Scholar] [CrossRef]
  5. Dymond, C.C.; Mladenoff, D.J.; Radeloff, V.C. Phenological differences in Tasseled Cap indices improve deciduous forest classification. Remote Sens. Environ. 2002, 80, 460–472. [Google Scholar] [CrossRef]
  6. Defries, R.S.; Townshend, J.R.G. NDVI-Derived Land Cover Classification at a Global Scale. Int. J. Remote Sens. 1994, 15, 3567–3586. [Google Scholar] [CrossRef]
  7. Arii, M.; van Zyl, J.J.; Kim, Y. A general characterization for polarimetric scattering from vegetation canopies. IEEE Trans. Geosci. Remote Sens. 2010, 48, 3349–3357. [Google Scholar] [CrossRef]
  8. Wang, C.; Wang, J.; Naudiyal, N.; Wu, N.; Cui, X.; Wei, Y.; Chen, Q. Multiple Effects of Topographic Factors on Spatio-temporal Variations of Vegetation Patterns in the Three Parallel Rivers Region, Southeast Tibet. Remote Sens. 2022, 14, 151. [Google Scholar] [CrossRef]
  9. Hasegawa, K.; Matsuyama, H.; Tsuzuki, H.; Sweda, T. Improving the estimation of leaf area index by using remotely sensed NDVI with BRDF signatures. Remote Sens. Environ. 2010, 114, 514–519. [Google Scholar] [CrossRef]
  10. Chen, X.; Yang, D.; Chen, J.; Cao, X. An improved automated land cover updating approach by integrating with downscaled NDVI time series data. Remote Sens. Lett. 2015, 6, 29–38. [Google Scholar] [CrossRef]
  11. Gim, H.-J.; Ho, C.-H.; Jeong, S.; Kim, J.; Feng, S.; Hayes, M.J. Improved mapping and change detection of the start of the crop growing season in the US Corn Belt from long-term AVHRR NDVI. Agric. For. Meteorol. 2020, 294, 108143. [Google Scholar] [CrossRef]
  12. Martinuzzi, S.; Gould, W.A.; González, O.M.R.; Robles, A.M.; Maldonado, P.C.; Buitrago, N.P.; Cabán, J.J.F. Mapping tropical dry forest habitats integrating Landsat NDVI, Ikonos imagery, and topographic information in the Caribbean Island of Mona. Rev. Biol. Trop. 2008, 56, 625–639. [Google Scholar] [CrossRef] [Green Version]
  13. Singh, B.; Jeganathan, C.; Rathore, V.S. Improved NDVI based proxy leaf-fall indicator to assess rainfall sensitivity of deciduousness in the central Indian forests through remote sensing. Sci. Rep. 2020, 10, 17638. [Google Scholar] [CrossRef]
  14. Zhang, Y.; Ling, F.; Foody, G.M.; Ge, Y.; Boyd, D.S.; Li, X.; Du, Y.; Atkinson, P. Mapping annual forest cover by fusing PALSAR/PALSAR-2 and MODIS NDVI during 2007–2016. Remote Sens. Environ. 2019, 224, 74–91. [Google Scholar] [CrossRef] [Green Version]
  15. Quegan, S.; Le Toan, T.; Yu, J.; Ribbes, F.; Floury, N. Multitemporal ERS SAR analysis applied to forest mapping. IEEE Trans. Geosci. Remote Sens. 2000, 38, 741–753. [Google Scholar] [CrossRef]
  16. Melgani, F.; Bruzzone, L. Classification of hyperspectral remote sensing images with support vector machines. IEEE Trans. Geosci. Remote Sens. 2004, 42, 1778–1790. [Google Scholar] [CrossRef] [Green Version]
  17. Pal, M. Random forest classifier for remote sensing classification. Int. J. Remote Sens. 2005, 26, 217–222. [Google Scholar] [CrossRef]
  18. Bruzzone, L.; Chi, M.; Marconcini, M. A novel transductive SVM for semisupervised classification of remote-sensing images. IEEE Trans. Geosci. Remote Sens. 2006, 44, 3363–3373. [Google Scholar] [CrossRef] [Green Version]
  19. Pal, M.; Mather, P.M. Support vector machines for classification in remote sensing. Int. J. Remote Sens. 2005, 26, 1007–1011. [Google Scholar] [CrossRef]
  20. Zheng, S.; Shi, W.; Liu, J.; Tian, J. Remote Sensing Image Fusion Using Multiscale Mapped LS-SVM. IEEE Trans. Geosci. Remote Sens. 2008, 46, 1313–1322. [Google Scholar] [CrossRef]
  21. Chi, M.; Feng, R.; Bruzzone, L. Classification of hyperspectral remote-sensing data with primal SVM for small-sized training dataset problem. Adv. Space Res. 2008, 41, 1793–1799. [Google Scholar] [CrossRef]
  22. Gislason, P.O.; Benediktsson, J.A.; Sveinsson, J.R. Random Forest Classification of Multisource Remote Sensing and Geographic Data. In Proceedings of the 2004 IEEE International Geoscience and Remote Sensing Symposium, IGARSS’04, Anchorage, AK, USA, 20–24 September 2004; 2004. [Google Scholar]
  23. Canovas-Garcia, F.; Alonso-Sarria, F.; Gomariz-Castillo, F.; Oñate-Valdivieso, F. Modification of the random forest algorithm to avoid statistical dependence problems when classifying remote sensing imagery. Comput. Geosci. 2017, 103, 1–11. [Google Scholar] [CrossRef] [Green Version]
  24. Hayes, M.M.; Miller, S.N.; Murphy, M.A. High-resolution landcover classification using Random Forest. Remote Sens. Lett. 2014, 5, 112–121. [Google Scholar] [CrossRef]
  25. Asefa, T.; Kemblowski, M.; Lall, U.; Urroz, G. Support vector machines for nonlinear state space reconstruction: Application to the great salt lake time series. Water Resour. Res. 2005, 41, 1–10. [Google Scholar] [CrossRef] [Green Version]
  26. Schuldt, C.; Laptev, I.; Caputo, B. Recognizing human actions: A local SVM approach. In Proceedings of the International Conference on Pattern Recognition, Cambridge, UK, 23–26 August 2004; pp. 32–36. [Google Scholar]
  27. Hu, C.; Wang, L.; Li, Z.; Zhu, D. Inverse Synthetic Aperture Radar Imaging Using a Fully Convolutional Neural Network. IEEE Geosci. Remote Sens. 2020, 17, 1203–1207. [Google Scholar] [CrossRef]
  28. Ronneberger, O.; Fischer, P.; Brox, T. U-net: Convolutional networks for biomedical image segmentation. Proc. Int. Conf. Med. Image Comput. Comput.-Assist. Interv. 2015, 9351, 234–241. [Google Scholar]
  29. Jia, X.; Li, S.; Khandelwal, A.; Nayak, G.; Karpatne, A.; Kumar, V. Spatial Context-Aware Networks for Mining Temporal Discriminative Period in Land Cover Detection. In Proceedings of the 2019 SIAM International Conference on Data Mining (SDM), Calgary, AB, Canada, 2–4 May 2019. [Google Scholar]
  30. Pelletier, C.; Webb, G.I.; Petitjean, F. Temporal Convolutional Neural Network for the Classification of Satellite Image Time Series. Remote Sens. 2019, 11, 523. [Google Scholar] [CrossRef] [Green Version]
  31. Waldner, F.; Diakogiannis, F.I. Deep Learning on Edge: Extracting Field Boundaries from Satellite Images with a Convolutional Neural Network. Remote Sens. Environ. 2020, 245, 111741. [Google Scholar] [CrossRef]
  32. Omer, G.; Mutanga, O.; Abdel-Rahman, E.M.; Adam, E. Performance of support vector machines and artificial neural network for mapping endangered tree species using WorldView-2 data in Dukuduku forest, South Africa. IEEE J. Sel. Top. Appl. Earth Obs. Remote Sens. 2015, 8, 4825–4840. [Google Scholar] [CrossRef]
  33. Ibtehaz, N.; Rahman, M.S. MultiResUNet: Rethinking the U-Net architecture for multimodal biomedical image segmentation. Neural Netw. 2020, 121, 74–87. [Google Scholar] [CrossRef]
  34. Wei, Z.; Jia, K.; Jia, X.; Khandelwal, A.; Kumar, V. Global River Monitoring Using Semantic Fusion Networks. Water 2020, 12, 2258. [Google Scholar] [CrossRef]
  35. Wang, Y.; Ziv, G.; Adami, M.; Mitchard, E.; Batterman, S.A.; Buermann, W.; Marimon, B.S.; Junior, B.H.; Reis, S.M.; Rodrigues, D.; et al. Mapping tropical disturbed forests using multi-decadal 30m optical satellite imagery. Remote Sens. Environ. 2019, 221, 474–488. [Google Scholar] [CrossRef]
  36. Wei, Z.; Jia, K.; Jia, X.; Xie, Y.; Jiang, Z. Large-Scale River Mapping Using Contrastive Learning and Multi-Source Satellite Imagery. Remote Sens. 2021, 13, 2893. [Google Scholar] [CrossRef]
  37. Rendenieks, Z.; Nita, M.D.; Nikodemus, O.; Radeloff, V.C. Half a century of forest cover change along the Latvian-Russian border captured by object-based image analysis of Corona and Landsat TM/OLI data. Remote Sens. Environ. 2020, 249, 1–14. [Google Scholar] [CrossRef]
  38. Lin, X.; Niu, J.; Berndtsson, R.; Yu, X.; Zhang, L.; Chen, X. NDVI Dynamics and Its Response to Climate Change and Reforestation in Northern China. Remote Sens. 2020, 12, 4138. [Google Scholar] [CrossRef]
  39. Feng, Y.; Negrón-Juárez, R.I.; Chambers, J.Q. Remote sensing and statistical analysis of the effects of hurricane María on the forests of Puerto Rico. Remote Sens. Environ. 2020, 247, 1–13. [Google Scholar] [CrossRef]
  40. Kharuk, V.I.; Ranson, K.J.; Im, S.T.; Oskorbin, P.A.; Dvinskaya, M.L.; Ovchinnikov, D.V. Tree-Line Structure and Dynamics at the Northern Limit of the Larch Forest: Anabar Plateau, Siberia, Russia. Arct. Antarct. Alp. Res. 2013, 45, 526–537. [Google Scholar] [CrossRef] [Green Version]
  41. Wang, N.; Xue, J.; Peng, J.; Biswas, A.; He, Y.; Shi, Z. Integrating Remote Sensing and Landscape Characteristics to Estimate Soil Salinity Using Machine Learning Methods: A Case Study from Southern Xinjiang, China. Remote Sens. 2020, 12, 4118. [Google Scholar] [CrossRef]
  42. Srivastava, N.; Hinton, G.; Krizhevsky, A.; Sutskever, I.; Salakhutdinov, R. Dropout: A Simple Way to Prevent Neural Networks from Overfitting. J. Mach. Learn. Res. 2014, 15, 1929–1958. [Google Scholar]
  43. Cui, Y.; Long, D.; Hong, Y.; Zeng, C.; Zhou, J.; Han, Z.; Liu, R.; Wan, W. Validation and reconstruction of FY-3B/MWRI soil moisture using an artificial neural network based on reconstructed MODIS optical products over the Tibetan Plateau. J. Hydrol. 2016, 543, 242–254. [Google Scholar] [CrossRef]
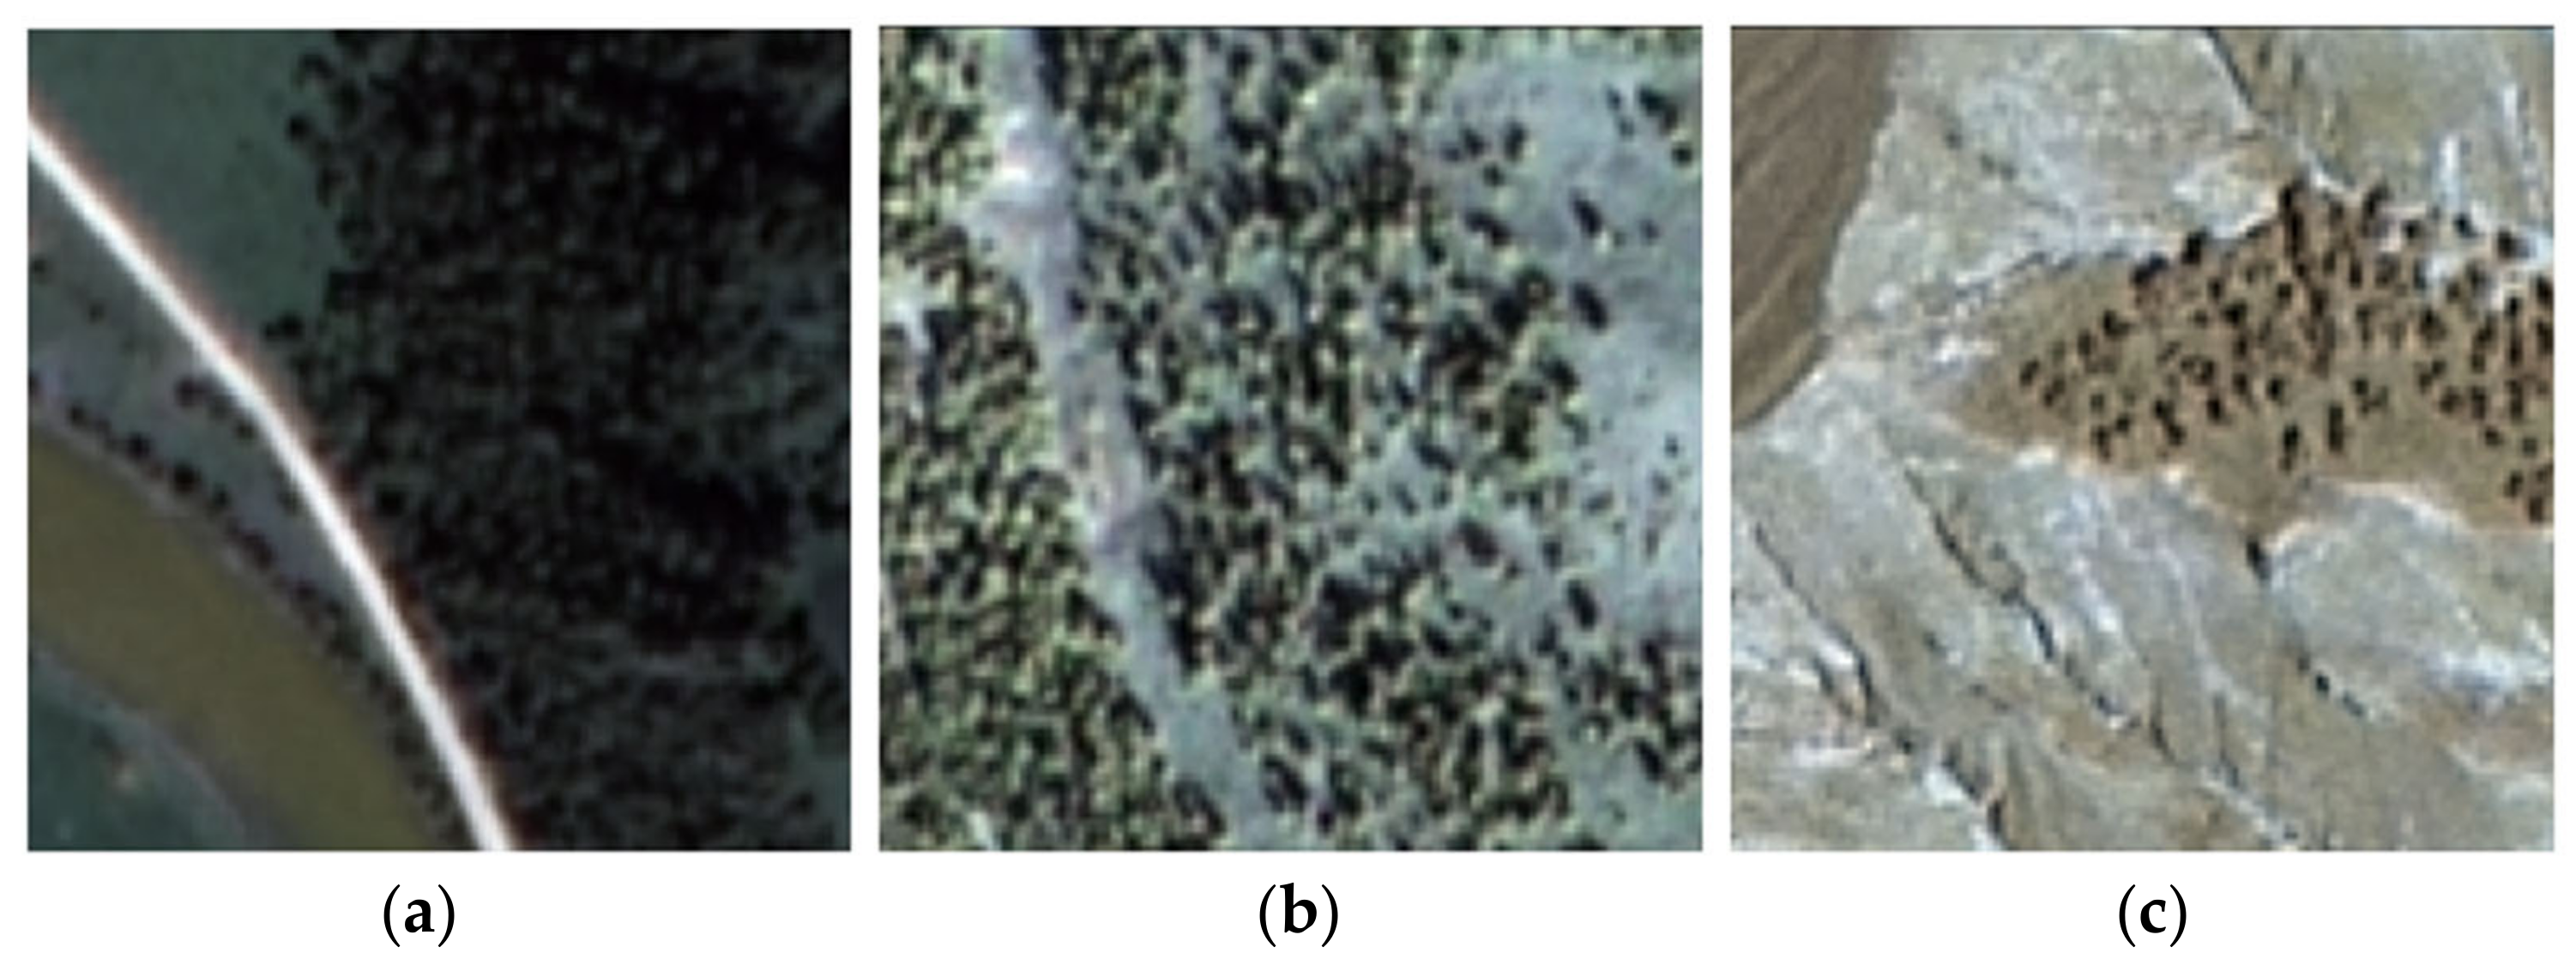
Figure 1. Different types of forest community located in Sanjiangyuan National Nature Reserve: (a) high-density forest community, (b) medium-density forest community, (c) low-density forest community.
Remotesensing 14 00388 g001
Figure 2. Sanjiangyuan National Nature Reserve is located in the southern part of Qinghai Province, China. Two purple diamond marks A and B represents the location of the current proposed dataset: the mark A in the middle of Sanjiangyuan is located in Yushu County, Qinghai Province; The mark B in the eastern part of Sanjiangyuan is located in Guoluo County, Qinghai Province.
Remotesensing 14 00388 g002
Figure 3. The sample and ground truth visualization for an example within the proposed dataset: (a) false color composite image, (b) manual ground truth.
Remotesensing 14 00388 g003
Figure 4. The clustering results for the labeled samples within the proposed dataset: each dot represents a labeled sample; each red circle represents a random selected category, and has been further visualized by false color images in Figure 5.
Remotesensing 14 00388 g004
Figure 5. Categories visualization for forest samples from Figure 4: (a) category 1, (b) category 2 (c) category 3.
Remotesensing 14 00388 g005
Figure 6. The structure of the proposed plateau forest monitoring methods.
Remotesensing 14 00388 g006
Figure 7. Unsupervised learning-based model for domain knowledge extraction. The function of the layer blocks are explained as follow: ‘Input’ represents an input layer; ‘Conv 3 × 3’ represents a convolutional layer with an kernel size of 3 × 3; ‘Max Pooling’ represents a max pooling layer; ‘Dropout’ represents a dropout layer for avoiding over-fitting; ‘Up Sampling’ represents an up sampling layer; ‘Connect’ represents the connection layer, the connection layer with the same number as connecting with each other; ‘Conv 2 × 2’ represents a convolutional layer with an kernel size of 2 × 2; ‘Conv 1 × 1’ represents a convolutional layer with an kernel size of 1 × 1; ‘NDVI Output’ represents an output layer that using normalized difference vegetation index (NDVI) as ground truth validation; ‘RVI Output’ represents an output layer that using ratio vegetation index (RVI) as ground truth validation.
Remotesensing 14 00388 g007
Figure 8. Structure of semi-supervised learning based model for plateau forest segmentation using the knowledge transformed from the unsupervised learning based model. The function of the layer blocks are explained as follows: ‘Input’ represents an input layer; ‘Conv 3 × 3’ represents a convolutional layer with an kernel size of 3 × 3; ‘Max Pooling’ represents a max pooling layer; ‘Dropout’ represents a dropout layer for avoiding over-fitting; ‘Up Sampling’ represents an up sampling layer; ‘Connect’ represents the connection layer, the connection layer with the same number as connecting with each other; ‘Conv 2 × 2’ represents a convolutional layer with an kernel size of 2 × 2; ‘Conv 1 × 1’ represents a convolutional layer with an kernel size of 1 × 1; ‘Output’ represents an output layer.
Remotesensing 14 00388 g008
Figure 9. The training curve of the unsupervised learning based model for domain knowledge extraction.
Remotesensing 14 00388 g009
Figure 10. Figures of the high density plateau forest results: (a) false color composite image for sample visualization; (b) NDVI prediction; (c) NDVI ground truth; (d) RVI prediction; (e) RVI ground truth. The first row represents a high-density forest testing sample, and the second row represents a low-density forest testing sample.
Remotesensing 14 00388 g010
Figure 11. The training curves based on the proposed method and compared supervised learning UNET method, each curve represents the average of 10 times model training following the corresponding method: (a) the training accuracy curves; (b) the training loss curves.
Remotesensing 14 00388 g011
Figure 12. Comparison of segmentation results for the proposed method and other methods: (a) test sample’s false color composite image; (b) test sample’s ground truth; (c) normalized difference vegetation index (NDVI); (d) ratio vegetation index (RVI); (e) random forest (RF); (f) support vector machine (SVM); (g) UNET; (h) proposed method. Each row represents a test sample visualization and model segmentation, the samples are ordered based on the follow steps: we randomly select 2 test samples during the 100, 300, 500, 700 training sample models testing process, thus the first two rows of this figure represents two samples from the 100 training sample models testing process, and the rest are from the 300, 500, 700 training sample models testing process. The red circle within each row of column (h) represents the significant segmentation result improvement of the proposed method, while being compared with other state-of-the-art methods.
Remotesensing 14 00388 g012
Figure 13. Figures of a random selected testing sample’ visualization: (a) false color composite image; (b) samples’ ground truth; (c) the segmentation results of the proposed method.
Remotesensing 14 00388 g013
Figure 14. The visualization of the four resolution stage’s feature maps in encoding part of the model proposed in Figure 8: (a) input of the first max pooling layer; (b) input of the second max pooling layer; (c) input of the third max pooling layer; (d) input of the fourth max pooling layer. Each column represents a randomly selected kernel within the corresponding max pooling layer.
Remotesensing 14 00388 g014
Figure 15. The visualization of the high-dimension feature map of the model proposed in Figure 8: each subfigure for column (ac) comes from a randomly selected kernel.
Remotesensing 14 00388 g015
Figure 16. The visualization of the four resolution stage’s feature maps in decoding part of the model proposed in Figure 8: (a) input of the first up-sampling layer; (b) input of the second up-sampling layer; (c) input of the third up-sampling layer; (d) input of the fourth up-sampling layer. Each column represents a random selected kernel within the corresponding up-sampling layer.
Remotesensing 14 00388 g016
Figure 17. Visualization of a ZY-3 satellite imagery for Western part of Sanjiangyuan National Nature Reserve, at 12 May 2017: (a) false color composite images; (b) the plateau forest segmentation based on the proposed method.
Remotesensing 14 00388 g017
Figure 18. Visualization of a ZY-3 satellite imagery of eastern part of Sanjiangyuan National Nature Reserve on 30 June 2017: (a) false color composite images; (b) the plateau forest segmentation based on the proposed method.
Remotesensing 14 00388 g018
Figure 19. Visualization of a ZY-3 satellite imagery of Eastern part of Sanjiangyuan National Nature Reserve, on 9 January 2017: (a) false color composite images; (b) the plateau forest segmentation based on the proposed method.
Remotesensing 14 00388 g019
Table 1. Detail information for ZY-3 satellite imagery.
Parameter TypeDetail
temporal resolution5 days
spatial resolution2 m
spectral range0.45–0.89 μm
orbital altitude505.984 km
Table 2. Detail information for the proposed dataset.
Parameter TypeDetail
data sourcesZY-3 satellite imagery
sample38,708
manual ground truth1187
sample size128 × 128 pixels
manual ground truth size128 × 128 pixels
resolution for each pixel2 m
period of the dataJanuary 2017–December 2017
period of the manual ground truthMay 2017–June 2017
Table 3. The algorithms training processes’ parameters.
AlgorithmParameterValue
NDVIThreshold0.1
RVIThreshold0.01
RFCriterionGini
SVMKernel TypeRBF
UNETLearning Rate0.0001
Loss functionBinary Cross Entropy
Proposed MethodLearning Rate0.0001
Loss functionMean Squared Error, Binary Cross Entropy
Note: NDVI: normalized difference vegetation index, RVI: ratio vegetation index, RF: random forest, SVM: support vector machine, U-Net (UNET), PROPOSED: proposed method.
Table 4. Comparison of segmentation among different methods.
Train SamplesNDVIRVIRFSVMUNETPROPOSED
F1PRF1PRF1PRF1PRF1PRF1PR
10043.0959.3247.3851.2150.7667.6367.0276.8365.0772.2380.3572.6173.2895.4865.7384.2396.3279.09
30045.4054.2252.1151.0747.5171.0262.7372.1662.0771.6974.5377.9581.9194.0480.8986.3997.5582.59
50047.2860.1849.3648.8443.6976.2561.6562.8171.9469.2368.6882.5283.8593.5784.2586.7695.2086.53
70043.8846.5352.2651.0546.9068.0167.4670.3371.8773.8179.6574.0192.7893.9590.6292.9093.9791.75
Average44.9155.0650.2850.5447.2270.7364.7270.5367.7471.7475.8076.7782.9694.2680.3787.5795.7684.99
Note: F1: f1 score, P: precision, R: recall, NDVI: normalized difference vegetation index, RVI: ratio vegetation index, RF: random forest, SVM: support vector machine, UNET: UNET, PROPOSED: proposed method.
Publisher’s Note: MDPI stays neutral with regard to jurisdictional claims in published maps and institutional affiliations.