Abstract
The large-scale development and utilization of coal resources have brought great challenges to the ecological environment of coal-mining areas. Therefore, this paper has used scientific and effective methods to monitor and evaluate whether changes in ecological environment quality in coal-mining areas are helpful to alleviate the contradiction between human and nature and realize the sustainable development of such coal-mining areas. Firstly, in order to quantify the degree of coal dust pollution in coal-mining areas, an index-based coal dust index (ICDI) is proposed. Secondly, based on the pressure-state-response (PSR) framework, a new coal-mine ecological index (CMEI) was established by using the principal component analysis (PCA) method. Finally, the coal-mine ecological index (CMEI) was used to evaluate and detect the temporal and spatial changes of the ecological environment quality of the Ningwu Coalfield from 1987 to 2021. The research shows that ICDI has a strong ability to extract coal dust with an overall accuracy of over 96% and a Kappa coefficient of over 0.9. As a normalized difference index, ICDI can better quantify the pollution degree of coal dust. The effectiveness of CMEI was evaluated by four methods: sample image-based, classification-based, correlation-based, and distance-based. From 1987 to 2021, the ecological environment quality of Ningwu Coalfield was improved, and the mean of CMEI increased by 0.1189. The percentages of improvement and degradation of ecological environment quality were 71.85% and 27.01%, respectively. The areas with obvious degradation were mainly concentrated in coal-mining areas and built-up areas. The ecological environment quality of Pingshuo Coal Mine, Shuonan Coal Mine, Xuangang Coal Mine, and Lanxian Coal Mine also showed improvement. The results of Moran’s Index show that CMEI has a strong positive spatial correlation, and its spatial distribution is clustered rather than random. Coal-mining areas and built-up areas showed low–low clustering (LL), while other areas showed high–high clustering (HH). The utilization and popularization of CMEI provides an important reference for decision makers to formulate ecological protection policies and implement regional coordinated development strategies.
1. Introduction
Since the reform and opening-up, China’s economic construction has achieved remarkable achievements, which benefited from China’s long-term development and utilization of coal resources. Although China has started an energy transition plan to gradually transition from fossil energy to clean energy [1], the resource endowment characteristics of “rich coal, poor oil, and little gas” determine that coal is still the cornerstone of China’s long-term development [2]. It is estimated that China’s total energy consumption will reach its peak by 2040, about 5.9 × 10⁹ tce, of which coal still accounts for 30% [3]. Over the past 40 years, China has produced more than 80 billion tons of raw coal. Such large-scale and ultra-intensive coal-mining activities are bound to have a great impact on the ecological environment of the coal-mining areas. It is mainly manifested as surface subsidence [4], destruction of landscape pattern [5,6], decline of soil quality [7], degradation of ecosystem structure and function [8,9], spontaneous combustion of coal and coal gangue [10,11], and water and air pollution [12,13]. Previous studies have shown that underground mining of every 10,000 tons of coal will lead to surface subsidence of 2000–3300 m2 [14]. At present, China’s total area of coal-mining subsidence has exceeded that of the United States, Germany, Australia, and other countries, ranking first in the world, about 1.35 × 10⁴ km2, and growing at a rate of 700 km2 per year. Compared with underground mining, opencast mining of coal damages the surface ecological environment more seriously. According to statistics, 2400 m2 of land will be directly damaged by opencast mining for every 10,000 tons of coal, and such damage is often irreversible [15]. Therefore, scientifically and rationally evaluating the ecological environment quality in coal-mining areas and grasping the law of its evolution in time is essential for quantifying the impact of coal-mining activities and promoting regional sustainable development.
The rapid development of remote-sensing earth-observation technology has provided strong technical support for the ecological environment monitoring in cities, mining areas, wetlands, forests, and other regions [16,17,18,19]. A variety of remote-sensing indexes obtained from satellite images have been widely used to evaluate the ecological environment quality of a region and describe its temporal and spatial evolution, such as the normalized difference vegetation index (NDVI), modified normalized difference water index (MNDWI), ratio-normalized difference soil index (RNDSI), index-based built-up index (IBI), normalized difference impervious surface index (NDISI), leaf area index (LAI), and land-surface temperature (LST) [20,21,22,23,24,25,26]. However, a single indicator has limited explanatory power for the ecological environment quality, because it ignores the contribution of other ecological environmental factors, while a comprehensive indicator can reveal more features related to the ecological environment quality [27].
In 2015, the Ministry of Environmental Protection of China proposed the Ecological Environment Index (EI). EI is calculated by the weighted summation of six indexes: the biological richness index, vegetation coverage index, water network denseness index, land stress index, pollution load index, and environmental restriction index. It is suitable for evaluating the ecological environment quality at county level and above [28,29]. However, the selection of EI indicators is more cumbersome, and the setting of indicator weights is not objective. The calculated result is a numerical value, which cannot describe the spatial distribution of ecological environment quality [30]. In view of this, many studies have used indicators based entirely on remote sensing, and integrated various indicators by using principal component analysis (PCA), and automatically assigned weights based on the contribution of each indicator to each principal component, thereby constructing a comprehensive evaluation index. For example, Xu et al. [31] proposed the remote-sensing ecological index (RSEI) based on the four indicators of greenness, wetness, dryness, and heat to evaluate and predict the ecological conditions of the Xiong’an New Area. Zhu et al. [32] integrated soil-adjusted vegetation index (SAVI), normalized difference moisture index (NDMI), normalized difference soil index (NDSI), and normalized difference build-up index (NDBI) to establish integrated ecological index (IEI), which reflects the surface ecological conditions and thermal environmental effects of Xi’an in the past 20 years. Yang et al. [33] integrated vegetative cover (VC), vegetative health index (VHI), normalized differential build-up, and bare soil index (NDBSI), land-surface moisture (LSM), and land-surface temperature (LST) to construct a comprehensive ecological evaluation index (CEEI), which reveals the impact of the urbanization movement from 1987 to 2017 on the ecological quality of Guangdong–Hong Kong–Macau Greater Bay Area (GBA) of China.
Although the existing comprehensive evaluation indicators based on remote sensing are often used to evaluate the ecological environment quality of coal-mining areas [34,35], most of these indicators are created for urban areas [36,37,38]. Compared with urban areas, the ecological environment of coal-mining areas is more fragile, and the surface biophysical characteristics are more complex [39]. Coal dust is solid fine particles produced during coal mining and processing. With the long-term transportation and storage of coal, coal dust is easily released into the air and soil under the action of external forces, and gradually accumulates as part of the surface landscape of coal-mining areas [40]. Studies have shown that the diffusion of coal dust will not only pollute the air and soil [41,42], but also reduce the photosynthetic efficiency of vegetation [43]. In addition, coal dust is easy to cause explosions and fires under certain conditions, which brings great potential safety hazards to coal-mine areas and the surrounding environment [44]. Therefore, it is necessary to incorporate the pollution degree of coal dust into the ecological environment evaluation system of coal mine areas.
The purpose of this research is to: (1) propose a new remote-sensing index for detecting coal dust, which can be used to quantify the pollution degree of coal dust in coal-mining areas; (2) integrate the normalized difference vegetation index (NDVI), vegetative health index (VHI), wetness component (Wet), normalized differential build-up and bare soil index (NDBSI), index-based coal dust index (ICDI), and land-surface temperature (LST) to establish a coal-mine ecological index (CMEI) suitable for ecological environment assessment in coal-mining areas; (3) reveal the temporal and spatial evolution of the ecological environment quality of Ningwu Coalfield from 1987 to 2021.
2. Study Area and Data
2.1. Study Area
Ningwu Coalfield is located in the north–central area of Shanxi Province (38°07′31″–39°38′41″N and 111°39′23″–112°34′07″E) (Figure 1), across Shuozhou City, Xinzhou City, Luliang City, and Taiyuan City, with a total area of 3522.64 km2. It is one of China’s 14 billion-ton national key coal bases and one of the six largest coal fields in Shanxi Province. Ningwu Coalfield is composed of Pingshuo Coal Mine, Shuonan Coal Mine, Xuangang Coal Mine, and Lanxian Coal Mine from north to south. The coal resources of Ningwu Coalfield are 70 billion tons and the coal reserves are 39 billion tons, making it one of the important producing areas of thermal coal in Shanxi. Among them, Pingshuo Coal Mine is the largest and most technologically advanced opencast coal mine in China. It includes three large opencast coal mines, Antaibao Coal Mine, Anjialing Coal Mine, and East Opencast Coal Mine, with a designed annual output of 45 million tons of coal. Shuonan Coal Mine is the main follow-up development zone of the Jinbei Coal Base, with a designed annual output of 36 million tons of coal. Xuangang Coal Mine is divided into three mine fields, one exploration area, and three resource integration areas, with a designed annual output of 7.5 million tons of coal. Lanxian Coal Mine is mainly used for underground mining, with a designed annual output of 12.7 million tons of coal. The study area is a typical Loess Plateau landform feature, the terrain is mainly mountainous and hilly, and the elevation of the whole area is above 1000 m (Figure 1b). Ningwu coalfield is located in a temperate continental climate, with annual average temperature of 6.2 °C and annual precipitation of 470–770 mm, of which 85% is concentrated in summer and autumn. In the whole coal field, there are typical land cover types in various coal-mining areas, such as industrial and mining land, built-up land, vegetation, bare land, and water area. These typical land-cover types directly affect the surface biophysical characteristics of the coal-mining area. In addition, complex natural geographic conditions and frequent coal-mining activities have aggravated the fragility of the local ecological environment [45]. According to reports, this area has become one of the most serious areas of coal dust pollution and coal spontaneous combustion in Shanxi Province [46,47], and it is also accompanied by vegetation degradation and soil erosion [48,49]. Ningwu Coalfield has a history of large-scale coal mining for nearly 40 years and is very suitable for remote-sensing monitoring in long time-series. In summary, Ningwu Coalfield can be used as a typical research area for remote-sensing evaluation and temporal and spatial change detection of ecological environment quality in coal-mining areas.
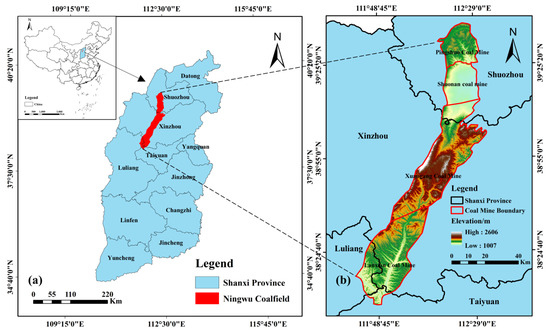
Figure 1.
Location map of the study area. (a) Location of the Ningwu Coalfield in Shanxi Province, China, (b) elevation and coal mine boundary of the Ningwu Coalfield.
2.2. Data Resources and Preprocessing
This study uses Level 1T images of Landsat series satellites provided by the United States Geological Survey (https://earthexplorer.usgs.gov/, accessed on 5 October 2021), including TM images in 1987, 1994, and 2001, ETM+ images taken in 2008 and OLI/TRIS images taken in 2015 and 2021 (Table 1). The spatial resolution of these images is 30 m × 30 m, and the temporal resolution is 16 days. As part of the surface biophysical parameters are greatly affected by different seasons, in order to ensure the comparability of research results between different years, all images selected were taken autumn (August and September). Considering that the Scan Lines Corrector (SLC) of the ETM+ image has failed, resulting in a certain lack of images [50]. Therefore, it was necessary to use the gap-filling interpolation algorithm of ENVI 5.3 software to perform strip filling on the 2008 ETM+ image. Secondly, based on the cubic convolution interpolation method and the second-order polynomial method, the TM/ETM+ image and the OLI/TIRS image were registered, and the root mean square error (RMSE) was controlled within 0.5 pixels [30]. Then, the “Radiometric Calibration” module integrated with the ENVI 5.3 software and the Fast Line-of-sight Atmospheric Analysis of Spectral Hypercubes (FLAASH) atmospheric correction tool were used to perform radiometric calibration and atmospheric correction on the image to generate the surface reflectance image. Finally, the ground surface reflectance images were mosaiced and cropped to obtain images of the study area.

Table 1.
Satellite images of the study area.
3. Methods
3.1. Selection of Ecological Environment Indicators
The selection of ecological environment indicators in this study follows the pressure-state-response (PSR) framework. The PSR framework is an ecological environment framework system jointly proposed and developed by the Organization for Economic Cooperation and Development (OECD) and the United Nations Environment Programme (UNEP) [51]. This framework system corresponds to the three aspects of man-made pressure, environmental status, and climate response [27]. In coal-mining areas, human-led coal industry activities have gradually transformed the original ecological land into production land and living land. Therefore, NDBSI and ICDI can be used to represent the pressure intensity of human activities on the ecological environment. NDVI and VHI are the most commonly used indicators to quantify the vegetative cover and vegetation health in coal-mining areas [33], and therefore can represent the environmental status of coal-mining areas. Wet and LST can indicate the changes of meteorological factors such as humidity and temperature to a large extent [52].
3.1.1. Normalized Difference Vegetation Index (NDVI)
The normalized difference vegetation index (NDVI) was originally proposed by Rouse [20], because it has a good relationship with vegetation fractional coverage (VFC), leaf area index (LAI), gross primary productivity (GPP), and net primary productivity (NPP). Therefore, it is widely used in global or regional ecological environment research [53,54]. In coal-mining areas, NDVI is considered to be an important indicator to measure the impact of coal mining and the effect of ecological restoration [55]. This is calculated as follows:
here, and represent the reflectance of the near-infrared band and the red band, respectively.
3.1.2. Vegetative Health Index (VHI)
Chlorophyll, xanthophyll, and nitrogen are important substances that reflect the nutritional status of vegetation and the efficiency of photosynthesis. The three elements can be represented by the normalized difference vegetation index (NDVI), the normalized difference senescent vegetative index (NDSVI) [56], and the nitrogen reflectance index (NRI) [57] in the remote-sensing index. PCA is a method of data dimension reduction, which can integrate most information of multiple ecological environment indexes into the first principal component (PC1) [28]. Therefore, PC1 was selected in this study to calculate vegetative health index (VHI), which represents the vegetation health degree. In addition, before the principal component analysis, the value of each index must be standardized between 0 and 1. The calculation formulas are as follows:
In the formulas, is the reflectance of each band of the TM, ETM+, and OLI sensors. Here, is the standardized index value, refers to the index value at pixel , and and are the maximum and minimum values of the index, respectively. In order to facilitate subsequent calculations, after obtaining PC1, it also needs to be standardized to obtain the final VHI value.
3.1.3. Wetness Component (Wet)
Tasseled cap transformation (TCT) is a linear transformation in which the coordinate space is rotated. The three components of brightness, greenness, and wetness calculated by it are directly related to the surface biophysical parameters [58], and have been widely used in ecological environment monitoring [31,34], where the wetness component (Wet) can be used to represent the moisture content of surface vegetation and soil. The calculation formulas are as follows:
In the formulas, is the reflectance of each band of the TM, ETM+, and OLI sensors respectively.
3.1.4. Normalized Differential Build-Up and Bare Soil Index (NDBSI)
The soil index (SI) [59] and the index-based built-up index (IBI) are used to extract bare surface soil and built-up land, respectively. A large amount of natural surface in the Ningwu Coalfield is transformed into bare soil, industrial squares, built-up areas, and traffic roads. Therefore, SI and IBI can be combined as NDBSI to explain the degree of surface dryness in this area [60]. The calculation formulas are as follows:
In the formulas, is the reflectance of each band of the TM, ETM+, and OLI sensors respectively.
3.1.5. Index-Based Coal Dust Index (ICDI)
Coal dust pollution is one of the most important factors leading to the deterioration of the surface ecological environment in coal-mining areas. Especially in open coal-mining yards, coal storage yards, coal-fired power stations, coal gangue dumps, and coal transportation channels, the pollution of coal dust is very serious. Therefore, it is very important to utilize satellite remote-sensing technology to extract coal dust and quantify its pollution degree. Mao et al. [61] constructed the normalized difference coal index (NDCI) based on the differences between near-infrared band and short-wave infrared band in Landsat TM images. However, the index not only enhanced coal information, but enhanced soil information and building information, so it was not suitable for areas with complex features. Mukherjee et al. [62] proposed a coal-mine index (CMI) for detecting opencast coal mines based on the two short-wave infrared bands of Landsat OLI images, but the index needs further logical operation and image classification to better separate coal mines and other ground objects. Therefore, it cannot be directly used to quantify the pollution degree of coal dust. This study focuses on analyzing the spectral reflectance characteristics of six typical land cover types in Ningwu Coalfield, including water, vegetation, high-reflectivity built-up land, low-reflectivity built-up land, bare land, and coal dust (Figure 2). The results show that in the TM image, ETM+ image and OLI image, the reflectance of coal dust in the blue band is greater than that in the green band, while the reflectance of water, vegetation, high-reflectivity built-up land, low-reflectivity built-up land, and bare land in the blue band is smaller than that in the green band. Therefore, this study initially constructed the coal dust index (CDI) and reverse coal dust index (RCDI), which can expand the spectral differences between coal dust and other ground objects. The CDI is used to enhance the information of coal dust and suppress the information of other typical features, while the function of RCDI is just the opposite. The calculation formulas are as follows:
here, and represent the reflectance of the blue band and the green band, respectively.
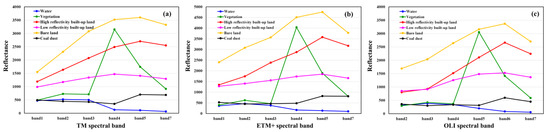
Figure 2.
Spectral reflectance curves of six typical land cover types in Ningwu Coalfield in different images. (a) Spectral reflectance curves of six typical land-cover types in the TM image, (b) spectral reflectance curves of six typical land-cover types in the ETM+ image, (c) spectral reflectance curves of six typical land-cover types in the OLI image.
Considering that the CDI index values of water, low-reflectivity built-up land, and coal dust are not much different, if only CDI is used to extract coal dust, it is easy to confuse a large amount of water and low-reflectivity built-up land in the extraction results. In view of this, this study further compresses multiple bands of remote-sensing images into four thematic indexes, namely CDI, RCDI, NDVI, and MNDWI [21]. Figure 3 shows that in the TM/ETM+/OLI images, coal dust has the only characteristic that the CDI index value is greater than the RCDI index value, the NDVI index value, and the MNDWI index value. At the same time, the CDI and RCDI have the ability to strengthen and weaken coal dust information respectively. Therefore, the relative strength difference between the two indexes of coal dust can be used to further enhance the information of coal dust. Based on the above index characteristics, CDI, RCDI, NDVI, and MNDWI can be combined to construct an index-based coal dust index (ICDI). ICDI is a normalized difference index, and its value ranges from −1 to 1, so it can better quantify the degree of coal dust pollution. The calculation formulas are as follows:
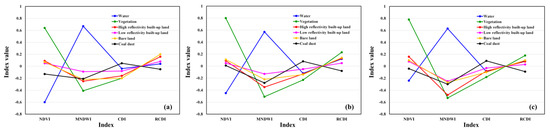
Figure 3.
Spectral index curves of six typical land cover types in Ningwu Coalfield in different images. (a) Spectral index curves of six typical land-cover types in the TM image, (b) spectral index curves of six typical land-cover types in the ETM+ image, (c) spectral index curves of six typical land-cover types in the OLI image.
In the formulas, is the reflectance of each band of the TM, ETM+, and OLI sensors respectively.
3.1.6. Land-Surface Temperature (LST)
Land-surface temperature (LST) is an important parameter describing the physical processes of the surface at global and regional scales [63]. The inversion of land-surface temperature first converts the DN values of band 6 of TM image, band 6 of ETM+ image, and band 10 of OLI/TIRS image into radiance. The calculation formula is as follows:
here, is the radiance of the thermal infrared band; and are the gain value and offset value of the corresponding band. The radiance of the satellite sensor can be converted to the brightness temperature of the satellite through the thermal conversion constant. The calculation formula is as follows:
here, is the brightness temperature of the satellite; and are the thermal conversion constant, for the band 6 of the TM image, = 607.76 W/(m2·sr·μm), = 1260.56 K; for the band 6 of the ETM+ image, = 666.09 W/(m2·sr·μm), = 1282.71 K; for the band 10 of OLI/TIRS images, = 774.89 W/(m2·sr·μm), = 1321.08 K. Finally, the emissivity modulation method is used to calculate the surface temperature [64]. The calculation formula is as follows:
here, is the center wavelength of the thermal infrared band (the band 6 of the TM image is 11.435 μm, the band 6 of the ETM+ image is 11.335 μm, and the band 10 of the OLI/TIRS image is 10.9 μm); = 1.438 × 10⁻² (m·K); ε is the surface-specific emissivity, which can be determined by Sobrino’s model [65].
3.2. Coal-Mine Ecological Index (CMEI)
The six ecological environment indicators mentioned above are closely related to the ecological environment quality of coal-mining areas. Among them, NDVI, VHI, and Wet have positive effects on the ecological environment, while NDBSI, ICDI, and LST have negative effects on the ecological environment. How to synthesize the information of these six indicators and establish a comprehensive index to evaluate the ecological environment quality of coal-mine areas is an urgent problem to be solved in this study. Principal component analysis (PCA) is a multidimensional data compression technique, which can remove the correlation between multiple indicators by rotating the spatial axis of characteristic spectrum, and concentrate the information of six ecological environment indicators on the first principal component with the largest percentage of characteristic values. Therefore, PCA was selected in this study to establish the coal-mine ecological index (CMEI). Considering the different value ranges of each ecological environment indicator, the values of the six ecological environment indicators need to be standardized between 0 and 1 before principal component analysis, so as to generate six single-band images. Then the six single-band images were combined into a multi-band image, and the multi-band image was processed by a PCA rotation tool in ENVI 5.3 software. After principal component analysis, the initial CMEI value can be obtained according to the first principal component (PC1) of PCA, and then the CMEI value can be calculated.
CMEI forward calculation formula:
CMEI reverse calculation formula:
In order to facilitate the description and comparison of the ecological environment quality in different periods, CMEI also needs to be standardized between 0 and 1.
3.3. Moran’s Index
Moran’s Index is an important indicator of exploratory spatial data analysis (ESDA), which is often used to analyze the spatial autocorrelation of things [66]. This study uses Global Moran’s Index (GMI) and Local Moran’s Index (LMI) to detect the spatial clustering and anomalies of CMEI in Ningwu Coalfield [27]. GMI judges from the overall situation whether CMEI has spatial autocorrelation in the whole area. This is calculated as follows:
here, is the total number of spatial units in the study area; and are the CMEI values of spatial units and , respectively; is the weight of the matrix, and is the mean of CMEI; The value of Moran’s Index ranges from −1 (positive spatial autocorrelation) to 1 (negative spatial autocorrelation). A value of 0 means that there is no spatial autocorrelation [60]. LMI is used to calculate the local spatial aggregation characteristics of CMEI, and reflect this characteristic on the local spatial location through the local indicator of spatial association (LISA). This is calculated as follows:
In this study, GeoDa software and ArcGIS software were used to calculate GMI and LMI, and five spatial aggregation types were established, including high–high clustering type (HH), low–low clustering type (LL), and low–high clustering type (LH), high–low clustering type (HL), and not significant.
4. Results
4.1. Indicator Combination and Analysis
Table 2 shows the eigenvalues and contribution rates of each principal component after principal component analysis. It is not difficult to see that PC1 has the largest eigenvalue in the principal components of each year, and the percent eigenvalues ranges from 66.4% to 79.39%, which shows that PC1 has concentrated most of the information of each ecological environment indicator. Continue to examine the weights of the ecological environment indicators (Table S1), and found that only the symbols of NDVI, VHI, Wet and NDBSI, ICDI, LST in PC1 are opposite, indicating that the contributions of the two groups of indexes to the ecological environment are opposite, which is in line with objective facts. The symbols in PC2, PC3, PC4, PC5, and PC6 are irregular and it is difficult to explain the ecological environmental quality using them. Therefore, based on the above considerations, it is feasible to use PC1 to construct CMEI.
Table 2.
The eigenvalues and contribution rates of the main components of PCA.
Table S2 provides the statistics of ecological environment indicators and CMEI in Ningwu Coalfield. From 1987 to 2021, the mean of NDVI, VHI, and Wet, which have positive effects on the ecological environment, showed an overall increasing trend, increasing by 0.2047, 0.1725, and 0.0169, respectively. The mean of NDBSI, ICDI, and LST, which have negative effects on the ecological environment, showed an overall decreasing trend, decreasing by 0.1054, 0.1468, and 0.0419, respectively. The results of six ecological environment indicators show that the ecological environment quality of Ningwu Coalfield has improved on the whole, which is consistent with the increase of CMEI. Figure 4 also shows the spatial distribution of six ecological environment indicators and CMEI in Ningwu Coalfield. In the northern part of Ningwu Coalfield, there are mostly opencast coal mines, accompanied by the main urban area of Shuozhou city, while in the southern part there are mostly underground coal mines. These areas have frequent human activities and generally have higher NDBSI values, ICDI values, and LST values, and lower CMEI values. The central part of Ningwu Coalfield has a high elevation (Figure 1), mainly mountainous areas and forests, and human activities are fewer, so most of them show higher NDVI values, VHI values, Wet values, and CMEI values. The above results indicate that CMEI has integrated the characteristics of six ecological environment indicators and can represent the ecological environment quality of the study area. The six ecological environment indicators each describe one aspect of eco-environmental quality in the study area. If only a single indicator is used to represent ecological environment quality, the impact of other ecological environment indicators cannot be quantified, and the interaction between indicators is also ignored. For example, NDVI can only represent the extent of vegetation coverage, but cannot quantify the health of vegetation. Another example: from 2001 to 2008, ICDI with negative effect on the ecological environment quality increased by 0.0268, but CMEI increased by 0.0609, because NDVI, VHI, and Wet increased by 0.1739, 0.0994, and 0.0628 respectively. NDBSI and LST decreased by 0.11 and 0.0013, respectively. In this way, not only the negative effects of ICDI on ecological environment quality are offset, but also the overall ecological environment quality is improved. Therefore, CMEI can make up for the deficiency of single index in describing the characteristics of overall ecological environment quality.
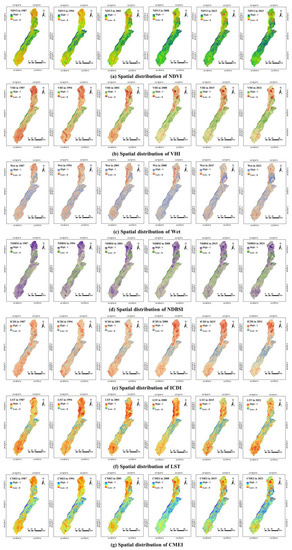
Figure 4.
Spatial distribution of six ecological environment indicators and CMEI in 1987, 1994, 2001, 2008, 2015, and 2021. (a) Spatial distribution of NDVI, (b) spatial distribution of VHI, (c) spatial distribution of Wet, (d) spatial distribution of NDBSI, (e) spatial distribution of ICDI, (f) spatial distribution of LST, (g) spatial distribution of CMEI.
4.2. Temporal and Spatial Change Detection of CMEI
In order to further quantify the ecological environment quality of Ningwu Coalfield, the normalized CMEI is divided into poor (0–0.2), fair (0.2–0.4), moderate (0.4–0.6), good (0.6–0.8), and excellent (0.8–1.0) five levels, then calculated the mean of CMEI and the area proportion of CMEI level (Figure 5 and Figure 6), and produced a thematic map of the spatial distribution of CMEI level (Figure 7).
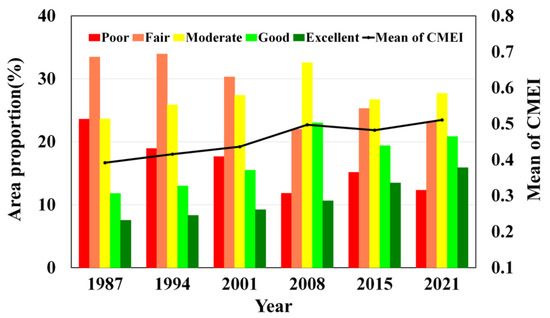
Figure 5.
The mean of CMEI and the area proportion of CMEI level of Ningwu Coalfield.
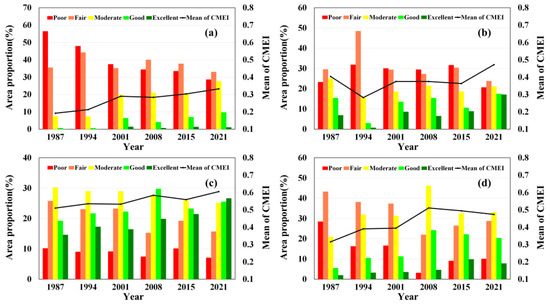
Figure 6.
The mean of CMEI and the area proportion of CMEI level of the four coal mines. (a–d) respectively represent the mean of CMEI and the area proportion of the CMEI level of Pingshuo Coal Mine, Shuonan Coal Mine, Xuangang Coal Mine, and Lanxian Coal Mine.
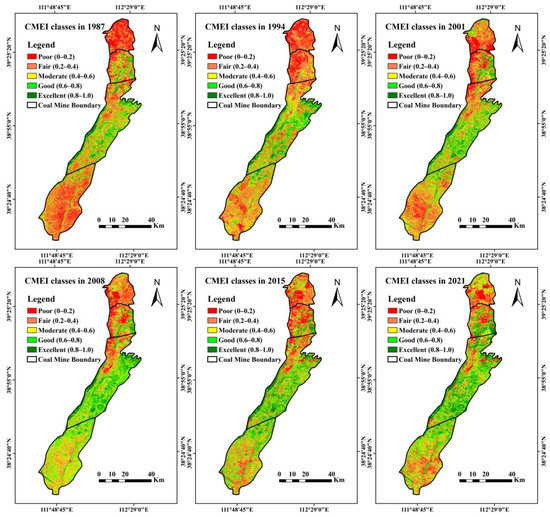
Figure 7.
Spatial distribution of CMEI classes in Ningwu Coalfield in 1987, 1994, 2001, 2008, 2015, and 2021.
From 1987 to 2021, the mean of CMEI in Ningwu Coalfield experienced an “increase–decrease–increase” process, the mean of CMEI has increased by 0.1189. The proportion of the area with poor, fair and moderate ecological environment quality decreased from 80.69% to 63.28%, while the proportion of the area with good and excellent ecological environment quality increased from 19.31% to 36.72%, indicating that the ecological environment quality of Ningwu Coalfield has been greatly improved. Among the four coal mines in the Ningwu Coalfield, the mean of CMEI of the Pingshuo Coal Mine ranges from 0.1918 to 0.3325 (Figure 6a), which is much lower than the mean of CMEI of the Ningwu Coalfield during the same period. From 1987 to 2021, the proportion of areas with poor ecological environmental quality in Pingshuo Coal Mine dropped by 27.82%, the proportion of areas with fair environmental quality remained almost stable, while the mean of areas with moderate, good, and excellent environmental quality rose sharply. During the entire period, the mean of CMEI of the Shuonan Coal Mine showed a “W-shaped” change, an overall increase of 16.82% (Figure 6b). From the perspective of the proportion of CMEI levels, the ecological environment quality of Shuonan Coal Mine has long been poor, fair, and moderate, accounting for 65.5% to 96.32%. The mean of CMEI of Xuangang Coal Mine remained above 0.5 (Figure 6c), and the proportion of poor, fair, and moderate ecological environment quality showed a decreasing trend, while the proportion of good and excellent environmental quality showed a rising trend. The ecological environment quality of Lanxian Coal Mine showed a trend of improvement from 1987 to 2008 (Figure 6d), and a trend of deterioration from 2008 to 2021. The mean of CMEI first increased from 0.3157 to 0.5107, and then decreased to 0.4736. Correspondingly, the proportion of poor and fair ecological environment quality has also decreased first and then increased.
Throughout the whole study area, the areas with poor and fair ecological environmental quality are mainly distributed in Pingshuo Coal Mine and Shuonan Coal Mine in the north and Lanxian Coal Mine in the south (Figure 7). The areas with good and excellent ecological environment quality are mostly concentrated in Xuangang Coal Mine in the central part. Among them, Pingshuo Coal Mine is the most important coal production base in Ningwu Coalfield. Intensive coal mining has gradually formed three red-cloud patches, representing poor ecological environment quality, in Pingshuo Coal Mine, corresponding to East Opencast Mine, Antaibao Coal Mine, and Anjialing Coal Mine from north to south. Green patches representing good and excellent ecological environment quality gradually appeared in the western dumps and northern cultivated area of Pingshuo Coal Mine. From 1987 to 2021, the spatial difference of CMEI of Shuonan Coal Mine became more and more obvious, and the areas with poor and fair ecological environment quality were concentrated in the fallow land in the west, the main urban area of Shuozhou City in the central part, and coal-mining areas in the northeast corner. The areas with good and excellent ecological environment quality are mainly distributed in the Qili River and Huihe River outside the main urban area, as well as the cultivated area in the east, and there is a trend of outward expansion. The areas with excellent ecological environment quality of Xuangang Coal Mine are always distributed in the central and western mountainous areas with an altitude of more than 2000 m (Figure 1). As the areas with poor and fair ecological environment quality gradually shrink to the north, the areas with good and excellent ecological environment quality gradually occupy the dominant position. In 1987, the ecological environment quality in most areas of the Lanxian Coal Mine was poor and fair. By 2008, the poor and fair areas will be greatly reduced, and the ecological environment quality will mainly be moderate. By 2021, the Lanxian Coal Mine has formed a spatial pattern of good and excellent ecological environment quality in the north and poor, fair, and moderate ecological environment quality in the south.
Remote-sensing change detection is an important means by which to analyze the temporal and spatial changes of ecological environment quality in different periods [67]. Figure 8 and Table S3 show the dynamic changes of CMEI in Ningwu Coalfield. The results show that from 1987 to 1994, the ecological environment quality of 58.72% of the Ningwu Coalfield was improved, and the areas with significant improvements (+3 and +4) were the dumps of the Pingshuo Coal Mine and the central and southern areas of the study area. The ecological environment quality of 40.04% of the area has been degraded, and most of the areas that are significantly degraded (−3 and −4) are cultivated areas of Shuonan Coal Mine. From 1994 to 2001, the total area of improvement and degradation of the ecological environment quality in the study area was roughly the same. From 2001 to 2008, the quality of the ecological environment quality improved significantly, and the area proportion of the improved area was 32.63% higher than that of the degraded area. From 2008 to 2015, 51.97% of the study area showed degradation of ecological environment quality, of which 50.7% of the area was slightly degraded (−1 and −2), and 1.27% of the area was markedly degraded. Obviously degraded areas are mainly the large opencast coal mines in the northeast and southwest corners of Xuangang Coal Mine, as well as the East Opencast Coal Mine and Antaibao Coal Mine of Pingshuo Coal Mine. From 2015 to 2021, the ecological environment quality of Ningwu Coalfield has been improved again, and the proportion of improved areas has increased from 46.45% to 56.12%. In the above five periods, the area proportion of the improved area showed a trend of fluctuation and decline, while the area proportion of the degraded area showed the opposite trend. The area proportion of the unchanged area was relatively stable, between 1.19% and 2.13%, mainly distributed in the eastern mountainous area with an altitude higher than 2000 m. During the whole study period (1987–2021), the proportions of improved areas, unchanged areas, and degraded areas were 71.85%, 1.14%, and 27.01%, respectively. The areas with obvious degradation were mainly coal-mining areas and built-up areas. On the whole, the ecological environment quality of Ningwu Coalfield has been improved.
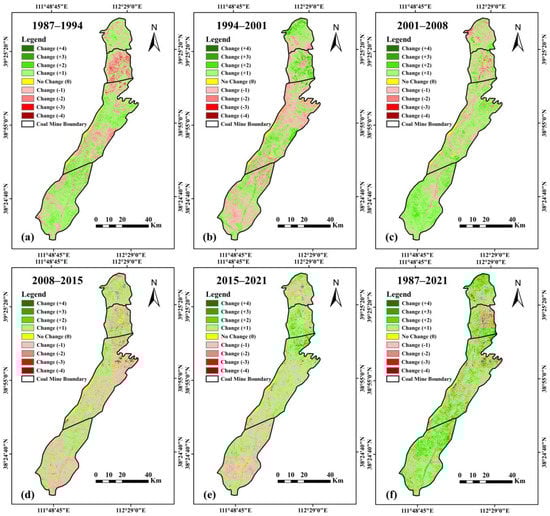
Figure 8.
Change detection images of CMEI in Ningwu Coalfield. (a) Change detection image of CMEI in Ningwu Coalfield from 1987 to 1994, (b) change detection image of CMEI in Ningwu Coalfield from 1994 to 2001, (c) change detection image of CMEI in Ningwu Coalfield from 2001 to 2008, (d) change detection image of CMEI in Ningwu Coalfield from 2008 to 2015, (e) change detection image of CMEI in Ningwu Coalfield from 2015 to 2021, (f) change detection image of CMEI in Ningwu Coalfield from 1987 to 2021.
4.3. CMEI Spatial Cluster Analysis
4.3.1. Global Cluster Analysis
Figure 9 reflects the global spatial autocorrelation results of CMEI in Ningwu Coalfield. Most of the scattered points are concentrated in the first and third quadrants, indicating that the distribution of CMEI has a positive spatial correlation, showing high–high clustering (HH) and low–low clustering (LL) as a whole. From the perspective of the trend of change, Moran’s Index value shows the overall characteristics of increased fluctuation, especially after 2001, this kind of fluctuation is more obvious. In 2008, Moran’s Index value had the highest value (0.911722), indicating a high degree of spatial clustering of CMEI. In 2015, Moran’s Index value dropped to the lowest value (0.884577), indicating that the spatial clustering degree of CMEI decreased, and the ecological environment patches gradually fragmented. By 2021, Moran’s Index was back above 0.90.
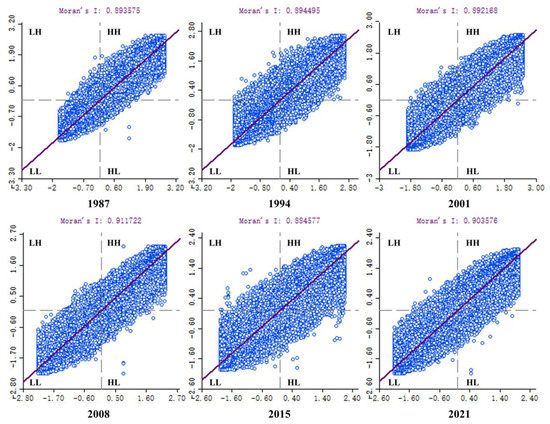
Figure 9.
Moran scatter plot of CMEI in Ningwu Coalfield in 1987, 1994, 2001, 2008, 2015, and 2021.
4.3.2. Local Cluster Analysis
We used the LISA cluster map to visualize the clustering characteristics of CMEI in six years (Figure 10). In 1987, the high–high clusters were mostly concentrated in the Xuangang Coal Mine in the central part and the Shuonan Coal Mine in the north–central part, while the low–low clusters were mainly distributed in the Pingshuo Coal Mine in the north and the Lanxian Coal Mine in the south. In 1994, the high–high clusters moved southward as a whole. There were only a few high–high clusters in the northern part of the study area, which were distributed in the dumps of the Pingshuo Coal Mine and the southeast area of the Shuonan Coal Mine. The original low–low clustering in the northern area of Lanxian Coal Mine changed to high–high clustering. From 2001 to 2015, the high–high clustering continued to expand southward, and the cultivated area outside the main urban area of Shuozhou City in the north also showed high–high clustering. In 2021, most areas of Ningwu Coalfield showed high–high clustering, while low–low clustering is mainly distributed in Antaibao Coal Mine, Anjialing Coal Mine, East Opencast Coal Mine, the main urban area of Shuozhou City, several large opencast coal mines of Xuangang Coal Mine, and the southern area of Lanxian Coal Mine. Comparing the LISA cluster map in 2021 with the change detection map from 1987 to 2021 (Figure 8f), it is not difficult to see that high–high clustering and low–low clustering roughly correspond to the improvement of ecological environment quality and the degradation of ecological environment quality, respectively. This is consistent with the results of previous studies [27]. Therefore, it can be confirmed that the spatial distribution of CMEI is clustered and not random. It is further explained that coal mining and urban expansion have led to the emergence of low–low clustering, and ecological restoration measures have promoted the expansion of high–high clustering, such as the vegetation greening project carried out in the dumps of Pingshuo Coal Mine [68].
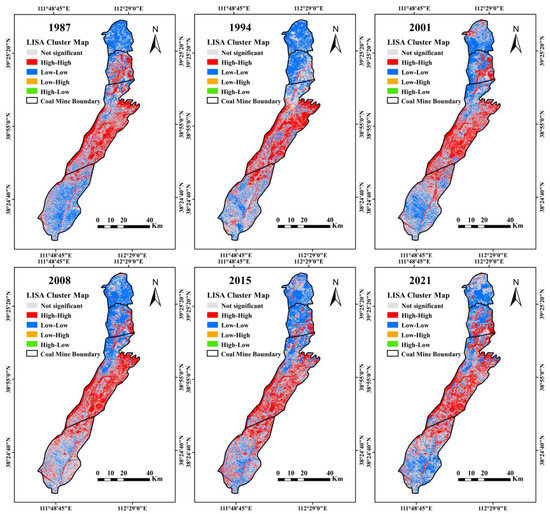
Figure 10.
LISA cluster map of CMEI in Ningwu Coalfield in 1987, 1994, 2001, 2008, 2015, and 2021.
4.4. Prediction of Ecological and Environmental Effects
Taking CMEI as the dependent variable and NDVI, VHI, Wet, NDBSI, ICDI, and LST as independent variables, a stepwise regression analysis was performed on 60,219 sample points of each image, and a coal-mine ecological model based on CMEI was established (the model passed a 1% significance test):
Judging from the obtained model, the six ecological environment indicators have not been eliminated in the gradual regression of six years. It shows that the six indicators are important indicators that reflect the ecological environment quality in coal-mining areas and can be used as predictors. As shown in Table S4, the coefficients of NDVI, VHI, and Wet are positive, indicating a positive effect on CMEI, and the coefficients of NDBSI, ICDI and LST are negative, indicating a negative effect on CMEI, which is consistent with the contribution results of each indicator in PC1 to the ecological environment (Table S1). In summary, the sum of absolute values of the coefficients of NDBSI, ICDI, and LST is less than the sum of coefficients of NDVI, VHI, and Wet, so the comprehensive influence of NDVI, VHI, and Wet with positive effects on the ecological environment is greater than that of NDBSI, ICDI, and LST with negative effects on the ecological environment. But over time, the comprehensive influence of NDVI, VHI and Wet tends to weaken. Overall, NDVI has the greatest impact on the ecological environment of Ningwu Coalfield, followed by NDBSI. It is worth noting that the positive effect of VHI, which represents the health of vegetation, on the ecological environment has been highlighted in 2015, and its impact capacity has exceeded NDVI in 2015 and 2021. In addition, the negative effect of ICDI, which represents the degree of coal dust pollution, cannot be ignored. Whether it is the coefficient of the regression model or the contribution to PC1, ICDI has shown an increasing trend. This also shows the importance of VHI and ICDI to the local ecological environment. This study uses the latest regression model in 2021 to make predictions. The results show that if the Ningwu Coalfield wants to increase the CMEI by 0.1 unit in the future, it must increase the NDVI by 0.5102 units or reduce the NDBSI by 0.3772 units. The same effect can be achieved by increasing VHI by 0.4329 units or decreasing ICDI by 0.6211 units.
5. Discussion
5.1. Accuracy Verification of ICDI
In this study, the TM image in 1994, ETM+ image in 2008, and OLI image in 2015 of Pingshuo Coal Mine were taken as examples to extract coal dust in each image by ICDI, and the extraction threshold was set as −0.02, 0.01, and 0.1 respectively. From the visual results, the outline of the extracted coal dust is clear. Whether it is a patch of coal dust area or a scattered coal dust area, it can be well-identified (Figure 11). In addition, this research is based on Google images, selects sample points through visual interpretation, and quantitatively verifies the accuracy of ICDI extraction. Table S5 shows that for the three images, the overall accuracy of ICDI has reached more than 96%, the Kappa coefficient is not less than 0.9, and the user accuracy has also exceeded 92%. In addition, excluding the 1994 TM image, the producer accuracy of ICDI is 86.2%, and the producer accuracy of ICDI of the images in the rest of the year is higher than 91%. To sum up, ICDI has a good identification effect on coal dust. The advantage of ICDI lies in the selection of thematic indices related to surface biophysical characteristics, rather than the traditional original bands of images, which greatly reduces spectral confusion between land cover types and facilitates rapid extraction of coal dust. In addition, as ICDI is a normalized difference index, its function is not limited to extracting coal dust information and calculating the coal dust area, but can also be used to quantify the pollution degree of coal dust, which is of great significance to further study the ecological environment quality of coal-mining areas.
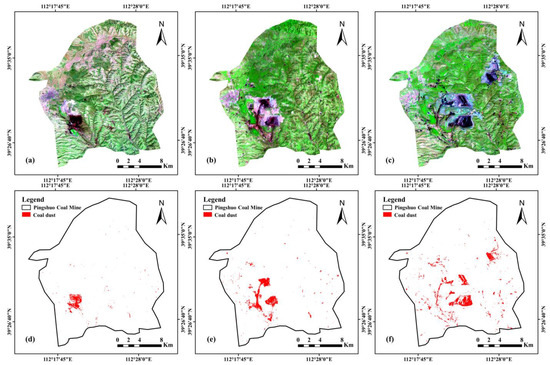
Figure 11.
Extraction results of coal dust in Pingshuo Coal Mine in different images. (a) TM image of Pingshuo Coal Mine (RGB743), (b) ETM+ image of Pingshuo Coal Mine (RGB743), (c) OLI image of Pingshuo Coal Mine (RGB754), (d) extraction results of coal dust in the TM image, (e) extraction results of coal dust in the ETM+ image, (f) extraction results of coal dust in the OLI image.
5.2. Evaluation of the Effectiveness of CMEI
CMEI was created under the framework of pressure-state-response (PSR). Among the six indicators used, NDBSI and ICDI represent pressure intensity, NDVI and VHI represent environmental status, Wet and LST represent climate response, and CMEI is the comprehensive reflection of the six indicators on the quality characteristics of the ecological environment. Therefore, the creation of CMEI is representative. In order to further prove the effectiveness of CMEI, four methods are going to be utilized to evaluate CMEI in this study: the sample-based method, classification-based method, correlation-based method, and distance-based method.
5.2.1. Evaluation Based on Sample Images
Figure 12 shows the locations of sample sites of different CMEI levels in OLI images (RGB 754), and CMEI images and OLI images (RGB 754) of different CMEI levels. Among them, the mean of CMEI of OLI images with excellent, good, moderate, fair, and poor CMEI levels were 0.9173, 0.7371, 0.4503, 0.2205, and 0.0288, respectively. It was obvious that the decrease of vegetation coverage would lead to a decrease in CMEI, while bare soil tended to increase. In addition, coal-mining areas and urban areas also showed low CMEI.
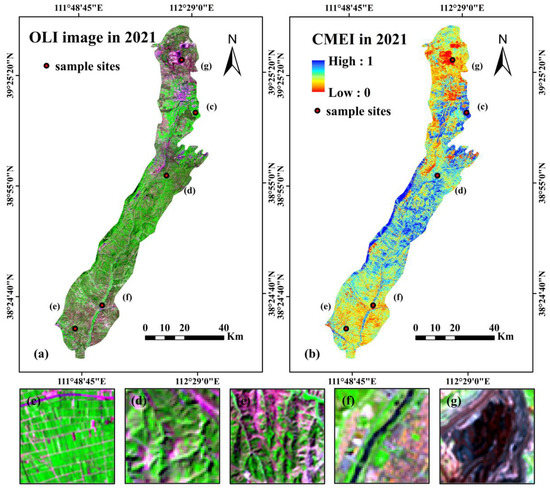
Figure 12.
The locations of sample sites of different CMEI levels in OLI images (RGB 754), and CMEI images and OLI images (RGB 754) of different CMEI levels. (a) The locations of sample sites of different CMEI levels in OLI image (RGB 754), (b) the locations of sample sites of different CMEI levels in CMEI image, (c) OLI image with excellent CMEI level, (d) OLI image with good CMEI level, (e) OLI image with moderate CMEI level, (f) OLI image with fair CMEI level, (g) OLI image with poor CMEI level.
5.2.2. Evaluation Based on Classification
Table 3 shows that the mean of each ecological environment indicator changes regularly with the change of the ecological environment quality level. Among them, NDVI, VHI, and Wet increase with the increase of ecological environment quality level, while NDBSI, ICDI, and LST decrease with the increase of ecological environment quality level. This shows that the creation of CMEI is reasonable, and CMEI can be directly used to describe the changes of ecological environmental quality.
Table 3.
CMEI classes and the mean of the corresponding level of the six indicators (normalized).
5.2.3. Evaluation Based on Correlation
The stronger the correlation between CMEI and various ecological environment indicators, the better the ability of CMEI to comprehensively represent all indicators [38]. As shown in Figure 13, there is a good correlation between CMEI and ecological environment indicators, in which CMEI is positively correlated with NDVI, VHI, and Wet, and CMEI is negatively correlated with NDBSI, ICDI, and LST. From the perspective of the mean correlation coefficient of each indicator (Table 4), the mean correlation of six years of NDBSI is the highest among the six single indicators, which is 0.7389, while the mean correlation of six years of CMEI is 0.8310, 0.0921 higher than that of NDBSI. The mean correlation coefficient of CMEI from 1987 to 2021 is higher than the mean correlation coefficient of any single ecological environment indicator. This indicates that CMEI is better than any single indicator at comprehensively evaluating ecological environment quality.
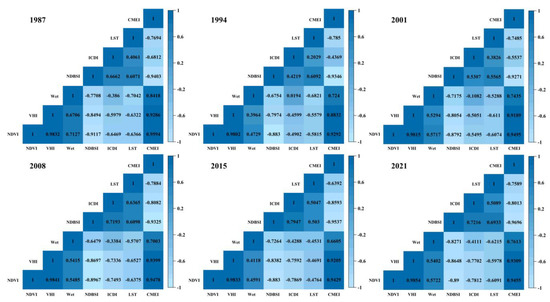
Figure 13.
Correlation analysis between CMEI and six ecological environment indicators in 1987, 1994, 2001, 2008, 2015, and 2021.
Table 4.
Mean correlation coefficient of each indicator.
5.2.4. Evaluation Based on Distance
In this study, the Antaibao Coal Mine and the main urban area of Shuozhou City were selected as typical areas (Figure 14). Buffer analysis is used to analyze the distribution of the mean of CMEI every 0.5 km in coal-mining area and urban area. The research range of coal-mining area and urban area is 0.5 km to 8 km and 0.5 km to 6 km, respectively. The results showed that the mean of CMEI was the lowest in those closest to the coal-mine center, which was related to the high pollution degree of coal dust, high density of bare land, low vegetation coverage, and poor vegetation health status in the coal mine center (Figure 4). Figure 14a shows that there is a vegetation transition zone between the Antaibao Coal Mine, Anjialing Coal Mine, and the East Opencast Coal Mine, so the mean of CMEI increases significantly after a distance of more than 2 km. After exceeding 3 km, the mean of CMEI decreased again, starting from 6 km beyond the mining range of the three coal mines, the mean of CMEI gradually increased. In addition, although the mean of CMEI within 1 km from the city center is also very low, it is not the lowest—which indicates that the ecological environment in the city center is gradually improving. In Figure 14b, a small number of green areas can also be observed in the center of the main city. Between 1.5 km and 2 km, the mean of CMEI gradually decreases, which is related to high building density, less vegetation coverage, and high surface temperature. When the distance exceeds 4.5 km, it starts to enter the agricultural area, and the mean of CMEI increases with the increase of distance.
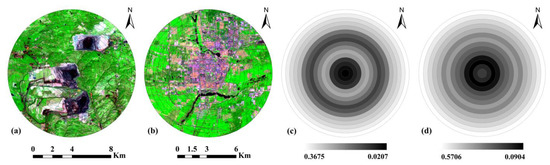
Figure 14.
OLI images (RGB754) of a typical coal mining and urban area and the change of mean of CMEI with distance. (a) OLI image (RGB754) of typical coal mining area, (b) OLI image (RGB754) of typical urban area, (c) the mean of CMEI of typical coal-mining area changes with distance, (d) the mean of CMEI of typical urban area changes with distance; the circle centers of (a,c) are located in the center of Antaibao Coal Mine. The radius represents the distance from the center of the coal mine, and the radius is 0.5 km, 1 km, 1.5 km…, 8 km; the circle centers of (b,d) are located in the main urban center of Shuozhou city. The radius represents the distance from the urban center, and the radius is 0.5 km, 1 km, 1.5 km…, 6 km.
The above results prove the effectiveness and practicality of CMEI in evaluating the ecological environment quality. The establishment of CMEI selects ecological environment indicators that can reflect the surface biophysical characteristics of coal-mining areas, and these indicators can be calculated by remote-sensing images. Therefore, CMEI can easily and quickly evaluate the ecological environment quality of coal-mining areas. In addition, CMEI can visualize the ecological environment quality temporally and spatially. Therefore, compared with commonly used EI indicators, CMEI is easier to promote and use. It is worth noting that CMEI is a comprehensive evaluation index based on a PSR framework, which takes into account the influence of man-made pressure in coal-mining areas more comprehensively than most indexes and innovatively includes ICDI into the ecological environment evaluation system, making up the deficiency of remote-sensing comprehensive evaluation indexes such as IEI, RSEI, and CEEI in quantification of the impact of coal dust pollution on ecological environment quality. It avoids classifying coal dust areas as areas with better ecological environment quality [35,69]. Therefore, CMEI can be used to help standardize mining activities in coal-mining areas, reduce irrational development and utilization of coal resources, and provide a decision-making basis for further control of coal dust pollution and improvement of ecological environment quality.
5.3. Limitations and Future Work
This study uses CMEI to evaluate the temporal and spatial changes of the ecological environment quality of the Ningwu Coalfield from 1987 to 2021. The results of this study can provide a scientific basis for the planning and development of coal-mining areas and the development of ecological restoration. However, this study still has certain limitations. First of all, the establishment of CMEI is completely based on remote-sensing images, so it is inevitably affected by clouds, which makes it difficult for the images of the selected study area to be kept in the same month. Although this paper selected images of similar months to fill the area covered by clouds, it still brings some limitations to the research results. Secondly, the ecological environment of coal-mining areas is complex and changeable, and human activities are more frequent, which makes the surface biophysical characteristics more complicated [39]. CMEI is composed of six ecological environment indicators, but only ICDI is proposed in this study for coal-mining areas, and the remaining indicators are commonly used indicators selected by experience [60]. Further verification is needed as to whether these indicators can fully describe the surface biophysical characteristics of coal-mining areas. Finally, this study did not conduct an in-depth analysis of the driving factors of the temporal and spatial changes in the ecological environment quality of the Ningwu Coalfield, such as the impact of climate, coal mining, urbanization, and ecological restoration policies.
Therefore, the following work needs to be carried out in the future: (1) to promote and verify CMEI in other large coal-mining areas, such as Dongsheng Coalfield, Zhungeer Coalfield, Datong Coal Mine, and Yangquan Coal Mine, etc., and to supplement and improve the indicators of CMEI to improve its application ability in different coal-mining areas; (2) to explore the potential of ICDI and CMEI on other satellite sensors such as MODIS, ASTER, AVHRR, IRS, Sentinel, and Gaofen-5, and improve the spatiotemporal and spectral resolution of remote-sensing images through multi-source remote-sensing data fusion technology, and establish long-time-series, high-precision ICDI and CMEI data sets of typical coal-mining areas; (3) to strengthen the analysis of driving forces of ecological environment quality change in coal-mining areas, and quantify the impact of climate change and human activities on ecological environment quality in coal-mining areas.
6. Conclusions
Selecting appropriate remote-sensing indicators, establishing an ecological environment quality evaluation system in coal-mining areas, and then carrying out ecological environment quality evaluation and temporal and spatial change detection are of great significance to the ecological protection and management of coal-mining areas and sustainable development. The results of remote-sensing evaluation and temporal and spatial change detection of ecological environment quality of Ningwu Coalfield from 1987 to 2021 show that:
(1) In this study, four special indexes, CDI, RCDI, NDVI, and MNDWI were innovatively used to construct ICDI, which overcame the spectral confusion existing in the identification process of coal dust by existing indexes, realized the rapid and high-precision extraction of surface coal dust, and provided an important ecological environment indicator for quantifying the pollution degree of coal dust.
(2) The coal-mine ecological index (CMEI) is a comprehensive evaluation index based on remote-sensing information. It integrates most of the information of six ecological environment indicators, including NDVI, VHI, Wet, NDBSI, ICDI, and LST, through principal component analysis (PCA). It can objectively and quantitatively evaluate and detect the spatial and temporal distribution and change characteristics of ecological environment quality in a coal-mine area.
(3) From 1987 to 2021, the mean of the CMEI of the Ningwu Coalfield showed a trend of “increase–decrease–increase”, and the overall ecological environment quality showed an improvement. The areas with poor and fair ecological environment are mainly distributed in Pingshuo Coal Mine and Shuonan Coal Mine in the north and Lanxian Coal Mine in the south, and have gradually been transferred to coal-mining areas and densely built areas. The areas with good and excellent ecological environment are mostly concentrated in Xuangang Coal Mine in the middle and gradually have come to occupy a dominant position.
(4) NDVI and NDBSI are key factors affecting the ecological environment quality, while the importance of VHI and ICDI to the ecological environment quality is also increasing. Therefore, improving vegetation coverage and vegetation health, reducing bare ground and coal dust pollution, strengthening the green development and clean utilization of coal, and rationally planning the construction layout of urban and rural residential areas are the main ways to achieve sustainable development of the Ningwu Coalfield.
Supplementary Materials
The following supporting information can be downloaded at: https://www.mdpi.com/article/10.3390/rs14020345/s1. Table S1: Principal component analysis of six variables; Table S2: Statistics of six ecological environment indicators in the study area; Table S3: Percentage change of CMEI level of Ningwu Coalfield from 1987 to 2021; Table S4: Coefficient comparison of regression models; Table S5. Accuracy verification of ICDI.
Author Contributions
Conceptualization, X.N. and Z.H.; methodology, X.N.; software, X.N.; validation, X.N., Z.H. and M.R.; formal analysis, X.N. and Q.Z.; investigation, X.N., Z.H., M.R., Q.Z. and H.S.; resources, X.N.; data curation, X.N. and H.S.; writing—original draft preparation, X.N.; writing—review and editing, Z.H.; visualization, X.N.; project administration, Z.H. and M.R.; funding acquisition, Z.H. All authors have read and agreed to the published version of the manuscript.
Funding
This research was funded by the National Key Research and Development Program (grant numbers: 2019YFC1805003 and 2020YFC1806505).
Institutional Review Board Statement
Not applicable.
Informed Consent Statement
Not applicable.
Data Availability Statement
The Landsat dataset is available from the United States Geological Survey website at https://earthexplorer.usgs.gov/ (accessed on 5 October 2021).
Acknowledgments
The authors thank anonymous reviewers for their constructive comments and suggestions which helped to improve the manuscript.
Conflicts of Interest
The authors declare no conflict of interest.
References
- Shi, X.; Sun, Y.; Shen, Y. China’s ambitious energy transition plans. Science 2021, 373, 170. [Google Scholar] [CrossRef] [PubMed]
- Mallapaty, S. How China could be carbon neutral by mid-century. Nature 2020, 586, 482–484. [Google Scholar] [CrossRef]
- Huang, W.; Han, J.; Wang, Y.; Shen, J.; Cheng, L. Strategies and Countermeasures for Ensuring Energy Security in China. Strateg. Study CAE 2021, 23, 112–117. [Google Scholar] [CrossRef]
- He, T.; Xiao, W.; Zhao, Y.; Deng, X.; Hu, Z. Identification of waterlogging in Eastern China induced by mining subsidence: A case study of Google Earth Engine time-series analysis applied to the Huainan coal field. Remote Sens. Environ. 2020, 242, 111742. [Google Scholar] [CrossRef]
- Zhang, M.; Wang, J.; Li, S.; Feng, D.; Cao, E. Dynamic changes in landscape pattern in a large-scale opencast coal mine area from 1986 to 2015; a complex network approach. Catena 2020, 194, 104738. [Google Scholar] [CrossRef]
- Hu, T.; Myers Toman, E.; Chen, G.; Shao, G.; Zhou, Y.; Li, Y.; Zhao, K.; Feng, Y. Mapping fine-scale human disturbances in a working landscape with Landsat time series on Google Earth Engine. ISPRS J. Photogramm. Remote Sens. 2021, 176, 250–261. [Google Scholar] [CrossRef]
- Liu, X.; Bai, Z.; Zhou, W.; Cao, Y.; Zhang, G. Changes in soil properties in the soil profile after mining and reclamation in an opencast coal mine on the Loess Plateau, China. Ecol. Eng. 2017, 98, 228–239. [Google Scholar] [CrossRef] [Green Version]
- Qian, D.; Yan, C.; Xiu, L.; Feng, K. The impact of mining changes on surrounding lands and ecosystem service value in the Southern Slope of Qilian Mountains. Ecol. Complex. 2018, 36, 138–148. [Google Scholar] [CrossRef]
- Yan, M.; Cui, F.; Liu, Y.; Zhang, Z.; Zhang, J.; Ren, H.; Li, Z. Vegetation type and plant diversity affected soil carbon accumulation in a postmining area in Shanxi Province, China. Land Degrad. Dev. 2020, 31, 181–189. [Google Scholar] [CrossRef]
- Zhou, B.; Wu, J.; Wang, J.; Wu, Y. Surface-based radon detection to identify spontaneous combustion areas in small abandoned coal mine gobs: Case study of a small coal mine in China. Process Saf. Environ. 2018, 119, 223–232. [Google Scholar] [CrossRef]
- Singh, N.; Chatterjee, R.S.; Kumar, D.; Panigrahi, D.C. Spatio-temporal variation and propagation direction of coal fire in Jharia Coalfield, India by satellite-based multi-temporal night-time land surface temperature imaging. Int. J. Min. Sci. Technol. 2021, 31, 765–778. [Google Scholar] [CrossRef]
- Li, Y.; Ji, L.; Mi, W.; Xie, S.; Bi, Y. Health risks from groundwater arsenic on residents in northern China coal-rich region. Sci. Total Environ. 2021, 773, 145003. [Google Scholar] [CrossRef]
- Van Dijk, P.; Zhang, J.; Jun, W.; Kuenzer, C.; Wolf, K. Assessment of the contribution of in-situ combustion of coal to greenhouse gas emission; based on a comparison of Chinese mining information to previous remote sensing estimates. Int. J. Coal Geol. 2011, 86, 108–119. [Google Scholar] [CrossRef]
- Xiao, W.; Hu, Z.; Chugh, Y.P.; Zhao, Y. Dynamic subsidence simulation and topsoil removal strategy in high groundwater table and underground coal mining area: A case study in Shandong Province. Int. J. Min. Reclam. Environ. 2014, 28, 250–263. [Google Scholar] [CrossRef]
- Gao, Y.; Wang, J.; Zhang, M.; Li, S. Measurement and prediction of land use conflict in an opencast mining area. Resour. Policy 2021, 71, 101999. [Google Scholar] [CrossRef]
- Ramachandra, T.V.; Bharath, A.H.; Sowmyashree, M.V. Monitoring urbanization and its implications in a mega city from space: Spatiotemporal patterns and its indicators. J. Environ. Manag. 2015, 148, 67–81. [Google Scholar] [CrossRef]
- He, J.; Shi, X.; Fu, Y. Identifying vegetation restoration effectiveness and driving factors on different micro-topographic types of hilly Loess Plateau: From the perspective of ecological resilience. J. Environ. Manag. 2021, 289, 112562. [Google Scholar] [CrossRef] [PubMed]
- Gallant, A. The Challenges of Remote Monitoring of Wetlands. Remote Sens. 2015, 7, 10938–10950. [Google Scholar] [CrossRef] [Green Version]
- Hansen, M.C.; Potapov, P.V.; Moore, R.; Hancher, M.; Turubanova, S.A.; Tyukavina, A.; Thau, D.; Stehman, S.V.; Goetz, S.J.; Loveland, T.R. High-resolution global maps of 21st-century forest cover change. Science 2013, 342, 850–853. [Google Scholar] [CrossRef] [PubMed] [Green Version]
- Rouse, J.W.; Haas, R.H.; Schell, J.A.; Deering, D.W. Monitoring vegetation systems in the Great Plains with ERTS. NASA Spec. Publ. 1974, 351, 309. [Google Scholar]
- Xu, H. Modification of normalised difference water index (NDWI) to enhance open water features in remotely sensed imagery. Int. J. Remote Sens. 2006, 27, 3025–3033. [Google Scholar] [CrossRef]
- Deng, Y.; Wu, C.; Li, M.; Chen, R. RNDSI: A ratio normalized difference soil index for remote sensing of urban/suburban environments. Int. J. Appl. Earth Obs. 2015, 39, 40–48. [Google Scholar] [CrossRef]
- Xu, H. A new index for delineating built-up land features in satellite imagery. Int. J. Remote Sens. 2008, 29, 4269–4276. [Google Scholar] [CrossRef]
- Xu, H. Analysis of impervious surface and its impact on urban heat environment using the normalized difference impervious surface index (NDISI). Photogramm. Eng. Remote Sens. 2010, 76, 557–565. [Google Scholar] [CrossRef]
- Zhu, Z.; Piao, S.; Myneni, R.B.; Huang, M.; Zeng, Z.; Canadell, J.G.; Ciais, P.; Sitch, S.; Friedlingstein, P.; Arneth, A. Greening of the Earth and its drivers. Nat. Clim. Chang. 2016, 6, 791–795. [Google Scholar] [CrossRef]
- Shen, H.; Huang, L.; Zhang, L.; Wu, P.; Zeng, C. Long-term and fine-scale satellite monitoring of the urban heat island effect by the fusion of multi-temporal and multi-sensor remote sensed data: A 26-year case study of the city of Wuhan in China. Remote Sens. Environ. 2016, 172, 109–125. [Google Scholar] [CrossRef]
- Hu, X.; Xu, H. A new remote sensing index for assessing the spatial heterogeneity in urban ecological quality: A case from Fuzhou City, China. Ecol. Indic. 2018, 89, 11–21. [Google Scholar] [CrossRef]
- Yu, H.; Zhao, J. The Impact of Environmental Conditions on Urban Eco-Sustainable Total Factor Productivity: A Case Study of 21 Cities in Guangdong Province, China. Int. J. Environ. Res. Public Health 2020, 17, 1329. [Google Scholar] [CrossRef] [PubMed] [Green Version]
- Yue, H.; Liu, Y.; Li, Y.; Lu, Y. Eco-Environmental Quality Assessment in China’s 35 Major Cities Based On Remote Sensing Ecological Index. IEEE Access 2019, 7, 51295–51311. [Google Scholar] [CrossRef]
- Shan, W.; Jin, X.; Ren, J.; Wang, Y.; Xu, Z.; Fan, Y.; Gu, Z.; Hong, C.; Lin, J.; Zhou, Y. Ecological environment quality assessment based on remote sensing data for land consolidation. J. Clean. Prod. 2019, 239, 118126. [Google Scholar] [CrossRef]
- Xu, H.; Wang, Y.; Guan, H.; Shi, T.; Hu, X. Detecting Ecological Changes with a Remote Sensing Based Ecological Index (RSEI) Produced Time Series and Change Vector Analysis. Remote Sens. 2019, 11, 2345. [Google Scholar] [CrossRef] [Green Version]
- Zhu, X.; Wang, X.; Yan, D.; Liu, Z.; Zhou, Y. Analysis of remotely-sensed ecological indexes’ influence on urban thermal environment dynamic using an integrated ecological index: A case study of Xi’an, China. Int. J. Remote Sens. 2019, 40, 3421–3447. [Google Scholar] [CrossRef]
- Yang, C.; Zhang, C.; Li, Q.; Liu, H.; Gao, W.; Shi, T.; Liu, X.; Wu, G. Rapid urbanization and policy variation greatly drive ecological quality evolution in Guangdong-Hong Kong-Macau Greater Bay Area of China: A remote sensing perspective. Ecol. Indic. 2020, 115, 106373. [Google Scholar] [CrossRef]
- Zhu, D.; Chen, T.; Zhen, N.; Niu, R. Monitoring the effects of open-pit mining on the eco-environment using a moving window-based remote sensing ecological index. Environ. Sci. Pollut. Res. 2020, 27, 15716–15728. [Google Scholar] [CrossRef]
- Nie, X.; Hu, Z.; Zhu, Q.; Ruan, M. Research on Temporal and Spatial Resolution and the Driving Forces of Ecological Environment Quality in Coal Mining Areas Considering Topographic Correction. Remote Sens. 2021, 13, 2815. [Google Scholar] [CrossRef]
- He, C.; Gao, B.; Huang, Q.; Ma, Q.; Dou, Y. Environmental degradation in the urban areas of China: Evidence from multi-source remote sensing data. Remote Sens. Environ. 2017, 193, 65–75. [Google Scholar] [CrossRef]
- Firozjaei, M.K.; Fathololoumi, S.; Weng, Q.; Kiavarz, M.; Alavipanah, S.K. Remotely Sensed Urban Surface Ecological Index (RSUSEI): An Analytical Framework for Assessing the Surface Ecological Status in Urban Environments. Remote Sens. 2020, 12, 2029. [Google Scholar] [CrossRef]
- Hu, X.; Xu, H. A new remote sensing index based on the pressure-state-response framework to assess regional ecological change. Environ. Sci. Pollut. Res. 2019, 26, 5381–5393. [Google Scholar] [CrossRef]
- Firozjaei, M.K.; Sedighi, A.; Firozjaei, H.K.; Kiavarz, M.; Homaee, M.; Arsanjani, J.J.; Makki, M.; Naimi, B.; Alavipanah, S.K. A historical and future impact assessment of mining activities on surface biophysical characteristics change: A remote sensing-based approach. Ecol. Indic. 2021, 122, 107264. [Google Scholar] [CrossRef]
- Ding, J.; Zhou, G.; Liu, D.; Jiang, W.; Wei, Z.; Dong, X. Synthesis and performance of a novel high-efficiency coal dust suppressant based on self-healing gel. Environ. Sci. Technol. 2020, 54, 7992–8000. [Google Scholar] [CrossRef] [PubMed]
- Tong, R.; Cheng, M.; Yang, X.; Yang, Y.; Shi, M. Exposure levels and health damage assessment of dust in a coal mine of Shanxi Province, China. Process Saf. Environ. 2019, 128, 184–192. [Google Scholar] [CrossRef]
- Tang, Z.; Chai, M.; Cheng, J.; Jin, J.; Yang, Y.; Nie, Z.; Huang, Q.; Li, Y. Contamination and health risks of heavy metals in street dust from a coal-mining city in eastern China. Ecotoxicol. Environ. Saf. 2017, 138, 83–91. [Google Scholar] [CrossRef] [PubMed]
- Singh, S.; Pandey, B.; Roy, L.B.; Shekhar, S.; Singh, R.K. Tree responses to foliar dust deposition and gradient of air pollution around opencast coal mines of Jharia coalfield, India: Gas exchange, antioxidative potential and tolerance level. Environ. Sci. Pollut. Res. 2021, 28, 8637–8651. [Google Scholar] [CrossRef]
- Azam, S.; Mishra, D.P. Effects of particle size, dust concentration and dust-dispersion-air pressure on rock dust inertant requirement for coal dust explosion suppression in underground coal mines. Process Saf. Environ. 2019, 126, 35–43. [Google Scholar] [CrossRef]
- Xu, W.; Wang, J.; Zhang, M.; Li, S. Construction of landscape ecological network based on landscape ecological risk assessment in a large-scale opencast coal mine area. J. Clean. Prod. 2021, 286, 125523. [Google Scholar] [CrossRef]
- Li, L.; Zhang, R.; Sun, J.; He, Q.; Kong, L.; Liu, X. Monitoring and prediction of dust concentration in an open-pit mine using a deep-learning algorithm. J. Environ. Health Sci. Eng. 2021, 19, 401–414. [Google Scholar] [CrossRef] [PubMed]
- Xin, H.; Sun, J.; Tian, W.; Zhou, B.; Tang, Z.; Qi, X.Y.; Di, C.C.; Zhong, X.X.; Wang, D.M. The structural transformation and reburning characteristics of gas coal in Ningwu coalfield fire. Energy Explor. Exploit. 2022, 40, 79–96. [Google Scholar] [CrossRef]
- Li, S.; Wang, J.; Zhang, M.; Tang, Q. Characterizing and attributing the vegetation coverage changes in North Shanxi coal base of China from 1987 to 2020. Resour. Policy 2021, 74, 102331. [Google Scholar] [CrossRef]
- Shi, W.; Wang, J.; Li, X.; Xu, Q.; Jiang, X. Multi-fractal characteristics of reconstructed landform and its relationship with soil erosion at a large opencast coal-mine in the loess area of China. Geomorphology 2021, 390, 107859. [Google Scholar] [CrossRef]
- Chen, J.; Zhu, X.; Vogelmann, J.E.; Gao, F.; Jin, S. A simple and effective method for filling gaps in Landsat ETM+ SLC-off images. Remote Sens. Environ. 2011, 115, 1053–1064. [Google Scholar] [CrossRef]
- Han, B.; Liu, H.; Wang, R. Urban ecological security assessment for cities in the Beijing–Tianjin–Hebei metropolitan region based on fuzzy and entropy methods. Ecol. Model. 2015, 318, 217–225. [Google Scholar] [CrossRef]
- Firozjaei, M.K.; Fathololomi, S.; Kiavarz, M.; Arsanjani, J.J.; Homaee, M.; Alavipanah, S.K. Modeling the impact of the COVID-19 lockdowns on urban surface ecological status: A case study of Milan and Wuhan cities. J. Environ. Manag. 2021, 286, 112236. [Google Scholar] [CrossRef]
- Pettorelli, N.; Vik, J.O.; Mysterud, A.; Gaillard, J.; Tucker, C.J.; Stenseth, N.C. Using the satellite-derived NDVI to assess ecological responses to environmental change. Trends Ecol. Evol. 2005, 20, 503–510. [Google Scholar] [CrossRef]
- Boori, M.S.; Choudhary, K.; Paringer, R.; Kupriyanov, A. Spatiotemporal ecological vulnerability analysis with statistical correlation based on satellite remote sensing in Samara, Russia. J. Environ. Manag. 2021, 285, 112138. [Google Scholar] [CrossRef]
- Liu, X.; Zhou, W.; Bai, Z. Vegetation coverage change and stability in large open-pit coal mine dumps in China during 1990–2015. Ecol. Eng. 2016, 95, 447–451. [Google Scholar] [CrossRef]
- Qi, J.; Marsett, R.; Heilman, P.; Bieden Bender, S.; Moran, S.; Goodrich, D.; Weltz, M. RANGES improves satellite-based information and land cover assessments in southwest United States. Eos Trans. Am. Geophys. Union 2002, 83, 601–606. [Google Scholar] [CrossRef]
- Bausch, W.C.; Duke, H.R. Remote sensing of plant nitrogen status in corn. Trans. ASAE 1996, 39, 1869–1875. [Google Scholar] [CrossRef]
- Liu, Q.; Liu, G.; Huang, C.; Xie, C. Comparison of tasselled cap transformations based on the selective bands of Landsat 8 OLI TOA reflectance images. Int. J. Remote Sens. 2015, 36, 417–441. [Google Scholar] [CrossRef]
- Rikimaru, A.; Roy, P.S.; Miyatake, S. Tropical forest cover density mapping. Trop. Ecol. 2002, 43, 39–47. [Google Scholar]
- Jing, Y.; Zhang, F.; He, Y.; Kung, H.; Johnson, V.C.; Arikena, M. Assessment of spatial and temporal variation of ecological environment quality in Ebinur Lake Wetland National Nature Reserve, Xinjiang, China. Ecol. Indic. 2020, 110, 105874. [Google Scholar] [CrossRef]
- Mao, Y.; Ma, B.; Liu, S.; Wu, L.; Zhang, X.; Yu, M. Study and Validation of a Remote Sensing Model for Coal Extraction Based on Reflectance Spectrum Features. Can. J. Remote Sens. 2014, 40, 327–335. [Google Scholar] [CrossRef]
- Mukherjee, J.; Mukherjee, J.; Chakravarty, D.; Aikat, S. A Novel Index to Detect Opencast Coal Mine Areas From Landsat 8 OLI/TIRS. IEEE J. Sel. Top. Appl. Earth Obs. Remote Sens. 2019, 12, 891–897. [Google Scholar] [CrossRef]
- Li, Z.; Tang, B.; Wu, H.; Ren, H.; Yan, G.; Wan, Z.; Trigo, I.F.; Sobrino, J.A. Satellite-derived land surface temperature: Current status and perspectives. Remote Sens. Environ. 2013, 131, 14–37. [Google Scholar] [CrossRef] [Green Version]
- Sobrino, J.A.; Jiménez-Muñoz, J.C.; Paolini, L. Land surface temperature retrieval from LANDSAT TM 5. Remote Sens. Environ. 2004, 90, 434–440. [Google Scholar] [CrossRef]
- Nichol, J. An emissivity modulation method for spatial enhancement of thermal satellite images in urban heat island analysis. Photogramm. Eng. Remote Sens. 2009, 75, 547–556. [Google Scholar] [CrossRef] [Green Version]
- Dall’Erba, S.; Chen, Z. Exploratory Spatial Data Analysis. In International Encyclopedia of Human Geography, 2nd ed.; Kobayashi, A., Ed.; Elsevier: Oxford, UK, 2020; pp. 357–365. [Google Scholar] [CrossRef]
- Yuan, B.; Fu, L.; Zou, Y.; Zhang, S.; Chen, X.; Li, F.; Deng, Z.; Xie, Y. Spatiotemporal change detection of ecological quality and the associated affecting factors in Dongting Lake Basin, based on RSEI. J. Clean. Prod. 2021, 302, 126995. [Google Scholar] [CrossRef]
- Zhang, M.; Wang, J.; Li, S. Tempo-spatial changes and main anthropogenic influence factors of vegetation fractional coverage in a large-scale opencast coal mine area from 1992 to 2015. J. Clean. Prod. 2019, 232, 940–952. [Google Scholar] [CrossRef]
- Karimi Firozjaei, M.; Fathololoumi, S.; Kiavarz, M.; Biswas, A.; Homaee, M.; Alavipanah, S.K. Land Surface Ecological Status Composition Index (LSESCI): A novel remote sensing-based technique for modeling land surface ecological status. Ecol. Indic. 2021, 123, 107375. [Google Scholar] [CrossRef]
Publisher’s Note: MDPI stays neutral with regard to jurisdictional claims in published maps and institutional affiliations. |
© 2022 by the authors. Licensee MDPI, Basel, Switzerland. This article is an open access article distributed under the terms and conditions of the Creative Commons Attribution (CC BY) license (https://creativecommons.org/licenses/by/4.0/).