Article

Geodetic Mass Balance of Haxilegen Glacier No. 51, Eastern Tien Shan, from 1964 to 2018

1
State Key Laboratory of Cryospheric Science/Tien Shan Glaciological Station, Northwest Institute of Eco-Environment and Resources, Chinese Academy of Sciences, Lanzhou 730000, China
2
National Cryosphere Desert Data Center, Northwest Institute of Eco-Environment and Resources, Chinese Academy of Sciences, Lanzhou 730000, China
*
Author to whom correspondence should be addressed.
Remote Sens. 2022, 14(2), 272; https://doi.org/10.3390/rs14020272
Submission received: 19 August 2021 / Revised: 25 December 2021 / Accepted: 5 January 2022 / Published: 7 January 2022

Abstract

:
The eastern Tien Shan hosts substantial mid-latitude glaciers, but in situ glacier mass balance records are extremely sparse. Haxilegen Glacier No. 51 (eastern Tien Shan, China) is one of the very few well-measured glaciers, and comprehensive glaciological measurements were implemented from 1999 to 2011 and re-established in 2017. Mass balance of Haxilegen Glacier No. 51 (1999–2015) has recently been reported, but the mass balance record has not extended to the period before 1999. Here, we used a 1:50,000-scale topographic map and long-range terrestrial laser scanning (TLS) data to calculate the area, volume, and mass changes for Haxilegen Glacier No. 51 from 1964 to 2018. Haxilegen Glacier No. 51 lost 0.34 km2 (at a rate of 0.006 km2 a−1 or 0.42% a−1) of its area during the period 1964–2018. The glacier experienced clearly negative surface elevation changes and geodetic mass balance. Thinning occurred almost across the entire glacier surface, with a mean value of −0.43 ± 0.12 m a−1. The calculated average geodetic mass balance was −0.36 ± 0.12 m w.e. a−1. Without considering the error bounds of mass balance estimates, glacier mass loss over the past 50 years was in line with the observed and modeled mass balance (−0.37 ± 0.22 m w.e. a−1) that was published for short time intervals since 1999 but was slightly less negative than glacier mass loss in the entire eastern Tien Shan. Our results indicate that Riegl VZ®-6000 TLS can be widely used for mass balance measurements of unmonitored individual glaciers.

Graphical Abstract

1. Introduction

Glaciers store a large amount of fresh water and provide an indispensable supply of water to arid and semi-arid regions such as the Tien Shan [1]. The concept of “natural solid reservoir” is well represented in the Tien Shan, which is heavily glacierized [2,3]. Glaciers in the Tien Shan have been retreating since the end of the Little Ice Age in the context of climate warming [4]. The continuous retreat and subsequent disappearance of glaciers strongly affect the quantity and seasonal distribution of runoff in Central Asia’s glacier-fed basins [4,5]. Glacier mass balance measurements are widely recognized as being key to studies of climate–glacier interactions, water resources and sea-level rise [5,6]. The annual and seasonal mass balance of individual glaciers can be measured using the direct glaciological method (i.e., measurements recorded from repeated snow pits observations and dense arrays of ablation stakes drilled into the glacier surface). However, there are only seven glaciers in the Tien Shan with a history of in situ mass balance measurements that extends more than five years, and two glaciers in the Tien Shan have glaciological mass balance records that cover more than 30 years (Tuyuksu glacier in Kazakhstan and Urumqi Glacier No. 1 in China) [3]. Thus, regional glacier change assessments are challenged by the small number and heterogeneous spatiotemporal distribution of in situ measurement series [7,8,9,10,11].
The geodetic mass balance (difference in surface elevation obtained from repeated geodetic survey) can be considered as complementary information to glaciological mass balance measurements [12]. Previous studies in the Tien Shan have focused on geodetic mass balance estimates for individual glaciers in the northern and central regions (e.g., [13,14,15,16,17,18]). Long-term geodetic mass balance estimates for individual glaciers in the eastern Tien Shan have not been systematically reported. To the best of our knowledge, only the mass balance of Urumqi Glacier No. 1 has been calculated using the geodetic method [19,20]. Although glacier mass change at regional and global scales can be estimated using remotely sensed geodetic measurements, such estimates need to be validated using reliable glacier mass balance measurements for individual glaciers [6,8]. The quality of estimates of geodetic mass changes depends strongly on the resolution and accuracy of the digital elevation models (DEMs) that are used [20,21]. Many available global DEMs, such as those from the Advanced Spaceborne Thermal Emission and Reflection Radiometer (ASTER) Global Digital Elevation Model (GDEM), Shuttle Radar Topography Mission (SRTM) DEM and TanDEM-X, have large vertical errors in mountainous areas with complex terrain [22,23,24]. Other global DEMs, such as the Advanced Land Observing Satellite (ALOS) World AW3D30 DEM, also contain a widespread elevation anomaly [25]. Such DEMs cannot resolve microtopographic variations of surface elevation for individual glaciers, especially in the accumulation area [11]. On the other hand, the penetration of the SRTM C-Band radar signal into snow and ice can introduce a bias to estimates of glacier surface elevation changes based on radar-derived DEM [11]. Data acquisition techniques, such as real-time kinematic global navigation satellite system (RTK-GNSS), unmanned aerial vehicle (UAV), and light detection and ranging (LiDAR) can generate high-resolution DEMs with sub-centimeter vertical accuracy [23]. Compared with RTK-GNSS, UAV and LiDAR are less time-consuming and can rapidly survey glacier surface terrain, and measurements from these instruments are increasingly being used to monitor glacier changes (e.g., [26,27,28,29]). The reliability of UAV surveys is dependent on ground control points (GCPs). If GCPs are unevenly distributed or have low precision, then the UAV-derived glacier mass balance may have higher uncertainty [28,29]. LiDAR is also called laser scanning, including airborne (ALS), mobile (MLS), and terrestrial laser scanning (TLS). MLS is not applicable in remote mountain areas because the instrument is mounted on a mobile platform, which is usually a ship, train, or car [30]. ALS can be used to rapidly map extensive areas but is limited to operating at flight altitude. Great topographic relief and high mountains often limit geodetic surveys made by aircraft because most ALS instruments have a limited operating flight altitude [20]. TLS is a flexible method with high measurement accuracy and has been increasingly used to monitor glacier mass changes at seasonal, monthly, and hourly scales (e.g., [27,31,32]).
A long-range Riegl VZ®-6000 TLS was utilized to survey Haxilegen Glacier No. 51 in 2018. In situ measurements for Haxilegen Glacier No. 51 have been performed since 1999, making it one of the very few well-measured glaciers in the eastern Tien Shan. However, measurements stopped in 2011, and its mass balance has been reconstructed from 1999 to 2015 using a temperature index and an accumulation model [33]. Currently, the mass balance record for Haxilegen Glacier No. 51 has not been extended to the period before 1999, and this means that long-term mass changes in the glacier are poorly understood. In addition, to the best of our knowledge, previous studies of Haxilegen Glacier No. 51 have focused primarily on changes in its geometry (length, area, and thickness) (e.g., [34,35,36,37,38]). In this study, we extend the mass balance record of Haxilegen Glacier No. 51 using a 1:50,000-scale topographic map constructed from aerial photography and the Riegl VZ®-6000 TLS-derived DEM. The main objectives of our study are (1) to give a detailed estimate of changes to surface elevation and mass for Haxilegen Glacier No. 51 over the past 54 years, (2) to compare these estimates with local and regional geodetic mass balance estimates, and (3) to infer potential drivers for the observed glacier mass changes.

2. Study Site

Tien Shan is the largest latitudinal mountain system in Central Asia, stretching across China, Kazakhstan, Kyrgyzstan, and Uzbekistan (Figure 1a). It is far away from the ocean and covers a larger spatial area (the total length is about 2500 km and the average width from north to south is about 250–350 km). The total glacierized area in the Tien Shan is 11,864 km2, according to the latest Randolph Glacier Inventory V6.0 [39]. Haxilegen Glacier No. 51 (43.73°N, 84.39°E) is a small northeast-facing cirque glacier located in the headwaters of the Kuytun River in the eastern Tien Shan (Figure 1a). The glacier covers an altitudinal range of 3400 to 4000 m a.s.l., with a total area of around 1.48 km2 and a length of 1.70 km in 1964 [36]. The glacier occupies a wide valley of ~1.5 km at higher elevation parts and becomes narrower (<0.9 km) at lower altitudes (Figure 1b). The surface terrain is relatively flat at the lower elevations, with an average slope of ~10°. In situ measurements for Haxilegen Glacier No. 51 include glaciological mass balance, surface velocity, thickness, and variations in the surface area and location of the front [33,34]. For glaciological mass balance measurements, approximately 20 well-distributed ablation stakes were drilled into the glacier in August 2017 using a stream drill (Figure 1b). Surveys made by ground-penetrating radar in 2010 showed that the maximum and mean thicknesses of the glacier were 73 m and 39 m, respectively [36]. The glacier surface velocity ranged from 1.5 to 3.1 m a–1 during 2000–2006, based on RTK-GNSS surveys [36].
Haxilegen Glacier No. 51 is a summer-accumulation-type glacier (strong ablation and accumulation occur simultaneously during summer) in a continental climate setting [33,36]. The climate setting was confirmed by the annual climate records (1965–2017) of Usu Meteorological Station, which is located approximately 76 km northeast of Haxilegen Glacier No. 51 at an altitude of 1044 m a.s.l. and is approximately 2400 m a.s.l. below the glacier terminus in 2018. Based on climatic data from the station, the climate was characterized by very low air temperature in January (cold month) with a mean value of 15.9 °C and by high air temperatures during the summer months (May–August), with the warmest month being July (25.0 °C). More precipitation was observed in summer (May–September) than in winter, and winter precipitation accounted for only 13.7% of the total annual precipitation.

3. Data and Methods

3.1. DEM Generated from Riegl VZ®-6000 TLS

The novel long-range Riegl VZ®-6000 TLS emits near-infrared laser signals (3B laser beams with a wavelength of 1064 nm), which enable high rates of reflection (>80%) for snowy and icy terrain [40]. The instrument can provide a maximum scanning range of 6 km with a spatial resolution better than 0.0005° (1.8 arcsec). The scanned distances of Haxilegen Glacier No. 51 range from 80 to 1600 m. In order to prevent ground motion and enhance data acquisition quality, we performed TLS surveys at two fixed scan positions located in the stable terrain area with a wide view relative to the whole glacier surface (Figure 1b). The instrument was mounted on a tripod for each scanning position. The viewing geometry has a significant influence on point cloud data quality because it can influence the working distance of the Riegl VZ®-6000 and cause data voids. The instrument cannot receive the echo of the laser pulse when the angle of incidence is less than 10° [40]. The glacier surface terrain is generally steep, relative to the two scan positions, which guaranteed the requirements of the angle of incidence, and therefore meant that most of the glacier surface could be surveyed. However, the left upper corner of the glacier was invisible from the two scan positions (Figure 1c), which resulted in data voids (the unscanned areas account for 7.3% of the whole glacier). In this study, these unscanned areas were not considered for the geodetic mass balance estimates. The accuracy of the point clouds relies on the accuracy of three-dimensional (3D) coordinates of the two scan positions. Prior to the laser scanning, we used the RTK-GNSS of Trimble R10 to survey 3D coordinates of two scan positions. The accuracy of the RTK-GNSS has been reported to be within ±1 cm horizontally and ±2 cm vertically [41]. The scan campaigns were performed at the end of the ablation season under an overcast sky to reduce the influence of large areas of fresh snow and atmospheric refraction [40,41]. We implemented the TLS surveys on 2 September 2018 with a scanning angle resolution of 0.02°, resulting in a total of 58,684,617 points, with an average density of 18.67 points m−2.
We generated a DEM based on point clouds of the Riegl VZ®-6000 TLS survey. RiSCAN PRO® v 1.81 software was used to process the cloud data. The procedures include direct georeferencing, data registration, data compression, data filtering and interpolation. We first converted the point cloud data from the scanner’s own coordinate system into the global coordinate system using the RTK-GNSS surveyed 3D coordinates for the two scan positions. We then used multistation adjustment to complete data registration based on the iterative closest point algorithm, which iteratively adjusts the orientation between the two scans until the point cloud of the two scans is matched in space, at which point we merged the two scans into one layer. Then, we used an octree algorithm to compress the layer to generate points with equal spacing and to complete the data compression [20,41]. We used the terrain filter to remove noise and nonground data, and we checked the processed data and removed clear visual outliers through visual inspection. Finally, the processed point clouds were interpolated to generate a DEM using the coordinate system of the World Geodetic System (WGS) 84 datum and Universal Transverse Mercator (UTM) 45N projection, with a spatial resolution of 0.5 m. This was downscaled to 30 m resolution to match the spatial resolution of the DEM generated from a topographic map (see Section 3.2). The specific procedures of point cloud processing are described in detail in [41].

3.2. DEM Generated from the Topographic Map and Co-Registration

The 1:50,000-scale historical topographic map produced by the Chinese Military Geodetic Service in September 1964 was scanned at a resolution of 600 dpi to create a DEM for the past time. We used the one-kilometer gridlines to georeference the scanned map. The original coordinate system for the map was Beijing 1954, and the elevation system was the Yellow Sea system 1956. We reprojected the georeferenced map onto the WGS84 datum and UTM 45N projection to match the coordinate system for the TLS surveys. The topographic map and the Riegl VZ®-6000 TLS use different surveying techniques, which may result in horizontal and vertical deviations between the two datasets [42]. Thus, we selected several clearly distinguishable stable features on the high-resolution TLS point clouds and used these to register the topographic map. Subsequently, we manually digitized 20 m elevation contours from the map. We used the digital contour lines to create a triangulated irregular network (TIN) via the Create TIN module from ArcGIS 10.2. Using the TIN To Raster module from ArcGIS 10.2, we generated a raster DEM with 30 m resolution by interpolating cell values from the elevations of the created TIN [20]. The nominal vertical accuracy (root mean square error of the elevations) of the topographic map was reported to be better than 5 m for flat and hilly areas with slopes of less than 6°, and 8 m for mountainous areas with slopes of 6–25°, according to the photogrammetric Chinese National Standard [43]. The vertical accuracy of the DEM generated from the topographic map should therefore be better than 8 m, as the mean slope was approximately 17.6° in 1964.

3.3. Glacier Boundary Delineation

We manually delineated the glacier boundaries in 1964 and 2018 on the basis of the processed topographic map and TLS data. We used shaded reliefs based on the TLS-derived high-resolution DEM to delineate the glacier boundary in 2018 (Figure 2). The processes are introduced in detail in [41]. The glacier boundary derived from a Landsat Thematic Mapper image (acquisition date: 8 August 2009) was taken from the second Chinese Glacier Inventory as an additional cross-reference and used to improve the digitizing accuracy for the unscanned areas [44].

3.4. Geodetic Mass Balance Calculations

The geodetic mass balance ( B geod ), in units of m w.e. (meters water equivalent) was calculated for Haxilegen Glacier No. 51 by multiplying the glacier volume change ( Δ V ) and a volume-to-mass conversion factor (ρ) over the glacier area:
B geod = Δ V S ¯ · ρ ρ water = Δ V ( S 1964 + S 2018 ) / 2 · ρ ρ water
where S ¯ is the mean glacier area over the two acquisition years 1964 and 2018, assuming a linear change over the period [6]; ρwater is the density of water; and ρ is the average density of Δ V , for which we assume the widely recommended value of 850 ± 60 kg m−3 [45]. This assumption is valid because the geodetic surveys span more than 5 years [45]. We used the glacier boundary in 2018 to determine elevation changes due to the existence of a small glacial lake at the left fore of the glacier, which resulted in some data voids of the point cloud.

3.5. Uncertainty Estimates

3.5.1. Uncertainties in Glacier Area

Uncertainties in the glacier area include systematic and random errors [46]. The uncertainties caused by snow cover, mountain shadow, side debris, and human misinterpretation can be regarded as systematic errors. Selecting high-quality remote sensing images can reduce these uncertainties, but the total systematic error cannot be accurately estimated [46]. Uncertainties related to remote sensing image resolution, spectral characteristics and debris cover can be considered as random errors [44]. We primarily considered the uncertainty caused by image resolution as the glacier surface was clean. The uncertainty ( σ area ) can be expressed as
σ area = N pixel × r 2 / 2
where r is the spatial resolution of the topographic map and the TLS-derived DEM (30 m); N pixel is the total number of pixels passed by the glacier boundary [44]. Resulting values for σ area are given in Section 4.1.

3.5.2. Uncertainties in Geodetic Mass Balance

The uncertainties in glacier surface elevation and mass change depend mainly on the DEM differencing and volume-to-mass conversion processes [12,47]. Thus, the total uncertainty in the geodetic mass balance ( σ geod ) over the period of record can be estimated as [48]
σ geod = ( Δ h σ ρ ) 2 + ( ρ σ Δ h ) 2
where Δ h denotes the average glacier-wide change in surface elevation, which is equal to Δ V S ¯ ; σ ρ denotes the uncertainty in volume-to-mass conversion, which is set to 60 kg m−3 according to [44]. σ Δ h   is the uncertainty in glacier surface elevation change, which can be evaluated using precise and well-distributed GCPs over the stable terrain [49]. Here, the standard deviation of the elevation changes over the stable terrain is used to estimate σ Δ h due to a lack of GCPs, and the corresponding error can be expressed as [50]
σ Δ h   =   σ Δ h i     N eff
where   σ Δ h i is the standard deviation of elevation change over the stable terrain, and Neff is the standard deviation of the mean elevation change Δ h (Figure 3). Neff is the effective number of independent measurements and can be calculated as
N eff = N total · R   2 d
where Ntotal is the total number of measurements; R is the spatial resolution of the applied DEM (30 m), and d is the distance of spatial autocorrelation (686 m), which is calculated using Moran’s autocorrelation index [20,50].
Based on the law of error propagation, the average annual uncertainty in the geodetic mass balance ( σ geod . a ) is calculated as [12]
σ geod . a = σ geod n
where n is the number of years spanned by the geodetic surveys. The results are summarized in Table 1.

4. Results

4.1. Changes in Glacier Area

The glacier area was 1.48 ± 0.09 km2 in 1964 and 1.14 ± 0.08 km2 in 2018; thus, the glacier lost 0.34 km2 of its area over this period, at an average rate of 0.006 km2, or 0.4% per year. Most of the glacier area was lost from the lower elevations of the glacier (Figure 1b; Table 1). A previous study reported that the glacier area was reduced by 0.12 km2 between 1964 and 2006 at a rate of 0.003 km2 or 0.2% per year [34], which suggests that glacier shrinkage has accelerated over the last ten years (Figure 4).

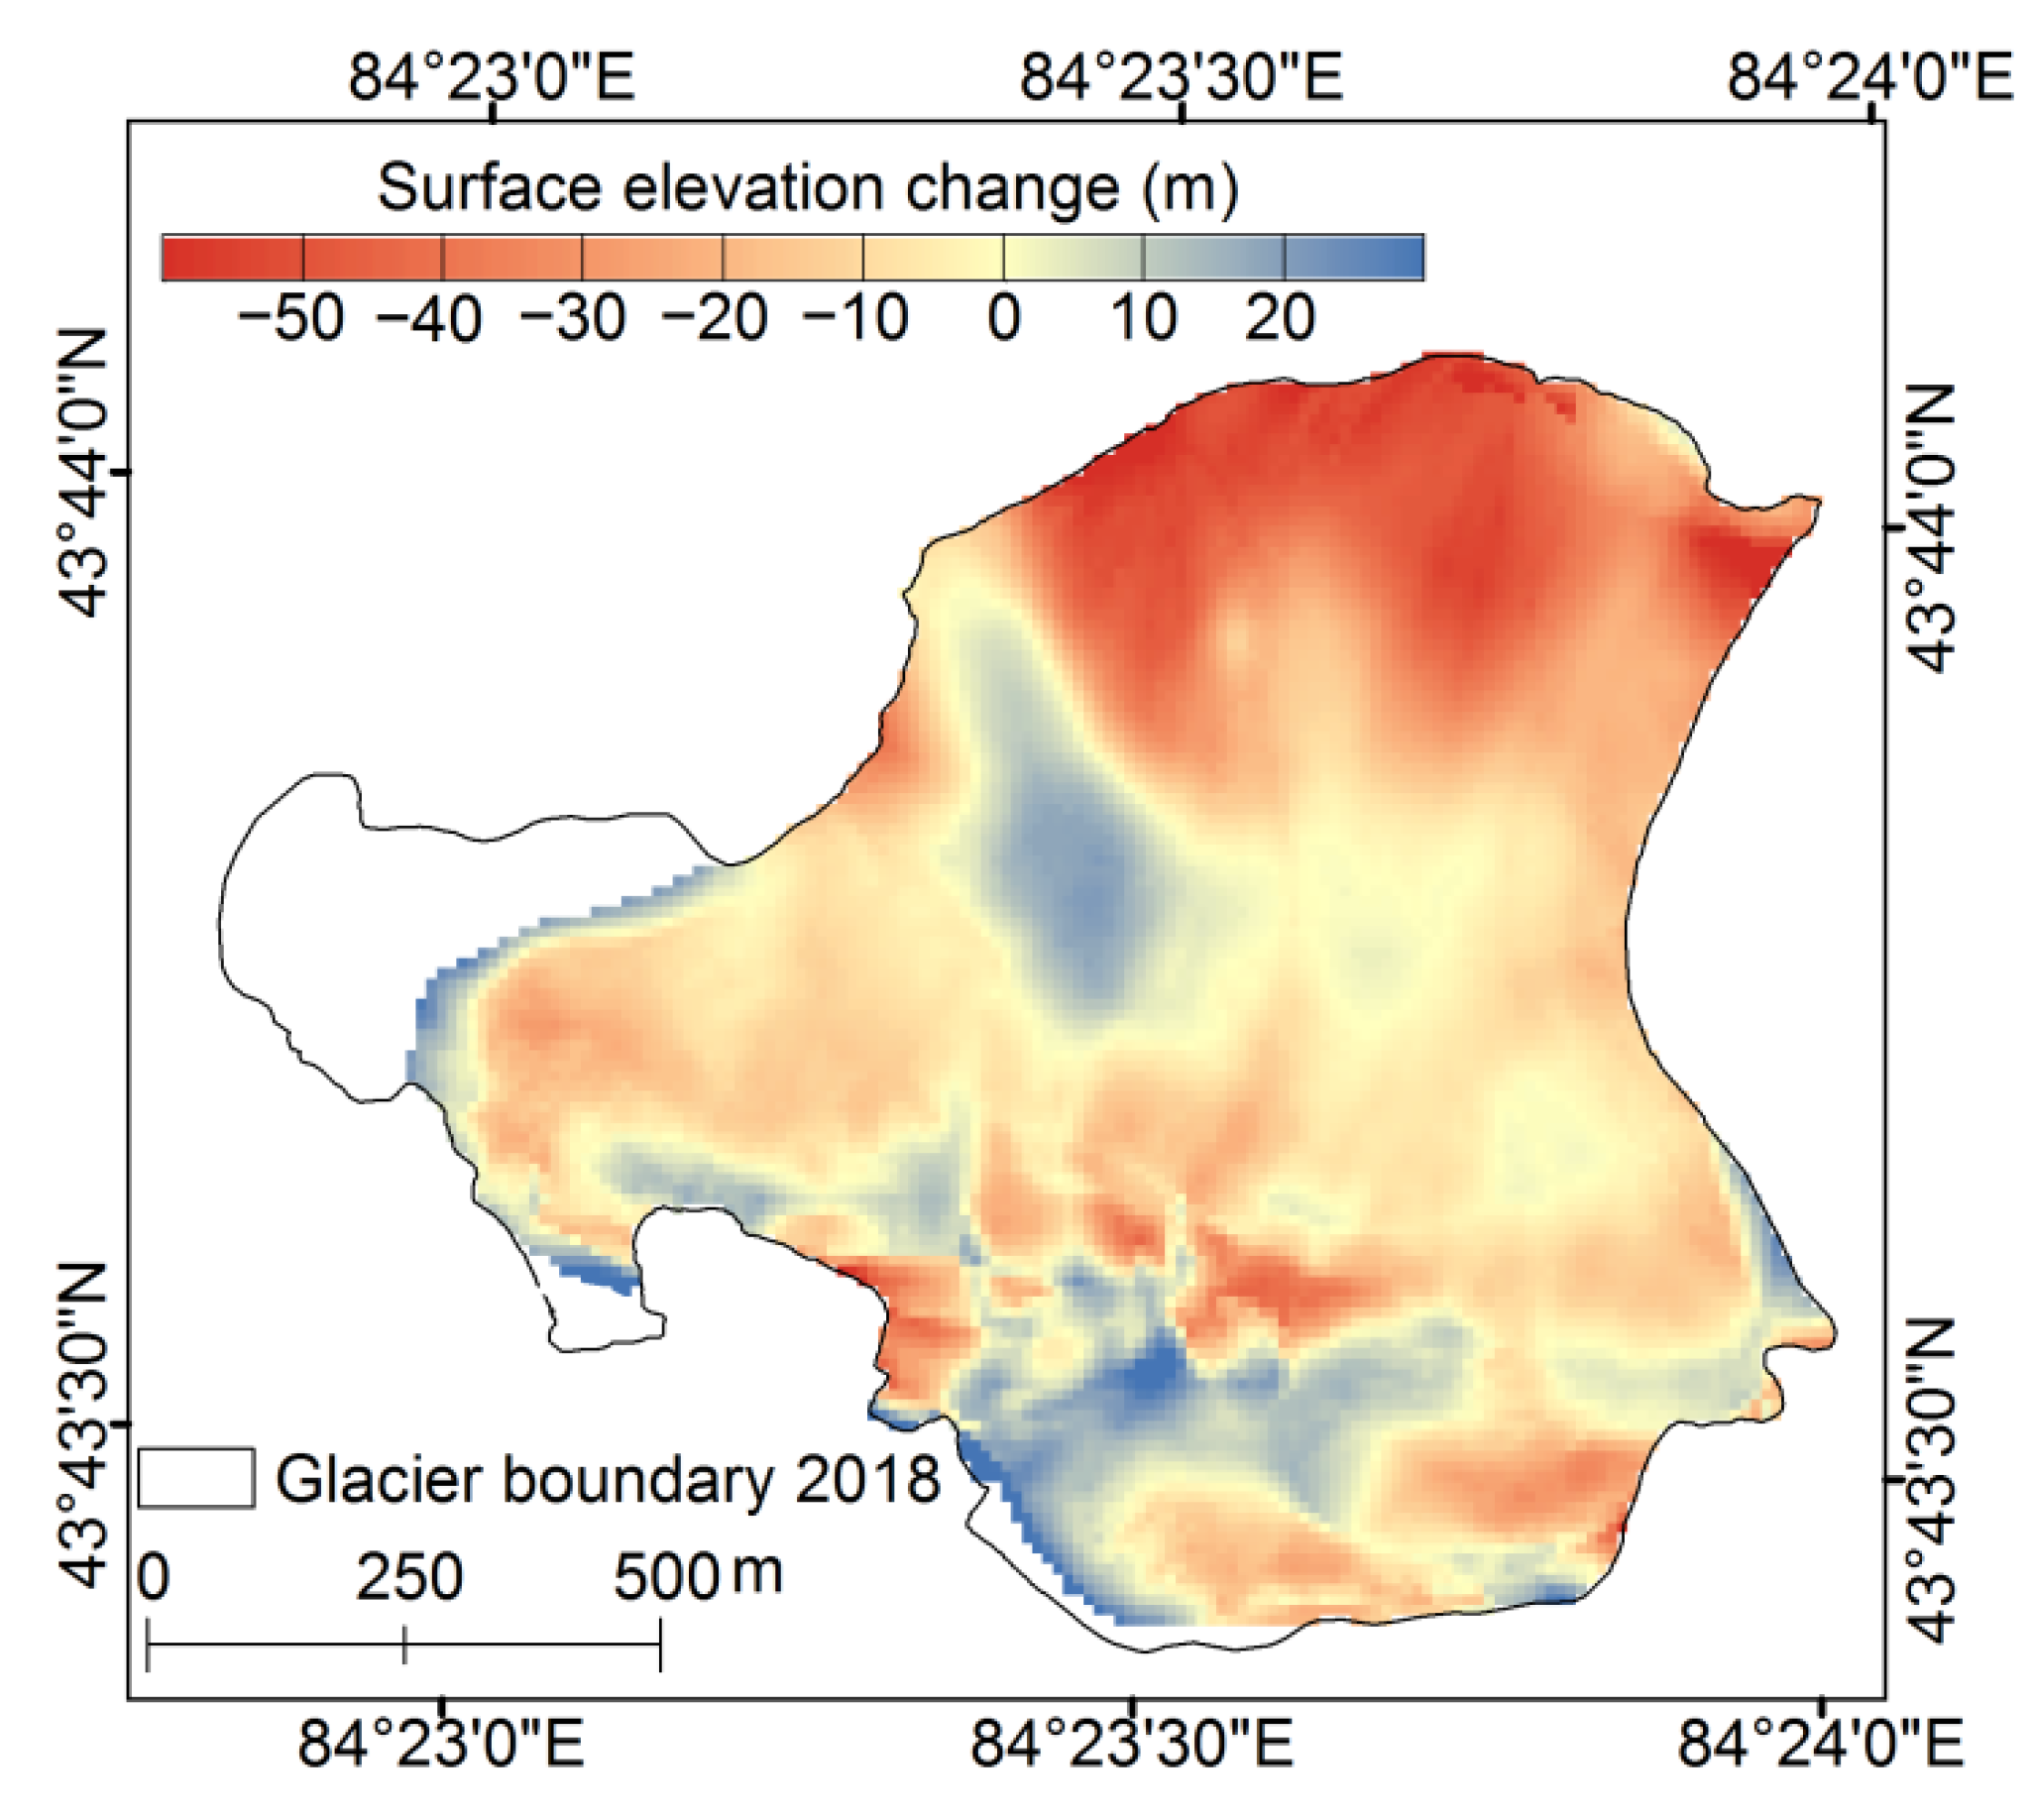
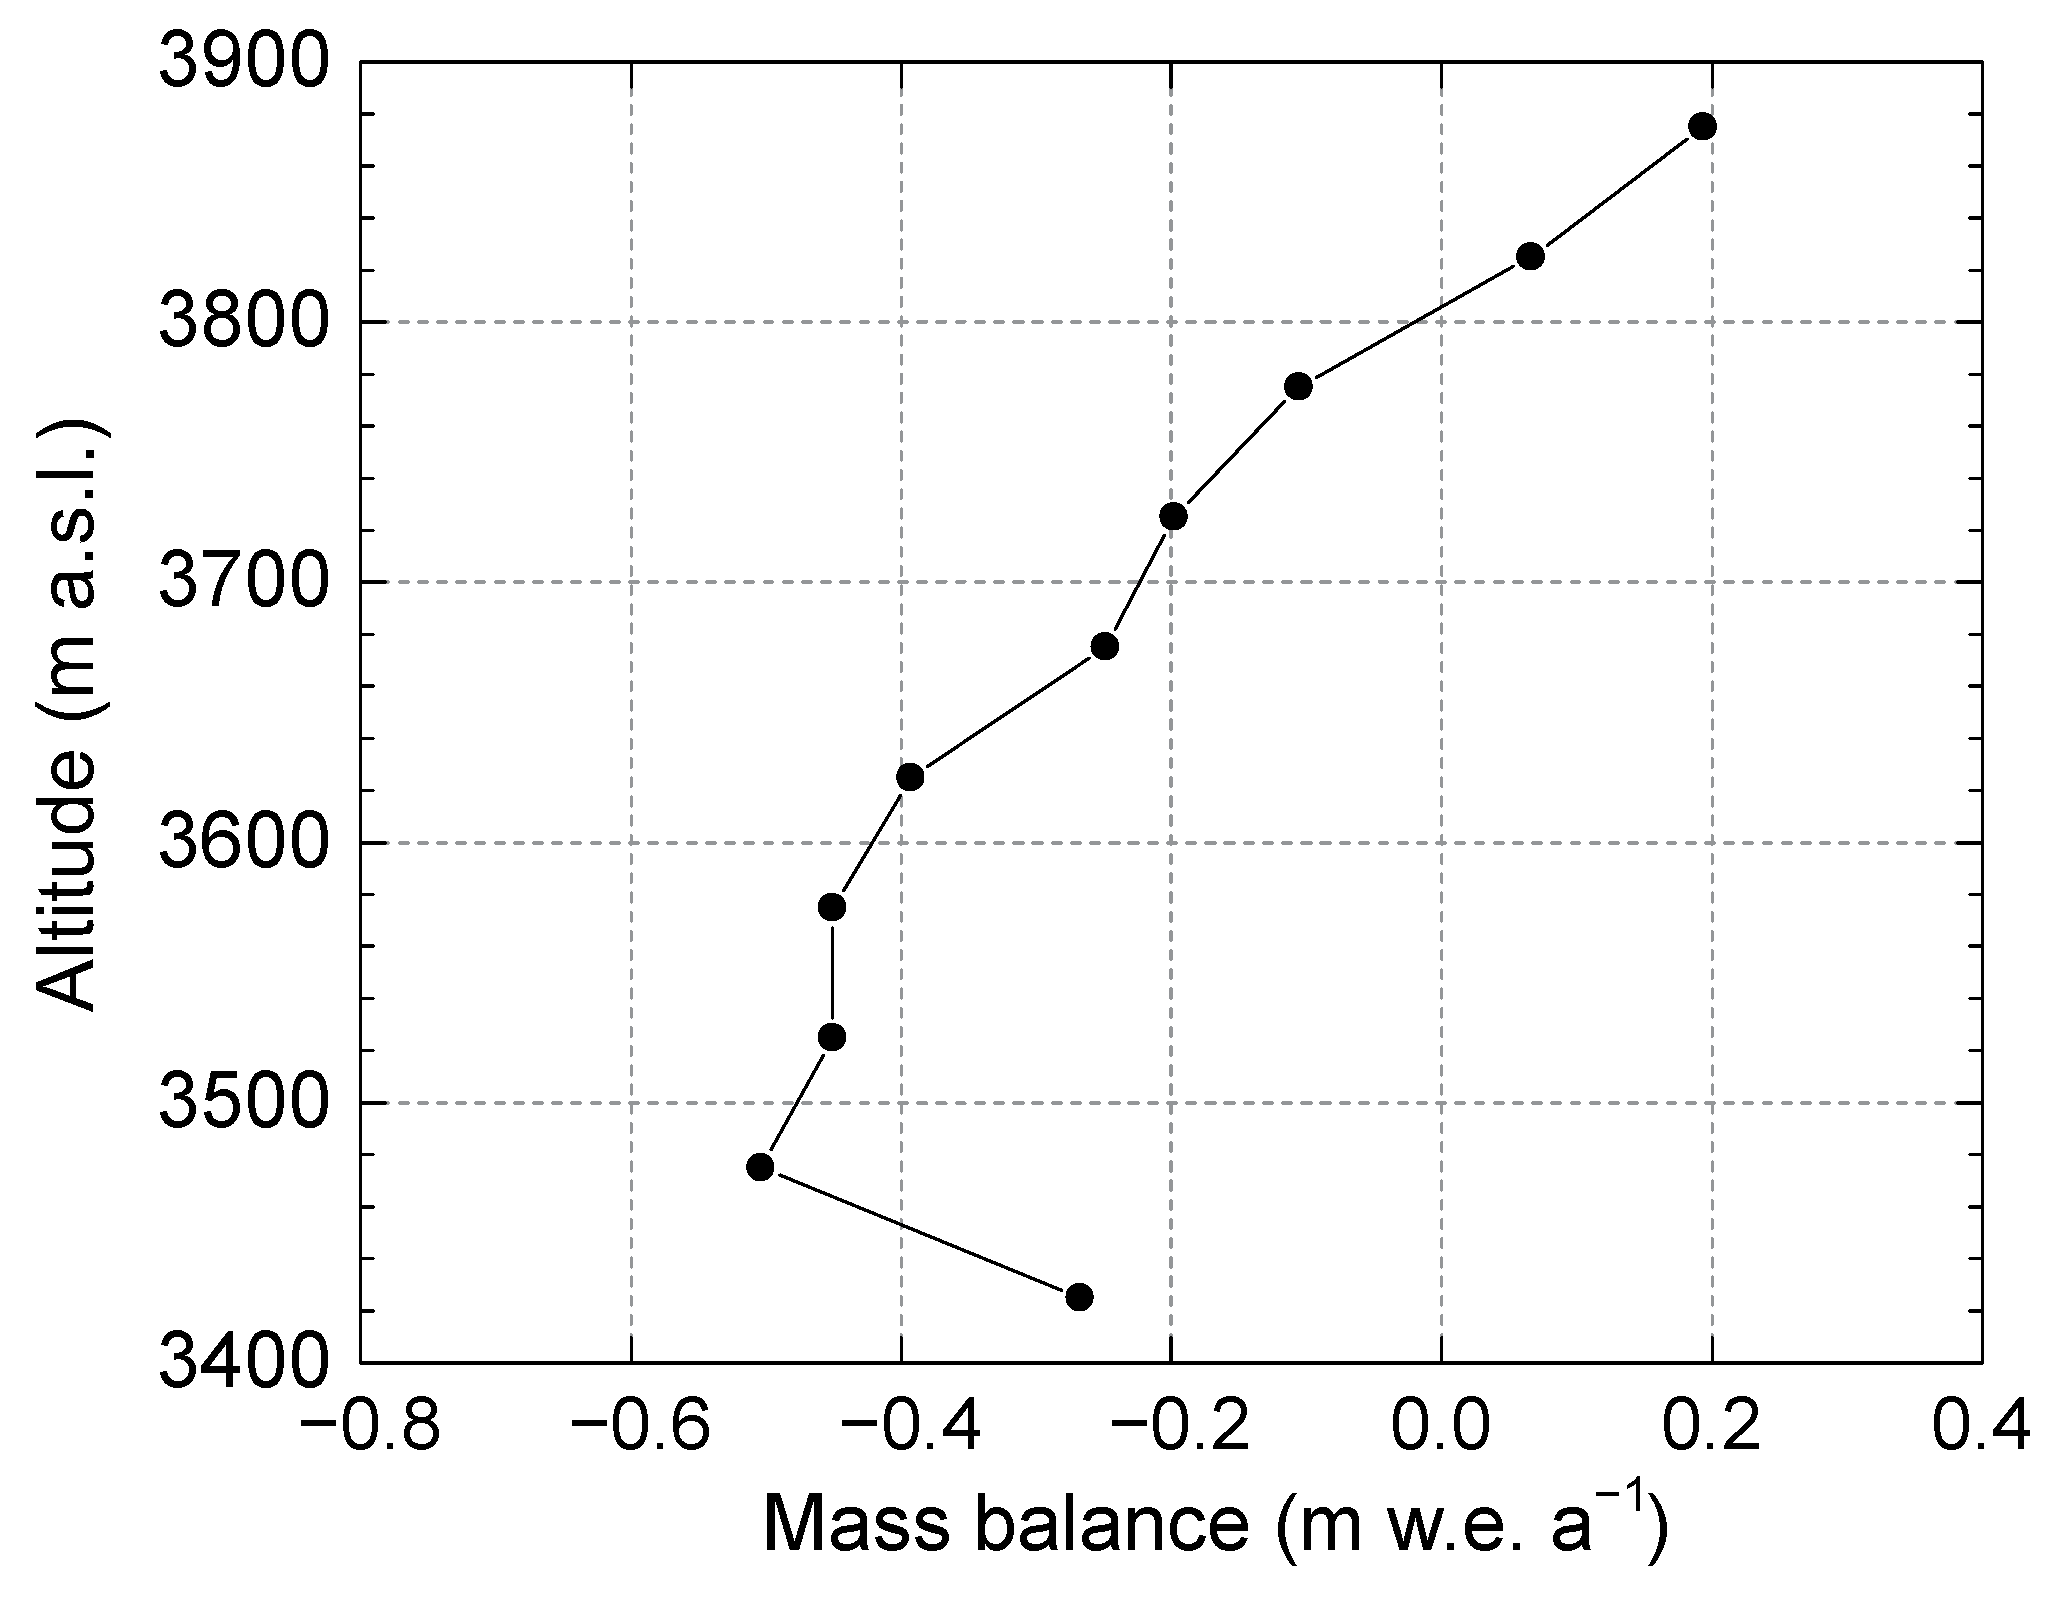
4.2. Changes in Glacier Surface Elevation and Mass Balance

Our results suggest that Haxilegen Glacier No. 51 experienced substantial thinning and mass loss during the period 1964–2018 (Figure 5). The mean thinning of Haxilegen Glacier No. 51 was −23.09 ± 6.49 m or −0.43 ± 0.12 m a−1, which was equivalent to 31.6% of the mean thickness of the glacier surveyed in 2010 [36]. The thickness reduced over almost the whole glacier area, and the most pronounced thinning occurred over the lower-elevation parts of the glacier, with the greatest reductions ranging from −60 to −50 m during the period 1964–2018 (Figure 1b and Figure 5). Some clear surface lowering (approximately −30 to −20 m) was also observed in the middle–upper parts of the glacier, where the glacier was very thin, and where the exposed rock area increased significantly with glacier shrinkage (Figure 4).
From 1964 to 2018, the total volume loss was approximately 0.034 ± 0.01 km3, and the corresponding water equivalent was approximately 28.90 ± 8.5 × 10⁶ m3. The glacier wastage resulted in a negative cumulative geodetic mass balance of −19.63 ± 5.69 m w.e., with a mean annual change of −0.36 ± 0.12 m w.e. a1. A glacial lake was observed in 2018, which may be related to Haxilegen Glacier No. 51 having experienced mass loss over the period (Figure 4). The altitudinal distribution of glacier mass balance indicates that specific mass balance increased with elevation, and reduced glacier mass loss was observed at the glacier terminus (Figure 6). This is a commonly observed pattern and agrees well with glaciological mass balance measurements for some “reference” glaciers (with >30 ongoing observations) [51].

5. Discussion

5.1. Comparison with Previous Studies

Haxilegen Glacier No. 51 retreated at a rate higher compared to the global average rate for glacier retreat (0.35% a−1), greater than the average retreat rate for glaciers in China (~0.36% a−1), and higher than the average rate for glaciers in the Chinese Tien Shan (0.37% a−1) over the last 50 years [46,52,53]. Several studies have reported the glacier shrinkage of individual glaciers in the Tien Shan. For example, an area reduction rate of 0.41% a−1 for the Tuyuksu glacier was observed between 1975 and 2006 [14], and a retreat rate of 0.36% a−1 was observed during the period 1962–2018 for Urumqi Glacier No. 1 [54], which was slightly smaller than the retreat rate of Haxilegen Glacier No. 51. The area of Haxilegen Glacier No. 51 is relatively small, which may explain the large percentage value for the relative glacier retreat rate.
As mentioned in Section 1, available glaciological mass balance records are scarce in the Tien Shan. Previous studies reconstructed the mass balance of Haxilegen Glacier No. 51 from 1999 to 2015 based on glaciological mass balance measurements of seven discontinuous hydrological years between 1999 and 2011, and an average mass balance of −0.37 ± 0.22 m w.e. a−1 was found, which is in the same range as the mass balance estimates in our study [33]. Haxilegen Glacier No. 51 thinned by ~10 m (~0.28 m w.e. a−1) from the 1980s to 2010 [36]. Therefore, we can conservatively assume that glacier mass changes for the two periods 1964–1999 and 1999–2015 were similar, indicating that the mass loss rate for Haxilegen Glacier No. 51 had not increased over the past five decades. The nearest well-monitored glacier is Urumqi Glacier No. 1, located approximately 200 km east of Haxilegen Glacier No. 51 (Figure 1a). Urumqi Glacier No. 1 experienced an annual mass loss of −0.37 ± 0.20 m w.e. a1 from 1964 to 2018, based on glaciological mass balance measurements, which is similar to the mass balance estimates in our study [51]. The available mass balance data series for the central Tien Shan showed slightly more negative mass balances than for Haxilegen Glacier No. 51, especially Sary-Tor Glacier. The long-term glaciological measurements of the Tuyuksu glacier suggested that the glacier experienced mass loss at a rate of −0.43 ± 0.20 m w.e. a−1, which is also slightly more negative than that experienced at Haxilegen Glacier No. 51; however, these mass balances agree well when error bounds are considered (within the 95% confidence interval, p = 0.017) (Table 2). The differences in mass loss may be related to local climate and the aspect, size, geometry, and hypsometry of the investigated glaciers [55]. The wider accumulation zone of Haxilegen Glacier No. 51 may favor glacier accumulation [33]. Additionally, snowdrifts or avalanches can strengthen the accumulation of the small cirque glacier [33].
A regional average mass balance rate of −0.50 ± 0.37 m w.e. a−1 was found for glaciers in the eastern Tien Shan for the period 1999–2000 to 2017–2018 [8]. Average mass loss rates of −0.32 ± 0.30 m w.e. a−1 and −0.41 ± 0.25 m w.e. a−1 were reported in the Borohoro range (a subregion in the eastern Tien Shan) for the years 1961 to 2012 and 2003 to 2009, respectively, according to glaciological modeling [3]. Mass budgets of −0.28 ± 0.20 w.e. a−1 and −0.40 ± 0.20 w.e. a−1 were estimated for glaciers in the whole Tien Shan and eastern Tien Shan, respectively, using satellite stereoimagery for the period 2000–2016 [57]. The aforementioned studies all estimated similar regional glacier mass balance for the last two decades in the eastern Tien Shan, which were more negative than the glacier mass changes for the whole Tien Shan. Mean mass losses of −0.40 ± 0.09 w.e. a−1 and −0.40 ± 0.07 w.e. a−1 were found for glaciers in the northern Tien Shan and in Ak Shirak (a subregion in the central Tien Shan) from 1964 to 2018, which were slightly more negative than the mass balance estimates for Haxilegen Glacier No. 51 [58]. The compared results only considered the absolute mass balance, and most of these estimates would be consistent if we considered the error bounds (0.07–0.37 w.e. a−1) (Table 2). However, errors in mass balance estimates cannot be eliminated and advanced data acquisition technologies, such as UAV and LiDAR, should be used to improve the accuracy of mass balance measurements. Using these technologies may make it easier to compare glacier mass balance estimates for different regions, as the error bounds may become negligible.

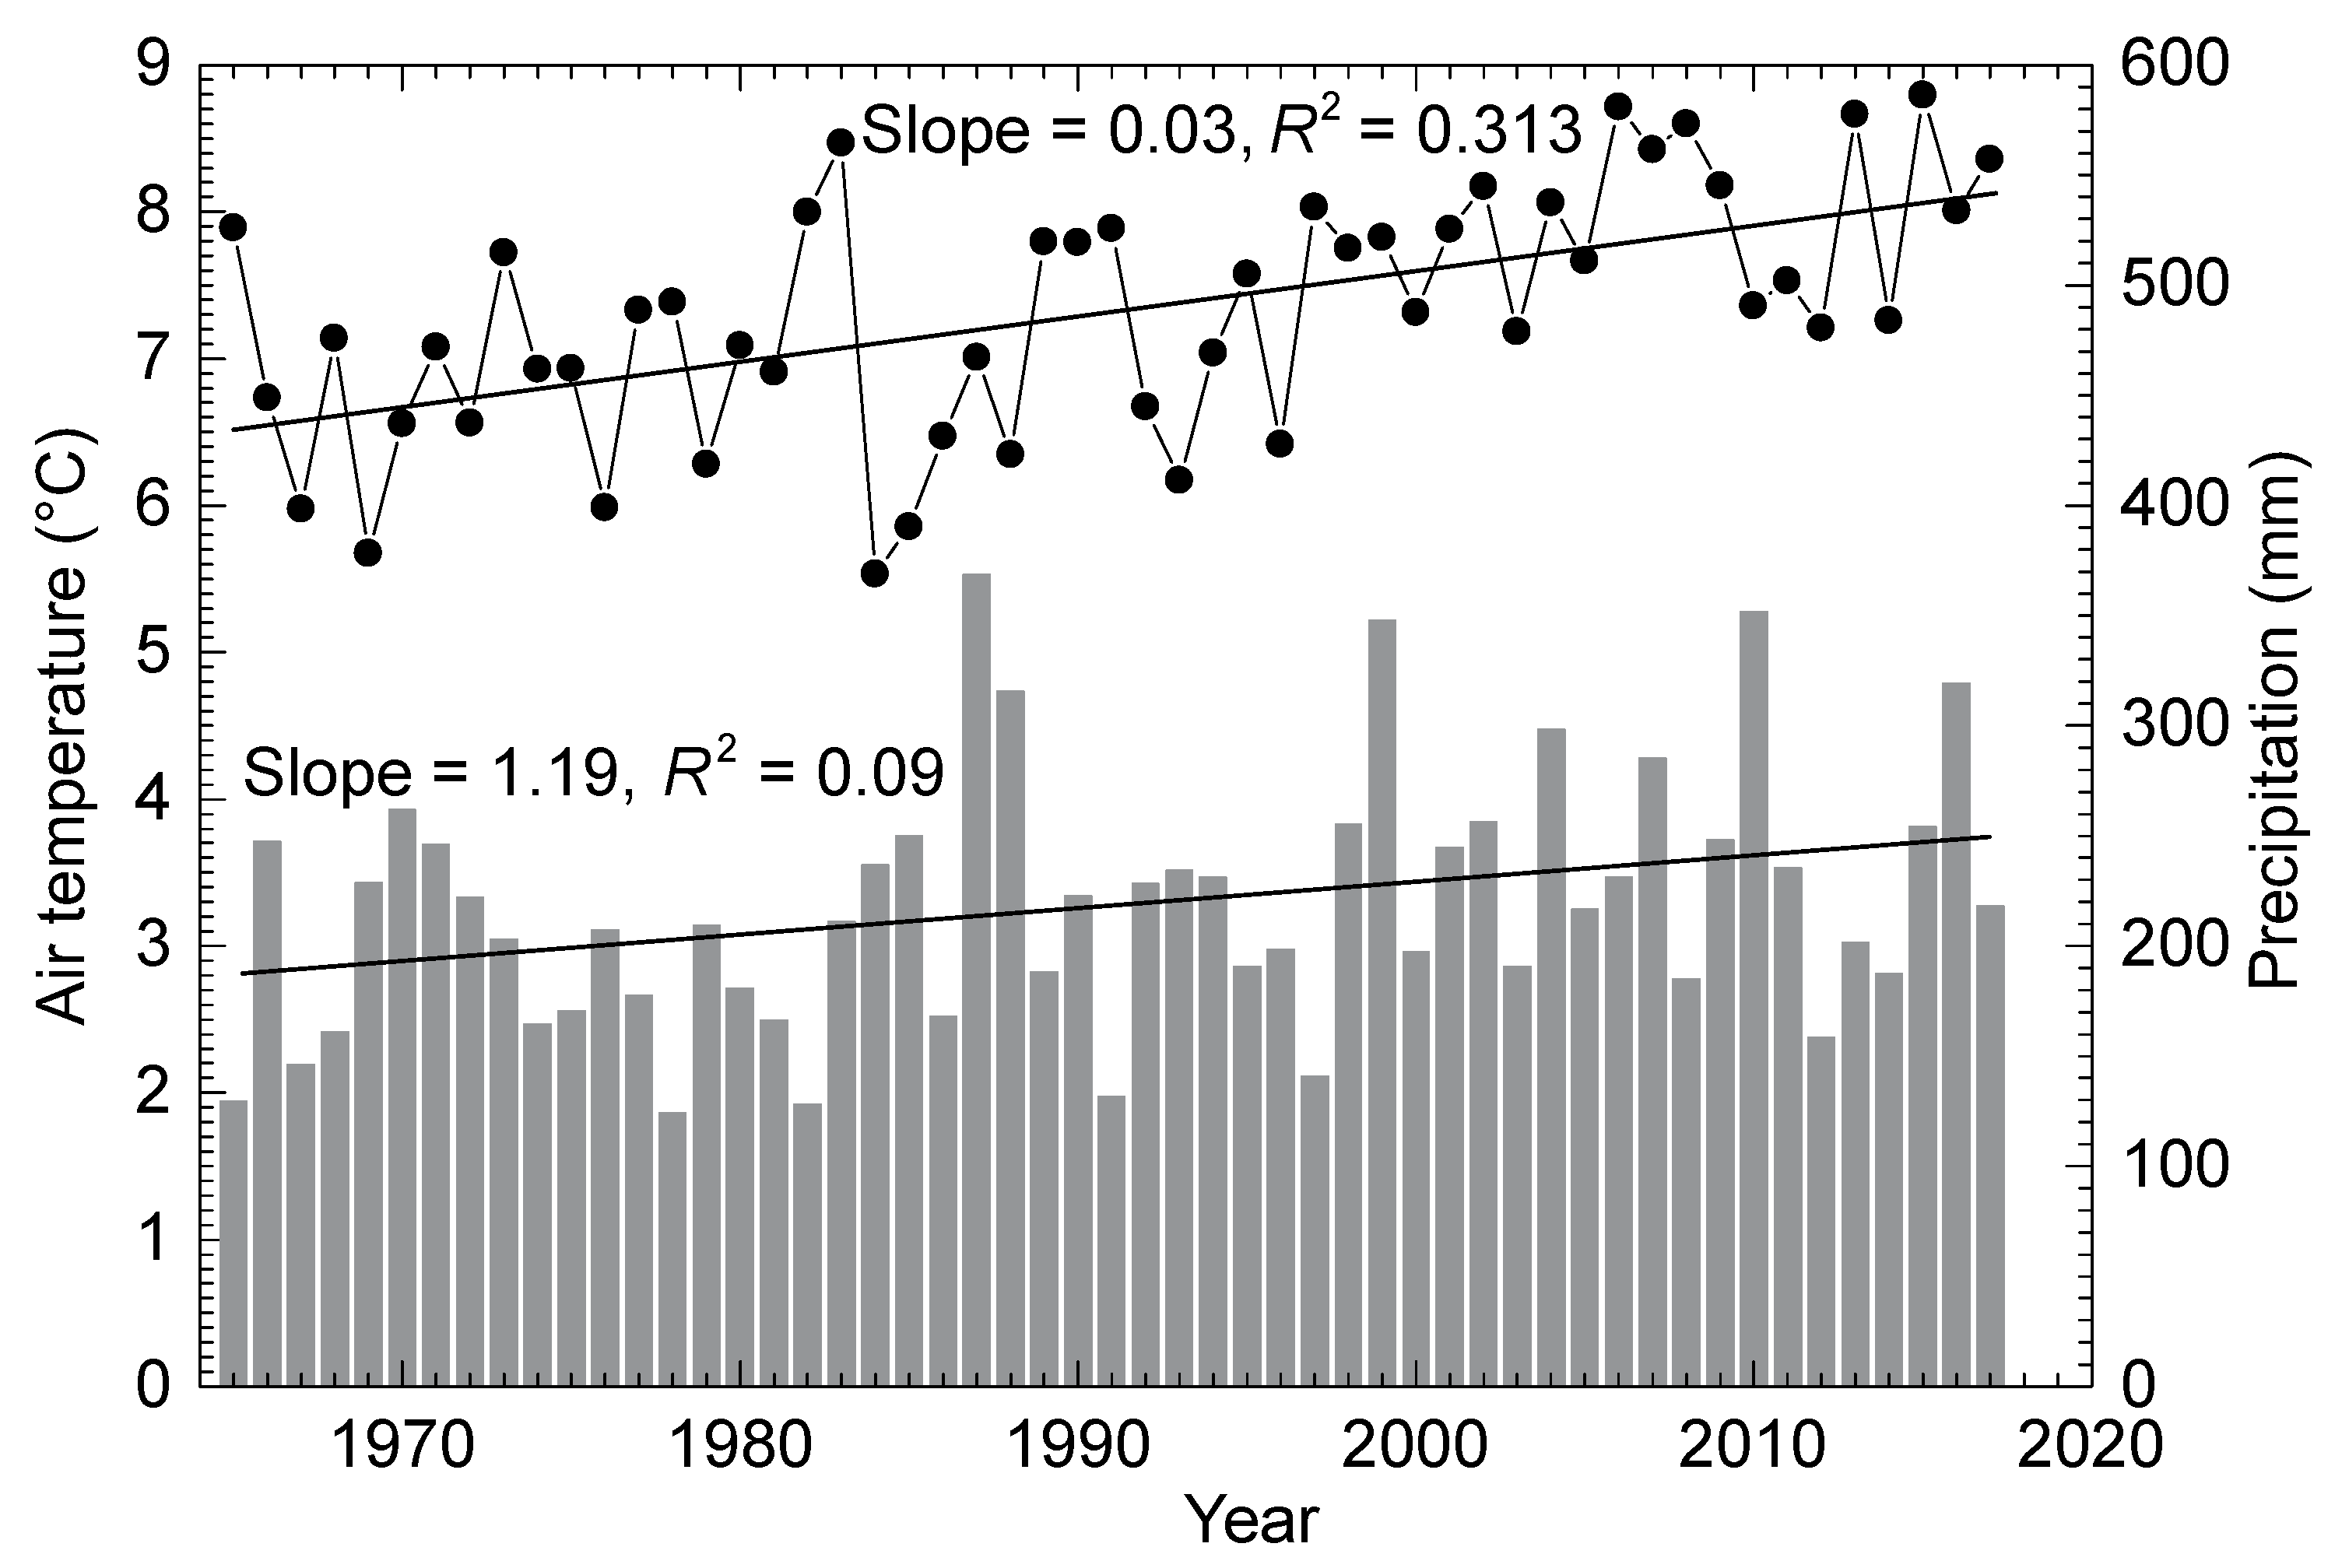
5.2. Possible Drivers for Glacier Mass Changes

Glacier mass balance is deemed to be an essential climate variable and is acknowledged to be one of the most direct indicators of climate change [12,59]. Summer (May–August) air temperature and annual precipitation were the main contributors to mass balance fluctuation for Haxilegen Glacier No. 51 over the period 1999–2015 [33]. We analyzed data recorded at the Usu Meteorological Station to investigate possible drivers for the glacier mass changes from 1964 to 2018 (Figure 7). The annual average air temperature increased at a rate of 0.3 °C (10 a) −1, which is approximately twice the average global warming rate over the same period [60]. The annual precipitation had been increasing gradually with an average rate of 12 mm (10 a)1. A particularly abrupt change in air temperature occurred in the 1990s, and the warming trend has been more significant since then (p < 0.01), with a decadal average increased value of 0.91 °C, according to data from the Usu Meteorological Station. Previous studies have suggested that mass balance for Haxilegen Glacier No. 51 is more sensitive to air temperature than precipitation [33,36]. We conservatively assumed that abnormal air temperature rise may be an important driver for glacier mass loss of Haxilegen Glacier No. 51.
Some studies have suggested that glacier surface albedo reduction is an important driver for continuous and accelerated glacier mass loss in Tibetan Plateau and its surrounding areas [60,61,62]. The average albedo of glaciers in these areas decreases gradually as the ablation area increases, which enhances shortwave radiation heating and results in a further expansion of the ablation zone [60]. Surface albedo reduction can enhance glacier ablation by approximately 30–60%, and both annual and summer glacier surface albedo in the eastern Tien Shan presented an obvious decreasing trend from 2001 to 2018 [62]. This may be a possible driver for mass changes of Haxilegen Glacier No. 51, but the lack of observed surface albedo prevents a more detailed quantitative analysis.
For glaciers in the Tibetan Plateau and its surrounding areas, previous studies have also suggested that supraglacial rivers may influence energy exchange between the atmosphere and glacier, and thereby increase the shortwave radiation energy received by the glacier and expand the effective ablation area [60]. Based on field investigations in September 2018, visual interpretation found that supraglacial drainage developed in the ablation area of the glacier (Figure 4b), and this may increase ablation area. Glacier surface velocity in the Tien Shan decreased by −6.4 ± 1.0% (10 a)1 over the period 2000–2017, a reduction in glacier velocity may reduce the supply of mass to the ablation area, and this may have contributed to the thinning at the glacier terminus [63]. Haxilegen Glacier No. 51 exhibited a slowing trend of glacier movement from 2000 to 2006 based on in situ measurements [36]. Slowdown for Haxilegen Glacier No. 51 may influence glacier mass loss. However, the possible drivers for glacier mass changes that are suggested in this paragraph are quite speculative. Further studies, including detailed observations and physics-based models, are needed to better understand these potential drivers for mass change.

5.3. Implications and Recommendations

Our results suggest that most of the glacier surface can be surveyed (Figure 3) and demonstrate that the Riegl VZ®-6000 TLS allows more detailed insight into the glacier’s evolution when repeat surveys are used [46]. Therefore, we recommend the increased use of Riegl VZ®-6000 TLS to monitor glacier mass balance. Nevertheless, there are both advantages and disadvantages to the TLS survey technique. It is not always easy to find suitable scan positions, where good visual angles can be obtained relative to the glacier surface. Thus, there are often data voids (unscanned areas), even for very small glaciers (e.g., [48]). Water vapor in the air (rain, cloud, and fog) can absorb the laser pulse and reduce the possible survey distance, which may result in further data voids. In addition, wind can influence the accuracy of the point cloud. These weather conditions are common in glaciated areas and the dry, fogless, and windless conditions that are ideal for TLS surveys are often not available [41,48]. In addition, the absence of substantial firn or fresh snow at the times of the TLS survey may increase the uncertainty of the resulting annual or seasonal geodetic mass balance estimates, because the recommended volume-to-mass conversion factor (density) is only appropriate where geodetic observations span more than 5 years [44]. We can select the end of the ablation season, when a small amount of fresh snow covers the glacier, to reduce the uncertainty in the assumed density. Ideally, the density of snow-firn in the accumulation area should be measured to establish an appropriate volume-to-mass conversion [32]. Our efforts at Haxilegen Glacier No. 51 included continuous measurements of glacier velocity because glacier emergence/submergence velocities have a significant impact on glacier surface evolution [41]. Foreseeable developments and future planned field studies include pasting several retroreflective targets to the surface of each ablation stake, increasing their reflectivity for incident laser radiation so that their 3D coordinates can be more easily surveyed. We hope that this will allow us to determine surface velocity more easily. Some recent studies propose the use of repeated snow line observations obtained from terrestrial automatic cameras to reconstruct glacier mass balance [16]. We plan to acquire snow line observations by installing terrestrial automatic cameras in a 30 m high glacier monitoring tower at the front of the glacier with the support of the “Key Scientific and Technological Infrastructure Construction Project for the Field Station Network of Chinese Academy of Sciences”.

6. Conclusions

In this study, we used a 1:50,000-scale topographic map based on aerial photography acquired in September 1964, and long-range TLS data acquired in September 2018 to calculate area, volume, and mass changes for Haxilegen Glacier No. 51. We found that the glacier area reduced by 0.34 km2 at a rate of 0.006 km2 a−1, or 0.42% a−1, from 1964 to 2018. The relative shrinkage rate is slightly higher than global and regional average rates, which may be attributed to the relatively small area of the glacier. Our resulting estimates of surface elevation changes and geodetic mass balance are clearly negative, with surface lowering observed across almost the entire glacier. The calculated mean geodetic mass balance was −0.36 ± 0.12 m w.e. a−1, which was in the same range as observed and modeled values for the mass balance published in recent studies for the period 1999–2015. However, our calculated value was slightly more positive than the glaciological mass balance of the Tuyuksu glacier over the past 50 years, and more positive than the glacier mass loss in the eastern Tien Shan over the last two decades.
Glacier mass balance measurements in the eastern Tien Shan are crucially needed. The Riegl VZ®-6000 TLS is a well-established tool for monitoring the mass balance of individual glaciers. We recommend the increased use of this device to survey the glacier. Snow-firn density should be measured in the accumulation area to improve the accuracy of geodetic mass balance estimates. Further measurements and technologies such as terrestrial automatic cameras and glacier monitoring towers can be integrated.

Author Contributions

Conceptualization, C.X. and F.W.; methodology, C.X.; software, C.X.; validation, C.X., Z.L., and J.M.; formal analysis, C.X. and F.W.; investigation, Z.L.; data curation, J.M. and X.Z.; writing—original draft preparation, C.X.; writing—review and editing, C.X. and F.W.; supervision, Z.L.; project administration and resources, C.X. and F.W. All authors have read and agreed to the published version of the manuscript.

Funding

This research was funded by the National Natural Science Foundation of China (42001067), Natural Science Foundation of Gansu Province (21JR7RA059), State Key Laboratory of Cryospheric Science (SKLCS-ZZ-2021), National Key Research and Development Program of China (2020YFF0304400), National Cryosphere Desert Data Center (20D03), and the Third Xinjiang Scientific Expedition (TXSE) program (2021xjkk14001).

Institutional Review Board Statement

Not applicable.

Informed Consent Statement

Not applicable.

Data Availability Statement

Data are available upon request by email to the corresponding author.

Acknowledgments

The authors sincerely thank the staff from Tien Shan Glaciological Station, Chinese Academy of Sciences, for providing the field surveys.

Conflicts of Interest

The authors declare no conflict of interest.

References

  1. Pritchard, H.D. Asia’s shrinking glaciers protect large populations from drought stress. Nature 2019, 569, 649–654. [Google Scholar] [CrossRef] [PubMed]
  2. Pfeffer, W.T.; Arendt, A.A.; Bliss, A.; Bolch, T.; Cogley, J.G.; Gardner, A.S.; Hagen, J.O.; Hock, R.; Kaser, G.; Kienholz, C.; et al. The randolph glacier inventory: A globally complete inventory of glaciers. J. Glaciol. 2014, 60, 537–552. [Google Scholar] [CrossRef] [Green Version]
  3. Farinotti, D.; Longuevergne, L.; Moholdt, G.; Duethmann, D.; Mölg, T.; Bolch, T.; Vorogushyn, S.; Güntner, A. Substantial glacier mass loss in the Tien Shan over the past 50 years. Nat. Geosci. 2015, 8, 716–722. [Google Scholar] [CrossRef]
  4. Sorg, A.; Bolch, T.; Stoffel, M.; Solomina, O.; Beniston, M. Climate change impacts on glaciers and runoff in Tien Shan (Central Asia). Nat. Clim. Chang. 2012, 2, 725–731. [Google Scholar] [CrossRef]
  5. Huss, M.; Hock, R. Global-scale hydrological response to future glacier mass loss. Nat. Clim. Chang. 2018, 8, 135–140. [Google Scholar] [CrossRef] [Green Version]
  6. Zemp, M.; Huss, M.; Thibert, E.; Eckert, N.; McNabb, R.; Huber, J.; Barandun, M.; Machguth, H.; Nussbaumer, S.U.; Gärtner-Roer, I.; et al. Global glacier mass changes and their contributions to sea-level rise from 1961 to 2016. Nature 2019, 568, 382–386. [Google Scholar] [CrossRef]
  7. Hoelzle, M.; Azisov, E.; Barandun, M.; Huss, M.; Farinotti, D.; Gafurov, A.; Hagg, W.; Kenzhebaev, R.; Kronenberg, M.; Machguth, H.; et al. Re-establishing glacier monitoring in Kyrgyzstan and Uzbekistan, Central Asia. Geosci. Instrum. Methods Data Syst. 2017, 6, 397–418. [Google Scholar] [CrossRef] [Green Version]
  8. Barandun, M.; Pohl, E.; Naegeli, K.; McNabb, R.; Huss, M.; Berthier, E.; Saks, T.; Hoelzle, M. Hot spots of glacier mass balance variability in Central Asia. Geophys. Res. Lett. 2021, 48, e2020GL092084. [Google Scholar] [CrossRef] [PubMed]
  9. Barandun, M.; Huss, M.; Sold, L.; Farinotti, D.; Azisov, E.; Salzmann, N.; Usubaliev, R.; Merkushkin, A.; Hoelzle, M. Re-analysis of seasonal mass balance at Abramov glacier 1968–2014. J. Glaciol. 2015, 61, 1103–1117. [Google Scholar] [CrossRef] [Green Version]
  10. Kronenberg, M.; Barandun, M.; Hoelzle, M.; Huss, M.; Farinotti, D.; Azisov, E.; Usubaliev, R.; Gafurov, A.; Petrakov, D.; Kääb, A. Mass balance reconstruction for Glacier No. 354, Tien Shan, from 2003 to 2014. Ann. Glaciol. 2016, 57, 92–102. [Google Scholar] [CrossRef] [Green Version]
  11. Thomson, L.; Brun, F.; Braun, M.; Zemp, M. Editorial: Observational Assessments of Glacier Mass Changes at Regional and Global Level. Front. Earth Sci. 2021, 8, 641710. [Google Scholar] [CrossRef]
  12. Zemp, M.; Thibert, E.; Huss, M.; Stumm, D.; Rolstad Denby, C.; Nuth, C.; Nussbaumer, S.U.; Moholdt, G.; Mercer, A.; Mayer, C.; et al. Reanalysing glacier mass balance measurement series. Cryosphere 2013, 7, 1227–1245. [Google Scholar] [CrossRef] [Green Version]
  13. Hagg, W.J.; Braun, L.N.; Uvarov, V.N.; Makarevich, K.G. A comparison of three methods of mass balance determination in the Tuyuksu glacier region, Tien Shan, Central Asia. J. Glaciol. 2004, 50, 505–510. [Google Scholar] [CrossRef] [Green Version]
  14. Kapitsa, V.; Shahgedanova, M.; Severskiy, I.; Kasatkin, N.; White, K.; Usmanova, Z. Assessment of Changes in Mass Balance of the Tuyuksu Group of Glaciers, Northern Tien Shan, Between 1958 and 2016 Using Ground-Based Observations and Pléiades Satellite Imagery. Front. Earth Sci. 2020, 8, 259. [Google Scholar] [CrossRef]
  15. Bolch, T. Glacier area and mass changes since 1964 in the Ala Archa Valley, Kyrgyz Ala-Too, northern Tien Shan. Ice Snow 2015, 129, 28–39. [Google Scholar] [CrossRef]
  16. Barandun, M.; Huss, M.; Usubaliev, R.; Azisov, E.; Berthier, E.; Kääb, A.; Bolch, T.; Hoelzle, M. Multi-decadal mass balance series of three Kyrgyz glaciers inferred from modelling constrained with repeated snow line observations. Cryosphere 2018, 12, 1899–1919. [Google Scholar] [CrossRef] [Green Version]
  17. Pieczonka, T.; Bolch, T. Region-wide glacier mass budgets and area changes for the Central Tien Shan between ~1975 and 1999 using Hexagon KH-9 imagery. Glob. Planet. Chang. 2015, 128, 1–13. [Google Scholar] [CrossRef]
  18. Kenzhebaev, R.; Barandun, M.; Kronenberg, M.; Chen, Y.; Usubaliev, R.; Hoelzle, M. Mass balance observations and reconstruction for Batysh Sook Glacier, Tien Shan, from 2004 to 2016. Cold Reg. Sci. Technol. 2017, 135, 76–89. [Google Scholar] [CrossRef] [Green Version]
  19. Wang, P.; Li, Z.; Li, H.; Wang, W.; Yao, H. Comparison of glaciological and geodetic mass balance at Urumqi Glacier No. 1, Tian Shan, central Asia. Glob. Planet. Chang. 2014, 114, 14–22. [Google Scholar] [CrossRef]
  20. Xu, C.; Li, Z.; Wang, P.; Anjum, M.N.; Li, H.; Wang, F. Detailed comparison of glaciological and geodetic mass balances for Urumqi Glacier No. 1, eastern Tien Shan, China, from 1981 to 2015. Cold Reg. Sci. Technol. 2018, 155, 137–148. [Google Scholar] [CrossRef]
  21. Fischer, M.; Huss, M.; Hoelzle, M. Surface elevation and mass changes of all Swiss glaciers 1980–2010. Cryosphere 2015, 9, 525–540. [Google Scholar] [CrossRef] [Green Version]
  22. Chu, T.; Lindenschmidt, K.-E. Comparison and validation of digital elevation models derived from InSAR for a flat inland delta in the high latitudes of Northern Canada. Can. J. Remote Sens. 2017, 43, 109–123. [Google Scholar] [CrossRef]
  23. Schumann, G.J.; Bates, P.D. The need for a high-accuracy, open-access global DEM. Front. Earth Sci. 2018, 6, 225. [Google Scholar] [CrossRef]
  24. Podgórski, J.; Kinnard, C.; Pętlicki, M.; Urrutia, R. Performance assessment of TanDEM-X DEM for mountain glacier elevation change detection. Remote Sens. 2019, 11, 187. [Google Scholar] [CrossRef] [Green Version]
  25. Caglar, B.; Becek, K.; Mekik, C.; Ozendi, M. On the vertical accuracy of the ALOS world 3D-30m digital elevation model. Remote Sens. Lett. 2018, 9, 607–615. [Google Scholar] [CrossRef]
  26. Fugazza, D.; Scaioni, M.; Corti, M.; D’Agata, C.; Azzoni, R.S.; Cernuschi, M.; Claudio, S.; Diolaiuti, G.A. Combination of UAV and terrestrial photogrammetry to assess rapid glacier evolution and map glacier hazards. Nat. Hazards Earth Syst. Sci. 2018, 18, 1055–1071. [Google Scholar] [CrossRef] [Green Version]
  27. Réveillet, M.; Vincent, C.; Six, D.; Rabatel, A.; Sanchez, O.; Piard, L.; Laarman, O. Spatio-temporal variability of surface mass balance in the accumulation zone of the Mer de Glace, French Alps, from multitemporal terrestrial LiDAR measurements. J. Glaciol. 2021, 67, 137–146. [Google Scholar] [CrossRef]
  28. Immerzeel, W.W.; Kraaijenbrink, P.D.A.; Shea, J.M.; Shrestha, A.B.; Pellicciotti, F.; Bierkens, M.F.P.; Jong, S.M.D. High-resolution monitoring of Himalayan glacier dynamics using unmanned aerial vehicles. Remote Sens. Environ. 2014, 150, 93–103. [Google Scholar] [CrossRef]
  29. Wigmore, O.; Mark, B. Monitoring tropical debris-covered glacier dynamics from high-resolution unmanned aerial vehicle photogrammetry, Cordillera Blanca, Peru. Cryosphere 2017, 11, 2463–2480. [Google Scholar] [CrossRef] [Green Version]
  30. Kukko, A.; Kaartinen, H.; Hyyppä, J.; Chen, Y. Multiplatform mobile Laser scanning: Usability and performance. Sensors 2012, 12, 11712–11733. [Google Scholar] [CrossRef] [Green Version]
  31. Gabbud, C.; Micheletti, N.; Lane, S.N. Lidar measurement of surface melt for a temperate Alpine glacier at the seasonal and hourly scales. J. Glaciol. 2015, 61, 963–974. [Google Scholar] [CrossRef] [Green Version]
  32. Xu, C.; Li, Z.; Wang, F.; Li, H.; Wang, W.; Wang, L. Using an ultra-long-range terrestrial laser scanner to monitor the net mass balance of Urumqi Glacier No. 1, eastern Tien Shan, China, at the monthly scale. J. Glaciol. 2017, 63, 792–802. [Google Scholar] [CrossRef]
  33. Zhang, H.; Li, Z.; Zhou, P.; Zhu, X.; Wang, L. Mass balance observations and reconstruction for Haxilegen Glacier No. 51, eastern Tien Shan, from 1999 to 2015. J. Glaciol. 2018, 64, 689–699. [Google Scholar] [CrossRef] [Green Version]
  34. Jing, Z.; Ye, B.; Jiao, K.; Yang, H. Surface velocity on the Glacier No. 51 at Haxilegen of the Kuytun River, Tianshan Mountains. J. Glaciol. Geocryol. 2002, 24, 564–566. [Google Scholar]
  35. Jiao, K.; Jing, Z.; Cheng, P. Monitoring results on the Glacier No. 51 at Haxilegen in the Kuytun River Basin, Tianshan Mountains. Arid Land Geogr. 2009, 32, 733–738. [Google Scholar]
  36. Wang, P.; Li, Z.; Li, H.; Wang, W.; Wu, L.; Zhang, H.; Huai, B.; Wang, L. Recent evolution in extent, thickness, and velocity of Haxilegen glacier no. 51, Kuytun River Basin, Eastern Tianshan Mountains. Arct. Antarct. Alp. Res. 2016, 48, 241–252. [Google Scholar] [CrossRef] [Green Version]
  37. Zhang, H.; Li, Z.; Wang, P.; Huai, B. Variation of Haxilegen No. 51 Glacier at the Headwater of Kuytun River in Tianshan Mountains and Its Response to Climate Change. Arid Zone Res. 2015, 32, 88–93. [Google Scholar]
  38. Zhang, H.; Li, Z.; Mu, J. Impact of the glacier change on water resources in the Kuytun River Basin, Tianshan Mountains during recent 50 years. Sci. Geogr. Sin. 2017, 37, 1771–1777. [Google Scholar]
  39. RGI Consortium. Randolph Glacier Inventory—A Dataset of Global Glacier Outlines: Version 6.0: Technical Report, Global Land Ice Measurements from Space; Digital Media: Denver, CO, USA, 2017. [Google Scholar] [CrossRef]
  40. RIEGL Laser Measurement Systems. 3D Terrestrial Laser Scanner Riegl VZ®-4000/Riegl VZ®-6000 General Description and Data Interfaces; RIEGL Laser Measurement Systems: Horn, Austria, 2014; pp. 1–466. [Google Scholar]
  41. Xu, C.; Li, Z.; Li, H.; Wang, F.; Zhou, P. Long-range terrestrial laser scanning measurements of annual and intra-annual mass balances for Urumqi Glacier No. 1, eastern Tien Shan, China. Cryosphere 2019, 13, 2361–2383. [Google Scholar] [CrossRef] [Green Version]
  42. Nuth, C.; Kääb, A. Co-registration and bias corrections of satellite elevation data sets for quantifying glacier thickness change. Cryosphere 2011, 5, 271–290. [Google Scholar] [CrossRef] [Green Version]
  43. GB/T 12343.1-2008; Compilation Specifications for National Fundamental Scale Maps—Part 1: Compilation Specifications for 1:25,000/1:50,000/1:100,000 Topographic Maps. General Administration of Quality Supervision, Inspection and Quarantine of the People’s Republic of China: Beijing, China; Standardization Administration of the People’s Republic of China: Beijing, China, 2008; pp. 1–40.
  44. Liu, S.; Yao, X.; Guo, W.; Xu, J.; Shangguan, D.; Wei, J.; Bao, W.; Wu, L. The contemporary glaciers in China based on the Second Chinese Glacier Inventory. Acta Geogr. Sin. 2015, 70, 3–16. [Google Scholar]
  45. Huss, M. Density assumptions for converting geodetic glacier volume change to mass change. Cryosphere 2013, 7, 877–887. [Google Scholar] [CrossRef] [Green Version]
  46. Bolch, T.; Menounos, B.; Wheate, R. Landsat-based inventory of glaciers in western Canada, 1985–2005. Remote Sens. Environ. 2010, 114, 127–137. [Google Scholar] [CrossRef]
  47. Galos, S.P.; Klug, C.; Maussion, F.; Covi, F.; Nicholson, L.; Rieg, L.; Gurgiser, W.; Mölg, T.; Kaser, G. Reanalysis of a 10-year record (2004–2013) of seasonal mass balances at Langen-ferner/Vedretta Lunga, Ortler Alps, Italy. Cryosphere 2017, 11, 1417–1439. [Google Scholar] [CrossRef] [Green Version]
  48. Fischer, M.; Huss, M.; Kummert, M.; Hoelzle, M. Application and validation of long-range terrestrial laser scanning to monitor the mass balance of very small glaciers in the Swiss Alps. Cryosphere 2016, 10, 1279–1295. [Google Scholar] [CrossRef] [Green Version]
  49. Bolch, T.; Pieczonka, T.; Mukherjee, K.; Shea, J. Glaciers in the Hunza catchment (Karakoram) have been nearly in balance since the 1970s. Cryosphere 2017, 11, 531–539. [Google Scholar] [CrossRef] [Green Version]
  50. Gardelle, J.; Berthier, E.; Arnaud, Y.; Kääb, A. Region-wide glacier mass balances over the Pamir–Karakoram–Himalaya during 1999–2011. Cryosphere 2013, 7, 1263–1286. [Google Scholar] [CrossRef] [Green Version]
  51. WGMS (World Glacier Monitoring Service). Global Glacier Change Bulletin No. 3 (2016–2017); ISC(WDS)/IUGG(IACS)/UNEP/UNESCO/WMO; Zemp, M., Gärtner-Roer, I., Nussbaumer, S.U., Bannwart, J., Rastner, P., Paul, F., Hoelzle, M., Eds.; World Glacier Monitoring Service: Zurich, Switzerland, 2020; pp. 1–274. [Google Scholar] [CrossRef]
  52. Mu, J.; Li, Z.; Zhang, H.; Liang, P. The global glacierized area: Current situation and recent change, based on the Randolph Glacier Inventory (RGI 6.0) published in 2017. J. Glaciol. Geocryol. 2018, 40, 238–248. [Google Scholar]
  53. Xing, W.; Li, Z.; Zhang, H.; Zhang, M.; Liang, P.; Mu, J. Spatial-temporal variation of glacier resources in Chinese Tianshan Mountains since 1959. Acta Geogr. Sin. 2017, 72, 1594–1605. [Google Scholar]
  54. Li, H.; Wang, P.; Li, Z.; Jin, S.; Xu, C.; Liu, S.; Zhang, Z.; Xu, L. An application of three different field methods to monitor changes in Urumqi Glacier No. 1, Chinese Tien Shan, during 2012–2018. J. Glaciol. 2021, 1–13. [Google Scholar] [CrossRef]
  55. Brun, F.; Wagnon, P.; Berthier, E.; Jomelli, V.; Maharjan, S.B.; Shrestha, F.; Kraaijenbrink, P.D.A. Heterogeneous influence of glacier morphology on the mass balance variability in High Mountain Asia. J. Geophys. Res. Earth Surf. 2019, 124, 1331–1345. [Google Scholar] [CrossRef]
  56. Azisov, E.; Barandun, M.; Saks, T.; Vorogushyn, S.; Usubaliev, R.; Hoelzle, M. Reconstructed centennial mass balance change for Golubin Glacier, Northern Tien Shan. In Proceedings of the EGU General Assembly Conference, Vienna, Austria, 7–12 April 2019. [Google Scholar]
  57. Brun, F.; Berthier, E.; Wagnon, P.; Kääb, A.; Treichler, D.A. Spatially resolved estimate of High Mountain Asia glacier mass balances from 2000 to 2016. Nat. Geosci. 2017, 10, 668–673. [Google Scholar] [CrossRef] [PubMed]
  58. Bhattacharya, A.; Bolch, T.; Mukherjee, K.; King, O.; Menounos, B.; Kapitsa, V.; Neckel, N.; Yang, W.; Yao, T. High Mountain Asian glacier response to climate revealed by multi-temporal satellite observations since the 1960s. Nat. Commun. 2021, 12, 4133. [Google Scholar] [CrossRef]
  59. Kaser, G.; Cogley, J.G.; Dyurgerov, M.B.; Meier, M.F.; Ohmura, A. Mass balance of glaciers and ice caps: Consensus estimates for 1961–2004. Geophys. Res. Lett. 2006, 33, L19501. [Google Scholar] [CrossRef] [Green Version]
  60. Yao, T.; Yu, W.; Wu, G.; Xu, B.; Yang, W.; Zhao, H.; Wang, W.; Li, S.; Wang, N.; Li, Z.; et al. Glacier anomalies and relevant disaster risks on the Tibetan Plateau and surroundings. Chin. Sci. Bull. 2019, 64, 2770–2782. [Google Scholar] [CrossRef] [Green Version]
  61. Li, Z.; Li, H.; Chen, Y. Mechanisms and simulation of accelerated shrinkage of continental glaciers: A case study of Urumqi Glacier No. 1 in Eastern Tianshan, central Asia. J. Earth Sci. 2011, 22, 423–430. [Google Scholar] [CrossRef]
  62. Zhang, Y.; Gao, T.; Kang, S.; Shangguan, D.; Luo, X. Albedo reduction as an important driver for glacier melting in Tibetan Plateau and its surrounding areas. Earth-Sci. Rev. 2021, 220, 103735. [Google Scholar] [CrossRef]
  63. Dehecq, A.; Gourmelen, N.; Gardner, A.S.; Brun, F.; Goldberg, D.; Nienow, P.W.; Berthier, E.; Vincent, C.; Wagnon, P.; Trouvé, E. Twenty-first century glacier slowdown driven by mass loss in High Mountain Asia. Nat. Geosci. 2019, 12, 22–27. [Google Scholar] [CrossRef]
Figure 1. (a) Location map of Haxilegen Glacier No. 51, eastern Tien Shan, China; the blue solid circles indicate the distribution of other monitored glaciers, and the background is from Environmental Systems Research Institute (ESRI); (b) observation network of glaciological mass balance in 2017, glacier boundary in 1964, and 2018 delineated from a topographic map and TLS-derived DEM, respectively, which shows glacier area change in different elevation bands, and the background is from the Advanced Land Observing Satellite (ALOS) DEM; (c) spatially distributed scan positions (S1 and S2) and the corresponding scanning range of the TLS; the background is from Google Earth.
Remotesensing 14 00272 g001
Figure 2. Shaded reliefs of Haxilegen Glacier No. 51 margin calculated based on the TLS-derived DEM (on 1 September 2016) with the glacier boundary in 2018. The shaded relief calculated through ArcGIS 10.2 software with the solar azimuth angle and elevation angle was set to 300° and 60°, respectively.
Remotesensing 14 00272 g002
Figure 3. (a) Spatially distributed surface elevation changes over stable terrain; (b) corresponding frequency distribution of the changes, and the red curve is normal fits over the distribution. In addition, the median (μ), the standard deviation (σ), and the total number of pixels (N) for the stable terrain elevation changes are given.
Remotesensing 14 00272 g003
Figure 4. Shrinkage of Haxilegen Glacier No. 51 shown by pictures taken in 2006 (a) and 2018 (b). The picture in 2006 is from [35]. The red frame indicates corresponding areas of the two years, where the exposed rock area increased significantly. A small glacial lake was observed at the fore of the glacier in 2018.
Remotesensing 14 00272 g004
Figure 5. Spatially distributed geodetic glacier surface elevation changes between September 1964 and September 2018. The blank areas represent no data, which are not detected by the TLS because these areas are invisible relative to the two scan positions.
Remotesensing 14 00272 g005
Figure 6. Altitudinal (within 20 m elevation bands) distribution of annual geodetic mass balance during the period 1964–2018 as a function of altitude.
Remotesensing 14 00272 g006
Figure 7. Variations in annual average air temperature and precipitation at the Usu Meteorological Station during the period 1965–2017.
Remotesensing 14 00272 g007
Table 1. Average annual glacier surface elevation changes ( Δ h ), standard deviation ( σ Δ h ) in surface elevation changes over stable terrain, average annual uncertainty in the geodetic mass balance (   σ geod . a ), and the corresponding annual geodetic mass balance (Bgeod.a).
PeriodArea in 2018 (km2)Area Reduction (%)Δh
(m a−1)
σΔh
(m a−1)
σgeod.a
(m w.e. a−1)
Bgeod.a
(m w.e. a−1)
1964–20181.14 ± 0.0922.9−0.430.120.11−0.36
Table 2. Comparison of available mass balance series for glaciers in Tien Shan (TS). The locations of those glaciers are marked in Figure 1, and the unit of mass balance and its uncertainty is m w.e. a−1.
GlacierPeriodMass BalanceMethodRegionSource
Haxilegen Glacier No. 511964–2018−0.36 ± 0.11GeodeticEastern TSThis study
1999–2015−0.37 ± 0.22Glaciological/modeledEastern TS[33]
Urumqi Glacier No. 11964–2018−0.37 ± 0.20 1GlaciologicalEastern TS[51]
Glacier No. 3542003–2014−0.43 ± 0.09Glaciological/modeledCentral TS[10]
Batysh Sook Glacier2004–2016−0.39 ± 0.26Glaciological/modeledCentral TS[18]
Sary-Tor Glacier~1975–1999−0.51 ± 0.25GeodeticCentral TS[17]
Karabatkak Glacier1957–1998−0.44 ± 0.20 1GlaciologicalCentral TS[4]
~1975–1999−0.54 ± 0.25Geodetic[17]
Tuyuksu glacier1964–2018−0.43 ± 0.20 1GlaciologicalNorthern TS[51]
Golubin Glacier1950–2018−0.21 ± 0.42Glaciological/modeledNorthern TS[56]
1 The uncertainty of glaciological mass balance was estimated according to [18].
Publisher’s Note: MDPI stays neutral with regard to jurisdictional claims in published maps and institutional affiliations.

