
Assessing Snow Phenology and Its Environmental Driving Factors in Northeast China


Abstract
:1. Introduction
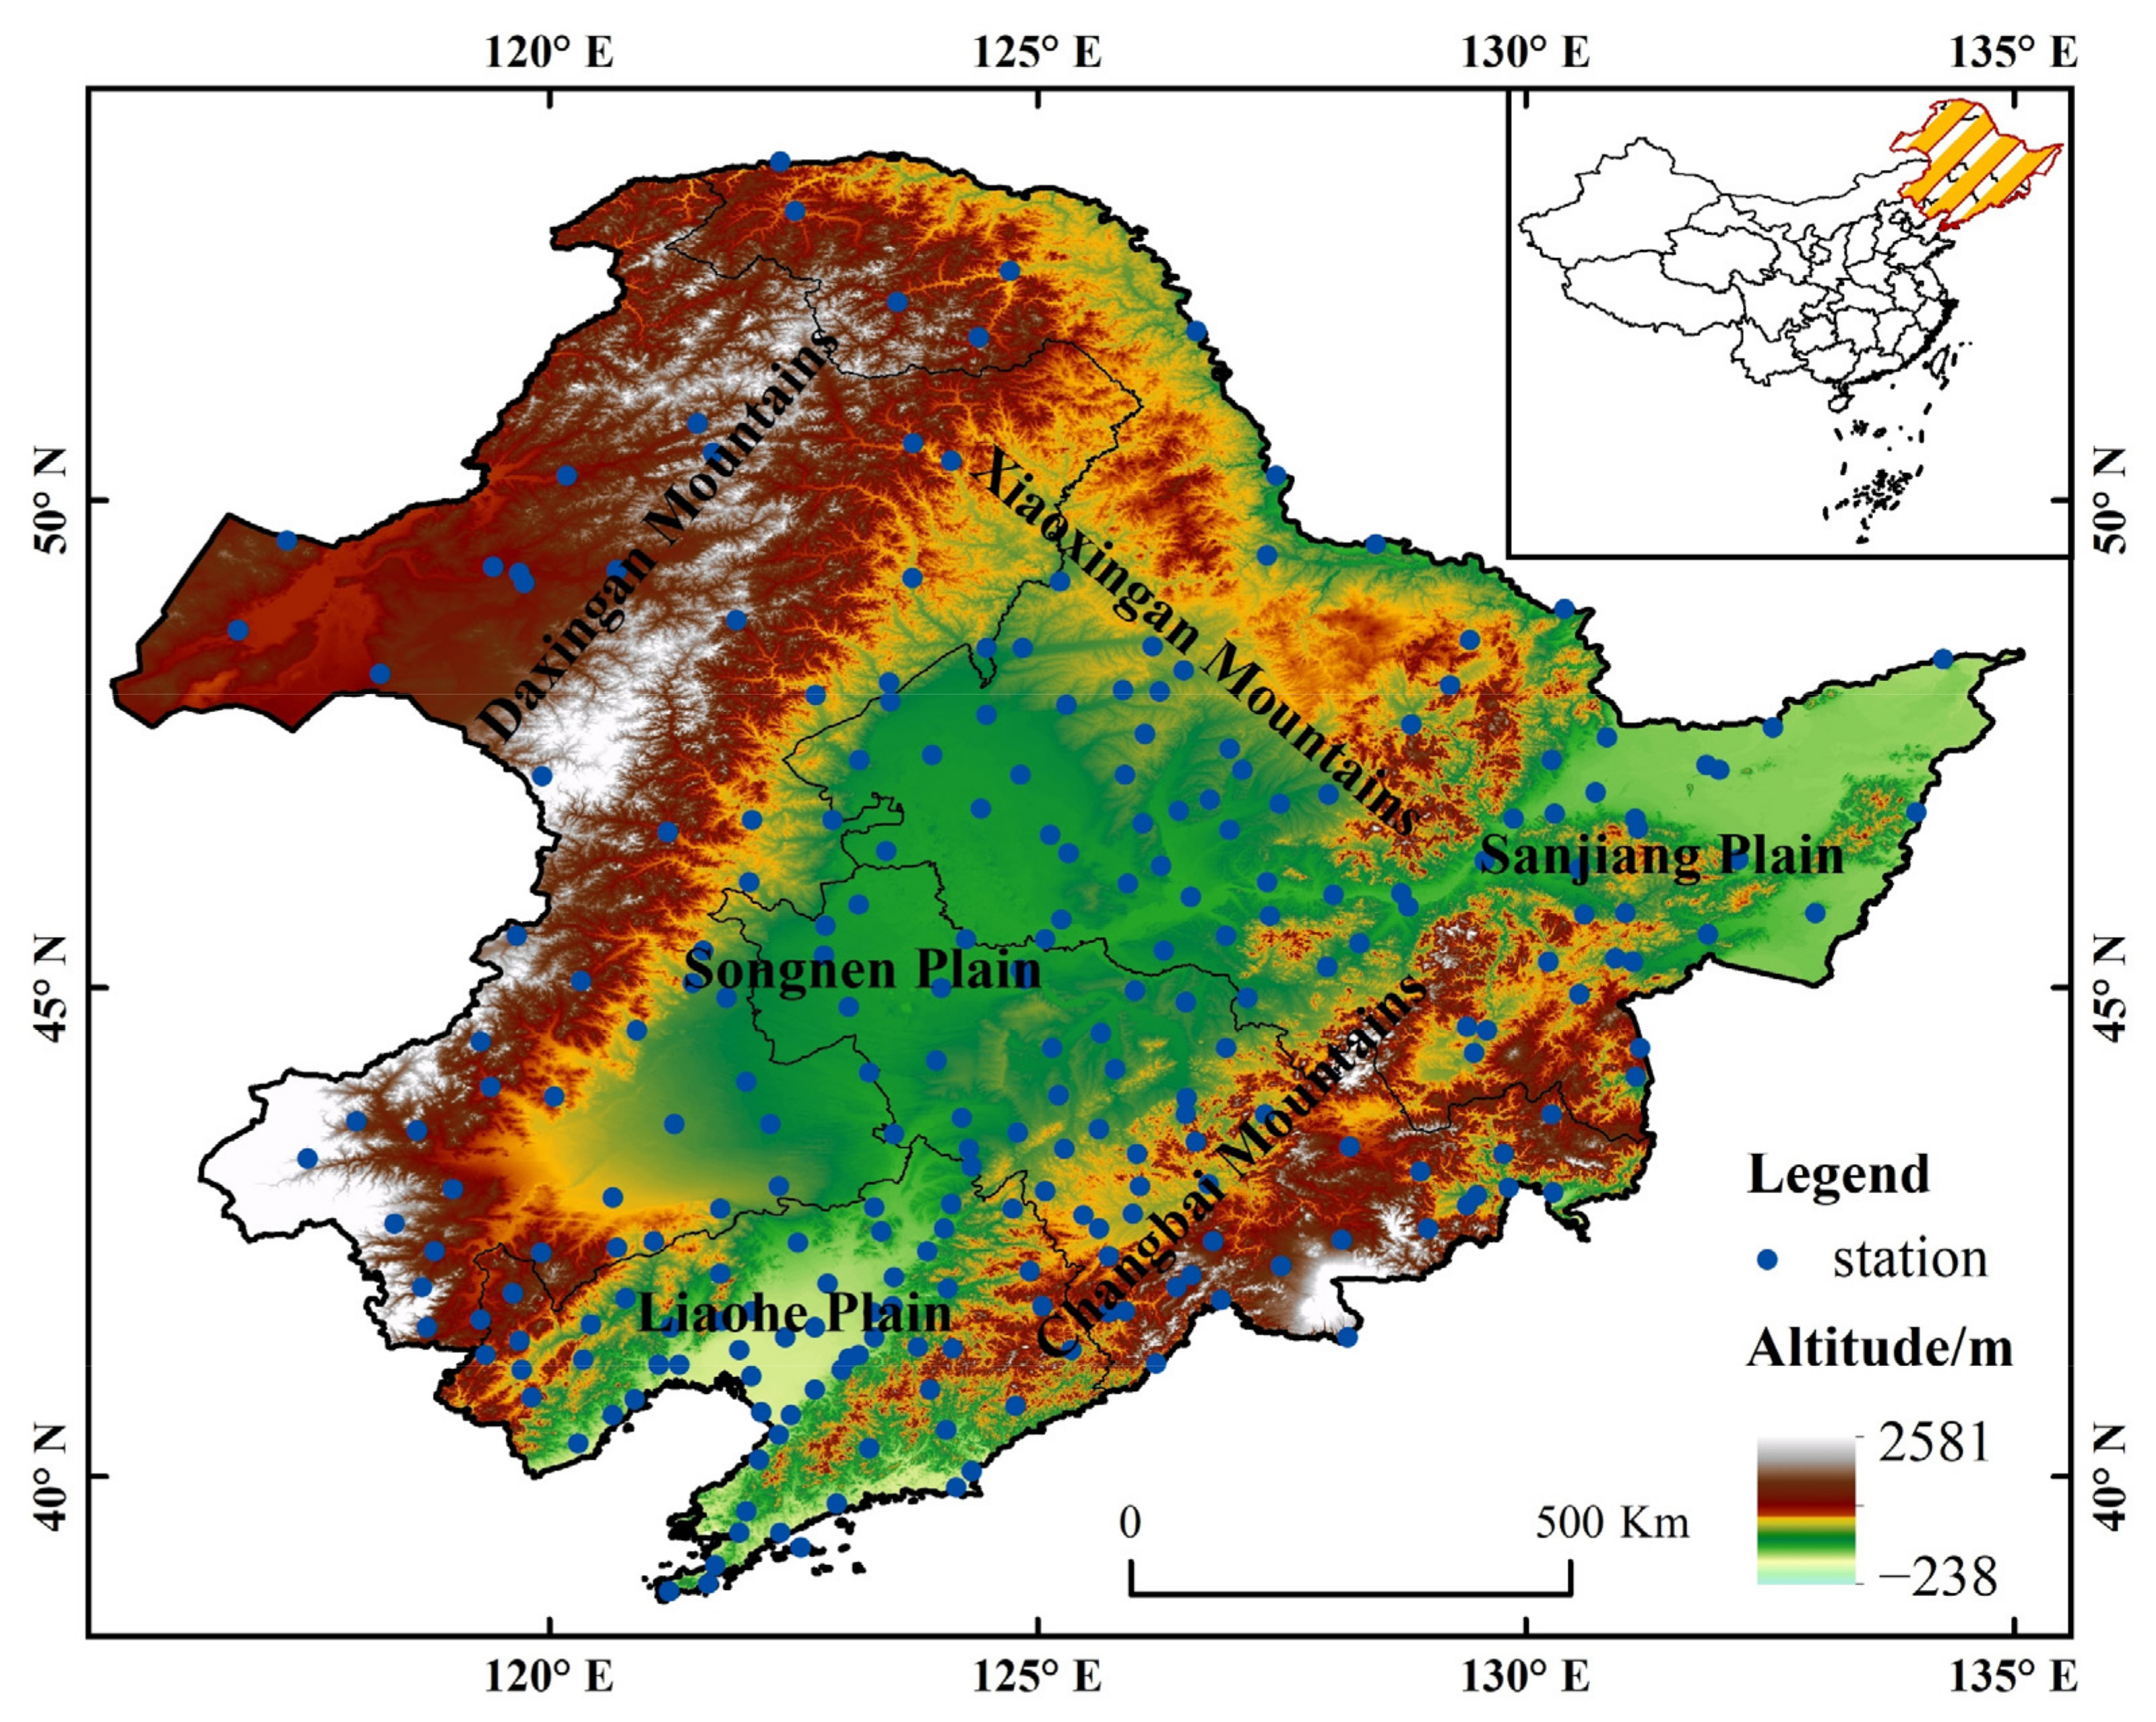
2. Study Area
3. Methodology
3.1. Data Sources
3.1.1. MODIS Data
3.1.2. Snow Depth Records
3.1.3. Meteorological Data
3.1.4. DEM
3.1.5. Vegetation Data
3.1.6. Land Cover Data
3.2. Methodology
3.2.1. MODIS Snow Product Cloud Removal
3.2.2. Snow Phenology Calculation
3.2.3. Cloud-Free Snow Product Accuracy Assessment
3.2.4. Trend Analysis
3.2.5. Relative Importance of Multiple Factors to Snow Phenology
3.2.6. Correlation Analysis
4. Results
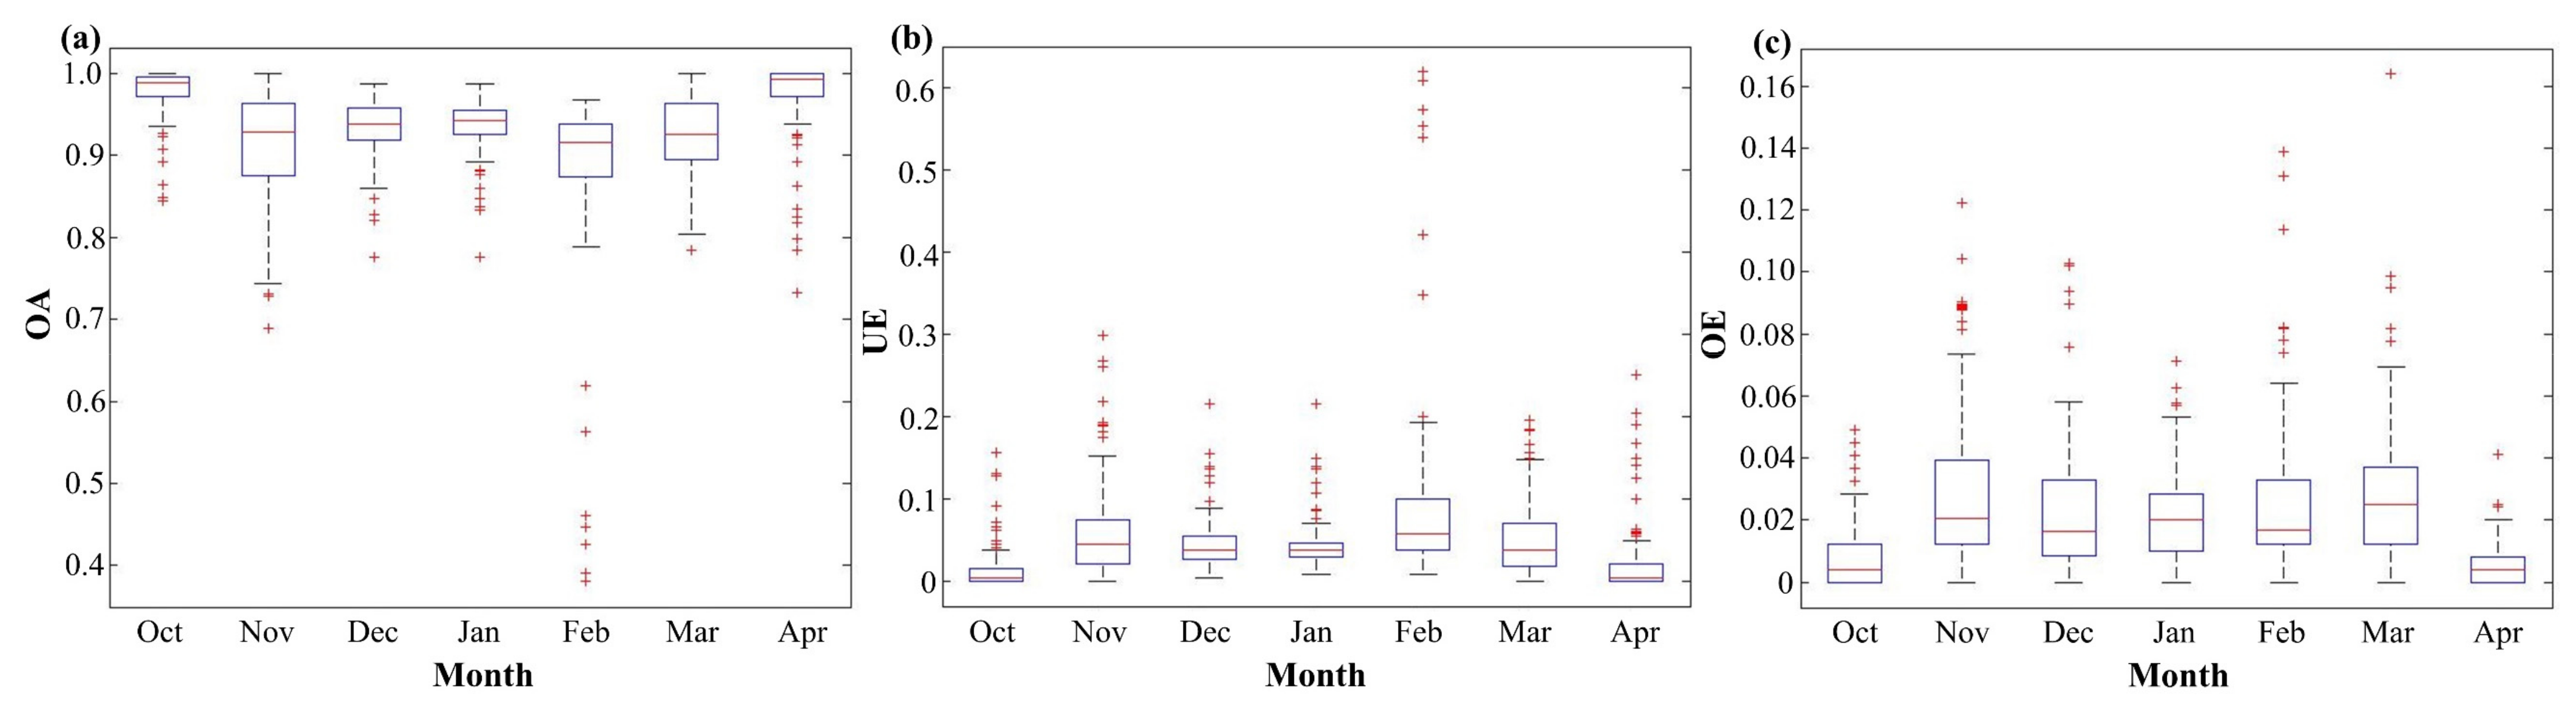
4.1. Validation of the Daily Cloud-Free MODIS Snow Products
4.2. Spatiotemporal Variations and Trends in Snow Phenology
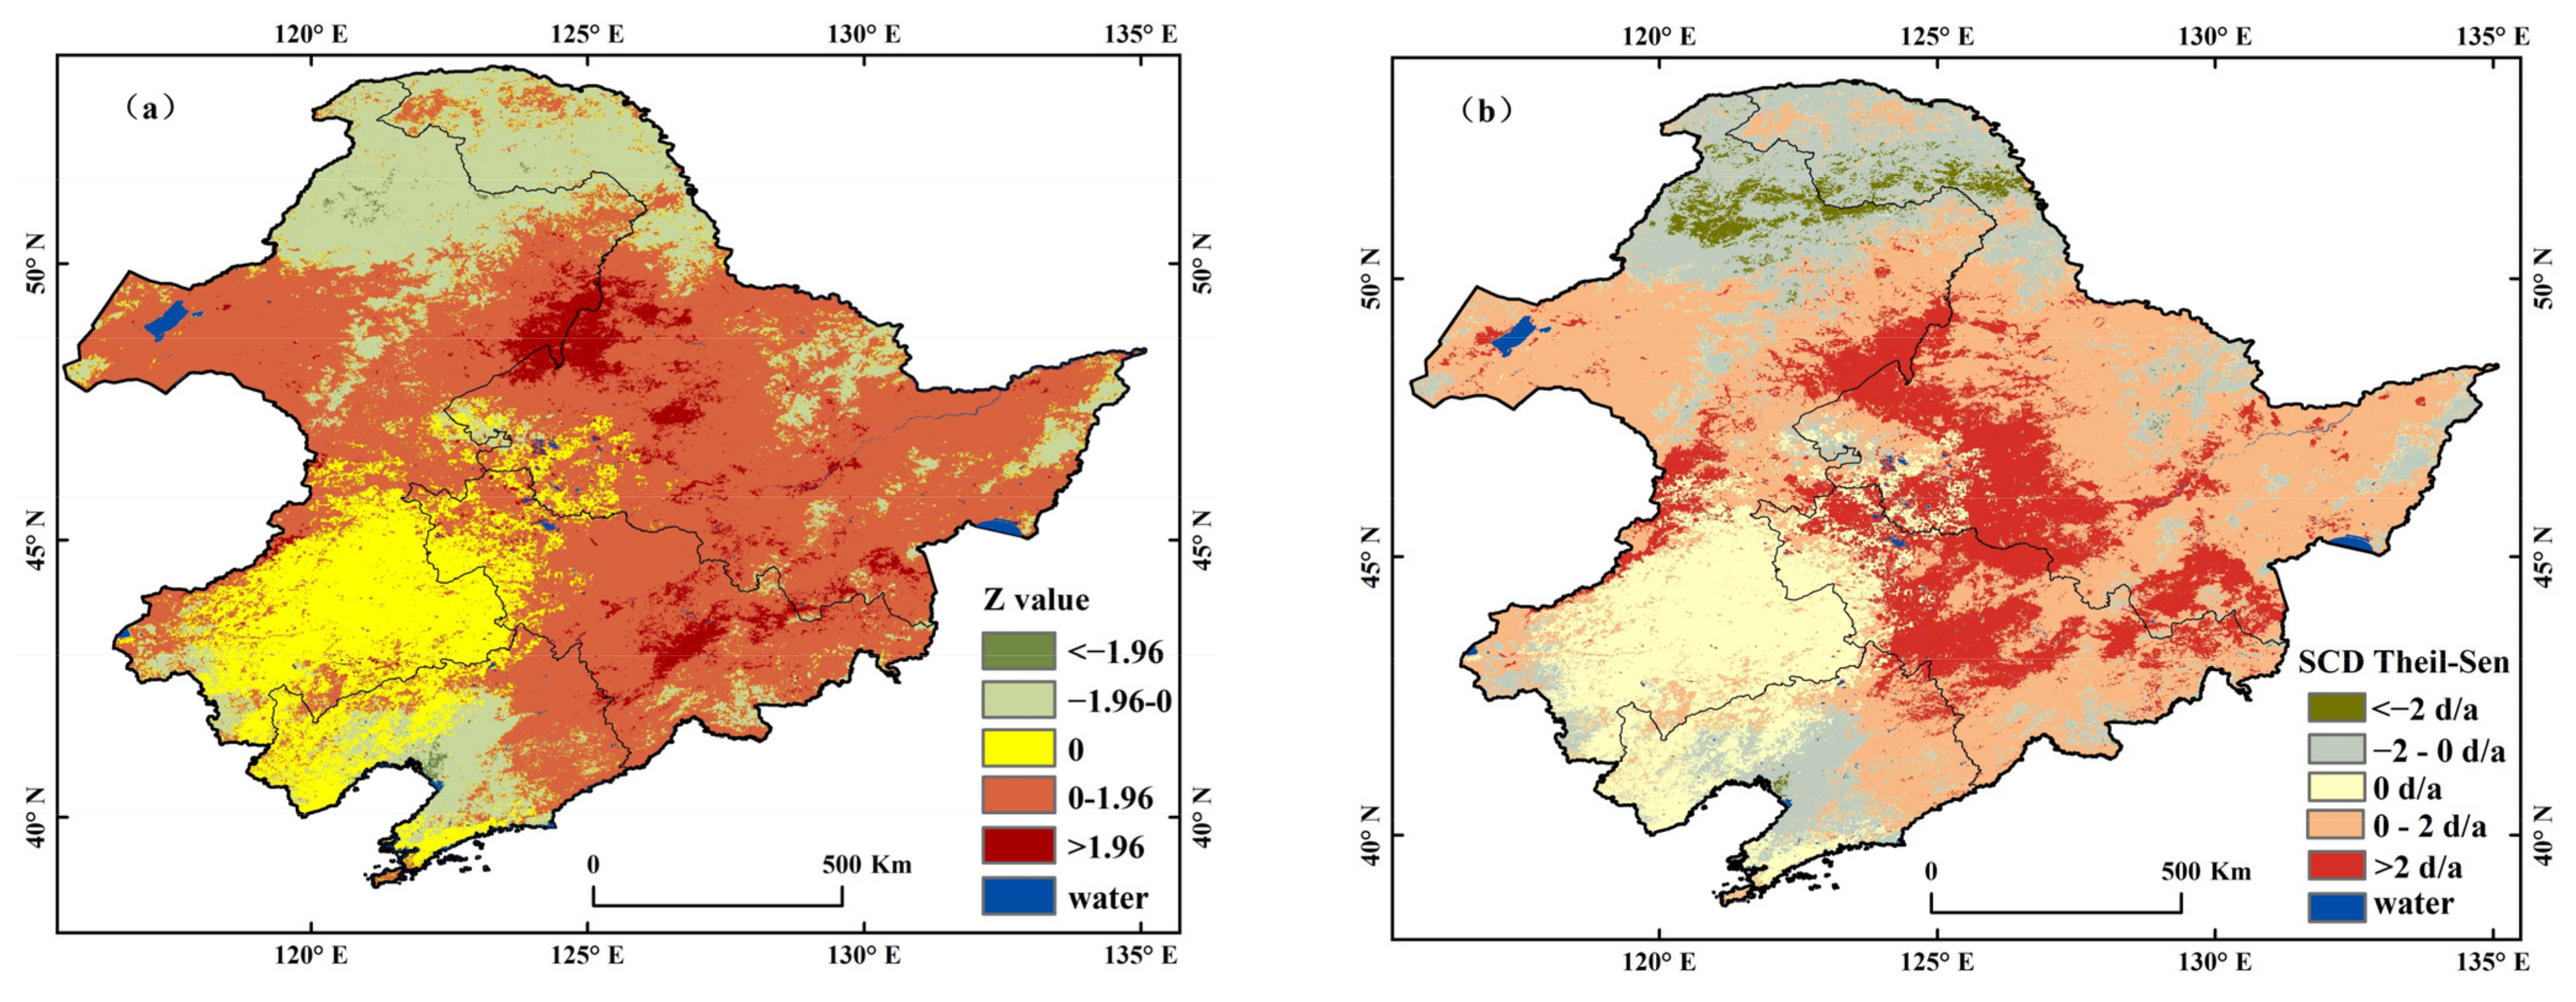
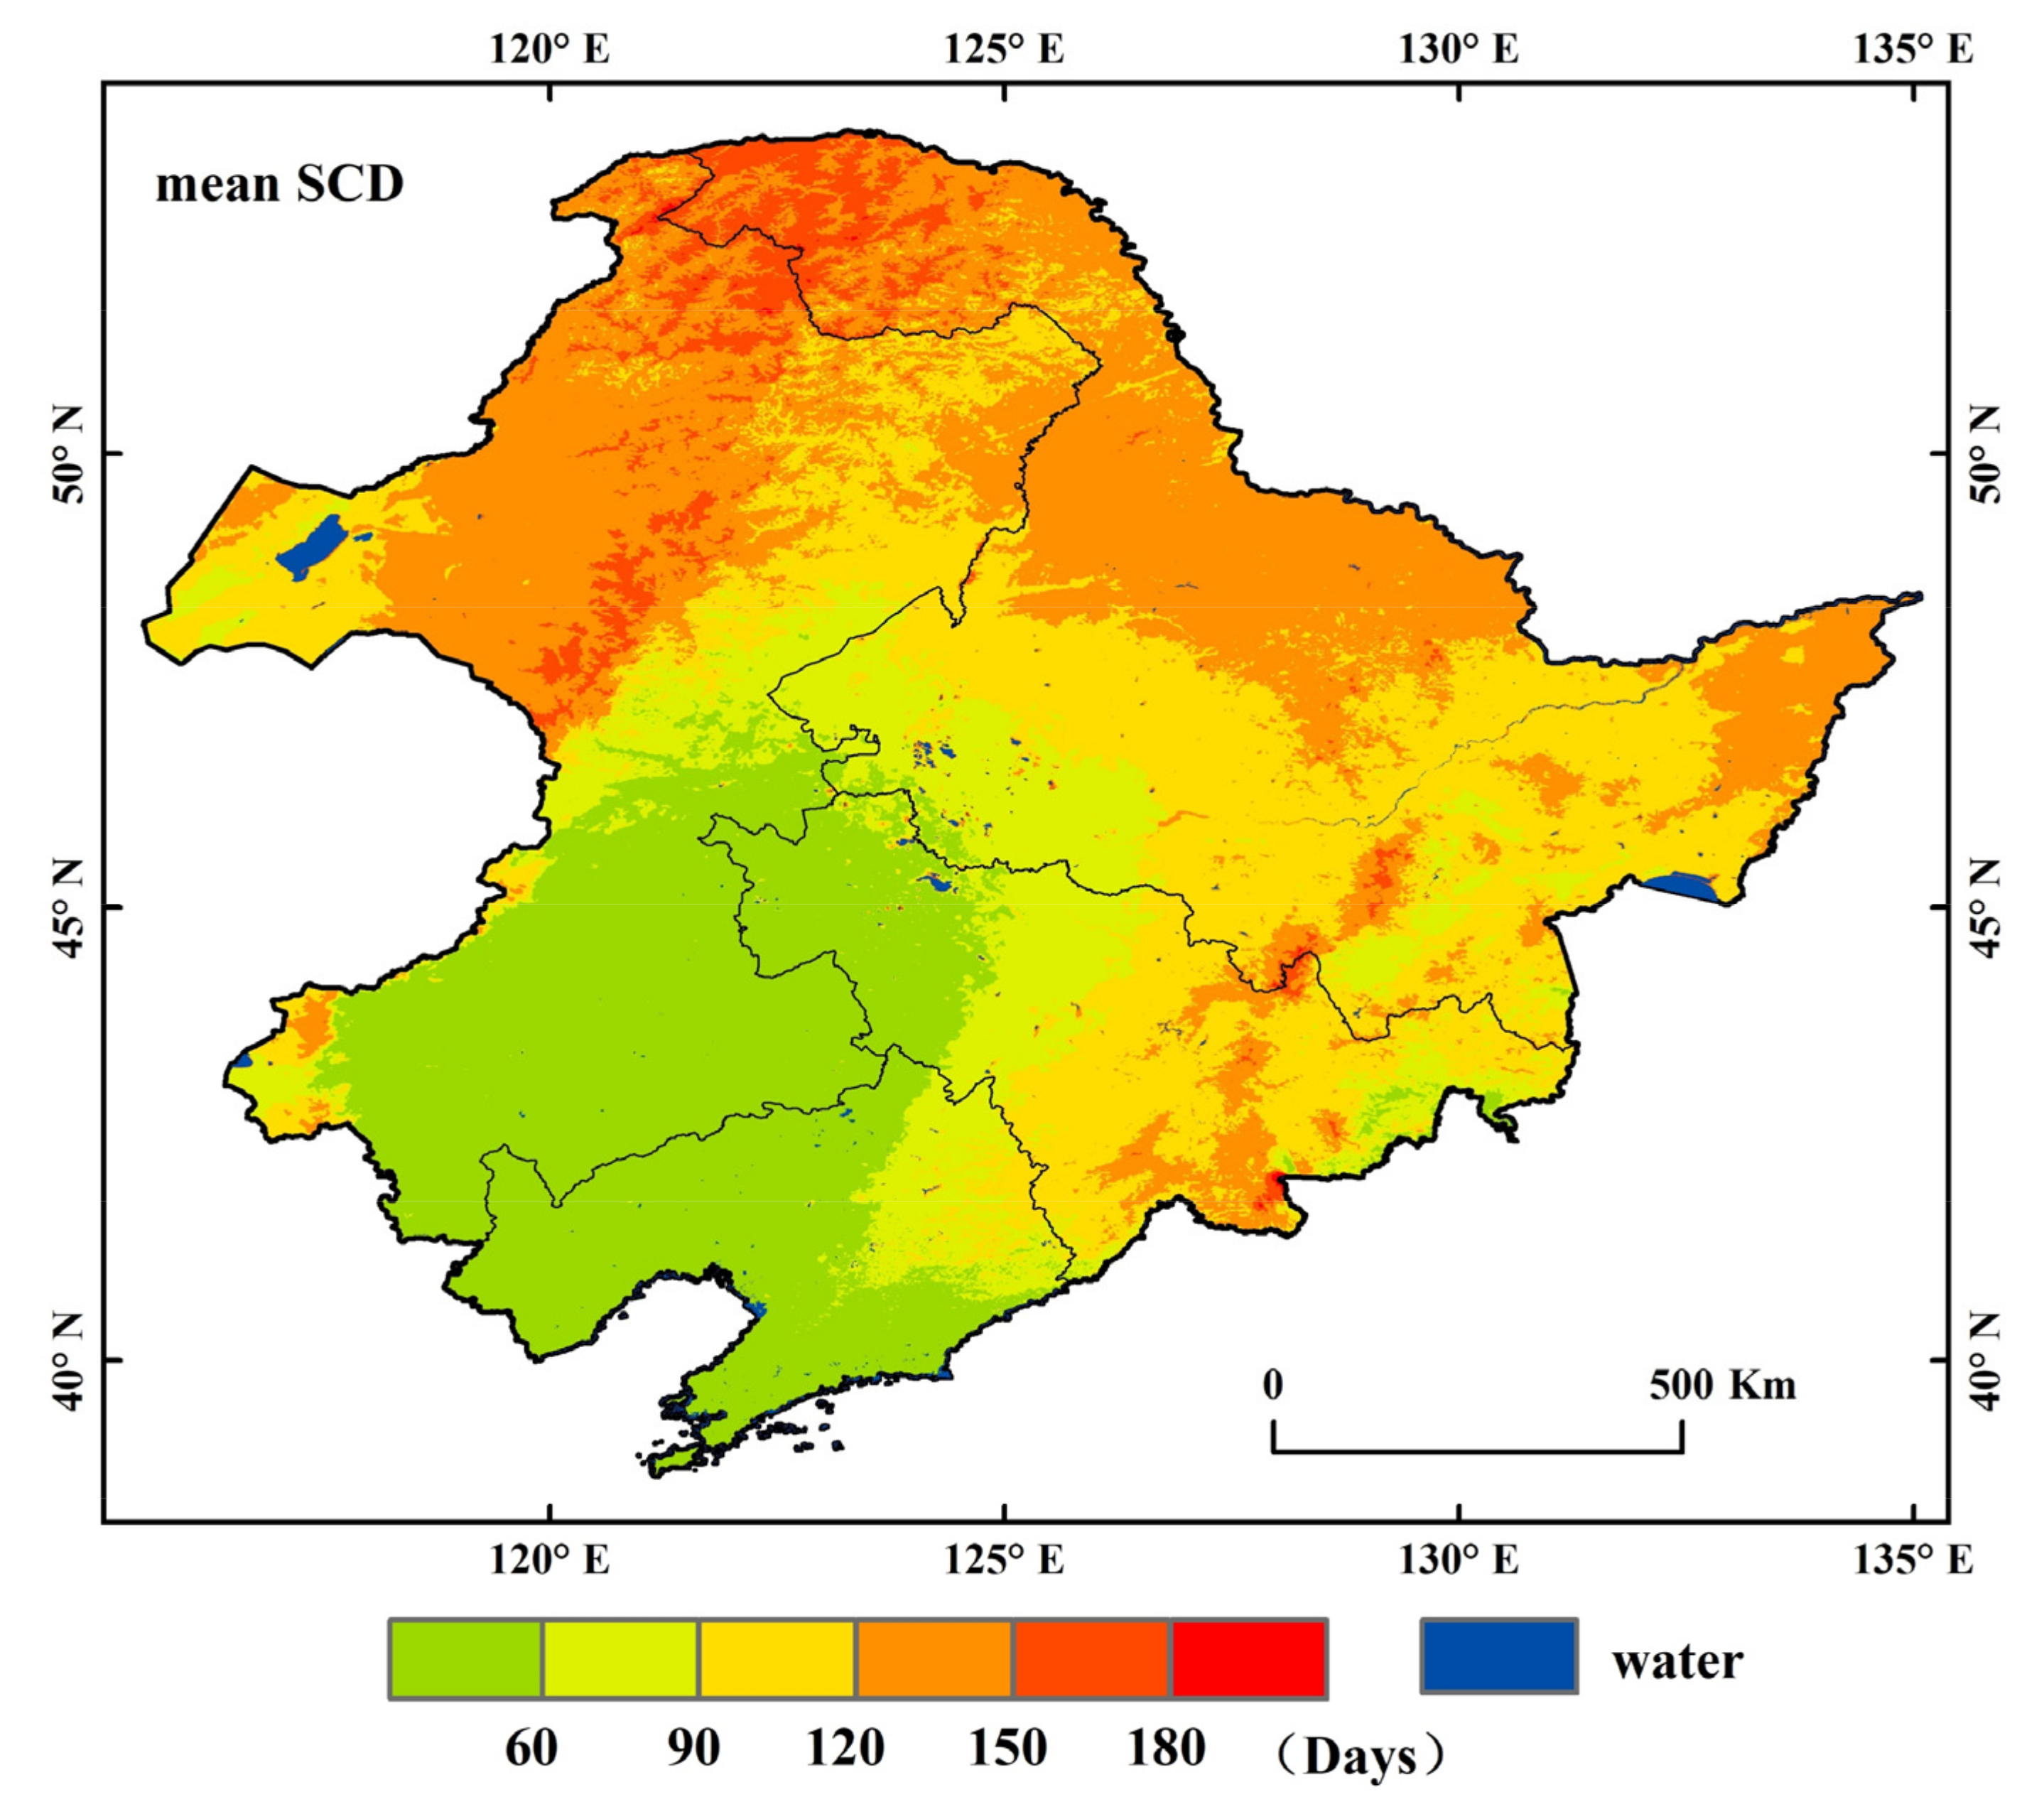
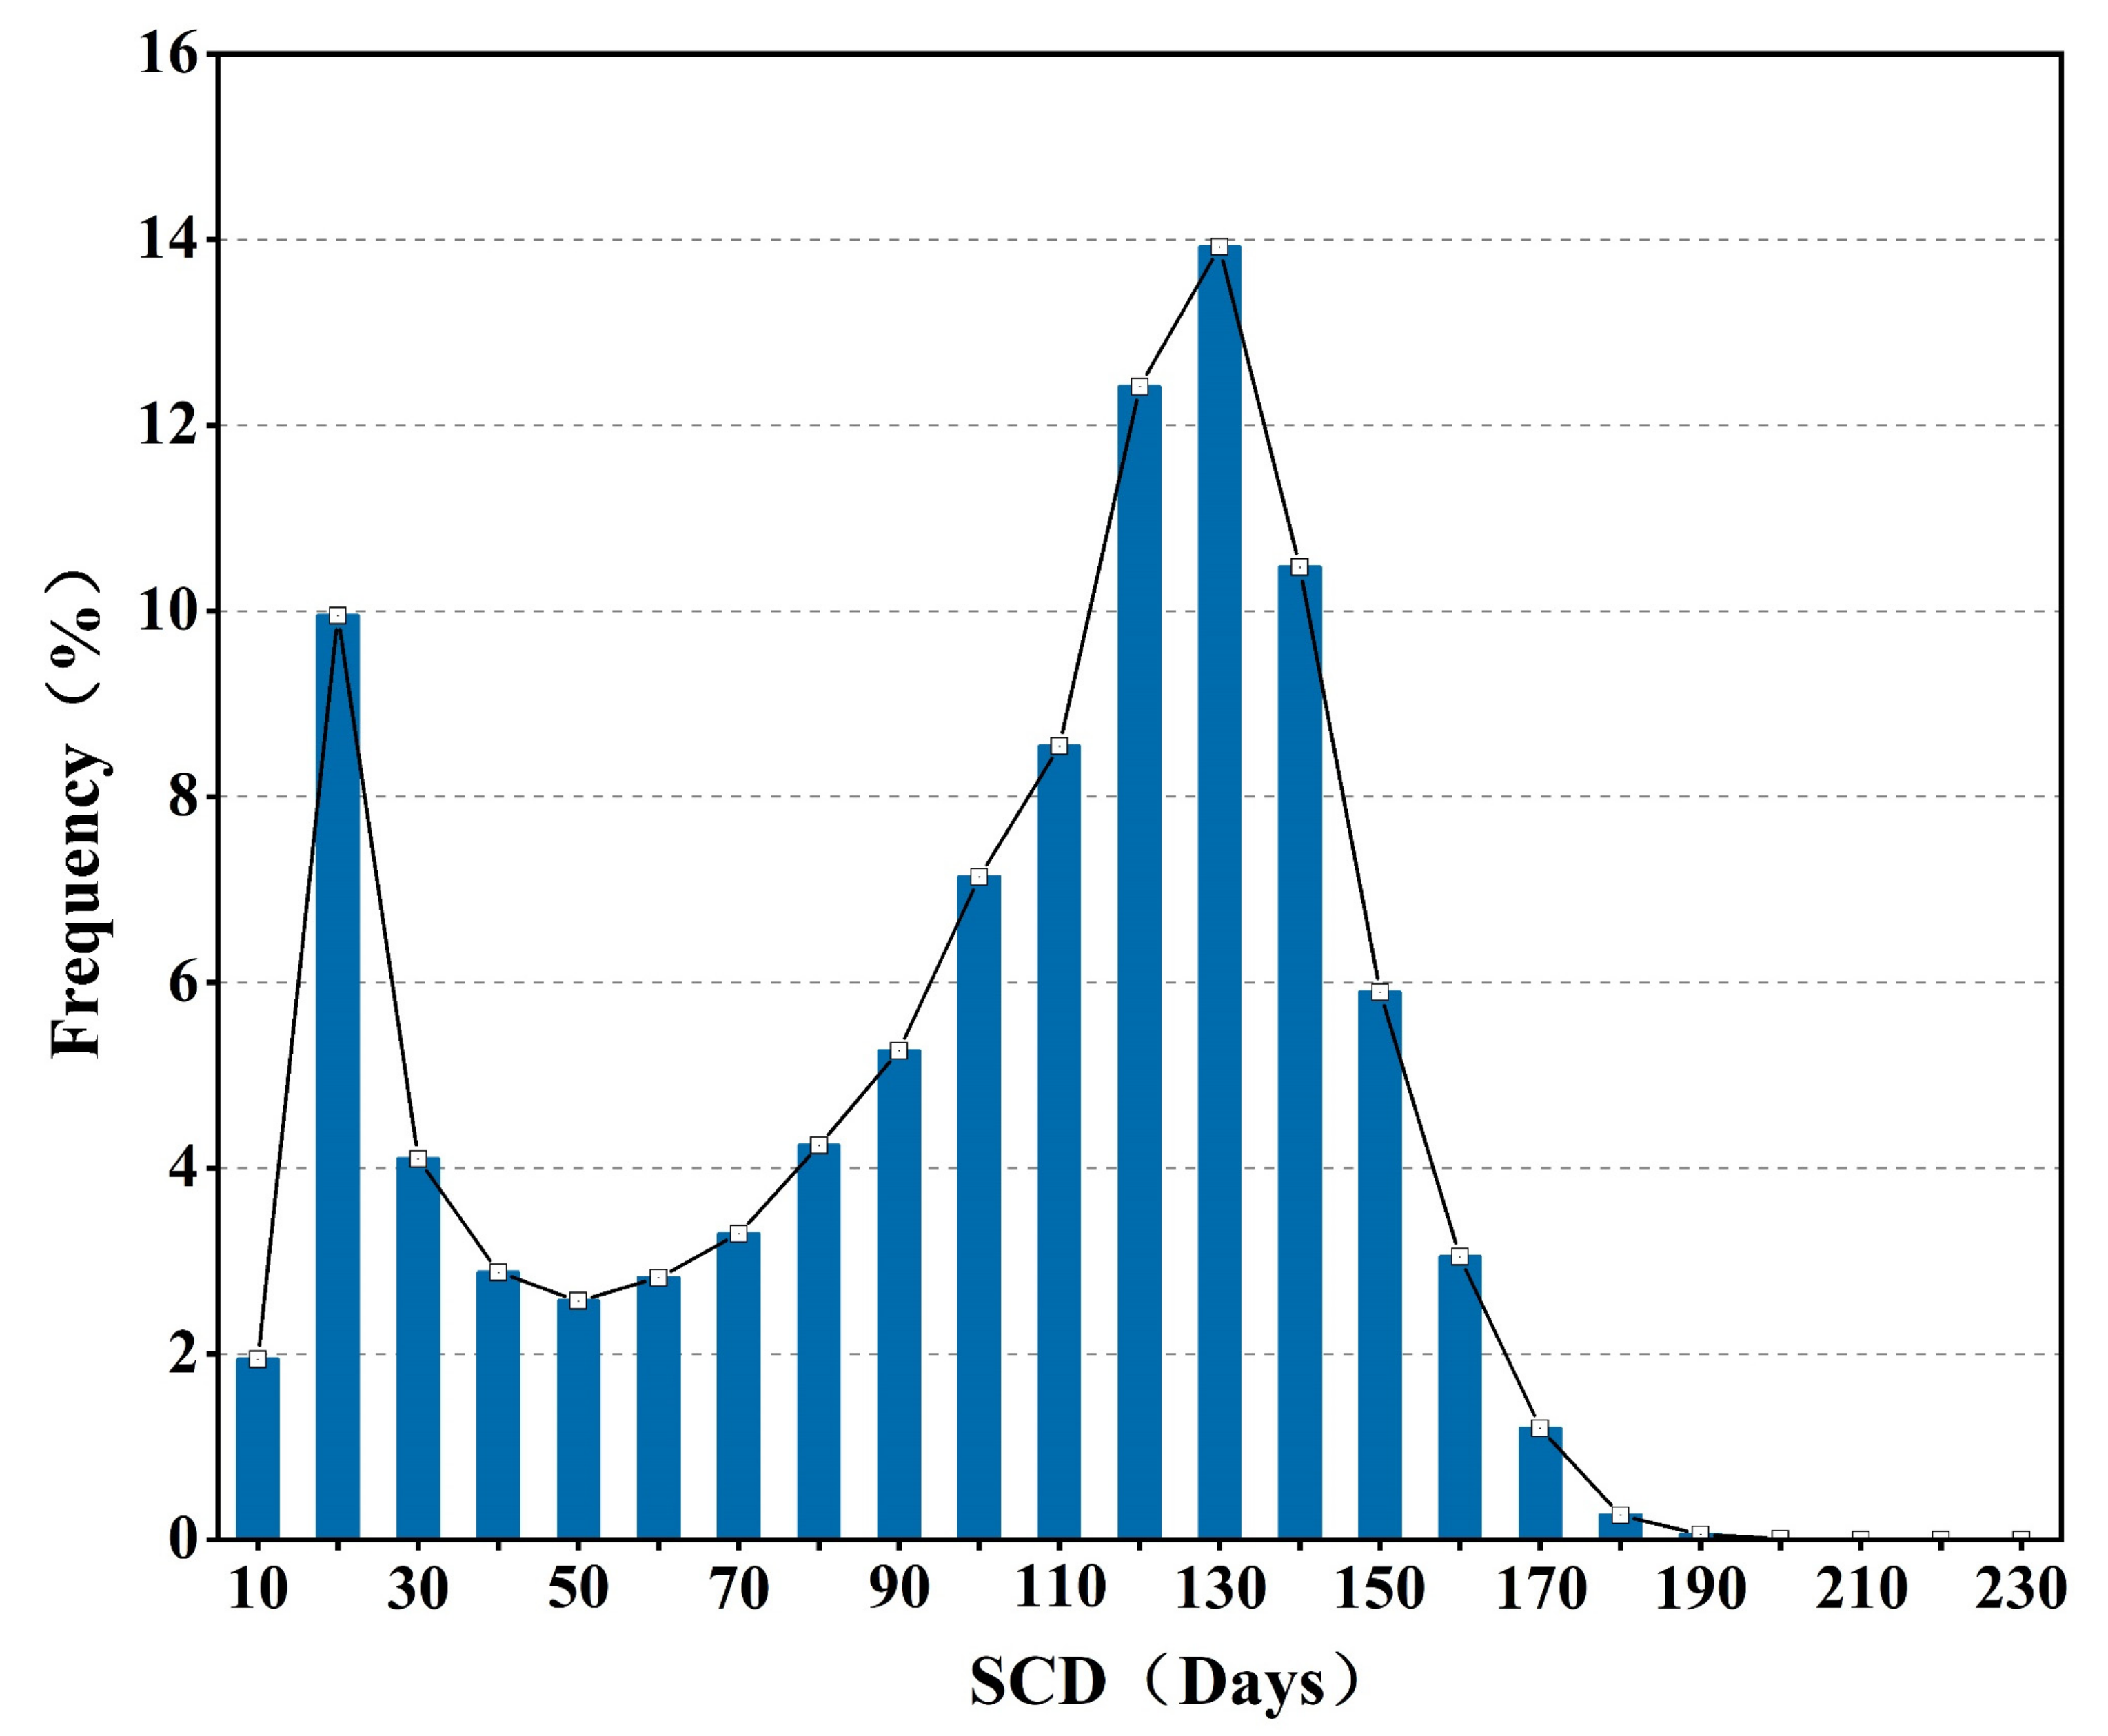
4.2.1. SCD
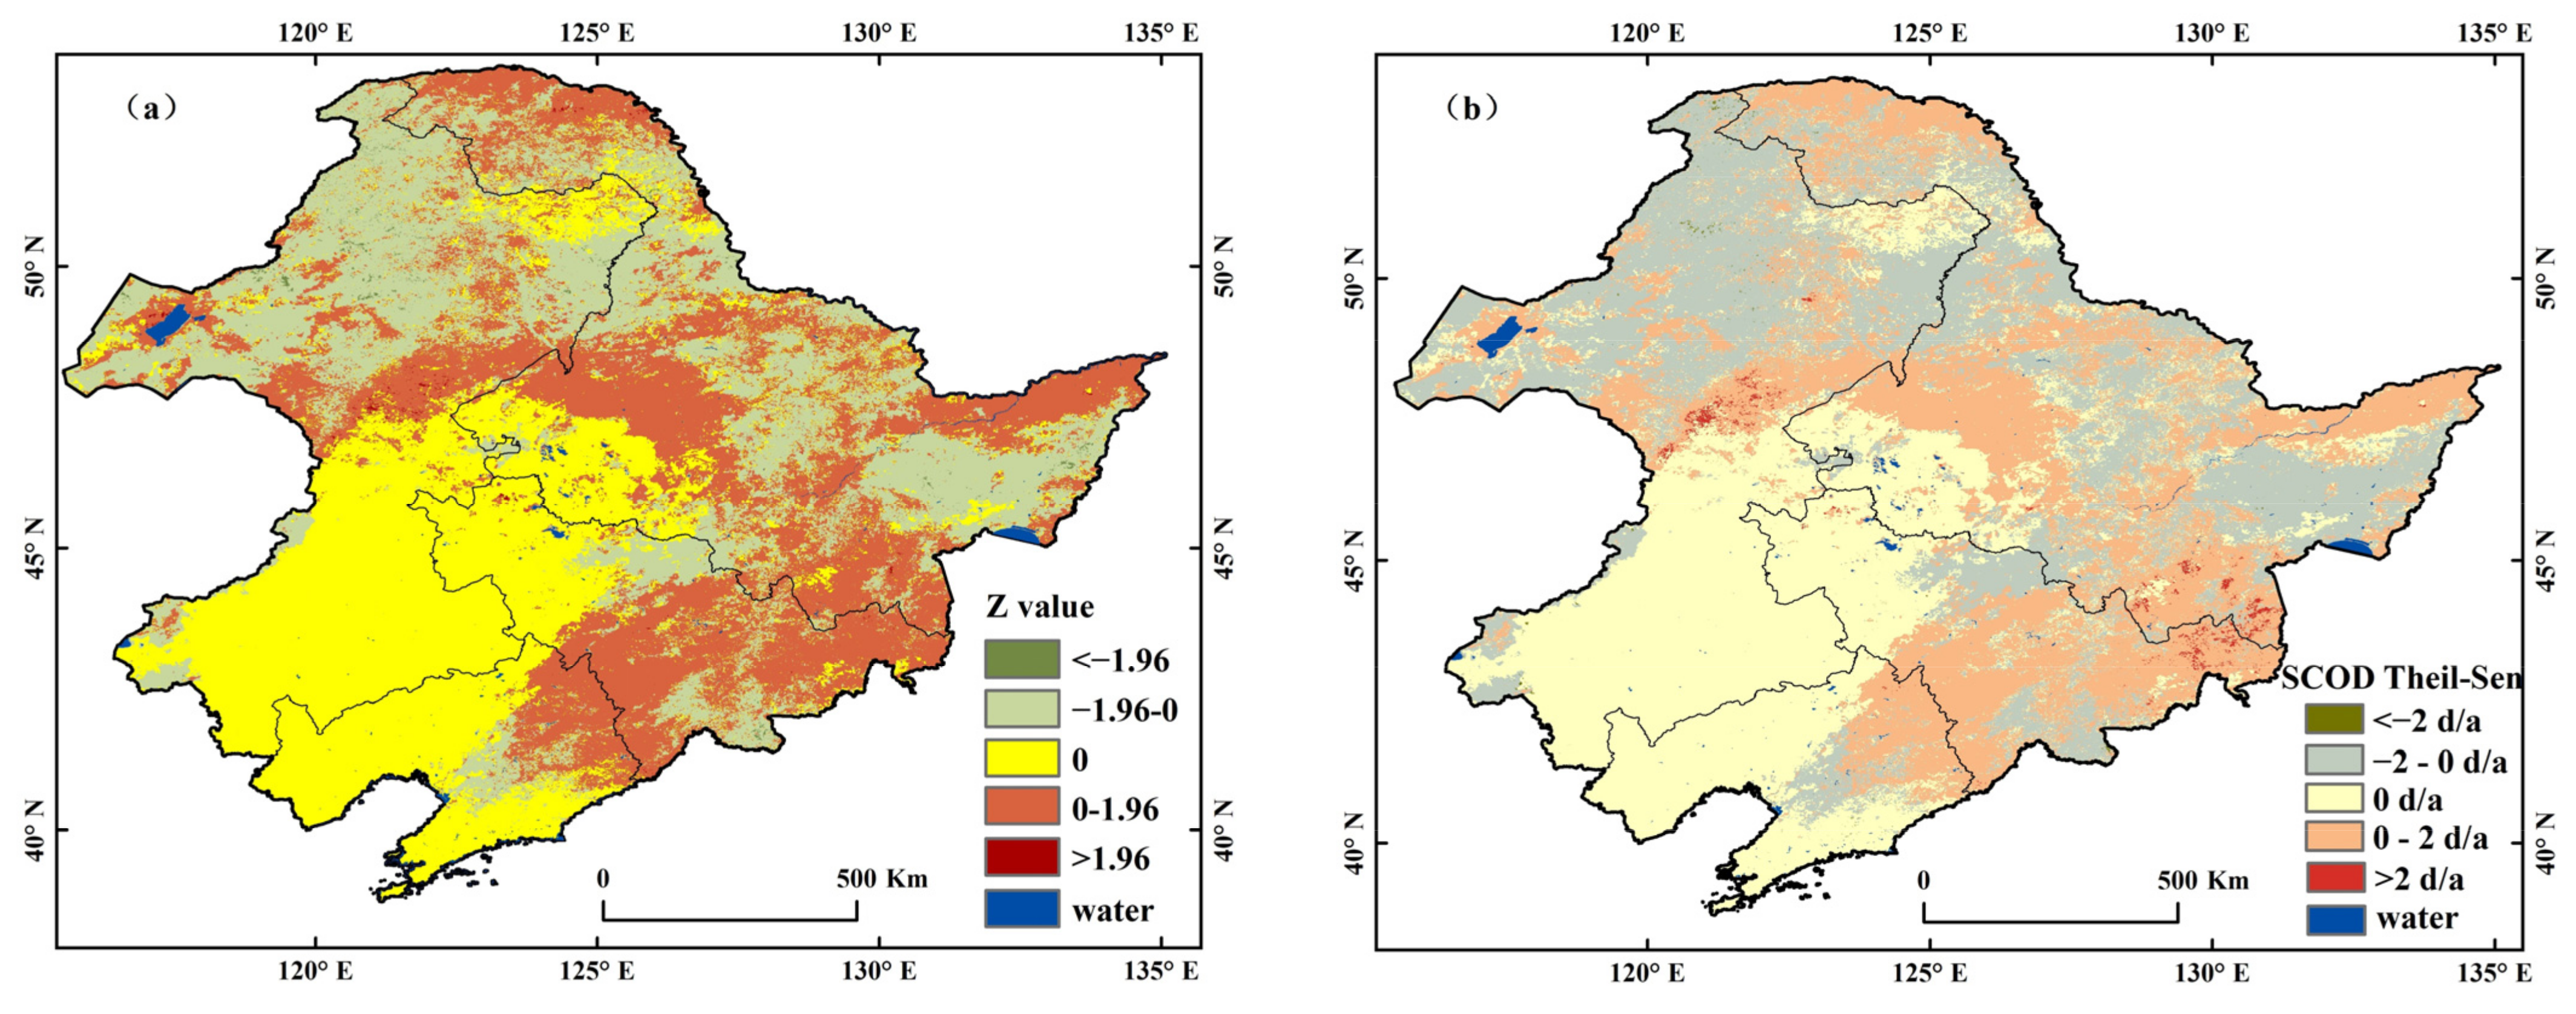
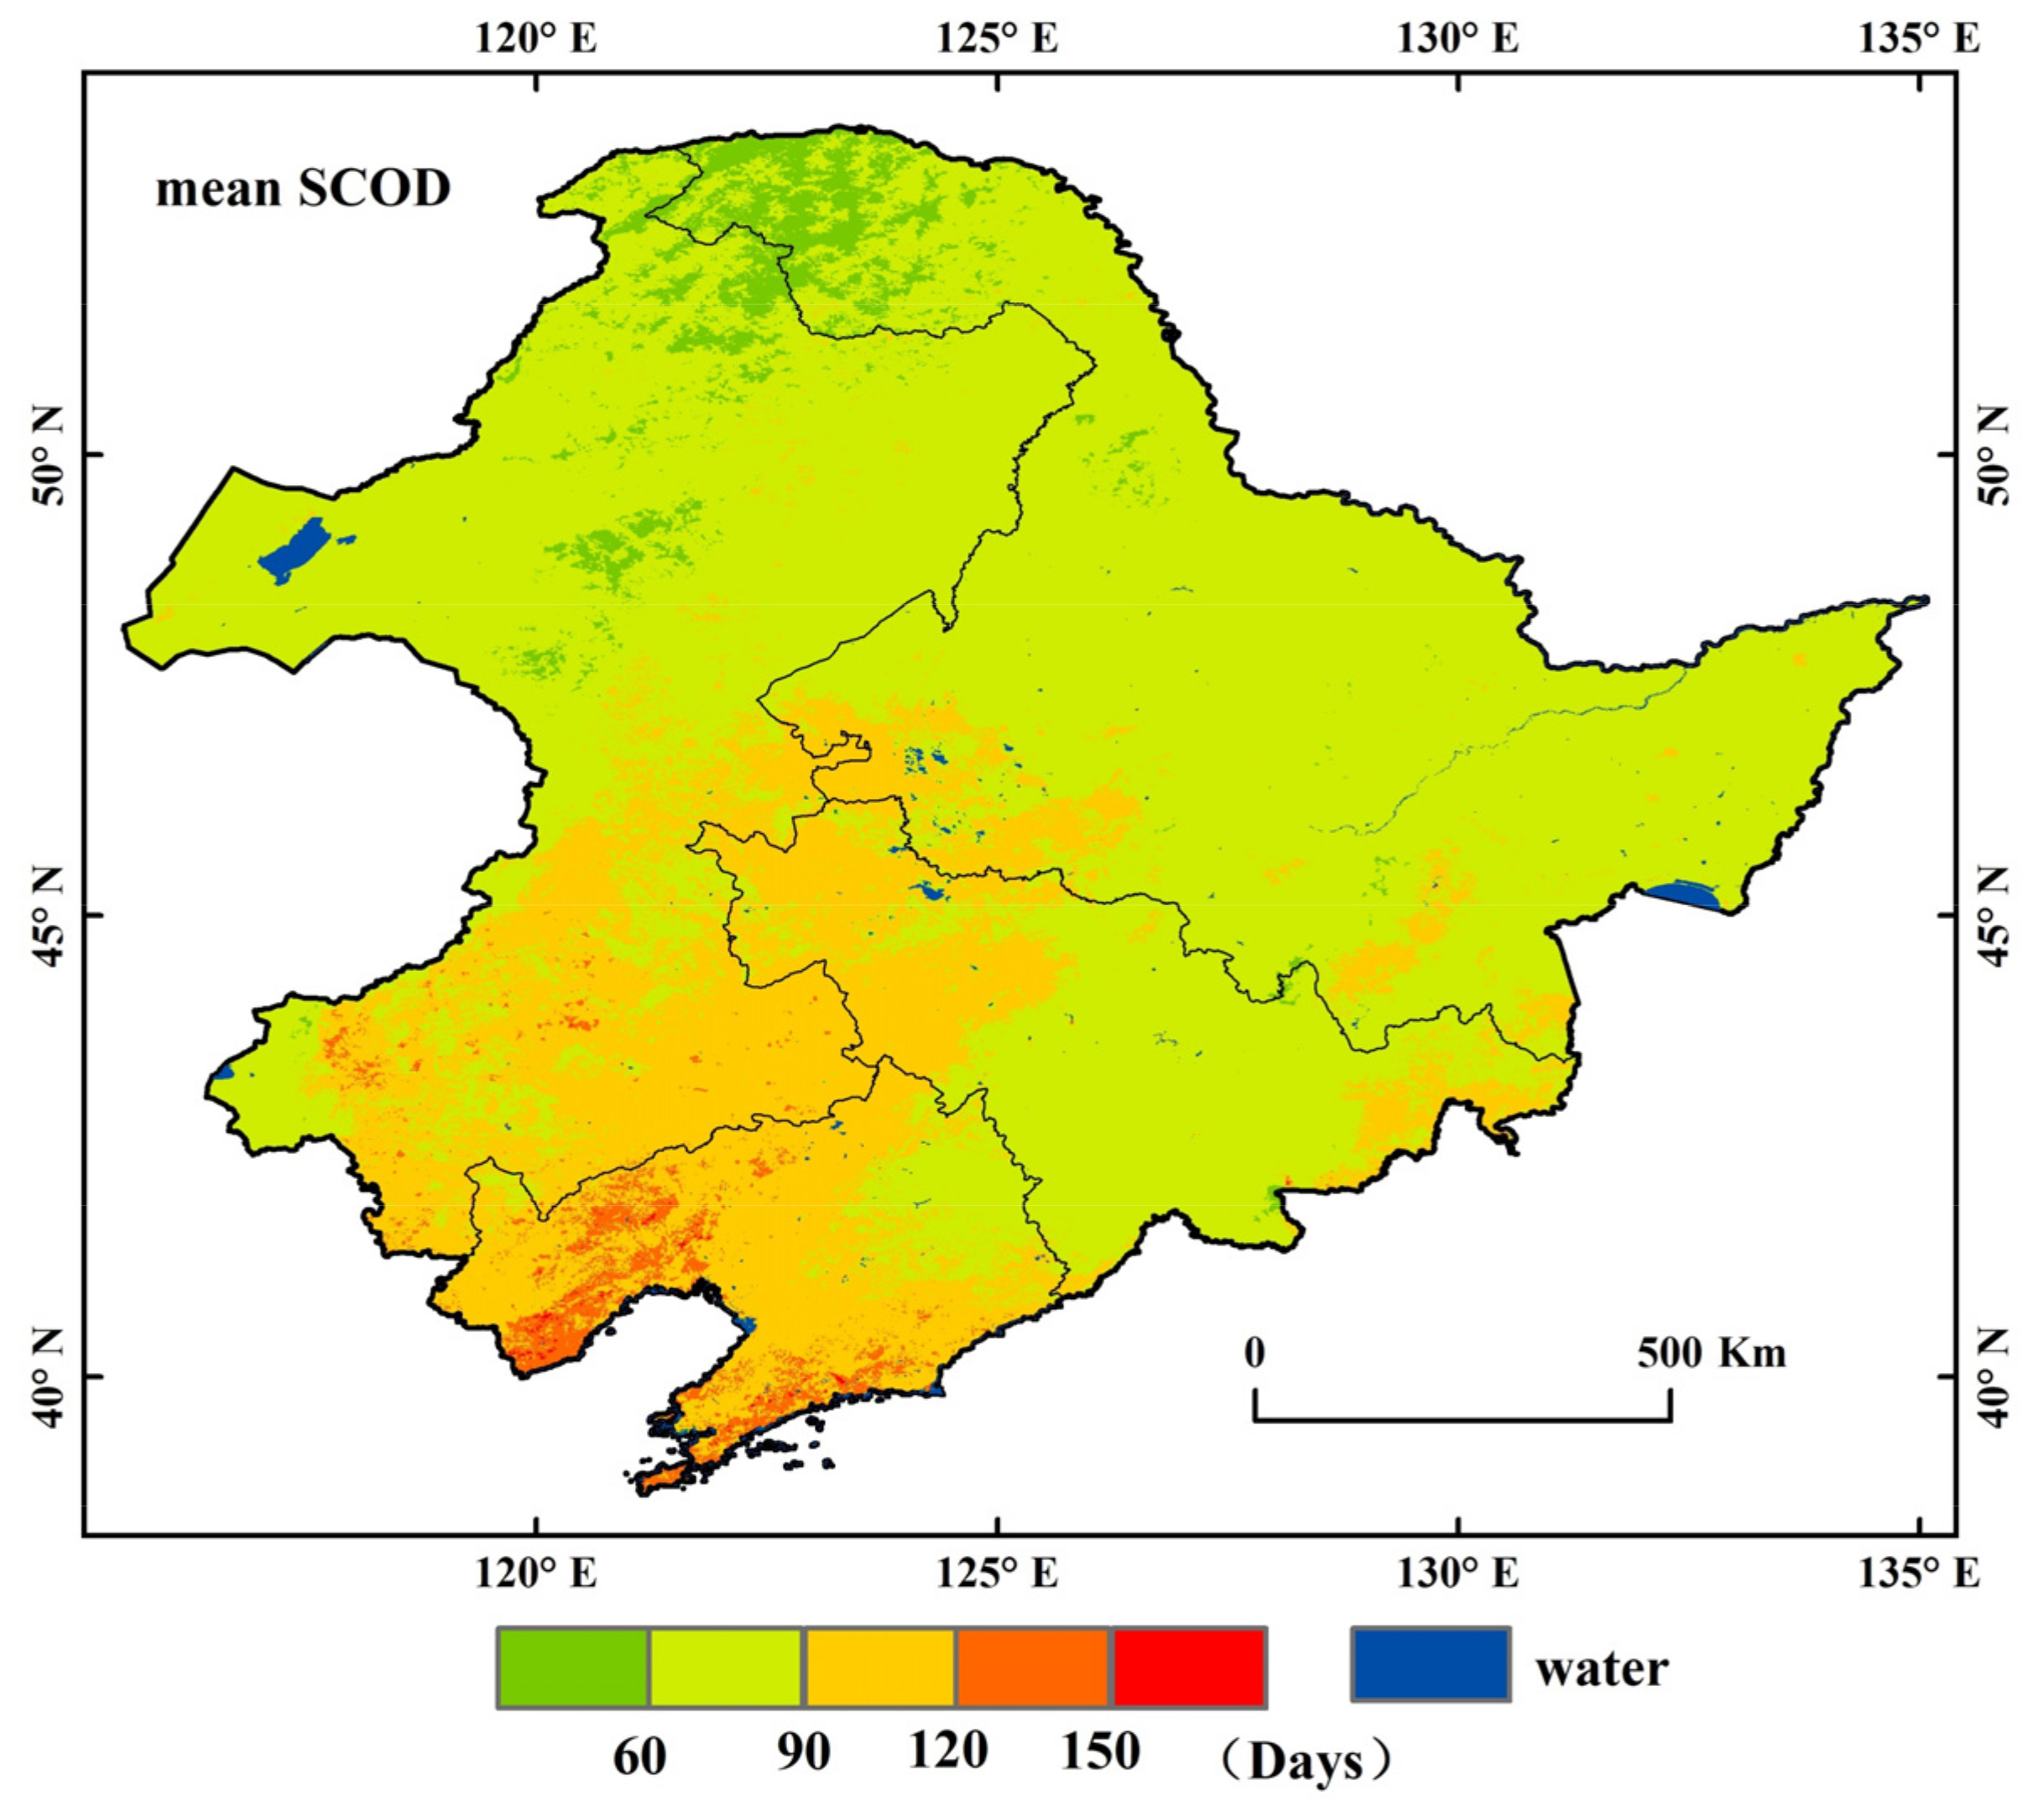
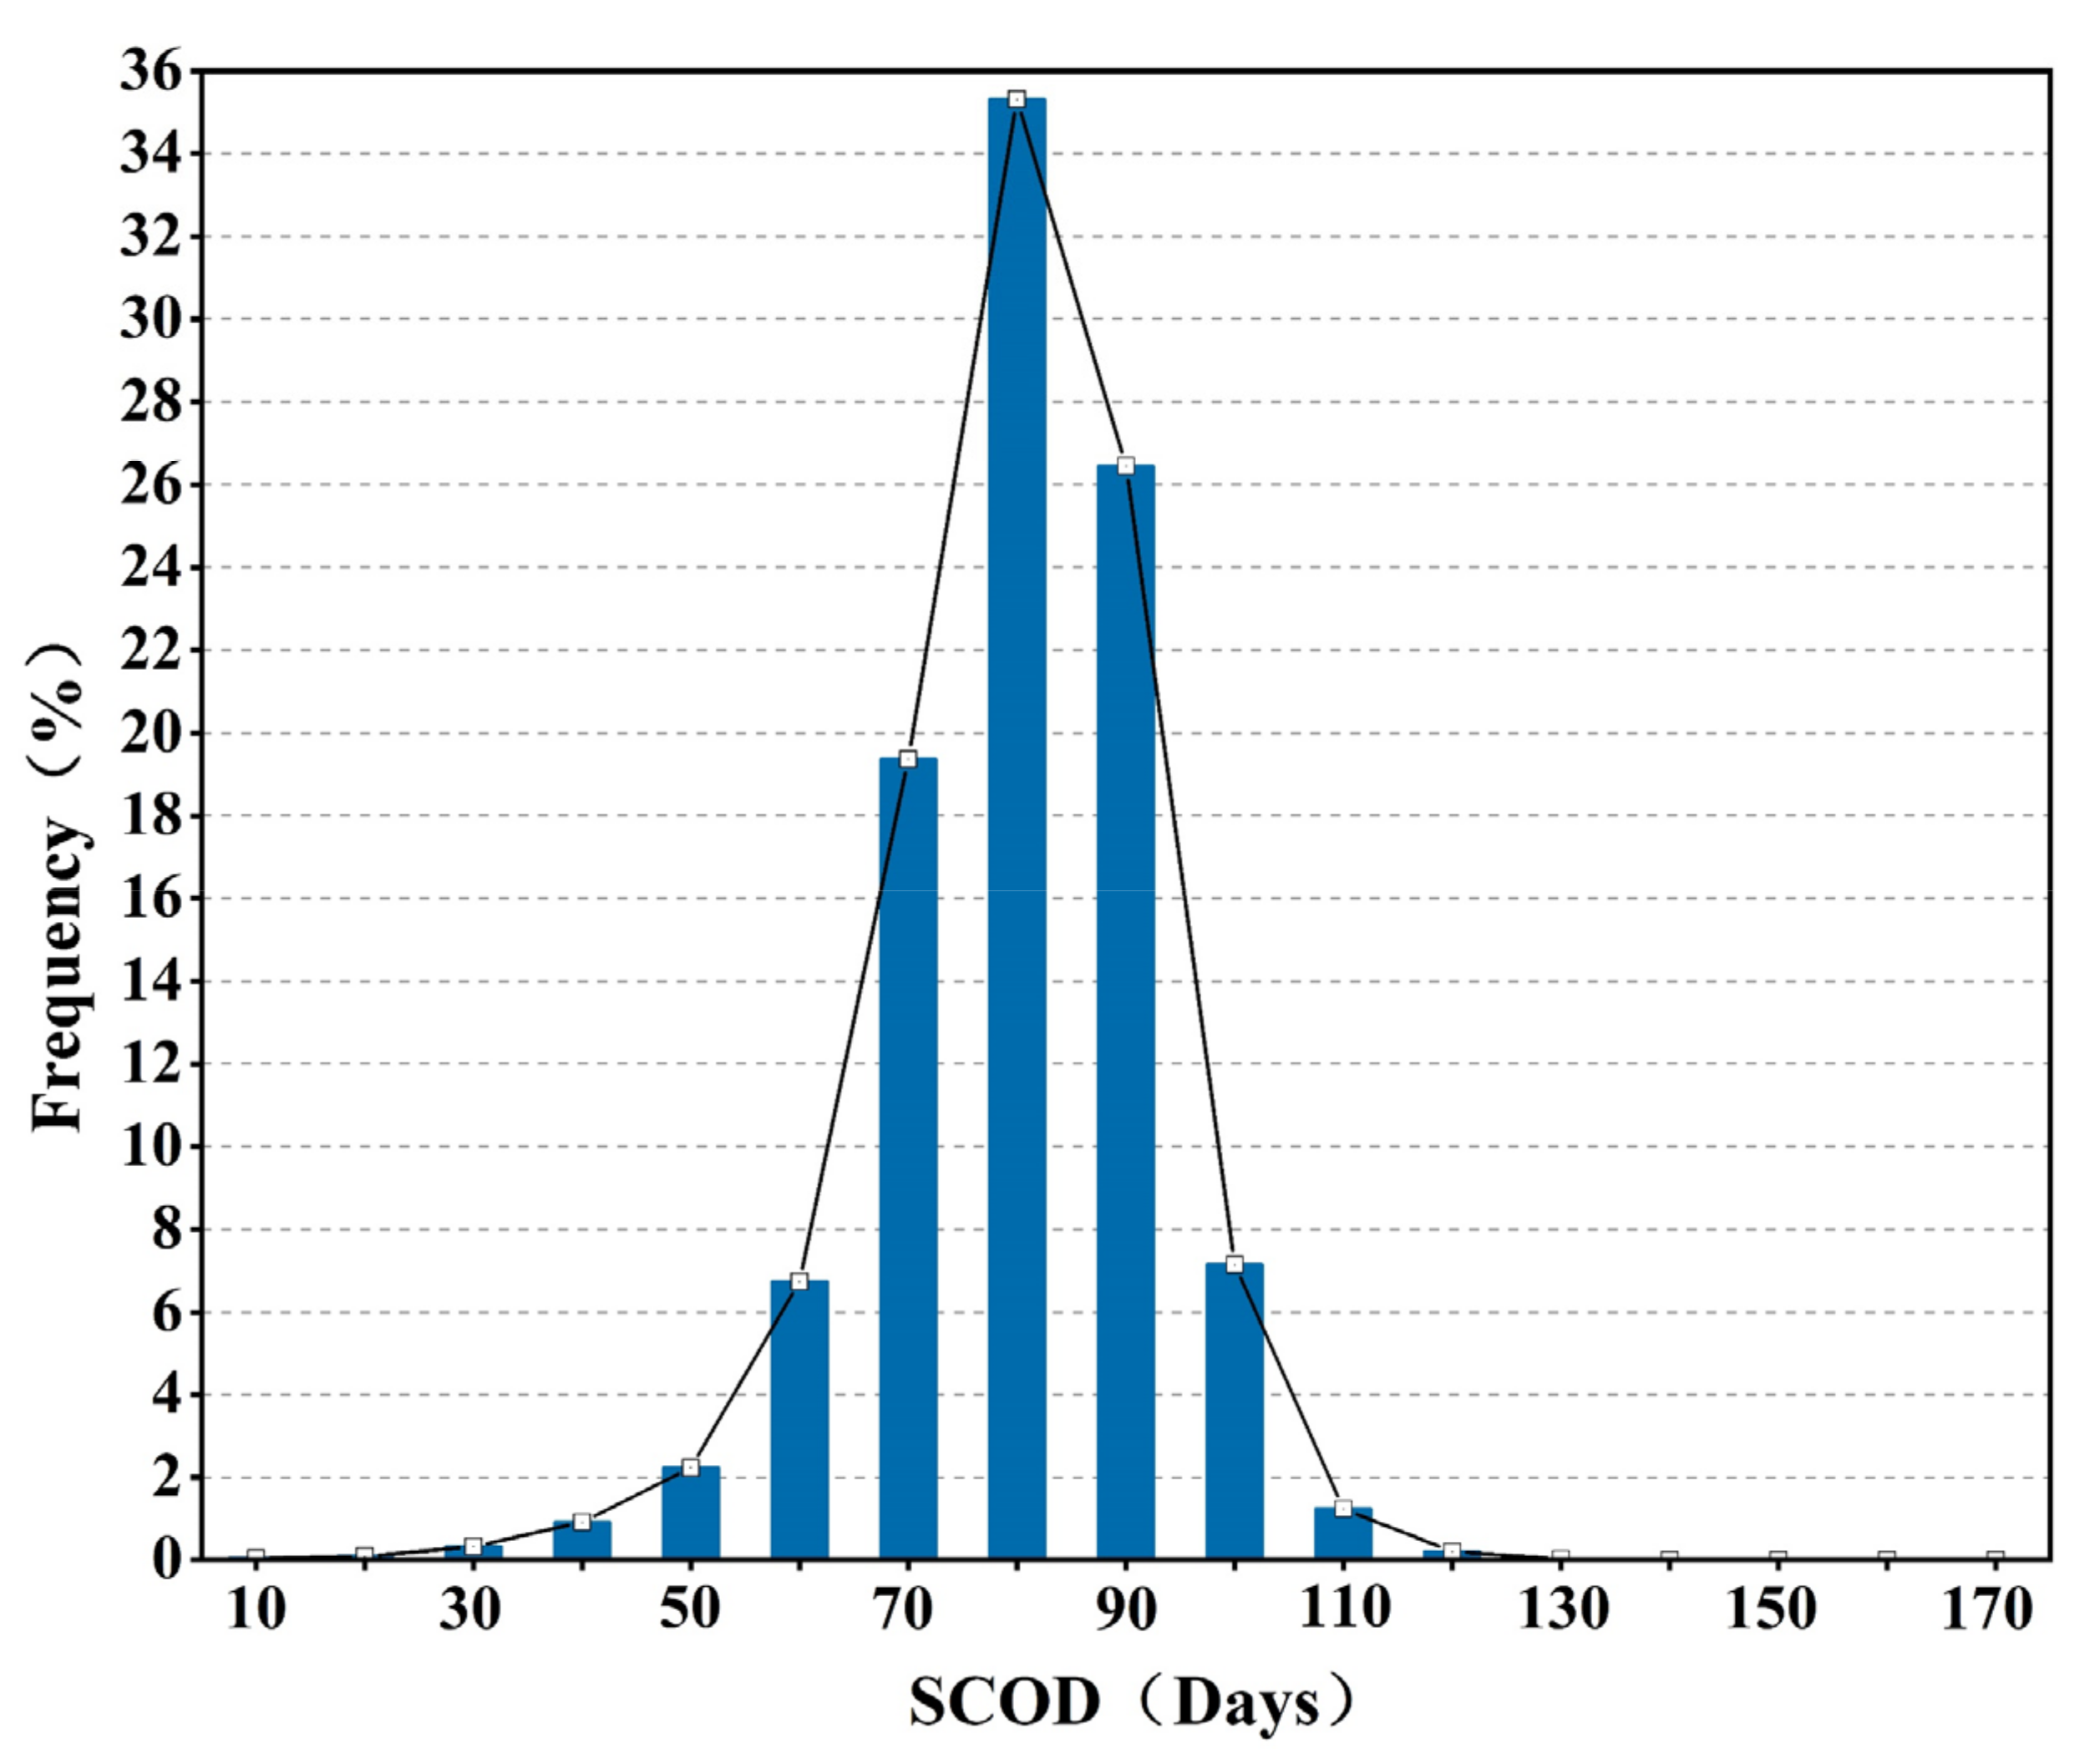
4.2.2. SCOD
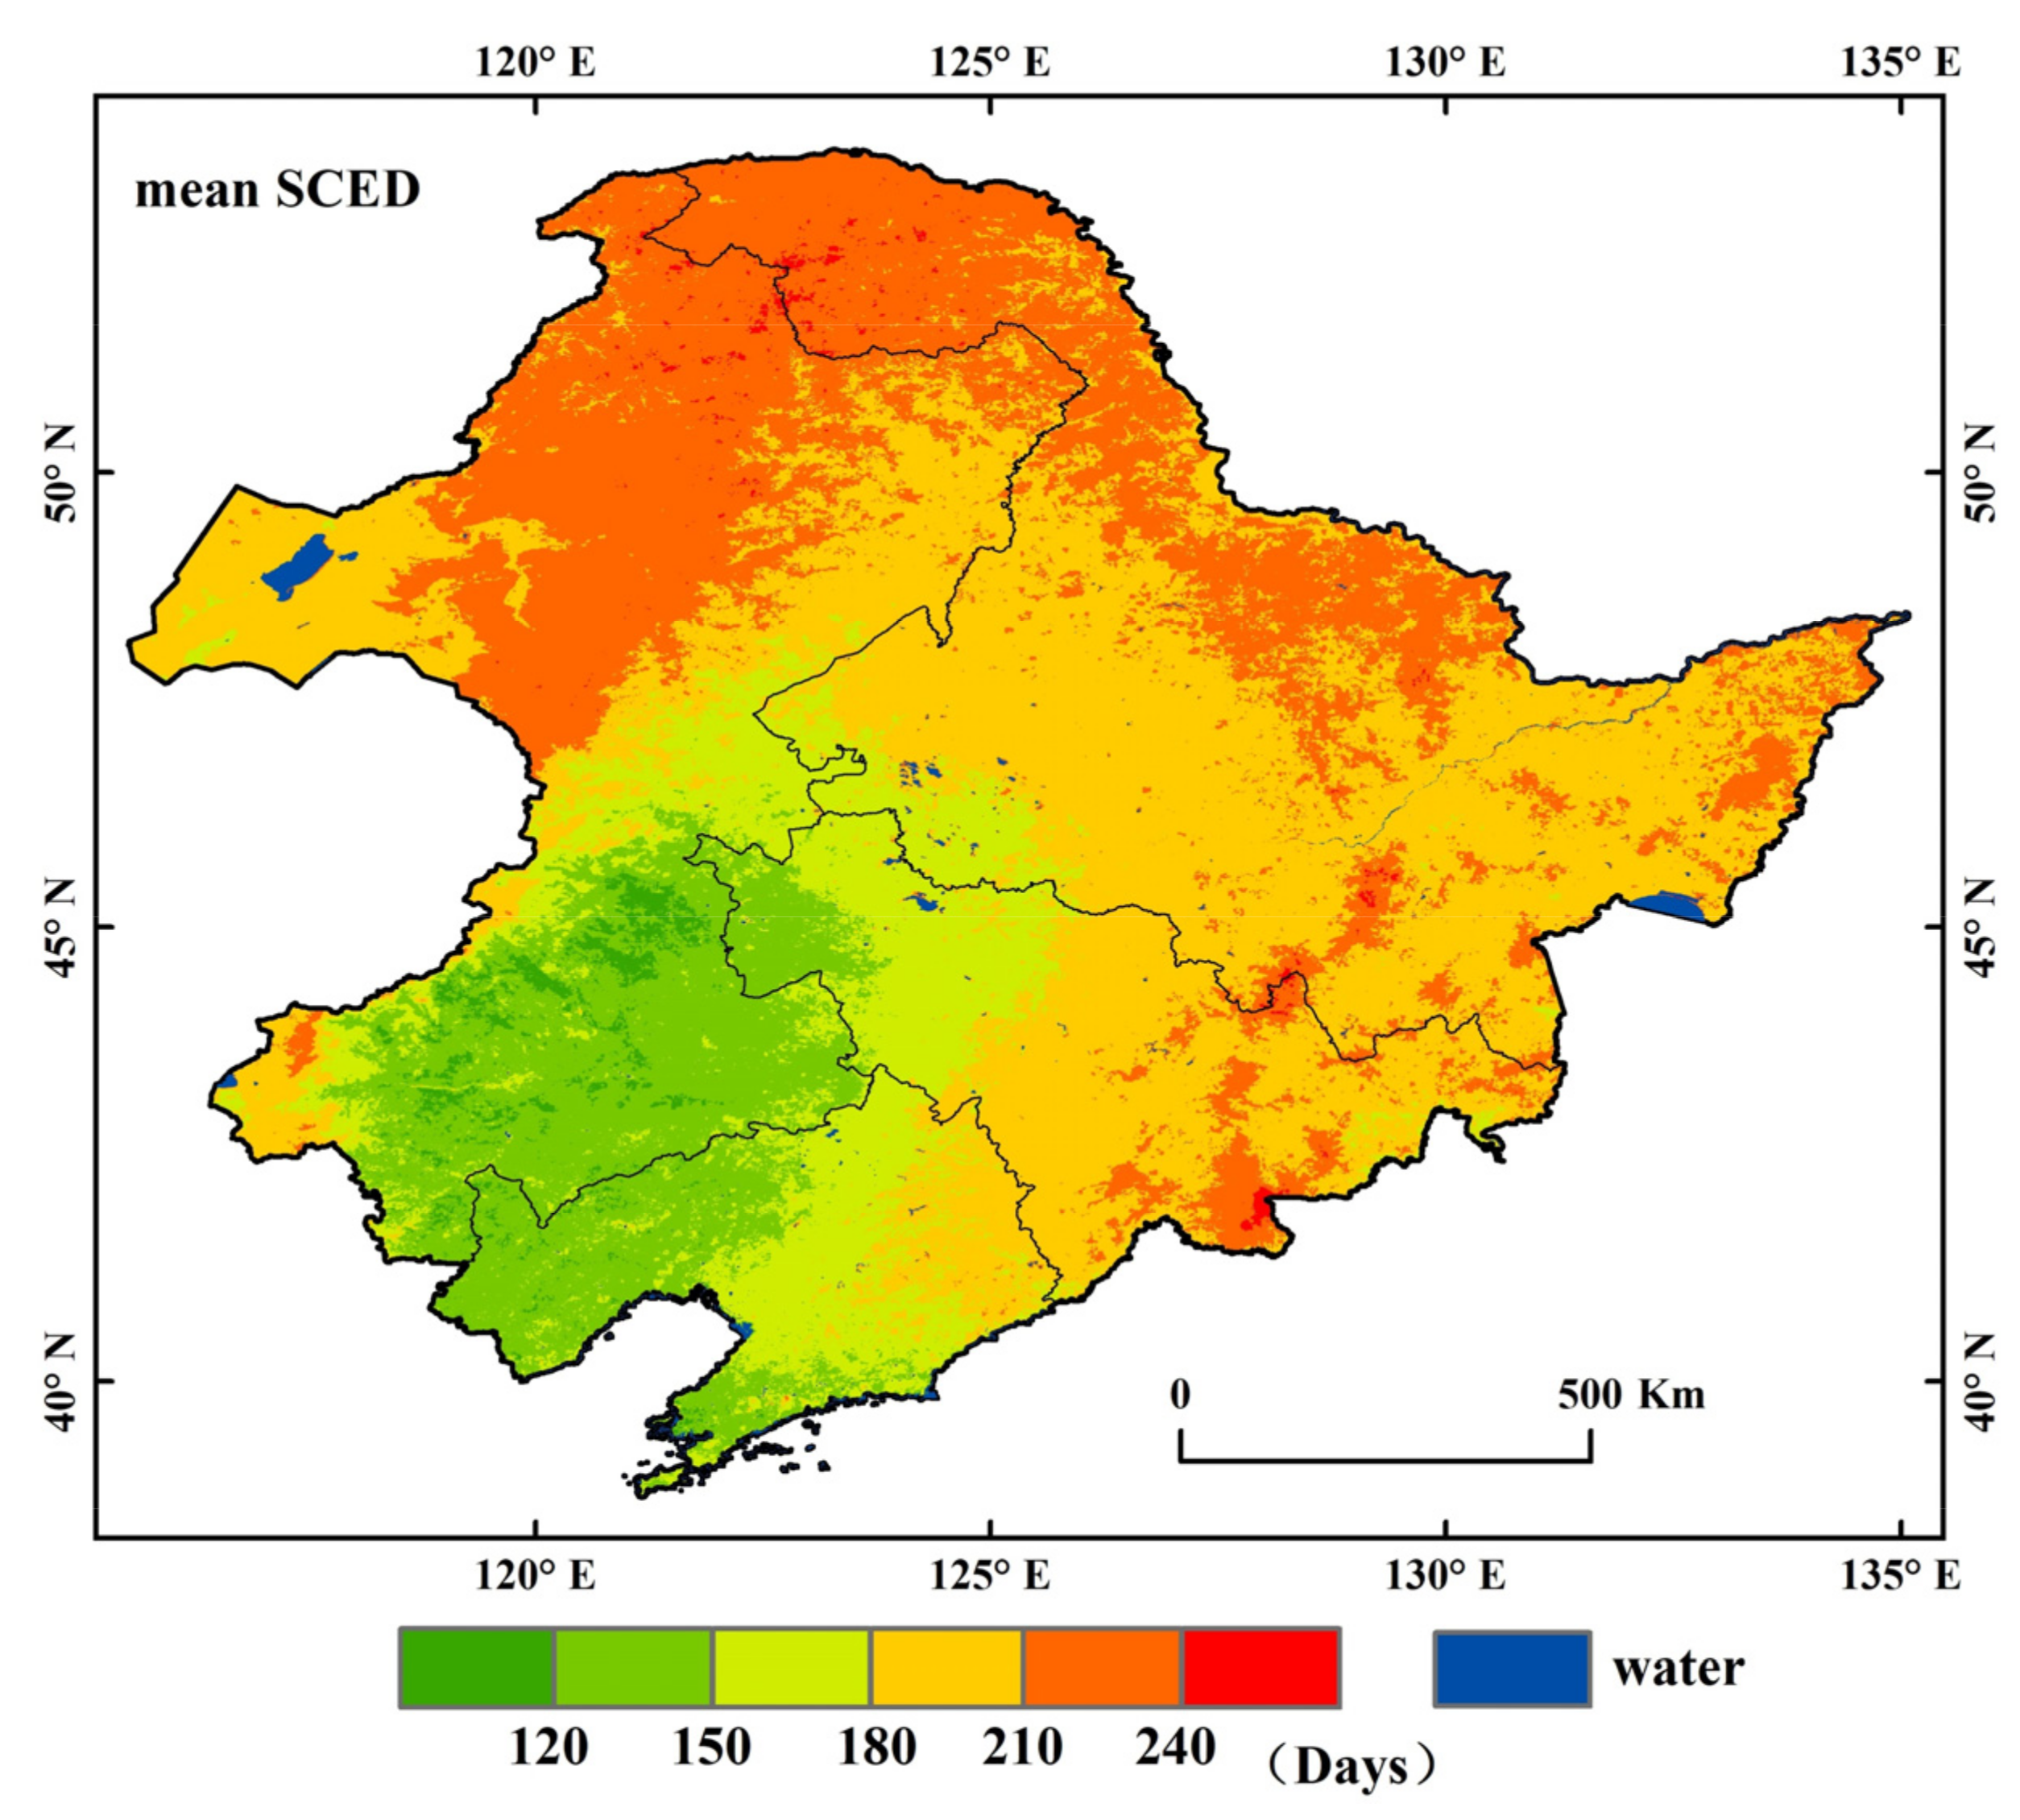
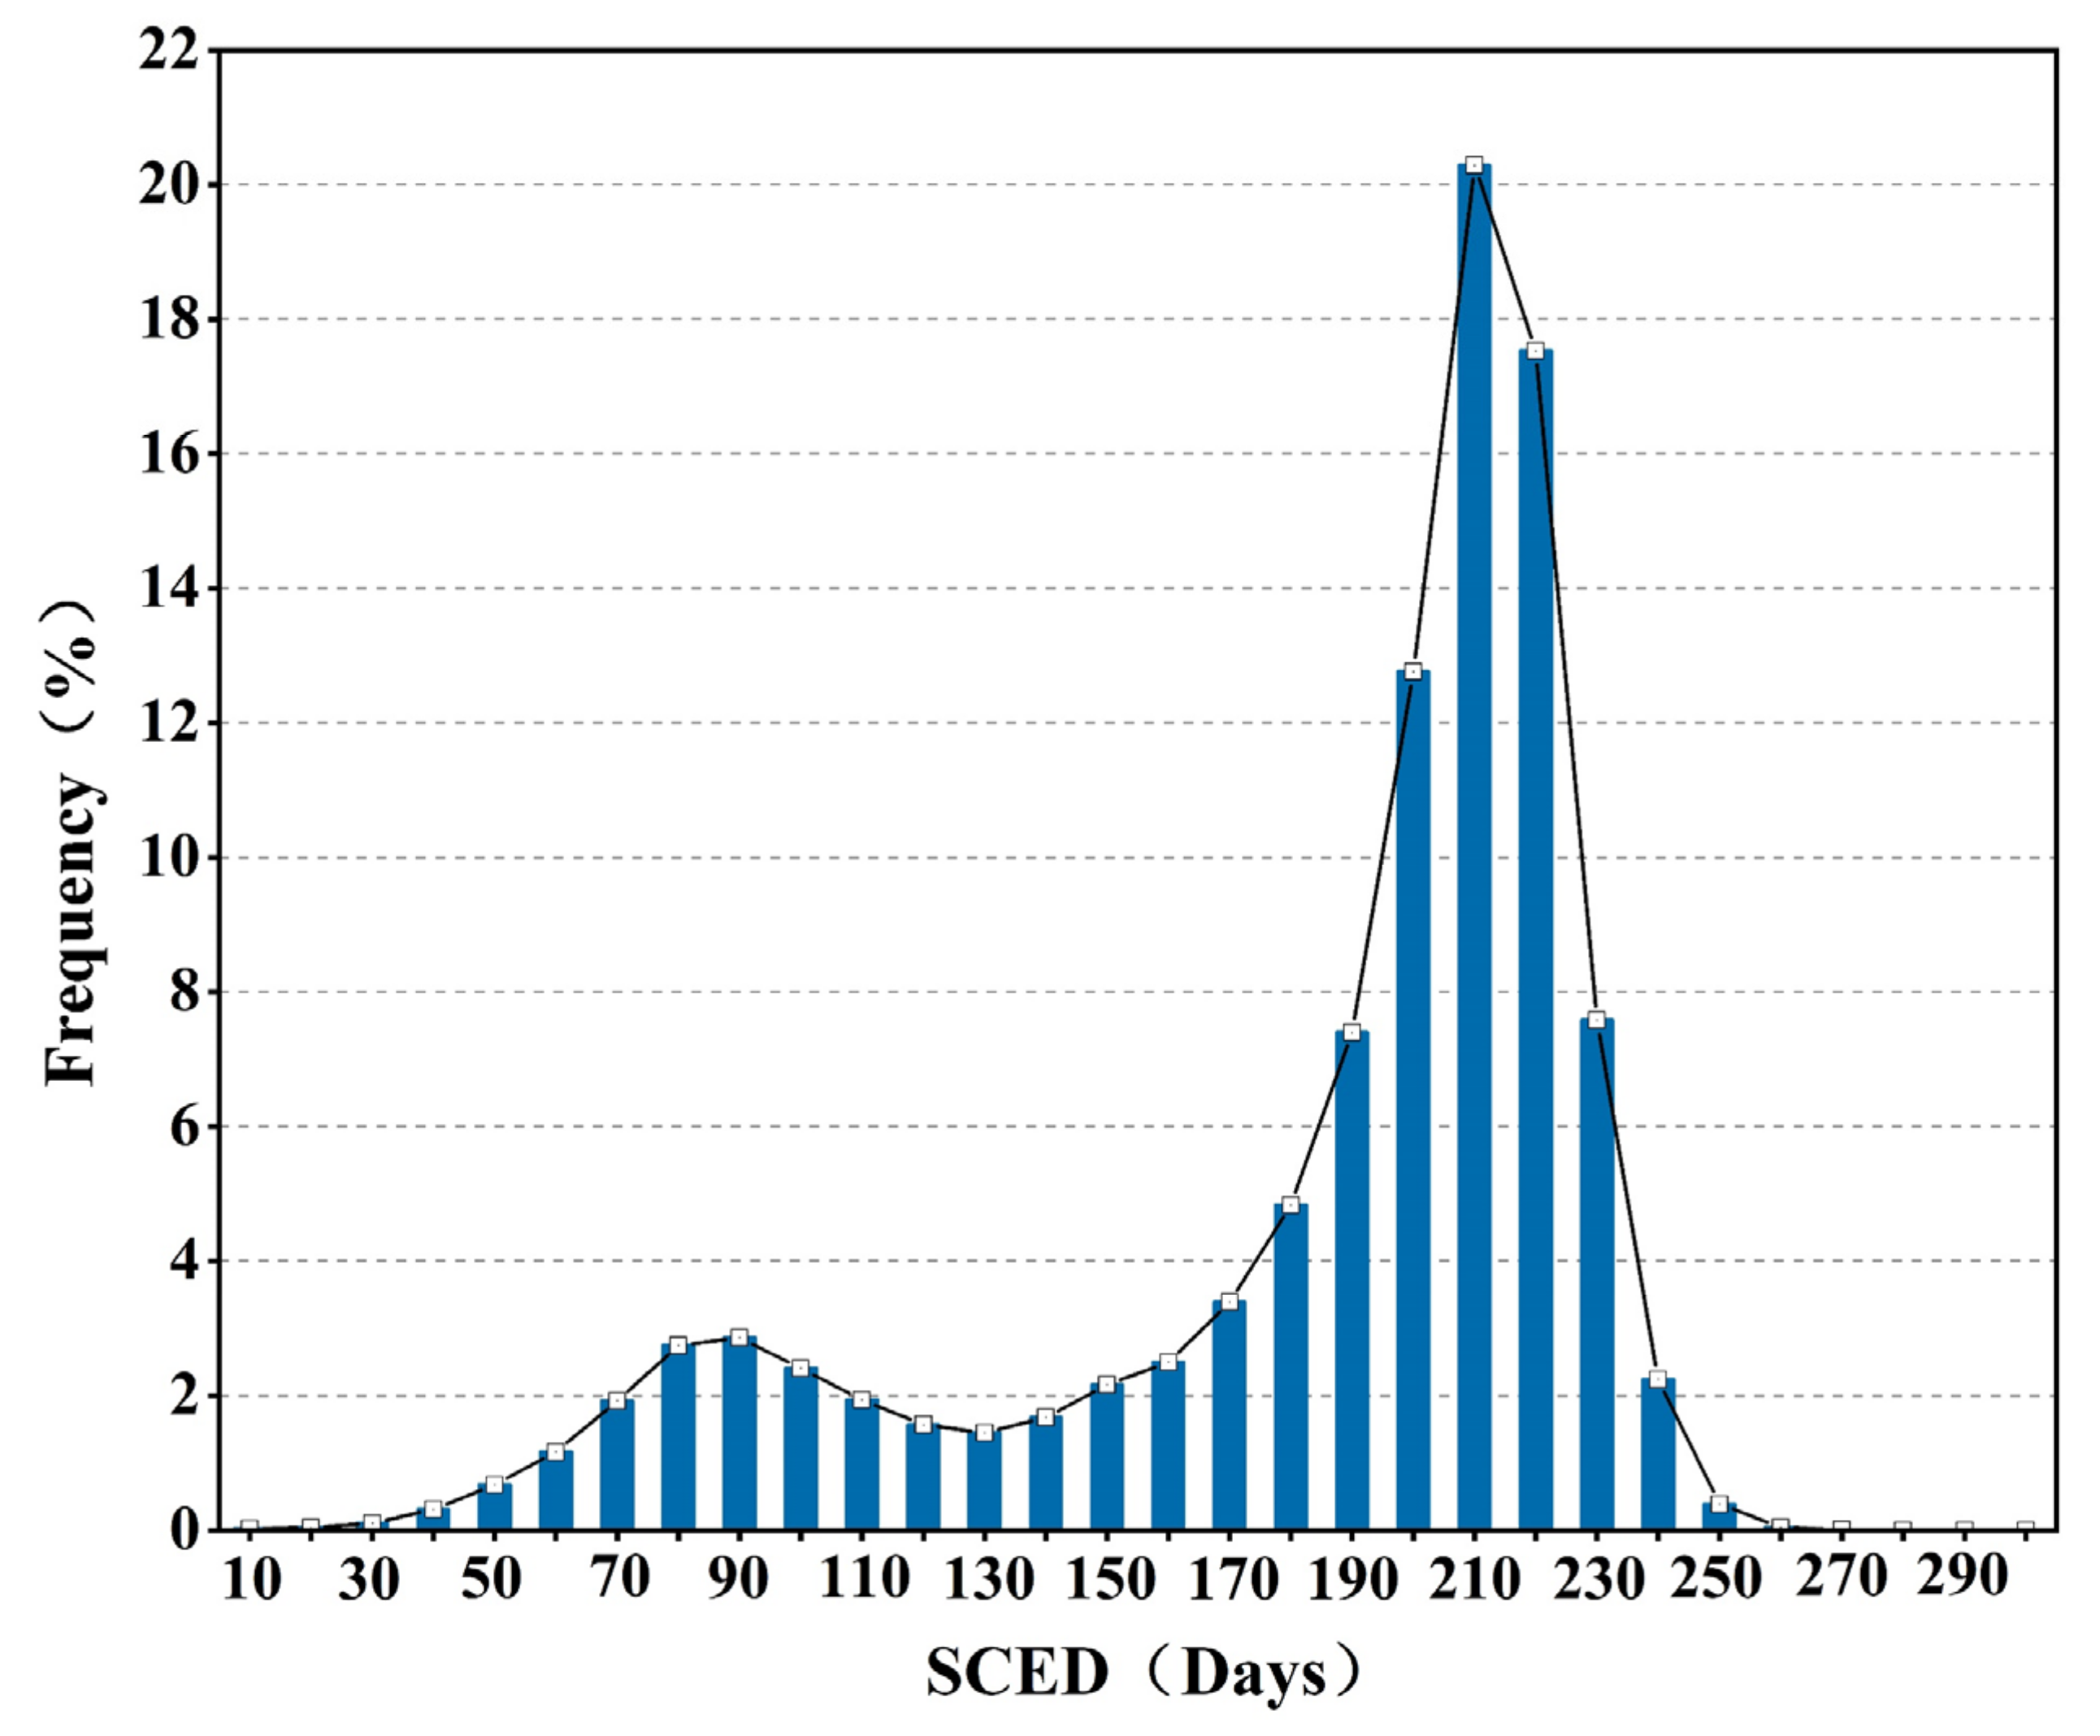
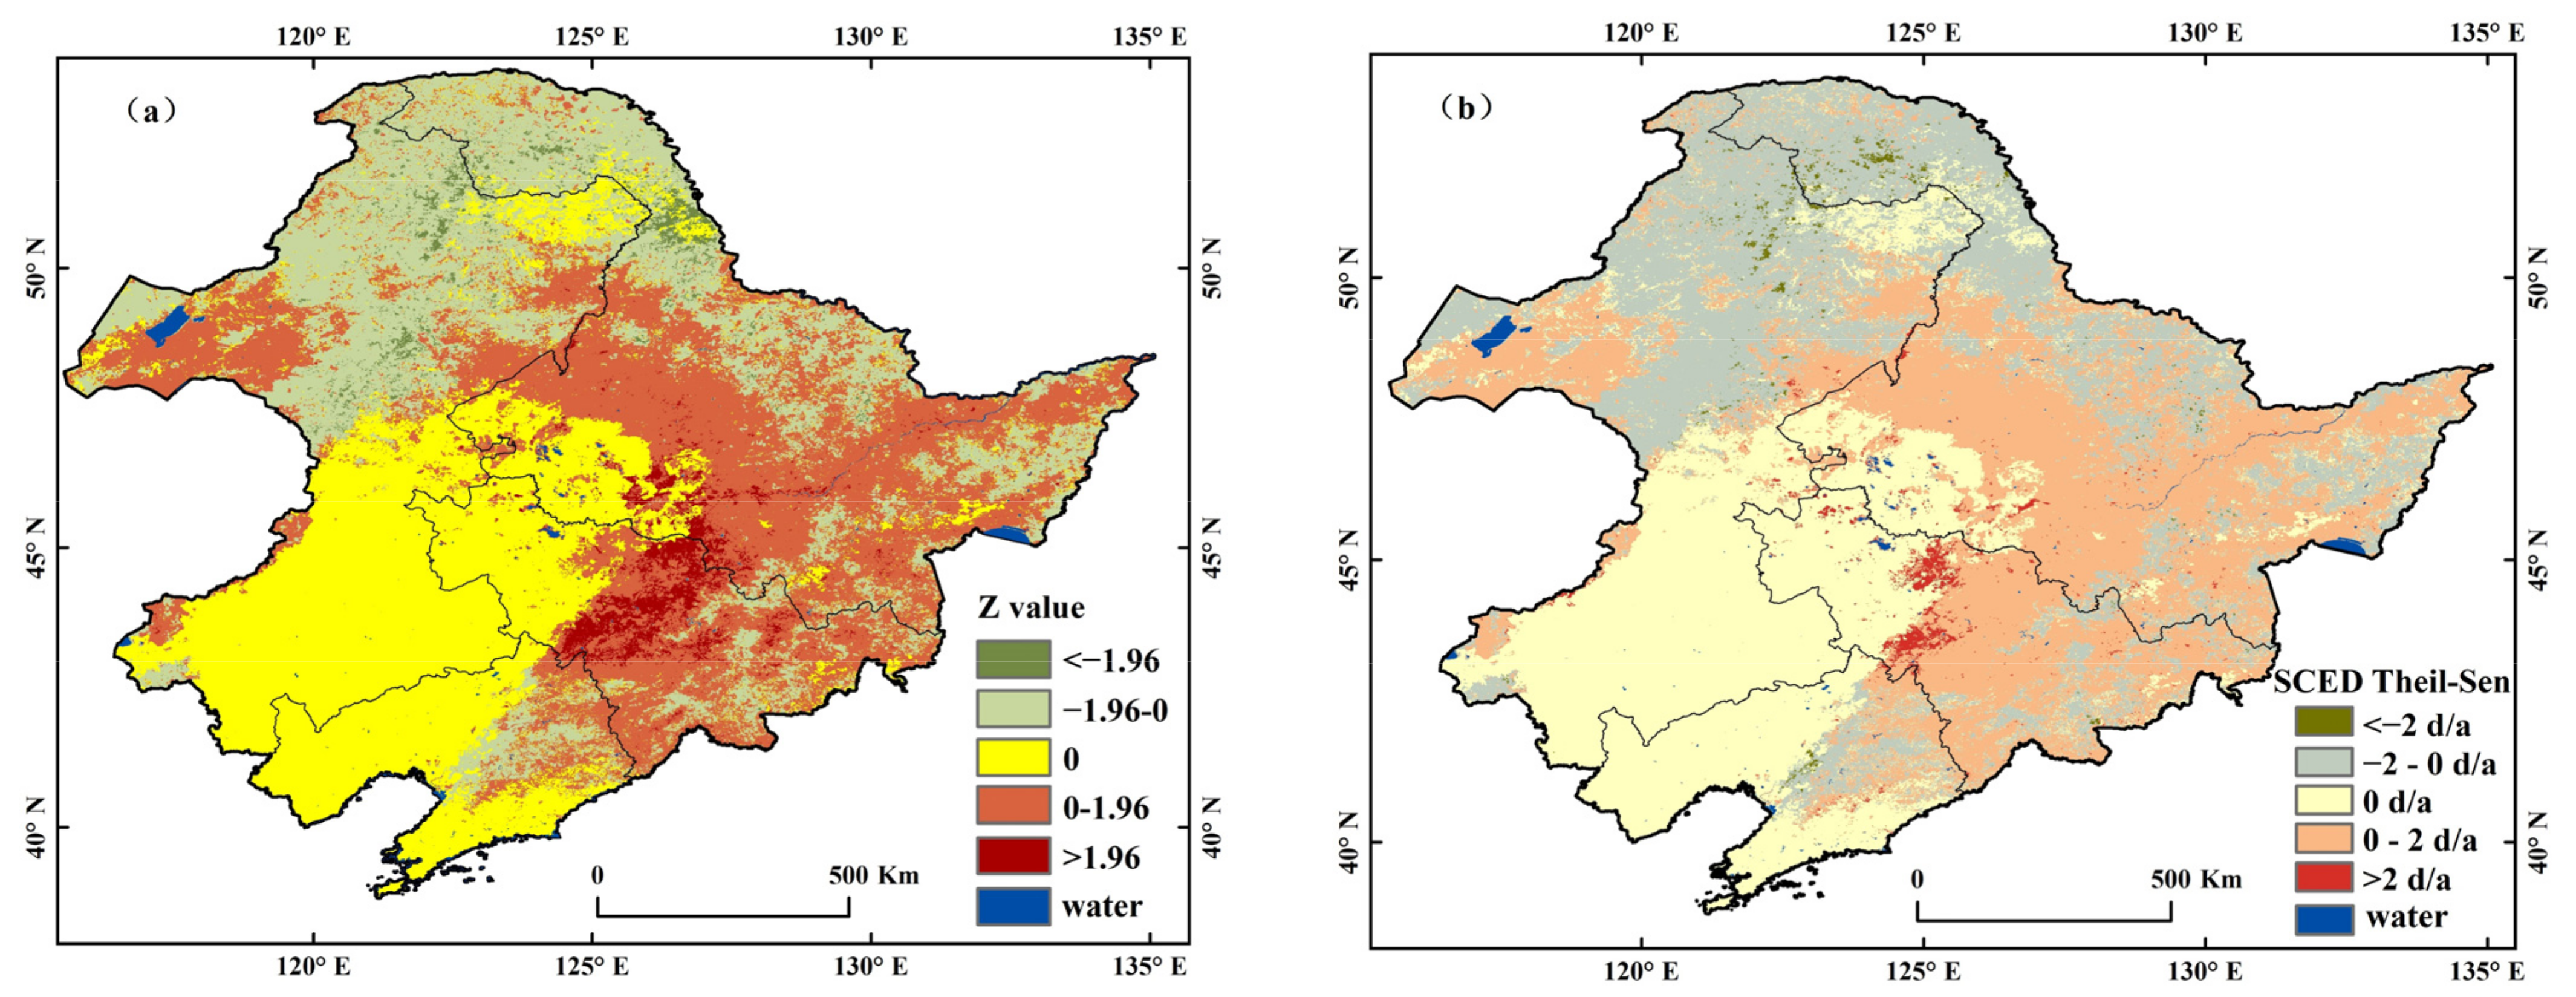
4.2.3. SCED
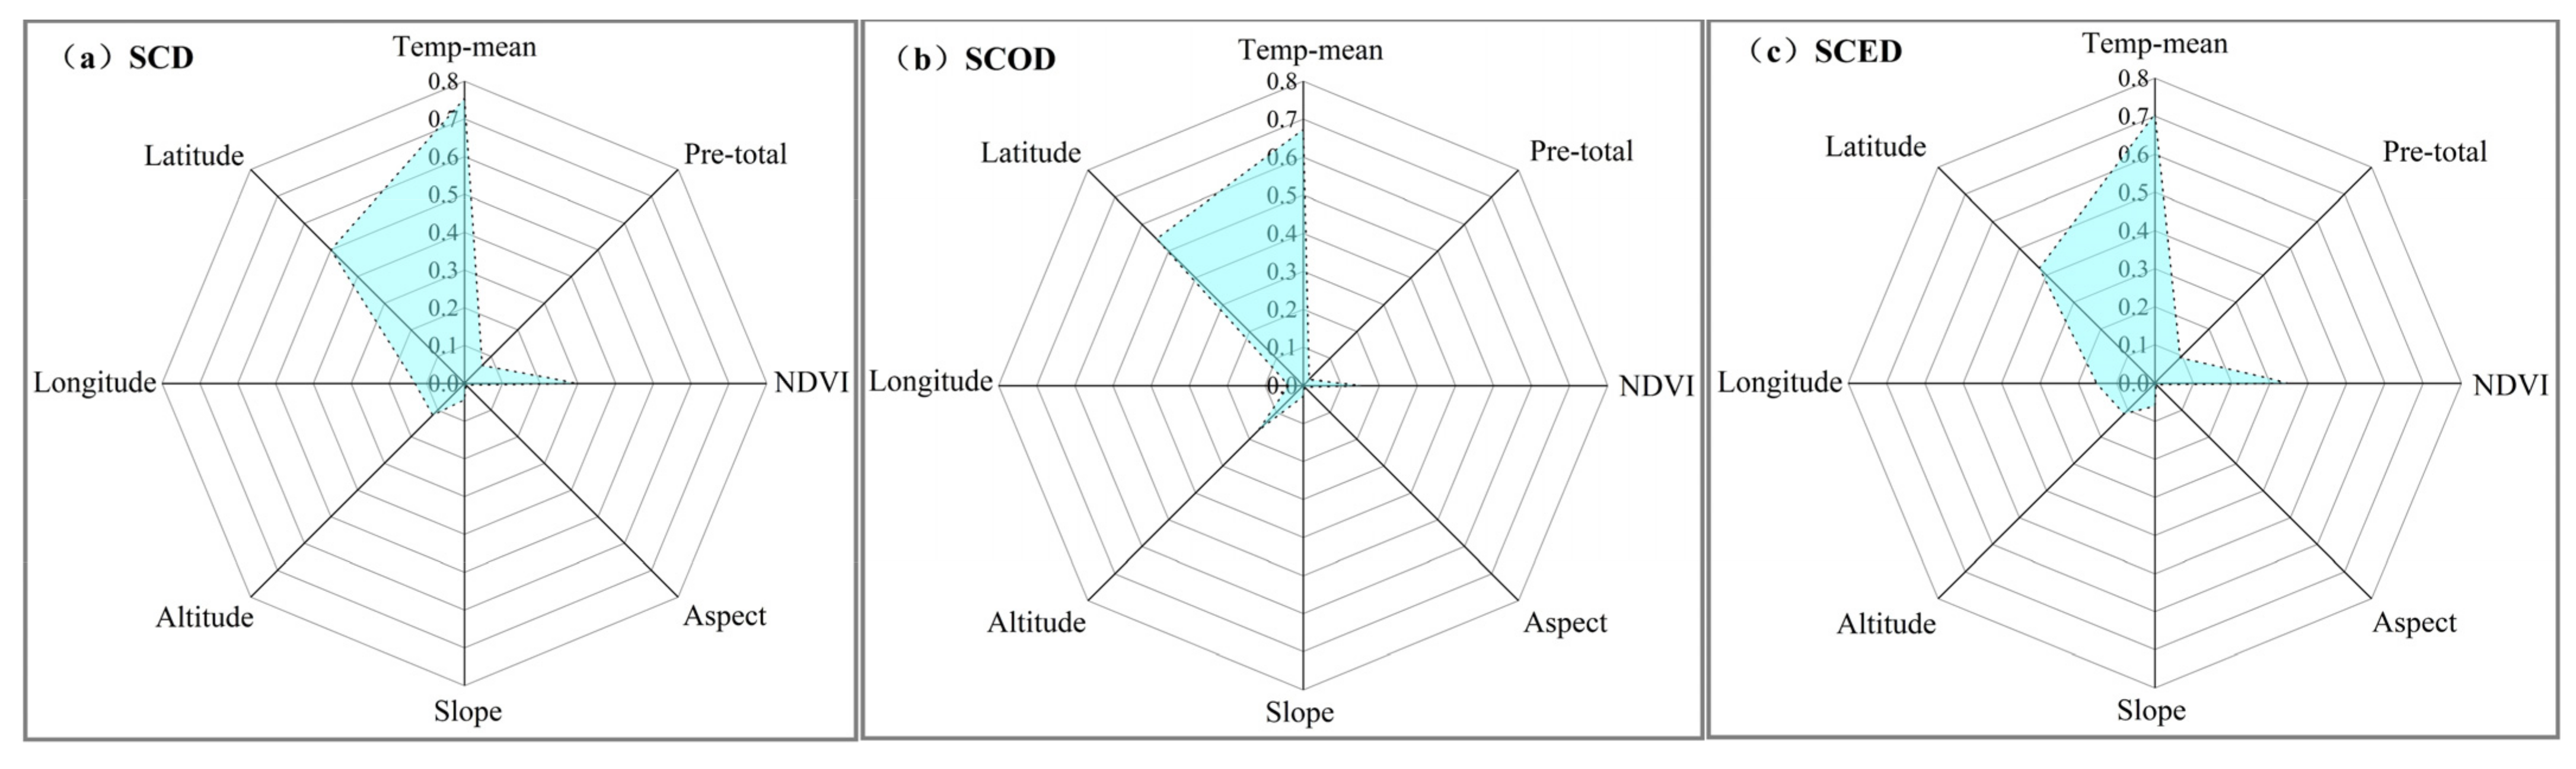
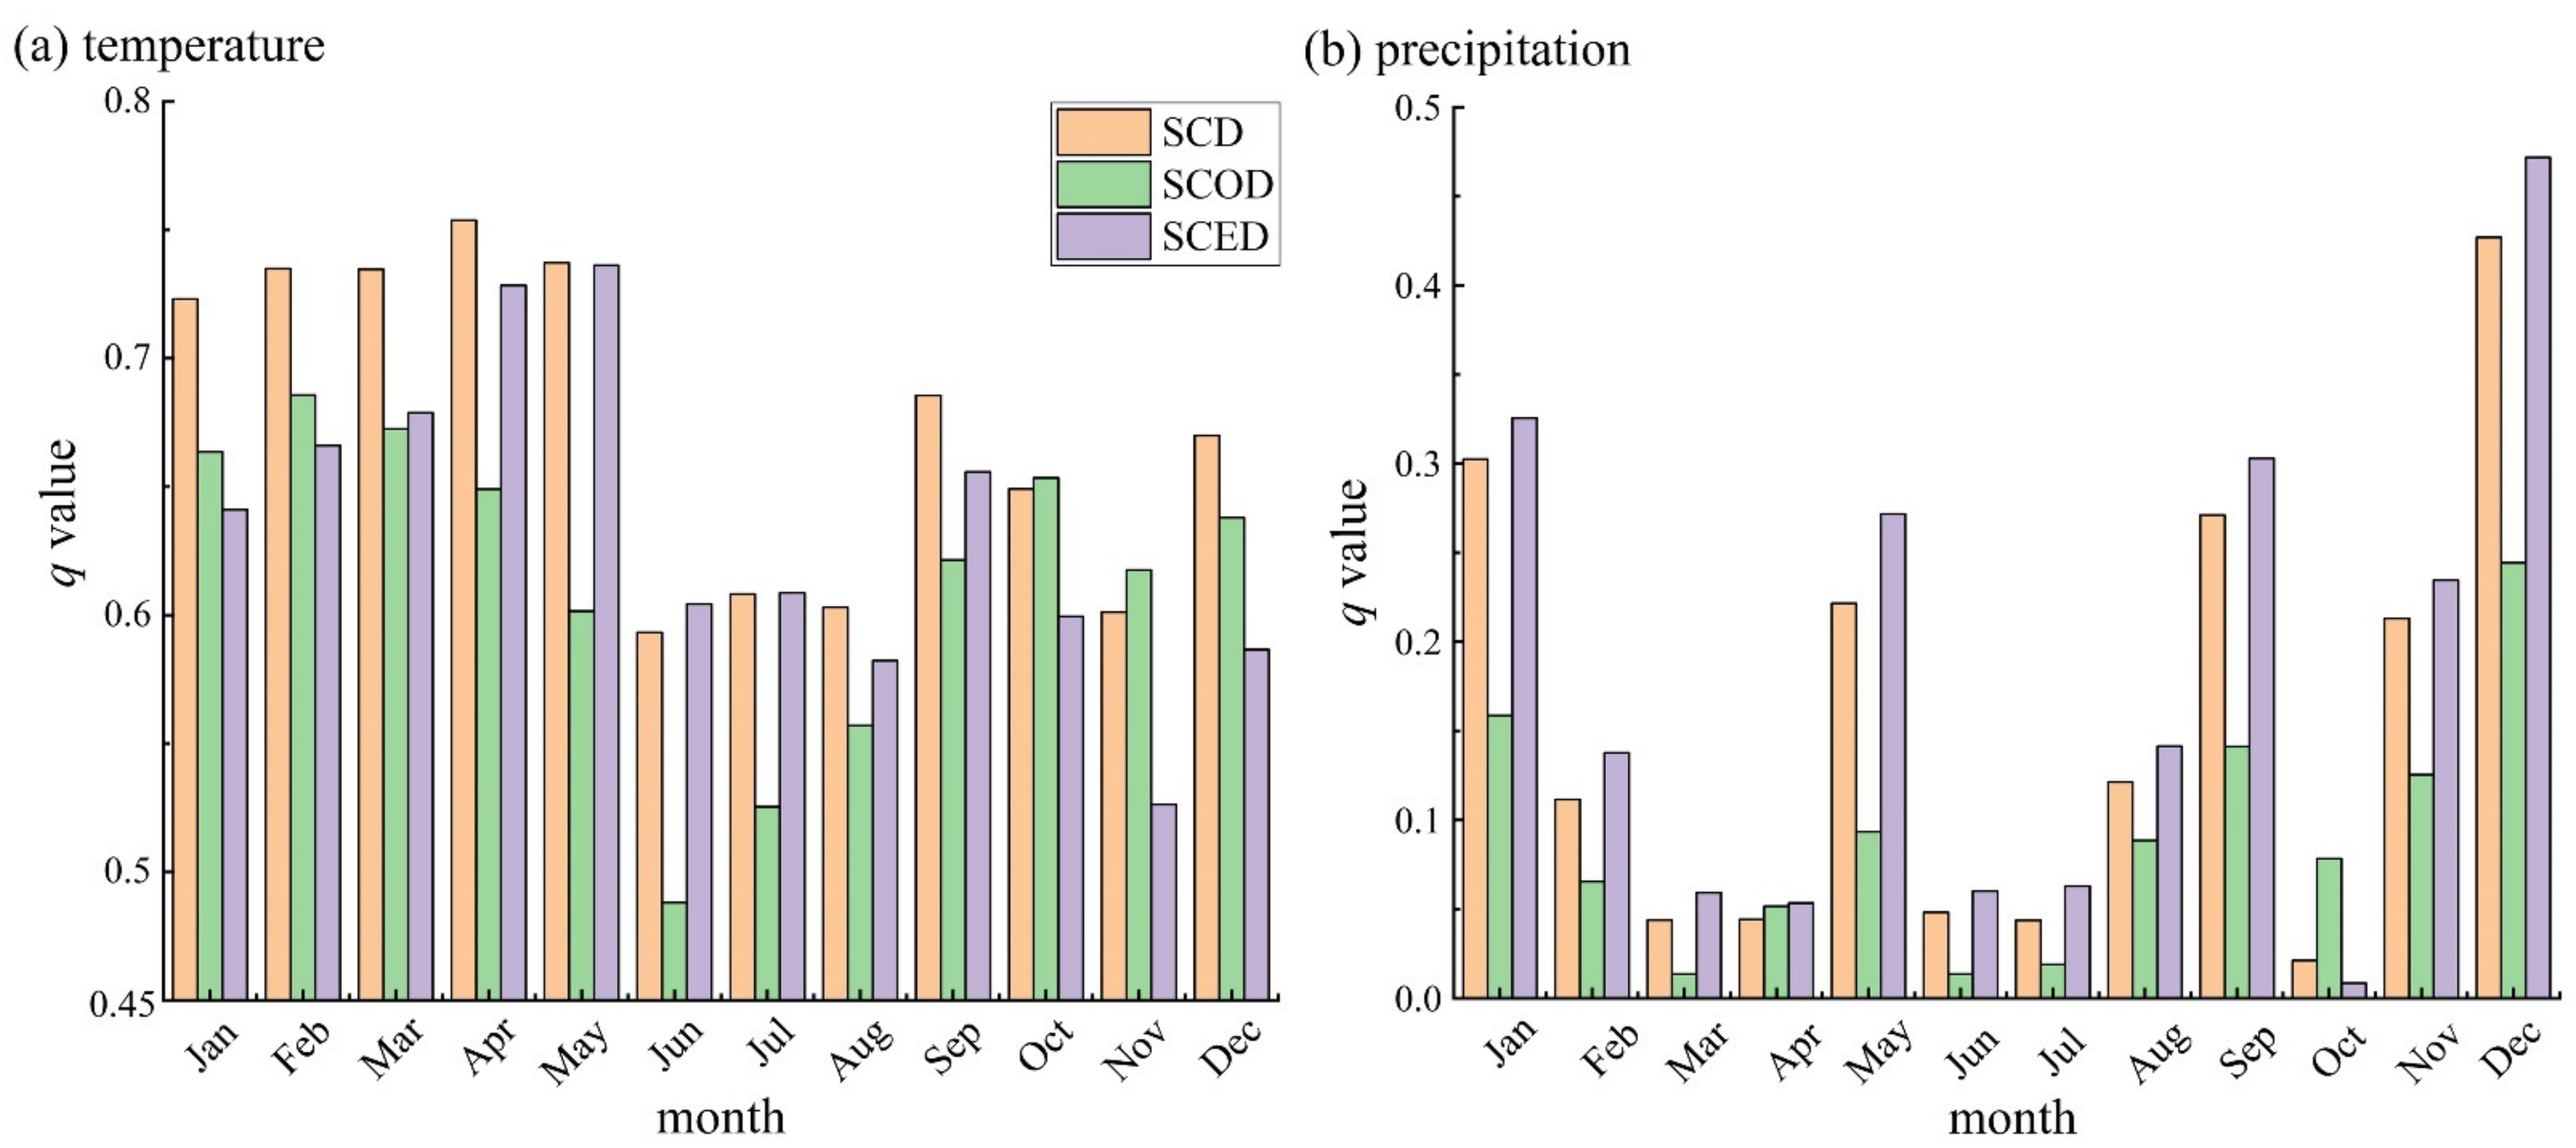
4.3. Roles of Multiple Factors in Snow Phenology
5. Discussions
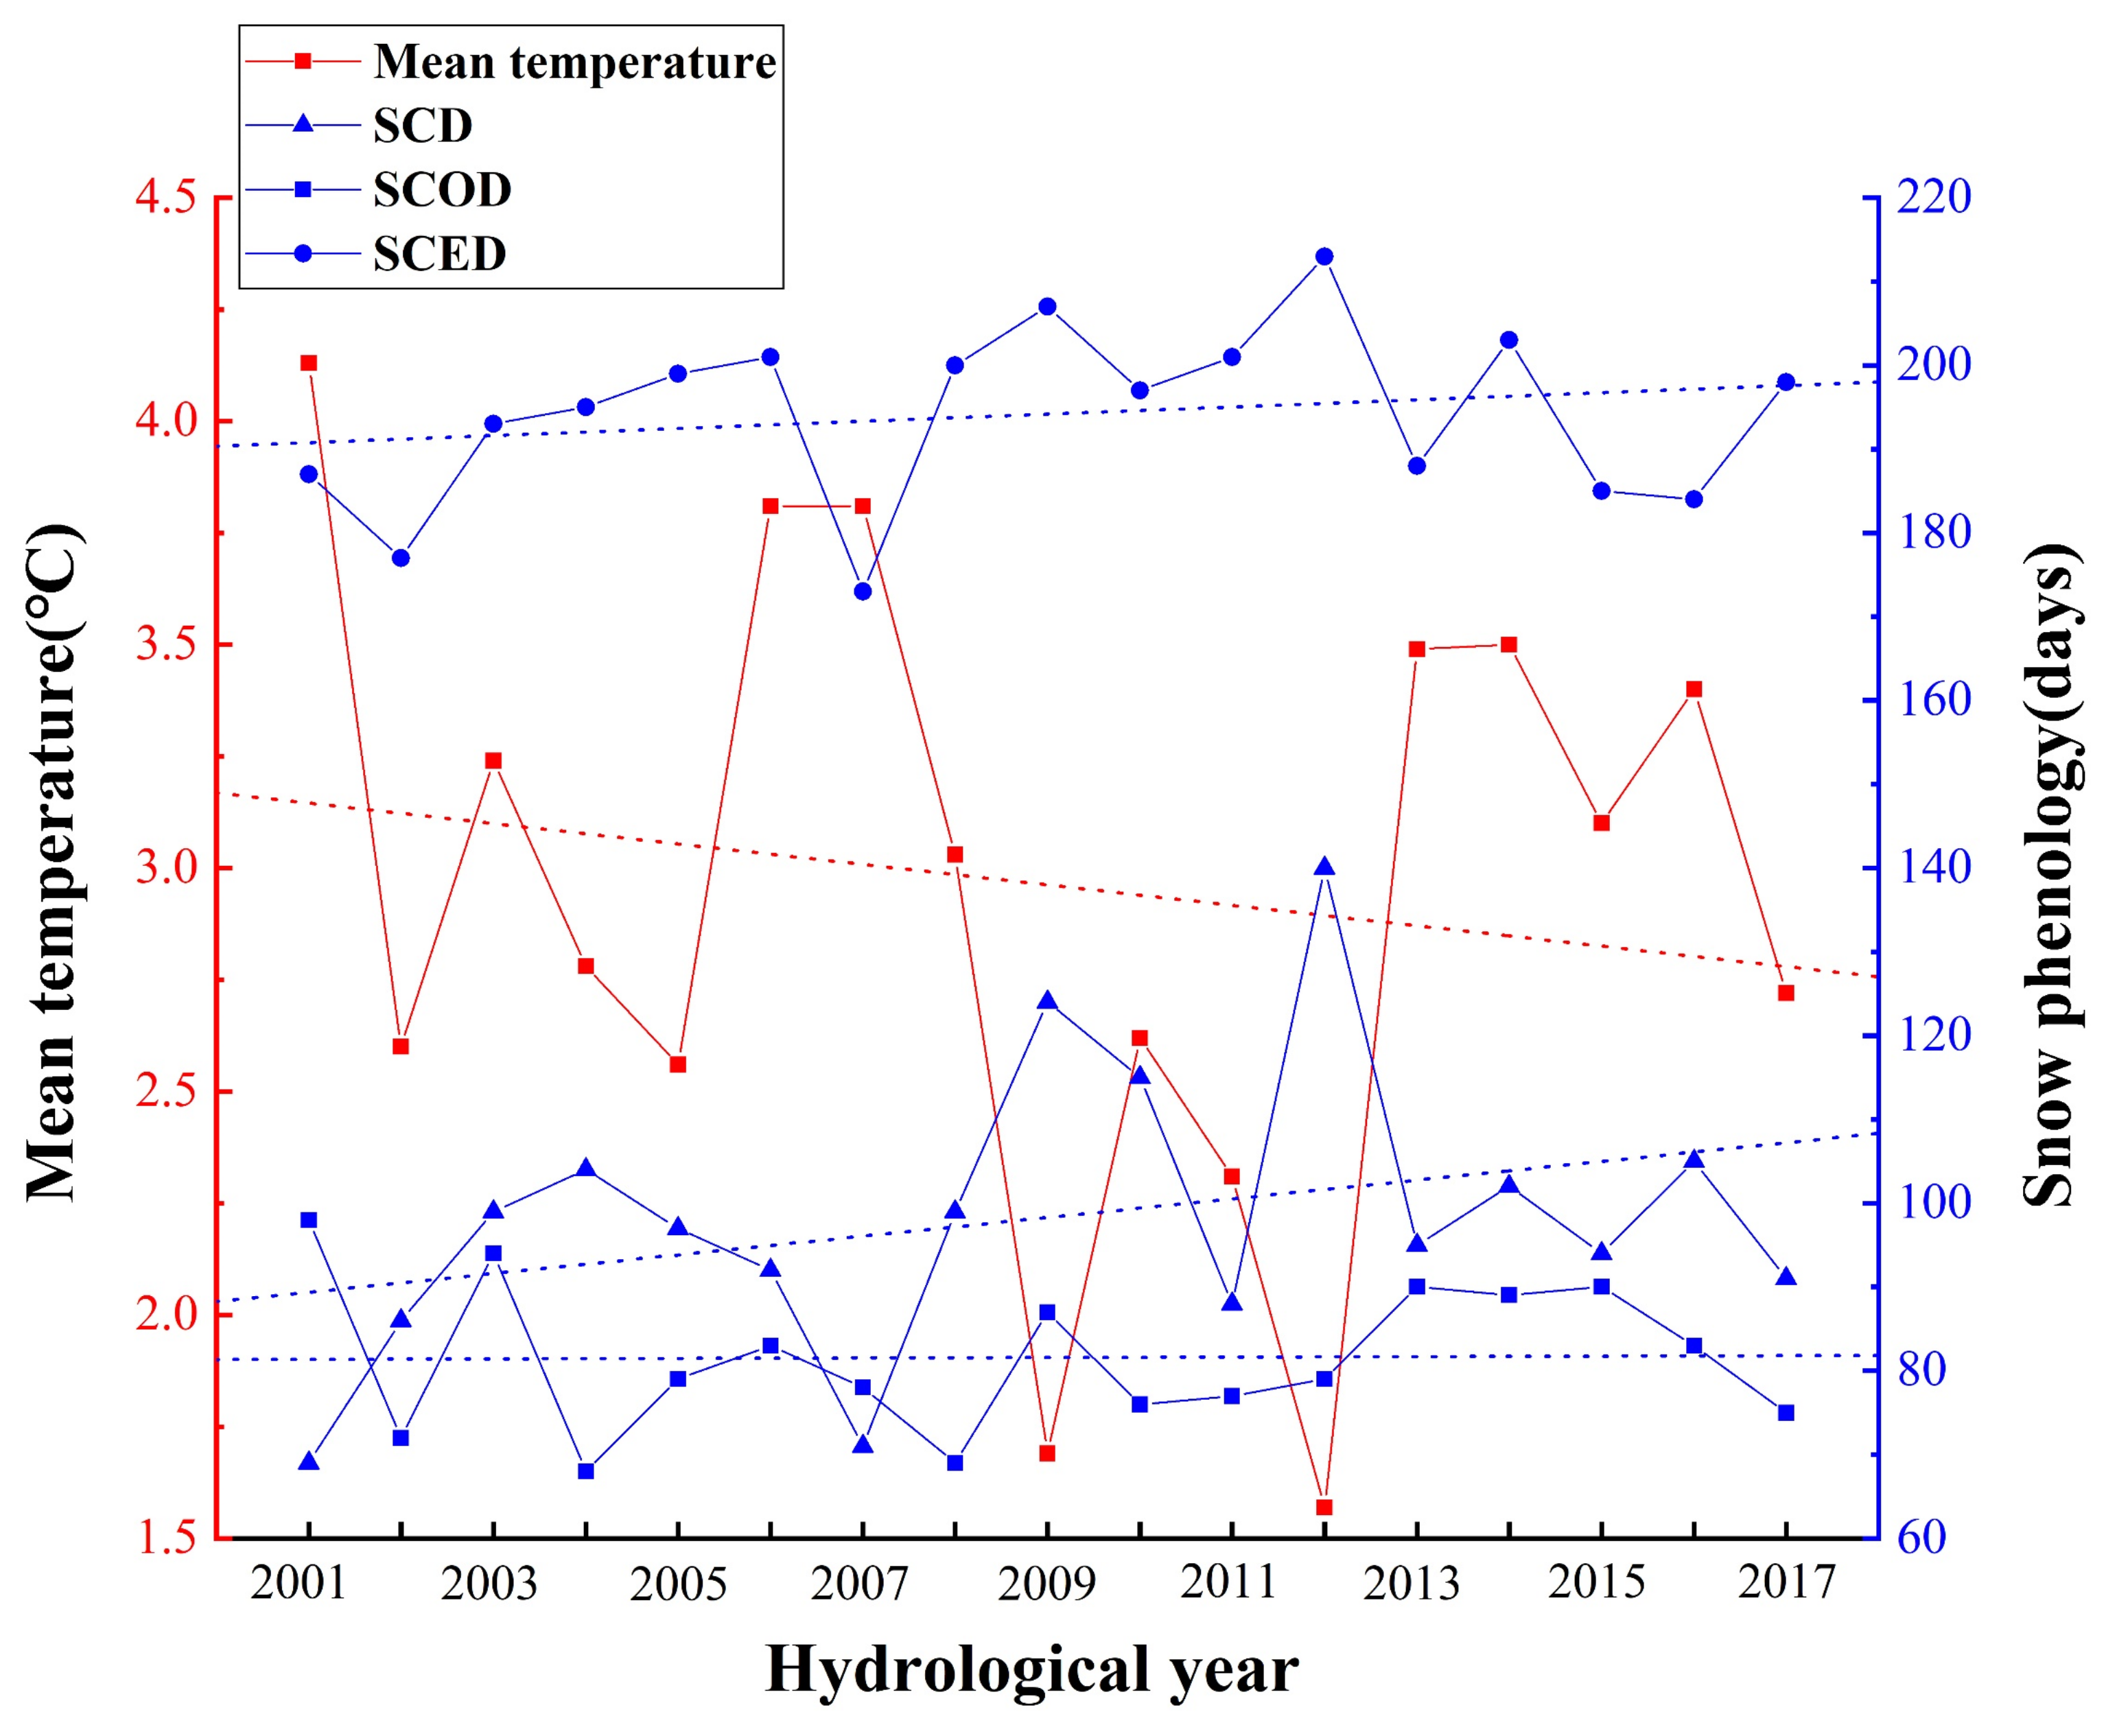
5.1. Response of Snow Phenology to Climate
5.2. Geographical and Vegetation Controls on Snow Phenology
5.3. Comparison with Previous Results
6. Conclusions
- (1)
- The SCD, SCOD and SCED all showed the characteristics of latitudinal zonal distribution, and the SCED and SCD distributions had obvious consistency. With increasing latitude, the SCD was longer, the SCOD began earlier, and the SCED appeared later. Overall, the SCD showed mainly an increasing trend, which was mostly distributed in the southern Daxing’an Mountains, Xiaoxing’an Mountains and Changbai Mountains. The SCOD showed advanced and delayed trends that accounted for 31.93% and 32.80%, respectively. The corresponding proportions of the SCED accounted for 29.44% and 36.70%, respectively, which meant that the SCED showed a delayed trend overall. On the Liaohe Plain and Songnen Plain, the snow phenology basically did not change.
- (2)
- For snow phenology, the mean temperature was identified as the most important driver, followed by latitude. In terms of the roles of temperature in different months, the snow phenology is mainly affected by the temperature in winter of current year and spring of the next year. The decrease in temperature directly led to the extension of SCD, the advancement of SCOD and the delay in SCED. Precipitation, aspect and the slope all had little effect on snow phenology. Compared with the SCOD, the NDVI and longitude both had a greater impact on the SCED and SCD, while SCOD showed a greater impact from altitude.
- (3)
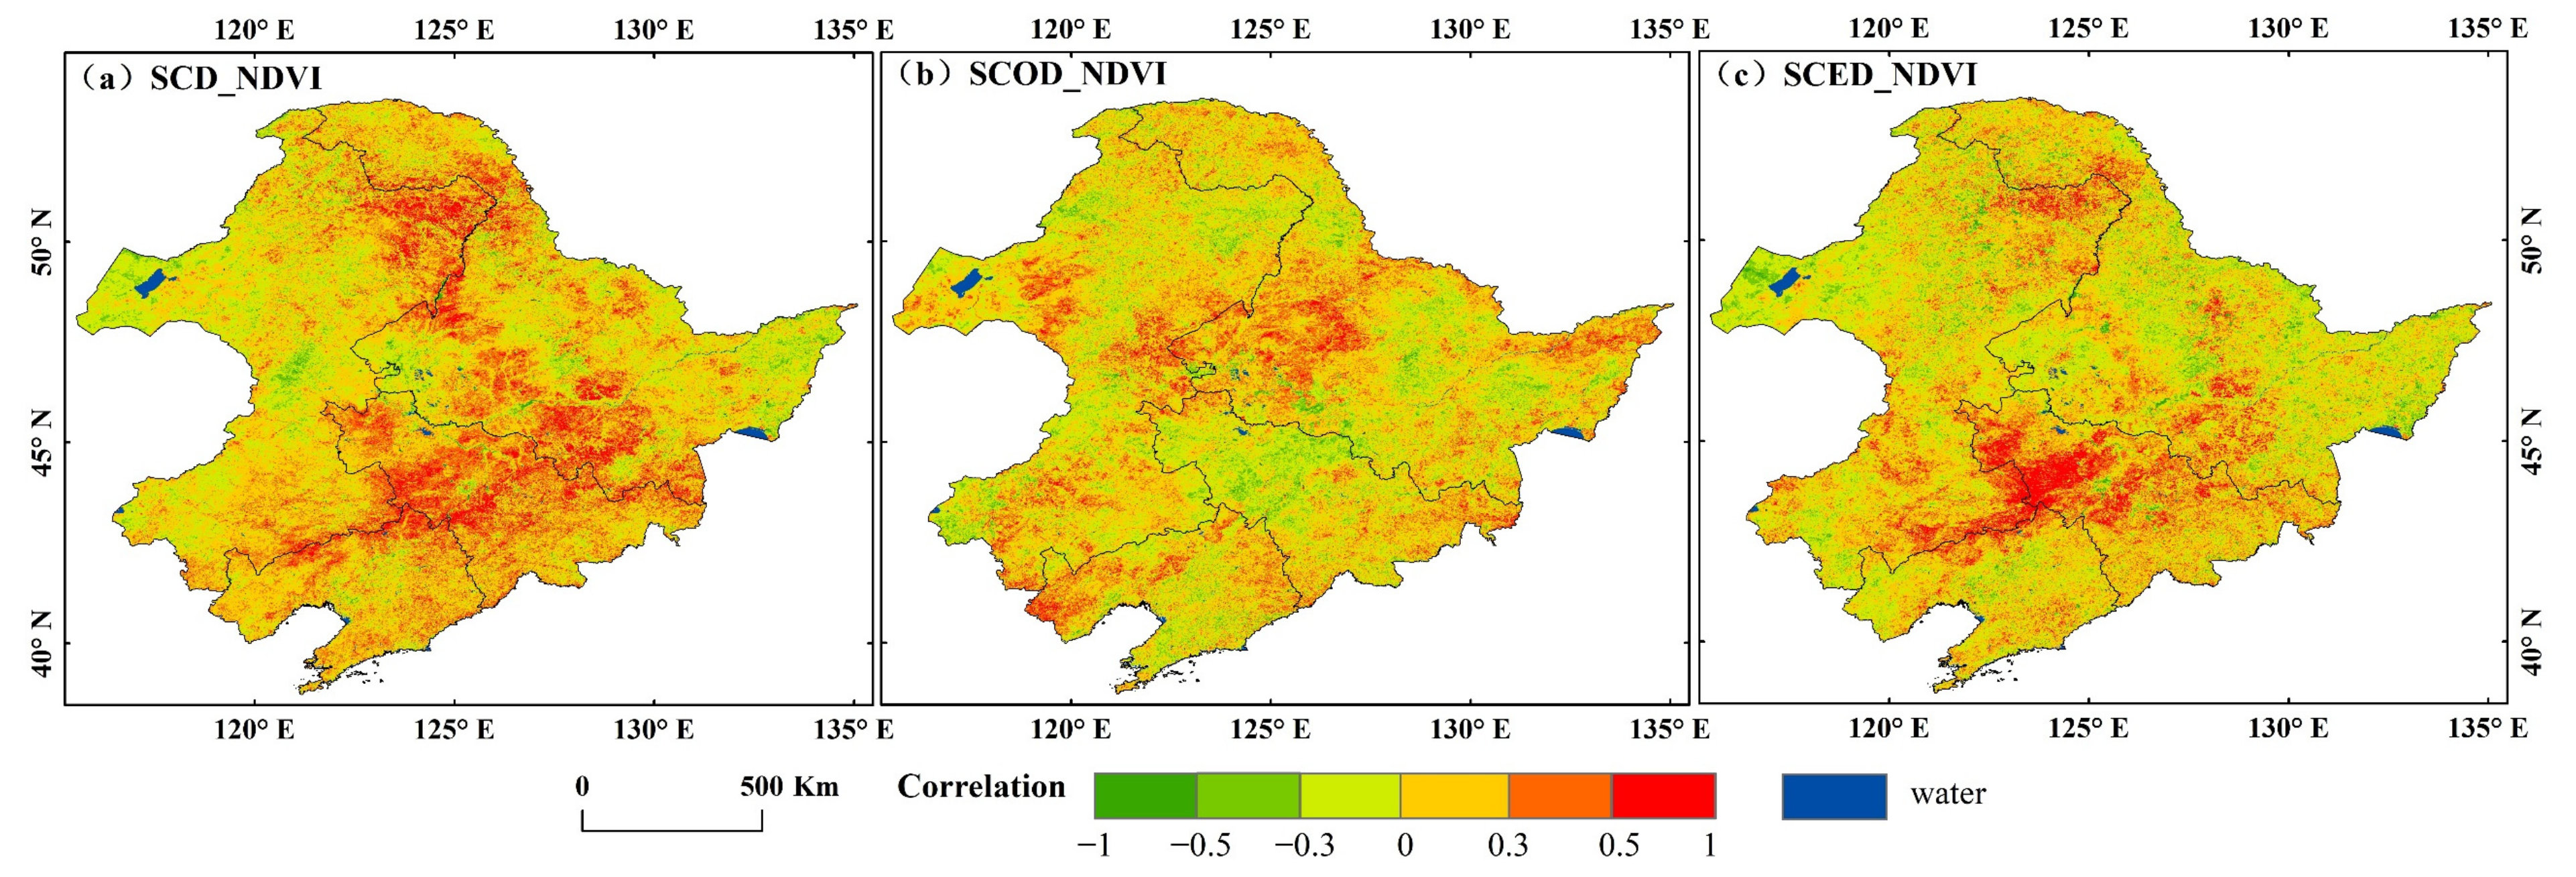
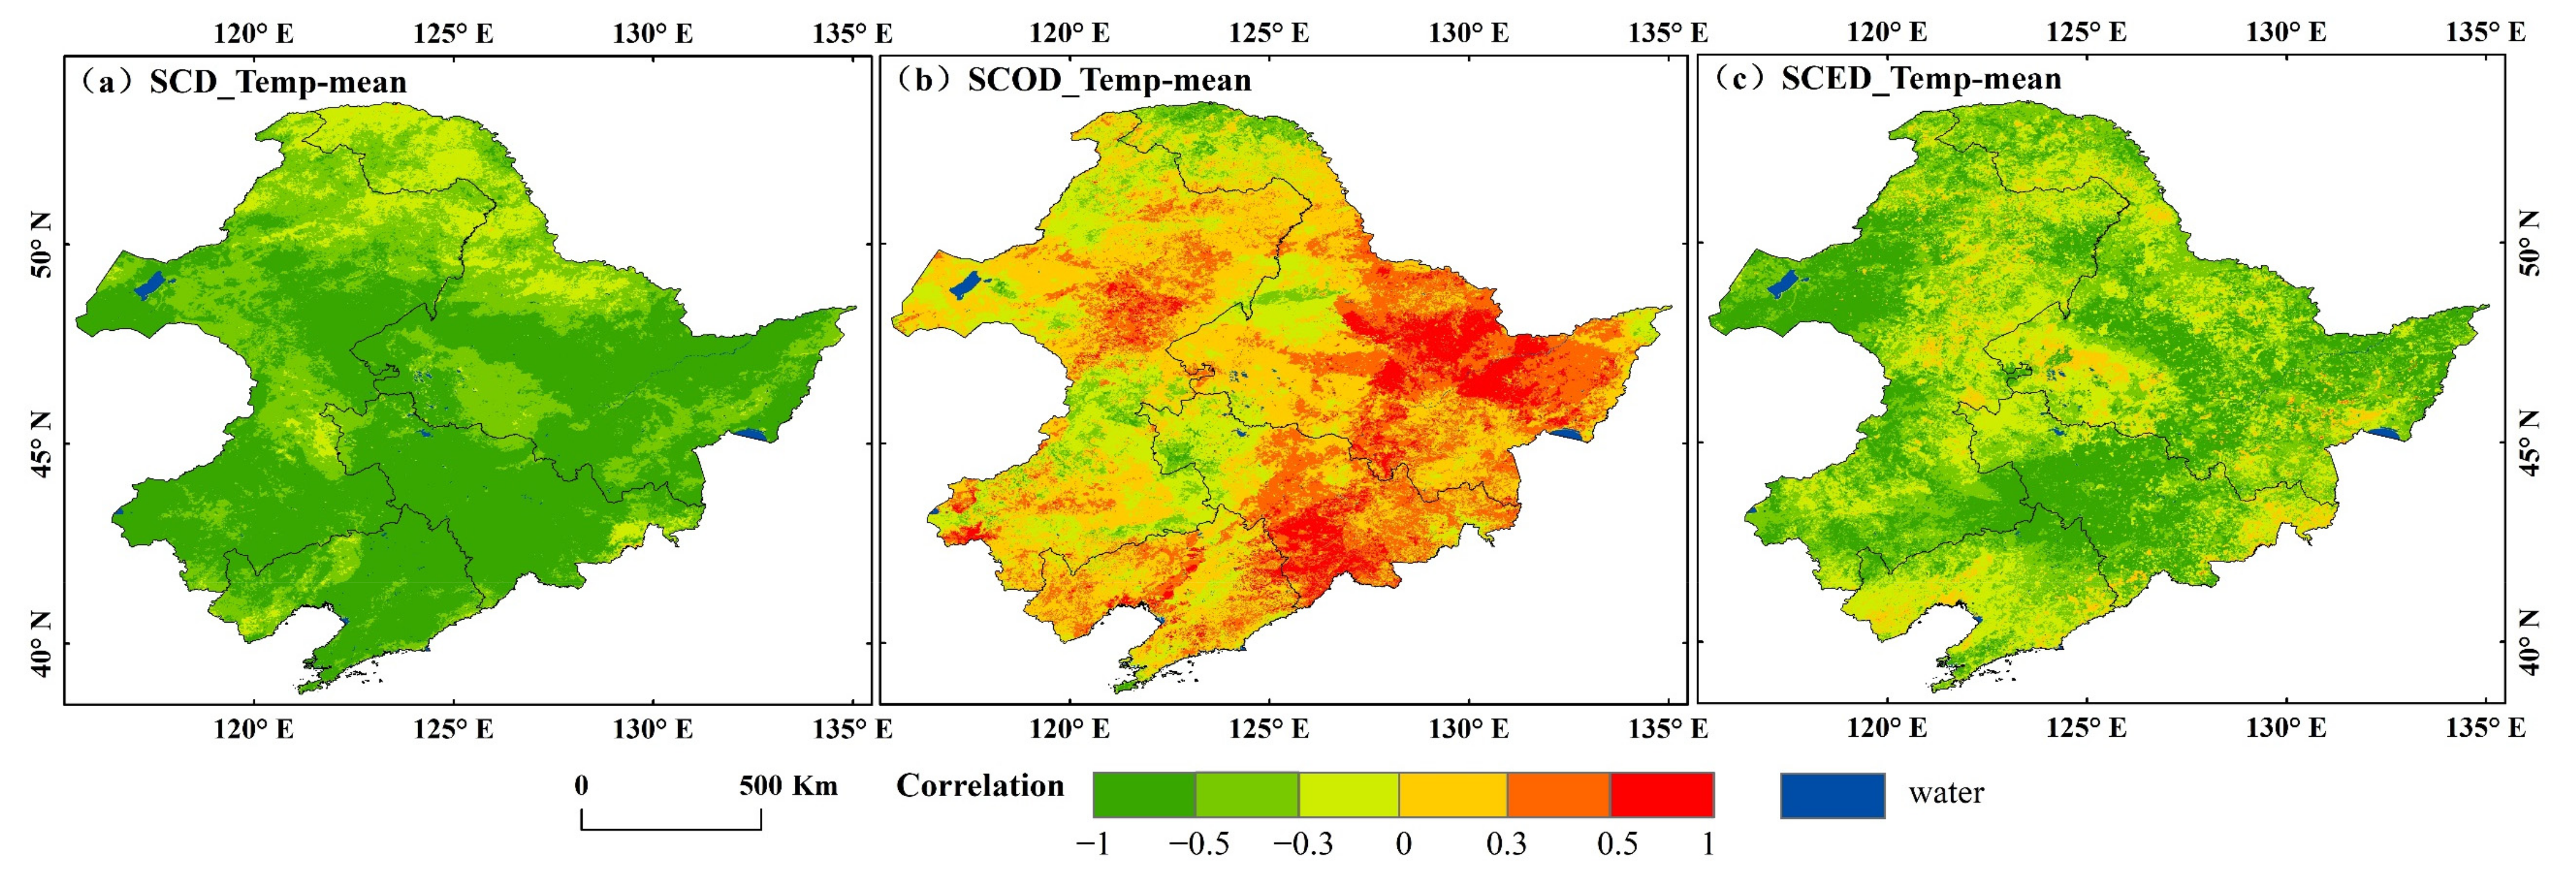
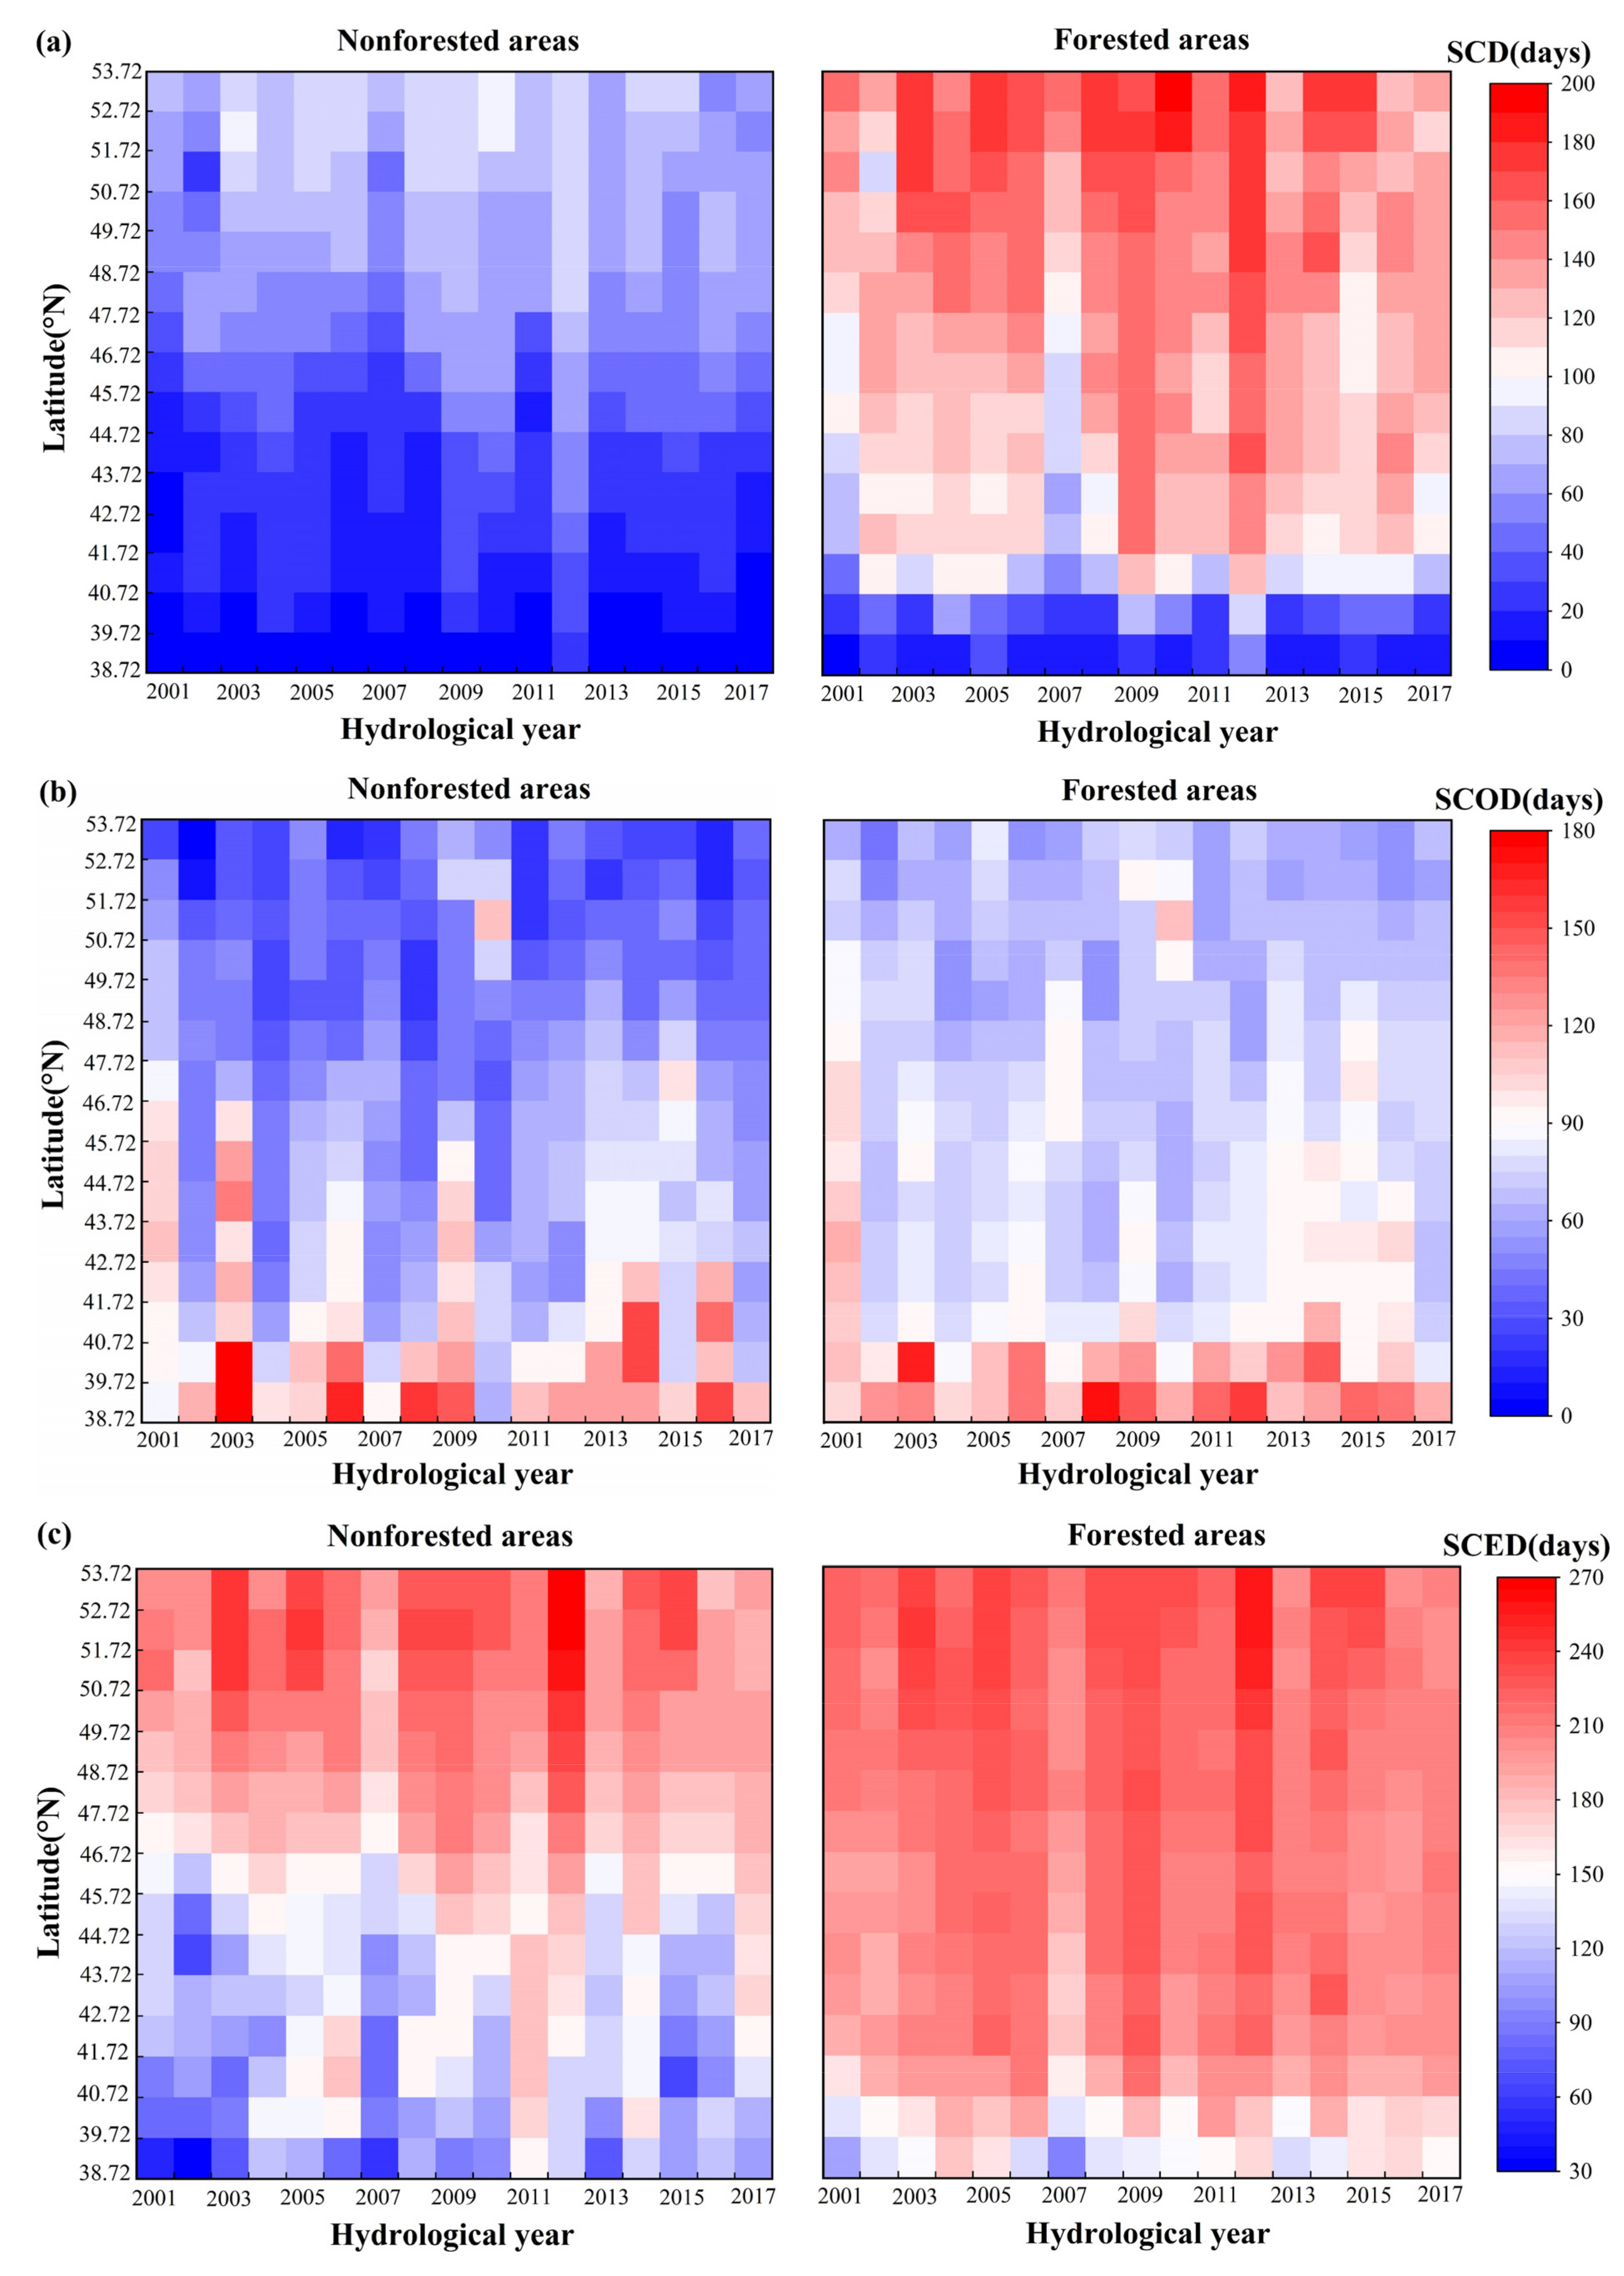
- The mean temperature was mainly negatively correlated with the SCD and SCED and mostly positively correlated with the SCOD. As the latitude increased, the snow phenology changed gradually, and the change rate in the SCD, SCOD and SCED in the whole Northeast China were 10.20 d/degree, −3.82 d/degree and 5.41 d/degree, respectively. The change rate in the snow phenology in forested areas and nonforested areas were inconsistent, and it was slower in forested areas than nonforested areas. Snow phenology was mainly positively correlated with the NDVI, but weak correlations with the NDVI accounted for a large proportion.
Author Contributions
Funding
Acknowledgments
Conflicts of Interest
References
- Shi, Y.; Gao, X.J.; Wu, J.; Giorgi, F. Changes in snow cover over China in the 21st century as simulated by a high resolution regional climate model. Environ. Res. Lett. 2011, 6, 045401. [Google Scholar] [CrossRef]
- Peng, S.S.; Piao, S.L.; Ciais, P.; Fang, J.Y.; Wang, X.H. Change in winter snow depth and its impacts on vegetation in China. Glob. Change Biol. 2010, 16, 3004–3013. [Google Scholar] [CrossRef]
- Qi, W.; Feng, L.; Liu, J.G.; Yang, H. Snow as an Important Natural Reservoir for Runoff and Soil Moisture in Northeast China. J. Geophys. Res. Atmos. 2020, 125, e2020JD033086. [Google Scholar] [CrossRef]
- Ding, T.; Gao, H. Relationship between winter snow cover days in Northeast China and rainfall near the Yangtze River basin in the following summer. J. Meteorol. Res. 2015, 29, 400–411. [Google Scholar] [CrossRef]
- Ke, C.-Q.; Li, X.-C.; Xie, H.; Ma, D.-H.; Liu, X.; Kou, C. Variability in snow cover phenology in China from 1952 to 2010. Hydrol. Earth Syst. Sci. 2016, 20, 755–770. [Google Scholar] [CrossRef] [Green Version]
- Ma, N.; Yu, K.; Zhang, Y.; Zhai, J.; Zhang, Y.; Zhang, H. Ground observed climatology and trend in snow cover phenology across China with consideration of snow-free breaks. Clim. Dyn. 2020, 55, 2867–2887. [Google Scholar] [CrossRef]
- Sun, Y.; Zhang, T.; Liu, Y.; Zhao, W.; Huang, X. Assessing Snow Phenology over the Large Part of Eurasia Using Satellite Observations from 2000 to 2016. Remote Sens. 2020, 12, 2060. [Google Scholar] [CrossRef]
- Chen, S.; Yang, Q.; Xie, H.; Zhang, H.; Lu, P.; Zhou, C. Spatiotemporal variations of snow cover in northeast China based on flexible multiday combinations of moderate resolution imaging spectroradiometer snow cover products. J. Appl. Remote Sens. 2014, 8, 084685. [Google Scholar] [CrossRef]
- Yang, Q.; Song, K.; Hao, X.; Chen, S.; Zhu, B. An Assessment of Snow Cover Duration Variability Among Three Basins of Song hua River in Northeast China Using Binary Decision Tree. Chin. Geogr. Sci. 2018, 28, 946–956. [Google Scholar] [CrossRef] [Green Version]
- Qiao, D.; Zhou, J.; Liang, S.; Fu, X. Combined Effects of Precipitation and Temperature on the Responses of Forest Spring Phenology to Winter Snow Cover Dynamics in Northeast China. IEEE Access 2019, 7, 138950–138962. [Google Scholar] [CrossRef]
- Shi, H.; Zhou, L.L.; Xu, X.Q.; Fan, H.M. Snow Cover Distribution’s Correlation with Climatic Factors in Northeast China’s Mollisol Region. Appl. Ecol. Environ. Res. 2020, 18, 6539–6554. [Google Scholar] [CrossRef]
- Huang, X.; Liu, C.; Zheng, Z.; Wang, Y.; Li, X.; Liang, T. Snow cover variations across China from 1951–2018. Cryosphere 2020, 1–20. [Google Scholar] [CrossRef]
- Wang, Y.; Zheng, Z. Spatial Representativeness Analysis for Snow Depth Measurements of Meteorological Stations in North east China. J. Hydrometeorol. 2020, 21, 791–805. [Google Scholar] [CrossRef]
- Woo, M.K.; Thorne, R. Snowmelt contribution to discharge from a large mountainous catchment in subarctic Canada. Hydrol. Processes 2006, 20, 2129–2139. [Google Scholar] [CrossRef]
- Tang, Z.G.; Wang, J.; Li, H.Y.; Yan, L.L. Spatiotemporal changes of snow cover over the Tibetan plateau based on cloud-re moved moderate resolution imaging spectroradiometer fractional snow cover product from 2001 to 2011. J. Appl. Remote Sens. 2013, 7, 073582. [Google Scholar] [CrossRef]
- Wang, X.; Zhu, Y.; Chen, Y.; Zheng, H.; Liu, H.; Huang, H.; Liu, K.; Liu, L. Influences of forest on MODIS snow cover map ping and snow variations in the Amur River basin in Northeast Asia during 2000–2014. Hydrol. Processes 2017, 31, 3225–3241. [Google Scholar] [CrossRef]
- Liang, S.; Li, X.; Zheng, X.; Jiang, T.; Li, X.; Qiao, D. Effects of Winter Snow Cover on Spring Soil Moisture Based on Remote Sensing Data Product over Farmland in Northeast China. Remote Sens. 2020, 12, 2716. [Google Scholar] [CrossRef]
- Brown, R.D.; Robinson, D.A. Northern Hemisphere spring snow cover variability and change over 1922–2010 including an assessment of uncertainty. Cryosphere 2011, 5, 219–229. [Google Scholar] [CrossRef] [Green Version]
- Chen, X.; Liang, S.; Cao, Y.; He, T.; Wang, D. Observed contrast changes in snow cover phenology in northern middle and high latitudes from 2001–2014. Sci. Rep. 2015, 5, 16820. [Google Scholar] [CrossRef] [Green Version]
- Liang, H.; Huang, X.D.; Sun, Y.H.; Wang, Y.L.; Liang, T.G. Fractional Snow-Cover Mapping Based on MODIS and UAV Data over the Tibetan Plateau. Remote Sens. 2017, 9, 1332. [Google Scholar] [CrossRef] [Green Version]
- Paudel, K.P.; Andersen, P. Monitoring snow cover variability in an agropastoral area in the Trans Himalayan region of Ne pal using MODIS data with improved cloud removal methodology. Remote Sens. Environ. 2011, 115, 1234–1246. [Google Scholar] [CrossRef]
- Hall, D.K.; Riggs, G.A.; Foster, J.L.; Kumar, S.V. Development and evaluation of a cloud-gap-filled MODIS daily snow-cover product. Remote Sens. Environ. 2010, 114, 496–503. [Google Scholar] [CrossRef] [Green Version]
- Da Ronco, P.; De Michele, C. Cloud obstruction and snow cover in Alpine areas from MODIS products. Hydrol. Earth Syst. Sci. 2014, 18, 4579–4600. [Google Scholar] [CrossRef] [Green Version]
- Huang, X.D.; Deng, J.; Ma, X.F.; Wang, Y.L.; Feng, Q.S.; Hao, X.H.; Liang, T.G. Spatiotemporal dynamics of snow cover based on multi-source remote sensing data in China. Cryosphere 2016, 10, 2453–2463. [Google Scholar] [CrossRef] [Green Version]
- Huang, Y.; Liu, H.X.; Yu, B.L.; We, J.P.; Kang, E.L.; Xu, M.; Wang, S.J.; Klein, A.; Chen, Y.N. Improving MODIS snow prod ucts with a HMRF-based spatio-temporal modeling technique in the Upper Rio Grande Basin. Remote Sens. Environ. 2018, 204, 568–582. [Google Scholar] [CrossRef]
- Chen, S.Y.; Wang, X.Y.; Guo, H.; Xie, P.Y.; Wang, J.; Hao, X.H. A Conditional Probability Interpolation Method Based on a Space-Time Cube for MODIS Snow Cover Products Gap Filling. Remote Sens. 2020, 12, 3577. [Google Scholar] [CrossRef]
- Chen, S.Y.; Wang, X.Y.; Guo, H.; Xie, P.Y.; Sirelkhatim, A.M. Spatial and Temporal Adaptive Gap-Filling Method Producing Daily Cloud-Free NDSI Time Series. IEEE J. Sel. Top. Appl. Earth Obs. Remote Sens. 2020, 13, 2251–2263. [Google Scholar] [CrossRef]
- Wang, X.Y.; Chen, S.Y.; Wang, J. An Adaptive Snow Identification Algorithm in the Forests of Northeast China. IEEE J. Sel. Top. Appl. Earth Obs. Remote Sens. 2020, 13, 5211–5222. [Google Scholar] [CrossRef]
- Li, X.; Cheng, G.D.; Jin, H.J.; Kang, E.; Che, T.; Jin, R.; Wu, L.Z.; Nan, Z.T.; Wang, J.; Shen, Y.P. Cryospheric change in China. Glob. Planet Change 2008, 62, 210–218. [Google Scholar] [CrossRef]
- Qian, A.; Yi, S.; Chang, L.; Sun, G.; Liu, X. Using GRACE Data to Study the Impact of Snow and Rainfall on Terrestrial Water Storage in Northeast China. Remote Sens. 2020, 12, 4166. [Google Scholar] [CrossRef]
- Sun, X.Z.; Sun, Z.B.; Luo, Y. Characteristics of snowfall from 1960 to 2005 in northeast China. J. Meteorol. Environ. 2010, 26. [Google Scholar]
- Riggs, G.A.; Hall, D.K.; Román, M.O. MODIS Snow Products Collection 6 User Guide; National Snow and Ice Data Center: Boulder, CO, USA, 2015. [Google Scholar]
- Xu, W.; Ma, H.; Wu, D.; Yuan, W. Assessment of the Daily Cloud-Free MODIS Snow-Cover Product for Monitoring the Snow-Cover Phenology over the Qinghai-Tibetan Plateau. Remote Sens. 2017, 9, 585. [Google Scholar] [CrossRef] [Green Version]
- Zhang, H.B.; Zhang, F.; Zhang, G.Q.; Che, T.; Yan, W.; Ye, M.; Ma, N. Ground-based evaluation of MODIS snow cover prod uct V6 across China: Implications for the selection of NDSI threshold. Sci. Total Environ. 2019, 651, 2712–2726. [Google Scholar] [CrossRef] [PubMed]
- Wang, X.; Wu, C.; Wang, H.; Gonsamo, A.; Liu, Z. No evidence of widespread decline of snow cover on the Tibetan Plateau over 2000–2015. Sci. Rep. 2017, 7, 14645. [Google Scholar] [CrossRef] [PubMed]
- Wang, J.-F.; Li, X.-H.; Christakos, G.; Liao, Y.-L.; Zhang, T.; Gu, X.; Zheng, X.-Y. Geographic detectors-based health risk assessment and its application in the neural tube defects study of the Heshun region, China. Int. J. Geogr. Inf. Sci. 2010, 24, 107–127. [Google Scholar] [CrossRef]
- Wei, W.; Guo, Z.C.; Zhou, L.; Xie, B.B.; Zhou, J.J. Assessing environmental interference in northern China using a spatial dis tance model: From the perspective of geographic detection. Sci. Total Environ. 2020, 709, 136170. [Google Scholar] [CrossRef]
- Cohen, J. Statistical Power Analysis for the Behavioral Sciences, 2nd ed.; Lawrence Erlbaum Associates: Hillsdale, NJ, USA, 1988; p. 83. [Google Scholar]
- Ye, K.H. Interannual variability of March snow mass over Northern Eurasia and its relation to the concurrent and preceding surface air temperature, precipitation and atmospheric circulation. Clim. Dyn. 2019, 52, 2813–2836. [Google Scholar] [CrossRef]
- Zhong, X.Y.; Zhang, T.J.; Kang, S.C.; Wang, K.; Zheng, L.; Hu, Y.T.; Wang, H.J. Spatiotemporal variability of snow depth across the Eurasian continent from 1966 to 2012. Cryosphere 2018, 12, 227–245. [Google Scholar] [CrossRef] [Green Version]
- Litaor, M.I.; Williams, M.; Seastedt, T.R. Topographic controls on snow distribution, soil moisture, and species diversity of herbaceous alpine vegetation, Niwot Ridge, Colorado. J. Geophys. Res.-Biogeosci. 2008, 113. [Google Scholar] [CrossRef] [Green Version]
- Qiao, D.; Wang, N. Relationship between Winter Snow Cover Dynamics, Climate and Spring Grassland Vegetation Phenology in Inner Mongolia, China. ISPRS Int. J. Geo-Inf. 2019, 8, 42. [Google Scholar] [CrossRef] [Green Version]
- Jost, G.; Weiler, M.; Gluns, D.R.; Alila, Y. The influence of forest and topography on snow accumulation and melt at the wa tershed-scale. J. Hydrol. 2007, 347, 101–115. [Google Scholar] [CrossRef]
- Qin, D.H.; Liu, S.Y.; Li, P.J. Snow cover distribution, variability, and response to climate change in western China. J. Clim. 2006, 19, 1820–1833. [Google Scholar]
- Hantel, M.; Ehrendorfer, M.; Haslinger, A. Climate sensitivity of snow cover duration in Austria. Int. J. Climatol. 2000, 20, 615–640. [Google Scholar] [CrossRef]
- Li, L.-Y.; Ke, C.-Q. Analysis of spatiotemporal snow cover variations in Northeast China based on moderate-resolution-imag ing spectroradiometer data. J. Appl. Remote Sens. 2014, 8, 084695. [Google Scholar] [CrossRef]


| Value | Attributes | Value | Attributes |
|---|---|---|---|
| 0–100 | NDSI_Snow_Cover | 239 | ocean |
| 200 | missing data | 250 | cloud |
| 201 | no decision | 254 | detector saturated |
| 211 | night | 255 | fill |
| 237 | inland water |
| MODIS | |||
|---|---|---|---|
| Snow | Snow-Free | ||
| Truth | snow | a | b |
| snow-free | c | d | |
| Time | OA | UE | OE |
|---|---|---|---|
| 1 October 2013–30 April 2014 | 0.95 | 0.03 | 0.02 |
| 1 October 2014–30 April 2015 | 0.94 | 0.05 | 0.01 |
| 1 October 2015–30 April 2016 | 0.92 | 0.06 | 0.03 |
| 1 October 2016–30 April 2017 | 0.94 | 0.04 | 0.02 |
| 1 October 2017–30 April 2018 | 0.93 | 0.05 | 0.02 |
| SCD | SCOD | SCED | ||||
|---|---|---|---|---|---|---|
| Slope | R2 | Slope | R2 | Slope | R2 | |
| Northeast China | 10.2 | 0.97 | −3.82 | 0.89 | 5.41 | 0.96 |
| Nonforested areas | 7.8 | 0.76 | −3.41 | 0.74 | 4.12 | 0.71 |
| Forested areas | 5.41 | 0.98 | −2.02 | 0.93 | 2.91 | 0.97 |
Publisher’s Note: MDPI stays neutral with regard to jurisdictional claims in published maps and institutional affiliations. |
© 2022 by the authors. Licensee MDPI, Basel, Switzerland. This article is an open access article distributed under the terms and conditions of the Creative Commons Attribution (CC BY) license (https://creativecommons.org/licenses/by/4.0/).
Share and Cite
Guo, H.; Wang, X.; Guo, Z.; Chen, S. Assessing Snow Phenology and Its Environmental Driving Factors in Northeast China. Remote Sens. 2022, 14, 262. https://doi.org/10.3390/rs14020262
Guo H, Wang X, Guo Z, Chen S. Assessing Snow Phenology and Its Environmental Driving Factors in Northeast China. Remote Sensing. 2022; 14(2):262. https://doi.org/10.3390/rs14020262
Chicago/Turabian StyleGuo, Hui, Xiaoyan Wang, Zecheng Guo, and Siyong Chen. 2022. "Assessing Snow Phenology and Its Environmental Driving Factors in Northeast China" Remote Sensing 14, no. 2: 262. https://doi.org/10.3390/rs14020262
APA StyleGuo, H., Wang, X., Guo, Z., & Chen, S. (2022). Assessing Snow Phenology and Its Environmental Driving Factors in Northeast China. Remote Sensing, 14(2), 262. https://doi.org/10.3390/rs14020262