Abstract
In this study, we analyze the accuracy of the stellar occultation technique to detect the oxygen number density and temperature in near space. Based on the validation of the algorithm related to stellar occultation using a single wavelength of 762 nm, the simulation and inversion are performed using the oxygen absorption A-band, and the results are compared with SABER observations to calculate the deviation. Then, the distribution of the detection accuracy with wavelength, latitude, and altitude is analyzed. The results show that the radiant transmittance of the basic observation varies significantly with wavelength and altitude, and it is not sensitive to a change of latitude. The inversion results of each wavelength at different latitudes can be combined, and it can be seen that the 754–769 nm band is preferred for oxygen and temperature detection. Therefore, analyzing the accuracy results of the specific wavelength 757.84 nm at different latitudes, the temperature accuracy can reach 0.1 K in the stratosphere at both low and high latitudes and 0.6–34 K at middle latitudes. The temperature detection accuracy in the mesosphere at each latitude reaches about a dozen K. The deviation of the inversion results at middle latitudes is larger in the thermosphere, and at the other two latitudes, it is about a few dozen K. From the analysis of relative deviation, excluding the deviation of 95–100 km, the deviation of other altitudes is within the ideal range, and the minimum can reach 0. The accuracy of the oxygen number density increases with latitude, and the relative deviation of the middle and high latitudes is around 10–20%. Based on the above results, it is concluded that the technique of starlight occultation exhibits high accuracy for detecting atmospheric parameters in the near space region, and the results lay the technical foundation for the independent development of stellar occultation.
1. Introduction
Near space [1] refers to the area between 20 km and 100 km from the ground. The top of the region is connected to the bottom of the ionosphere with low electron density. The latest research shows that the temperature, composition, and gravity wave propagation in near space [1] are considered to be the possible causes of various ionospheric phenomena. Its bottom relates to the earth’s lower atmosphere. The disturbance of the lower atmosphere can transfer energy and momentum to the region [2]. Additionally, it is affected by the meteorological processes and various atmospheric fluctuation processes in the lower atmosphere [3,4].
The measurement of temperature and atmospheric density can be used to understand the temperature structure, disturbance, energy upload, stratospheric explosive warming, and atmospheric radiation disturbance in near space [5]. In addition, the causes of ionospheric plasma bubbles, occasional E-layers, and traveling ionospheric disturbances can also be studied and correlated to the problems of the whole atmospheric system. Based on the above analysis, the detection of atmospheric parameters in near space is of great significance.
At present, there are relatively few means of atmospheric detection in near space, including meteor radar, intermediate frequency radar, rockets, etc. The existing detection methods face the shortcomings of poor height, time continuity, high cost, and great weather restrictions. Therefore, this study proposes using stellar occultation detection technology [6] to obtain the oxygen number density profile and temperature profile of near space. The advantages of this technology include global coverage, high precision, and high continuity [7,8]. Among them, oxygen, which is a constant component, allows us to obtain a panoramic image of the atmospheric density, as well as the temperature distribution, in near space.
Sun Mingchen et al. used the 762 nm single-wavelength atmospheric radiation transmittance to detect the oxygen number density and compared it with the MSISE-00 model; the results have high internal consistency [9]. Based on the algorithm model introduced in that article, in order to quantitatively calculate the detection accuracy of oxygen density and temperature in near space, this study proposes the oxygen absorption A-band 754–774 nm to invert the oxygen density and temperature, and it compares them with the SABER (Sounding of the Atmosphere using Broadband Emission Radiometry) [10] measurement results to calculate the accuracy dependent on the wavelength, latitude, and height. Among them, this absorption band is relatively pure and free from the interference of other absorption components.
The main work includes: 1. Calculating the transmittance of oxygen absorption bands and analyzing the characteristics of transmittance with wavelength as well as altitude, using the currently developed stellar occultation event simulation [11] and forward model [12]; 2. Calculating the absolute and relative deviation distributions of oxygen density and temperature obtained by the onion-peeling method [13,14] at different wavelengths at different latitudes, using the transmittance results and data inversion model. It also involves analyzing the wavelength dependence of the accuracy distribution; 3. Based on the results of each wavelength analysis, the wavelength with good results is selected for the single-spectrum inversion accuracy analysis. The process then involves calculating the latitude and height dependence of the inversion results at the same wavelength.
2. Simulation Methodology
The basic observed quantity of stellar occultation is the transmittance, T, which is related to Equation (1), where is the optical depth, is the absorption cross-section, is the density of the atmospheric composition, and s is the light-transmission path during an occultation event. In addition, this physical quantity is related to temperature. "Occultation event” means that a star is the signal source, and its position remains unchanged during an event time. When the observed star and the LEO (low Earth orbit) satellite are moving on the two sides of the earth’s atmosphere, the light is emitted by the star on the earth’s side. Through the absorption, scattering, and refraction of the earth’s atmosphere, this leads to the absorption characteristics of the atmospheric components at a specific location. Then, the LEO satellite receives the spectrum on the other side of the earth, which constitutes the occultation observation. With the LEO satellite continuously moving along the orbit and observing different target stars, completing a top-down or bottom-up scan of the earth’s atmosphere, the event is called an occultation event [11]. From the radiative transfer equation, the simulation of the transmittance requires the calculation of the absorption cross-section, as well as the specific path of the light in the occultation event, which contains the latitude, longitude, and tangent height distribution of the event.
Under the condition of LEO satellite, the stellar occultation events in different latitudes of near space are simulated. Using the occultation distribution results, the ray path of the occultation event in a vacuum atmosphere is calculated using the three-dimensional ray-tracing method [13]. That is, atmospheric patterns, time, frequency, occultation type, and Earth shape need to be input, and a targeting method is used to simulate and output the light path. Combined with the HITRAN spectrum library, the atmospheric transmittance of 754–774 nm at the low latitude is calculated, as shown in Figure 1. It is worth noting that the wavelength represented by each color in the figure is applicable to the full text.
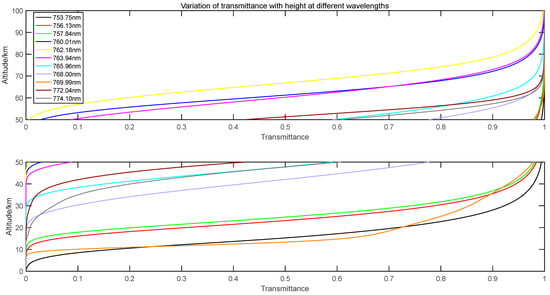
Figure 1.
Variation of transmittance of 11 wavelengths at a low latitude in near space. The specific wavelengths were determined according to the HITRAN database. To better observe the altitude coverage of each wavelength transmittance, especially below 20 km and above 60 km, it is divided into two maps, with 50 km as the limit.
We analyzed the variation of the simulated transmittance of different wavelengths from the ground to 100 km in Figure 1. The transmittance of all wavelengths changes in the range of 0–1, and the trend increases with an increase in height. However, the sensitivity of different wavelengths at the same height is different. The closer the transmittance is to 0 or 1, the less it can reflect the change of atmospheric component content. Among them, 753.75 nm, 756.13 nm, and 757.84 nm can retrieve the change of height close to the ground; 760.02 nm, 762.18 nm, 763.94 nm, and 765.96 nm can detect approximately 100 km. However, they can cover the entire 20–100 km area of near space.
In this study, the onion-peeling method [9] is used to retrieve the oxygen number density. We assume that the earth’s atmosphere is locally circularly symmetrical, and the satellite orbits are circular orbits that can stratify the earth’s atmosphere. The principal diagram of the stratification of the earth’s atmosphere, as well as the inversion, is shown in Figure 2.
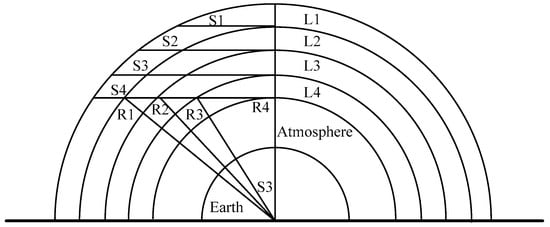
Figure 2.
The principal diagram of the stratification of the earth’s atmosphere, as well as the inversion. The number of observations is equal to the number of layers in the atmosphere.
L1:
L2:
L3:
To obtain the recursive formula for each layer,
where is optical depth, is the ray path, is the orbital radius, and is the oxygen molecular density. The oxygen absorption cross-section is calculated using the line-by-line integration method [15]. The results are shown in Figure 3.
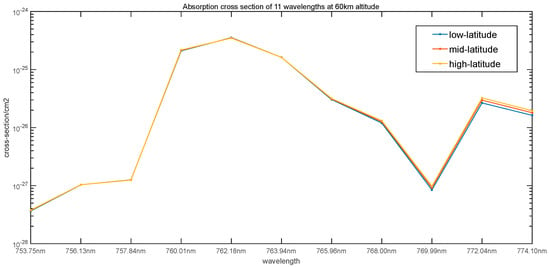
Figure 3.
The absorption cross-sections of different wavelengths at 60 km tangent height at different latitudes of low, middle, and high are shown in the figure. The absorption cross-section hardly varies with latitude but changes greatly with the wavelength, of which around 762 nm has a strong absorption line.
The results of the oxygen inversion are shown in Figure 4.
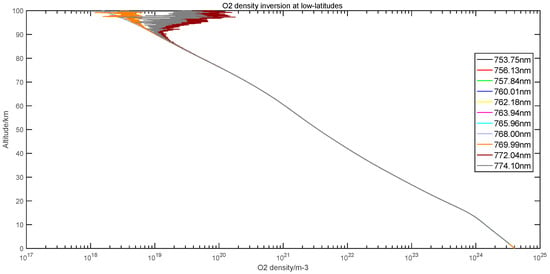
Figure 4.
Inversion results of oxygen number density at different wavelengths.
We found strong consistency in the inversion of 11 wavelengths below 85 km. At the altitude of 85–100 km, the inversion results of each wavelength show different trends. Among them, the inversion results of 769.99 nm, 772.04 nm, and 774.10 nm show a trend of increasing with height, and the inversion results of other wavelengths decrease with height.
At a height below 100 km, that is, in the homogeneous layer, the atmosphere is evenly mixed, and the interaction between different atmospheric components is not considered. Under the action of molecular diffusion, the density profile of atmospheric components is controlled by the scale height, which is related to the atmospheric temperature. Under the condition of static equilibrium and the ideal gas equation of the state, the oxygen density and temperature meet the following relationship, as shown in Formula (6):
where is the atmospheric temperature, H is the scale height, and is the Boltzmann constant. At this time, the height temperature profile of near space can be obtained as shown in Figure 5.
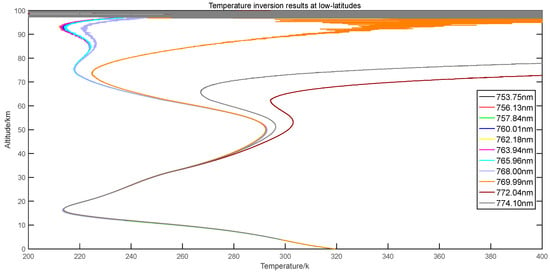
Figure 5.
Temperature inversion results at different wavelengths.
At present, the existing temperature distribution results show that [16], in low latitudes, from the ground to the troposphere of approximately 17 km, the temperature decreases with the increasing altitude. The temperature increases when the height reaches approximately 55 km. When the stratospheric top reaches 85 km, the temperature drops rapidly. From the top of the middle layer to the hot layer, the temperature rises. By analyzing the temperature inversion results, it is found that the inversion profiles of all wavelengths almost show this trend, but they show obvious differences in the middle layer, especially at 769–774 nm. The temperature begins to rise gently at approximately 65 km and 72 km, respectively. Other wavelengths show good agreement with the existing results.
3. Analysis of Error Results
The broadband radiometer SABER sounding data are used to verify the inversion results. The TIMED satellite (Thermosphere, Ionosphere, Mesosphere Energetics and Dynamics), launched in July 2001, is used to study the influence of the sun and the lower thermosphere/ionosphere (MLTI). The instrument SABER, carried on TIMED, detects the atmospheric composition and temperature in the MLTI in detail.
SABER has 10 channels and uses edge scanning to measure 15 µm and 4.3 µm CO2 edge infrared radiation to retrieve parameters, such as atmospheric temperature and composition. It scans the horizon once every 58 s to obtain data from the surface to 180 km. During the day, SABER covers 15 longitude bands. The data have high reliability [17,18] and wide coverage. The superposition of temperature random error and systematic error is ±1.4 K in the lower stratosphere, ±1 K in the middle stratosphere, and ±2 K in the upper stratosphere and middle stratosphere.
3.1. Analysis of Inversion Results of Low-Latitude Density and Temperature
Taking the data obtained on 1st October 2008 as an example, the detected altitude range is approximately 14–100 km. The specific method is to screen the detection data corresponding to the simulation latitude, take the daily average value (SABER has 15 daily temperature profile data points), and interpolate the vertical height of the measured data according to the simulation tangent height, with a height interval of 60 m. For each fixed height, one must calculate the difference between the measured data and the simulation data. In this study, the measured data minus the simulation data is used as the absolute deviation, and the relative deviation is calculated using Formula (7):
where, is the measured oxygen number density, is simulation 1, is the absolute deviation of density, and is the relative deviation. is the measured temperature, is the simulation inversion temperature, is the absolute deviation of temperature, and is the relative deviation of temperature.
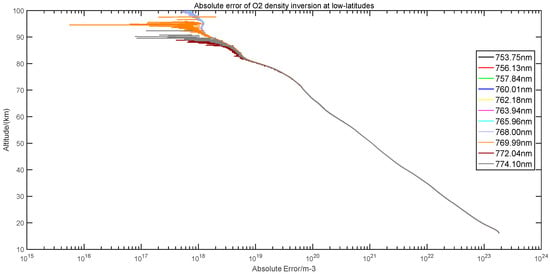
Figure 6.
Absolute deviation of oxygen number density retrieved by different wavelengths.
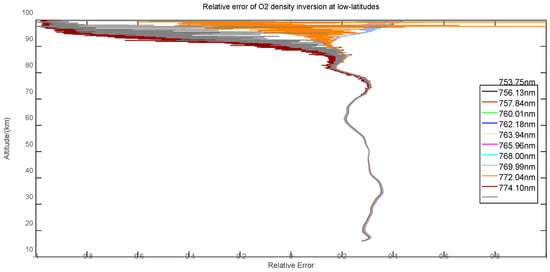
Figure 7.
Relative deviation of oxygen number density retrieved by different wavelengths.
By analyzing the absolute deviation, it is found that the inversion results of all wavelengths decrease with height. At the altitude of 85–100 km, the absolute deviation of 769.99–774 nm is lower than that of other wavelengths, and the results of other wavelengths are the same. The relative deviation results are as follow: the maximum deviation is approximately 30% at 14–95 km, and the deviation is large at 95–100 km. The causes of deviation are as follows: (1) SABER’s own detection data error; (2) The number density of measured oxygen is obtained from the atmospheric density 0.21. As the proportion of oxygen is not completely fixed with the increase in height, there is a large deviation of approximately 100 km; (3) The error of the onion-peeling method in inversion; (4) The MSISE-00 (Mass Spectrometer and Incoherent Scatter Radar Extended) atmospheric model data used in the simulation process produces errors. This model describes the neutral atmospheric density, temperature, and other atmospheric physical properties from the ground to the thermosphere and is one of the most widely used atmospheric models at present. The simulation data do not fully consider the influence of space weather, such as solar activity, but the simulation results in a relatively ideal environment.
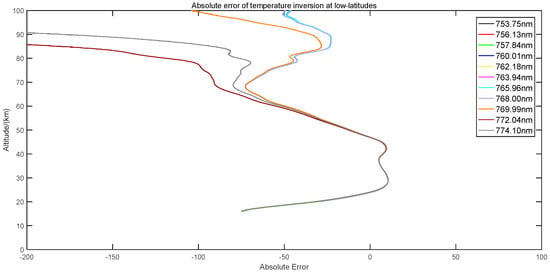
Figure 8.
Absolute deviation of temperature inversion results at different wavelengths.
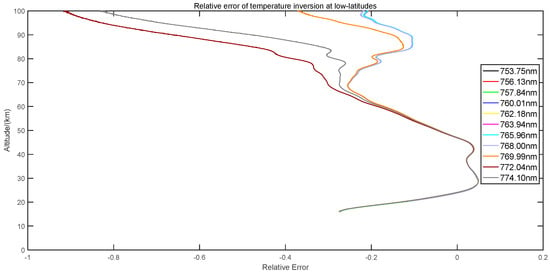
Figure 9.
Relative deviation of temperature inversion results at different wavelengths.
By analyzing the absolute and relative deviation distributions in the figures, the maximum absolute deviation at a low altitude of 14–20 km is approximately 70 K, and the corresponding relative deviation is 27%. Analyzing this is not within the scope of this research. With an increase in height, the deviation decreases. At 20–50 km, the maximum relative deviation is 15%, the minimum is 0, and the minimum accuracy is 0.15 K. At the height of 50–100 km, the relative deviation of 753–768 nm is within 13–20%, and the minimum accuracy is approximately 20 K. The relative deviation of other wavelengths is too large, which means that the detection accuracy is low.
The reasons for the above relative deviations are as follow: (1) SABER temperature detection error, including the impact of actual detection conditions on temperature; (2) It has been found that the detection accuracy is high when the temperature shows an increasing trend, or under a decreasing trend, the change speed is fast, and the detection accuracy is high; (3) The value of the upper-boundary temperature in the inversion process. In this paper, the value of the upper-boundary temperature is the measured data at 100 km, which has a certain error; (4) Because the temperature inversion result is obtained indirectly through the inversion result of oxygen number density, the error is accumulated.
3.2. Analysis of Relative Deviation between Oxygen Number Density and Temperature in Middle and High Latitudes
The accuracy results of 11 wavelengths at middle and high latitudes are analyzed by the same method. This study only gives the relative deviation of temperature and oxygen number density as shown in the Figure 10.
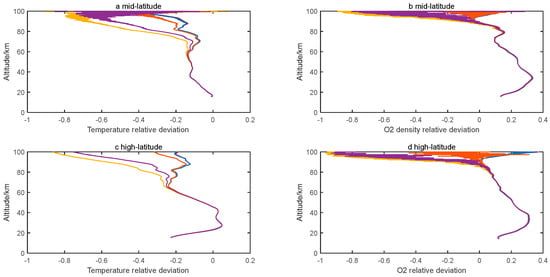
Figure 10.
(a) Relative deviation of middle latitude temperature; (b) Relative deviation of oxygen number density at middle latitude; (c) Relative deviation of high-latitude temperature; and (d) Relative error of oxygen number density at high latitude. The wavelength represented by each color in the figure is consistent with the previous illustration, so it will not be repeated here.
Comparing the relative deviation of temperature at middle and high latitudes in Figure 10a and Figure 10c, the variation trend of deviation results at different wavelengths is consistent with that at low latitudes.
In addition, analyzing the error results for the first eight wavelengths, there is a great difference between the two below 20 km. The minimum deviation of the former is 0, and the deviation increases with the height, while the maximum deviation of the latter is 20% and decreases with the height. The deviation of 20–60 km is within 10%. Above 60 km, the deviation of the latter is 10–20%, and the error of the former is too large at the height of 95–100 km. The comparison results show that, except for the tropospheric height, the detection accuracy of temperature at different latitudes is close. Because the detection area considered in this paper is near space, the inversion results of the troposphere can be ignored.
3.3. Accuracy Analysis of Different Latitudes at the Same Wavelength
According to the analysis results presented in Section 2, we know that the inversion results of the 753–764 nm band are very close. Therefore, we choose one wavelength that can cover the height of near space and analyze the change of the results with latitude to obtain the detection accuracy of stellar occultation at different latitudes as shown in the Figure 11.
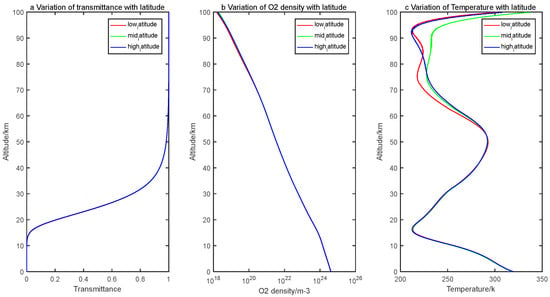
Figure 11.
Inversion results of transmittance (a), oxygen number density (b), and temperature (c) at 757.84 nm at low latitude, middle latitude, and high latitude, respectively.
An analysis of Figure 11a shows, that for the same wavelength, the transmittance at different latitudes changes little and almost overlaps, indicating that the transmittance has little dependence on latitude. The inversion result of oxygen number density in Figure 11b also shows the same phenomenon. However, in comparison, the inversion results of temperature in Figure 11c are very different, especially at the altitude range of 55–100 km, but the changing trend is the same. We quantitatively analyze the accuracy differences of different latitudes by calculating the absolute and relative deviations as shown in Figure 12.
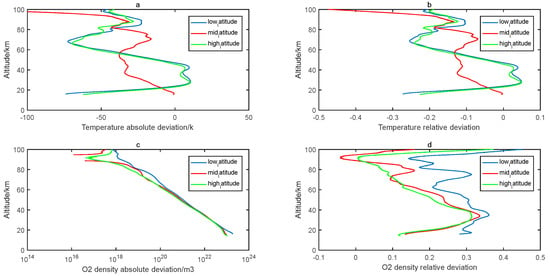
Figure 12.
Absolute and relative deviations of temperature in (a) and (c) respectively. Absolute and relative deviations of oxygen number density at different latitudes in (b) and (d) respectively.
The above results are compared and calculated according to the measured data of SABER. By analyzing Figure 12a, it is found that the absolute deviation of temperature at the three latitudes shows different changes. The deviation at the low and high latitudes gradually decreases at approximately 20–38 km, with a minimum of 0.1 K. The temperature deviation at the middle latitude increases gradually, with a minimum of 0.6 K and a maximum of 34 K. At approximately 38–50 km, the middle latitude deviation is approximately 30 K, and other latitude deviations are within 3–5 K. At approximately 50–70 km, the middle-latitude deviation first increases and then decreases, by approximately 16–30 K. The deviation of the other latitudes first increases and then decreases, with a maximum of approximately 50 K and a minimum of more than 10 K. According to the data, 70–100 km shows a decreasing trend. The maximum accuracy of low and high latitudes is approximately 40 K, and the inversion accuracy of middle latitudes at higher altitudes is relatively low, with a maximum accuracy of 100 K.
By analyzing the relative deviation of temperature in Figure 12b, it is found that the result of the middle latitude is within 0–15% at 14–90 km, 16–25% at 90–95 km, and 40% at 95–100 km. The deviation of low and high latitudes is approximately 10–20% in the range of 14–20 km and 60–100 km, and the deviation of 20–60 km is 0–10%.
Analyzing the absolute deviation of oxygen number density in Figure 12c, the absolute deviation at 14–20 km altitude is consistent with middle and high latitudes, and the variation at low latitudes is large. At approximately 20–60 km, the absolute error results of the three latitudes have little difference: approximately 60–80 km, showing the same change trend as 14–20 km. The absolute deviation of the three latitudes of 80–100 km is different, with the largest at the middle latitude and the smallest at the low latitude.
By analyzing the relative error in Figure 12d, it is found that below 80 km, the relative deviation in high latitude is the smallest, mainly concentrated in 10–20%, reaching approximately 30% at approximately 38 km. The trend of relative deviation at the middle latitude is consistent with that at the high latitude, but the relative deviation range is 0–16% in the range of 80–100 km, and the error of inversion result at the high latitude reaches 40% at 100 km. The main variation range of relative error at the low latitude is approximately 20–30%.
4. Conclusions
This study analyzed the detection accuracy of stellar occultation and used the oxygen absorption A-band to detect the oxygen and temperature in near space with high accuracy. At present, there exist GOMOS (Global Ozone Monitoring by Occultation of Stars) and GOLD (Global-scale Observations of the Limb and Disk), which detect oxygen by stellar occultation; the detection heights are 15–100 km and 150–230 km, respectively. Since the former officially indicates that the oxygen results are unavailable, and the latter’s detection altitude and band are inconsistent with this study, this study chooses SABER to compare the oxygen detection results with the simulation results.
Based on the above results of the analysis of the accuracy distribution characteristics, this study can lay the technical foundation for the realization of stellar occultation technology, and it is also an important part of promoting the formation of the development of the technology’s instrumentation.
Author Contributions
Conceptualization, M.S. and X.D.; methodology, M.S.; software, X.C.; validation, M.S., Q.Z. and X.D.; formal analysis, M.S.; investigation, H.W.; resources, J.W.; data curation, M..S.; writing—original draft preparation, M.S.; writing—review and editing, X.D.; visualization, X.C.; supervision, Q.Z.; project administration, X.D.; funding acquisition, Q.Z. All authors have read and agreed to the published version of the manuscript.
Funding
This research was funded by Spaceborne Multi-Means Joint Detection Technology grant number A132202069 and Environmental Monitoring Technology for Radiowave Propagation of Multiple External Radiation Sources on Satellites grant number 332103Y13. The APC was funded by the Spaceborne Multi-Means Joint Detection Technology. This research was also supported by the Strategic Priority Research Program of the Chinese Academy of Sciences (Grant No. XDA17010301) and the National Natural Science Foundation of China (Grant No. 42174192).
Data Availability of Statement
Not applicable.
Conflicts of Interest
The authors declare no conflict of interest.
References
- Xiao, C.Y. Researches on the Dynamics of the Atmosphere in Near Space. Ph.D. thesis, Graduate University of Chinese Academy of Sciences, Beijing, China, 2009. [Google Scholar]
- Nappo, C.J. An Introduction to Atmospheric Gravity Waves; Academic Press: Cambridge, MA, USA, 2012. [Google Scholar]
- John, S.R.; Kumar, K.K. TIMED/SABER observations of global gravity wave climatology and their interannual variability from stratosphere to mesosphere lower thermosphere. Clim. Dyn. 2012, 39, 1489–1505. [Google Scholar] [CrossRef]
- Yue, J.; Miller, S.D.; Hoffmann, L.; StrakaIII, W.C. Stratospheric and mesospheric concentric gravity waves over Tropical Cyclone Mahasen: Joint AIRS and VIIRS satellite observations. J. Atmos. Sol.-Terr. Phys. 2014, 119, 83–90. [Google Scholar] [CrossRef]
- Shi, G.C.; Hu, X.; Yao, Z.G.; Guo, W.J.; Sun, M.C.; Gong, X.Y. Case study on stratospheric and mesospheric concentric gravity waves generated by deep convection. Earth Planet. Phys. 2021, 5, 79–89. [Google Scholar] [CrossRef]
- Yamashita, C.; Liu, H.L.; Chu, X.Z. Responses of mesosphere and lower thermosphere temperatures to gravity wave forcing during stratospheric sudden warming. Geophys. Res. Lett. 2010, 37, L09803. [Google Scholar] [CrossRef]
- Mingchen, S.; Cui, T.; Xiong, H.; Xiaoyan, G.; Wenjie, G. Preliminary application of stellar occultation in the near-space. Infrared Laser Eng. 2019, 48, 290–298. (in Chinese). [Google Scholar]
- Bertaux, J.L.; Hauchecorne, A.; Dalaudier, F.; Cot, C.; Kyrölä, E.; Fussen, D.; Tamminen, J.; Leppelmeier, G.W.; Sofieva, V.; Hassinen, S.; et al. First results on GOMOS/ENVISAT. Adv. Space Res. 2004, 33, 1029–1035. [Google Scholar] [CrossRef]
- Bertaux, J.L.; Kyrölä, E.; Fussen, D.; Hauchecorne, A.; Dalaudier, F.; Sofieva, V.; Tamminen, J.; Vanhellemont, F.; Fanton d’Andon, O.; Barrot, G.; et al. Global ozone monitoring by occultation of stars: An overview of GOMOS measurements on ENVISAT. Atmos. Chem. Phys. 2010, 10, 12091–12148. [Google Scholar] [CrossRef]
- Sun, M.C.; Zhu, Q.L.; Dong, X.; Wu, J.J. Analysis of inversion error characteristics of stellar occultation simulation data. Earth Planet. Phys. 2022, 6, 61–69. [Google Scholar] [CrossRef]
- Mertens, C.J.; Russell, J.M., III; Mlynczak, M.G.; She, C.-Y.; Schmidlin, F.J.; Goldberg, R.A.; López-Puertas, M.; Wintersteiner, P.P.; Picard, R.H.; Winick, J.R.; et al. Kinetic temperature and carbon dioxide from broadband infrared limb emission measurements taken from the TIMED/SABER instrument. Adv. Space Res. 2009, 43, 15–27. [Google Scholar] [CrossRef]
- Sun, M.C.; Wu, X.C.; Hu, X. Analysis of simulation results of orbit observation of stellar occultation technology. Spectrosc. Spectr. Anal. 2020, 40, 15. [Google Scholar]
- Sun, M.C.; Wu, X.C.; Hu, X.; Gong, X.Y. Transmittance simulation calculation based on 3D ray tracing and HITRAN database. Spectroscopy and Spectral Analysis. Spectrosc. Spectr. Anal. 2020, 40, 2092–2097. [Google Scholar]
- Kyrölä, E.; Tamminen, J.; Sofieva, V.; Bertaux, J.L.; Hauchecorne, A.; Dalaudier, F.; Fussen, D.; Vanhellemont, F.; Fanton d’Andon, O.; Barrot, G.; et al. Retrieval of atmospheric parameters from GOMOS data. Atmos. Chem. Phys. 2010, 10, 11881–11903. [Google Scholar] [CrossRef]
- Yee, J.H. Atmospheric remote sensing using a combined extinctive and refractive stellar occultation technique 1. Overview and proof-of-concept observations. J. Geophys. Res. 2002, 107, ACH-15. [Google Scholar] [CrossRef]
- Zhang, H.; Shi, G.Y. A Fast and Efficient Line-By-Line Calculation Method for Atmospheric Absorption. Chin. J. Atmos. Sci. 2000, 24, 111–121. [Google Scholar]
- Yigit, E.; Medvedev, A.S. Internal wave coupling processes in Earth’s atmosphere. Adv. Space Res. 2015, 55, 983–1003. [Google Scholar] [CrossRef]
- Guharaya, A.; Nath, D.; Pant, P.; Pande, B.; Russell, J.M., III; Pandey, K. Middle atmospheric thermal structure obtained from Rayleigh lidar and TIMED/SABER observations: A comparative study. J. Geophys. Res.-Atmos. 2009, 114, D18105. [Google Scholar] [CrossRef]
Publisher’s Note: MDPI stays neutral with regard to jurisdictional claims in published maps and institutional affiliations. |
© 2022 by the authors. Licensee MDPI, Basel, Switzerland. This article is an open access article distributed under the terms and conditions of the Creative Commons Attribution (CC BY) license (https://creativecommons.org/licenses/by/4.0/).