1. Introduction
An unmanned aerial vehicle (UAV) has excellent convenience, stability, and safety. Because of its easy operation, flexible takeoff and landing, and wide detection range, it is frequently used in forestry and crop monitoring [
1,
2,
3,
4], traffic supervision [
5], urban planning [
6], municipal management [
7,
8], transmission line inspection [
9,
10], search and rescue [
11,
12,
13], and other fields. In forestry and crop monitoring, the acquisition and analysis of farmland data is very important, as it helps growers to carry out efficient management. Examples include the precise spraying of pesticides, monitoring of tree growth, and timely harvesting of crops. Traditional methods that rely on the manual acquisition of data are time-consuming and labor-intensive, and they are prone to inaccurate data due to sampling bias and sparse measurement. A common alternative today is to use UAVs to capture the aerial imagery of farmland and then analyze the imagery to obtain the required information. Since the size of the objects in the image varies with the altitude of the UAV, the objects appear in the image at different scales. Learning efficient representations for multiscale objects is an important challenge for object detection in UAV aerial images. Because of the rapid advancement of UAV technology, onboard cameras have become increasingly capable of capturing stable, high-resolution aerial images. This helps UAVs perform search-and-rescue missions over wide search areas or areas affected by natural disasters. Analyzing a large number of acquired aerial images in a short period of time is a huge and challenging job that would be quite stressful if performed manually. Therefore, an accurate and real-time UAV target detection method is urgently needed.
Traditional detection methods [
14,
15,
16,
17,
18] traverse each image through a preset sliding window to extract features and then use a trained classifier for classification. They tend to require a lot of manpower and effort to process data, and it is difficult to uniformly set standards for features. In addition, traditional detection methods often face problems such as high time complexity, poor robustness, and strong scene dependence, which make them difficult to put into practical use. In recent years, with the continuously proposed target-detection methods based on Convolutional Neural Networks (CNNs), excellent detection results have been achieved. It has been demonstrated that these deep-learning-based algorithms are better suited for machine vision tasks. Depending on how the input image is processed, there are two types of object-detection methods: two-stage and one-stage detection. Their respective advantages can be summarized as good detection accuracy and calculation speed. Among them, R-CNN [
19], Fast R-CNN [
20], Faster R-CNN [
21], Mask R-CNN [
22], Cascade R-CNN [
23], R-FCN [
24], etc., are two-stage detection methods. DenseBox [
25], RetinaNet [
26], SSD series [
27], YOLO series [
28,
29,
30,
31,
32,
33], etc., are one-stage detection methods.
During the flight of the UAV, the mounted device will transmit the captured images in real time, and this poses a challenge to the speed of the detection method. In addition, the objects contained in the images are mainly small objects, which are characterized by occlusion, blurring, dense arrangement, and sparse distribution, and they are often submerged in complex backgrounds. Due to the aforementioned problems, it is difficult for current detection methods to accurately locate and detect targets on UAV aerial images. They still have a lot of room for improvement. In recent years, YOLO series detection methods have been widely used in the detection of targets in UAV aerial images due to their superior speed and good accuracy. Chuanyang Liu et al. [
10] proposed MTI-YOLO for targets such as insulators in power line inspection using UAVs. On the basis of YOLOv3-Tiny, MTI-YOLO expands the neck by adding a feature-fusion structure and SPP modules. It also adds the output layers of the backbone. The improvement of this method in the neck is relatively redundant, and the structure of the network needs to be optimized. Oyku Sahin et al. [
34] analyzed the challenging problems in UAV aerial images. They extended the output layer of the backbone of YOLOv3 to detect objects of different scales in the image, increasing the original three detection layers to five. Such a structure plays a certain role in the feature-fusion part. However, this leads to overly large and complex detection models, thus increasing the cost of training and computation. Junos et al. [
35] produced a UAV aerial imagery dataset targeting oil palm fruit. Based on YOLOv3-Tiny, they proposed a target-detection method for oil palm fruit. The method uses a densely connected neural network and Swish activation functions and adds a new detection layer. The activation function selected by this model is prone to performance degradation in deep networks, and the added feature layer undoubtedly slows down the detection speed of the model. Jia GUO et al. [
9] proposed an improved YOLOv4 detection method for small targets such as anti-vibration hammers in transmission lines in UAV aerial images. To improve the ability of the network to extract features, the method adds Receptive Field Block (RFB) modules in the neck. In the proposed method, there is a lack of discussion on the location of adding modules, and the improved strategy is relatively simple. Yanbo Cheng et al. [
36] proposed an improved YOLO method for image blur caused by the camera shaking during UAV aerial photography, exposure caused by uneven illumination, and noise during transmission. This method uses a variety of data-enhancement methods such as affine transformation, Gaussian blur processing, and grayscale transformation to strengthen the data preprocessing capability of the YOLOv4, which is used to alleviate the problem of difficult training due to a small amount of data. The downside is that this method lacks targeted modifications to the structure of the model itself. Based on YOLOv5, Wei Ding et al. [
7] added a Convolutional Block Attention Module (CBAM) to distinguish buildings of different heights in UAV aerial images. The backbone of the improved model enhances the feature-extraction capability, but it should be noted that the amount of computation will increase due to the addition of other modules. Xuewen Wang et al. [
37] proposed the LDS-YOLO detection method in view of the characteristics of small targets and insignificant details of dead trees in UAV aerial images. This method is improved on the basis of YOLOv5. A new feature-extraction module is constructed; the SoftPool method is introduced in the SPP module; and the traditional convolutions are replaced with depth-wise separable convolutions. This method gives a good performance. Although the depth-wise separable convolution used reduces the parameters of the model, it is easier to fail to learn the target features due to insufficient samples during training. To address the problem of the poor detection performance of damaged roads in UAV aerial images, YuChen Liu et al. [
6] presented the M-YOLO detection method. This method replaces the backbone of YOLOv5s with MobileNetv3 and introduces the SPPNet network structure, which is beneficial to improving the detection speed of the model. It should be noted that the increase in speed is often accompanied by a sacrifice in detection accuracy. Based on YOLOv5s, Rui Zhang et al. [
8] proposed a defect detection method for wind turbine blades in UAV aerial images, named SOD-YOLO. SOD-YOLO adds a small object detection layer, uses the K-Means algorithm to cluster to obtain anchor boxes, and adds CBAM modules to the neck. Furthermore, the use of a channel pruning algorithm reduces the computational cost of the model, while increasing detection speed. However, this method has not overcome the problem that the initial anchor boxes tend to be local optimal solutions due to K-Means clustering.
To summarize, when improving the model, it is important to balance the relationship between detection accuracy and computation speed. A good detection method should try to take into account the above two points. The most popular YOLO series detection method is YOLOv5, which is based on YOLOv4 and has four versions: s, m, l, and x. YOLOv5x is large in size and computationally complex. YOLOv5s and YOLOv5m are faster, but they are not accurate enough. YOLOv5l performs well in terms of speed and precision and is similar to YOLOv4 in terms of total parameters and total floating-point operations per second (FLOPS). For the above reasons, we modified YOLOv5l according to the characteristics of UAV aerial images to improve the detection performance of the model. This paper focuses on the following two points: (1) due to the abundance of small targets in UAV aerial images, there are situations such as occlusion, blur, dense arrangement, and sparse distribution, and they are often submerged in complex backgrounds. Therefore, it is essential to comprehensively improve the ability of the backbone to extract features. (2) During the flight of the UAV, the mounted device will transmit the captured images in real time, so it is necessary to pay attention to the detection speed and calculation cost of the model. The main improvement strategies in this paper are as follows:
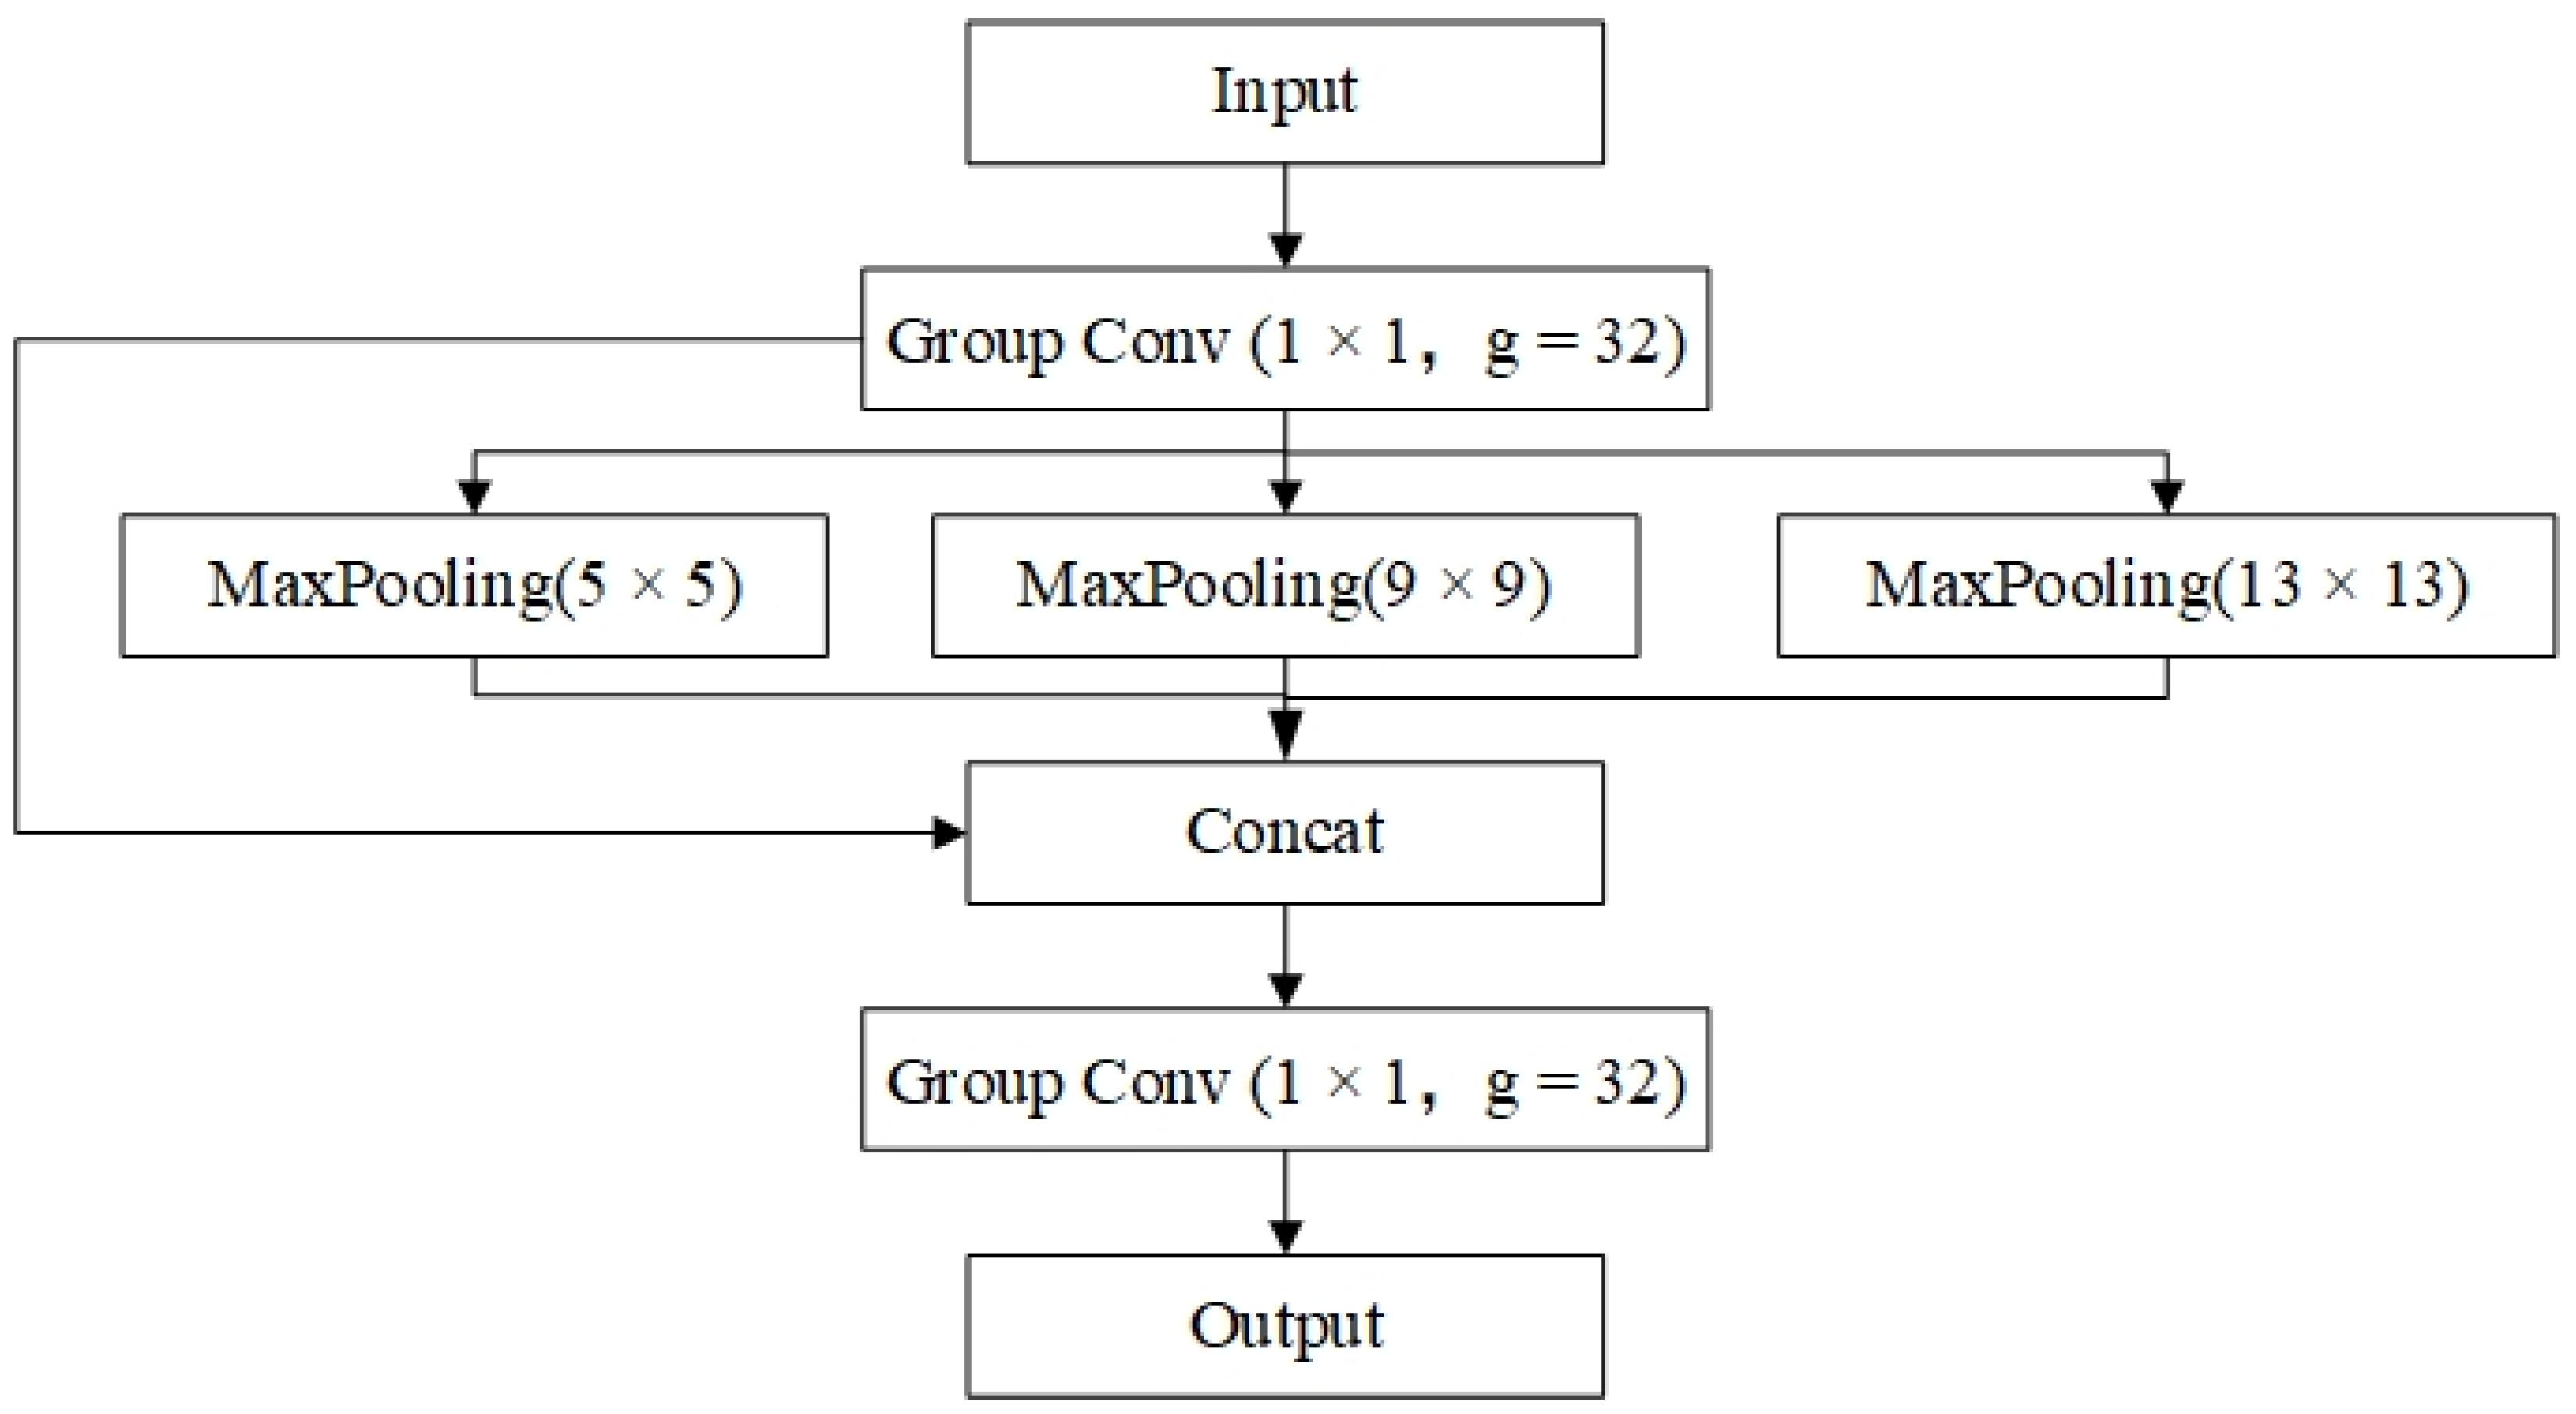
Modifications to the backbone of YOLOv5. The residual blocks in the upper, middle, and lower layers of the backbone of YOLOv5 are improved with asymmetric convolutional blocks. After the Focus module, an Improved Efficient Channel Attention (IECA) module is added. The SPP module is improved by using grouped convolutions.
Use the K-Means++ algorithm to cluster different datasets to get more accurate anchor boxes. In the postprocessing of the model, Efficient Intersection over Union (EIOU) is used as the judgment basis for non-maximum suppression (NMS). We named this new NMS method EIOU-NMS.
The rest of this paper consists of the following:
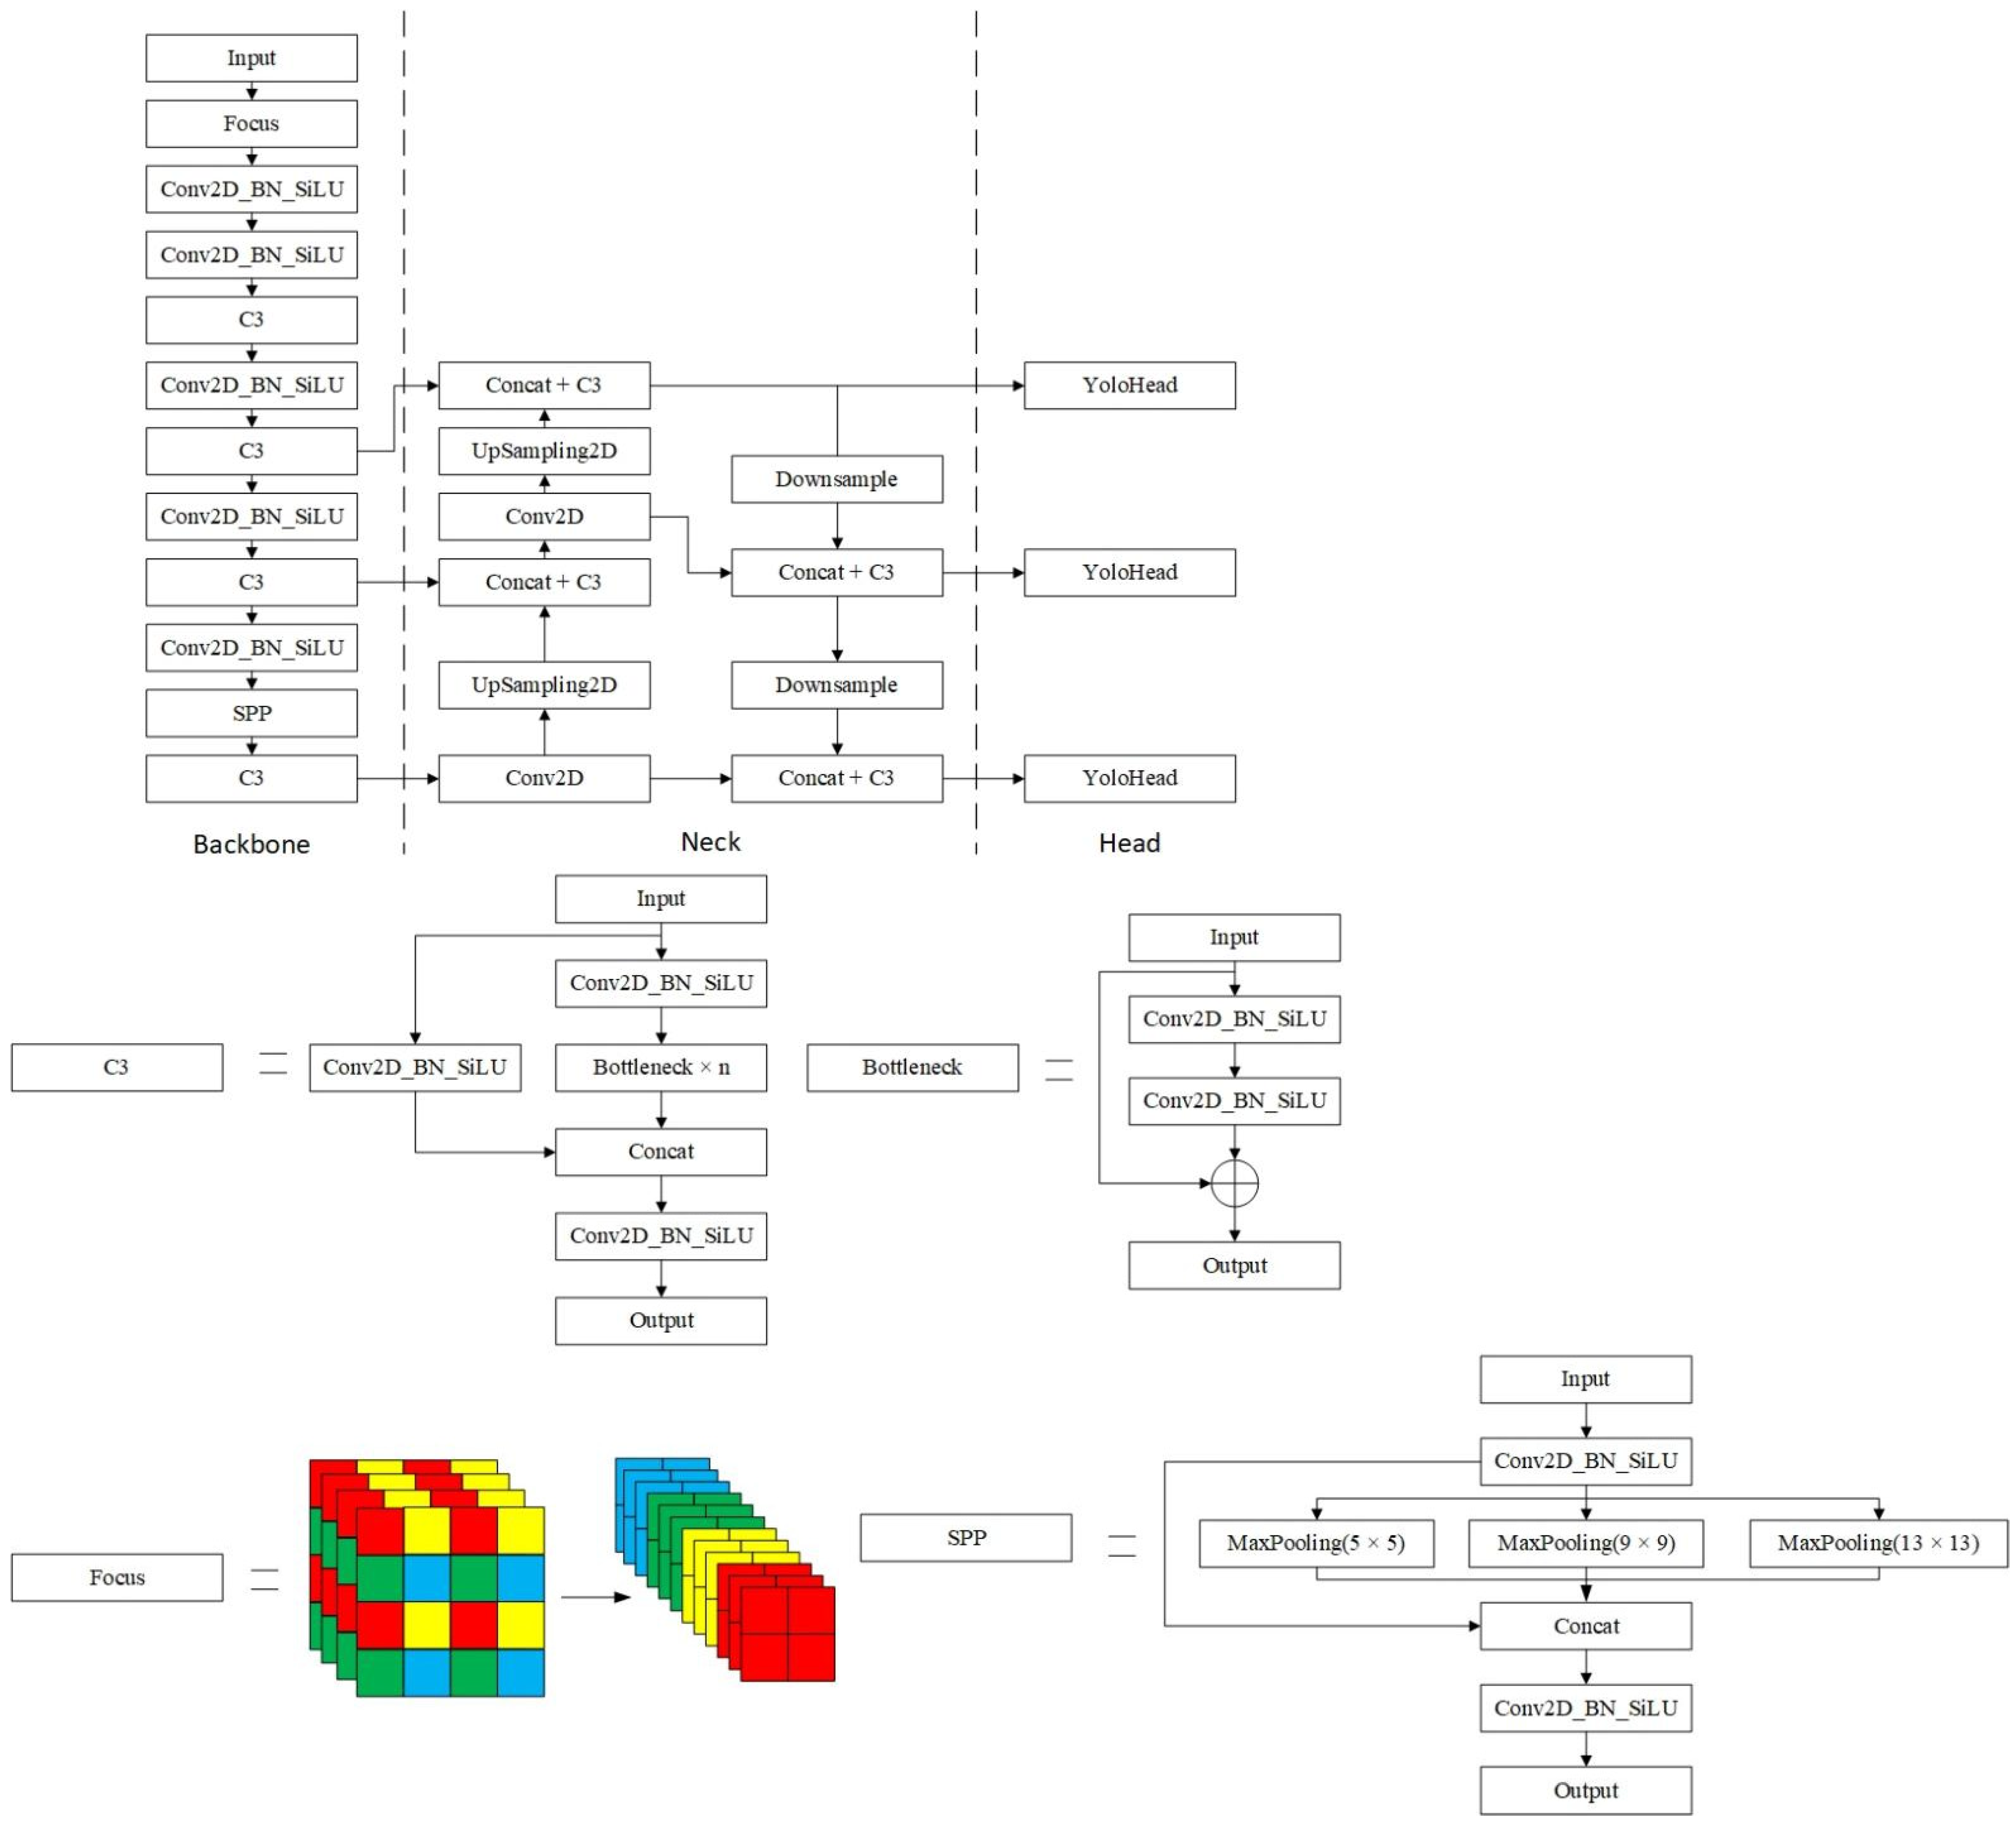
Section 2 gives a brief overview of the YOLOv5 and details the improvement strategies for the YOLO-UAV.
Section 3 presents the experimental environment, parameter settings, used datasets, and evaluation indicators. Detailed experimental steps, experimental results, and images for visualization are given to verify the effectiveness of the improved strategies and the superiority of the proposed method.
Section 4 summarizes the proposed improvement strategies and compares the YOLO-UAV with similar recent studies.
Section 5 concludes this paper and points out the future work ideas.
3. Experiments and Results
In this section, we discuss a series of experiments we conducted on image-classification datasets, generic-object-detection datasets, and UAV aerial image datasets, including CIFAR-10 [
57], PASCAL VOC, VEDAI [
58], VisDrone 2019 [
59], and Forklift [
48]. The experiments are divided into five parts: (1) the anchor boxes obtained by K-Means++ algorithm clustering on different datasets are given, and the clustering results are visualized; (2) since the improvements mainly focus on the backbone of the model, ablation experiments were performed on the image classification and detection tasks, respectively, to verify the effectiveness of the improvement strategies; (3) the proposed method is compared to several other advanced detection methods to verify its superiority; (4) comparative experiments were carried out on three UAV aerial image datasets to verify the superiority of the proposed method on UAV aerial imagery; and (5) three NMS methods are compared on multiple datasets to verify the effectiveness of the proposed EIOU-NMS method in suppressing redundant prediction boxes.
3.1. Experimental Environment and Training Parameter Settings
As shown in
Table 2 and
Table 3, the experimental environment and some uniform parameter criteria set in experiments are given. If there is no special description later, the parameter settings in the table are used by default.
3.2. Dataset
The CIFAR-10 is a small dataset for image classification. The dataset has an image size of 32 × 32 pixels and has 10 categories, including 50,000 training images and 10,000 testing images. It will be used for ablation experiments for the classification task of the backbone.
The PASCAL VOC includes the VOC2007 and VOC2012 datasets. Among them, the VOC2007 dataset contains 20 object categories and 4952 annotated images. This dataset was used for ablation experiments, comparative experiments of other methods, and comparative experiments of different NMS methods.
VEDAI is a dataset for vehicle detection in aerial images. Among them, the color image sub-dataset of 512 × 512 pixels contains eight categories, except “other”, with a total of 1246 annotated images. This dataset was used for comparative experiments on UAV aerial images and comparative experiments of different NMS methods.
The VisDrone 2019 dataset contains a large number of objects to be detected, some of which are very small due to the perspective of the UAV. This dataset has 7019 annotated images in total. It is divided into 10 categories, some of which have relatively similar characteristics. This dataset was used for comparative experiments on UAV aerial images and comparative experiments of different NMS methods.
The Forklift dataset is a forklift-targeted dataset based on UAV aerial imagery established by us. Initially, there were 1007 annotated images in the dataset. The number of images was then expanded to 2022, and images similar to the natural horizontal viewing angle were replaced. This part of the shooting task was completed by two professional UAV pilots. The UAVs used were DJI Mavic 2, Mavic 3, and Jingwei M300RTK, and the mounted cameras are Zenmuse P1 and Zenmuse H20T. The UAV was flying at an altitude of between 100 and 150 m when filming. We annotated the obtained UAV aerial images and invited two pilots to check and correct them. This dataset was used for comparative experiments on UAV aerial images and comparative experiments of different NMS methods.
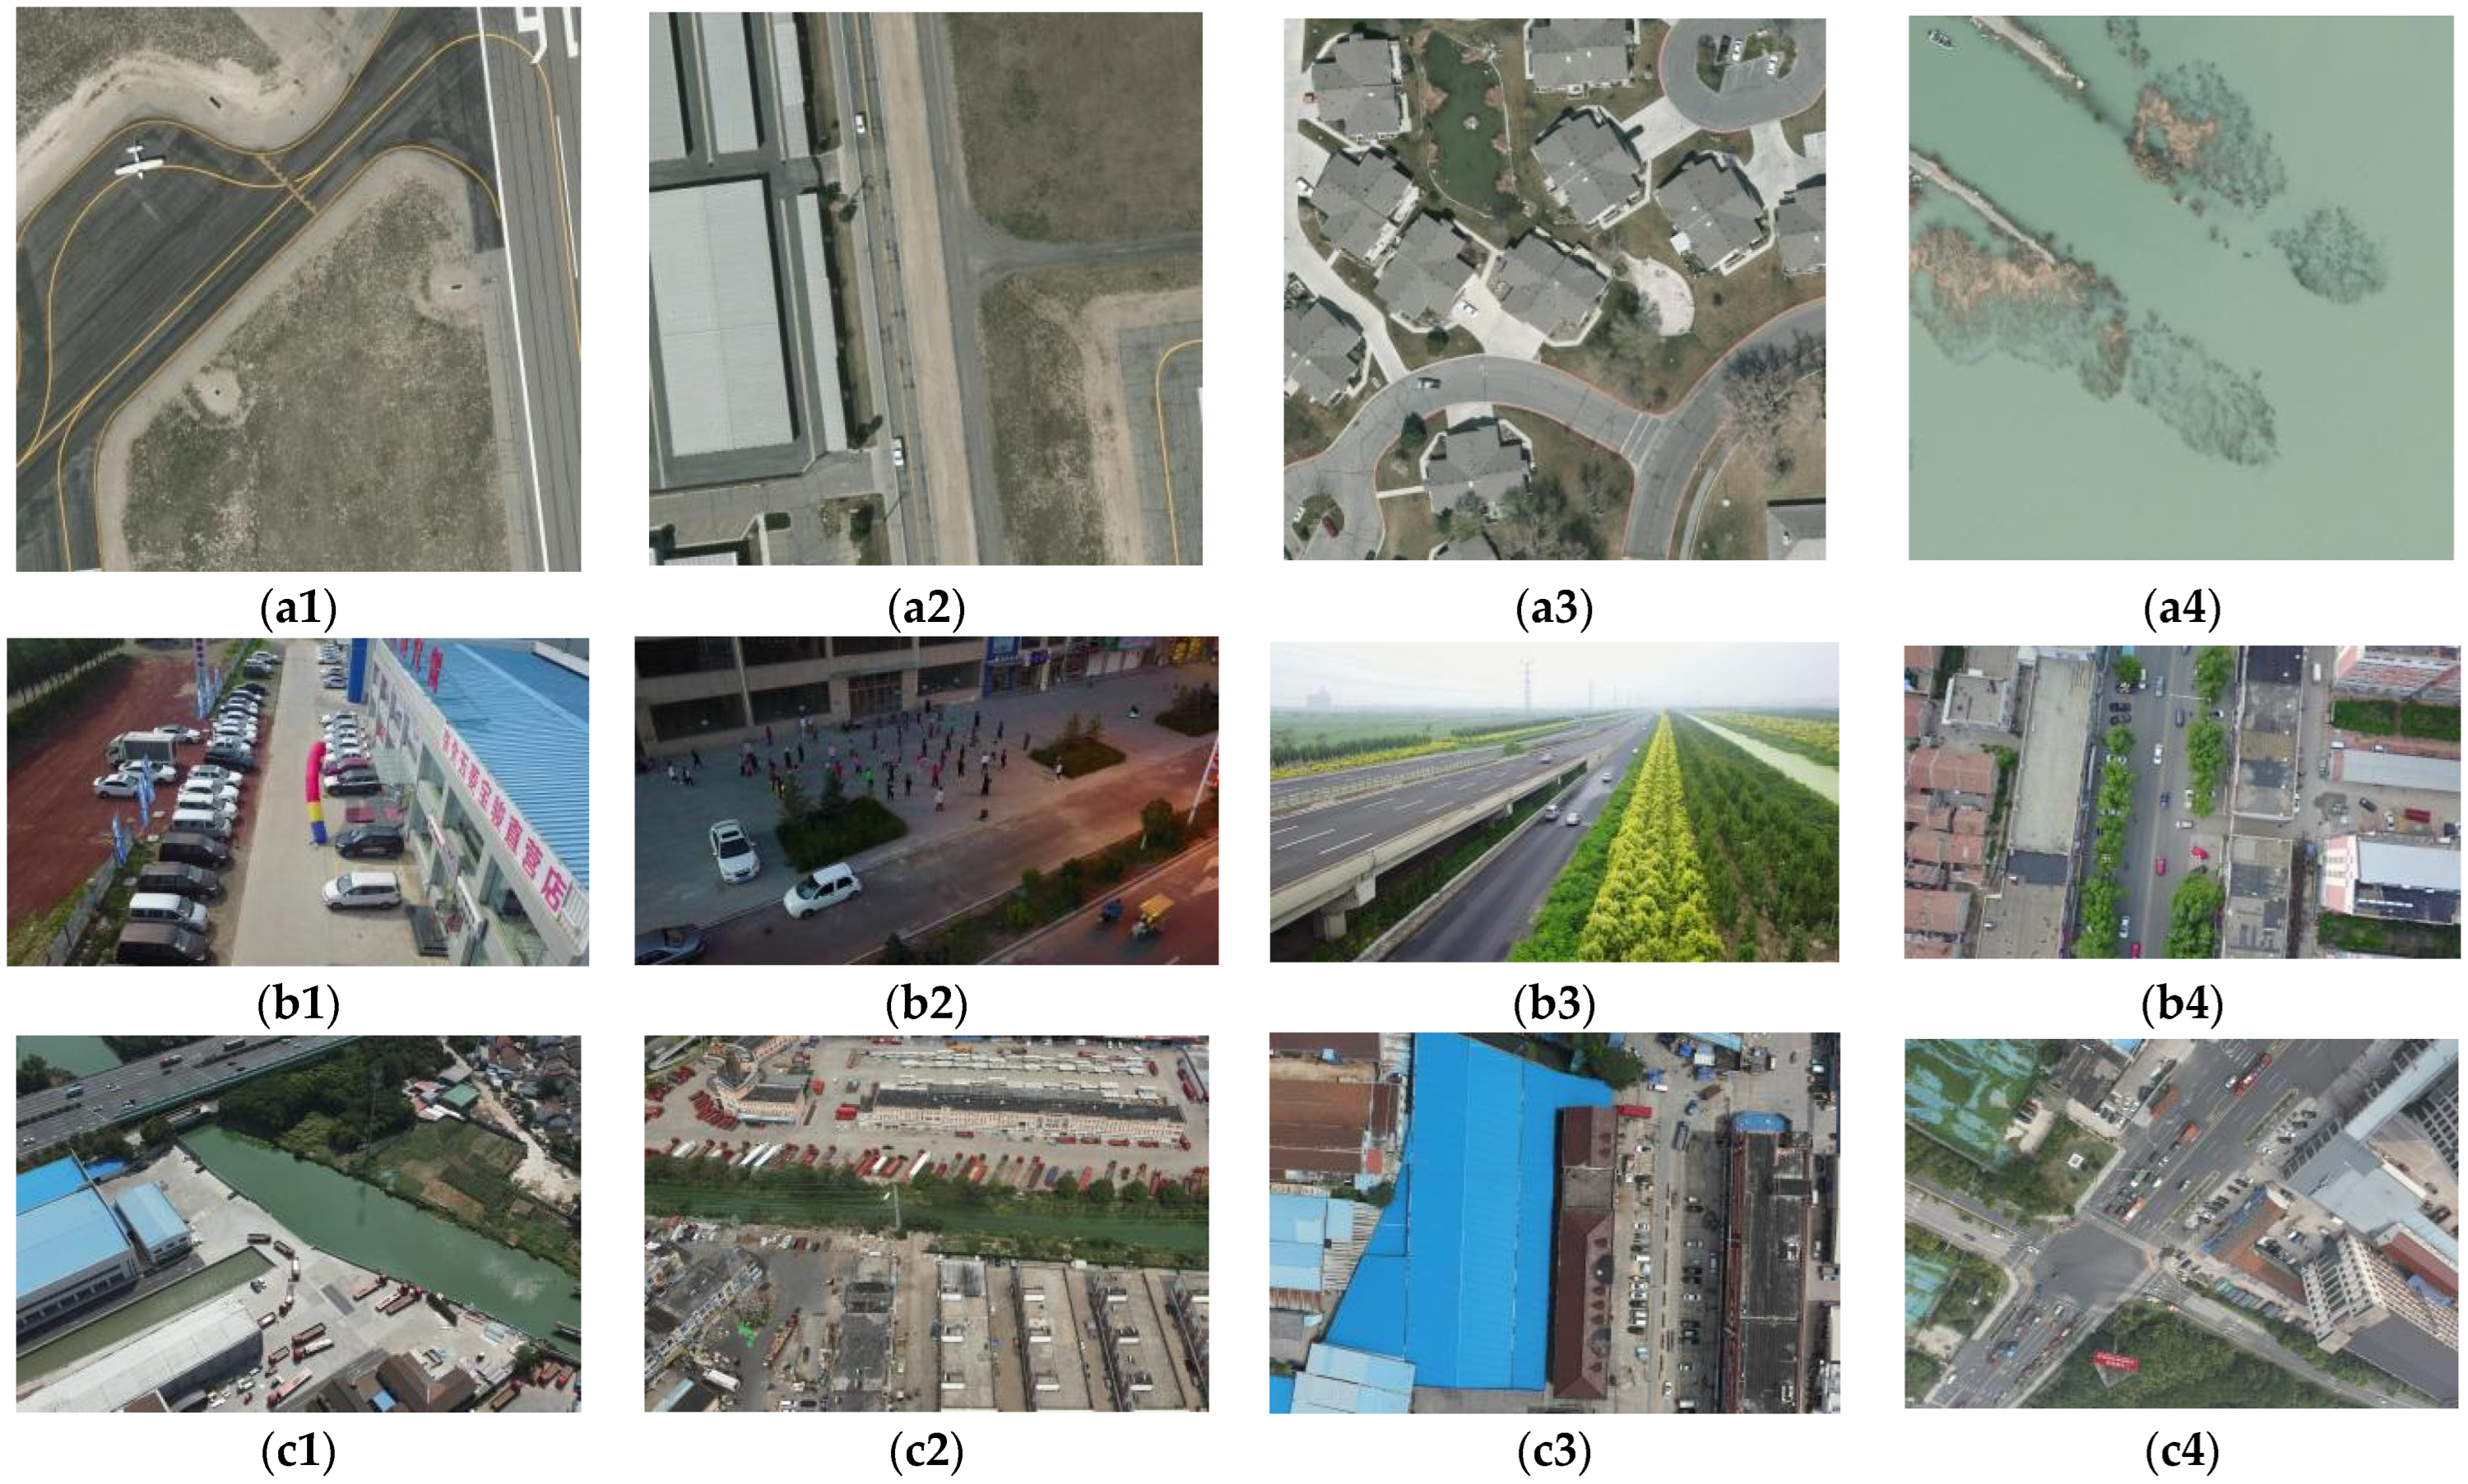
Figure 8 shows some example images from the VEDAI, VisDrone 2019, and Forklift datasets.
3.3. Evaluation Indicators
The evaluation indicators to evaluate the performance of the detection method are Precision (
P), Recall (
R),
F1 score, Average Precision (
AP), and Mean Average Precision (
mAP). They are calculated as shown in Equations (6)–(10), where
TP is True Positive,
FP is False Positive,
FN is False Negative, and
C is the total number of categories. Additionally, total parameters and total FLOPS are used to measure model size and computational complexity, and top-1 accuracy is used to measure image classification performance:
3.4. Experimental Results
3.4.1. Results of Clustering Different Datasets
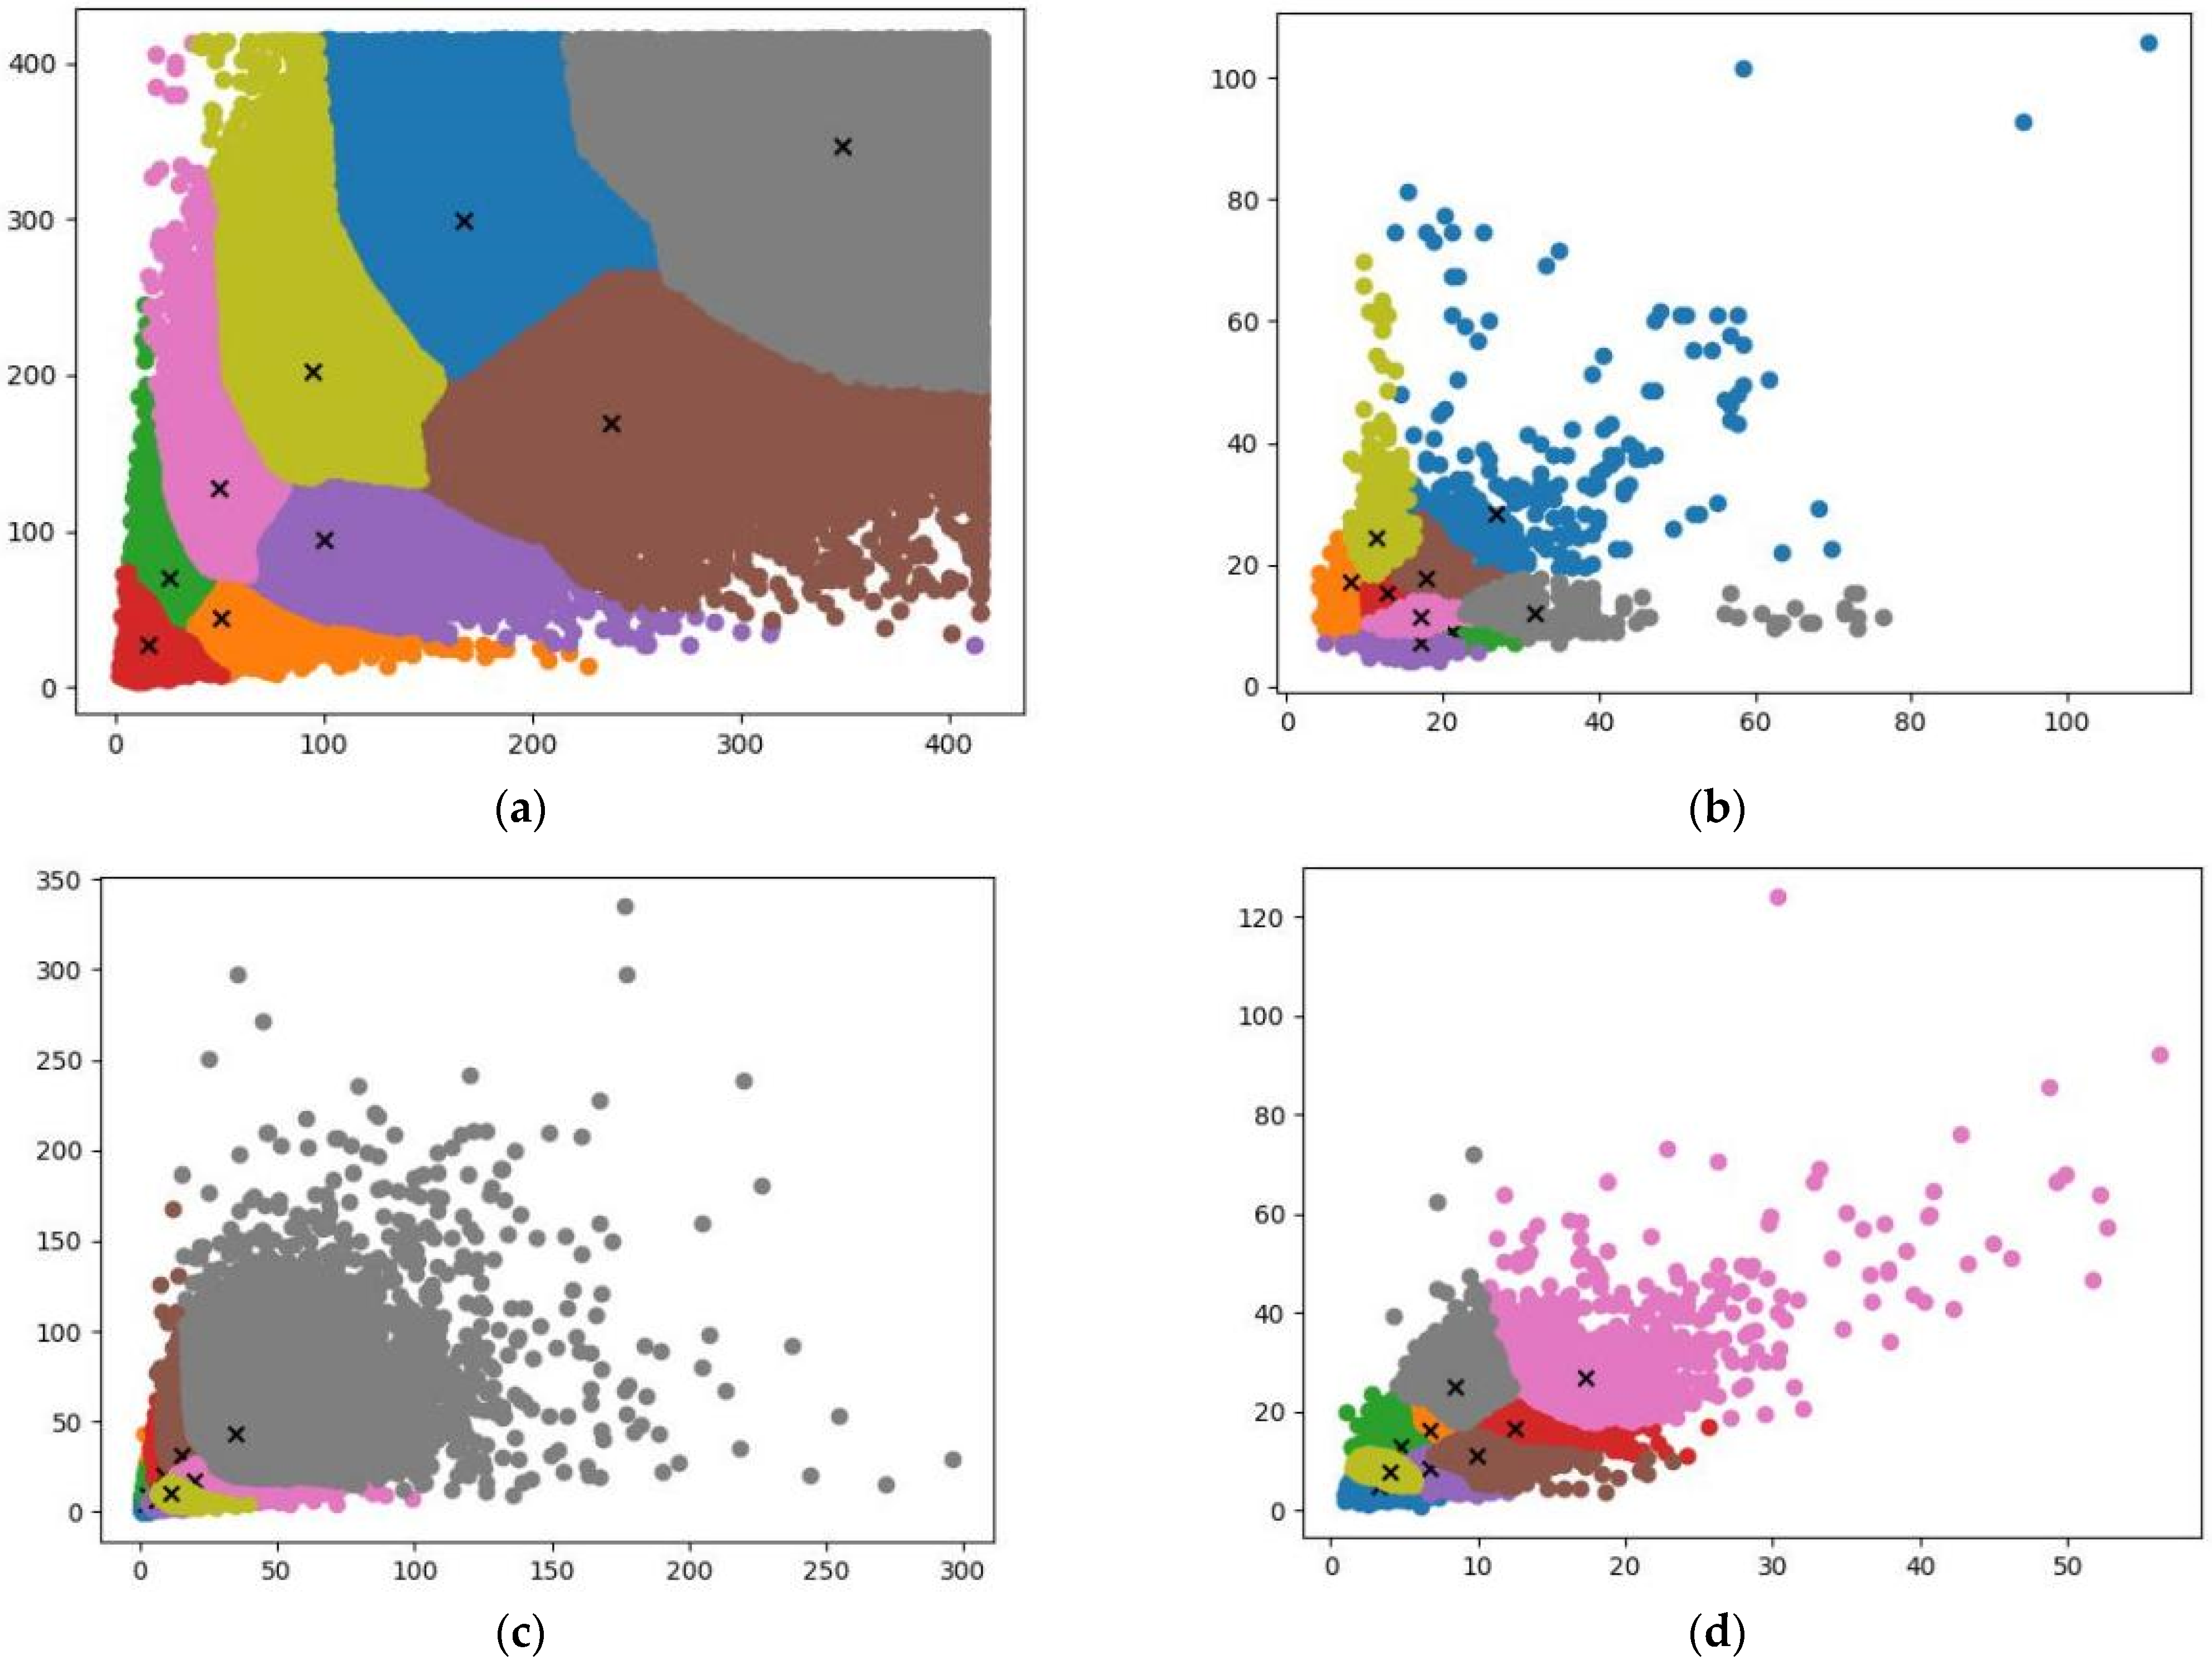
Clustering on PASCAL VOC, VEDAI, VisDrone 2019, and Forklift datasets was performed by using the K-Means++ algorithm. The number of cluster centers was set at nine.
Table 4 lists the default anchor boxes and our obtained anchor boxes.
Figure 9 shows the visualization results, where different colors represent different clusters, and “×” represents the cluster center. In subsequently mentioned experiments, the anchor boxes listed in the table were used.
3.4.2. Ablation Experiments
We improved the backbone of YOLOv5l to strengthen the ability to extract features. Ablation experiments were conducted on the image classification and the detection tasks, respectively, to verify the efficacy of the improved strategies.
- (1)
Ablation experiments on classification tasks
In this part of the experiments, an adaptive average pooling layer and a fully connected layer were additionally added after the backbone of the model for image classification. The dataset used was CIFAR-10. The input image size was set to 32 × 32 pixels, and the batch size was set to 64. We divided the ablation experiments into the following five steps: In Step 1, the residual blocks in Layers 1 to 4 of the backbone were replaced with the ASResNet module. In Step 2, we used the ASRes2Net module to replace the fourth layer. In Step 3, we added the IECA module after the Focus. In Step 4, we used the AEFE module to replace the third layer. In Step 5, we used GSPP to replace the original SPP module. The results of the ablation experiments on the classification task of the backbone are shown in
Table 5. In addition, the top-one accuracy of the backbone of YOLOv4 and YOLOv5x is also shown.
The experimental results lead to three conclusions: (1) as compared with YOLOv5, the backbone of YOLOv4 achieves higher top-one accuracy on classification tasks, indicating that the backbone of YOLOv4 is better than YOLOv5 in its ability to extract features in image classification; (2) due to the increased width and depth of the YOLOv5x, it has a higher top-one accuracy than the YOLOv5l; (3) the top-one accuracy of the YOLOv5l is 78.49%. After improvement, it increased to 85.69%, an increase of 7.20%. This indicates that the proposed improvement strategies are beneficial for enhancing the feature-extraction capability of the backbone.
We compared the total parameters and total FLOPS of the backbones of YOLOv4, YOLOv5l, YOLOv5x, and YOLO-UAV, which measure the size and computational complexity of the backbone.
Table 6 shows the comparison results.
Table 6 shows that the backbone of YOLOv5x has the highest total parameters and total FLOPS. The complexity of YOLO-UAV is not much different from that of YOLOv5l, with only a slight increase. The total parameters and total FLOPS of the backbone of YOLO-UAV are less than YOLOv5x, but its top-one accuracy on image classification tasks is 5.92% higher. This shows that YOLO-UAV has excellent parameter efficiency and achieves a good balance between speed and accuracy.
- (2)
Ablation experiments on detection tasks
In this part of the ablation experiments, the dataset used was the VOC2007 dataset. The ablation experiments had a total of seven steps, of which the first five steps were the same as the above. In Step 6, we used the anchor boxes mentioned in the previous section. In Step 7, we used EIOU-NMS instead of greedy NMS for suppressing redundant prediction boxes. The results of the ablation experiments are shown in
Table 7.
From the table above, it can be seen that the mAPs of YOLOv4, YOLOv5l, and YOLOv5x are 80.17%, 79.96%, and 83.92%, respectively. After the improvement of the backbone of YOLOv5l, the mAP increased to 85.02%, resulting in increases by 4.85%, 5.06%, and 1.10%, respectively. On this basis, after the remaining two points of improvement, mAP increased to 85.35%, with an increase of 5.18%, 5.39%, and 1.43%, respectively. To show the detection performance improvement more clearly, we visualized the feature map output by the backbone. The visualization results of different kinds of feature maps in the VOC2007 dataset are shown in
Figure 10. It is clearly observed in the form of heat maps that the features extracted by YOLO-UAV cover the target more accurately, and it is beneficial to alleviate the interference of complex backgrounds. In summary, the experimental results show that the above improvement strategies work well and are beneficial to an overall improvement in the performance of model detection.
3.4.3. Comparison with Other Object Detection Methods
The detection methods used for comparison include Faster R-CNN, SSD, YOLOv3, EfficientDet [
60], YOLOv4-Tiny, YOLOv4, and YOLOv5. The dataset used is VOC2007.
Table 8 shows the experimental results of the comparative experiments.
The experimental results show that YOLO-UAV achieves the highest mAP, which verifies the superiority of the improved model.
3.4.4. Experiments on the UAV Aerial Image Dataset
YOLO-UAV is improved on the basis of YOLOv5l, so in the following experiments, we focused on the difference in mAP between YOLO-UAV and YOLOv5l. The datasets used are the VEDAI, VisDrone 2019, and Forklift datasets. Inspired by transfer learning, when training on UAV aerial images, the pre-training weights used are all from the abovementioned comparative experiments. At this time, the epoch of training is modified to 500. The experimental results of YOLOv5l and YOLO-UAV on the UAV aerial image datasets are shown in
Table 9,
Table 10 and
Table 11, respectively.
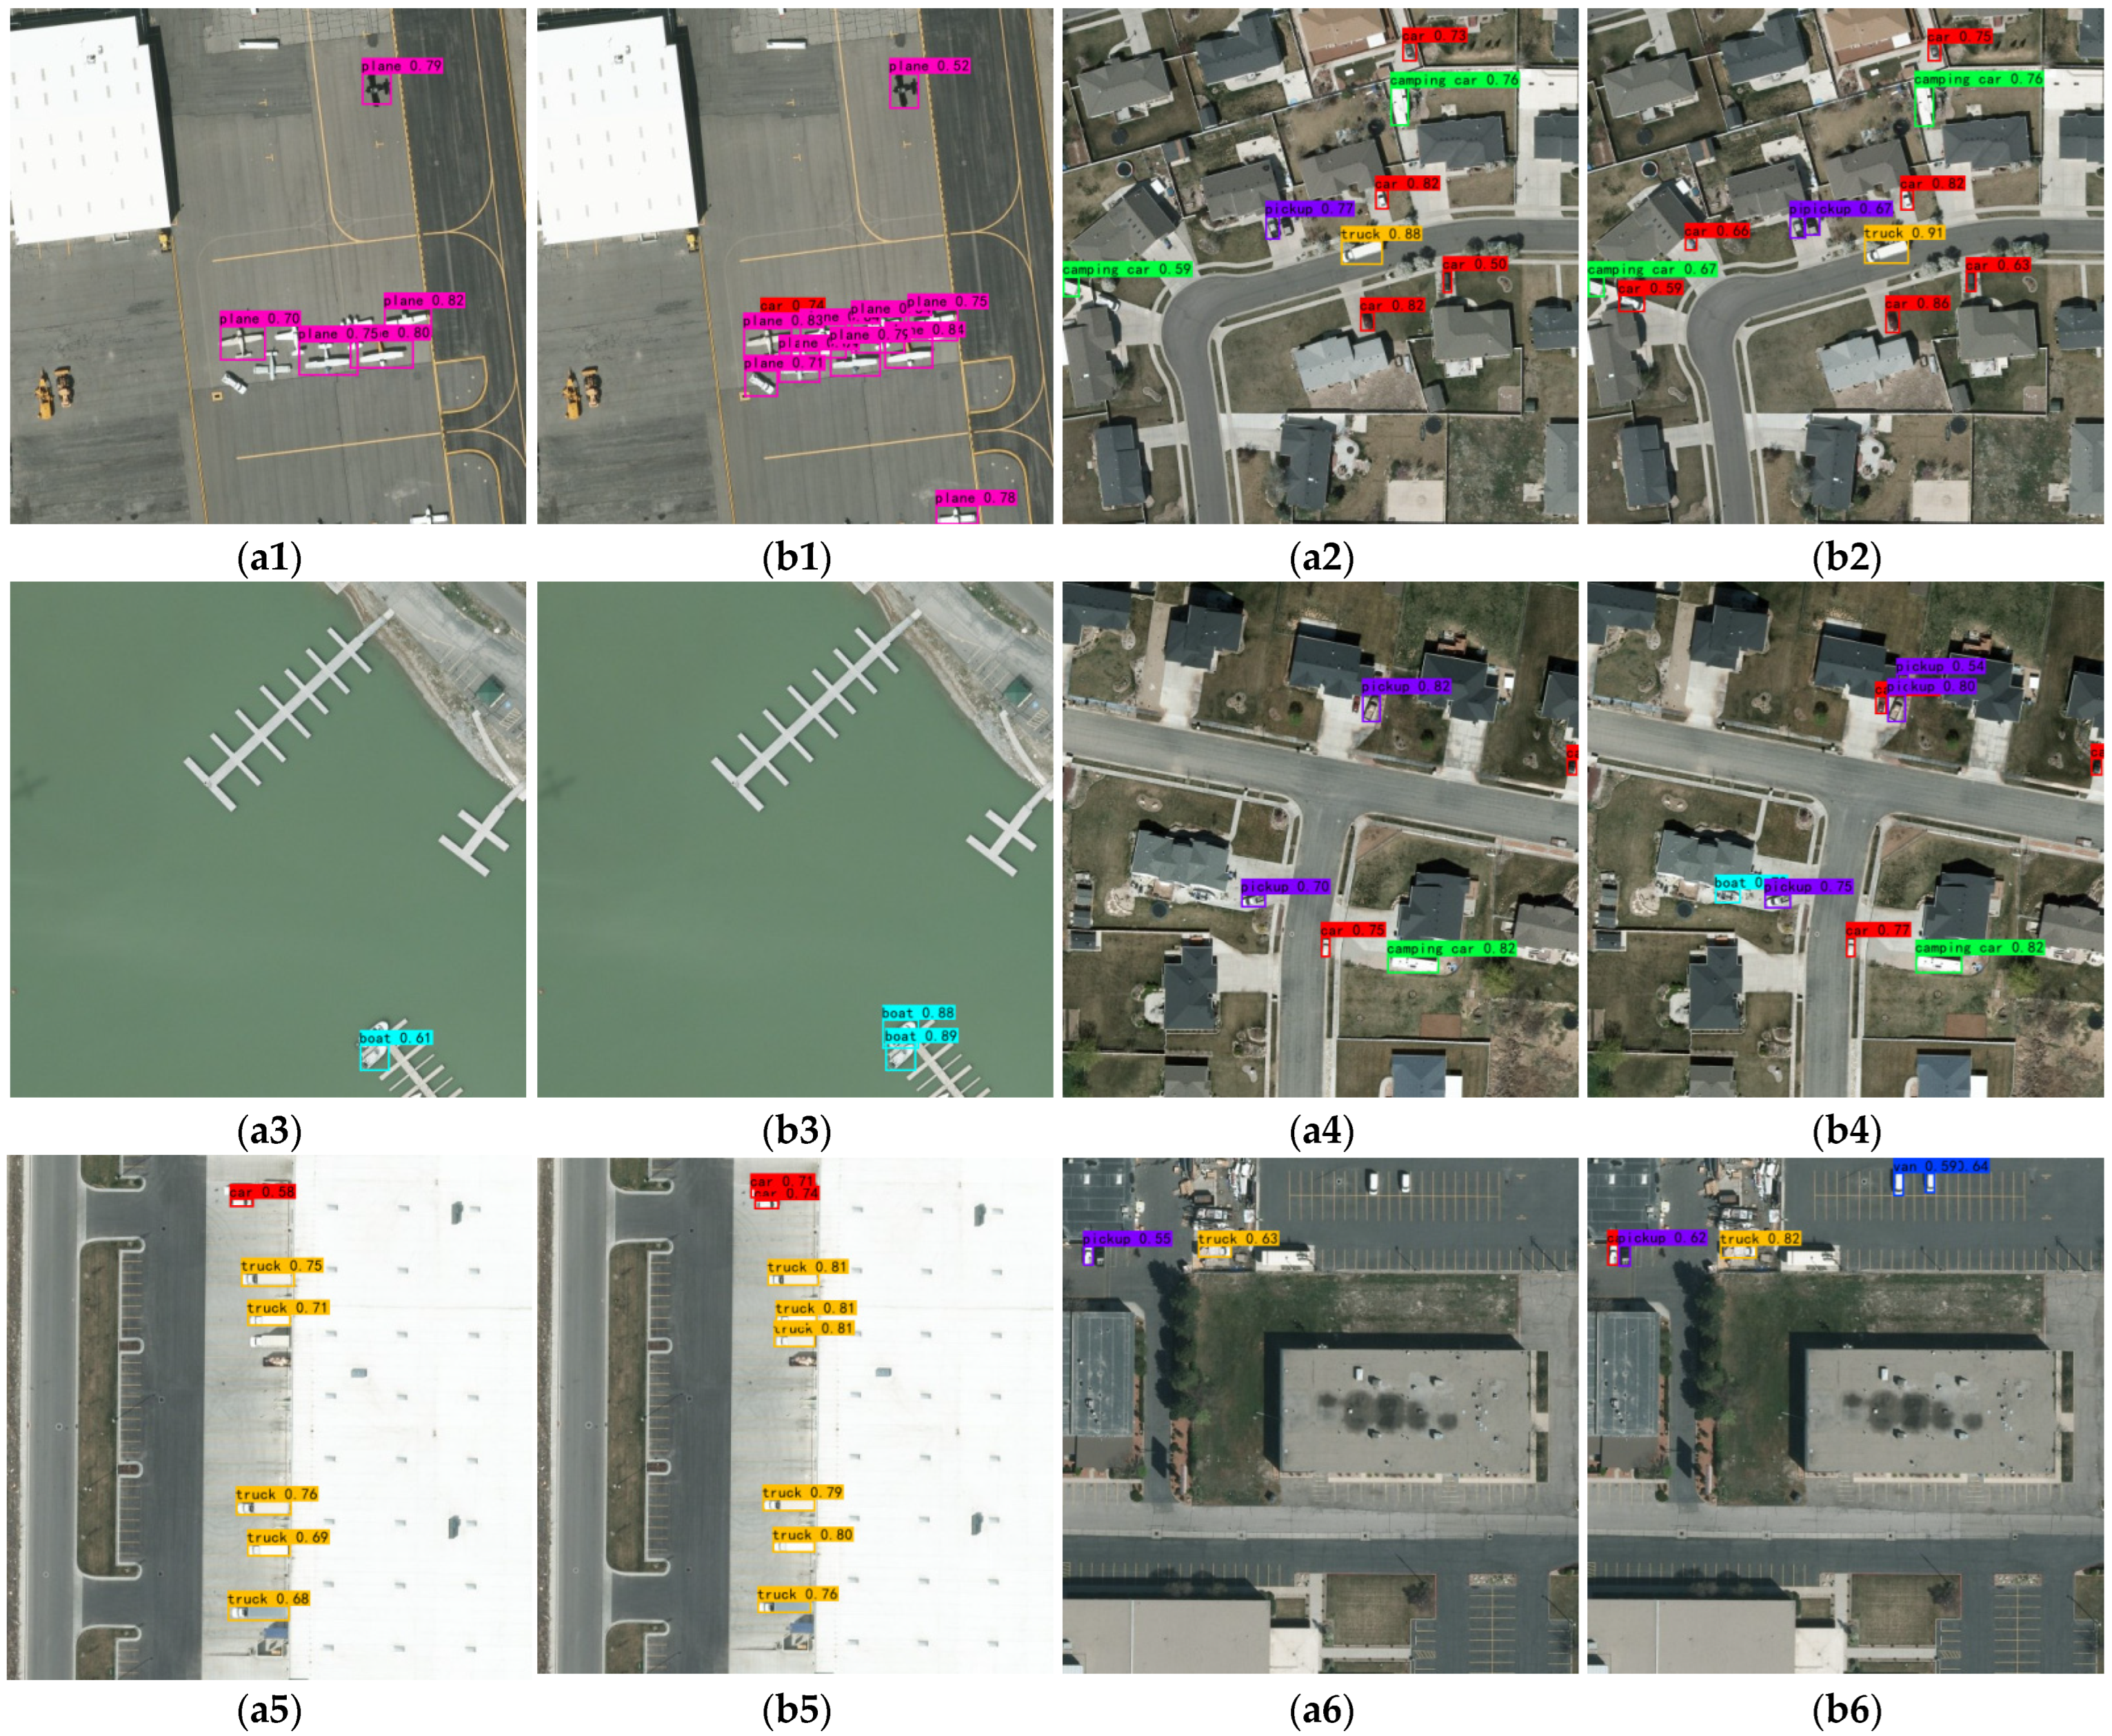
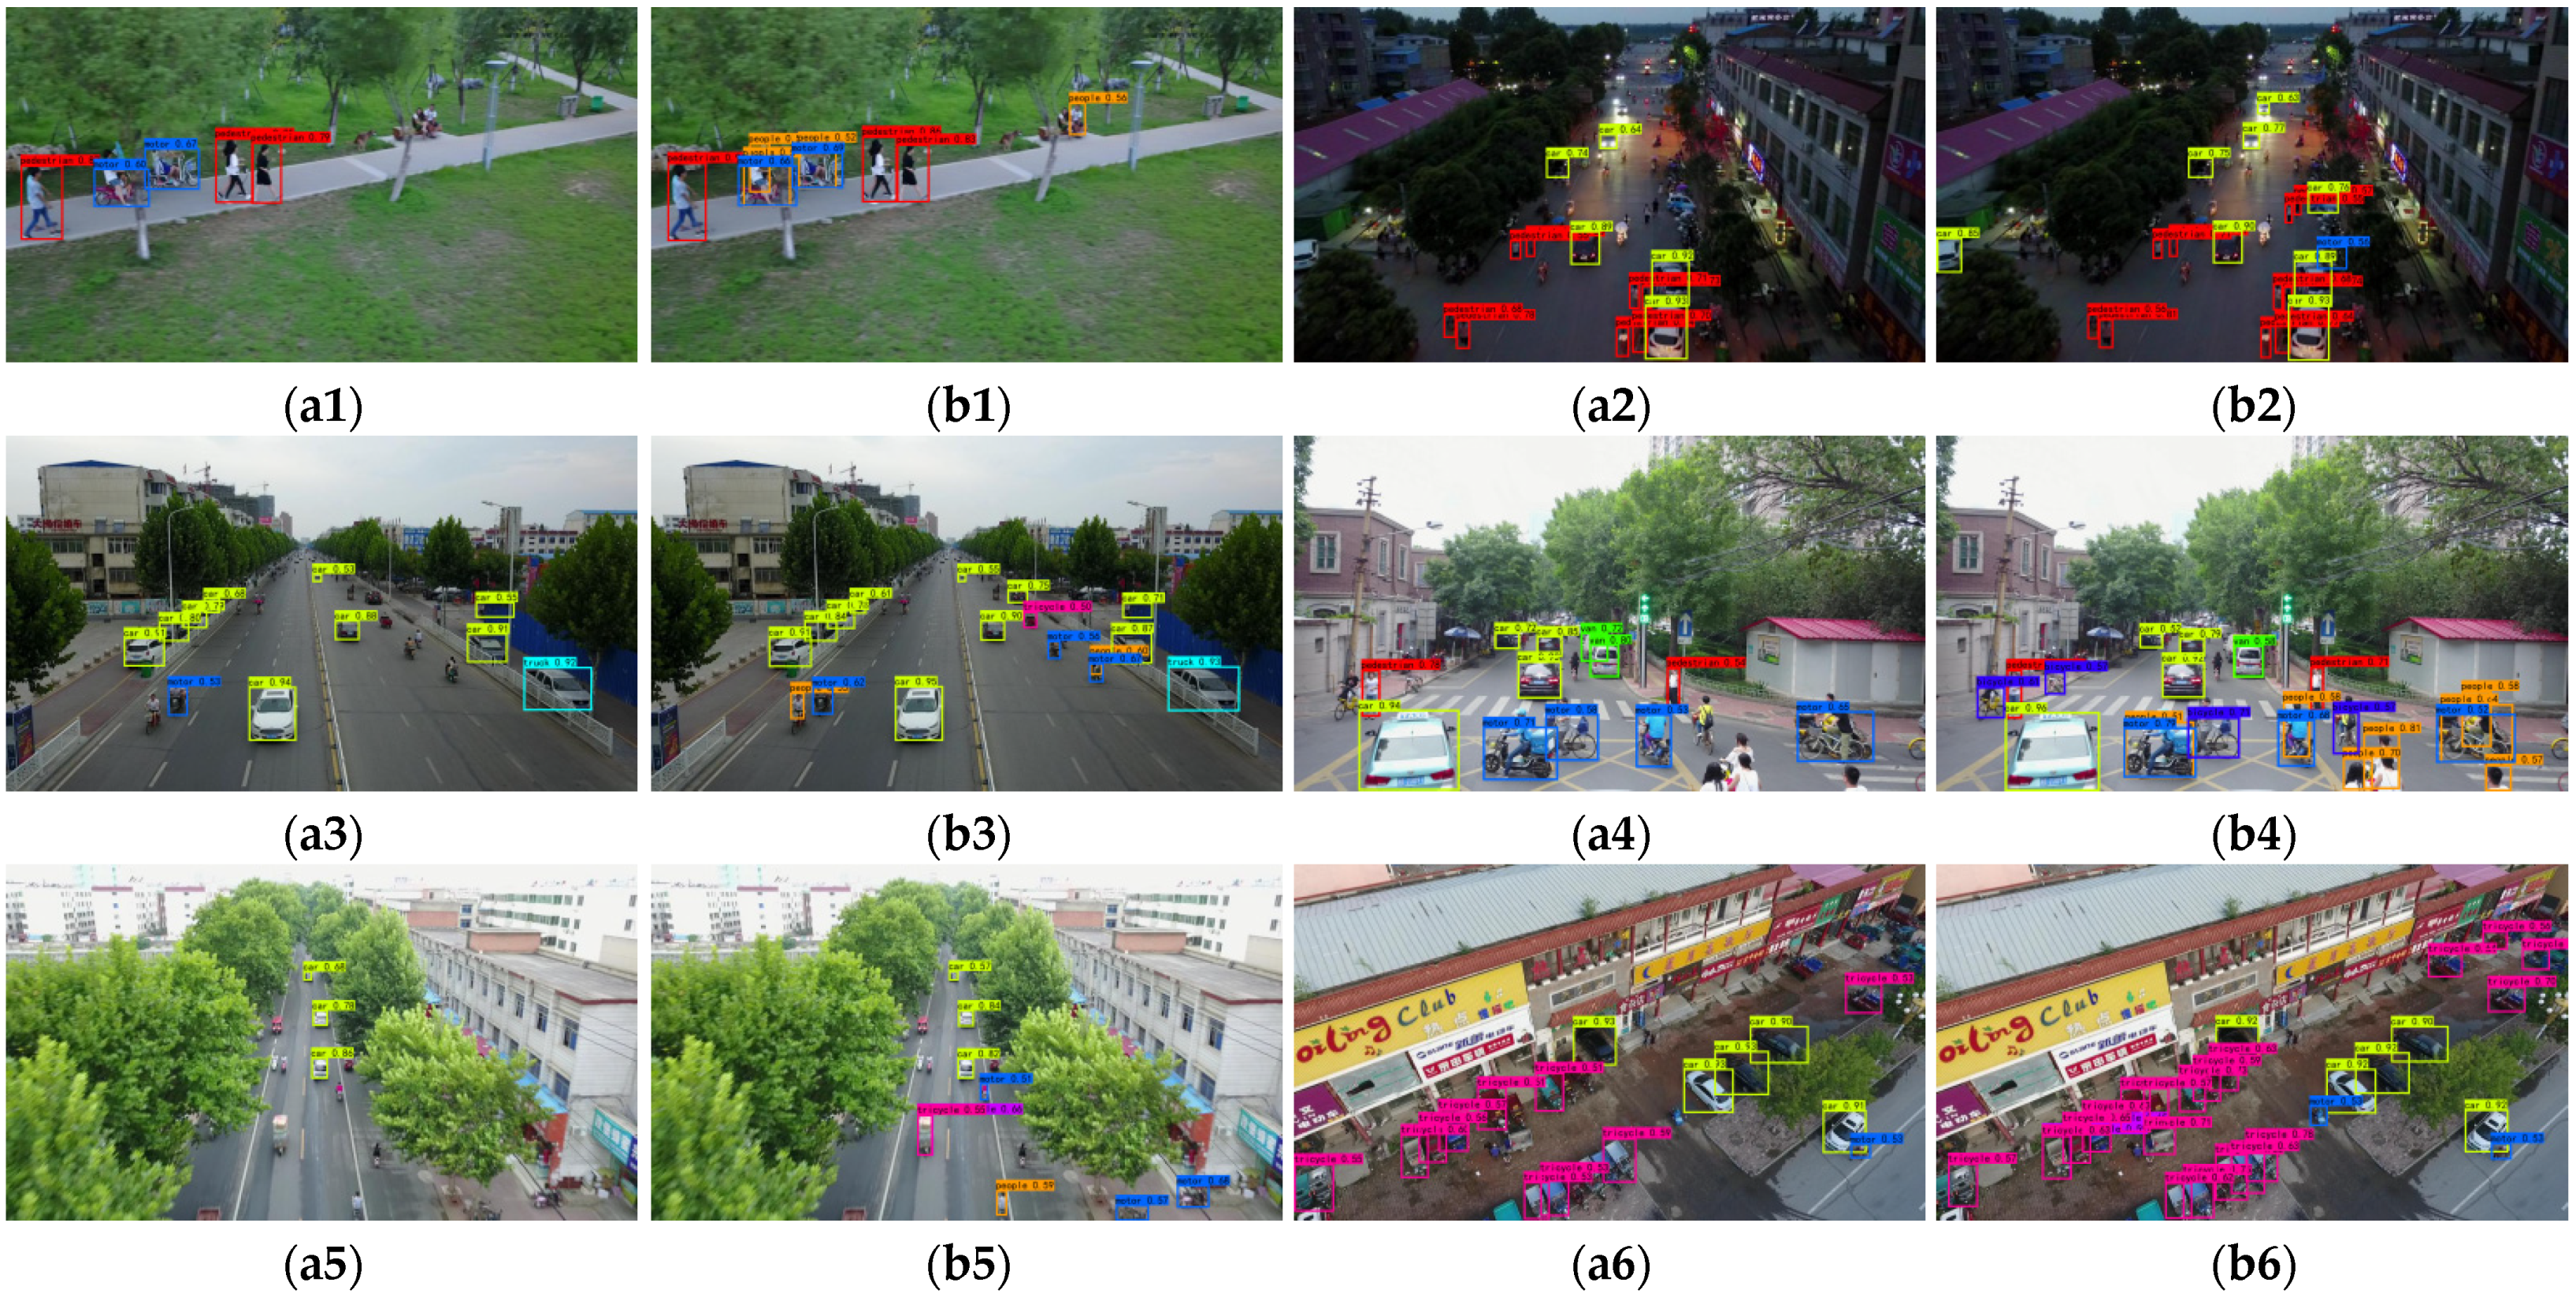
According to the experimental results, it can be seen that the mAP of YOLOv5l on the VEDAI, VisDrone 2019, and Forklift datasets is 55.31%, 26.04%, and 61.53%, respectively. YOLO-UAV is 61.10%, 30.50%, and 70.43%, respectively. The detection accuracy of YOLO-UAV is better than that of YOLOv5l on all three datasets, and the mAP is improved by 5.79%, 4.46%, and 8.90%, respectively. The experimental results verify the superiority of the improved methods in UAV aerial images. YOLO-UAV handles the challenges brought by factors such as small targets, dense arrangement, sparse distribution, and complex backgrounds very well, and it has a better performance in UAV aerial images.
Figure 11,
Figure 12 and
Figure 13 show some post-detection results on the VEDAI, VisDrone 2019, and Forklift datasets.
3.4.5. Comparison of Different NMS Methods in Multiple Datasets
We conducted comparative experiments on multiple datasets to verify the superiority of the EIOU-NMS method. The datasets include VOC2007, VEDAI, VisDrone 2019, and Forklift datasets. The NMS methods used for comparison included EIOU-NMS, DIOU-NMS, and greedy NMS. In this part of the experiments, the detection method used was YOLO-UAV, and only different NMS methods were replaced on its basis. We set the threshold for non-maximal suppression to 0.30. The precision of mAP was increased to five decimal places to better show the difference in mAP. The comparison results are shown in
Table 12.
From the data in the above table, it can be seen that mAP is the highest when using EIOU-NMS. We verified that the proposed EIOU-NMS method can more effectively suppress redundant prediction boxes, assisting in improving the model’s detection accuracy. The performance improvement benefits from the EIOU indicator, which makes the suppression criteria not only limited to the overlapping area of the two prediction boxes and the distance between the center points, but also pays attention to the difference in width and height between boxes. In addition, the EIOU-NMS method can be easily added to different models, without additional training.
4. Discussion
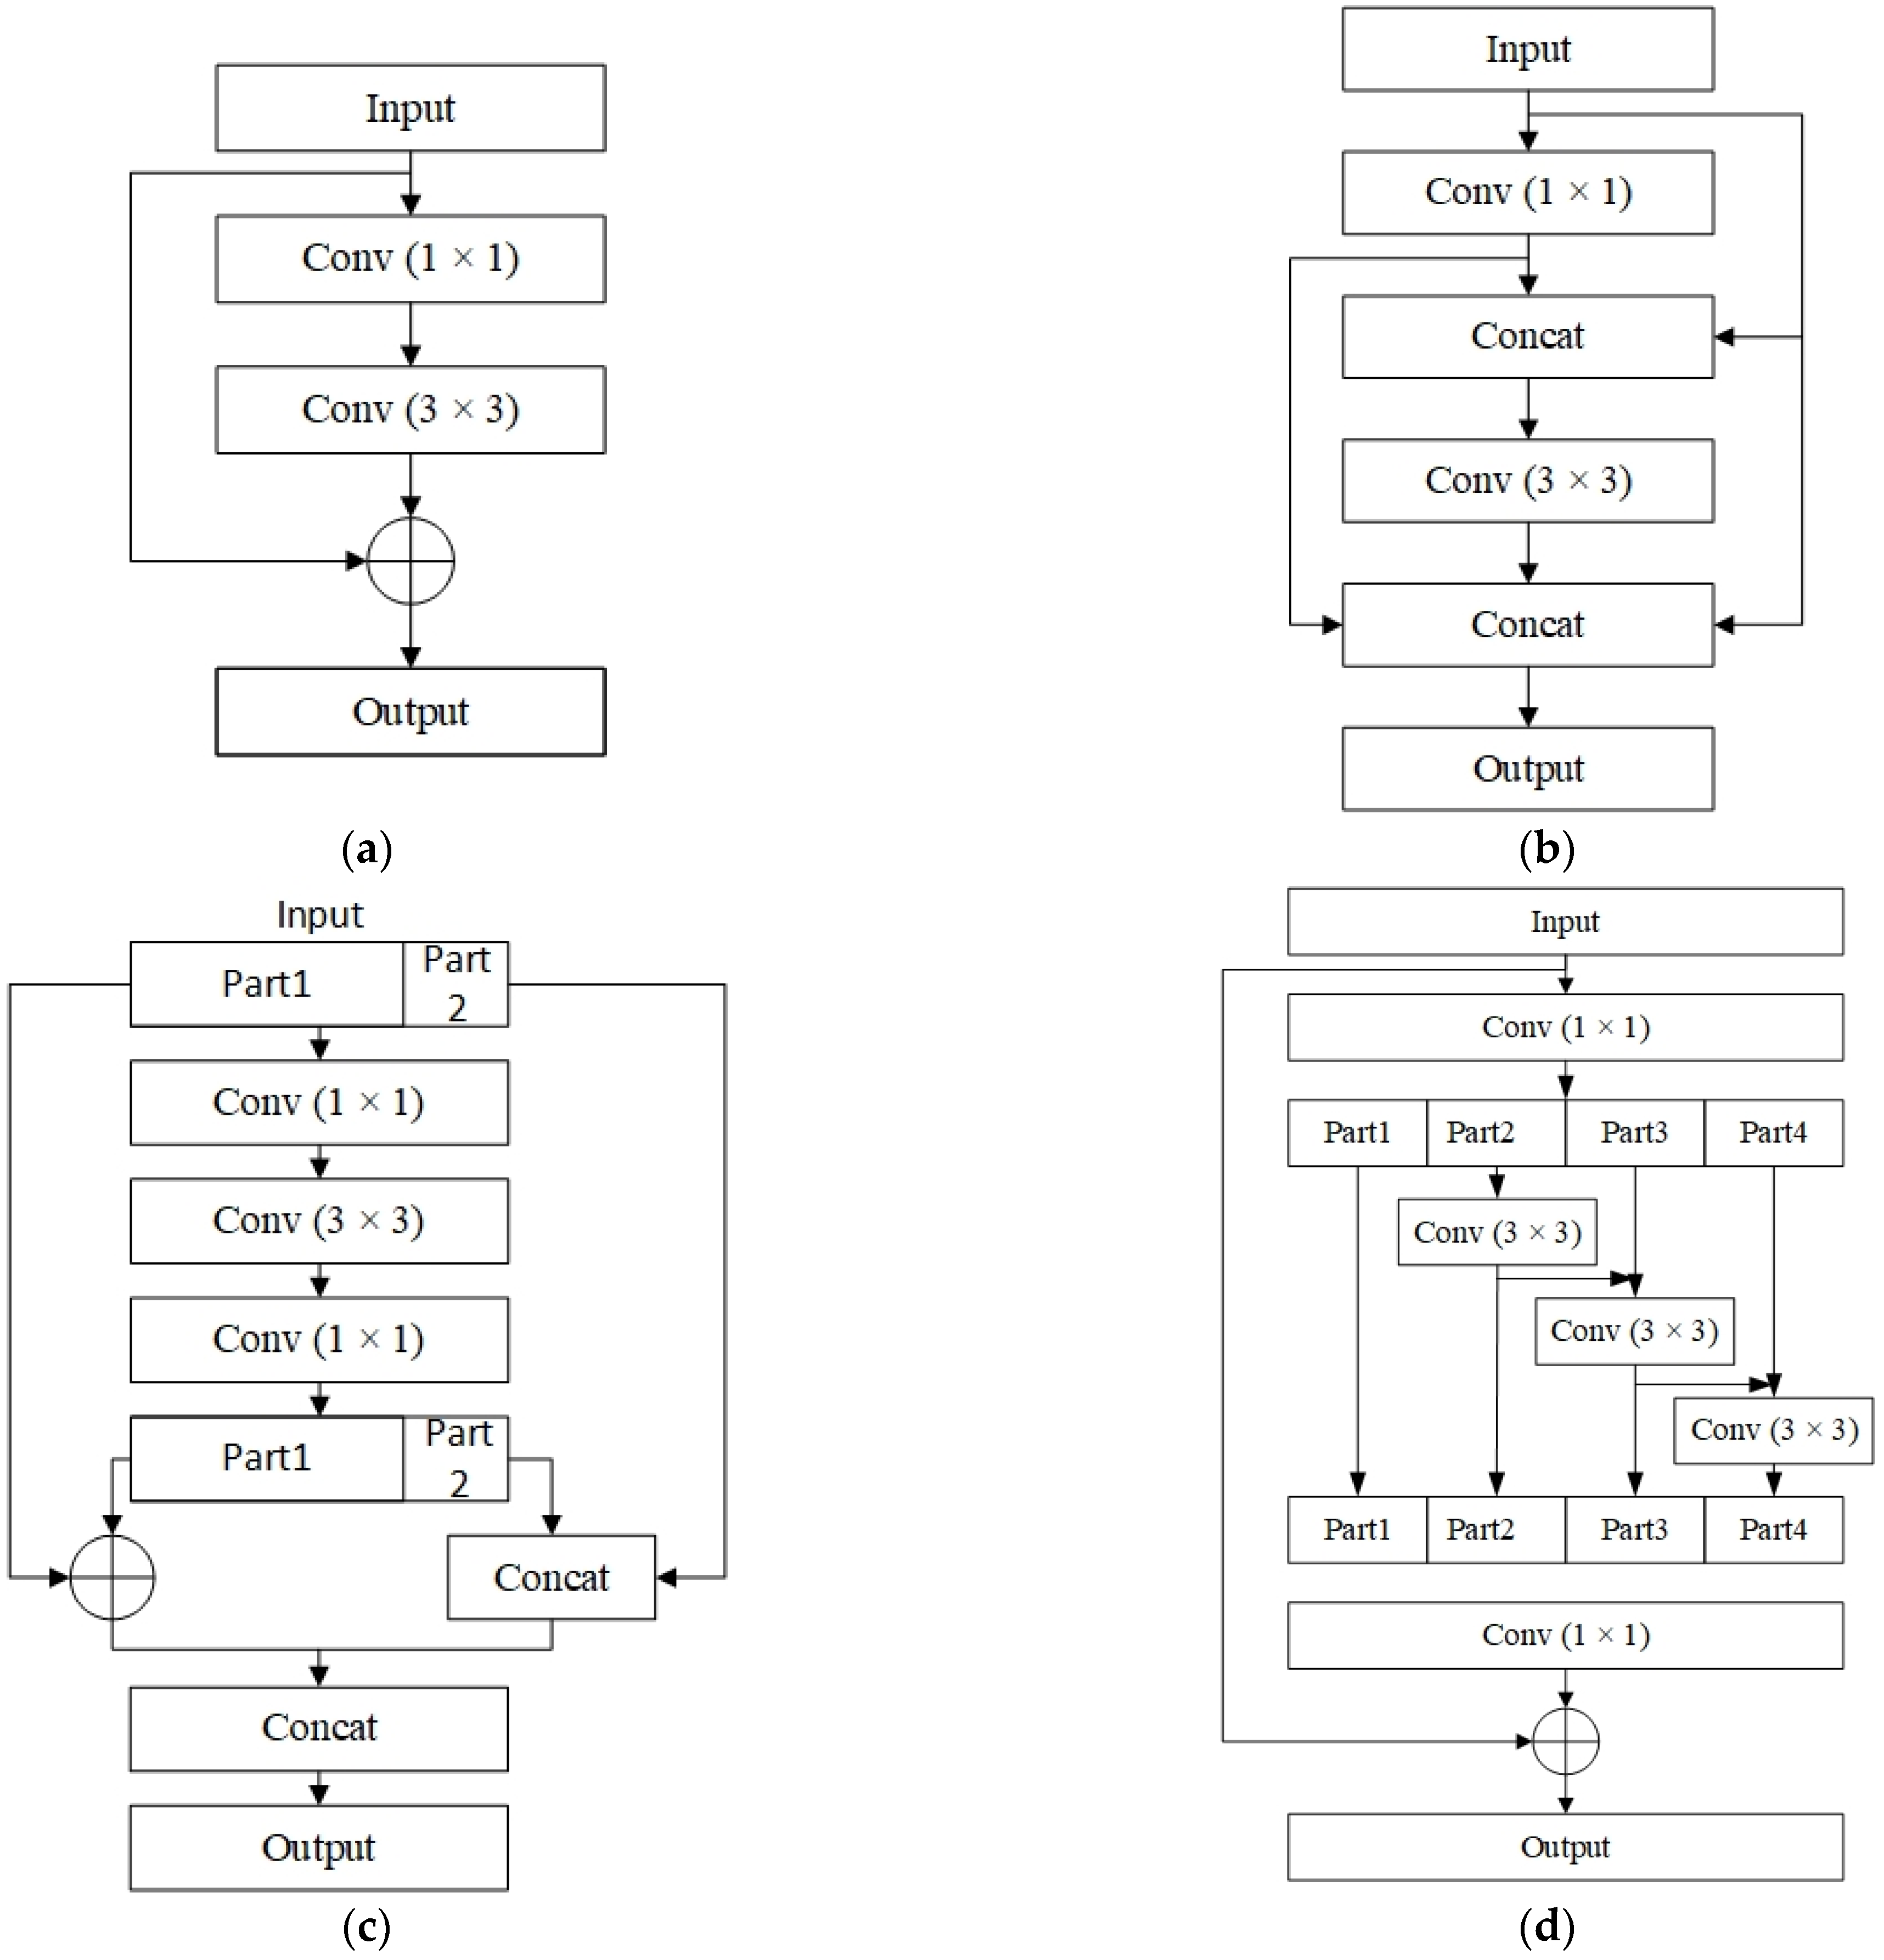
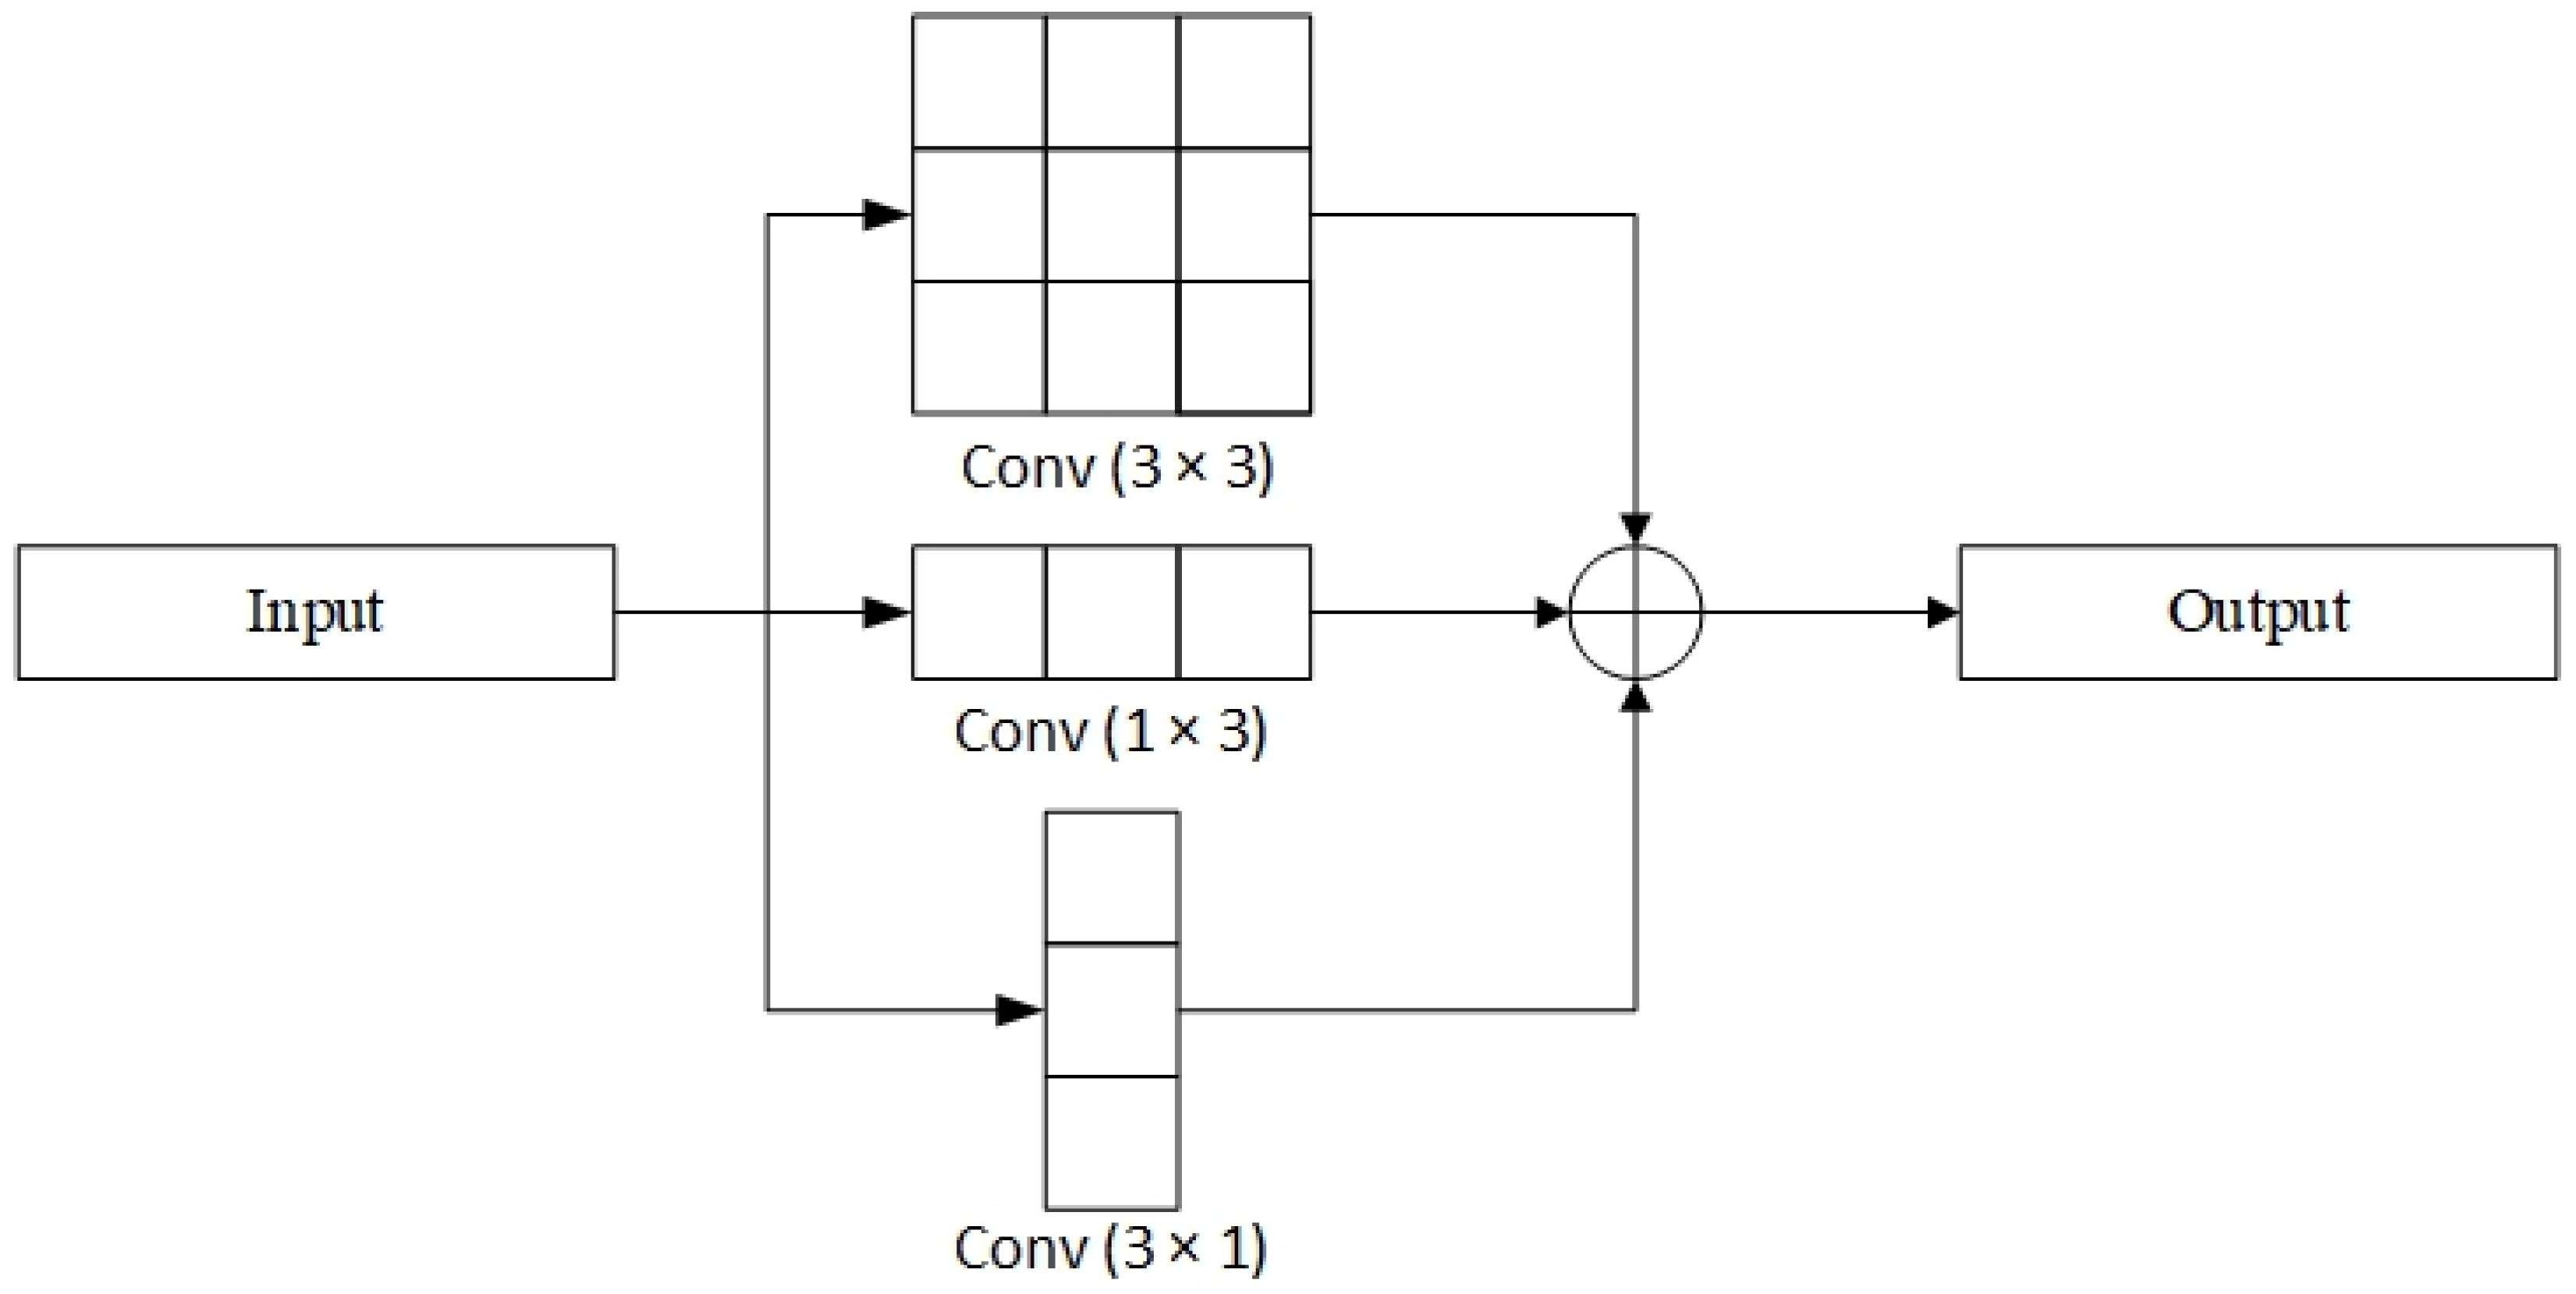
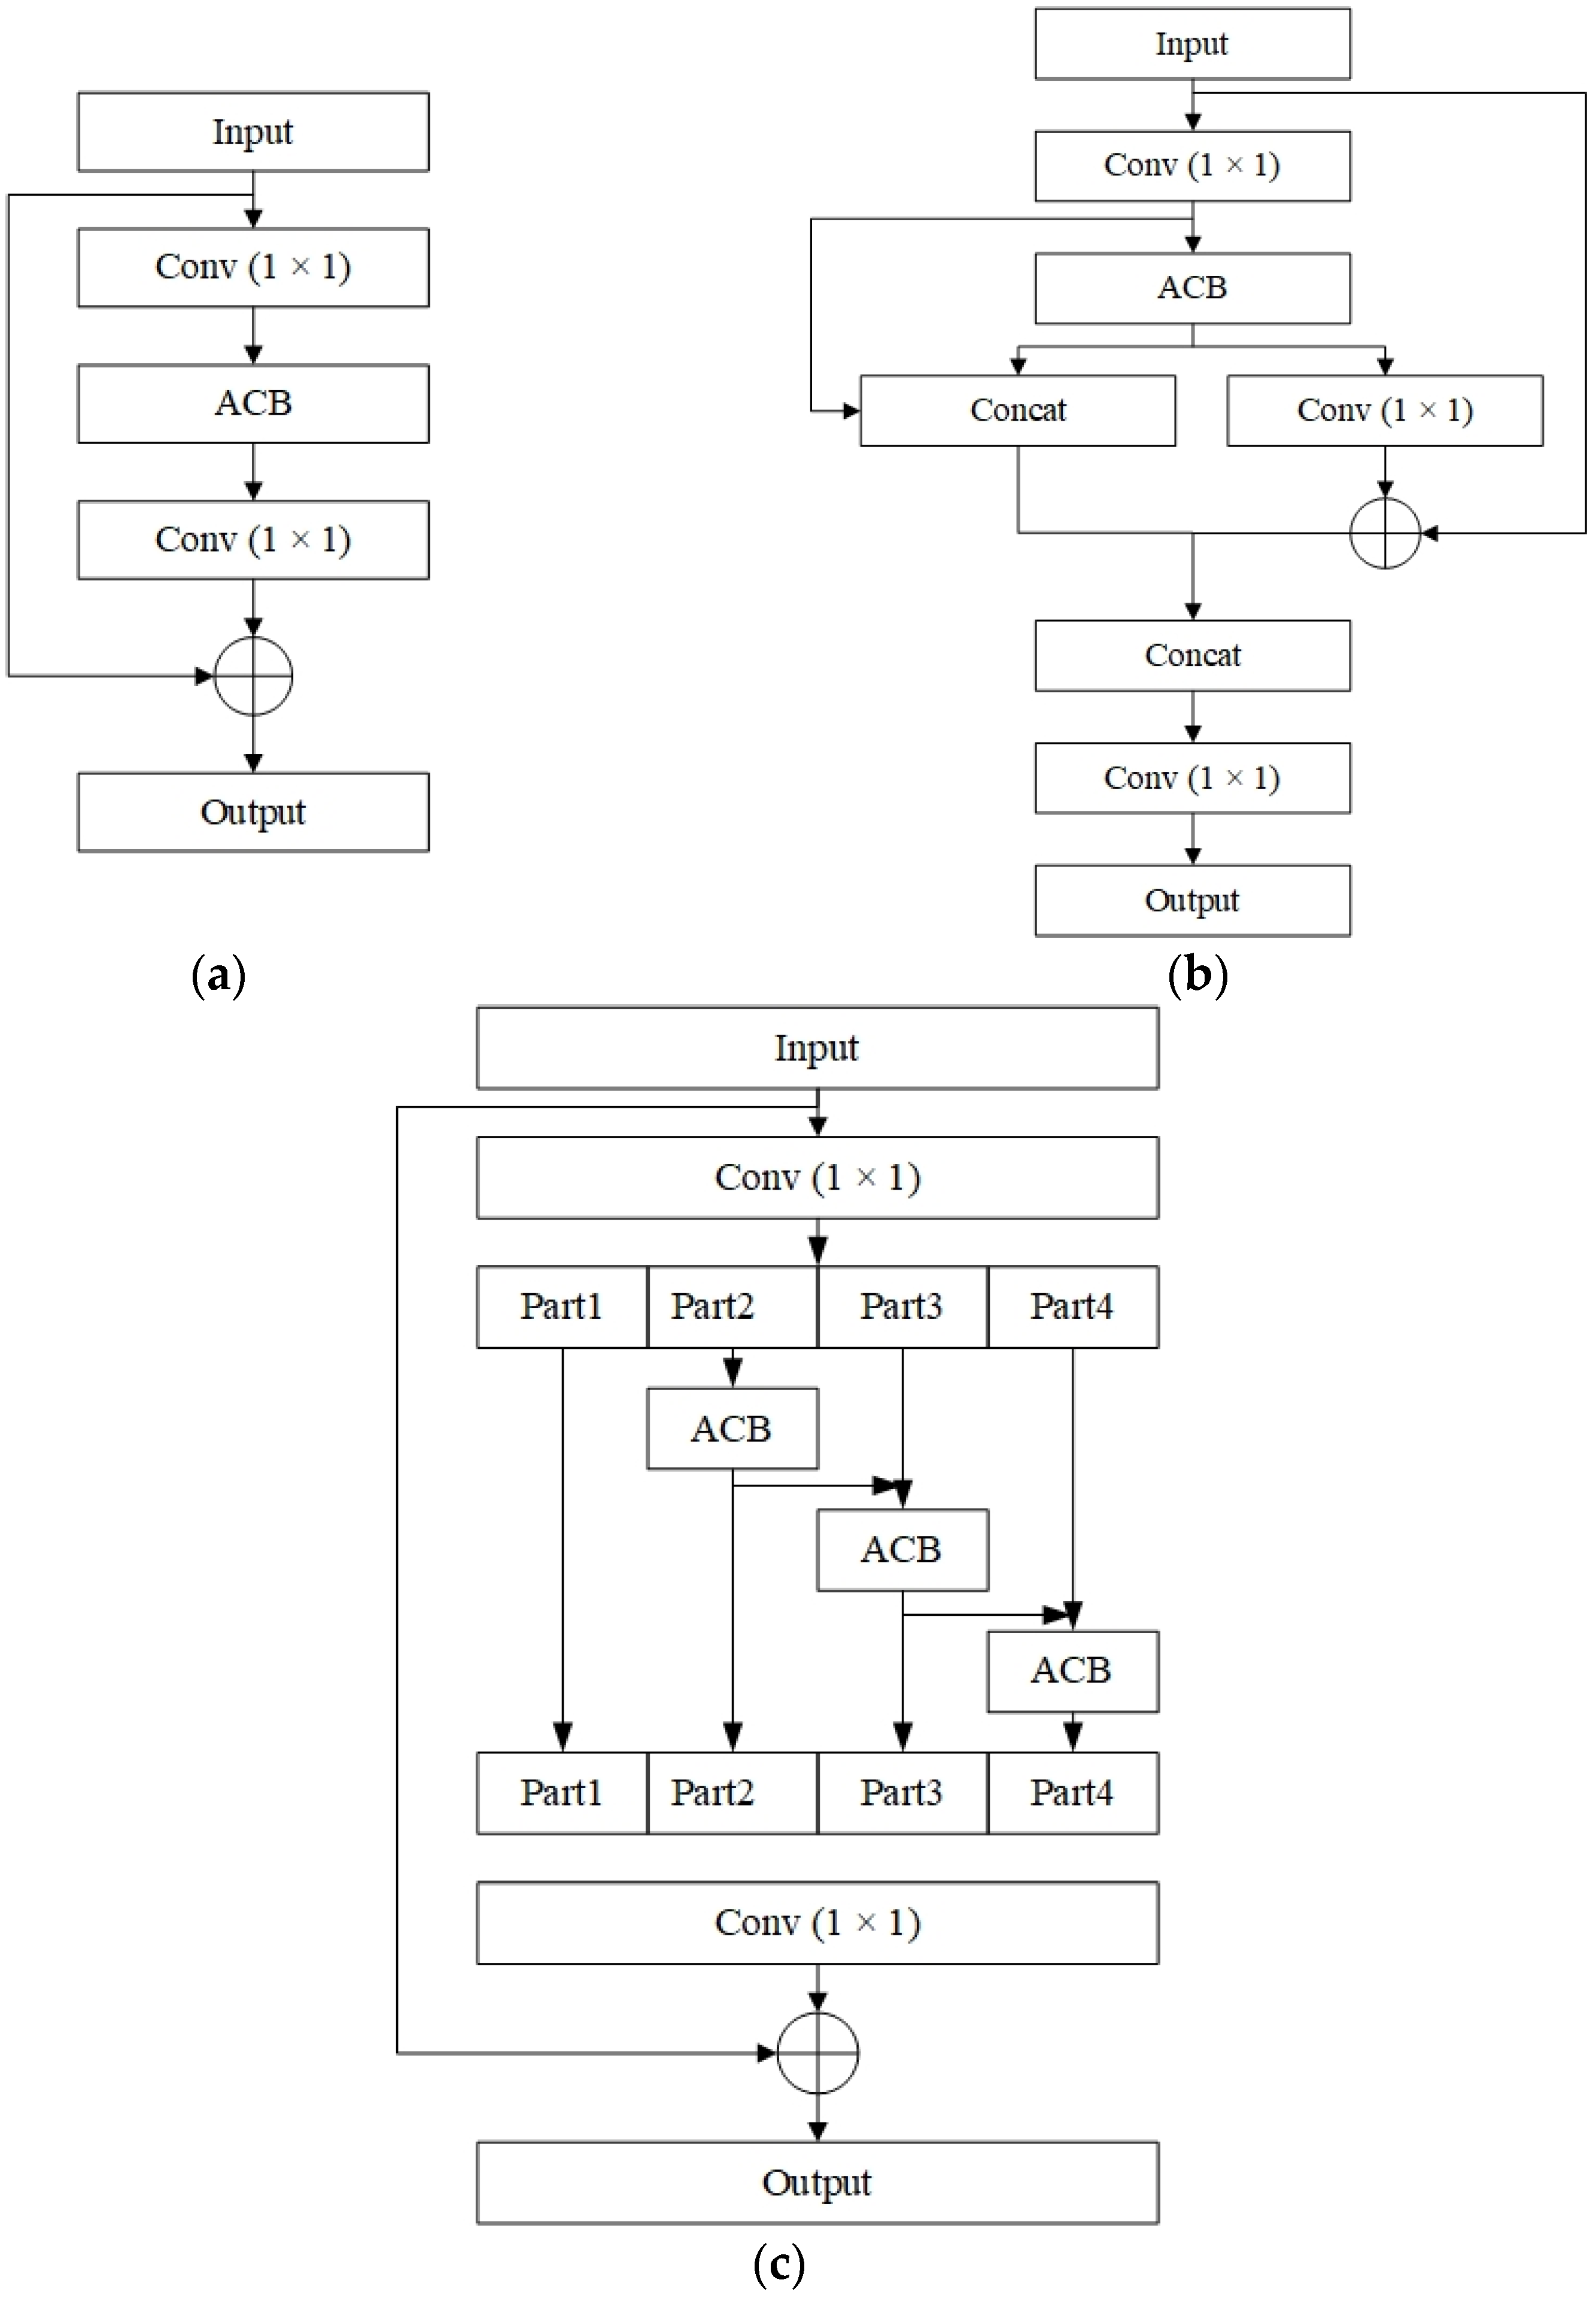
From the above experimental results, it can be seen that YOLO-UAV gives a better detection performance than YOLOv5l. The proposed improvement strategies include modifications to the backbone of the model and optimization of other parts. Specifically, they can be divided into the following five parts: (1) Inspired by asymmetric convolution, we modified ResNet, DPN, and Res2Net and proposed three feature-extraction modules, named ASResNet module, AEFE module, and ASRes2Net module, respectively. According to the respective characteristics of the above three modules, the residual blocks in different positions in the backbone of YOLOv5 were replaced accordingly. The improved modules explicitly enhance square convolutions with horizontal and vertical asymmetric convolutions. The addition of the multilayer convolution outputs together also make the extracted features more robust. (2) Since the number of channels of the input image will be expanded multiple times after passing through the Focus module, the interdependence between channels is more complicated at this time. Hence, the IECA channel attention module was added. It helps the detection model focus more on the target’s position, suppress irrelevant details, and extract more discriminative features. (3) The SPP module was replaced with GSPP. The GSPP module uses grouped convolutions to reduce the number of parameters, increasing model efficiency and reducing the risk of overfitting. (4) Use the K-Means++ algorithm to get more accurate anchor boxes. This algorithm effectively alleviates the problem of influence on convergence caused by the random selection of initial points. This helps to choose better initial cluster centers. (5) Use EIOU as the judgment basis for NMS. It not only considers the coincidence of the two prediction boxes and the distance between the center points, but also the difference in width and height. These features help improve the postprocessing capabilities of the model.
Compared with YOLOD [
48], another recently proposed target-detection method suitable for UAV aerial images, YOLO-UAV performs better in regard to detection accuracy and running speed. YOLOD adds a total of four IECA modules at various positions in the backbone and three ASFF modules at the end of the neck. Although the detection accuracy is improved, it undoubtedly increases the computational cost and slows down the operation speed. The location added by the attention mechanism in YOLO-UAV is more targeted. The asymmetric convolution it uses only slightly increases the number of parameters, but it significantly improves the feature extraction capability. The multiple convolutional structures used in the backbone enrich the extracted features and expand the receptive field of the model. The number of parameters for YOLO-UAV remains in a good range in the end.
5. Conclusions
This research analyzed the shortcomings of the detection method for UAV aerial images based on YOLO. According to the characteristics of UAV aerial images, we made some improvements on the basis of YOLOv5. The detection performance of the model is improved by the modification of the backbone and optimization of other parts. In the production of the UAV aerial image dataset, the previous Forklift dataset was expanded, and some images that were similar to natural images were replaced. We ran a series of experiments on five datasets, namely CIFAR-10, PASCAL VOC, VEDAI, VisDrone 2019, and Forklift. To verify the effectiveness of the improved strategies, ablation experiments were performed on image classification and detection tasks, respectively. The experimental results show that the improved model not only increases detection accuracy but also keeps total parameters and computational complexity at a reasonable level. The superiority of the proposed method is verified by comparison with other advanced detection methods. The experimental results from the tests on the UAV aerial images show that the proposed method still gives a better detection performance despite the challenges of small targets, dense arrangements, sparse distributions, and complex backgrounds. It is suitable for target detection in UAV aerial images. In the final experiment, different NMS methods were compared. The experimental results from the tests on the multiple datasets demonstrate that the proposed EIOU-NMS method is more effective in suppressing redundant prediction boxes.
We will continue to focus on the characteristics of targets in UAV aerial images in the future and propose more targeted optimization strategies. In terms of image collection and dataset annotation, more new target types will be involved.
