Article

A Cluster-Based Partition Method of Remote Sensing Data for Efficient Distributed Image Processing

1
International Research Center of Big Data for Sustainable Development Goals, Beijing 100094, China
2
Key Laboratory of Digital Earth Science, Aerospace Information Research Institute, Chinese Academy of Sciences, Beijing 100094, China
3
University of Chinese Academy of Sciences, Beijing 100049, China
4
State Key Laboratory of Remote Sensing Science, Aerospace Information Research Institute, Chinese Academy of Sciences, Beijing 100101, China
*
Author to whom correspondence should be addressed.
Remote Sens. 2022, 14(19), 4964; https://doi.org/10.3390/rs14194964
Submission received: 16 September 2022 / Revised: 2 October 2022 / Accepted: 3 October 2022 / Published: 5 October 2022

Abstract

:
Data stream partitioning is a fundamental and important mechanism for distributed systems. However, use of an inappropriate partition scheme may generate a data skew problem, which can influence the execution efficiency of many application tasks. Processing of skewed partitions usually takes a longer time, need more computational resources to complete the task and can even become a performance bottleneck. To solve such data skew issues, this paper proposes a novel partition method to divide on demand the image tiles uniformly into partitions. The partitioning problem is then transformed into a uniform and compact clustering problem whereby the image tiles are regarded as image pixels without spectrum and texture information. First, the equal area conversion principle was used to select the seed points of the partitions and then the image tiles were aggregated in an image layout, thus achieving an initial partition scheme. Second, the image tiles of the initial partition were finely adjusted in the vertical and horizontal directions in separate steps to achieve a uniform distribution among the partitions. Two traditional partition methods were adopted to evaluate the efficiency of the proposed method in terms of the image segmentation testing, data shuffle testing, and image clipping testing. The results demonstrated that the proposed partition method solved the data skew problem observed in the hash partition method. In addition, this method is designed specifically for processing of image tiles and makes the related processing operations for large-scale images faster and more efficient.

1. Introduction

As the volume of data (texts, images, audios and videos) generated around the world continues to increase rapidly, the processing and storage of data have become a challenging issue in recent times and will continue well into the foreseeable future [1,2,3,4]. To overcome such difficulties, big data platforms based on distributed clusters have emerged and applied in multiple domains to handle various types of massive data [5,6,7,8]. Specifically, the Apache Hadoop [9], the Apache Spark [10] and the Apache Flink [11] have been developed for massive data processing under a distributed cluster environment. Furthermore, these frameworks have been widely used by companies and research institutes around the world [12,13] with remarkable performance. As a result, it is becoming easier to mine valuable knowledge from massive databases using these tools [14]. However, the complexity of scheduling tasks is increasing compared with that for a single machine with sequential algorithms [15,16,17], despite the fact that the distributed clusters possess greater computational power. Therefore, how to schedule tasks for optimal performance and efficiency is critical for distributed platforms [18].
To schedule tasks efficiently, several data stream partition methods have been developed for the distributed platforms, most of which have a similar implementation mechanism [19]. The input data stream is always loaded and split into multiple parts according to the specific partition method, then various computing nodes are employed to process each part simultaneously to achieve distributed data processing [20]. The partition methods are critical for distributed systems, as they can regulate the workload of each computing node scientifically and effectively improve the work efficiency [21]. There have been two main types of partition methods in use up to now, the static method and the dynamic method [22]. The static methods, such as the hash, range, and grid partition methods, are typically provided officially and readily applied to a variety of data types, but they are not easily adaptable to specific data stream tasks. The dynamic methods are usually designed by the users and can be applied to specific data stream tasks. They predict and guide partitions in the future by sampling and estimating the past data streams in a dynamic way, but their construction steps are complicated. In general, different types of data streams and distributed algorithms require different partition methods [23]. Hence, how to select the appropriate partition method suitable for the task in hand is of great importance.
As is well known, improper partition can cause data skew issues, which could influence the execution efficiency directly in many tasks implemented over distributed clusters. Skewed partitions usually work harder, take longer and need more computational resources to complete the tasks [24]. This can result not only in a serious waste of computing resources but also a significant decrease in execution efficiency, and may create computing bottlenecks and even result in failure of the computing task [25]. Remote sensing images are an important category of big data given their volume characteristics [26,27]. Hence, how to select a proper partition method to efficiently process the large number of massive images under distributed clusters remains a challenge [28]. Although the partition methods are less studied than the distributed image processing methods, the improper partition could bring up tough issues. Research on the partition method mainly focus on the task scheduling. Both Costa and Bentes [29], and Sun and Zhang [30] adopted the directed acyclic graph (DAG) and the partitionable tasks to exploit the task parallelism to sufficiently utilize the available computing resources and further improve the execution efficiency. The above two methods assumed that the images were loaded evenly into each partition. However, the load balancing of partitions for image tiles remains a problem in the beginning of the processing job. Specifically, the partition methods which handle the image tiles generated by the decomposition of large-scale images over distributed clusters are still not available, and this limits the performance of image processing applications. Therefore, how to divide the image tiles into appropriate partitions is a key point that needs to be addressed to further improve the performance of distributed image processing.
To solve the data skew problem, research over the last decade has designed and developed related data partition methods. Bertolucci and Carlini [22] evaluated the impact of static and dynamic partition methods on efficiency using several graph algorithms, and demonstrated that the partition method adopted with respect to the data and algorithm characteristics could improve the task efficiency. Yu and Chen [31] repartitioned the unprocessed blocks of straggling tasks to other idle tasks according to the constructed active task list to fully utilize the computing nodes when a new task is registered. Tang and Zhang [32] evaluated the data stream distribution, sorted the partitions and split the large partition into various partitions to realize a uniform distribution. Liu and Zhu [33] generated the partition lookup table to predict and guide future partitions based on the hypothesis that the characteristics of multi-batch data would not change frequently. Tang and Lv [34] used rejection sampling to evaluate data distribution in parallel, then improved the hash or range partition methods, respectively, according to the actual application scenarios. However, the proposed algorithm was more suitable for the case where the computing power of each node was the same. Xiujin and Yueqin [35] improved the aforementioned method by adding a dynamic evaluation method for the computing resource capability to more accurately evaluate the state of each computing node and more scientifically allocate the data stream to partitions with different resource allocations. Wang and Khan [36] predicted automatically the potential problems a priori based on limited execution data and recommended the use of a locality setting and partitions. Fu and Tang [37] evaluated the characteristics of a previous data stream, strengthened the capability of the computing nodes to allocate appropriately the computing tasks and achieved an even distribution by a series of optimization measures. Huang and Wei [38] leveraged the skew detection algorithm to identify the skew partition and adjusted the task resource allocation according to the fine-grained resource allocation algorithm. Guoand Huang [39] took into account the differences in computational capabilities among the computing nodes and assigned each task to the computing nodes with the highest performance factor according to the greedy strategy. Li and Zhang [40] established a virtual partition for data partition with a huge amount of data, then used the hash partition method to further partition the data to alleviate the calculation pressure. Shen and Xiong [41] also subdivided the partition into sub partitions, adjusting the data skew and scheduled the tasks on the basis of the granularity of the sub partition. Wang and Jia [42] evaluated the data distribution according to the frequency of each data type, which was then analyzed to guide further merging or split operations of the partitions. However, the above partition methods are complex and suitable for different specialty applications, and application directly to image tiles can cause data skew problems. Moreover, there are no partition methods suitable for the remote sensing image tiles indexed by row and column numbers. Hence, an appropriate partition method for massive image tiles is needed urgently.
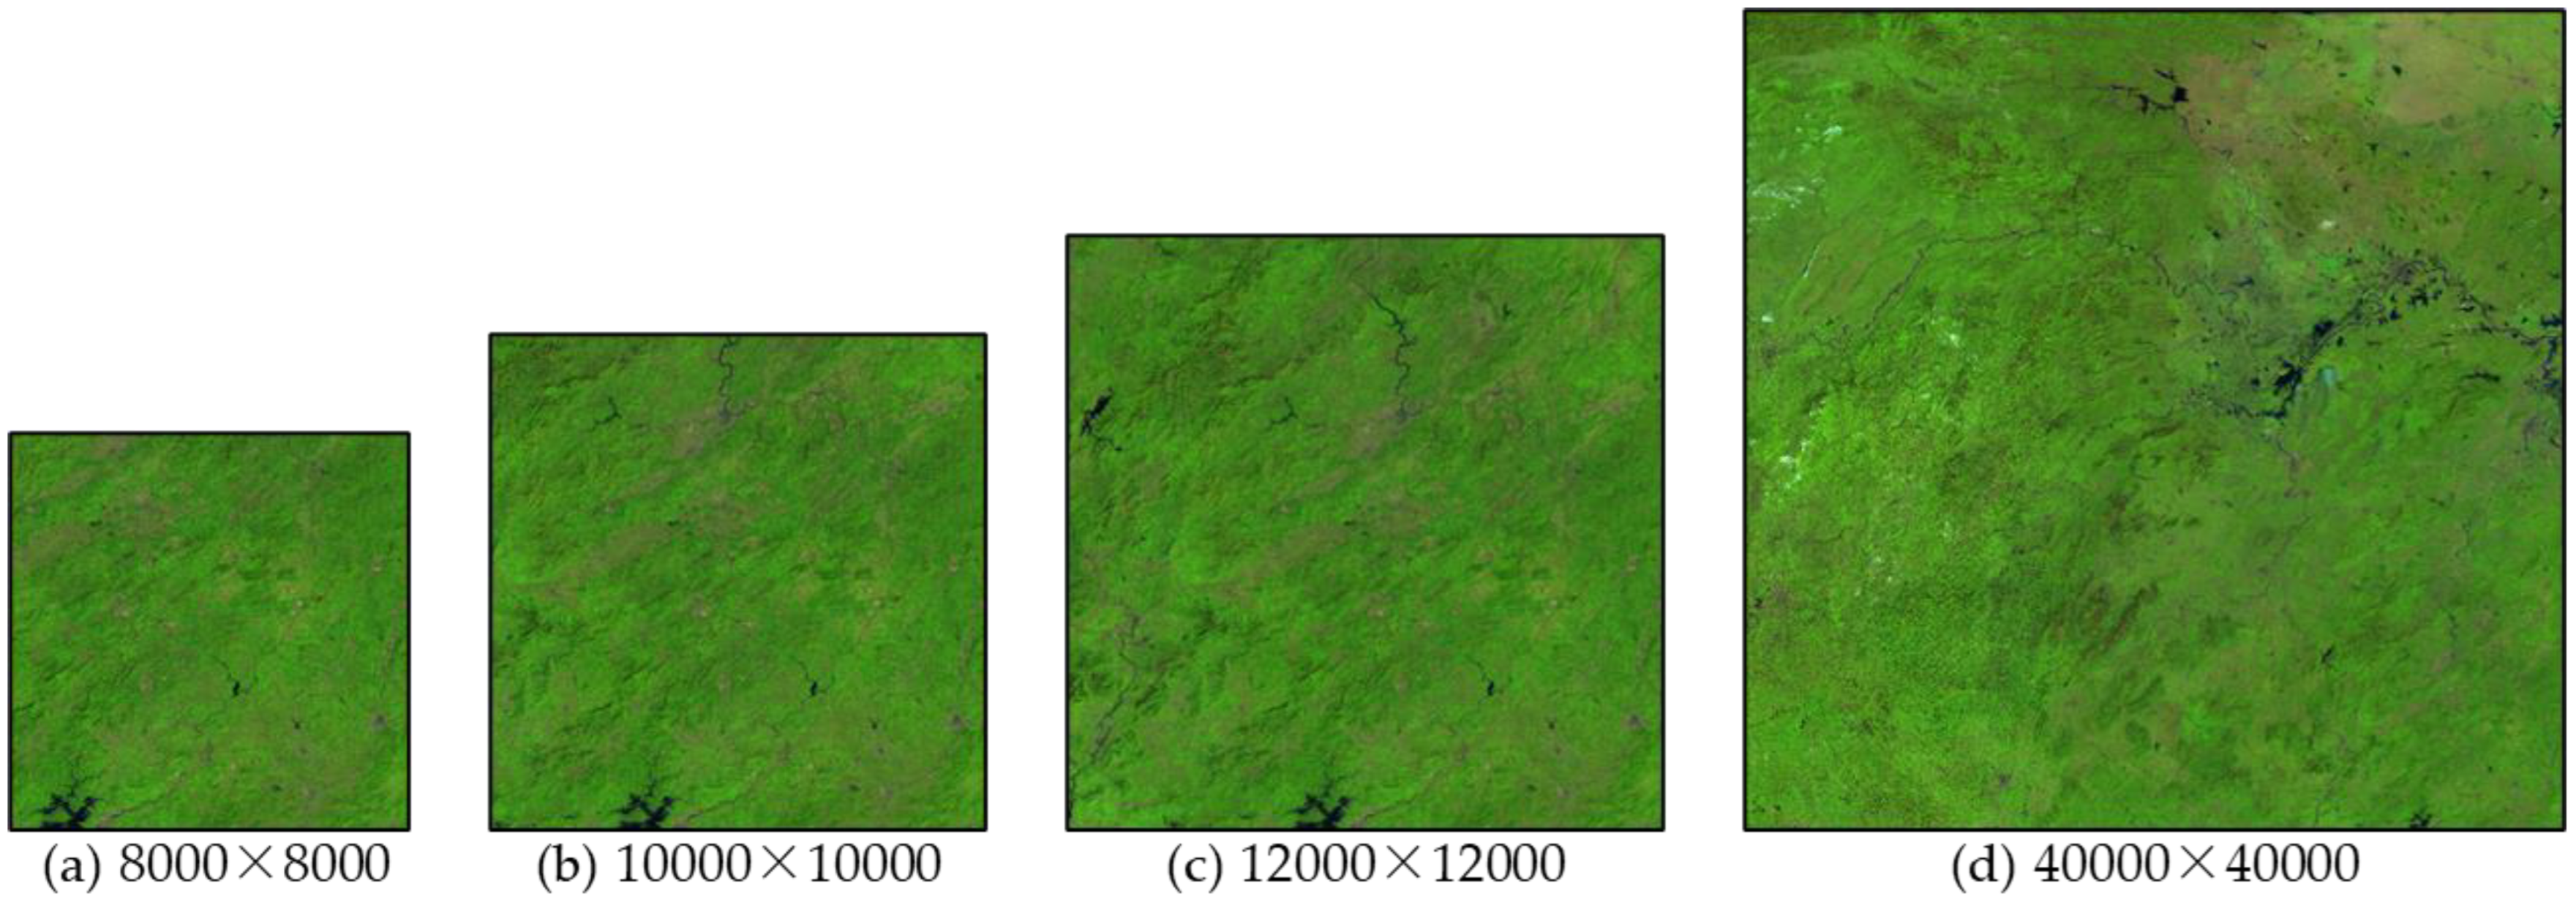
In this paper, the design of a new partition method is proposed to solve the data skew problem of image tiles, especially over distributed clusters. This partition method transforms the tile partitioning problem into a pixel clustering problem, and consists of three main steps, that is, seed point planning, the vertical direction adjustment and the horizontal direction adjustment. First, the seed point planning decides the initial location of the total partitions according to the image layout, and the initial seed points aggregate the surrounding image tiles into initial partitions. Second, the tuning operations are carried out along the vertical direction from top to bottom over the image layout. Finally, the bottom image tiles are tuned along the horizontal direction from left to right over the image layout. Hence, the final partition for the current image layout is generated, thus guiding the partitions of the image tile. Two traditional partition methods (the hash and range partition methods) were also employed to evaluate the elapsed time for the methods in terms of the image segmentation testing, data shuffle testing and image clipping testing. These experiments were carried out for four different types of image layouts with five kinds of partitions to reveal the performance in terms of the execution efficiency.
The main objectives of research were to:
  • Transform the partitioning problem into a uniform and compact clustering problem by regarding the image tiles as image pixels without spectral and texture information;
  • Propose a strategy for seed point generation of partitions based on the equal area conversion principle and tune the image tiles dynamically among the adjacent partitions to achieve an even distribution;
  • Solve the data skew problem existing in the distributed image processing tasks of the hash partition method and achieve an approximate linear relationship between the elapsed time and parallelism.
The organization of this paper is as follows. Section 2 outlines the methods. Section 3 describes the experimental design. Section 4 presents the results, and this is followed by the discussion in Section 5. Concluding remarks are given in the last section.

2. Methods

We first define three clustering principles of the image tile partitioning for the efficient parallel computation of the application tasks: (1) the number of partitions should be an integer multiple to the number of available nodes (the efficient use of resources); (2) the image tiles should be divided into partitions as uniformly as possible (even distribution); and (3) each partition should form a regular shape as possible such that the communications among nodes would be decreased (the equal area conversion).
This paper describes a novel static partition method—the raster partition method—that satisfies these clustering principles. The raster partition method is designed to leverage the row and column indexed characteristics of image tiles. In the method, massive image tiles are regarded as general image pixels which are missing the attributes of the spectrum response and texture. The proposed partition method consists mainly of three parts–the seed point planning, the vertical direction adjustment and the horizontal direction adjustment. Seed point planning is used to select the initial seed points and aggregate the image tiles to generate the initial partition. Then, the vertical direction adjustment is performed to fine tune the image tiles of the initial partition from top to bottom in terms of the vertical direction. Further, the horizontal direction adjustment is adopted to fine tune the image tiles of the remaining partition from left to right with respect to the horizontal direction. After performing these three steps, the massive image tiles would be distributed uniformly among each partition, and the data skew problem would also be solved. These three parts are explained in detail in the next section.

2.1. Seed Point Planning

In general image segmentation, the image pixels are clustered into meaningful objects according to its location, spectrum and textures information. However, the massive image tiles are regarded as image pixels with only location (column and row) information, which makes its clustering different from that of general ones. In addition, the partitioning process requires the seed points distributed evenly as possible to form regular shapes and solve the data skew problem. Therefore, we design a new initialization method for the image tile partitioning.
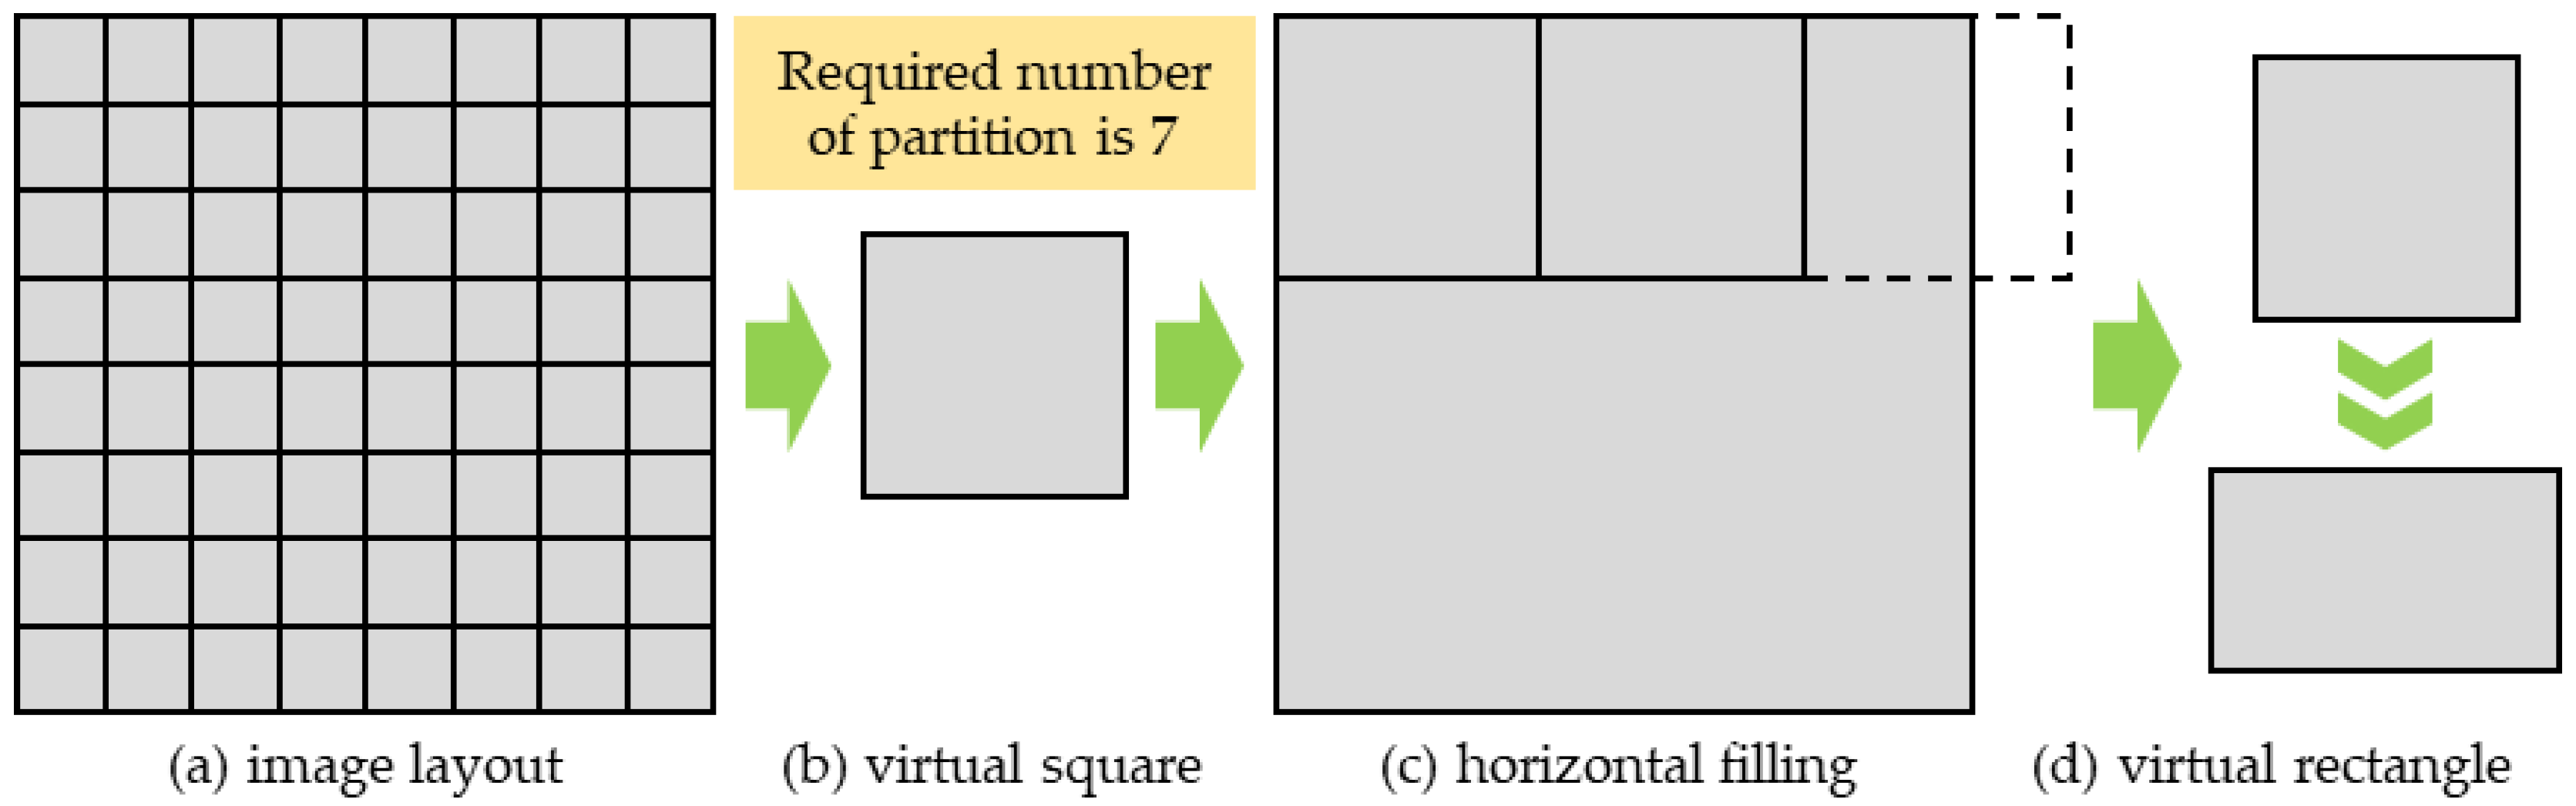
Seed point planning is the initial step of the image tile partition process, and it has a significant impact on the subsequent processing. In general, the number of seed points is determined by the number of partitions required by the application task (the number of partitions is set to 7 in all examples). Furthermore, the number of image tiles and the required number of partitions do not always have an integer division relationship, which makes it difficult to allocate evenly the total image tiles to each partition. Therefore, this section introduces the area factor of the image tile and achieves the initial uniform planning of seed points through the equal area conversion principle.
The area of each image tile is first defined as one unit, and the image area is the sum of all image tiles. The required number of partitions depends on the user’s actual demands and is used as the input parameter of the partition method. Then, the average area of the image tiles contained in each partition is calculated according to the number of partitions. A virtual square is then obtained by calculating the square root of the average partition area, as shown in Figure 1b. The virtual squares are put side by side into an image layout, as shown in Figure 1c. The maximum number (integer) of complete virtual squares that can be placed in the horizontal direction is recorded, and this is used as the number of filled virtual squares in the horizontal direction. Then, the horizontal length of the image layout is divided by the maximum number of virtual squares (integer) to get a virtual rectangle with the same area as the virtual square, as shown in Figure 1d.
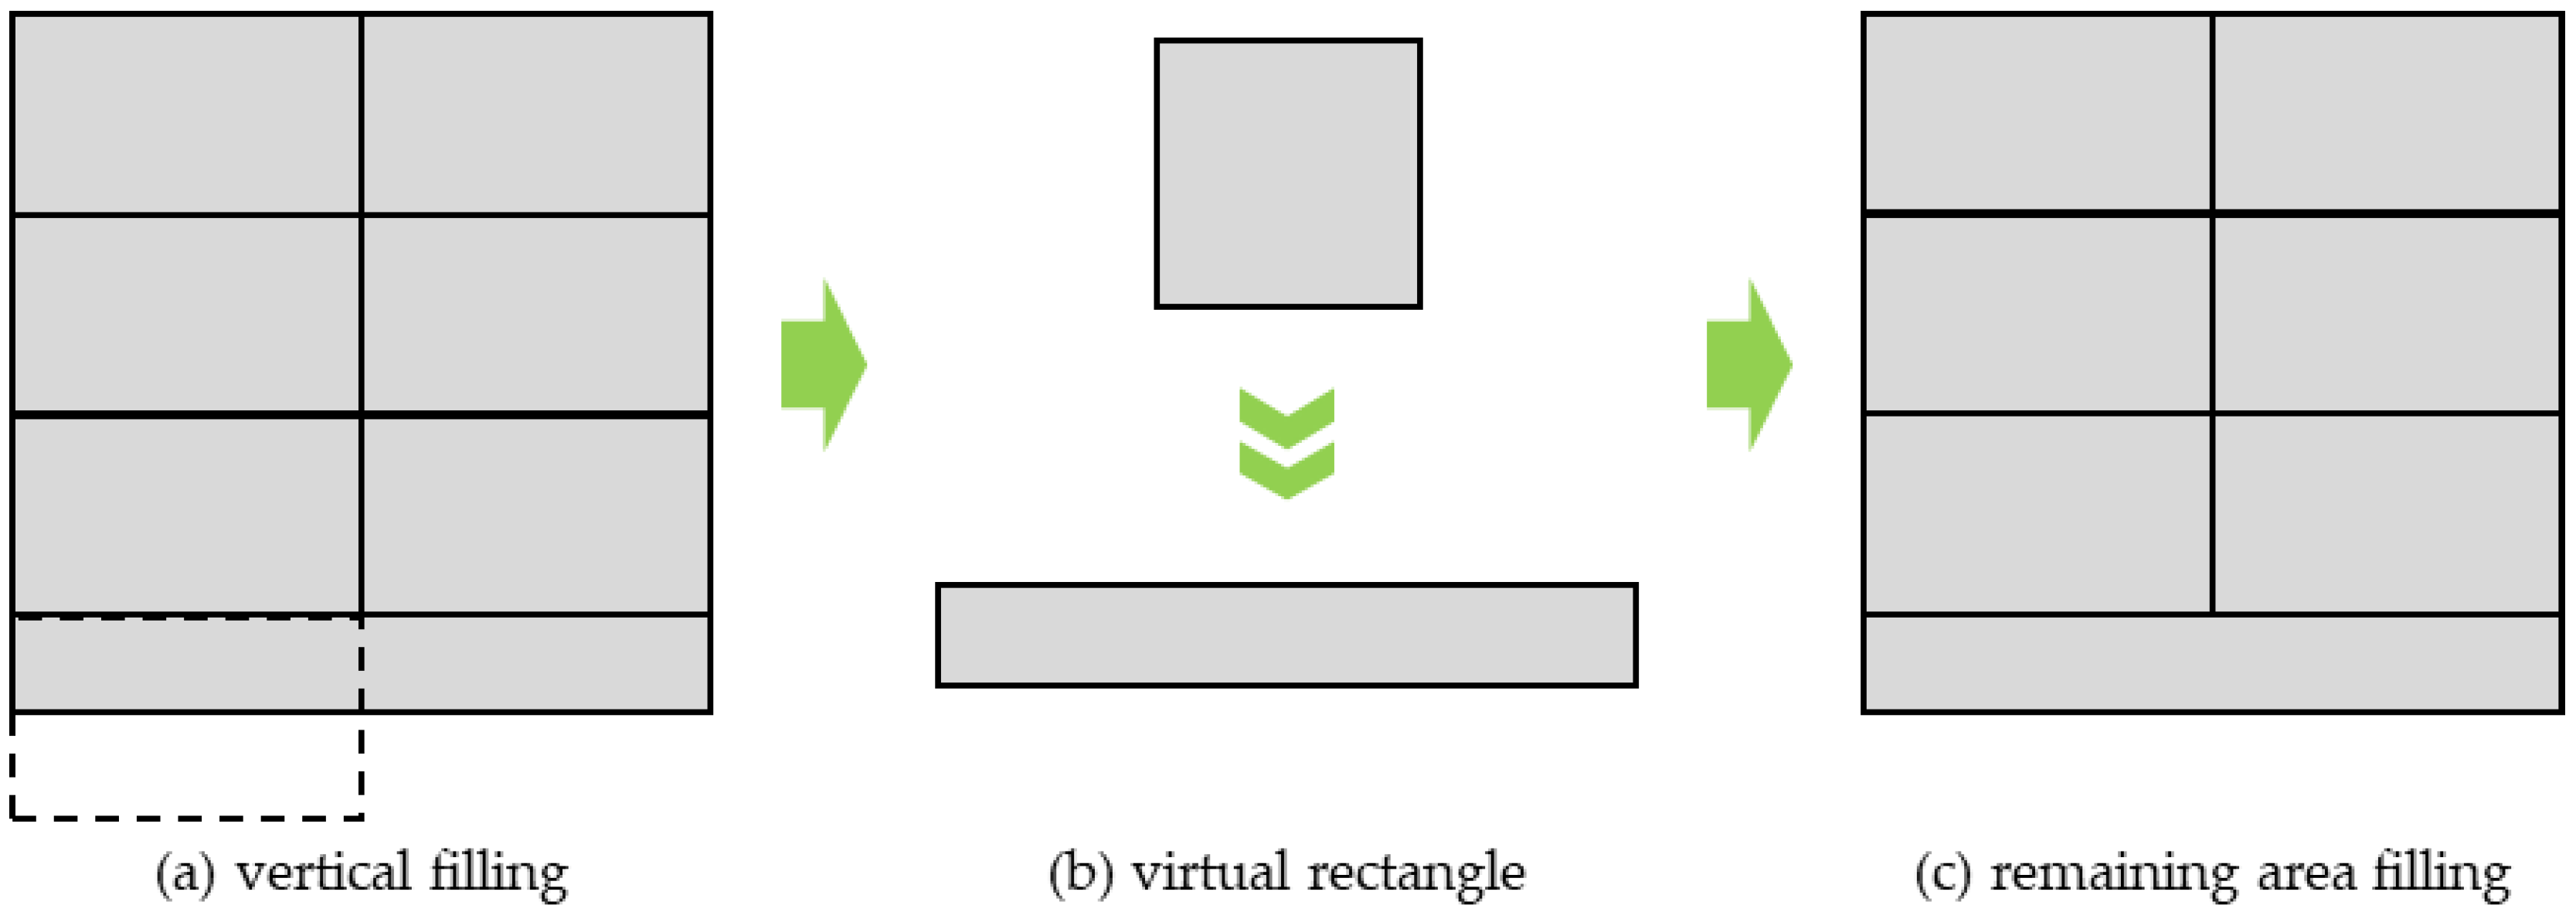
The virtual rectangle obtained by equal area conversion is used to fill the image layout in the order from left to right and from top to bottom. The maximum number (integer) of complete rectangles that can be placed in the vertical direction is recorded and taken as the number of filled virtual rectangles in the vertical direction, as shown in Figure 2a. Most areas of the image layout have been filled with regular equal area virtual rectangles, and the length and height of the remaining space of the image layout cannot meet the demands of placing virtual squares or equal area virtual rectangles at the same time. At this time, the height of the remaining space in the image layout is taken as the height, and we calculate the new virtual rectangle according to the area of the virtual square, as shown in Figure 2b. Next, the virtual square is converted into a new virtual rectangle according to the equal area conversion principle and used to fill completely the remaining space of image layout, as shown in Figure 2c. In addition, the number of new rectangles that can be placed completely in the horizontal direction is also recorded.
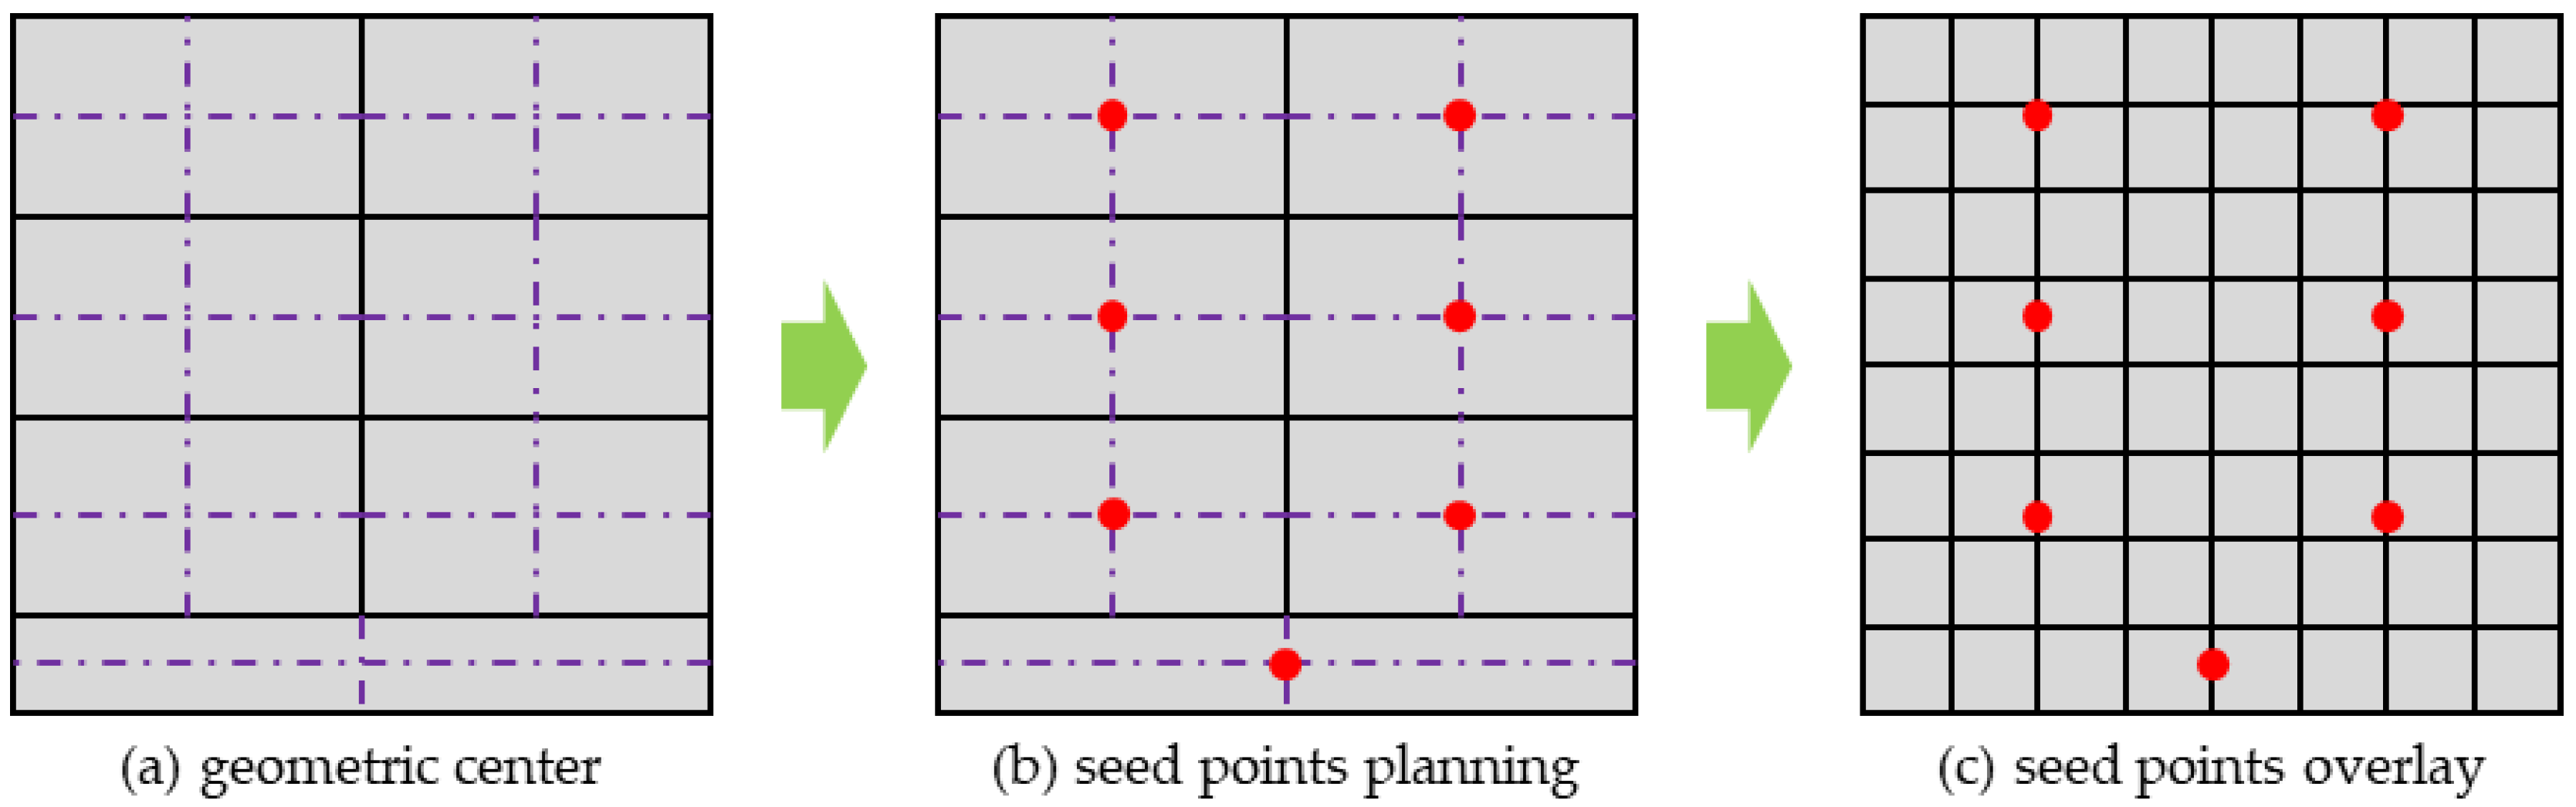
After completing the above steps, all the spaces in the image layout have been filled by two types of regular virtual rectangles according to the equal area conversion principle. In addition, the total number of each type of regular virtual rectangle is the same as that of the seed points or required partitions. The virtual square and the two types of regular virtual rectangle are both symmetrical, and the geometric center is just the center of the shape, as shown in Figure 3a. Therefore, as illustrated in Figure 3b, the geometric center of each equal area virtual rectangle in the image layout is extracted, and the corresponding horizontal and vertical coordinates are adopted as the seed point positions of the initial partition. Additionally, the category index corresponding to the partition encoding is established for each seed point. In the image layout, the image tiles are clustered according to the distance attribute with respect to the position of the initially planned seed points. All image tiles are allocated to the seed points having the closest distance, and the attribute tag information is also established to achieve the initialization of the image tiles, as shown in Figure 4a.

2.2. Vertical Direction Adjustment

Seed point planning mainly uses the clustering principle to initialize the multiple image tiles into various partitions. Although the seed points are generated according to the geometric center of the shapes of equal area, the number of image tiles in each partition still varies significantly after initialization. Hence, more optimization operations are required to modify the distribution of image tiles. The vertical direction adjustment aims to further optimize the data skew problem of image tile partition in the vertical direction.
The number of image tiles is not always an integer multiple of the number of partitions required by the application of the user. Although it is not possible to achieve an absolute average of the number of image tiles in each partition, it should be ensured that the maximum difference of the number of image tiles among each partition is one image tile, in order to effectively limit the data skew problem. Therefore, the histogram of the number of image tiles in each partition is obtained to support the adjustment process in both directions.
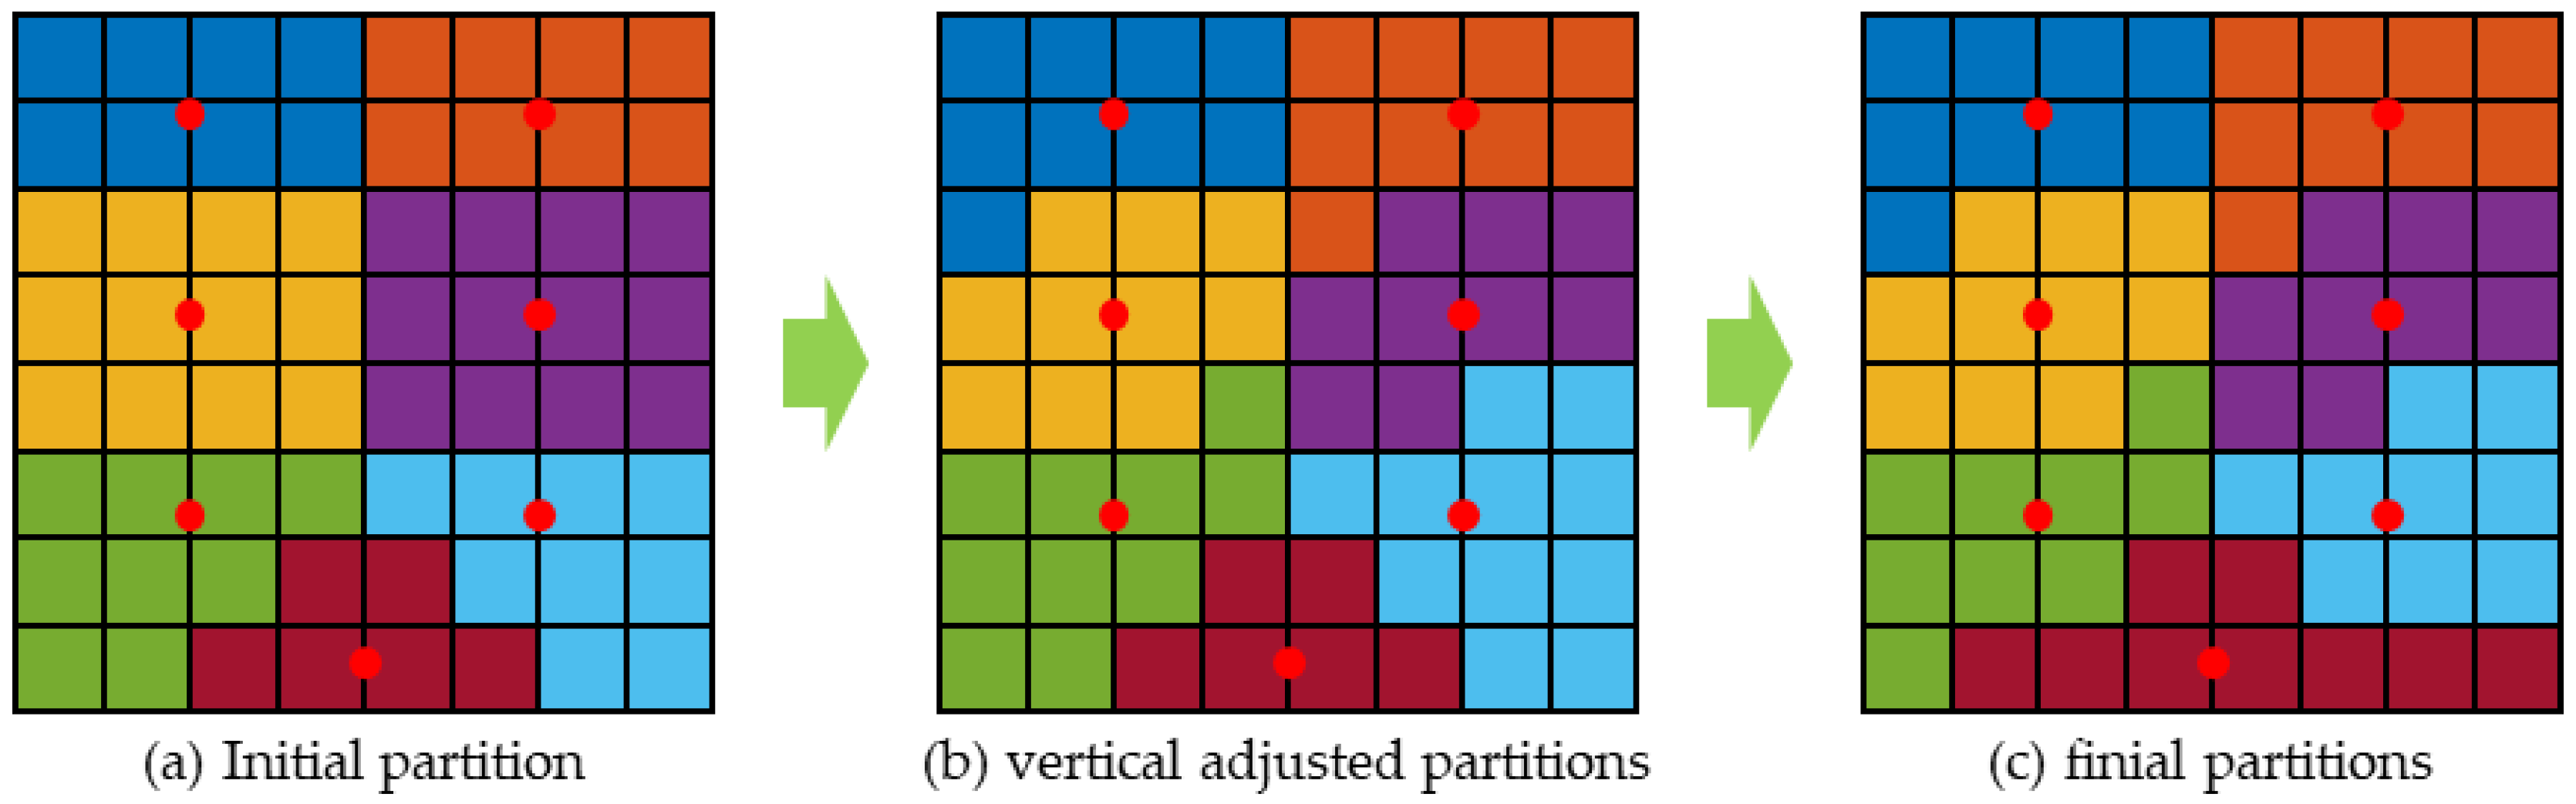
The initialization results of the image tiles are shown in Figure 4a, where most partitions have the same width in their respective vertical directions. The vertical direction adjustment will continue to maintain the equal width characteristic of these zones in their respective vertical directions. The overall order of the adjustment calculation over the image layout is from left to right in the horizontal direction and from top to bottom in the vertical direction. Each seed point and its image tile are regarded as the basic processing unit. According to the partition histogram and the average number of image tiles for each partition, another two number thresholds are set for each partition, representing the minimum and maximum number standard for the image tiles in each partition, respectively. The minimum and maximum thresholds are acquired by applying the floor and ceil functions on the average number of image tiles, respectively.
For a partition having more image tiles than the maximum threshold, the number of redundant image tiles is calculated according to the maximum threshold, which is usually the actual number of image tiles in the current partition minus the maximum threshold. All image tiles of the current partition are scanned in the vertical direction to look for its neighbor partitions in its bottom of the image layout. The processing list is established by sorting the image tiles in the current partition according to the row and column index in descending order. Then, the image tiles with the highest ranking, according to the number of redundant image tiles, are transferred to the adjacent partition, and the related tags of partitions and image tiles are also updated. The transferred image tiles will join the adjacent partition below the current partition.
For a partition with less image tiles than the minimum threshold, the number of missing image tiles is calculated according to the minimum threshold, which is usually the minimum threshold minus the actual number of image tiles in the current partition. All image tiles of the adjacent partition at the bottom of the vertical direction are interrogated. The current and the adjacent partitions are scanned at the same time. The processing list is established by sorting the image tiles in the adjacent partition according to the row and column index in ascending order. Then, the image tiles with the highest ranking in the adjacent partition, according to the number of missing image tiles, are transferred to the current partition, and the related tags of partitions and image tiles are also updated. The transferred image tiles will join the current partition from the below adjacent partition.
As shown in Figure 4b, the above adjustment process in the vertical direction will cover all but the bottom partitions which will remain stable. Therefore, the data skew problem of most partitions is solved, and the remaining data skew problem will be solved by the adjustment process for the horizontal direction.

2.3. Horizontal Direction Adjustment

After vertical direction adjustment, the data skew problem of image tiles in most partitions has been solved, but there remains a data skew problem in a small number of bottom partitions. This section is mainly concerned with how to optimize the bottom partitions in the image layout. In general, when the number of partitions can be exactly divided by the total number of image tiles, the horizontal direction adjustment would not be required.
Connected component analysis is used to scan and analyze the image tiles in the remaining bottom partitions, and the image tiles of all the data skew partitions are added to the same connected component. In the connected component, the image tiles are processed in each partition in the order from left to right along the horizontal direction according to the predefined number of partitions and the threshold values. Due to the irregular shape of the bottom connected component, it is inefficient to continue to use the simple image tile transfer as in the vertical direction adjustment. Therefore, the region growing algorithm may be adopted to process the target partitions based on four neighborhood directions (top, right, bottom and left), in order to obtain the partitions in which the number of image tiles meets the partition threshold well and all remaining image tiles in the image layout are evenly distributed.
After the bottom partitions are adjusted, the partitions in the connected component, and the corresponding mark and attribute information of the image tiles are updated. As shown in Figure 4c, through the vertical and horizontal direction adjustment, all the image tiles located in the image layout are evenly distributed in predefined partitions, which solves the data skew problem with respect to the partitioning of image tiles during the distributed processing of remote sensing images.

3. Experimental Design

In this section, comparative partition methods, the degrees of data skew, the adopted test applications, the related remote sensing images and the parametric setups are all described in detail. The performance of the proposed method is evaluated primarily in terms of the execution time for the comparison methods with various parameter settings which can visually reflect the execution efficiency.

3.1. Image Data

As can be seen in Figure 5, the synthetic Landsat remote sensing images were acquired to verify the proposed partition method [43], the location being at the southeast of China (23.75°N–33.75°N, 106.25°E–116.25°E). The image was acquired in 2021 and the spatial resolution is 30 m [44]. The image was cropped to four sizes, that is, 8000 × 8000 pixels, 10,000 × 10,000 pixels, 12,000 × 12,000 pixels, and 40,000 × 40,000 pixels. Three true color bands (red, green and blue) were selected as input data for all experiments in the study. The landscape of the remote sensing images included mountains, forests, rivers, cities and others. The image tile size of all the distributed partition experiments was set uniformly as 1000 × 1000 pixels, so that the four remote sensing images could be constructed with an 8 × 8, 10 × 10, 12 × 12, and 40 × 40 image layout, in order to increase the verification data for the samples of the distributed partition experiment.

3.2. Comparative Partition Methods

To illustrate the performance of the proposed raster partition method, another two traditional partition methods (the hash partition method [45] and the range partition method [46]) were employed as comparative methods. In terms of the hash partition method, it regards each basic element as an object and calculates the hash code of the object, then the partition number is acquired based on the number of partitions being divided by the hash code. In terms of the range partition method, it is appropriate to spread the data with keys that follows a particular order, and those data with keys within the same range will appear on the same computing node. However, the particular order of the range partition method needs to be defined by the user. In this experiment, we define the sweep curve for the range partition method. Hence, three partition methods were actually adopted to build the comparison experiment. For convenience, the partition methods implemented in the comparative experiments are referred simply as the hash, range and raster methods in the following figures, which are also specified in Table 1.

3.3. Evaluation Metircs for Partitions

In this study, two types of evaluation metrics were adopted to examine the partitions—the degree of data skew and the compactness of partitions. The degree of data skew over the partition was evaluated by the Degrees illustrated in Equation (2), where the Averege is the mean number of image tiles of all partitions [33]. To evaluate the partition methods, ten kinds of Degrees were used. The various values of the degrees of data skew were realized by changing the number of partitions, as the other conditions in this work are fixed, such as the image shape and size.
Averege = x = 1 n b B x n b
Degrees = x = 1 n b B x Averege 2 n b 1 Averege
where B x is the number of image tiles of partition x , and n b is the number of partitions.
In the study, ten types of degrees of data skew were constructed for each image layout to evaluate the partition method by setting in the experiment the number for the used computing nodes of the distributed cluster as 3–7 and 30–70. The degree of data skew was also the main variable of the experiment. As shown in Figure 6, the degree of data skew of different image layouts and partition methods shows different variation rules as the parallelism increases from 3 to 7 and 30–70, and the range of variation is 0–0.65 (this value refers to the hash partition method, while those for the range and raster partition methods are relatively small). As can be seen from Figure 6, the degree of data skew for the hash partition method is significantly higher than those for the range and raster partition methods as mentioned. The degree of data skew for the range and raster partition methods are very close to each other in various combinations of parallelism for the various image layouts.
The compactness of partitions was evaluated by the areas and bounding box, which is the ratio of pixels in the region to pixels in the total bounding box. As can be seen in Figure 7, the compactness of raster partition method is the highest in all image layouts, and the hash partition method acquired the lowest compactness in all cases. This could support the partition results of our proposed raster partition method.

3.4. Testing Applications

In this study, the applications adopted were the three stages of the distributed image segmentation process implemented over Apache Spark. They are the image segmentation stage, the data shuffle stage [47], and the image clipping stage [48]. With respect to the distributed image segmentation stage, for the first round of computing, the distributed strategy of Wang and Chen [49], and the simple linear iterative clustering (SLIC) image segmentation algorithm were employed to construct the distributed method in Apache Spark. During this stage, the image tiles distributed to each computing node were segmented to generate regular super pixels simultaneously which have a similar shape and size to each other. In terms of the data shuffle stage, the segmented image tiles which were distributed among multiple computing nodes would buffer border image pixels from their adjacent image tiles located in various computing nodes through the inner network communications. Moreover, the buffer size of each segmented image tile was predefined according to the specific applications. With respect to the image clipping stage, the buffered image tiles distributed among the multiple computing nodes should be transformed to the original shapes and sizes before the image tiles are stitched. The distributed image segmentation is a user defined application, the data shuffle is a characteristic of Apache Spark, and image clipping is an application developed by the Geo Trellis framework.

3.5. Parametric Setups

In the experiment, the implementation environment was as follows. All experiments were implemented in Apache Spark with the Hadoop Yarn mode, and the data management section of Apache Spark was used to record the elapsed times of the three test applications. The information of the basic services of the distributed cluster used is shown in Table 2.
The Apache Spark configurations used in this experiment are presented in Table 3, and where the number of executors, the executor memory, the executor cores, the driver memory and the parallelism are all set with specific values. The number of partitions was set to 3–7 and 30–70 equaling to the number of executors and the number of parallelisms.

4. Results

The results were evaluated comprehensively from four aspects, (1) the distributed image segmentation testing was used to evaluate the impact of the degree of data skew on the image segmentation process, (2) the data shuffle testing was used to evaluate the impact of the degree of data skew on the data shuffle process, (3) the image clipping testing was used to evaluate the impact of the degree of data skew on the image clipping process, and (4) the partition layout was used to illustrate the performance of the three different partition methods in the 8 × 8, 10 × 10, 12 × 12 and 40 × 40 layout schemes, respectively. The difference in the elapsed times of the jars with the same implementation parameters is a unique aspect of the evaluation. All of these tests were carried out on the Apache Spark platform. To ensure the reliability and stability of the data captured by the distributed cluster, the study involved repeat testing of each group of computing units 15 times. For the same operating environment and parameters, the differences in the elapsed times for the tasks can effectively characterize the efficiency of the various partition methods.

4.1. Image Segmentation Testing

The experimental results for the influence of data skew on the execution efficiency of the distributed image segmentation stage are shown in Figure 8. As can be seen in the layout schemes for 8 × 8, 10 × 10, 12 × 12 and 40 × 40, the elapsed times for the range and raster partition methods gradually decreased as the number of partitions increased. Meanwhile, the differences in the elapsed times between two adjacent partitions gradually decreased as the number of partitions increased. The elapsed times for the range and raster partition methods were relatively close to each other in the image layouts, especially so for the median value of the box graph. The elapsed time for the hash partition method depended more on the degree of data skew than the increase or decrease of the actual number of partitions. Therefore, the elapsed time for hash partition method did not exhibit a consistent change trend with increase in the number of partitions. For example, with an increase in the number of partitions, the elapsed time for the hash partition method represented a trend of at first decreasing and then increasing for the 8 × 8 and 12 × 12 image layouts; the elapsed time for the hash partition method could represent a trend of repeated decline and rise in the 10 × 10 and 40 × 40 schemes. Furthermore, the elapsed time difference between two adjacent partitions also varied, and there was no obvious change in the rule. In the comparison experiments, the raster partition method reduced the computational time by 21.5% and 1.5% on average compared with those for the hash and range partition methods, respectively. For each number of partition groups, the elapsed time of the image segmentation stage for each partition method continued to rise with the image layout increasing in going from 8 × 8 to 10 × 10 to 12 × 12 and 40 × 40.

4.2. Data Shuffle Testing

The experimental results for the influence of data skew on the execution efficiency of data shuffle stage are shown in Figure 9. The data shuffle time for the range and raster partition methods were similar in all image layout schemes, and, in general, the raster partition method reduced the computational time by 1.1% compared with the range partition method. In the layout schemes of 8 × 8, 10 × 10 and 12 × 12, the data shuffle time for the range and raster partition methods decreased monotonously as the number of partitions increased from 3 to 7. Although the data shuffle time for the hash partition method was close to that for the range and raster partition methods in many subfigures, the average efficiencies for the range and raster partition methods were 6.7% and 7.7% higher than that for the hash partition method, respectively. However, the data shuffle time for the hash, range and raster partition methods remained stable as the number of partitions increased from 30 to 70. In terms of the box graphs and the median values, the data shuffle time for the hash partition method was significantly different from that for the range and raster partition methods as shown in Figure 9c,e,i,j and Figure 1. In terms of the mean values, the hash partition method clearly requires more data shuffle time compared to that for the range and raster partition methods in most experiments as shown in Figure 9. The data shuffle time for the hash partition method showed a decreasing, overall flat and overall flat but with fluctuations trends separately in the 12 × 12, 10 × 10 and 8 × 8 image layouts as the number of partitions increased from 3 to 7. For each number of partition groups, the elapsed time for the data shuffle stage for each partition method continued to rise with the image layout increasing from 8 × 8, to 10 × 10 to 12 × 12 and 40 × 40.

4.3. Image Clipping Testing

The experimental results for the influence of data skew on the execution efficiency of the distributed image clipping are shown in Figure 10. In the image layout schemes for 8 × 8, 10 × 10, 12 × 12 and 40 × 40 the image clipping time for the range and raster partition methods showed a gradual downward trend and the image clipping time difference between two adjacent number of partitions was not clear as the number of partitions increased. The image clipping times for the range and raster partition methods were very similar in most subfigures, whether it is the box graphs or the median or mean values. The image clipping time for the hash partition method depended mainly on the degree of data skew, rather than the variation of the actual number of partitions. As the number of partitions increased, the image clipping time (mean value of box graph) generally showed that the phenomenon at first decreases and then rises in terms of the 8 × 8 image layout scheme, the image clipping time (mean and median of the box chart); for the 10 × 10 image layout scheme, it generally showed the phenomenon of repeatedly decreasing at first and then rising; for the 12 × 12 and 40 × 40 image layout schemes, the image clipping time (mean and median of box chart) showed a downward trend on the whole. The image clipping time difference between two adjacent partitions for the hash partition method exhibited no obvious trends. In the comparative experiments for each group, the raster partition method reduced the computational time by 8.5% and 1% on average compared with hash and range partition methods. In each number of partition groups, the elapsed time for the image clipping stage of each partition method kept rising with the image layout increasing from 8 × 8, to 10 × 10 to 12 × 12 and 40 × 40.

4.4. Partition Layout

In this study, the experiment used four images to generate four image layouts (8 × 8, 10 × 10, 12 × 12 and 40 × 40) according to the size of image tile. Given that the rendering of image layout by color separation was more intuitive, the partition details in the form of the images—as shown in Figure 11, Figure 12 and Figure 13 respectively—may be readily visualized. The range of variation in the number of partitions in this research was 3–7 and 30–70. The rendering color of each partition index was fixed, in the 8 × 8, 10 × 10 and 12 × 12 image layout schemes, seven colors were selected to render the partitions of various image layout schemes. As the image layout for 40 × 40 required at least 30 kinds of colors, it is not rendered.
As can be seen from Figure 11, Figure 12 and Figure 13, the partition results for the hash partition method were generated by the hash value of the row and column index for each image tile. Hence, the distribution of image tiles was nearly random, and there was no regular shape or obvious rules in the image layout. The partition results for the range partition method were distributed along the vertical scan line in the image layout, and the shape of the partition was relatively regular. Furthermore, the number of image tiles in each partition was very close to each other, and the maximum difference of image tiles among the partitions was no more than 1. The partition results for the raster partition method were close to a rectangle. The maximum difference of image tiles among the partitions for the raster partition method was also no more than 1. However, the image tile distribution for the raster partition method was more compact than that of the range and hash partition methods.

5. Discussion

In this research, the raster partition method is proposed to solve the improper partition problem of image tiles decomposed from large-scale images. This method focused on the unevenly divided image tiles among partitions which occurs in the loading or dividing stages and leads to the data skew problem. The researches of [29,30] focused on the task parallelism problem, which profiled the applications in remote sensing field and incorporated them with DAG to realize the further optimization the execution time. They usually find the partitionable tasks and build the task parallelism based on the analysis of the dependencies among tasks, while the load balancing in the beginning of the task were not discussed. The load balancing and the task parallelism concentrate on the partition problems occurring in different computing stages, but both of them could promote the further improvement of the execution efficiency. Additionally, the task parallelism method would be the further study point in our research.
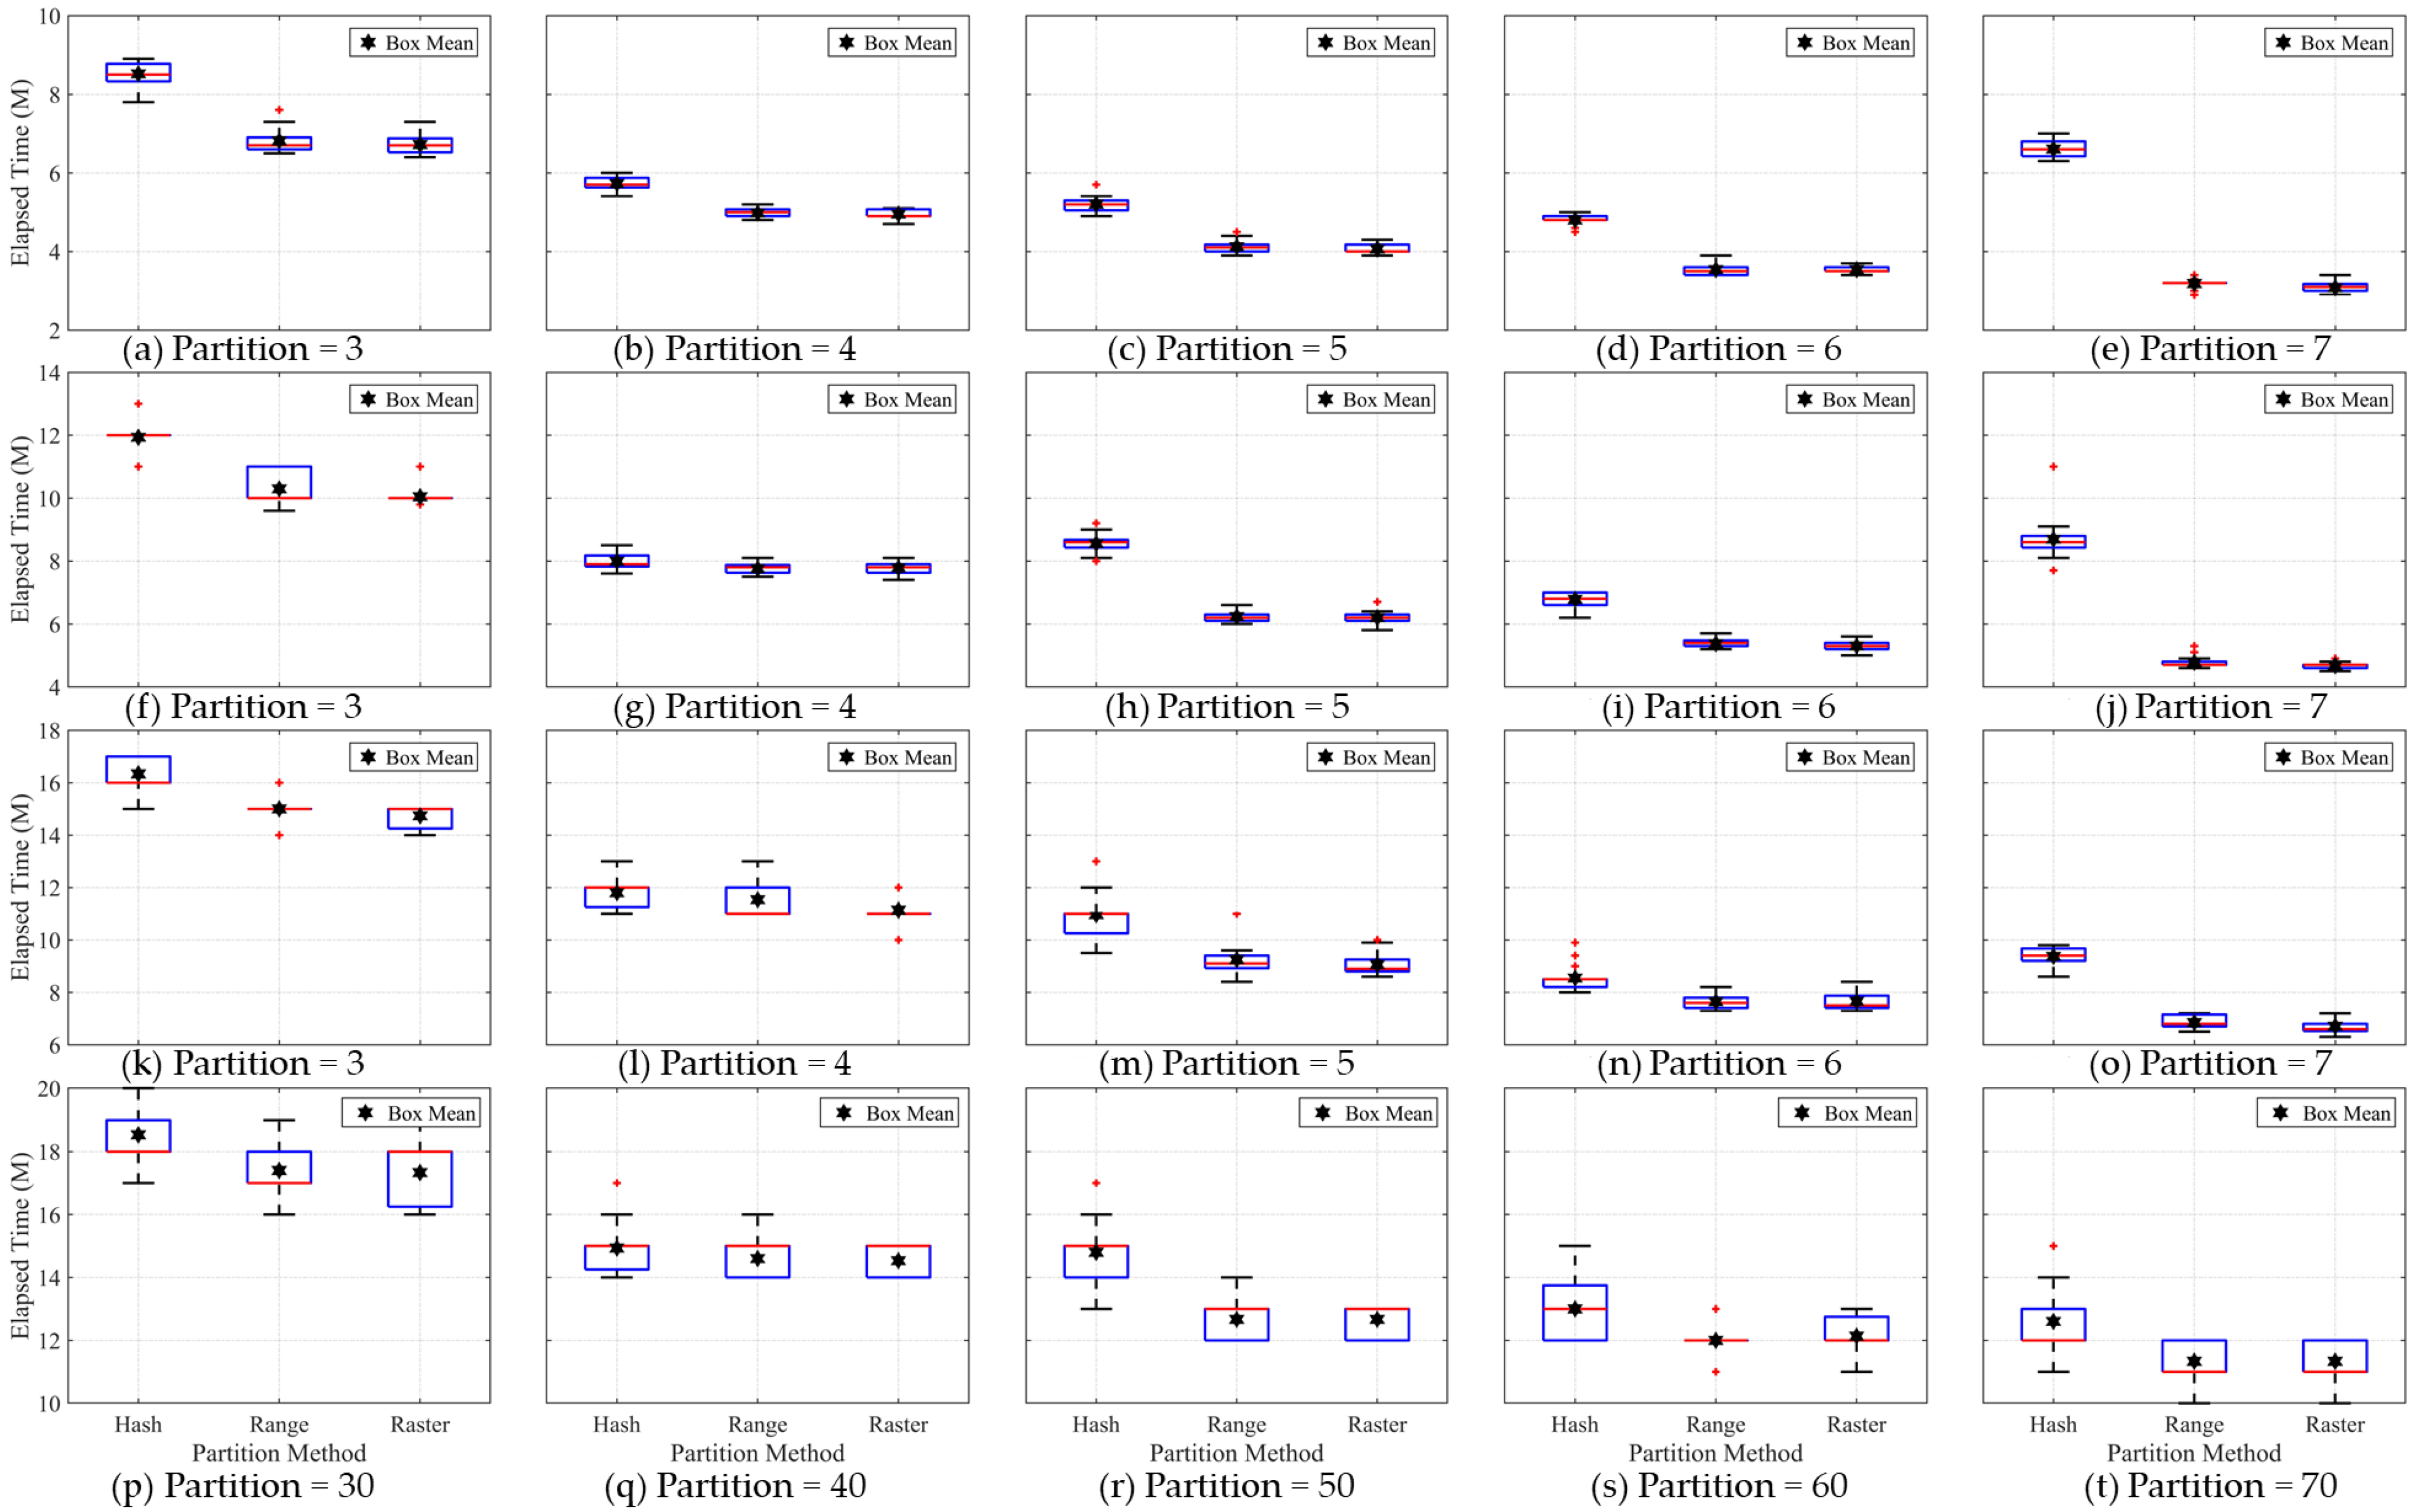
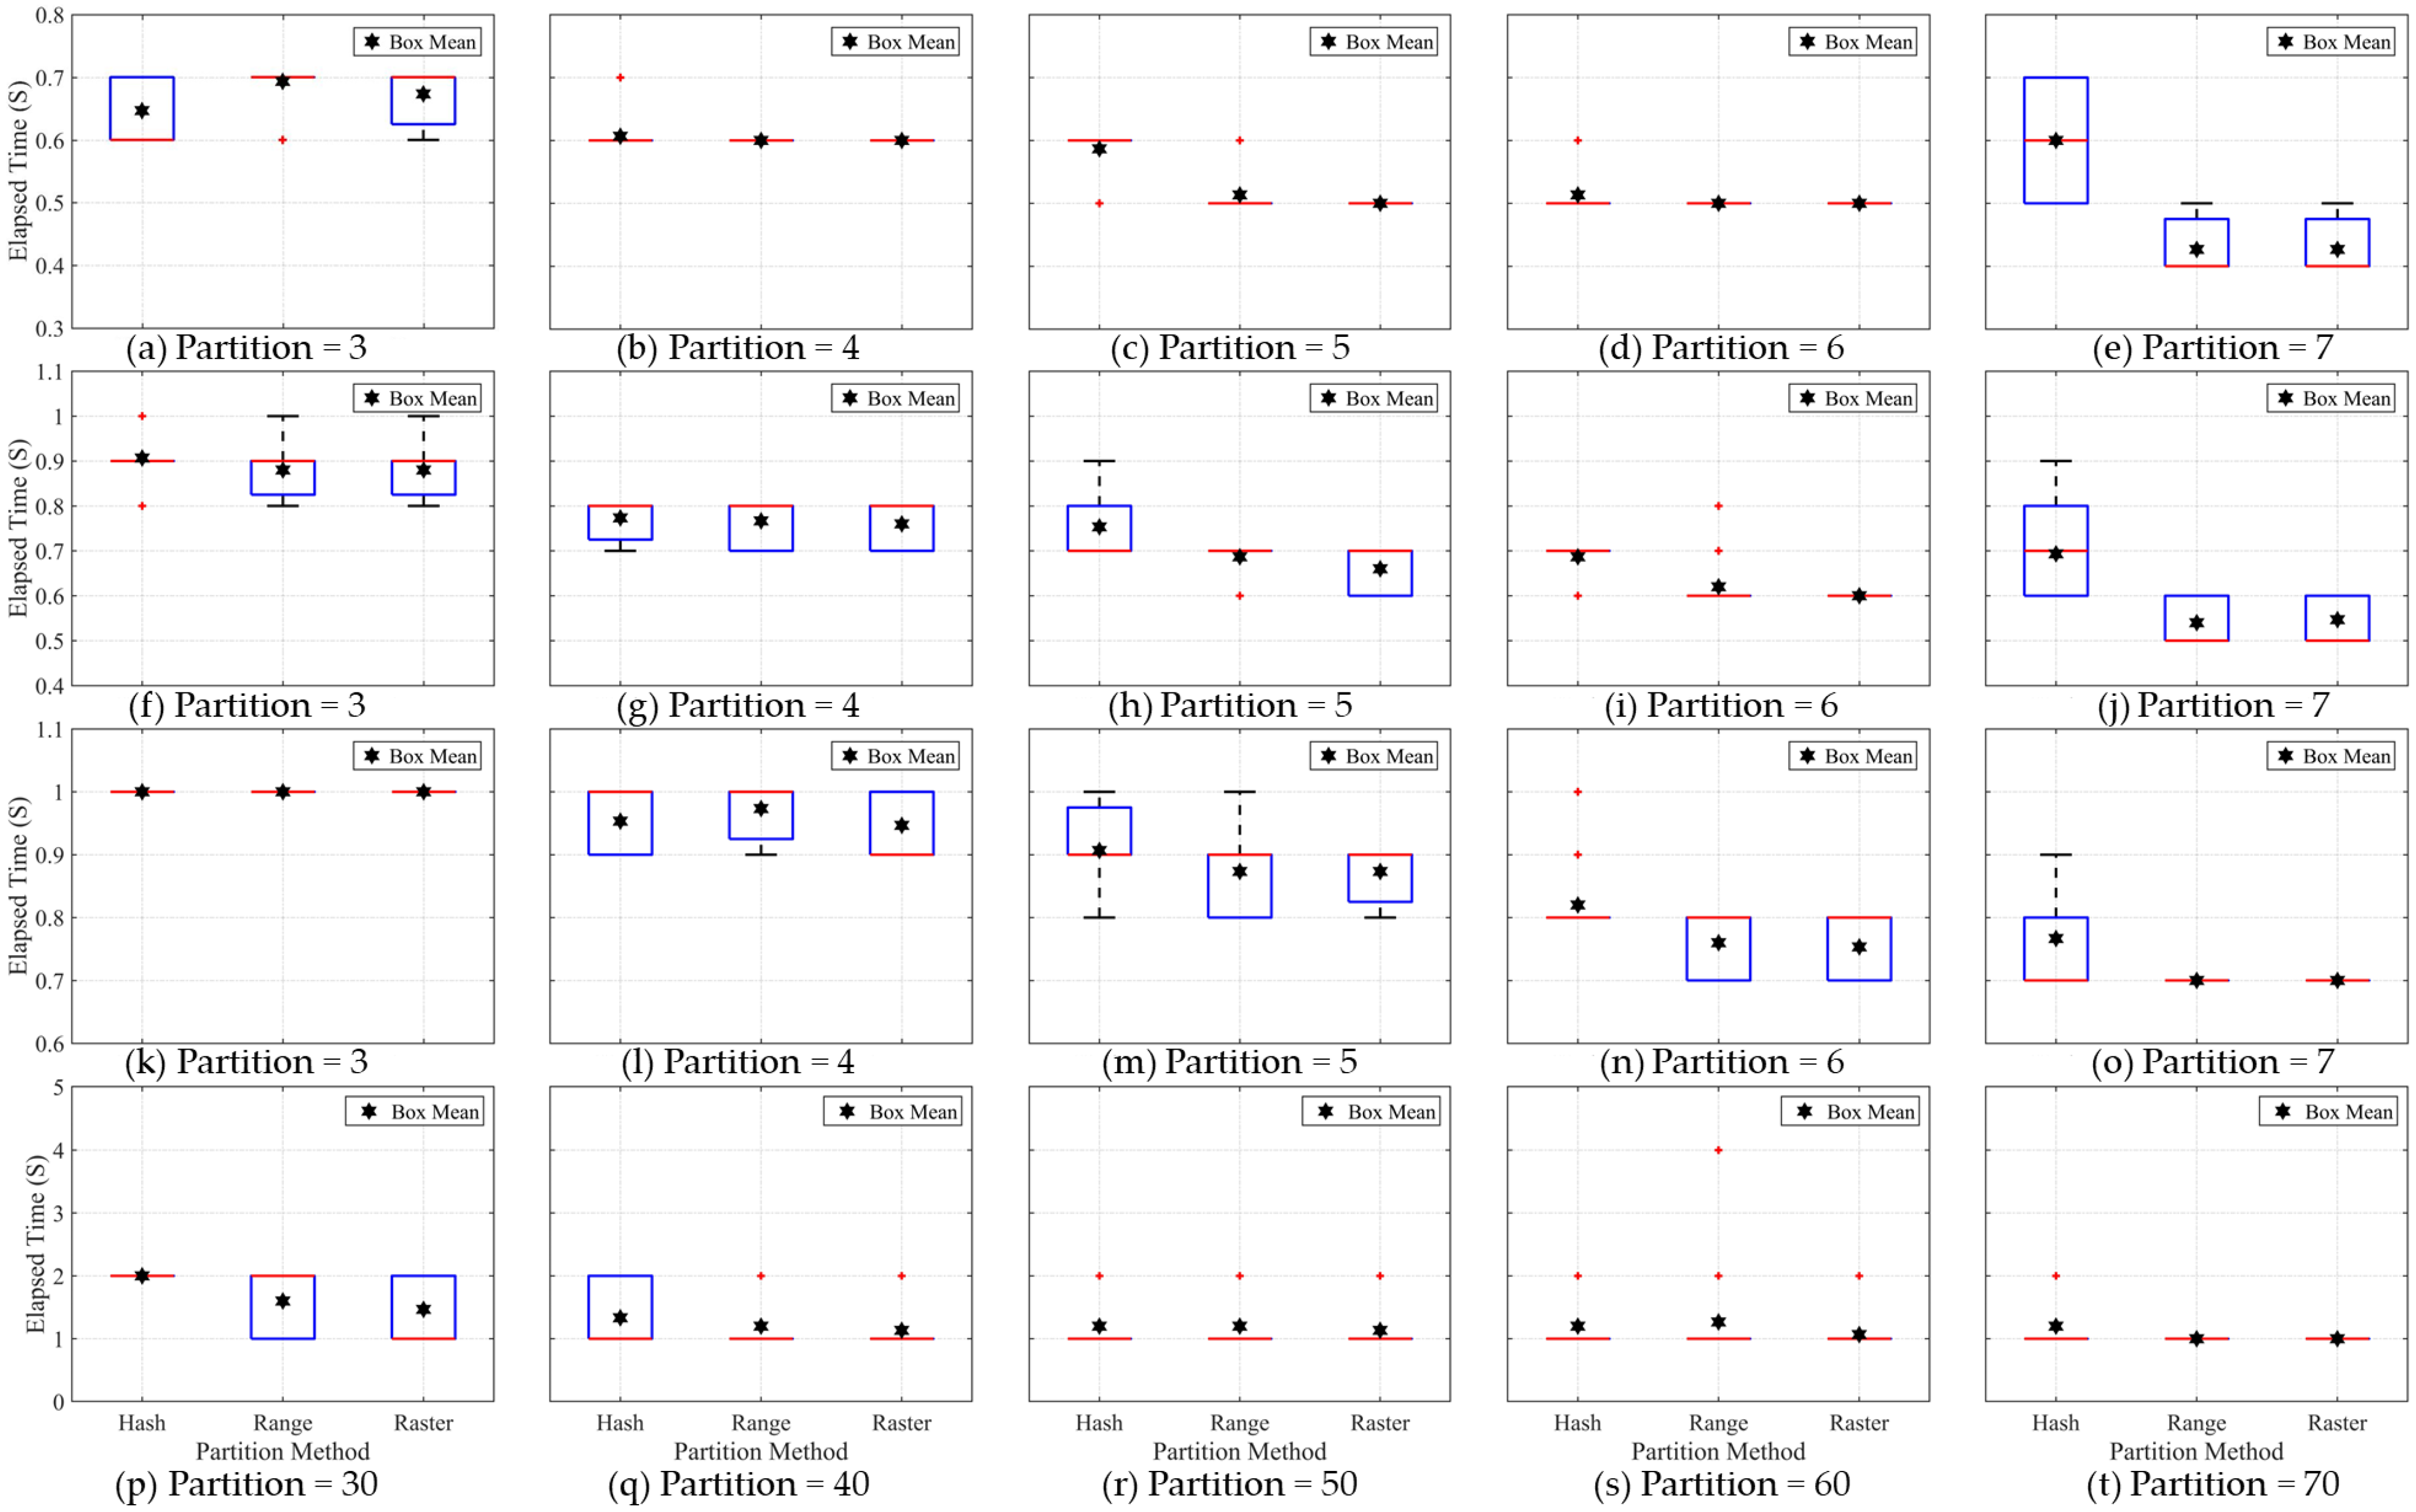
In terms of testing the image segmentation stage, the box graph is used to represent the elapsed time for all the repeat tests. The elapsed time recorded in each group changes within a certain range rather than having a fixed value, which is mainly caused by the operating condition of the distributed cluster and each computing node. When performing each round of calculation with a fixed number of computing nodes, the combination among these computing nodes is not unique, hence this will affect the execution efficiency of the same application task. The hash partition method requires more operational time than the range and raster partition methods in the image segmentation stage. The elapsed time for the hash partition method is affected by the degree of data skew and will rise with increase in the number of partitions, while the other two partition methods solve the problem of data skew. Although the elapsed time difference between the range and raster partition method is usually small, the elapsed time of the raster partition method is slightly lower than that of the range partition method.
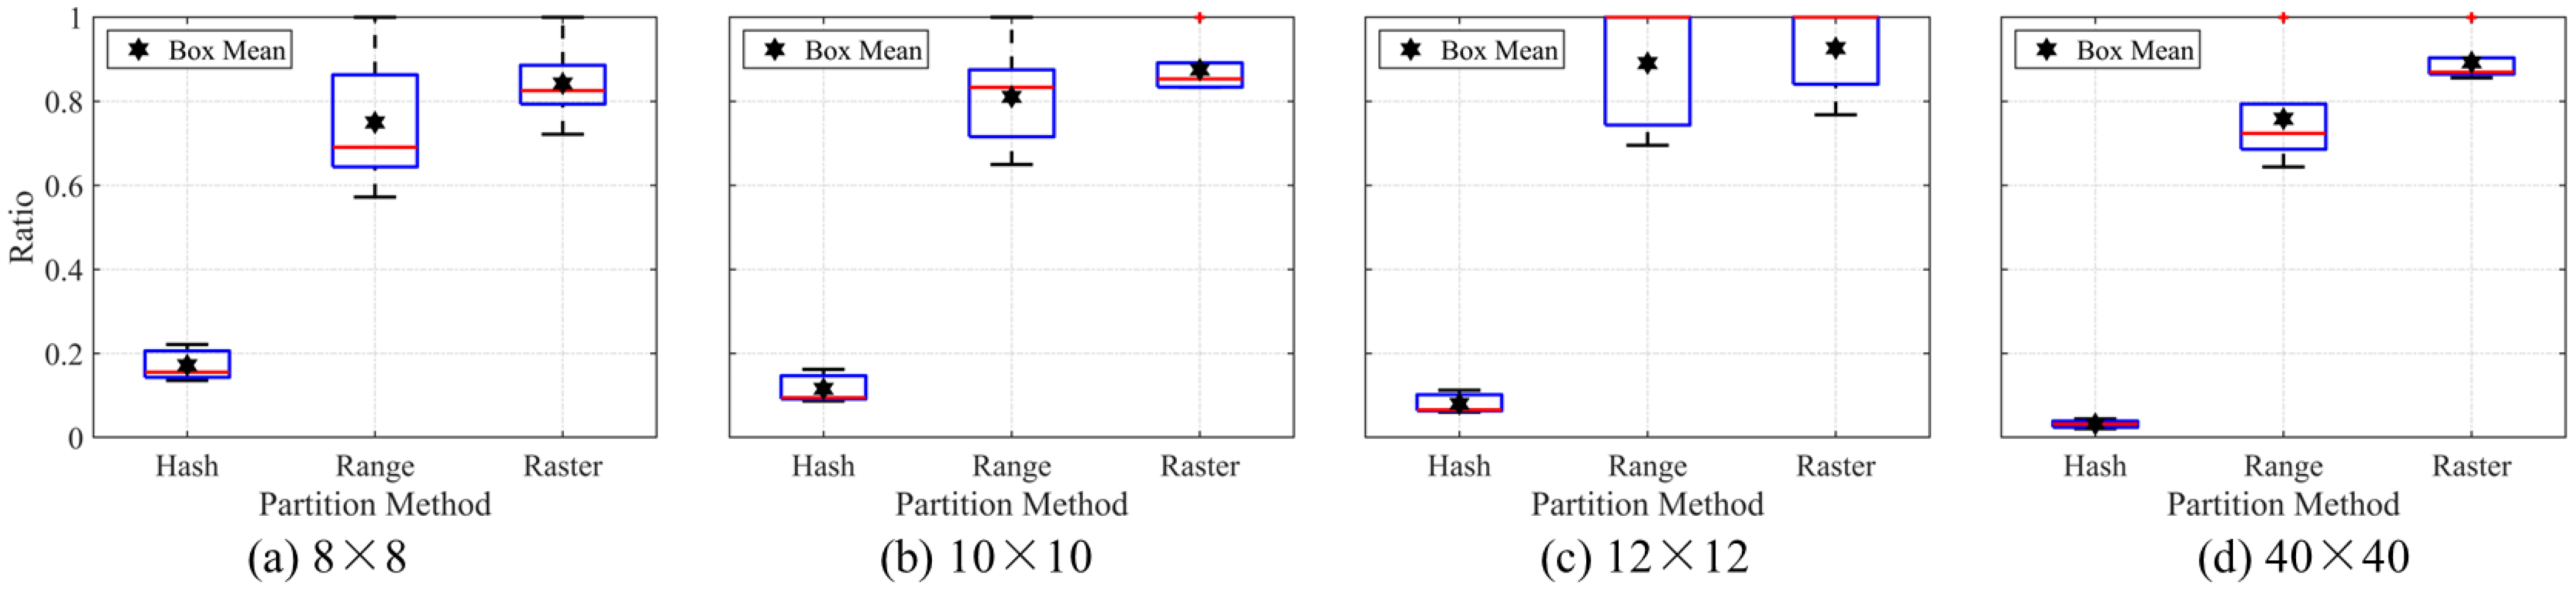
In terms of testing the data shuffle stage, the two highest degrees of data skew for the hash partition method will clearly lead to the highest data shuffle time (as shown in Figure 9). The higher the degree of data skew, the more the image tiles are contained in a small number of partitions. As is well known, the data shuffle process needs to obtain the image pixels of the image tiles located in the surrounding neighborhood, therefore, the partition needs to communicate using an internal network with more partitions (computing nodes) during the data shuffling stage. Compared with the internal network communication of the distributed cluster, the amount of image tiles is relatively small, therefore, a very high degree of data skew can lead to significant changes in the data shuffle time. In addition, the data shuffle time for the range partition method is slightly more than that for the raster partition method according to the average elapsed time for the data shuffle. The verification results show that the proposed raster partition method has a more compact partition structure and better efficiency performance among the three partition methods. On the one hand, due to the limitation of the Apache Spark platform management components, the elapsed time for all experiments can only be accurate to 0.1 s, which leads to a lack of accuracy in the recording of the elapsed time to a certain extent. On the other hand, other applications or service programs may occupy the internal network for communication when the test task is run in this experiment.
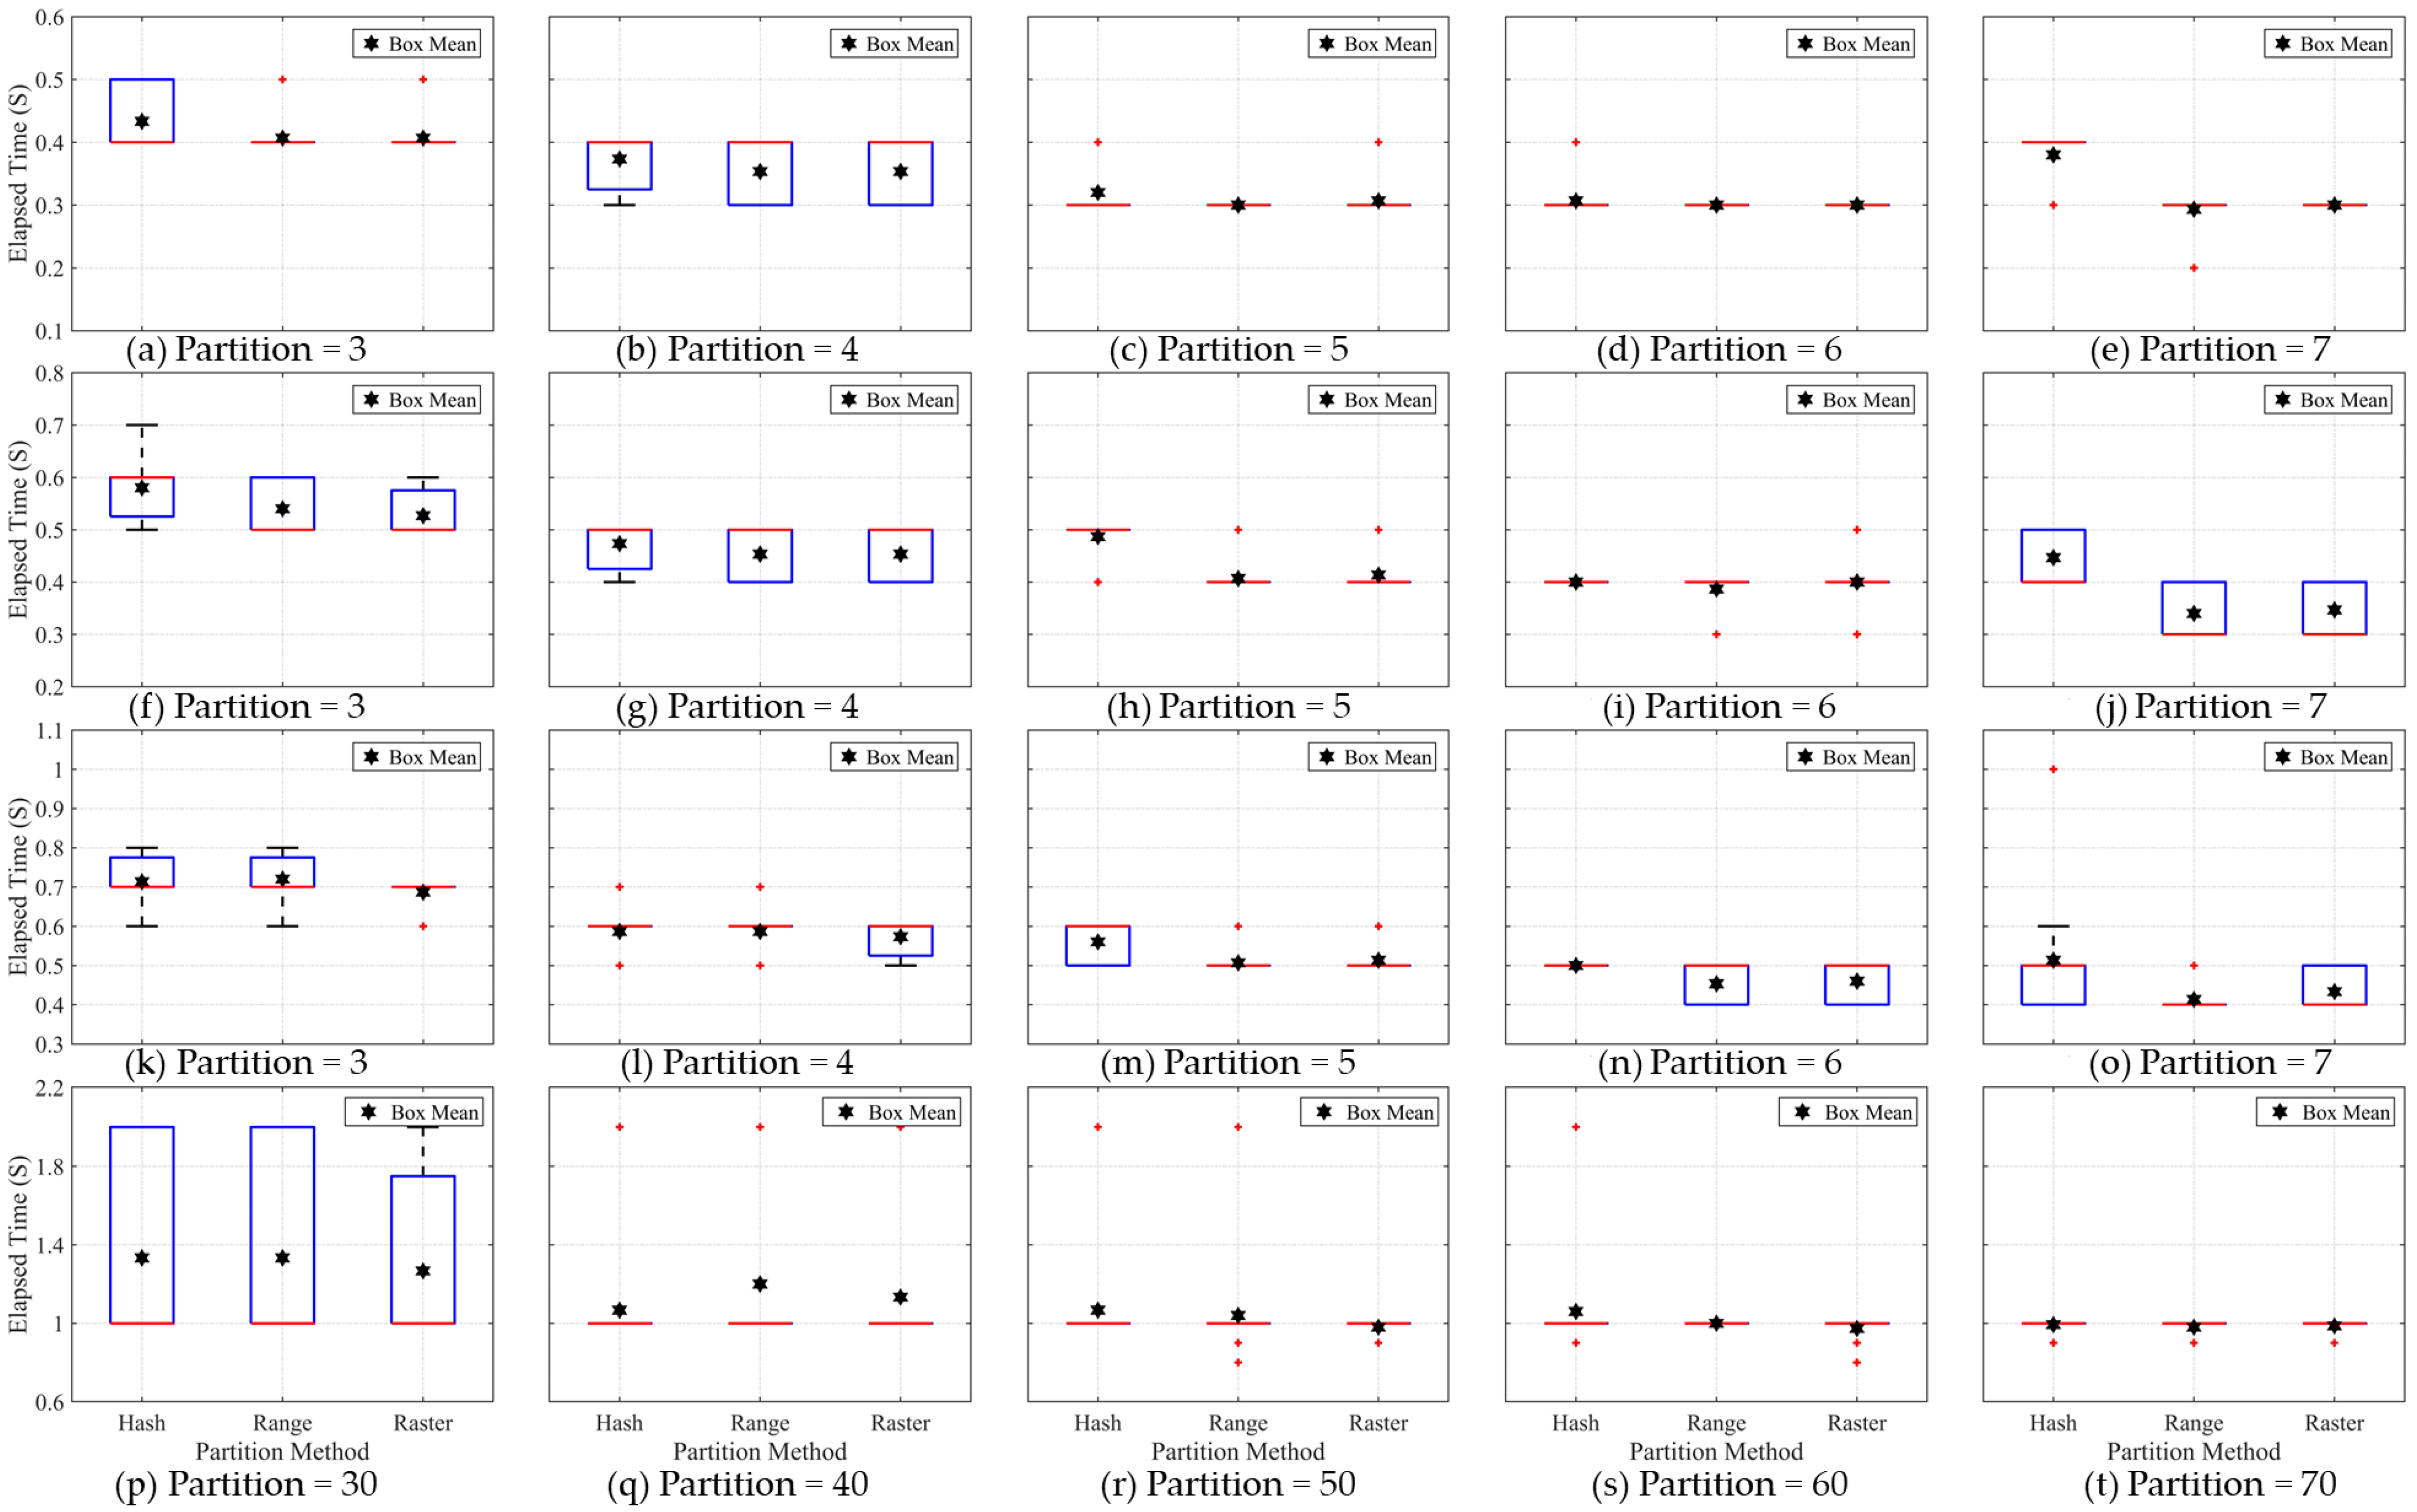
In terms of the testing of the image clipping stage, the image clipping process is a built-in function of the Geo trellis framework and is used to evaluate the impact of the variation in the number of partitions on the elapsed time. The elapsed time difference of image clipping stage can further verify the results generated by the former two test experiments. The elapsed times for the hash, range and raster partition methods were very close where the degree of data skew for the hash partition method was relatively low. In contrast, the elapsed time for the hash partition method can be clearly distinguished from that of the range and raster partition methods when the degree of data skew for the hash partition method was relatively high. This is because the image clipping function in the Geo trellis framework is very simple and requires very little operating time to complete. Therefore, only a huge difference of image tiles in each partition can lead to the relatively clear change in the operating time. The experimental testing shows that the data skew problem will indeed affect the efficiency of the distributed applications.
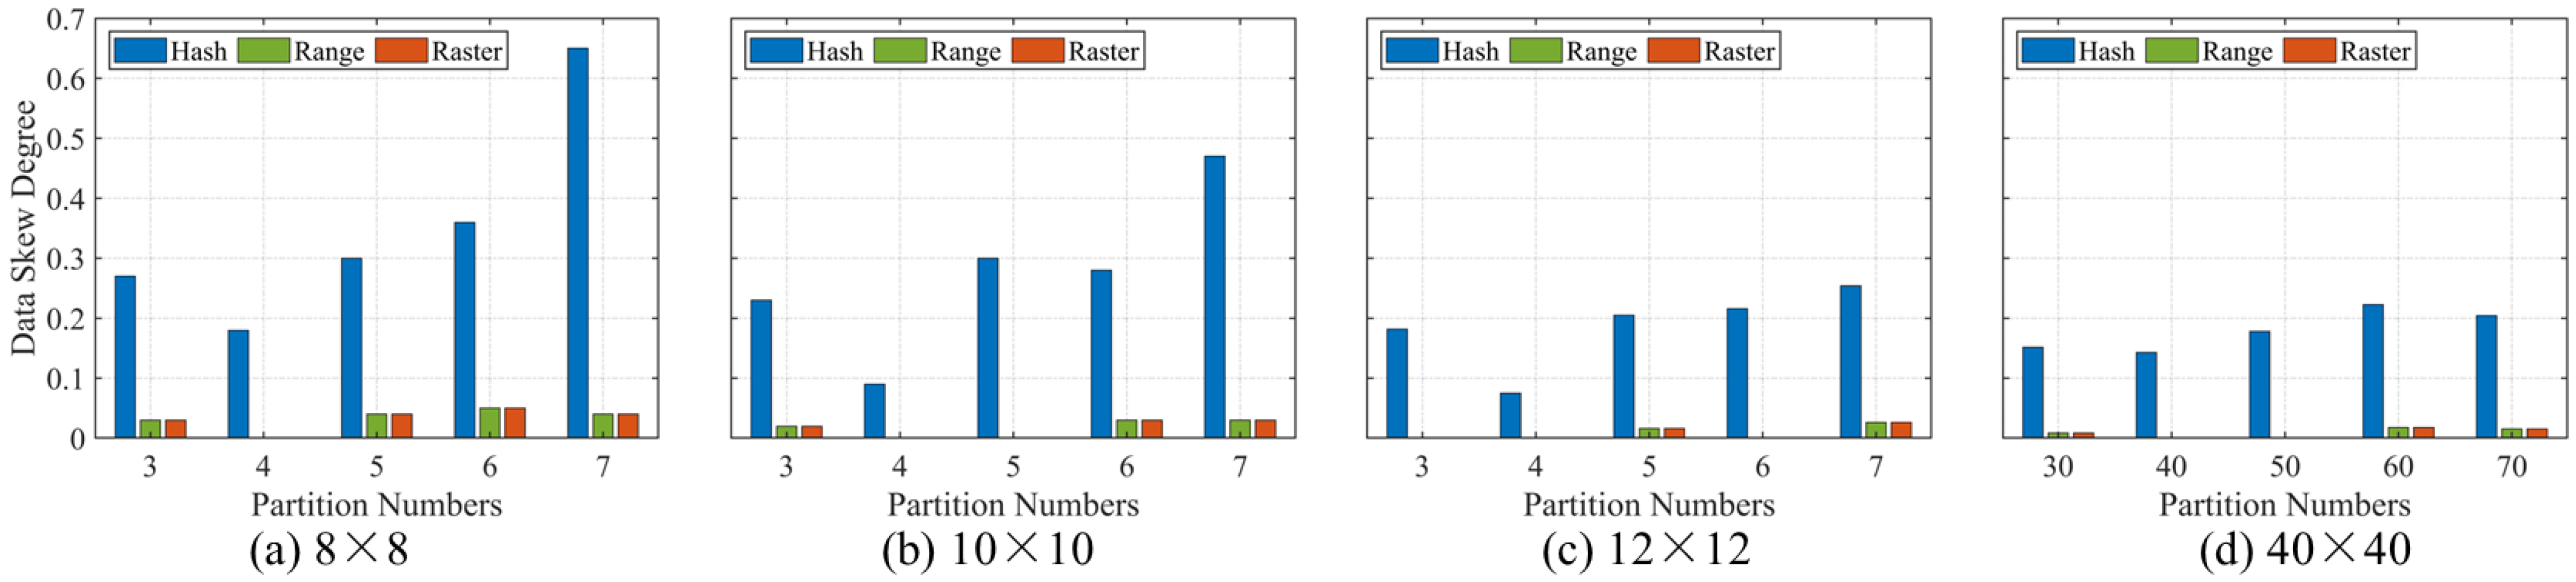
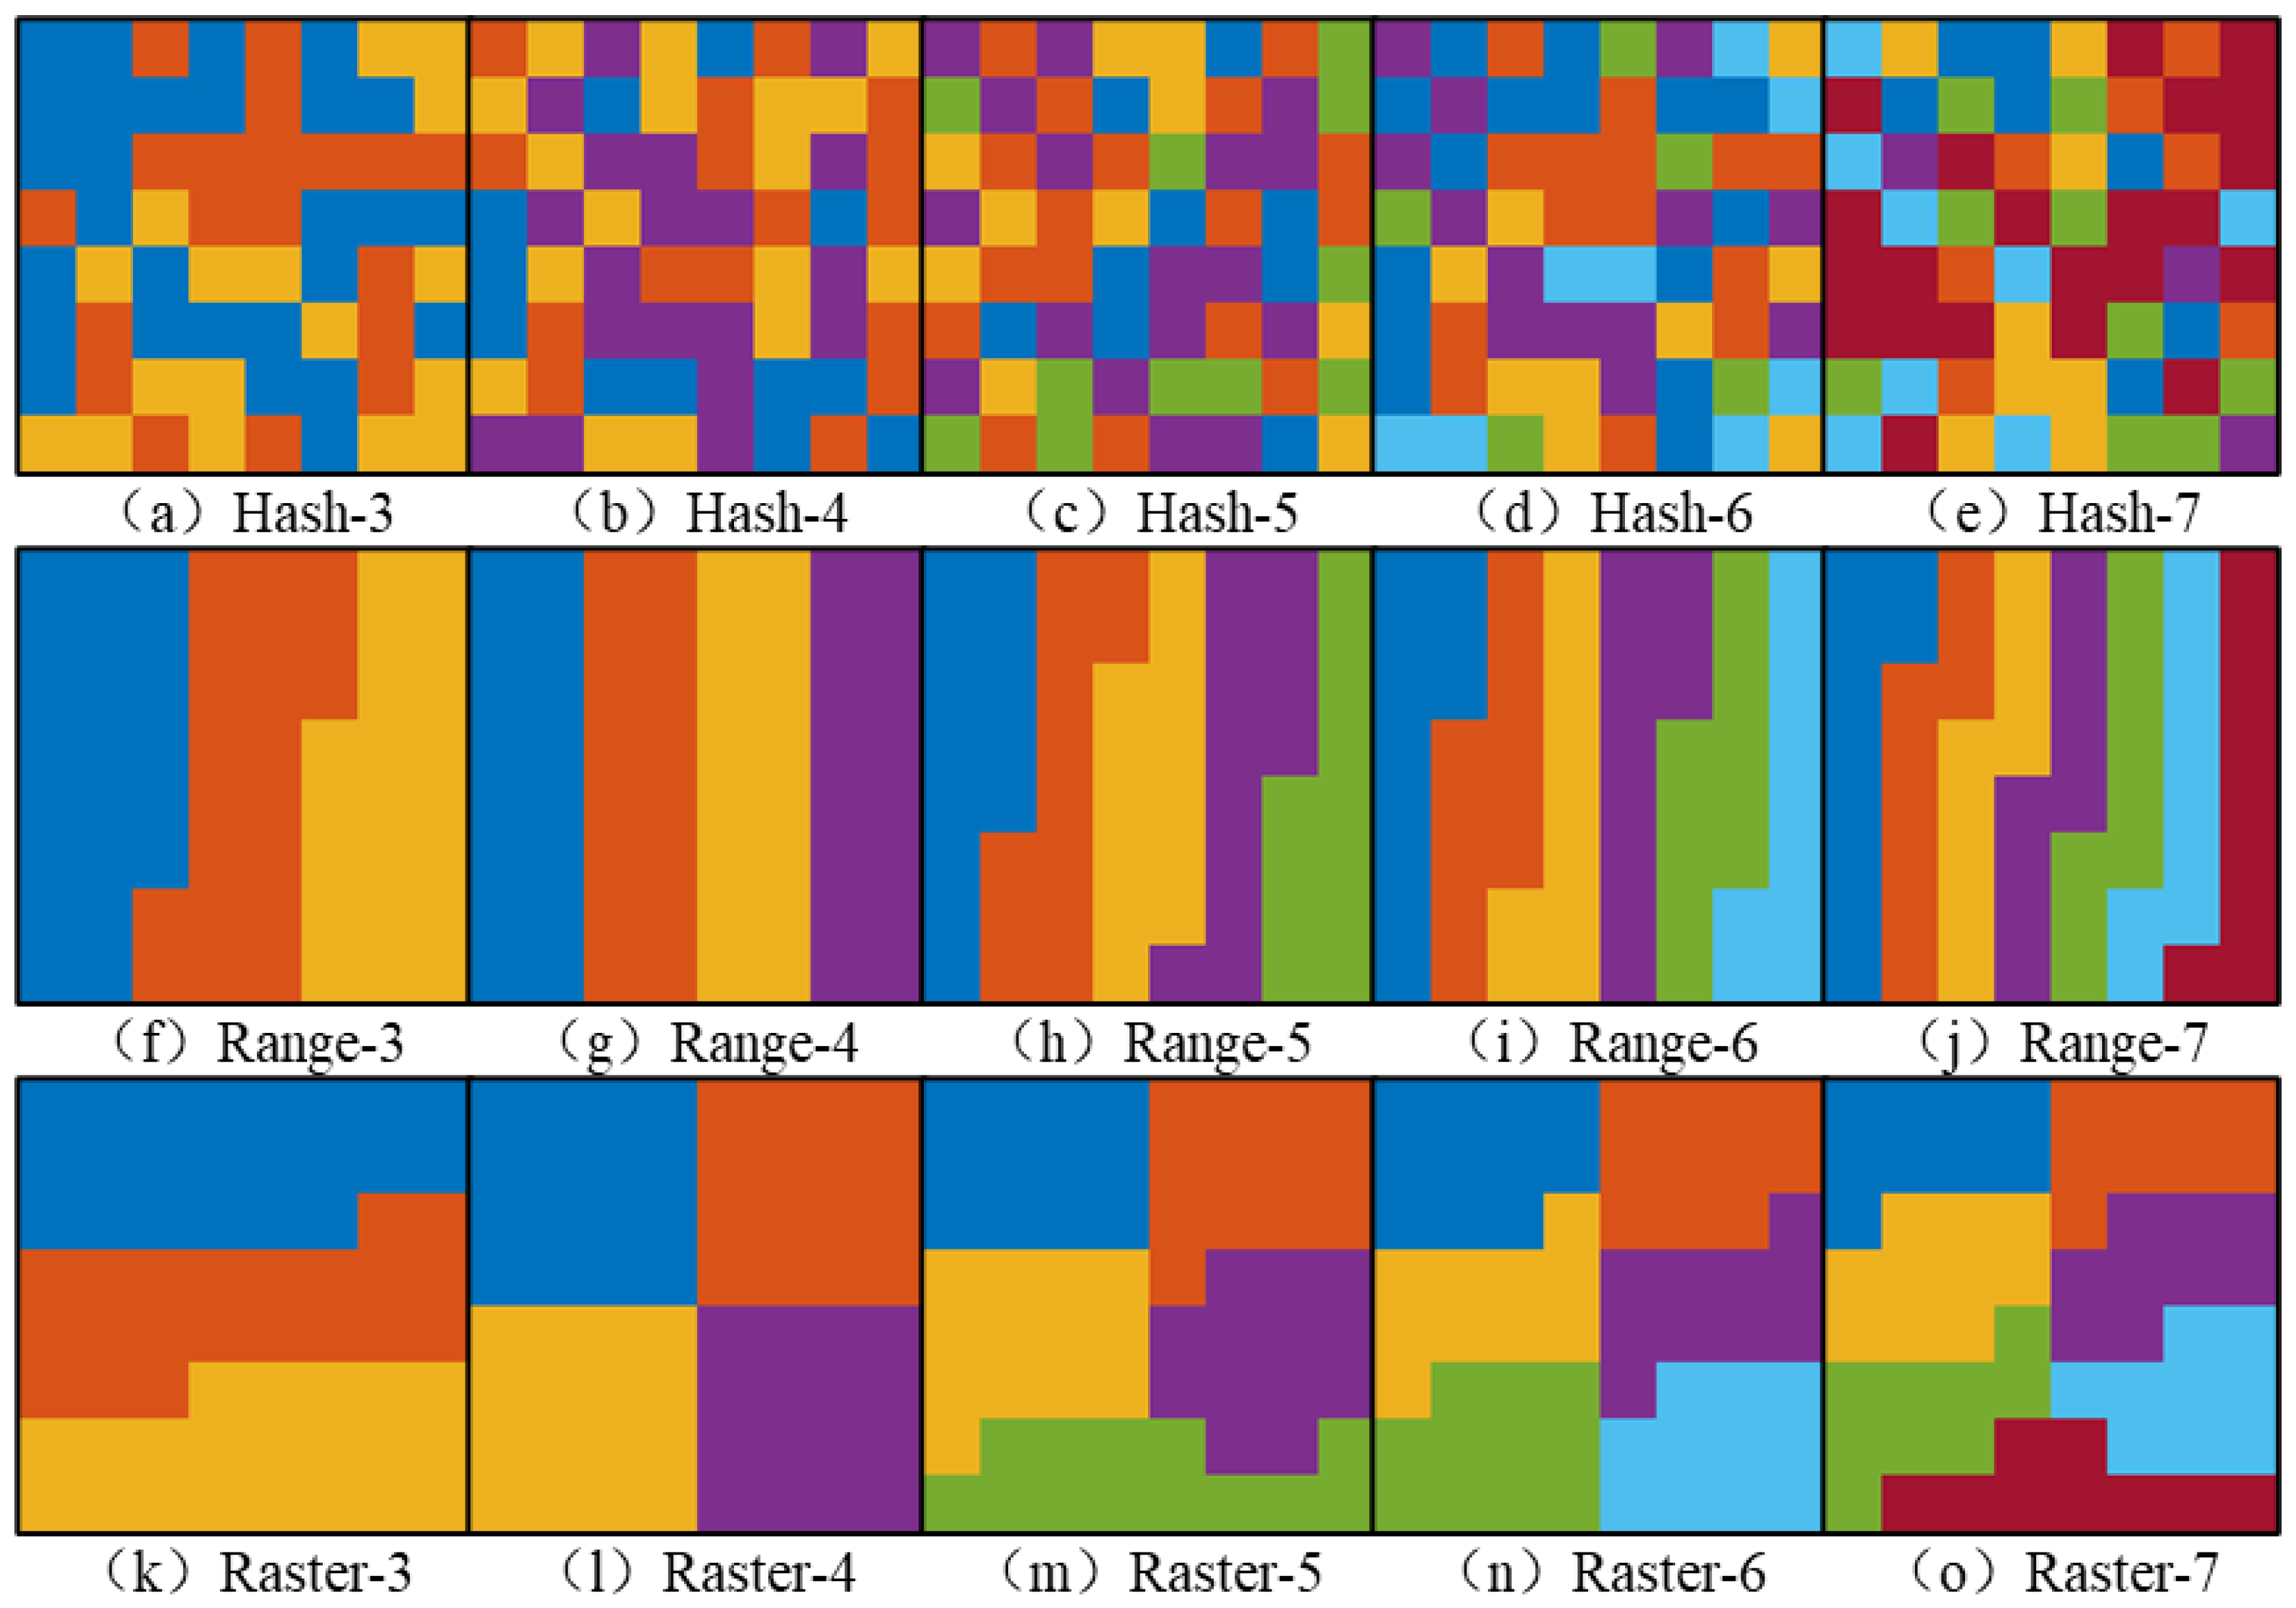
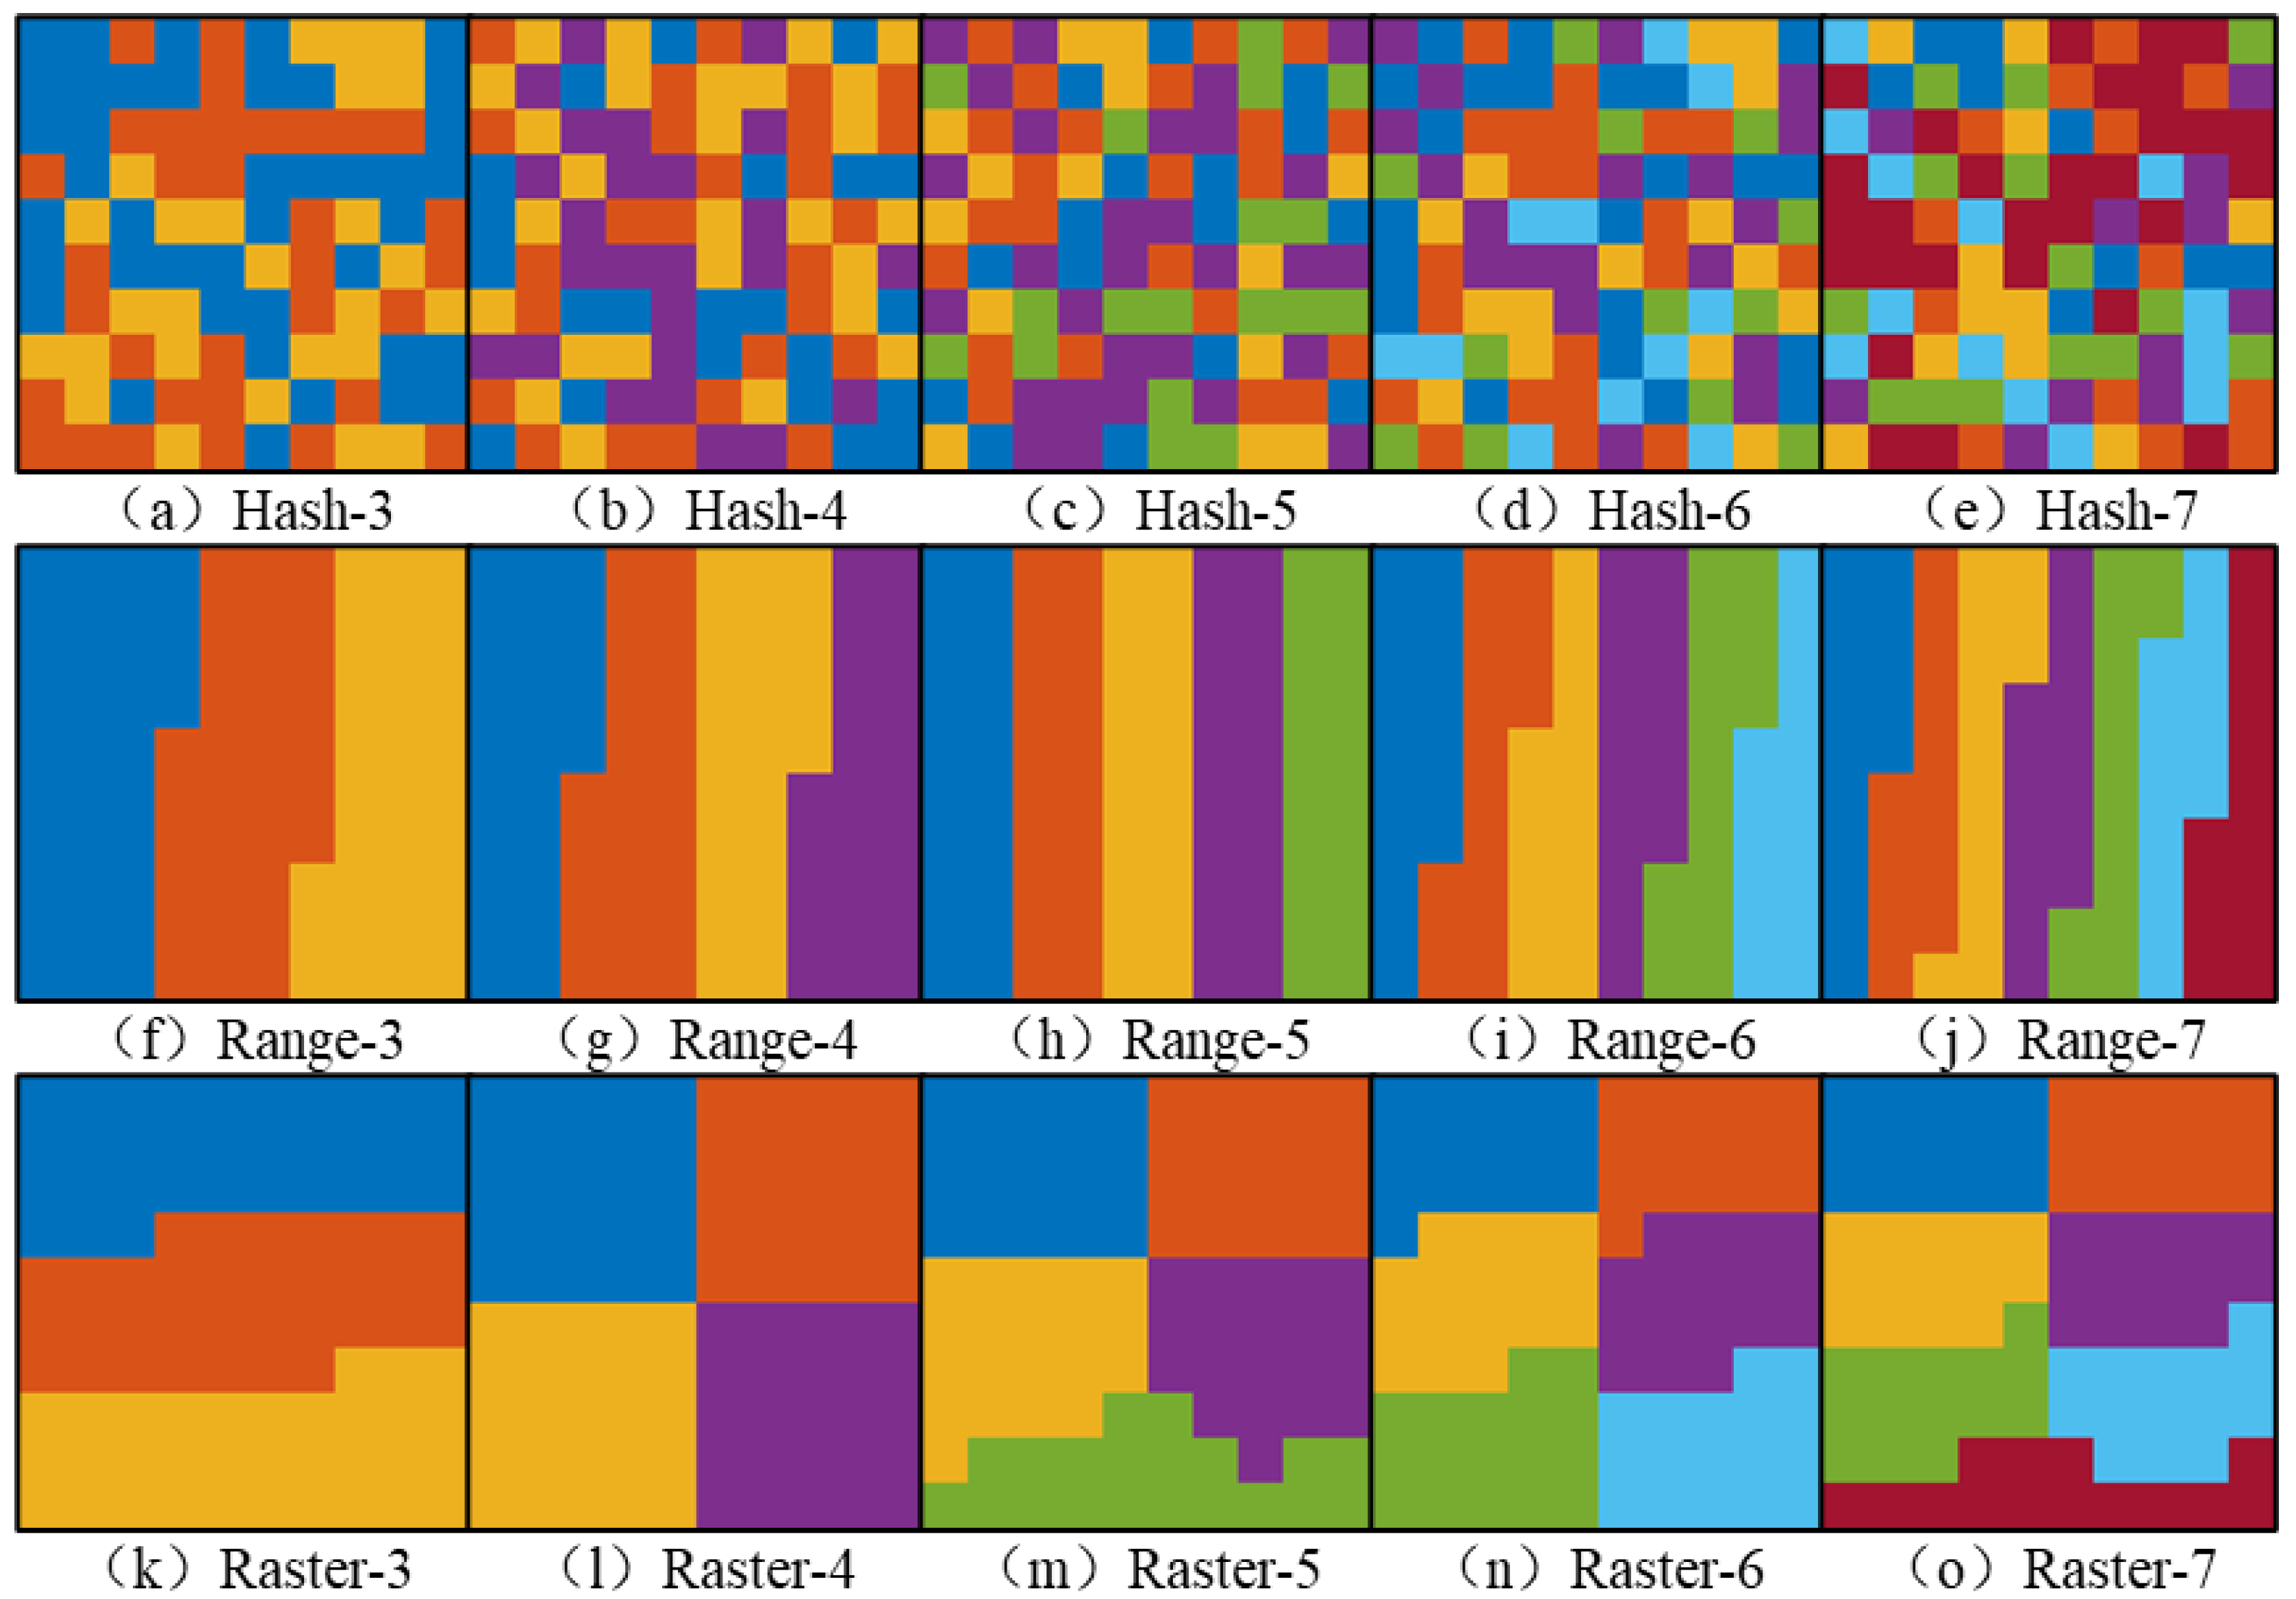
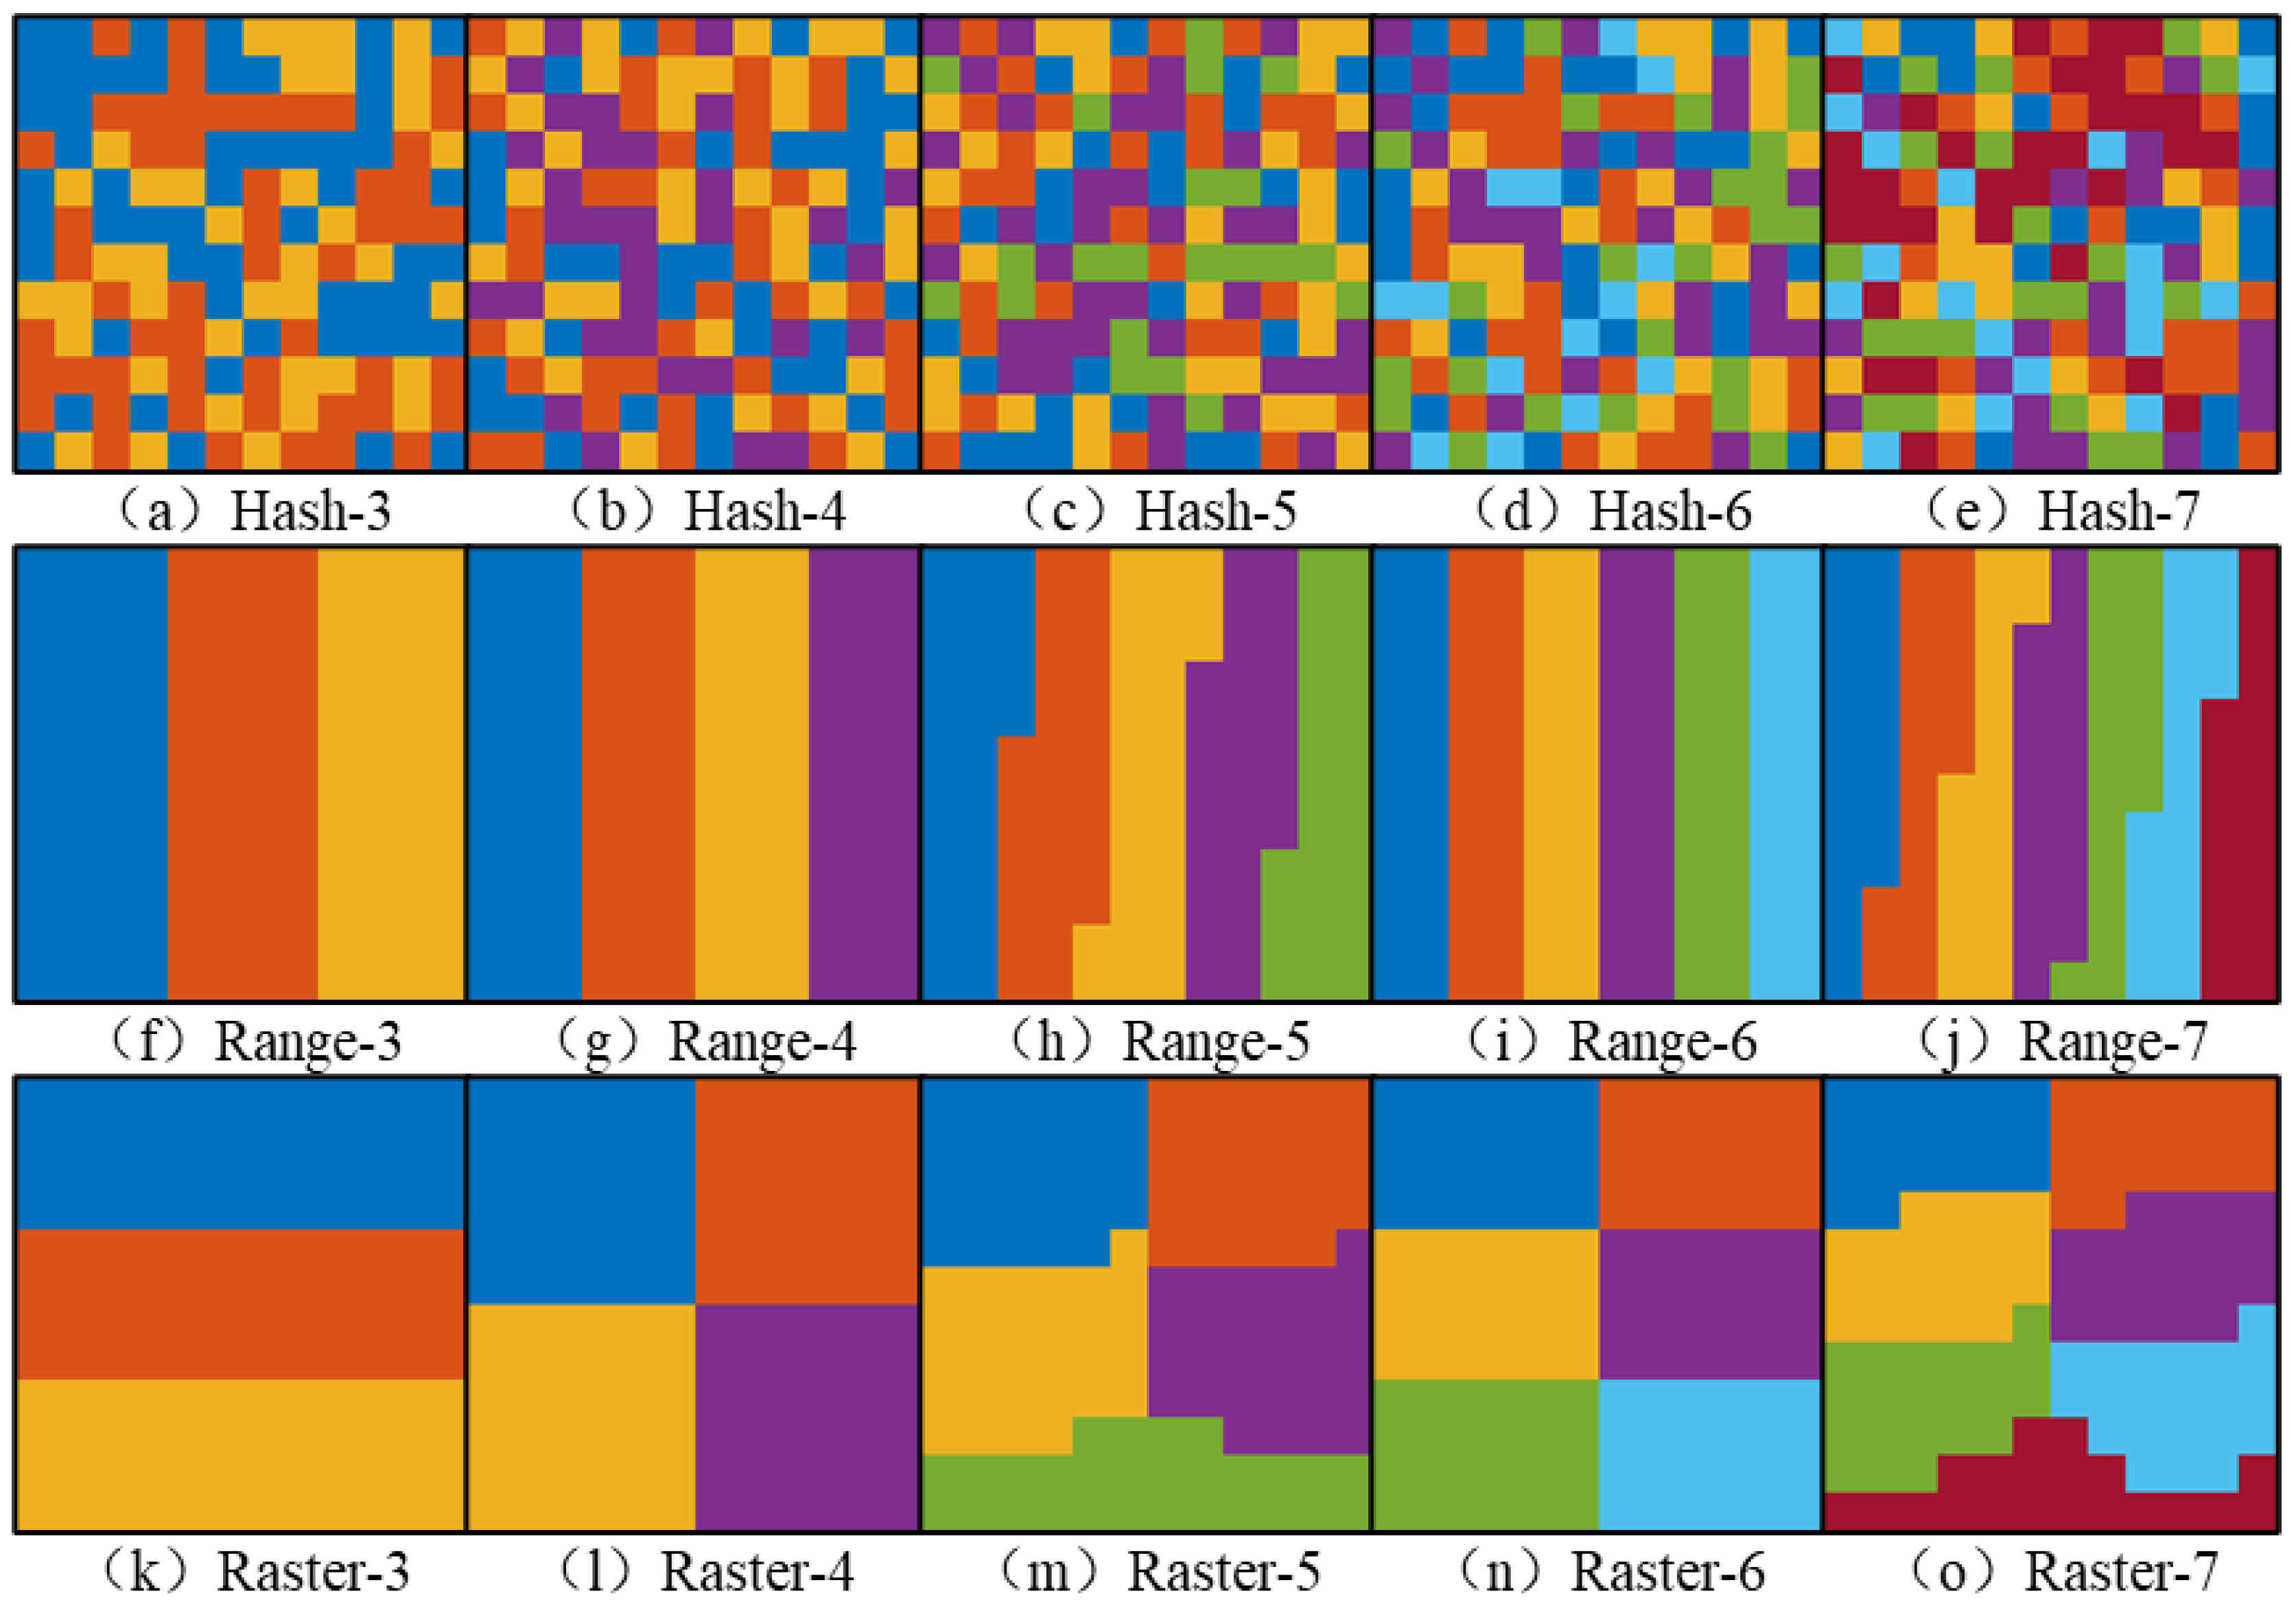
In terms of the several types of partition layout, the partition results for the hash, range and raster partition methods show, respectively, the randomness, the strip characteristic, and the aggregation feature in all types of image layouts and number of partitions. The hash partition method calculates the hash value of the column and row index corresponding to each decomposed image tile, and the manner of generation of the hash partition method determines the partition results. This usually generates random partition results, which leads to an extremely uneven number of image tiles in each partition. Therefore, more partitions will not improve the efficiency of the task but may lead to a longer task operating time or performance bottleneck. The processing order of the raster partition method is from top to bottom and from left to right, and the partitions located at the bottom of the image layout sometimes can have an abnormal shape and are not compact enough. A similar situation occurs in the results of the raster partition method when the number of partitions is 5 or 7, which is one deficiency in the current design scheme of the raster partition method.

6. Conclusions

As is well known, the data skew problem can influence the execution efficiency directly in many application tasks implemented over distributed clusters and even lead to performance bottlenecks. In addition, a partition method suitable for image tiles organized by row and column index characteristics is still not available. To solve the aforementioned data skew issues, this study proposed a novel partition method based on the clustering idea and the equal area conversion principle. The approach could specifically distribute the decomposed large-scale remote sensing image tiles uniformly to each computing node. Our proposed partition method consists of three main parts: the seed point planning, vertical direction adjustment and horizontal direction adjustment. In the method, image tiles are regarded as image pixels lacking spectrum and texture attributes, and the image tile partitioning problem is transformed into an image pixel clustering problem. First, the seed points are planned based on the equal area conversion principle and the image tiles are aggregated by taking the uniformity and compactness criteria into account to generate an initial partition. Second, the initial partition is fine tuned in terms of the vertical and horizontal directions to achieve a uniform distribution, which solves the data skew problem of image tiles. Two traditional partition methods (the hash and range partition methods) were employed to evaluate and verify the proposed partition method from three aspects: the elapsed time for the image segmentation stage, the data shuffle stage, and the image clipping stage. The results showed that the proposed partition method can solve the data skew problem by distributing image tiles evenly to each partition (computing node), and reduced the computational time by 21.5%, 7.7% and 8.5% on average in the three stages. Meanwhile, the elapsed time decreased monotonically as the number of partitions increased.
In future work, the proposed raster partition method could be further optimized in terms of the computational complexity and the compactness of the total partitions in the image layouts. In addition, the initial seed points should be selected and initialized in a more balanced distribution, which would maintain the adjacent image tiles within the same computing node as much as is feasibly possible. Furthermore, the task parallelism would be considered to further improve the execution efficiency in our research.

Author Contributions

Conceptualization, L.W. and N.W.; methodology, L.W. and N.W.; software, C.L.; validation, B.Y., F.C. and B.L.; formal analysis, B.Y.; investigation, L.W.; resources, F.C.; data curation, B.Y.; writing—original draft preparation, N.W.; writing—review and editing, B.Y.; visualization, N.W.; supervision, C.L.; project administration, L.W.; funding acquisition, F.C. All authors have read and agreed to the published version of the manuscript.

Funding

This research was supported by the Strategic Priority Research Program of the Chinese Academy of Sciences (XDA19030101), Youth Innovation Promotion Association, CAS (2022122) and China-ASEAN Big Earth Data Platform and Applications (CADA, guikeAA20302022).

Data Availability Statement

Data sharing not applicable.

Conflicts of Interest

The authors declare no conflict of interest.

References

  1. Wang, N.; Chen, F.; Yu, B.; Qin, Y. Segmentation of large-scale remotely sensed images on a Spark platform: A strategy for handling massive image tiles with the MapReduce model. ISPRS J. Photogramm. Remote Sens. 2020, 162, 137–147. [Google Scholar] [CrossRef]
  2. Chen, F.; Wang, N.; Yu, B.; Qin, Y.C.; Wang, L. A Strategy of Parallel Seed-Based Image Segmentation Algorithms for Handling Massive Image Tiles over the Spark Platform. Remote Sens. 2021, 13, 1969. [Google Scholar] [CrossRef]
  3. Jia, H.; Chen, F.; Zhang, C.; Dong, J.; Du, E.; Wang, L. High emissions could increase the future risk of maize drought in China by 60–70%. Sci. Total Environ. 2022, 852, 158474. [Google Scholar] [CrossRef]
  4. Jia, H.; Chen, F.; Pan, D.; Du, E.; Wang, L.; Wang, N.; Yang, A. Flood risk management in the Yangtze River basin—Comparison of 1998 and 2020 events. Int. J. Disaster Risk Reduct. 2022, 68, 102724. [Google Scholar] [CrossRef]
  5. Guo, H.; Chen, F.; Sun, Z.; Liu, J.; Liang, D. Big Earth Data: A practice of sustainability science to achieve the Sustainable Development Goals. Sci. Bull. 2021, 66, 1050–1053. [Google Scholar] [CrossRef]
  6. Guo, H. Big data drives the development of Earth science. Big Earth Data 2017, 1, 1–3. [Google Scholar] [CrossRef] [Green Version]
  7. Yu, B.; Xu, C.; Chen, F.; Wang, N.; Wang, L. HADeenNet: A hierarchical-attention multi-scale deconvolution network for landslide detection. Int. J. Appl. Earth Obs. Geoinf. 2022, 111, 102853. [Google Scholar] [CrossRef]
  8. Yu, B.; Yang, A.; Chen, F.; Wang, N.; Wang, L. SNNFD, spiking neural segmentation network in frequency domain using high spatial resolution images for building extraction. Int. J. Appl. Earth Obs. Geoinf. 2022, 112, 102930. [Google Scholar] [CrossRef]
  9. Apache Hadoop. Available online: http://hadoop.apache.org/ (accessed on 18 July 2022).
  10. Apache Spark. Available online: https://spark.apache.org/ (accessed on 18 July 2022).
  11. Apache Flink. Available online: https://flink.apache.org/ (accessed on 18 July 2022).
  12. Salloum, S.; Dautov, R.; Chen, X.; Peng, P.X.; Huang, J.Z. Big data analytics on Apache Spark. Int. J. Data Sci. Anal. 2016, 1, 145–164. [Google Scholar] [CrossRef] [Green Version]
  13. Sahal, R.; Breslin, J.G.; Ali, M.I. Big data and stream processing platforms for Industry 4.0 requirements mapping for a predictive maintenance use case. J. Manuf. Syst. 2020, 54, 138–151. [Google Scholar] [CrossRef]
  14. Tao, D.; Yang, P.; Feng, H. Utilization of text mining as a big data analysis tool for food science and nutrition. Compr. Rev. Food Sci. Food Saf. 2020, 19, 875–894. [Google Scholar] [CrossRef] [PubMed] [Green Version]
  15. Saxena, D.; Chauhan, R.; Kait, R. Dynamic fair priority optimization task scheduling algorithm in cloud computing: Concepts and implementations. Int. J. Comput. Netw. Inf. Secur. 2016, 8, 41. [Google Scholar] [CrossRef] [Green Version]
  16. Abualigah, L.; Diabat, A. A novel hybrid antlion optimization algorithm for multi-objective task scheduling problems in cloud computing environments. Clust. Comput. 2021, 24, 205–223. [Google Scholar] [CrossRef]
  17. Chen, F.; Wang, N.; Yu, B.; Wang, L. Res2-Unet, a New Deep Architecture for Building Detection from High Spatial Resolution Images. IEEE J. Sel. Top. Appl. Earth Obs. Remote Sens. 2022, 15, 1494–1501. [Google Scholar] [CrossRef]
  18. Wu, Z.; Sun, J.; Zhang, Y.; Wei, Z.; Chanussot, J. Recent developments in parallel and distributed computing for remotely sensed big data processing. Proc. IEEE 2021, 109, 1282–1305. [Google Scholar] [CrossRef]
  19. Mahmud, M.S.; Huang, J.Z.; Salloum, S.; Emara, T.Z.; Sadatdiynov, K. A survey of data partitioning and sampling methods to support big data analysis. Big Data Min. Anal. 2020, 3, 85–101. [Google Scholar] [CrossRef]
  20. Oussous, A.; Benjelloun, F.-Z.; Lahcen, A.A.; Belfkih, S. Big Data technologies: A survey. J. King Saud Univ. Comput. Inf. Sci. 2018, 30, 431–448. [Google Scholar] [CrossRef]
  21. Isah, H.; Abughofa, T.; Mahfuz, S.; Ajerla, D.; Zulkernine, F.; Khan, S. A survey of distributed data stream processing frameworks. IEEE Access 2019, 7, 154300–154316. [Google Scholar] [CrossRef]
  22. Bertolucci, M.; Carlini, E.; Dazzi, P.; Lulli, A.; Ricci, L. Static and dynamic big data partitioning on apache spark. In Parallel Computing: On the Road to Exascale; IOS Press: Amsterdam, The Netherlands, 2016; pp. 489–498. [Google Scholar]
  23. Geetha, J.; Harshit, N. Implementation and performance comparison of partitioning techniques in apache spark. In Proceedings of the 2019 10th International Conference on Computing, Communication and Networking Technologies (ICCCNT), Kanpur, India, 6–8 July 2019; IEEE: New York, NY, USA, 2019; pp. 1–5. [Google Scholar]
  24. Kwon, Y.; Balazinska, M.; Howe, B.; Rolia, J. Skewtune: Mitigating skew in mapreduce applications. In Proceedings of the 2012 ACM SIGMOD International Conference on Management of Data, Scottsdale, AZ, USA, 20–24 May 2012; pp. 25–36. [Google Scholar]
  25. Data Skew. Available online: https://www.ibm.com/docs/en/psfa/7.2.1?topic=appliance-data-skew (accessed on 18 July 2022).
  26. Guo, H. Big Earth data: A new frontier in Earth and information sciences. Big Earth Data 2017, 1, 4–20. [Google Scholar] [CrossRef] [Green Version]
  27. Hansen, M.C.; Wang, L.; Song, X.-P.; Tyukavina, A.; Turubanova, S.; Potapov, P.V.; Stehman, S.V. The fate of tropical forest fragments. Sci. Adv. 2020, 6, eaax8574. [Google Scholar] [CrossRef] [PubMed]
  28. Ma, Y.; Wu, H.P.; Wang, L.Z.; Huang, B.M.; Ranjan, R.; Zomaya, A.; Jie, W. Remote sensing big data computing: Challenges and opportunities. Future Gen. Comp. Syst. 2015, 51, 47–60. [Google Scholar] [CrossRef] [Green Version]
  29. Costa, G.A.; Bentes, C.; Ferreira, R.S.; Feitosa, R.Q.; Oliveira, D.A. Exploiting different types of parallelism in distributed analysis of remote sensing data. IEEE Geosci. Remote Sens. Lett. 2017, 14, 1298–1302. [Google Scholar] [CrossRef]
  30. Sun, J.; Zhang, Y.; Wu, Z.; Zhu, Y.; Yin, X.; Ding, Z.; Wei, Z.; Plaza, J.; Plaza, A. An efficient and scalable framework for processing remotely sensed big data in cloud computing environments. IEEE Trans. Geosci. Remote Sens. 2019, 57, 4294–4308. [Google Scholar] [CrossRef]
  31. Yu, J.; Chen, H.; Hu, F. SASM: Improving spark performance with adaptive skew mitigation. In Proceedings of the 2015 IEEE International Conference on Progress in Informatics and Computing (PIC), Nanjing, China, 18–20 December 2015; IEEE: New York, NY, USA, 2015; pp. 102–107. [Google Scholar]
  32. Tang, Z.; Zhang, X.; Li, K.; Li, K. An intermediate data placement algorithm for load balancing in spark computing environment. Future Gener. Comput. Syst. 2018, 78, 287–301. [Google Scholar] [CrossRef]
  33. Liu, G.; Zhu, X.; Wang, J.; Guo, D.; Bao, W.; Guo, H. SP-Partitioner: A novel partition method to handle intermediate data skew in spark streaming. Future Gener. Comput. Syst. 2018, 86, 1054–1063. [Google Scholar] [CrossRef]
  34. Tang, Z.; Lv, W.; Li, K.; Li, K. An intermediate data partition algorithm for skew mitigation in spark computing environment. IEEE Trans. Cloud Comput. 2018, 9, 461–474. [Google Scholar] [CrossRef]
  35. Xiujin, S.; Yueqin, Q. An algorithm of data skew in spark based on partition. In Proceedings of the 2020 International Conference on Computers, Information Processing and Advanced Education (CIPAE), Ottawa, ON, Canada, 16–18 October 2020; IEEE: New York, NY, USA, 2020; pp. 217–222. [Google Scholar]
  36. Wang, K.; Khan, M.M.H.; Nguyen, N.; Gokhale, S. A model driven approach towards improving the performance of apache spark applications. In Proceedings of the 2019 IEEE International Symposium on Performance Analysis of Systems and Software (ISPASS), Madison, WI, USA, 24–26 March 2019; IEEE: New York, NY, USA, 2019; pp. 233–242. [Google Scholar]
  37. Fu, Z.; Tang, Z.; Yang, L.; Li, K.; Li, K. ImRP: A Predictive Partition Method for Data Skew Alleviation in Spark Streaming Environment. Parallel Comput. 2020, 100, 102699. [Google Scholar] [CrossRef]
  38. Huang, Z.; Wei, W.; Xie, G. Load Balancing Mechanism Based on Linear Regression Partition Prediction in Spark. J. Phys. Conf. Ser. 2020, 1575, 012109. [Google Scholar] [CrossRef]
  39. Guo, W.; Huang, C.; Tian, W. Handling data skew at reduce stage in Spark by ReducePartition. Concurr. Comput. Pract. Exp. 2020, 32, e5637. [Google Scholar] [CrossRef]
  40. Li, J.; Zhang, C.; Zhang, J.; Qin, X.; Hu, L. MiCS-P: Parallel Mutual-information Computation of Big Categorical Data on Spark. J. Parallel Distrib. Comput. 2022, 161, 118–129. [Google Scholar] [CrossRef]
  41. Shen, Y.; Xiong, J.; Jiang, D. SrSpark: Skew-resilient spark based on adaptive parallel processing. In Proceedings of the 2020 IEEE 26th International Conference on Parallel and Distributed Systems (ICPADS), Hong Kong, China, 2–4 December 2020; IEEE: New York, NY, USA, 2020; pp. 466–475. [Google Scholar]
  42. Wang, S.; Jia, Z.; Wang, W. Research on Optimization of data balancing partition algorithm based on spark platform. In Proceedings of the International Conference on Artificial Intelligence and Security, Jaipur, India, 9–10 December 2021; Springer: Cham, Switzerland, 2021; pp. 3–13. [Google Scholar]
  43. Yin, R.; He, G.; Wang, G.; Long, T. 30-meter Global Mosaic Map of 2018. Sci. Data Bank 2019, 4. [Google Scholar] [CrossRef]
  44. Chen, F.; Zhang, M.M.; Guo, H.D.; Allen, S.; Kargel, J.S.; Haritashya, U.K.; Watson, C.S. Annual 30m dataset for glacial lakes in High Mountain Asia from 2008 to 2017. Earth Syst. Sci. Data 2021, 13, 741–766. [Google Scholar] [CrossRef]
  45. HashPartitioner. Available online: https://spark.apache.org/docs/2.3.1/api/scala/index.html#org.apache.spark.HashPartitioner (accessed on 18 July 2022).
  46. RangePartitioner. Available online: https://spark.apache.org/docs/2.3.1/api/scala/index.html#org.apache.spark.RangePartitioner (accessed on 18 July 2022).
  47. Shuffle Operations. Available online: https://spark.apache.org/docs/latest/rdd-programming-guide.html (accessed on 18 July 2022).
  48. Image Clipping Function. Available online: https://geotrellis.io/ (accessed on 18 July 2022).
  49. Wang, N.; Chen, F.; Yu, B.; Wang, L. A Strategy of Parallel SLIC Superpixels for Handling Large-Scale Images over Apache Spark. Remote Sens. 2022, 14, 1568. [Google Scholar] [CrossRef]
Figure 1. Flowchart for the horizontal filling.
Remotesensing 14 04964 g001
Figure 2. Flowchart for the vertical filling.
Remotesensing 14 04964 g002
Figure 3. Seed point planning.
Remotesensing 14 04964 g003
Figure 4. The flowchart for adjustment in the horizontal and vertical directions.
Remotesensing 14 04964 g004
Figure 5. The true color Landsat images for the partition experiments.
Remotesensing 14 04964 g005
Figure 6. The data skew for various image layouts.
Remotesensing 14 04964 g006
Figure 7. The compactness for various image layout.
Remotesensing 14 04964 g007
Figure 8. The elapsed time for image segmentation testing.
Remotesensing 14 04964 g008
Figure 9. The elapsed time for the data shuffle testing.
Remotesensing 14 04964 g009
Figure 10. The elapsed time for the image clipping testing.
Remotesensing 14 04964 g010
Figure 11. The partition results for the hash, range and raster partition methods over the 8 × 8-image layout.
Remotesensing 14 04964 g011
Figure 12. The partition results for the hash, range and raster partition methods over the 10 × 10-image layout.
Remotesensing 14 04964 g012
Figure 13. The partition results for the hash, range and raster partition methods over the 12 × 12-image layout.
Remotesensing 14 04964 g013
Table 1. Methods and nomenclature used in the comparative experiments.
NameDescription
HashThe hash partition method of Apache Spark
RangeThe range partition method with sweep curve of Apache Spark
RasterThe raster partition method
Table 2. Details for the version used for the basic service in the distributed cluster.
ServiceAmbariHadoopSparkGeo TrellisScala
Version2.6.22.7.32.2.02.1.02.11.8
Table 3. Parameters for the Spark submit system.
ParametersNumber of ExecutorsExecutor MemoryExecutor CoresDriver MemoryParallelism
Values3–7 & 30–7010 GB120 GB3–7 & 30–70
Publisher’s Note: MDPI stays neutral with regard to jurisdictional claims in published maps and institutional affiliations.

