Article

The Impact of Future Sea-Level Rise on Low-Lying Subsiding Coasts: A Case Study of Tavoliere Delle Puglie (Southern Italy)

1
Department of Earth and Geoenviromental Sciences, University of Bari Aldo Moro, 70125 Bari, Italy
2
Interdepartmental Research Center for Coastal Dynamics, University of Bari Aldo Moro, 70125 Bari, Italy
3
Istituto Nazionale di Geofisica e Vulcanologia, 00143 Rome, Italy
4
Institute for the Electromagnetic Sensing of the Environment—Italian National Research Council (IREA-CNR), 70125 Bari, Italy
5
LESIA, Observatoire de Paris, Université PSL, CNRS, Sorbonne Université, Université Paris Diderot, Sorbonne Paris Cité, 5 Place Jules Janssen, 92195 Meudon, France
6
Radboud Radio Lab, Department of Astrophysics/IMAPP–Radboud University, P.O. Box 9010, 6500 GL Nijmegen, The Netherlands
*
Author to whom correspondence should be addressed.
Remote Sens. 2022, 14(19), 4936; https://doi.org/10.3390/rs14194936
Submission received: 18 August 2022 / Revised: 24 September 2022 / Accepted: 29 September 2022 / Published: 2 October 2022

Abstract

:
Low-lying coastal zones are highly subject to coastal hazards as a result of sea-level rise enhanced by natural or anthropogenic land subsidence. A combined analysis using sea-level data and remote sensing techniques allows the estimation of the current rates of land subsidence and shoreline retreat, supporting the development of quantified relative sea-level projections and flood maps, which are appropriate for specific areas. This study focuses on the coastal plain of Tavoliere delle Puglie (Apulia, Southern Italy), facing the Adriatic Sea. In this area, land subsidence is mainly caused by long-term tectonic movements and sediment compaction driven by high anthropogenic pressure, such as groundwater exploitation and constructions of buildings. To assess the expected effects of relative sea-level rise for the next decades, we considered the following multidisciplinary source data: (i) sea-level-rise projections for different climatic scenarios, as reported in the Sixth Assessment Report of the Intergovernmental Panel on Climate Change, (ii) coastal topography from airborne and terrestrial LiDAR data, (iii) Vertical Land Movement (VLM) from the analysis of InSAR and GNSS data, and (iv) shoreline changes obtained from the analysis of orthophotos, historic maps, and satellite images. To assess the expected evolution of the coastal belt, the topographic data were corrected for VLM values, assuming that the rates of land subsidence will remain constant up to 2150. The sea-level-rise projections and expected flooded areas were estimated for the Shared Socioeconomic Pathways SSP1-2.6 and SSP5-8.5, corresponding to low and high greenhouse-gas concentrations, respectively. From our analysis, we estimate that in 2050, 2100, and 2150, up to 50.5 km2, 118.7 km2 and 147.7 km2 of the coast could be submerged, respectively, while beaches could retreat at rates of up to 5.8 m/yr. In this area, sea-level rise will be accelerated by natural and anthropogenic land subsidence at rates of up to −7.5 ± 1.7 mm/yr. Local infrastructure and residential areas are thus highly exposed to an increasing risk of severe inundation by storm surges and sea-level rise in the next decades.

Graphical Abstract

1. Introduction

It is a matter of fact that global warming affecting our planet has dramatic consequences for populated coastal areas. The recent sea-level-rise projections released by the Intergovernmental Panel of Climate Change (IPCC [1]) predict faster rates up to the year 2300 AD [1,2] than in the previous millennia, with critical implications for low-lying coastal areas [3,4,5,6]. In the Mediterranean basin, it was recently estimated that about 38,500 km2 of coasts will be exposed to rising sea levels and flooding by 2100 [7], while detailed studies highlighted the severity of the expected flooding at the local level [5,8,9,10,11,12,13,14]. For this reason, sea-level rise (SLR) could determine the loss of functionality in many coastal areas, with associated damage to the economy and ecological habitats [3,15]. In particular, coastal plains, river deltas, and lagoons undergoing land subsidence are much more susceptible to SLR than those characterized by vertical tectonic and geological stability. SLR is a function of different factors [16,17], as the sum of eustatic, isostatic, and tectonic contributions. On the other hand, the steric components must be considered, since they are linked with variations in water density as a result of the cooling or warming of the ocean mass or changes in salinity [18]. In addition to these vertical components, anthropogenic actions influence the local SLR, such as in response to groundwater reservoir exploitation or infrastructure construction [19,20,21,22]. An exemplary case is the Venice lagoon (Italy, North Adriatic Sea), which is subsiding at rates of up to approximately −10 mm/yr [21,23,24], which could result in a relative sea-level rise (RSLR) of over 1 m by 2100 [8,25]. Furthermore, the combined action of RSLR and extreme marine events, such as storm surges, could lead to an increased inland extent of coastal flooding [26]. This is an important issue considering that the area’s main economic activities are located along the coasts.
In this study, we focus on the coastal plain of Tavoliere delle Puglie (Apulia, southern Italy) to model expected marine flooding scenarios up to 2150.
Firstly, in order to model the extent of future coastal flooding, we used a high-precision Digital Surface Model (DSM), obtained from two Light Detection And Ranging (LiDAR) systems, a ground-based Terrestrial Laser Scanner (TLS) and an Airborne Laser Scanner (ALS), onto which projections of future sea-level from the Intergovernmental Panel on Climate Change (IPCC [1]), revised for local Vertical Land Movement (VLM) rates, were applied. The VLM rates in the study area were estimated through a combined geodetic analysis that included Global Navigation Satellite System (GNSS) and Interferometric Synthetic Aperture Radar (InSAR) data.
Secondly, to account for the locally variable shoreline displacement caused by coastal erosion, we modeled the future shoreline position, which defines the extent of the expected permanent flooding surfaces driven by RSLR. This was achieved by combining the regional IPCC SLR projections, which were corrected using the obtained VLM rates, with historic rates of shoreline displacement, obtained via the analysis of orthophotos, satellite images, and historic maps.
For each timestep, the best- and worst-case flooding scenarios were modeled using the IPCC SSP1-2.6 (reduction in greenhouse gases in the atmosphere) and IPCC SSP5-8.5 (no greenhouse-gas reduction, business as usual) SLR projections, respectively, corrected as described above. In addition, the impact of storm events was modeled under different RSLR scenarios, in which the impact of storm waves can determine the temporary flooding of low-lying areas. The implications of the RSLR projections and related expected flooded zones include the eventual loss of socio-economic activities in proximity to the coast and groundwater pollution due to the inland advancement of the saline wedge.

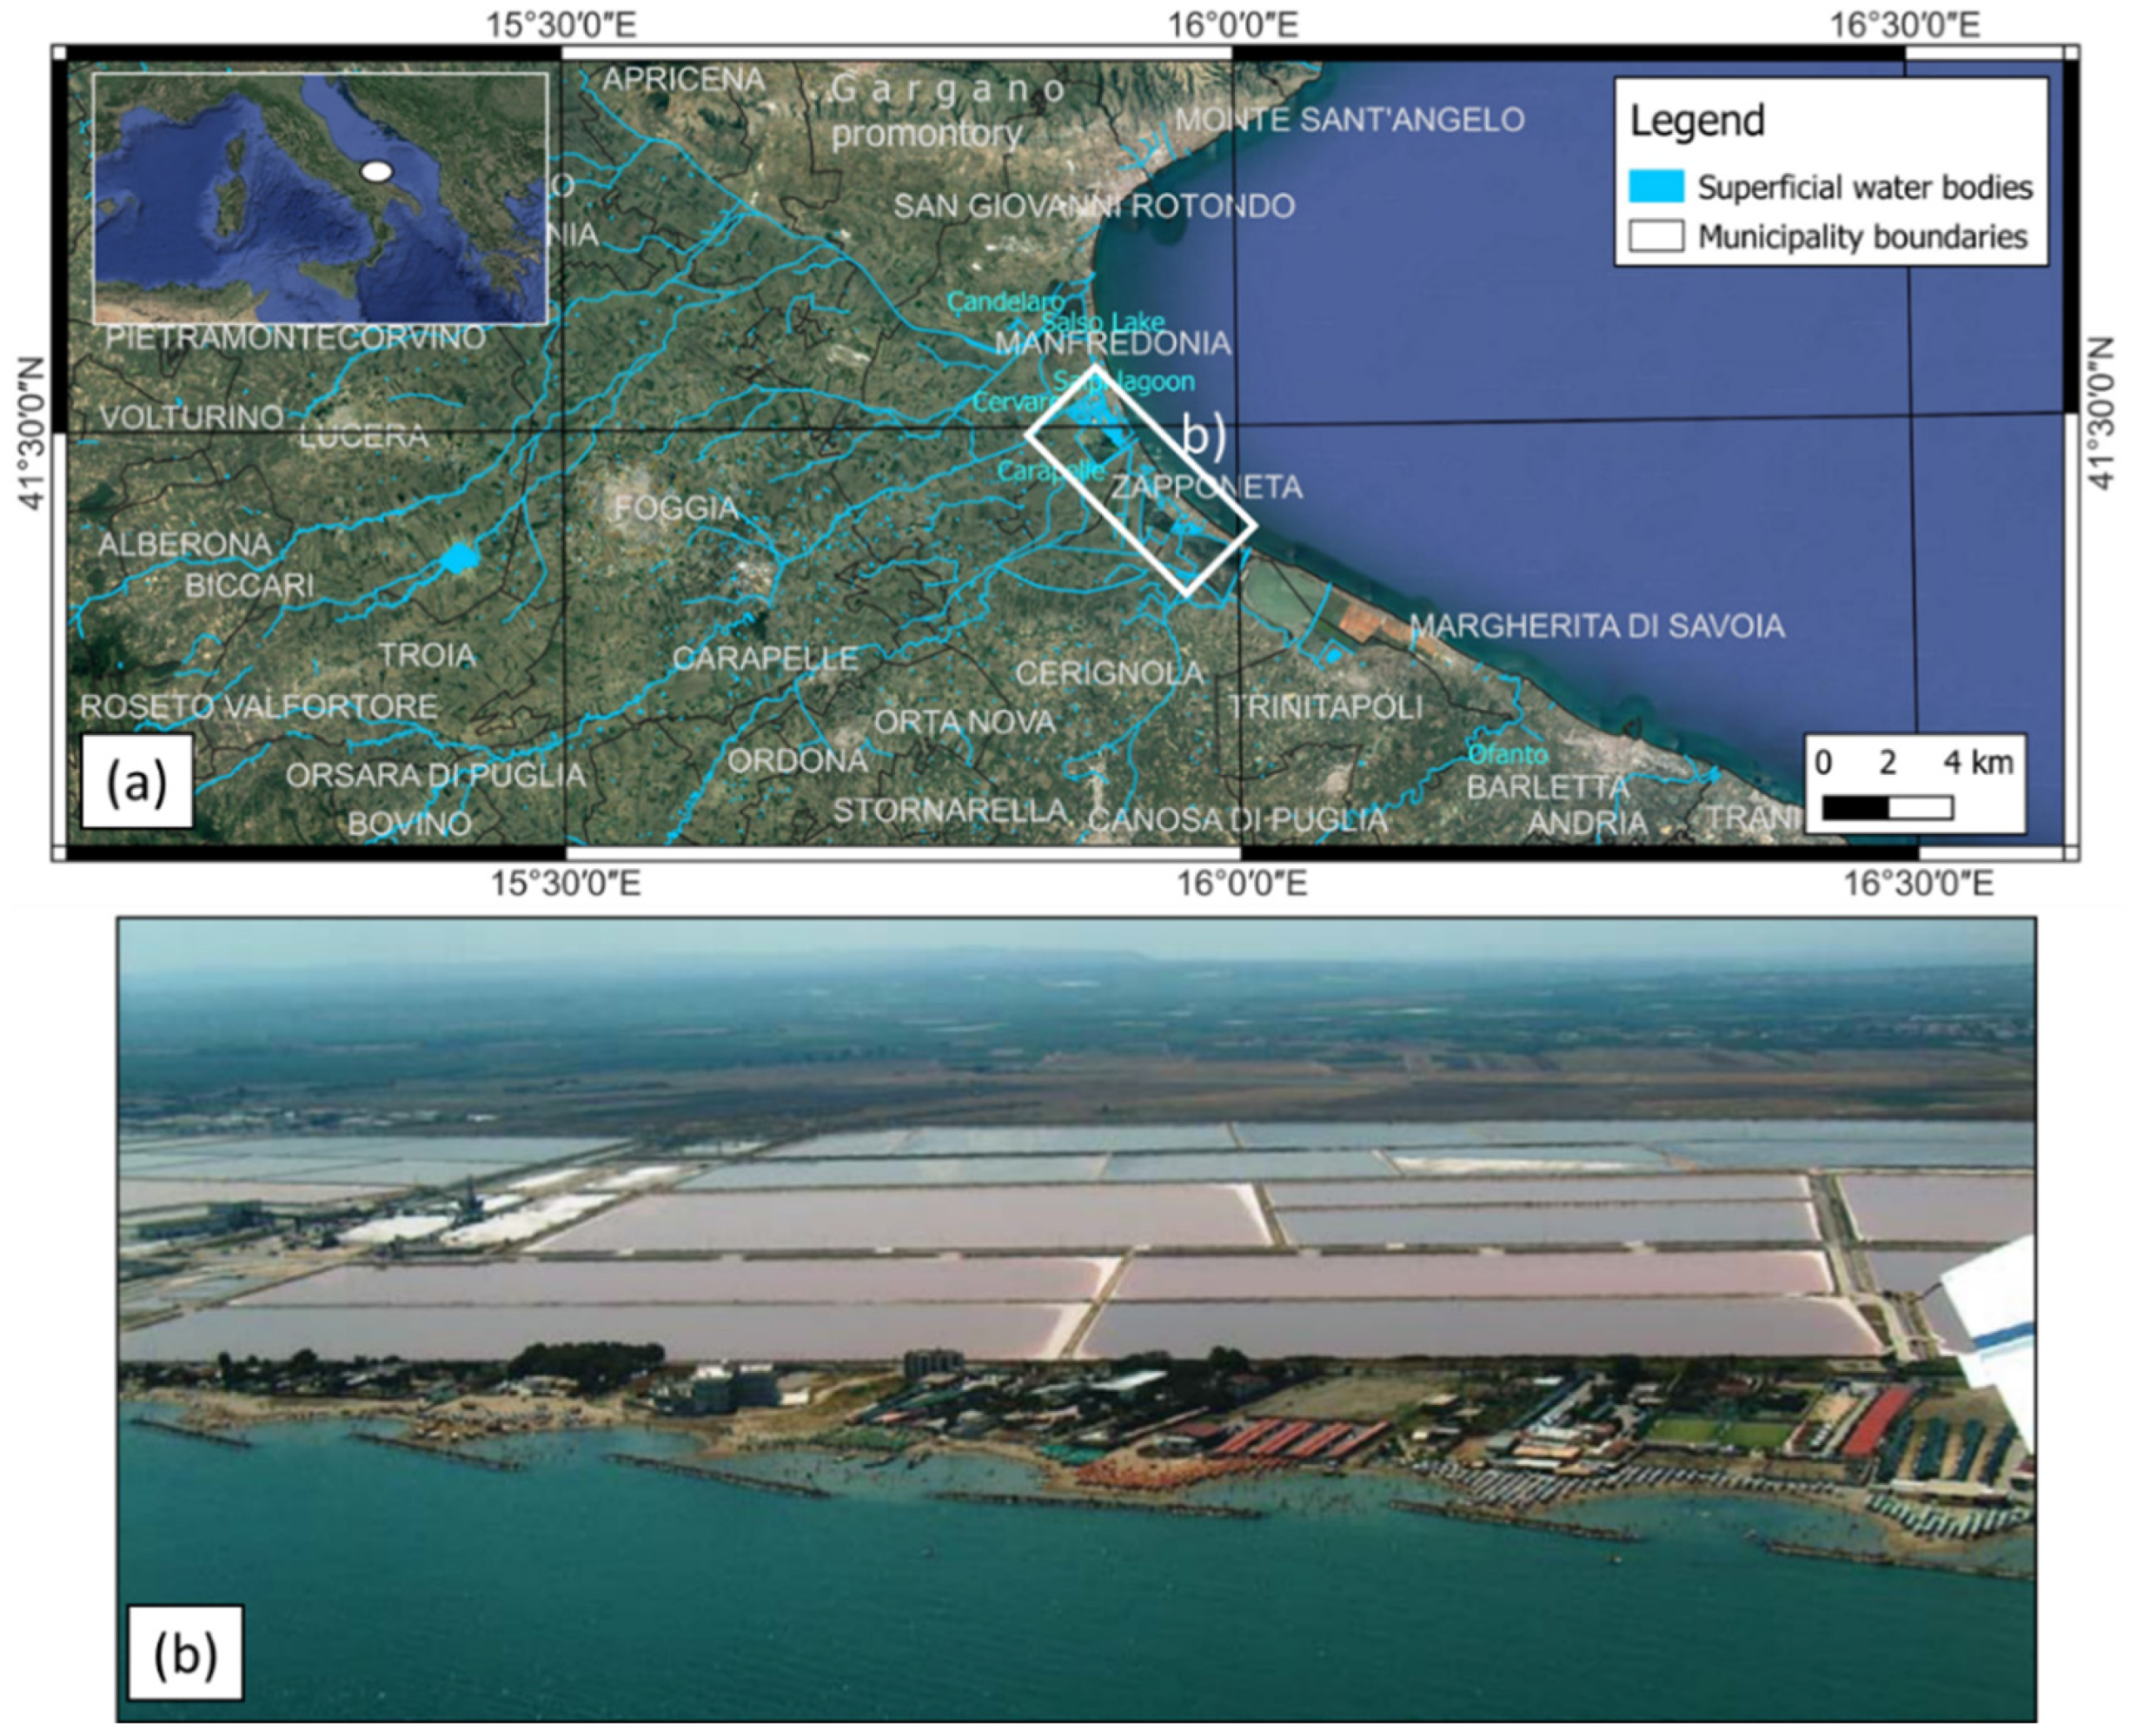
2. Study Area: The Gulf of Manfredonia

The Gulf of Manfredonia is located in the eastern part of Tavoliere delle Puglie and bordered by the Gargano Promontory to the north, the mountains of the Subappennino Dauno to the west, the Altopiano delle Murge to the south-east and the Adriatic Sea to the east [27,28,29]. This coastal plain extends for about 60 km between Barletta and Manfredonia (Figure 1).
This area is characterized by a peculiar landscape evolution from the Middle Pliocene to the Holocene. Between the Middle Pliocene and the Lower Pleistocene, it was subjected to a first geodynamic phase characterized by high rates of land subsidence [30]. During this phase, the accumulation of marine carbonate deposits of shallow water, known as the Calcarenite di Gravina formation, was followed by the appearance of the stratigraphic informal unit of argille subappennine [31,32,33]. From the Middle Pleistocene, uplift in the Apulia foreland started [30,34], with the sedimentation of regressive deposits on the Bradanic Trough and/or by marine and alluvial terraced deposits, from the oldest to the youngest, according to their progressive elevation [29,35]. Eight orders of terraced surfaces among 350 m and 5 m above sea level (asl) have been recognized and four orders of terraces are present between 15 m and 110 m below the sea level [29,36,37].
During the last glaciation, the coastal plain was characterized by a large swamp, formed in response to the abundant rainfall and poor river drainage [27]. During the Holocene, short sea-level stillstands appeared, as confirmed by the presence of now-submerged littoral ridges [38,39]. Subsequently, at the beginning of the Neolithic, the sea level was at a depth of about −10 to −15 m, followed by a SLR up to 3 m over the Middle Neolithic. At the end of the Neolithic, the swamp evolved into a sabkha and the whole area was abandoned until the end of the third millennium Before Christ (BC) [27,40]. Between the Bronze Age and the Middle Ages, the area experienced more phases of depopulation as a consequence of repeated outbreaks of malaria. At the beginning of the Modern Age, the Salpi lagoon was separated from the sea by a narrow strip of dunes about 150 m wide. From 1780 to 1825, the rainfall was low during winter and high aridity occurred during summer. These conditions led to the water level of the Salpi lagoon falling below the sea level [27]. Severe flooding of the Cervaro and Carapelle rivers occurred in 1795, when the Salpi lagoon was finally separated from the sea by a narrow strip of land. Subsequently, the lagoon turned into a large coastal swamp until 1930. During the middle of the 20th century, land reclamation, due to increasing human activities, gave the lagoon its current shape.
The entire littoral zone is nourished by alluvial sediments from the Candelaro, Cervaro, Carapelle, and Ofanto rivers, with a present-day longshore drift from the south-east to the north-west [41]. More recent coastal defense interventions—such as breakwaters and groynes—were undertaken to mitigate coastal erosion, mostly in the area between Zapponeta and Margherita di Savoia [19], where the dunes are almost completely eroded. The primary dune belt is constituted by medium sands located mainly along the southern littoral of Manfredonia, sometimes eroded in the proximity of touristic resorts. The sandy coast of Manfredonia is characterized by beaches with a foreshore width of 15 m and a mean slope of about 4–5 degrees, with local accumulation of low Posidonia oceanica banquettes, a backshore width of 25 m, and a mean slope of about 3–4 degrees.
This area is affected by land subsidence that conditions marine ingression and shoreline erosion. This land subsidence is likely to be associated with two different processes: (i) long-term lithospheric movements (tectonic, geodynamic and Glacial Isostatic Adjustment GIA); and (ii) sediment compaction and anthropogenic pressure due to the emplacement of new buildings and groundwater exploitation (anthropogenic subsidence). The occurrence of tectonic subsidence was suggested by the sampling of cores in the Ippocampo area [32], which highlighted the presence of Cladocora caespitosa bioherm in the alluvial deposits of the Carapelle and Cervaro rivers, at about −22 m. The bioherm was referred to as Marine Isotope Stage 5.5 (MIS 5.5, 132–116 kyrs), corresponding to a sea level of 6 ± 3 m higher than that of the present day [42,43]. The elevation of the bioherm highlighted a land subsidence of 26 ± 3 m from MIS 5.5 to the present day, with a rate of between −0.23 and −0.11 mm/y and a mean value of −0.21 mm/yr [32]. Notably, these data represent the greatest tectonic subsidence rate estimated for any location along the southern and central Adriatic coast [44].
The anthropogenic subsidence on selected coastal areas in the Tavoliere delle Puglie was assessed through the European Space Agency (ESA)’s legacy ERS and ENVISAT SAR observations. The data were processed through Persistent Scatterers Interferometric Synthetic Aperture Radar (PSInSAR) techniques [45], for the periods 1995–2000 (ERS) and 2003–2008 (ENVISAT), respectively, and highlighted subsidence rates exceeding 20 mm/yr in the Ippocampo coastal area.
The subsidence in this area determines the advancement of the Ghyben–Herzberg interface [46], producing a reduction in freshwater resources. Furthermore, in the northern part of Tavoliere delle Puglie, in correspondence with the Candelaro fault (Figure 2), saltwater reaches even farther inland, since this tectonic structure enhances the water flow rather than acting as a hydraulic barrier. Many authors [47,48,49,50] report high water-temperature and salinity values linked to the mixing of deep water and freshwater.

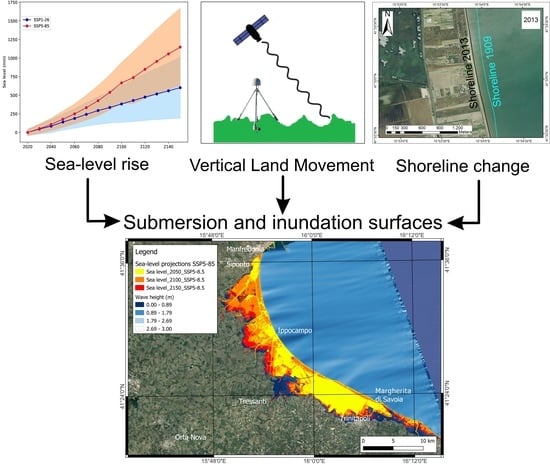
3. Materials and Methods

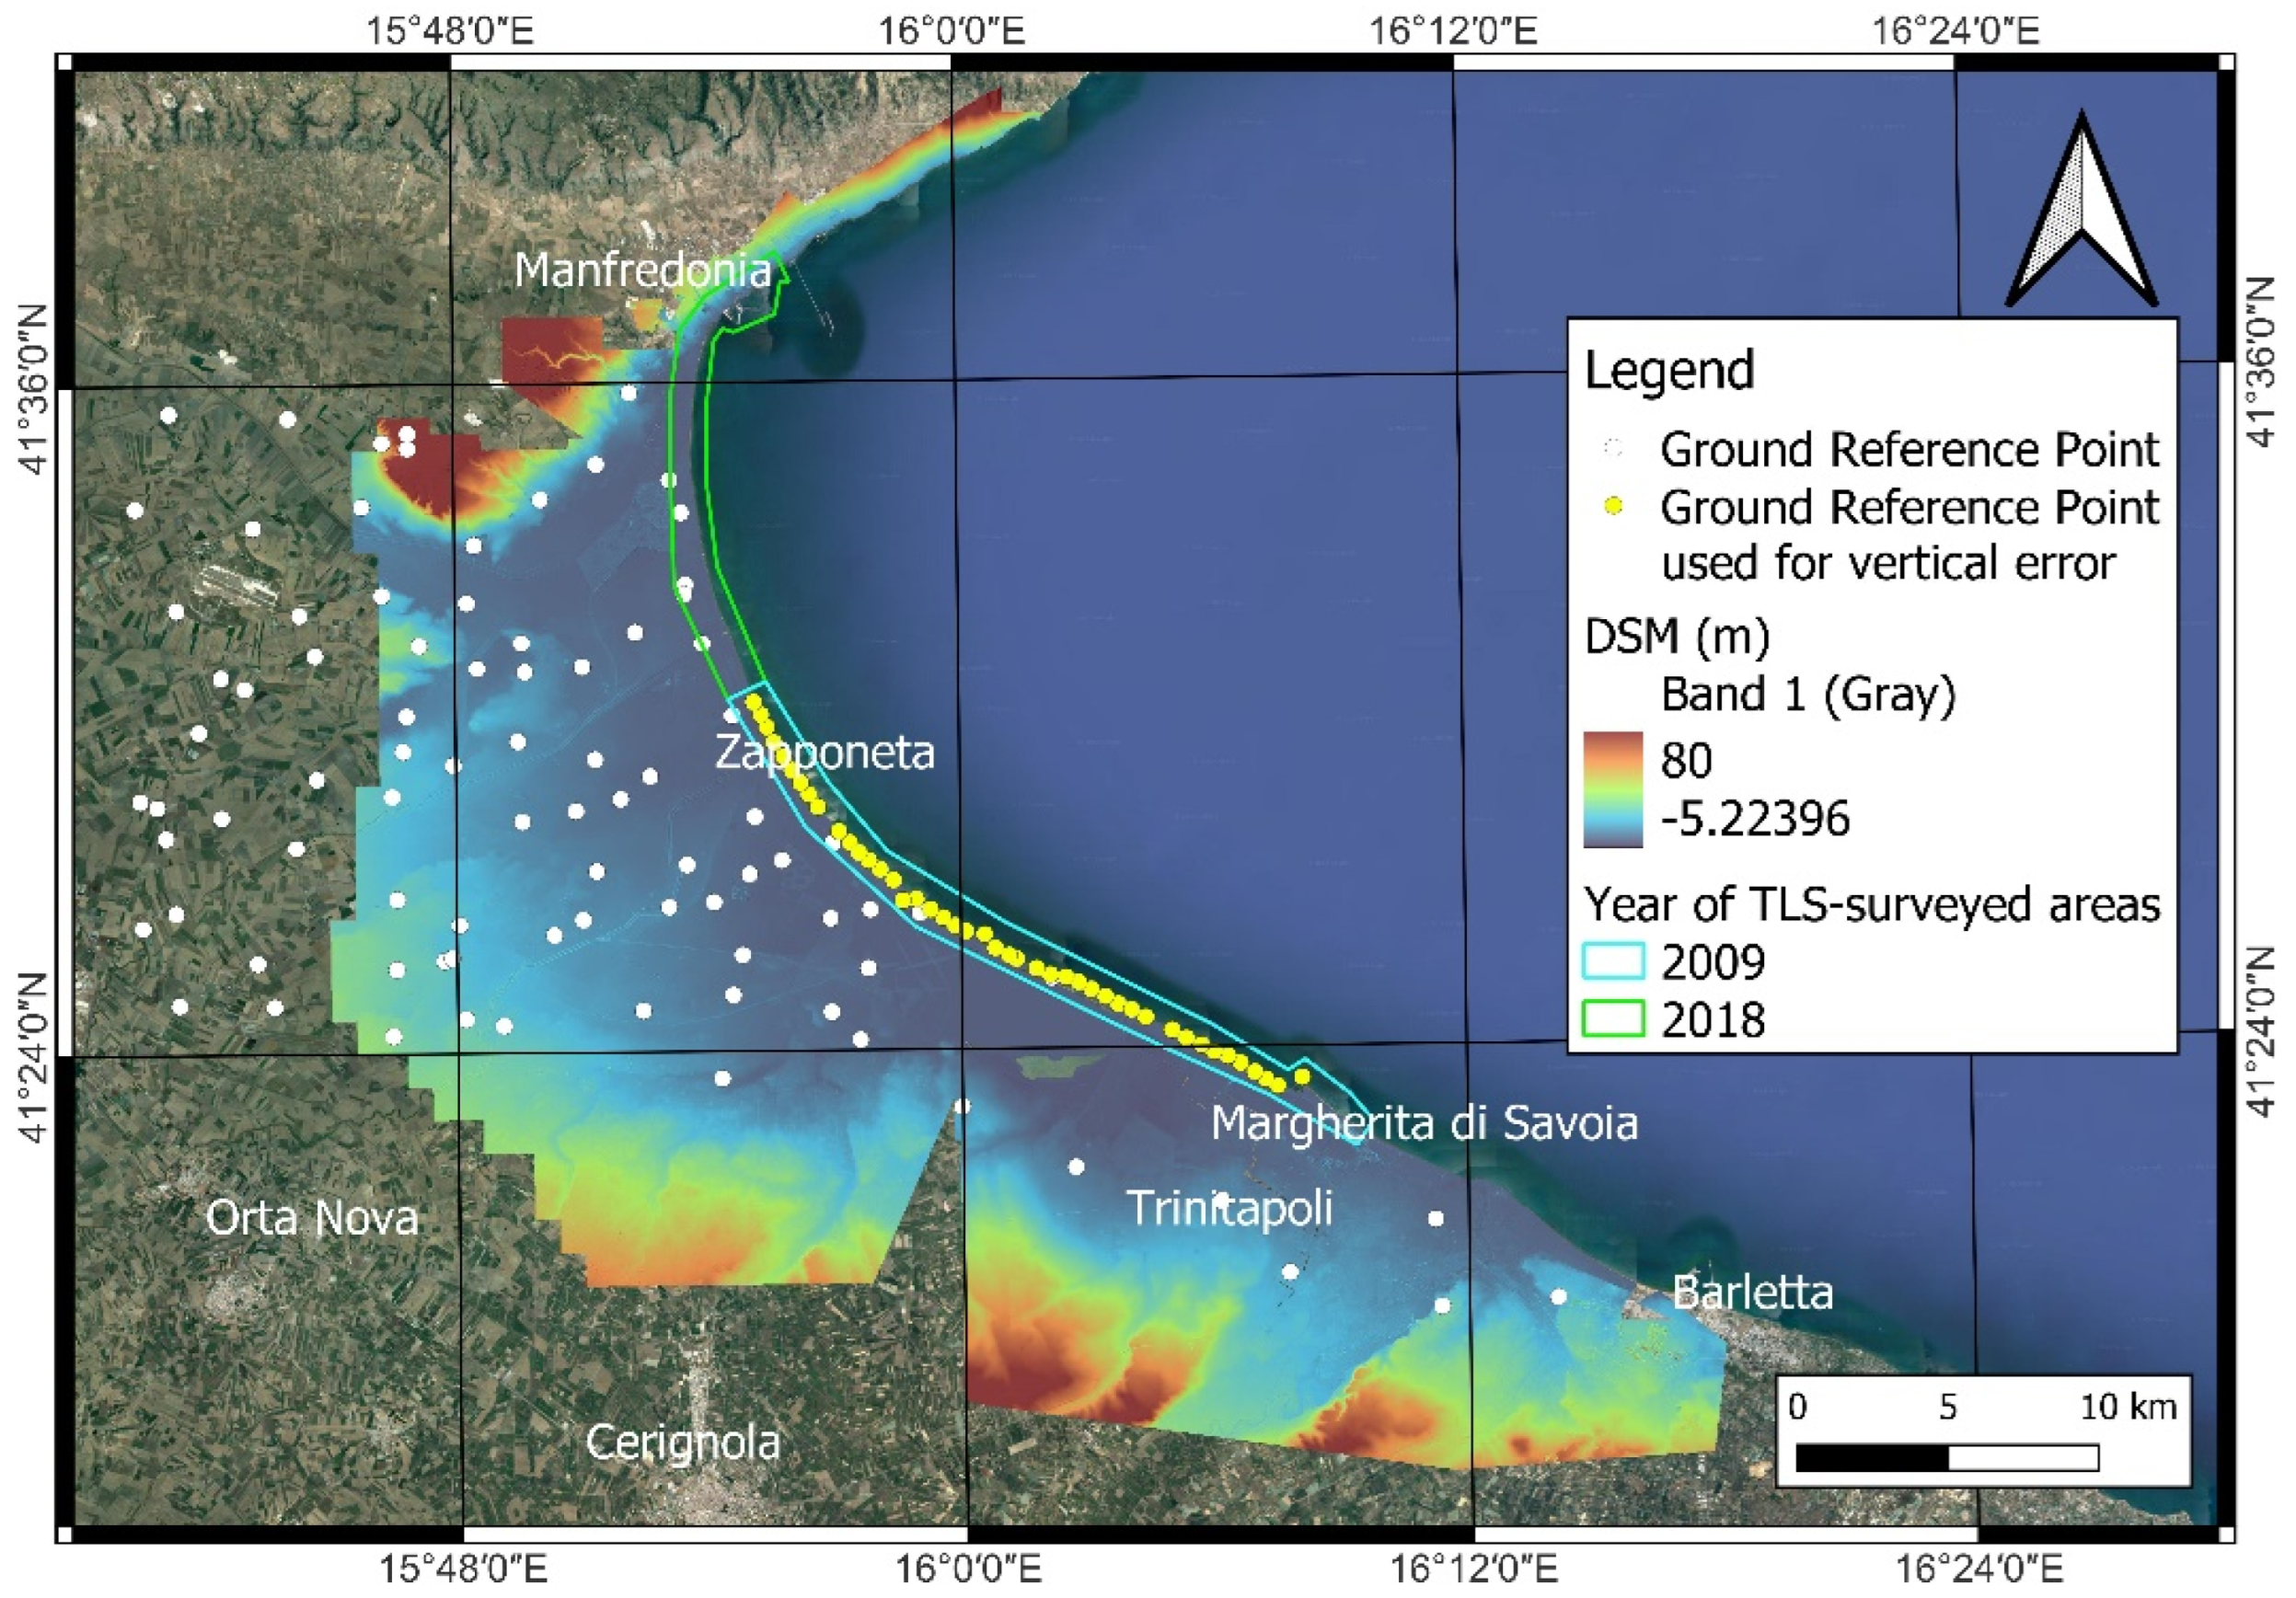
3.1. Topographic Survey of the Coastal Plain

Ground-based Terrestrial Laser Scanner (TLS) and Airborne Laser Scanner (ALS) data were used to obtain a DSM of the investigated area with a resolution of 0.05 m and georeferenced in WGS84/UTM zone 33N. The TLS surveys were performed in 2009 and 2018 through a mobile Riegl VZ400 instrument, to cover the littoral area of the emerged beach, ranging from the primary dune to the foreshore. The ALS data were acquired for the inland areas by the ex-Italian Environmental Ministry (Ministero dell’Ambiente) during the years 2008–2009, with vertical accuracy of 0.15 m and spatial resolution of 1 m over inland areas, and georeferenced in WGS84/UTM zone 33N. TLS and ALS data were interpolated using a natural neighbour method to obtain two distinct DSMs in the same reference system: (i) a TLS-DSM for the coastal area, and (ii) an ALS-DSM for the inland area. Both DSMs were obtained using a mesh of 1 m and a neighbour-search circle with a radius equal to 2 m.
From the merging of the TLS and ALS models, a final DSM was obtained with 1 × 1-meter pixel resolution, covering the entire extent of the coastal plain (Figure 3).
To obtain a high-resolution DSM for the assessment of flooding surface, an analysis of the vertical accuracy was performed. The latter was evaluated through two quantitative analyses estimating (a) the differences in data elevation between the two input DSMs (i.e., ALS-DSM and TLS-DSM, in the overlapping areas), and (b) the vertical errors of the input DSMs (pre-merge evaluation) and the output DSM (post-merge evaluation) with respect to a set of local Ground Reference Points (GRPs)acquired in 2009 [53,54,55,56,57] (Figure 3).
The difference between elevation values of the DSMs ( Δ z ) was computed per cell:
Δ z = Z TLS Z ALS
where Z TLS is the elevation value from TLS-DSM and Z ALS is the elevation value from ALS-DSM. Furthermore, a spatial analysis of different cell locations and corresponding surfaces shows that the largest height-difference values (equal to or greater than ±3 m) fell in built-up or vegetated areas.
The vertical errors of DSMs are estimated by comparing the elevation data of the models with the elevation of GRPs measured by GPS and leveling techniques, connected to the geodetic national network. An available set of 42 GRPs in the coastal zones of the study area was used. The height value of the reference point was subtracted from the DSM cell value in correspondence to the GRP position:
E = Z m Z GRP
where E is the error, Z m is the height value of the DSM, and Z GRP is the height value of the GRP. The error assessment was applied to TLS-DSM, ALS-DSM, and merged DSM in order to prevent the merging procedure from altering the quality of the data used for effective prediction of SLR scenarios. Metrics such as root mean square error (RMSE), standard deviation (SD), and mean error were computed to show the differences between the DSM and GRP values. In Table 1, the accuracy analysis and statistics for the DSMs, considering pre-merge and post-merge error trends, are reported.

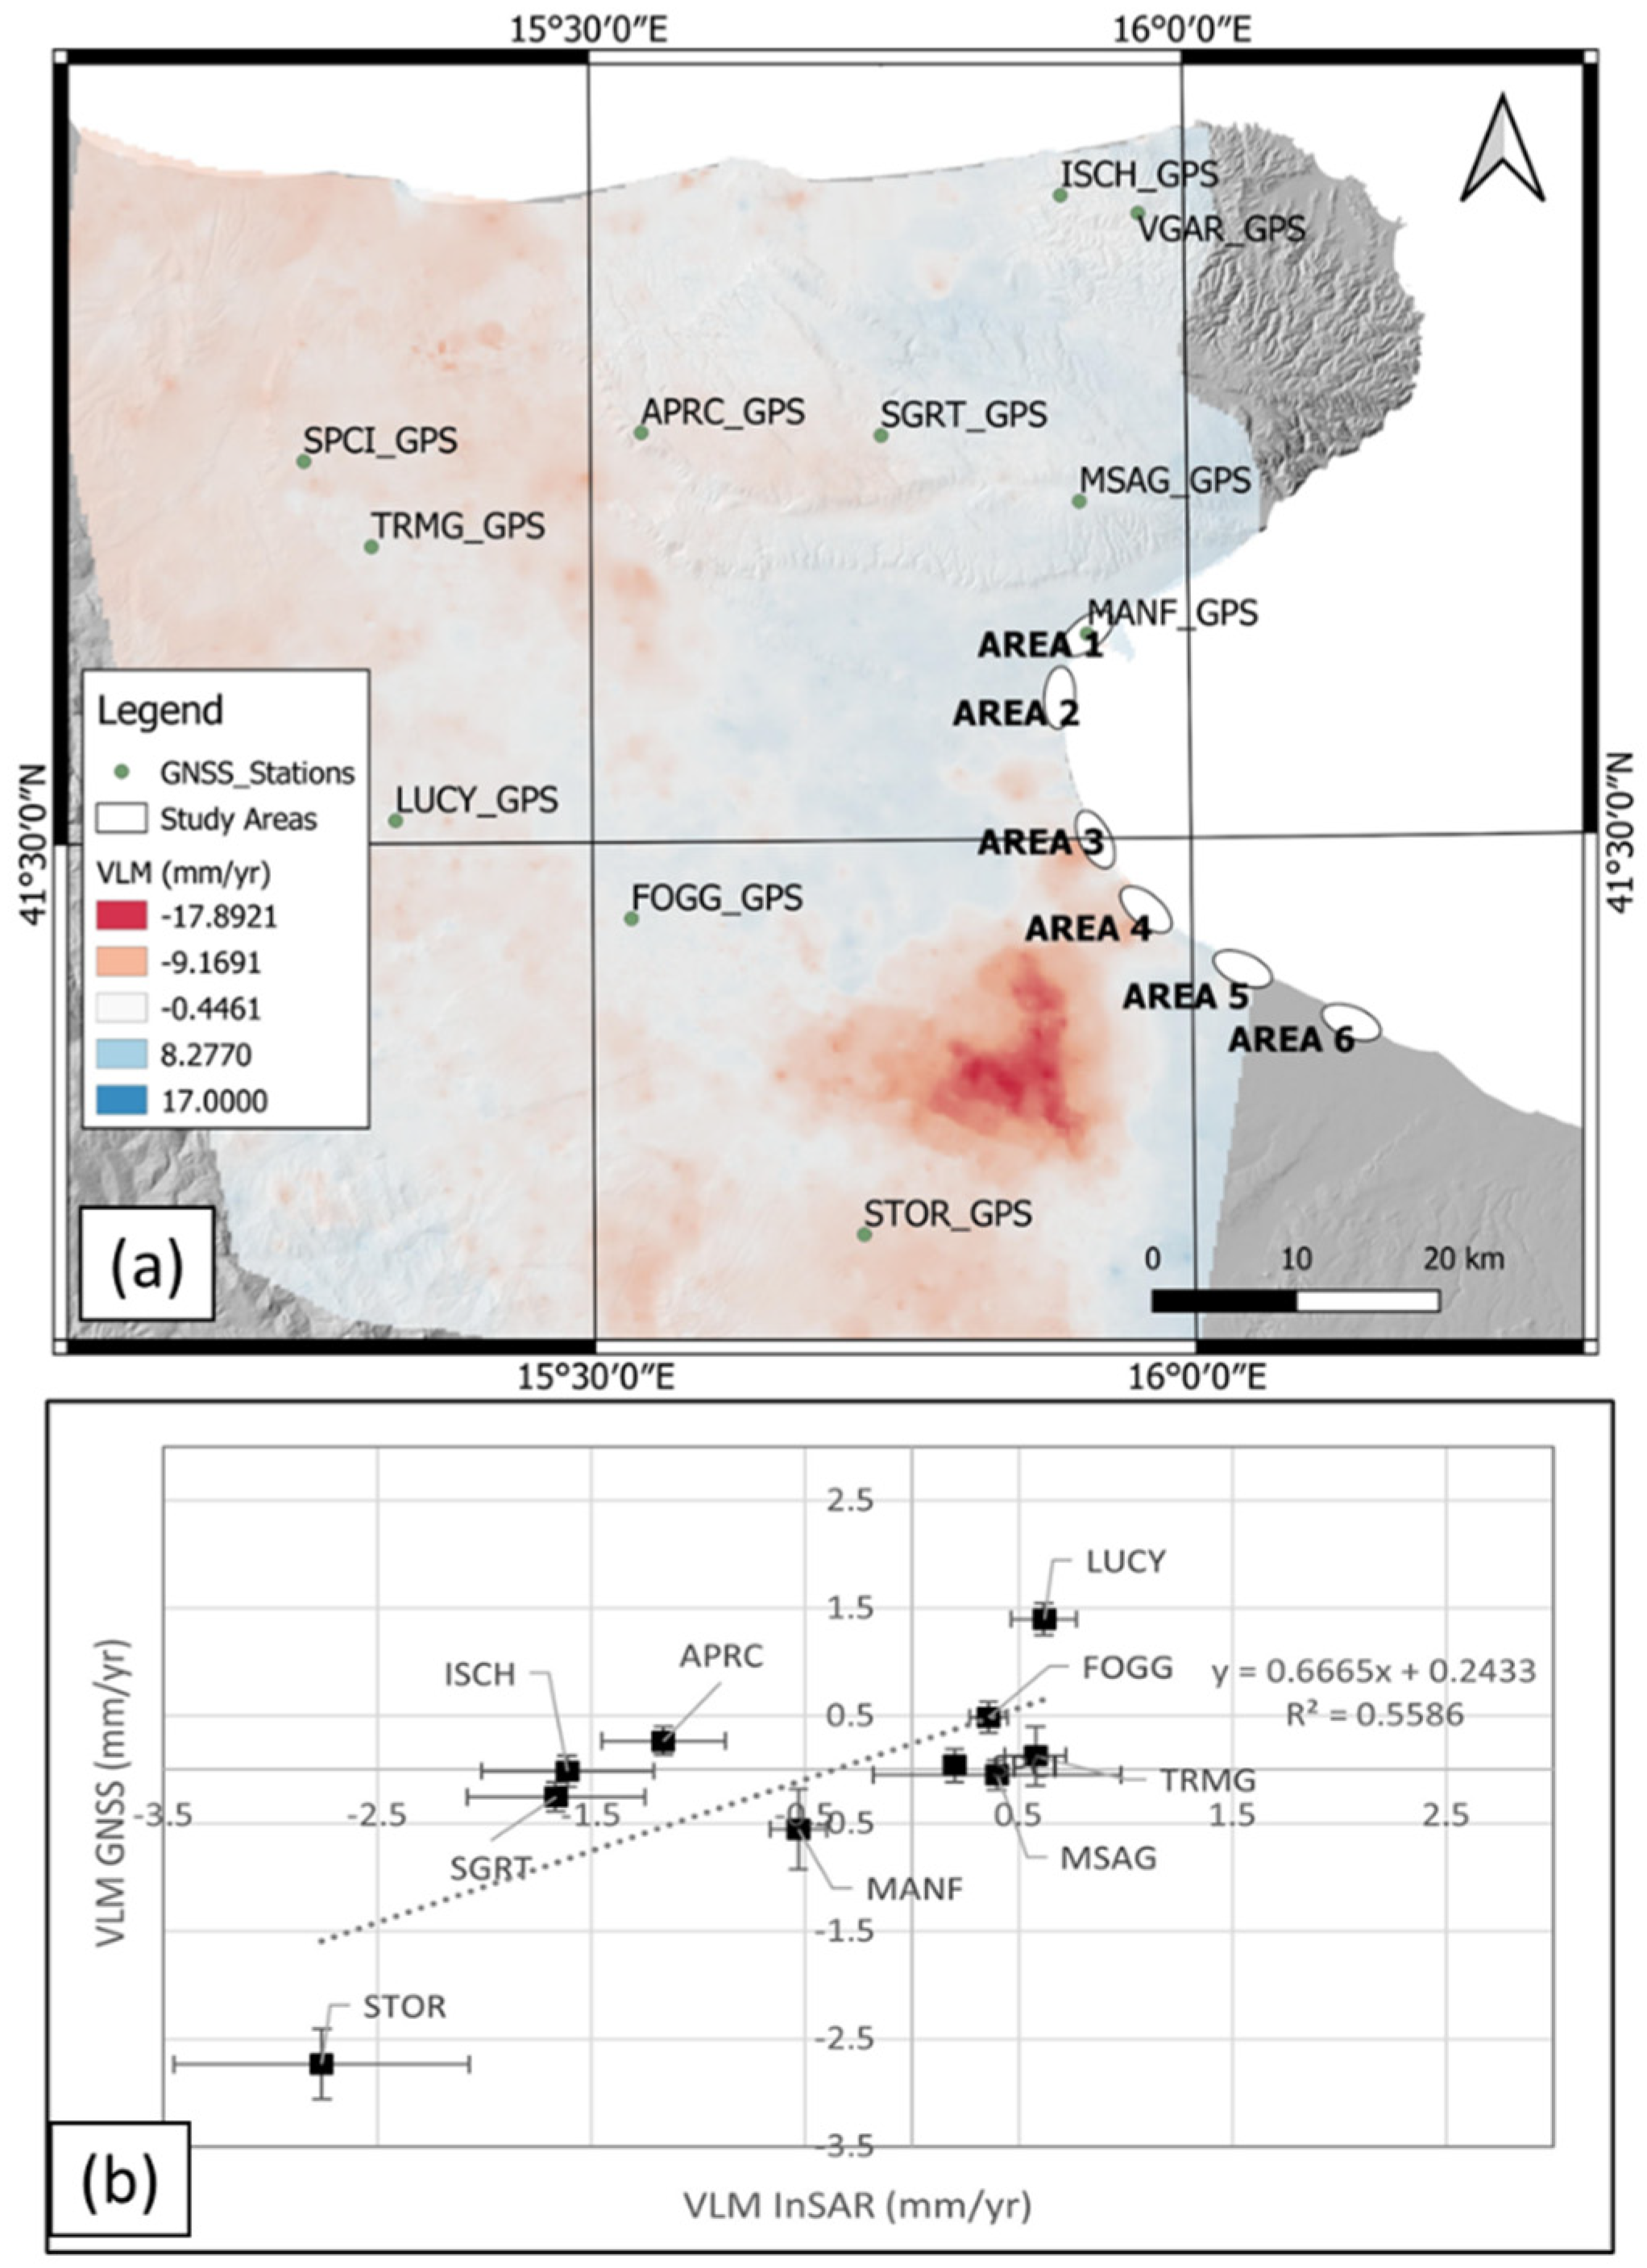
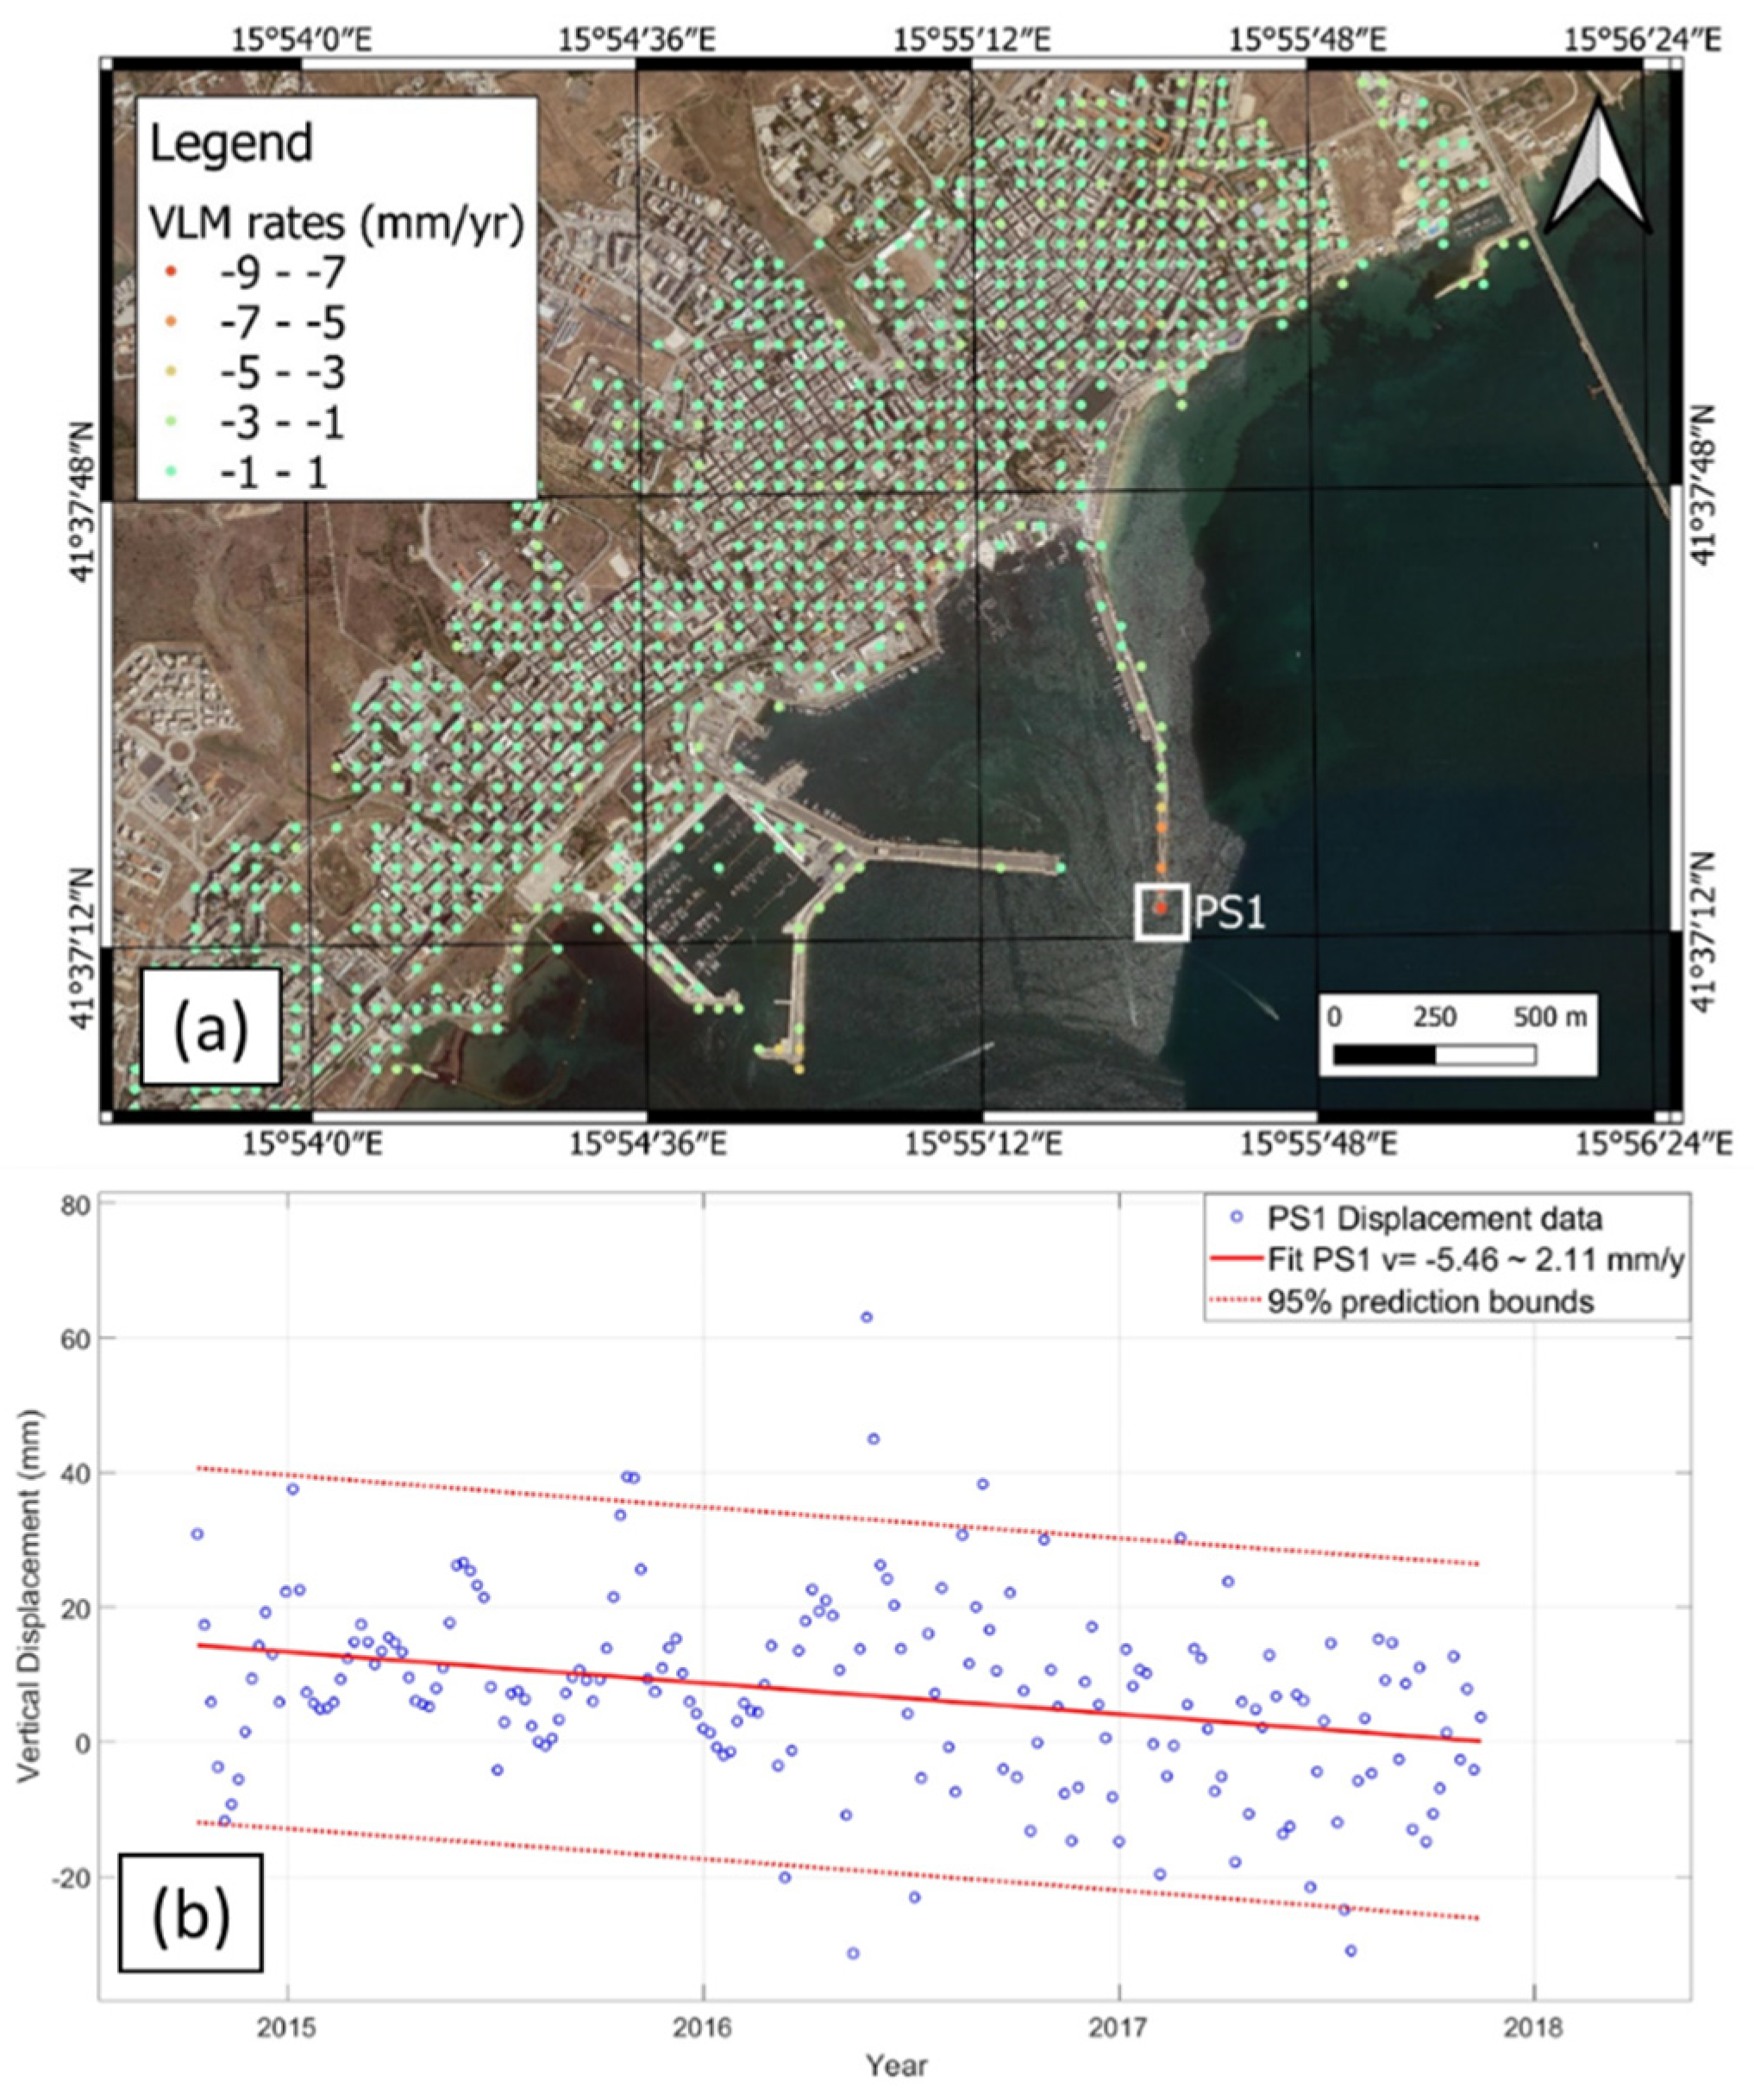
3.2. Vertical Land Movements

Persistent Scatter (PS) InSAR data from ESA’s Sentinel-1 satellites were used (C-Band SAR sensor, with a wavelength of 5.6 cm), from both ascending and descending orbits, covering the period from September 2014 to January 2021. Sentinel-1 satellites are operated by ESA in the Terrain Observation with Progressive Scans SAR (TOPSAR) acquisition mode (VV polarization); data are freely distributed ( https://sentinel.esa.int/web/sentinel/missions/sentinel-1, accessed on 18 August 2022). Specifically, we considered 94 images along the descending orbit covering the time interval from September 2014 to January 2021 with a revisiting time of 12 days, enough to detect the land movement in the investigated area. The same procedure was considered for the ascending orbit, selecting 117 images from December 2015 to March 2018.
The Sentinel-1 images were processed with the persistent scatterer interferometry technique (PSI) [58] and a series of PS undergoing VLMs was identified in the study area. With both PS in ascending and descending orbits, it was possible to evaluate through trigonometric considerations the vertical component of the displacement from the original data, which were measured along the sensor line of sight (LoS) [59]:
V v = V A + V D 2 cos θ
where V A and V D are the average interpolated LoS velocities for PS in ascending and descending orbit, respectively, while θ is the angle determined by the LoS with respect to the vertical (about 44 degrees for the processed Sentinel-1 data).
For the computation of the vertical component, two rasters were obtained for the PS in ascending and descending orbits by means of the nearest-neighbour gridding method, with a mesh of 250 m and a search circle of radius K = 50 m. Using Raster calculator in QGIS environment, the V v value was computed for each pixel, thereby obtaining a map of VLMs (Figure 4a).
The V A and V D obtained from the InSAR dataset were calibrated with the GNSS records available for northern Apulia (Figure 4b), provided by the GNSS-RING network [60], managed by INGV, and integrated by other active GNSS stations belonging to regional and national networks [61,62]. GNSS data were processed following the procedures described in a study by Serpelloni et al. [63]. For each GNSS station, the velocities in the LoS direction were assessed in both ascending and descending orbits, following the relationship below:
G P S LoS = U cos θ + E sin θ cos ξ + N sin θ sin ξ
where:
θ is the SAR incident angle;
ξ is the SAR orbit heading angle;
U is the GNSS velocity up component;
E is the GNSS velocity east component;
N is the GNSS velocity north component.
Differences between InSAR and GNSS LoS projected velocities were estimated for each GNSS station (Figure 4), and a line was fitted through the difference values. Ascending and descending LoS PS InSAR data were calibrated independently. This procedure is known from the literature [64,65] to provide satisfying results. This is because the PS InSAR technique estimates relative displacements in both the temporal and the spatial dimensions, and is therefore insensitive to large-scale velocity trends, which are instead well captured by GNSS measurements. For this study, the area was relatively small; therefore, a simple 2-D planar function was considered sufficient to model InSAR v.s GNSS velocity differences, rather than higher-degree 2-D polynomials used on larger areas. The DSM obtained by LiDAR data were then corrected with the obtained VLMs. VLM rates were extrapolated to the years 2050, 2100, and 2150, and were added to the DSM surfaces, to reconstruct the future topography. The largest effects were observed in the areas of Ippocampo-Zapponeta, where VLM rates reached values of approximately −7 mm/yr.

3.3. Modeling Long-Term Flooding and Shoreline Retreat

The permanent flooding due to sea-level rise was determined following the method shown in Scardino et al. [66]. This analysis was based on the combined effects caused by vertical components of RSLR and horizontal components of shoreline changes.
Regional-scale projections of long-term vertical SLR were obtained from [66]. These were updated with versions of the IPCC AR6 projections, downscaled for the Mediterranean Sea, which take into account the thermosteric and surface-mass balance contributions, the Greenland and Antarctic ice sheets, the glacier- and land-water storage, the GIA adjustment, and the inverse barometer effect (see [24,66] for full discussion). Two specific projections were used, SSP1-2.6 and SSP5-8.5, which represent low and high greenhouse-gas concentrations, respectively, and are thus representative of best- and worst-case projections, respectively.
To ensure the best accuracy of flood modeling, the regional projections were adjusted for VLM rates in order to estimate their local (i.e., study-area-specific) contributions to vertical RSLR and to horizontal shoreline movements. Vertical RSLR was assessed through the SLR projections (with best- and worst-case projections) on the future topography.
The assessment of horizontal components due to the sediment movements was obtained through the analysis of shoreline change rates using the Digital Shoreline Analysis (DSAS) add-in for ArcGIS [67]. To assess the shoreline rate changes in the Gulf of Manfredonia, historic maps, aerial photographs, optical multispectral satellite images from the Landsat 7–8, and WorldView 2 sensors, and topographic data (see Table S1—Supplementary Material) were used. From the satellite images and aerial photographs, the shorelines were digitized in a GIS environment for each year. In the coastal areas affected by several meters of coastal retreat, an estimation of the rate of total shoreline retreat was performed. To this end, we applied a linear regression to each of the digitized shoreline positions [67]. Firstly, to assess the coastal retreat due to SLR contribution alone, we assumed the investigated coasts to be in a steady state, without significant variation in sediment supply, and the shoreline migration to be caused only by land subsidence estimated by the geodetic measurements. Secondly, the eustatic sea-level component was added to the local land-subsidence analysis to obtain horizontal displacements as functions of the coastal slope. The latter were extracted from the above-mentioned DSM obtained from ALS and TLS data. To predict the shoreline migration in 2050, 2100, and 2150, we incorporated the sea-level projections in the model reported by Scardino et al. [66].
This model was implemented in the MATLAB environment by considering the future shoreline position through the relationships reported by Scardino et al. [66] (see Supplementary Material). The projected shoreline position was computed from the combination of vertical displacement ( Δ z ) (due to the future RSLR) and horizontal displacement, obtained from the easterly ( Δ x ) and northerly ( Δ y ) movement of the shoreline.

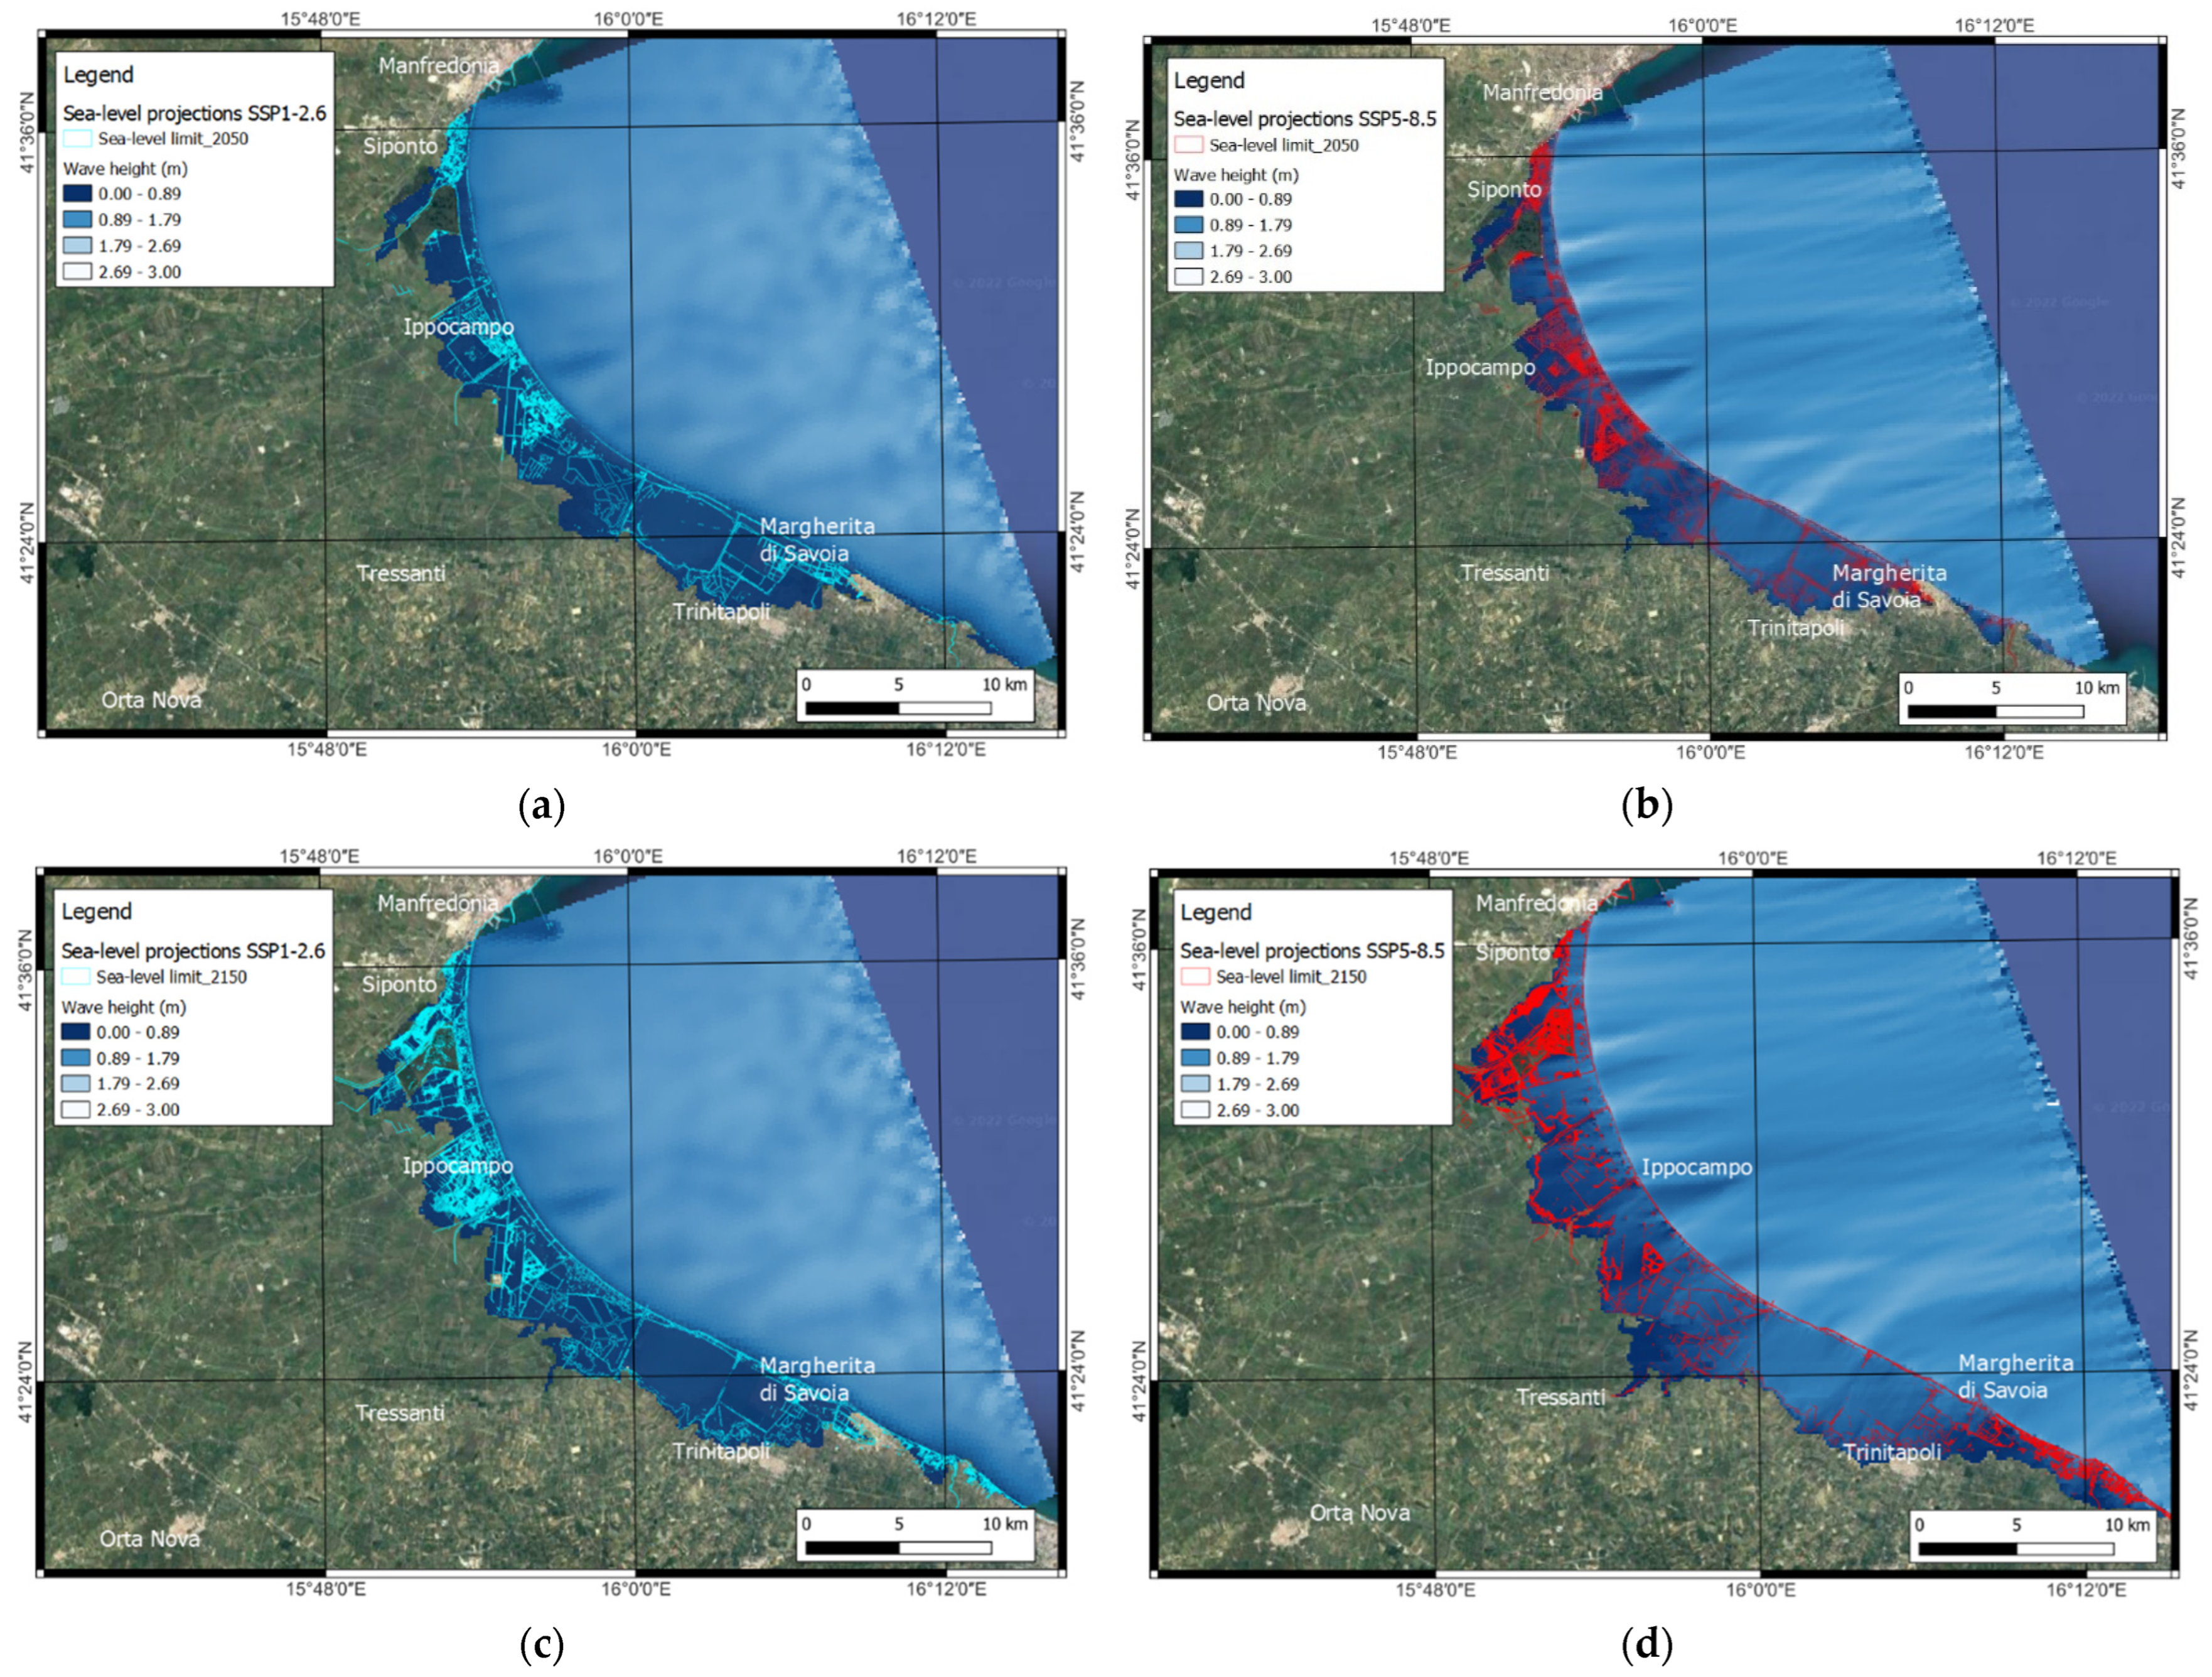
3.4. Modeling Storm Flooding

The intensification of the impact of storms in combination with SLR was also considered a key factor in future scenarios [26,68]. The impact of storms could result in temporary flooding caused by the surge itself (temporary SLR caused by a combination of meteorological conditions and astronomical tides) and by enhanced effects of river discharge induced by rainfall. The storm-wave impact in the Gulf of Manfredonia was modeled in the XBeach environment [69,70]. Considering that the lack of buoy data did not allow a full characterization of the spectral wave parameters in the Gulf of Manfredonia, the meteorological models were taken into consideration. In particular, the spectral wave parameters were obtained through MOLOCH-ERA5 meteorological model [71], which reported the mean sea level, wind stress, and water level for the event of 10–13 November 2019, which occurred in the Adriatic basin. This storm was particularly intense and exerted critical effects on the northern Adriatic, such as flooding in the Venice lagoon [71,72]. The model showed significant wave heights, ranging from 0.9 m to 2.5 m in the southern Adriatic, with water levels of up to about 1.2 m. To assess the effects of the storm event in different RSLR scenarios, the spectral wave parameters were inserted in the boundary conditions of XBeach grid domain. The grid domain was obtained through a cell averaging interpolation of the topography corrected with VLM displacements. The cell width of the grid domain is equal to 80 × 80 m offshore and 4 × 4 m on the emerged surface (see Supplementary Material-Section S2). The output of the model provides the flooding on the emerged surface, representing the temporary flooding that could occur in RSLR scenarios.

3.5. Evaluation of Assets Potentially Exposed to Sea-Level Rise

To evaluate the assets potentially exposed to SLR, a spatial overlay between the modeled zones of inundation for each scenario and high-resolution land-use data was analyzed in GIS environments. The land-use data are freely available in the Regione Puglia geoportal https://pugliacon.regione.puglia.it/web/sit-puglia-sit/home#menu (accessed on 18 August 2022) [73]. The spatial overlay was also performed on nature-protection areas that fall within the Europe-wide Natura 2000 network. By means of this analysis, the following data were obtained for each SLR scenario: (1) the percentage value of each land-use category expected to be lost in the total submerged area; and (2) the surfaces of protected areas expected to be affected by submersion.

4. Results and Discussions

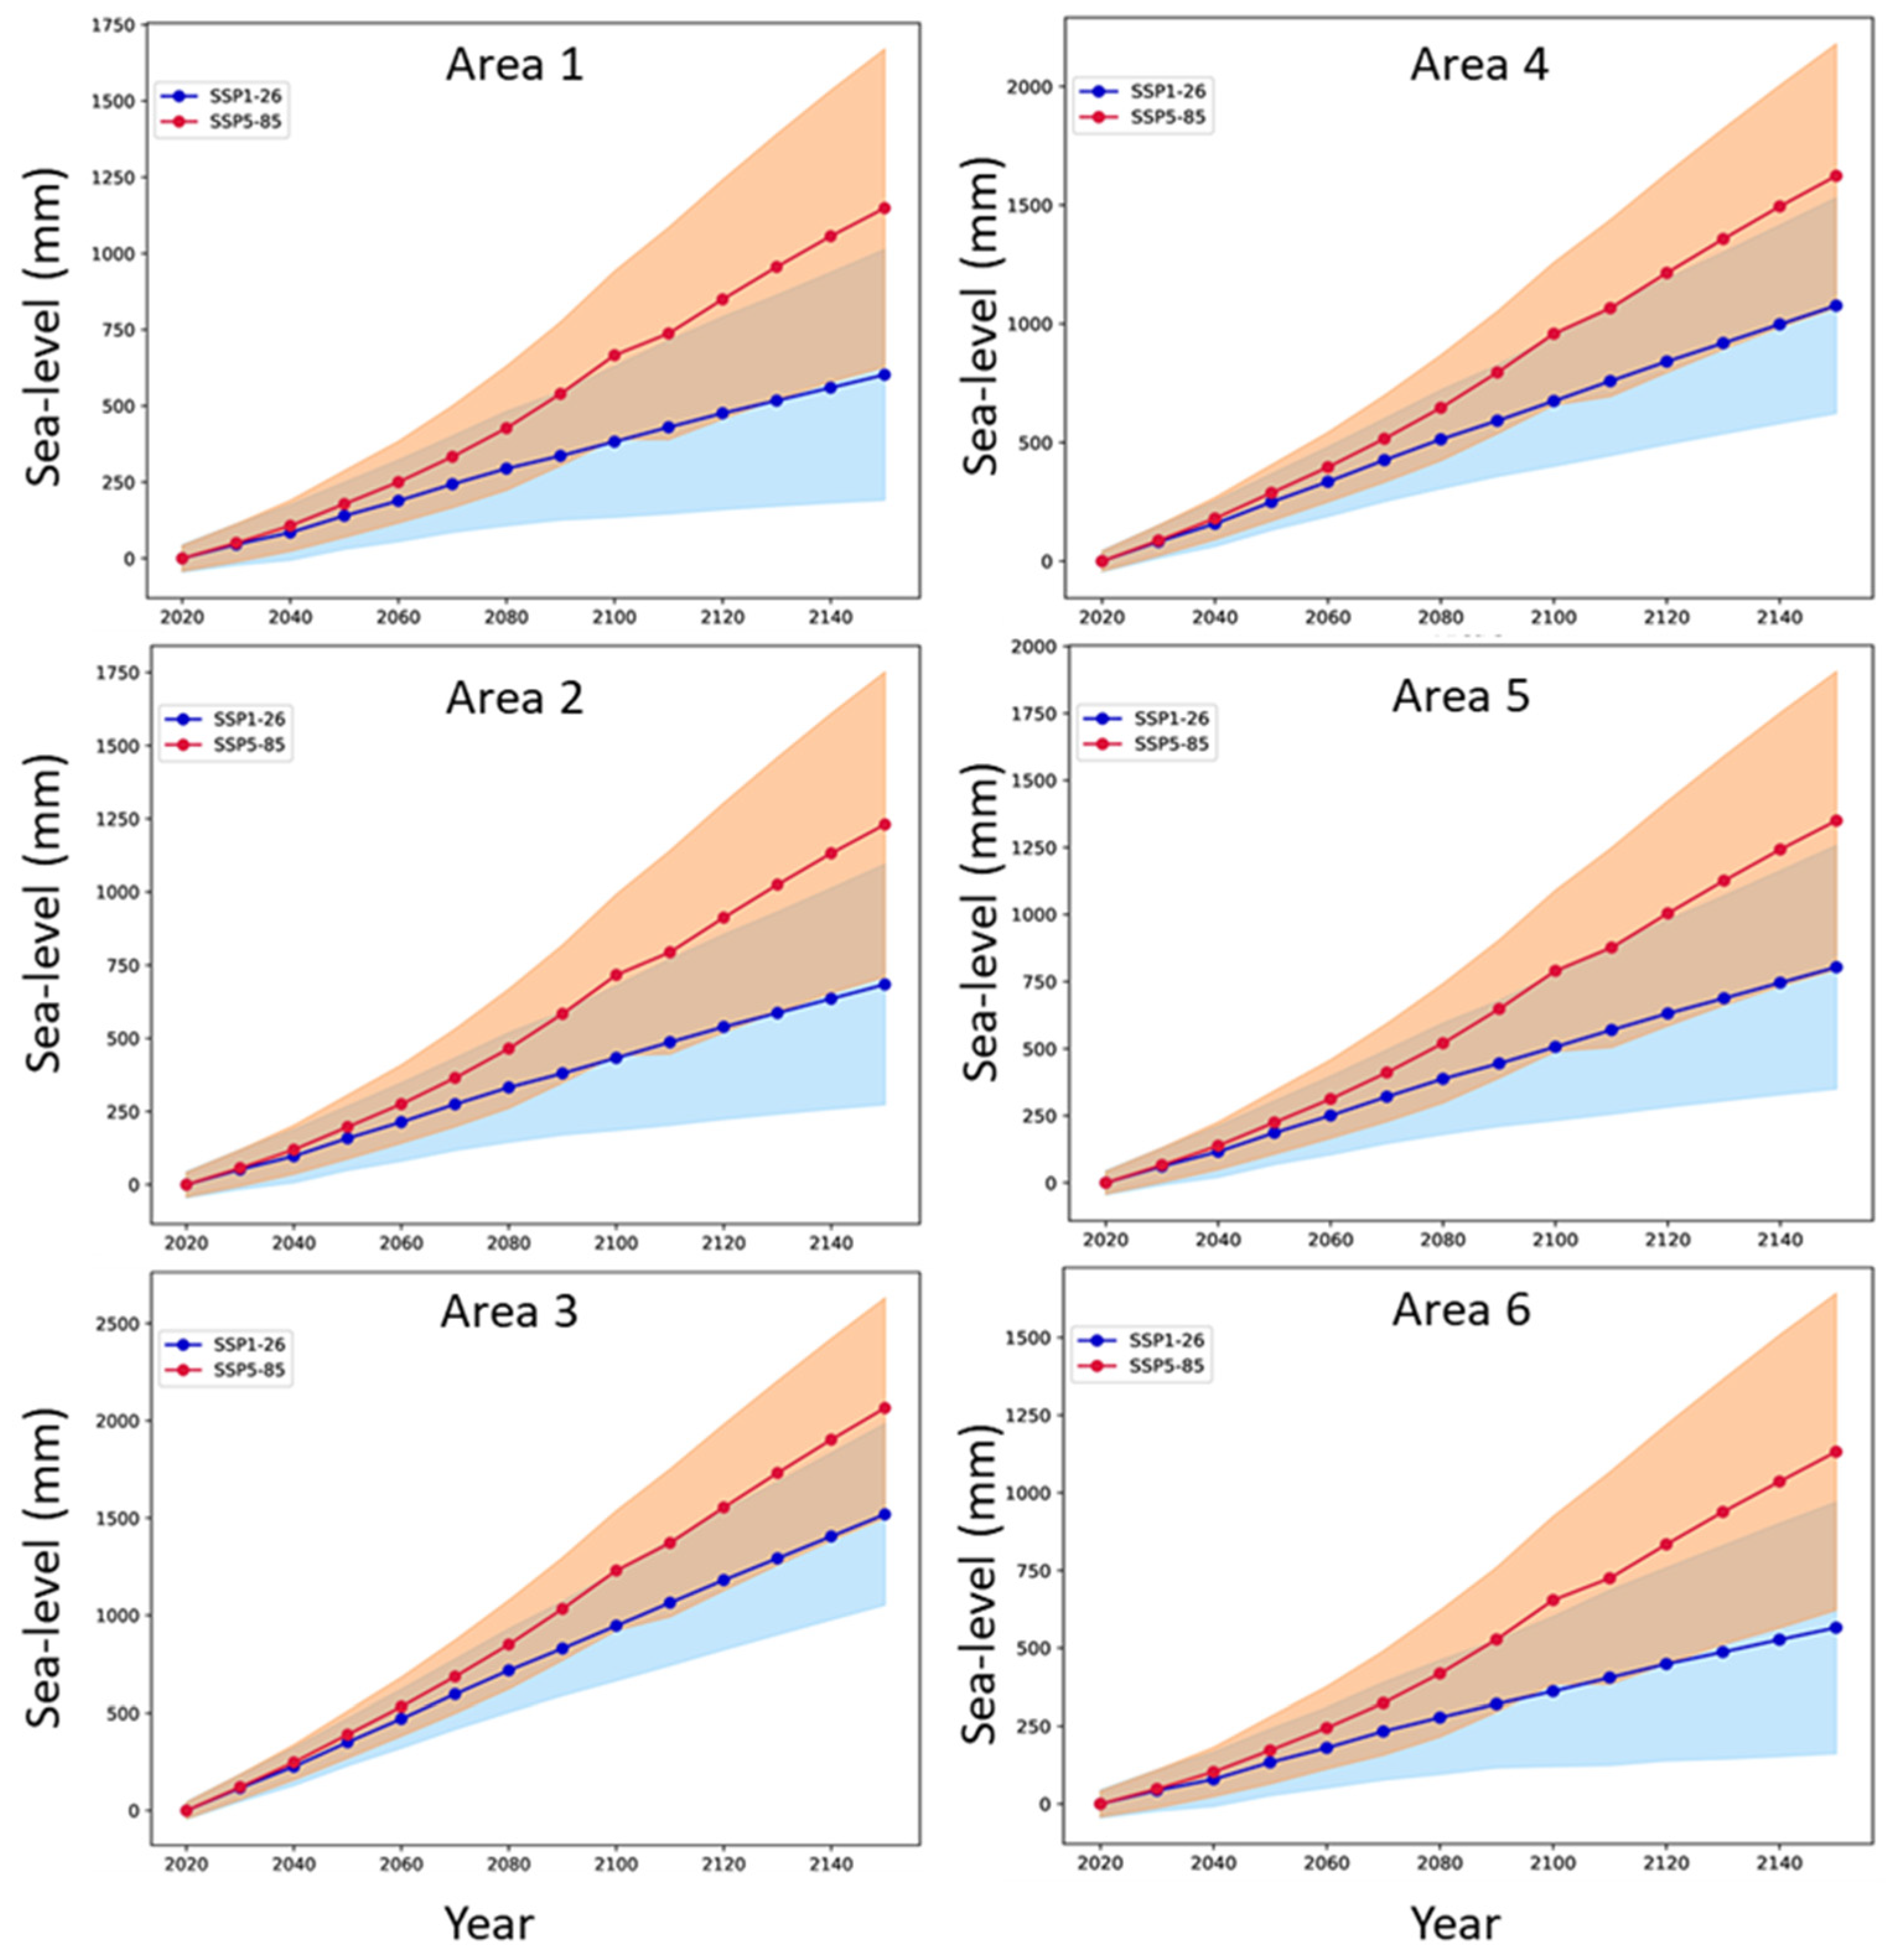
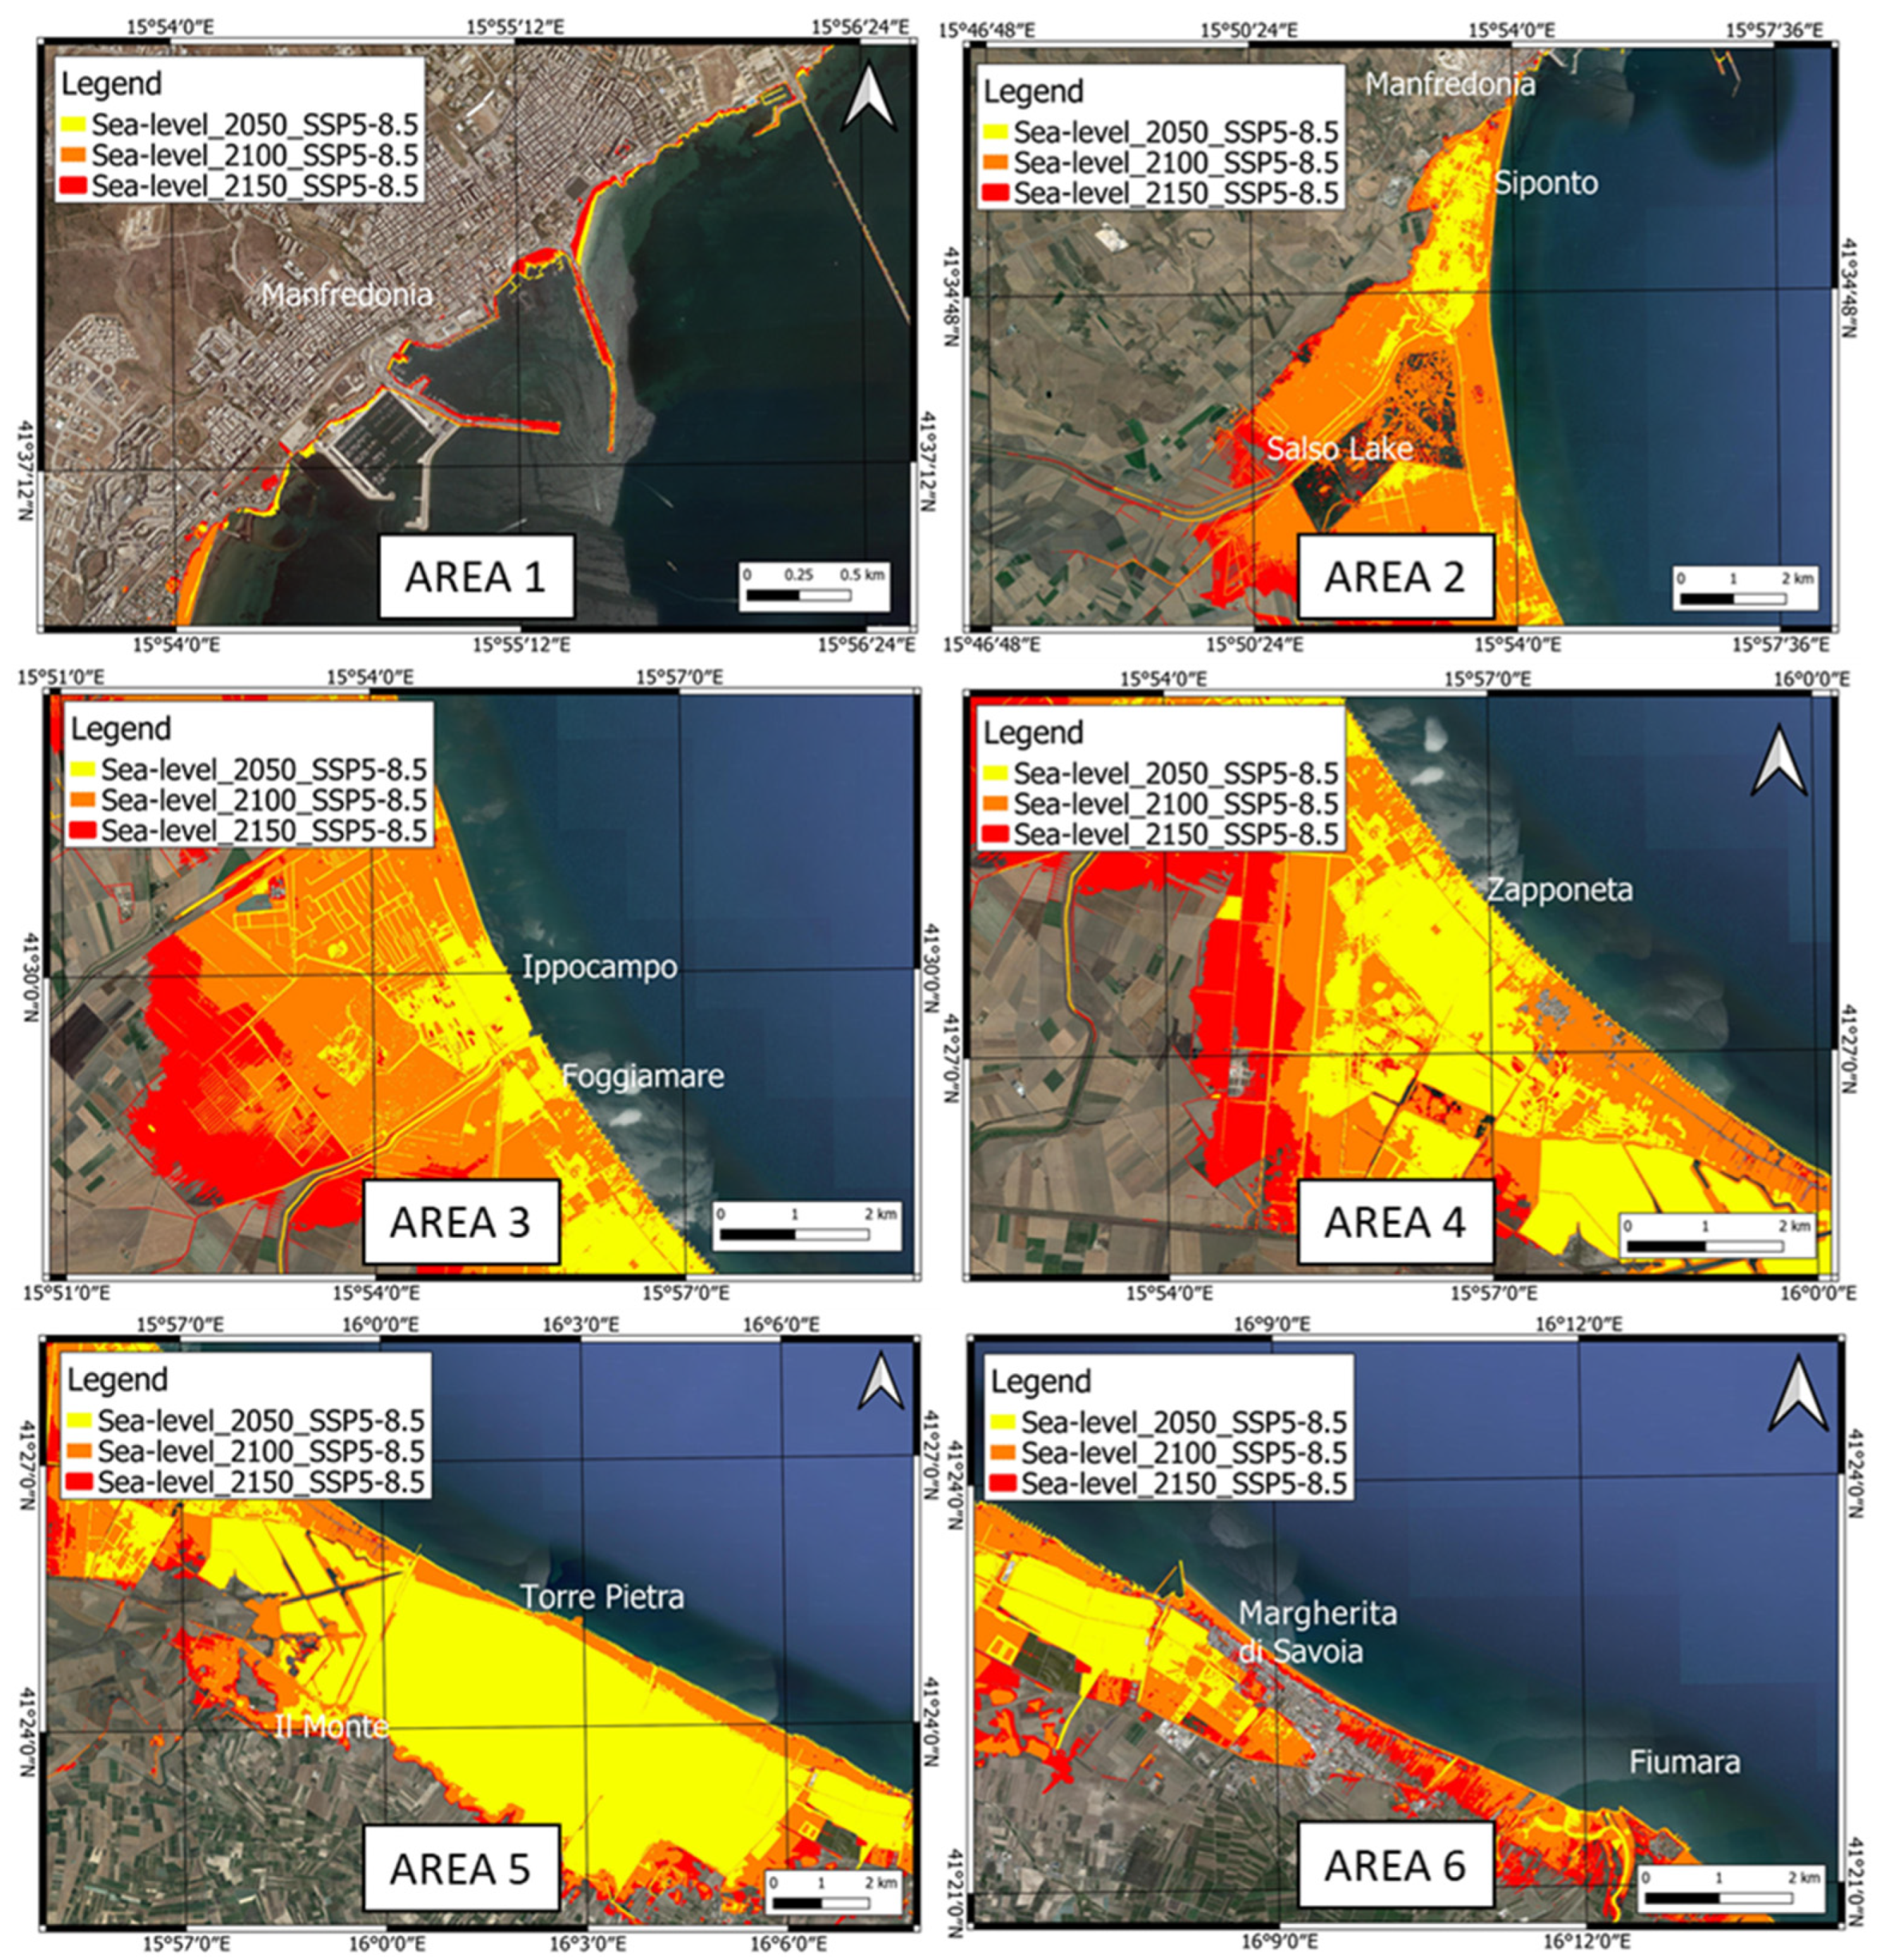
4.1. Sea-Level-Rise Projections

The wide coastal plain of Tavoliere delle Puglie is undergoing two distinct processes of land subsidence: natural subsidence, confirmed by the geological evidence for the past 125,000 years, and the current anthropogenic subsidence measured through geodetic data. For the first process, we considered the elevation of the marine deposits of MIS 5.5, while for the second, the InSAR and GNSS data were considered. The obtained RSLR values used for the flooding scenarios are reported in Table 2 and Figure 5. The areas most affected by RSLR are those experiencing the largest subsidence rates, for example, Area 3 and Area 5 (Table 2).
During the Pleistocene and Holocene, the coastal plain experienced subsidence movements, as suggested by the geological and archaeological markers. The cores sampled in the coastal plain showed the presence of the bioherm of Cladocora Caespitosa up to a depth of −22 m below the sea level [32]. The faunal assemblage of the bioherm allowed us to hypothesize that the sea bottom was at a depth of about 2 m. As the bioherm was referred to as MIS 5.5, and, in that period, the sea level was at +6 ± 3 m [16,74,75], the estimated subsidence was about −26 ± 3 m, with a rate between −0.23 and −0.11 mm/yr and a mean value of −0.21 mm/yr [32,44]. On the other hand, the archaeological markers of the Salapia Roman pier structure (currently located between −5 m and −10 m below the sea level, close to Torre Pietra) indicate that the subsidence was also significant during the Holocene [76]. The coastal areas subject to marine flooding based on the rates of tectonic subsidence are less extensive than those affected by anthropogenic subsidence (Figure 6). This implies that anthropogenic subsidence currently dominates, that it has driven the recent coastline retreat, and that it will influence the marine flooding that is expected to affect this coastal plain in the next decades.

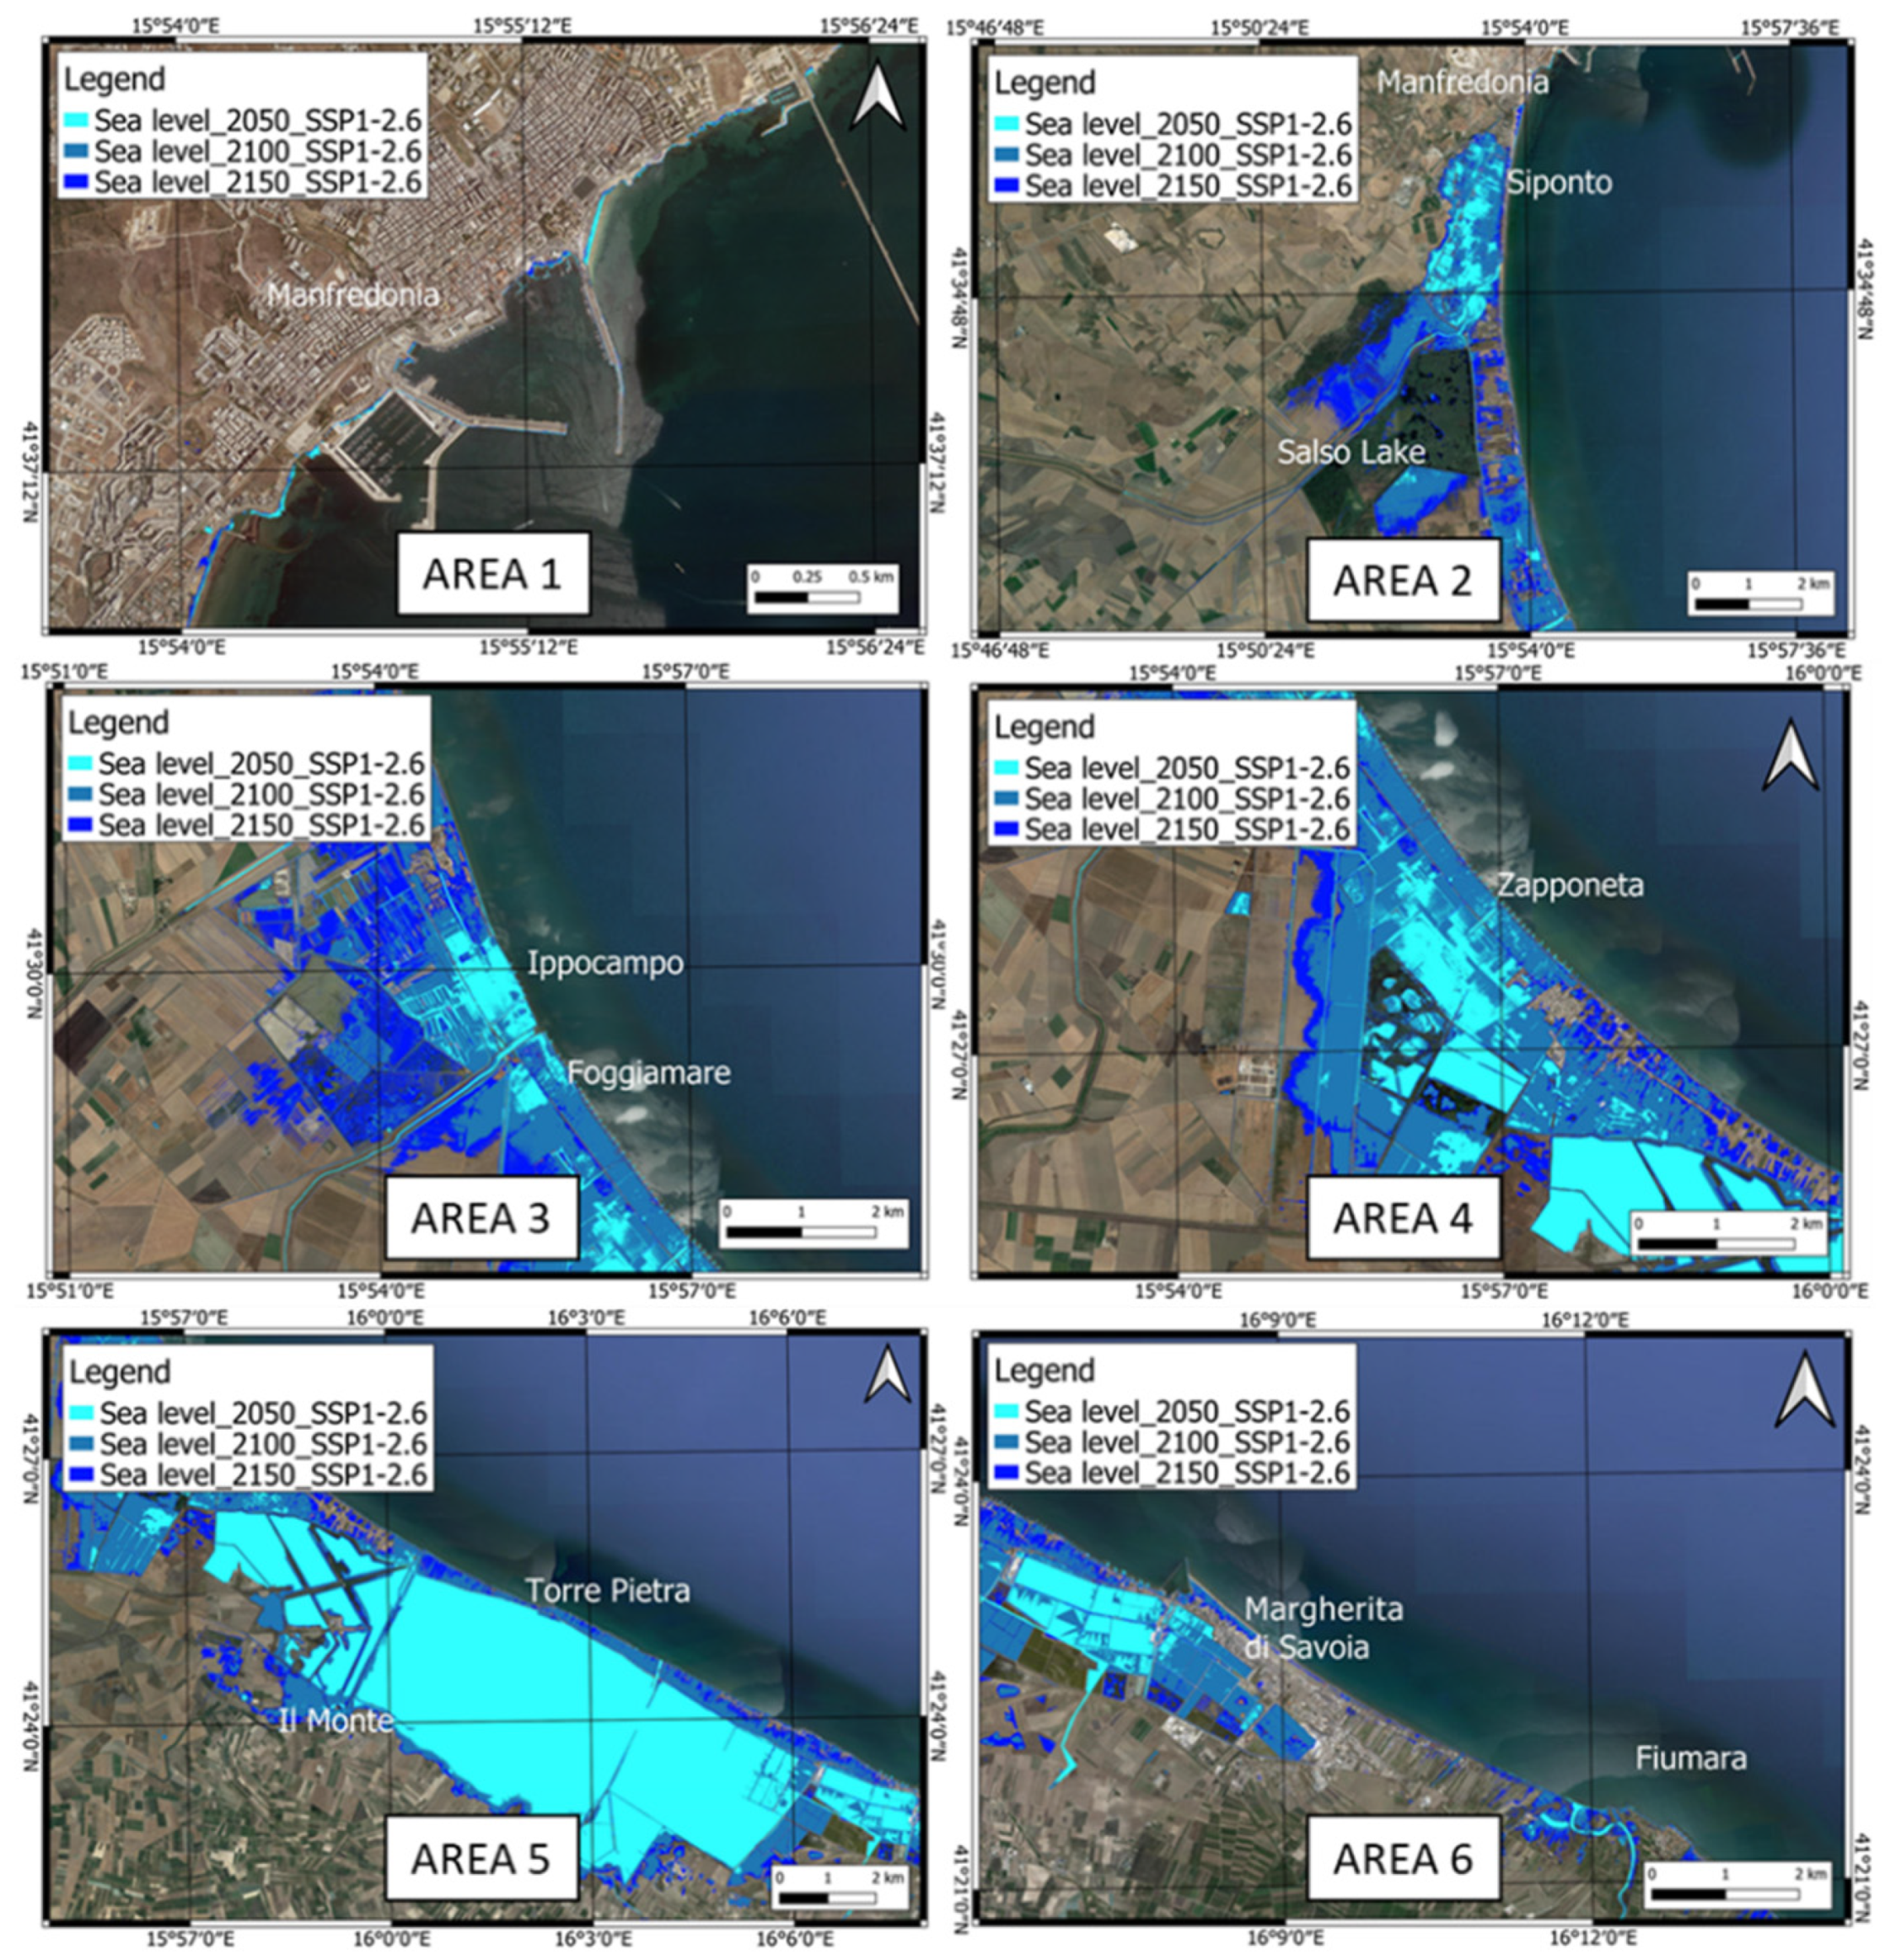
4.2. Shoreline Erosion and Flooding

The human influences on shoreline changes were estimated by comparing the rates and magnitudes of the observed shoreline movements with the theoretical (geometric) shoreline movements caused purely by the recent SLR, as measured at the tide-gauge station located in Manfredonia (Table S2—Supplementary Material). In this case, the purely SLR-driven shoreline movement was less than 10% of the observed shoreline changes, suggesting a strong anthropogenic influence. In the study area, multiple factors contributed to the shoreline retreat (Table 3), such as the gradient of longshore sediment transport, negative sediment input due to dams, and hydrological adjustments or the construction of holiday resorts along the coast.
The most significant shoreline changes occurred along the coastal plain of Area 3 (Ippocampo, Figure S2 in Supplementary Material), and Area 6 (Margherita di Savoia, close to the Ofanto river mouth, Figure S3 in Supplementary Material). These two areas were recently subjected to intensive anthropogenic development, with the building of touristic resorts and coastal-defense structures, which resulted in a negative sedimentary balance. Another important factor was the decrease in the suspended sediments delivered by the Ofanto river in the last decades [36,38]. This caused a shoreline retreat of about 200 m from 1954 to 2019 (Figure S3 in Supplementary Material).
The modeled flooded areas reported in Table 4 are based on the regional SLR corrected for VLM, as well as for the expected shoreline changes. In Figure 7 and Figure 8, the maps refer to the SSP1-2.6 and SSP5-8.5 emission scenarios (IPCC 2021), in which the SLR is accelerated by the land subsidence estimated by the geodetic analysis (Table 4). For the SSP1-2.6 scenario, the maximum extensions of the areas expected to be flooded in 2050, 2100, and 2150 AD in the investigated zone (Figure 7) are 44.534 km2, 76.537 km2, and 92.145 km2, respectively. For the SSP5-8.5 scenario, the maximum extensions of the areas expected to be flooded in 2050, 2100, and 2150 AD in the investigated zone (Figure 8) are equal to 50.497 km2, 118.696 km2, and 147.742 km2, respectively. The different flooding surfaces determine distinct effects on the coastal areas reported in Figure 4.
Area 1 is located in the Manfredonia municipality, which features a harbor whose docks are affected by structural subsidence. Here, the effects of future RSLR are limited by rocky coastlines and extensive coastal defenses.
The high rates of subsidence recorded in Manfredonia are relevant to the flooding assessment of the local harbor facilities. In particular, the SSP5-8.5 scenario shows a wide flooding of piers and docks, while in the SSP1-2.6 scenario, the flooding is less severe. On the other hand, it is worth noting that the harbor of Manfredonia has been affected by unstable docks in the last decades, as highlighted by the InSAR analysis, which showed a subsidence rate of about 5.46 mm/yr (Figure 9). In the SSP5-8.5 scenario, harbor infrastructures are at high risk of inundation in 2150.
In Area 2, the RSLR in the Candelaro river mouth will drive the inland extension of the sea, which will result in the permanent flooding of the Salso Lake by as early as 2100 within the SSP5-8.5 emission scenario.
The maximum rate of VLM occurs in Area 3, at about −7 mm/yr. The high VLM rates are critical for the residential zones located in this area, where damage to buildings has been observed and the effects of storms have led to inland flooding in recent decades [19].
Furthermore, these areas experienced high shoreline erosion, at rates of about −3 m/yr. The sea-level projections for 2100 and 2150 for the SSP1-2.6 and SSP5-8.5 emission scenarios indicate a major loss of land in these areas, with the complete flooding of the local infrastructure near the shore. The largest flooding is expected to occur in the coastal area of Ippocampo, where the intense building of touristic resorts destroyed the foredune, resulting in a negative sedimentary balance that was worsened by the longshore interventions.
Area 5 is the area of greatest flooding in the modeling of all the multi-temporal scenarios. Here, the effect of sea ingression is enhanced by the presence of salt marshes, which will be flooded in response to the continued RSLR.
On the other hand, the largest rates of shoreline erosion in the last century were observed along the coast of Margherita di Savoia and in the vicinity of the Ofanto river mouth [19,38]. Here, shoreline erosion showed a linear regression rate of about −7 m/yr, determined by a decrease in suspended sediment transport by the Ofanto river, with a consequent evolution of the delta into an estuary mouth [38]. The harbors of Barletta and Margherita di Savoia, and particularly the construction of the southern pier of the Margherita di Savoia harbor (ca. 540 m long), were further important factors contributing to the changes in the coastal dynamics. The current littoral drift is oriented about WNW, leading to the transportation of the sediments of the Ofanto mouth against the piers of the two harbors, in turn causing shoreline accretion in the southern part of Margherita di Savoia. Conversely, the coastline retreat has increased in the coastal stretches immediately to the north of the Margherita di Savoia harbor and to the south of the Barletta harbor. As early as the second half of the 1970s, engineering intervention strategies were applied in an attempt to counteract this process using defenses such as piers, breakwater barriers, and adherent barriers. Currently, although this coastal stretch is defended by 318 works, covering approximately 22 km, it is still retreating [77,78,79]. As early as the 1960s, however, in the study area, this general retreat led to the closure of the ‘La Salinella’ coastal road. Since the late 1970s, the Fiumara tourist village has been defended by means of groynes and barriers.
On the other hand, the increase in storm frequency and intensity in the Adriatic basin has influenced several of the low-lying coasts [71,80] comprising the coastal plain of Tavoliere delle Puglie. Considering the submersion due to SLR and the increased occurrence of storms, the modeling of storm flooding for 2050 and 2150 shows the potential inland extent of sea ingression (Figure 10). In particular, this storm flooding could involve the municipalities of Tressanti, Margherita di Savoia, and Trinitapoli, which were not usually affected by storms and SLR in the past. On the other hand, statistical models validated by data from the Monopoli buoy (property of ISPRA, located in the southern Adriatic sea, 140 km away from the study area), showed that waves with significant height, and with a return period of 100 years could reach values of 7.4 m [81]. The combined action of subsidence, SLR, and storm impact could be reflected in seawater intrusion, which could contaminate surficial and deep aquifers, modifying the freshwater–saltwater interface [82,83,84].

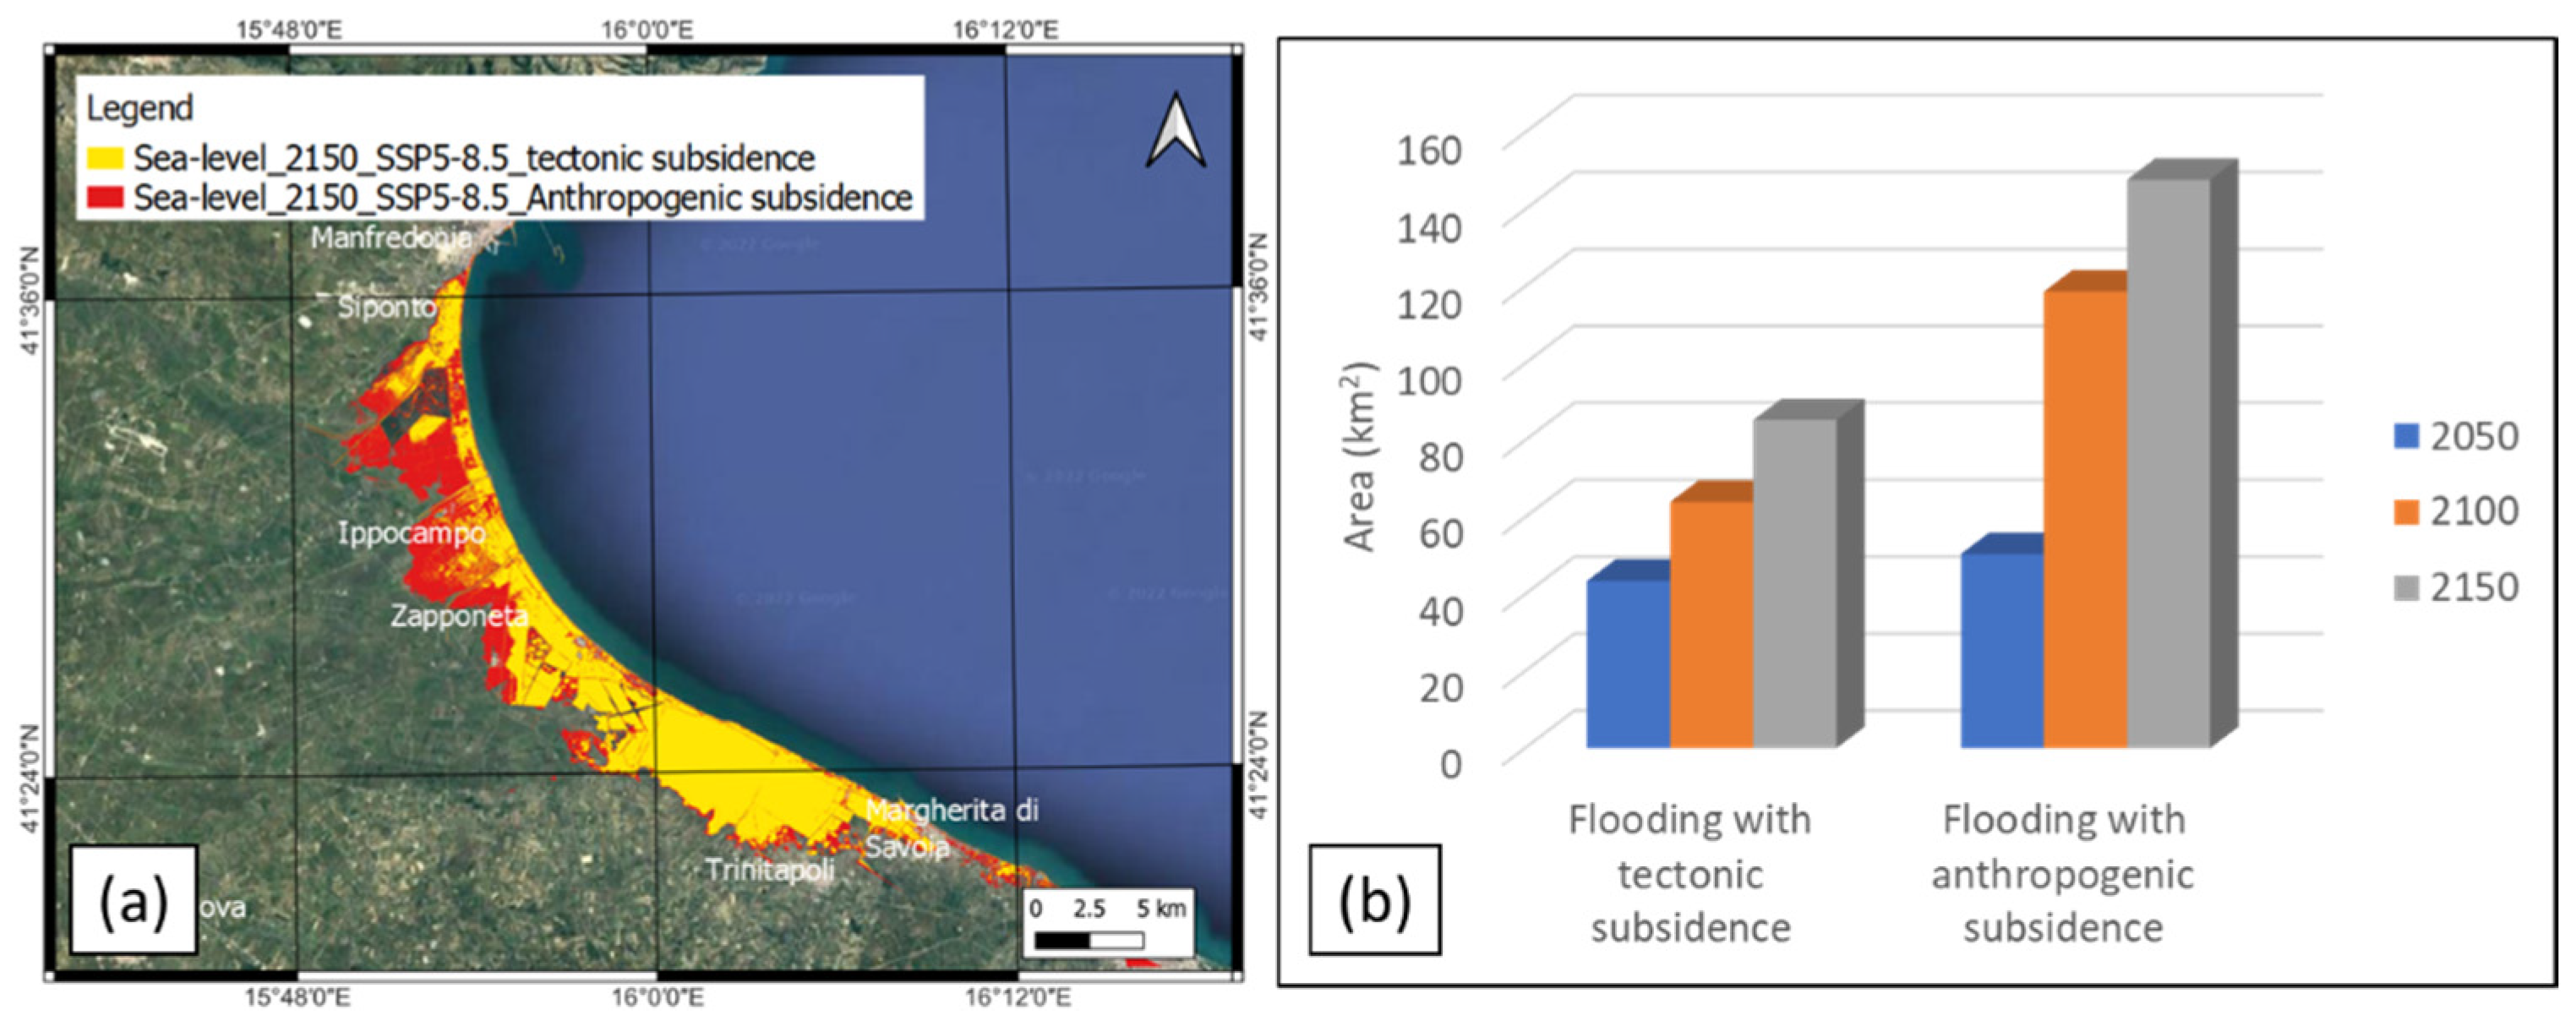
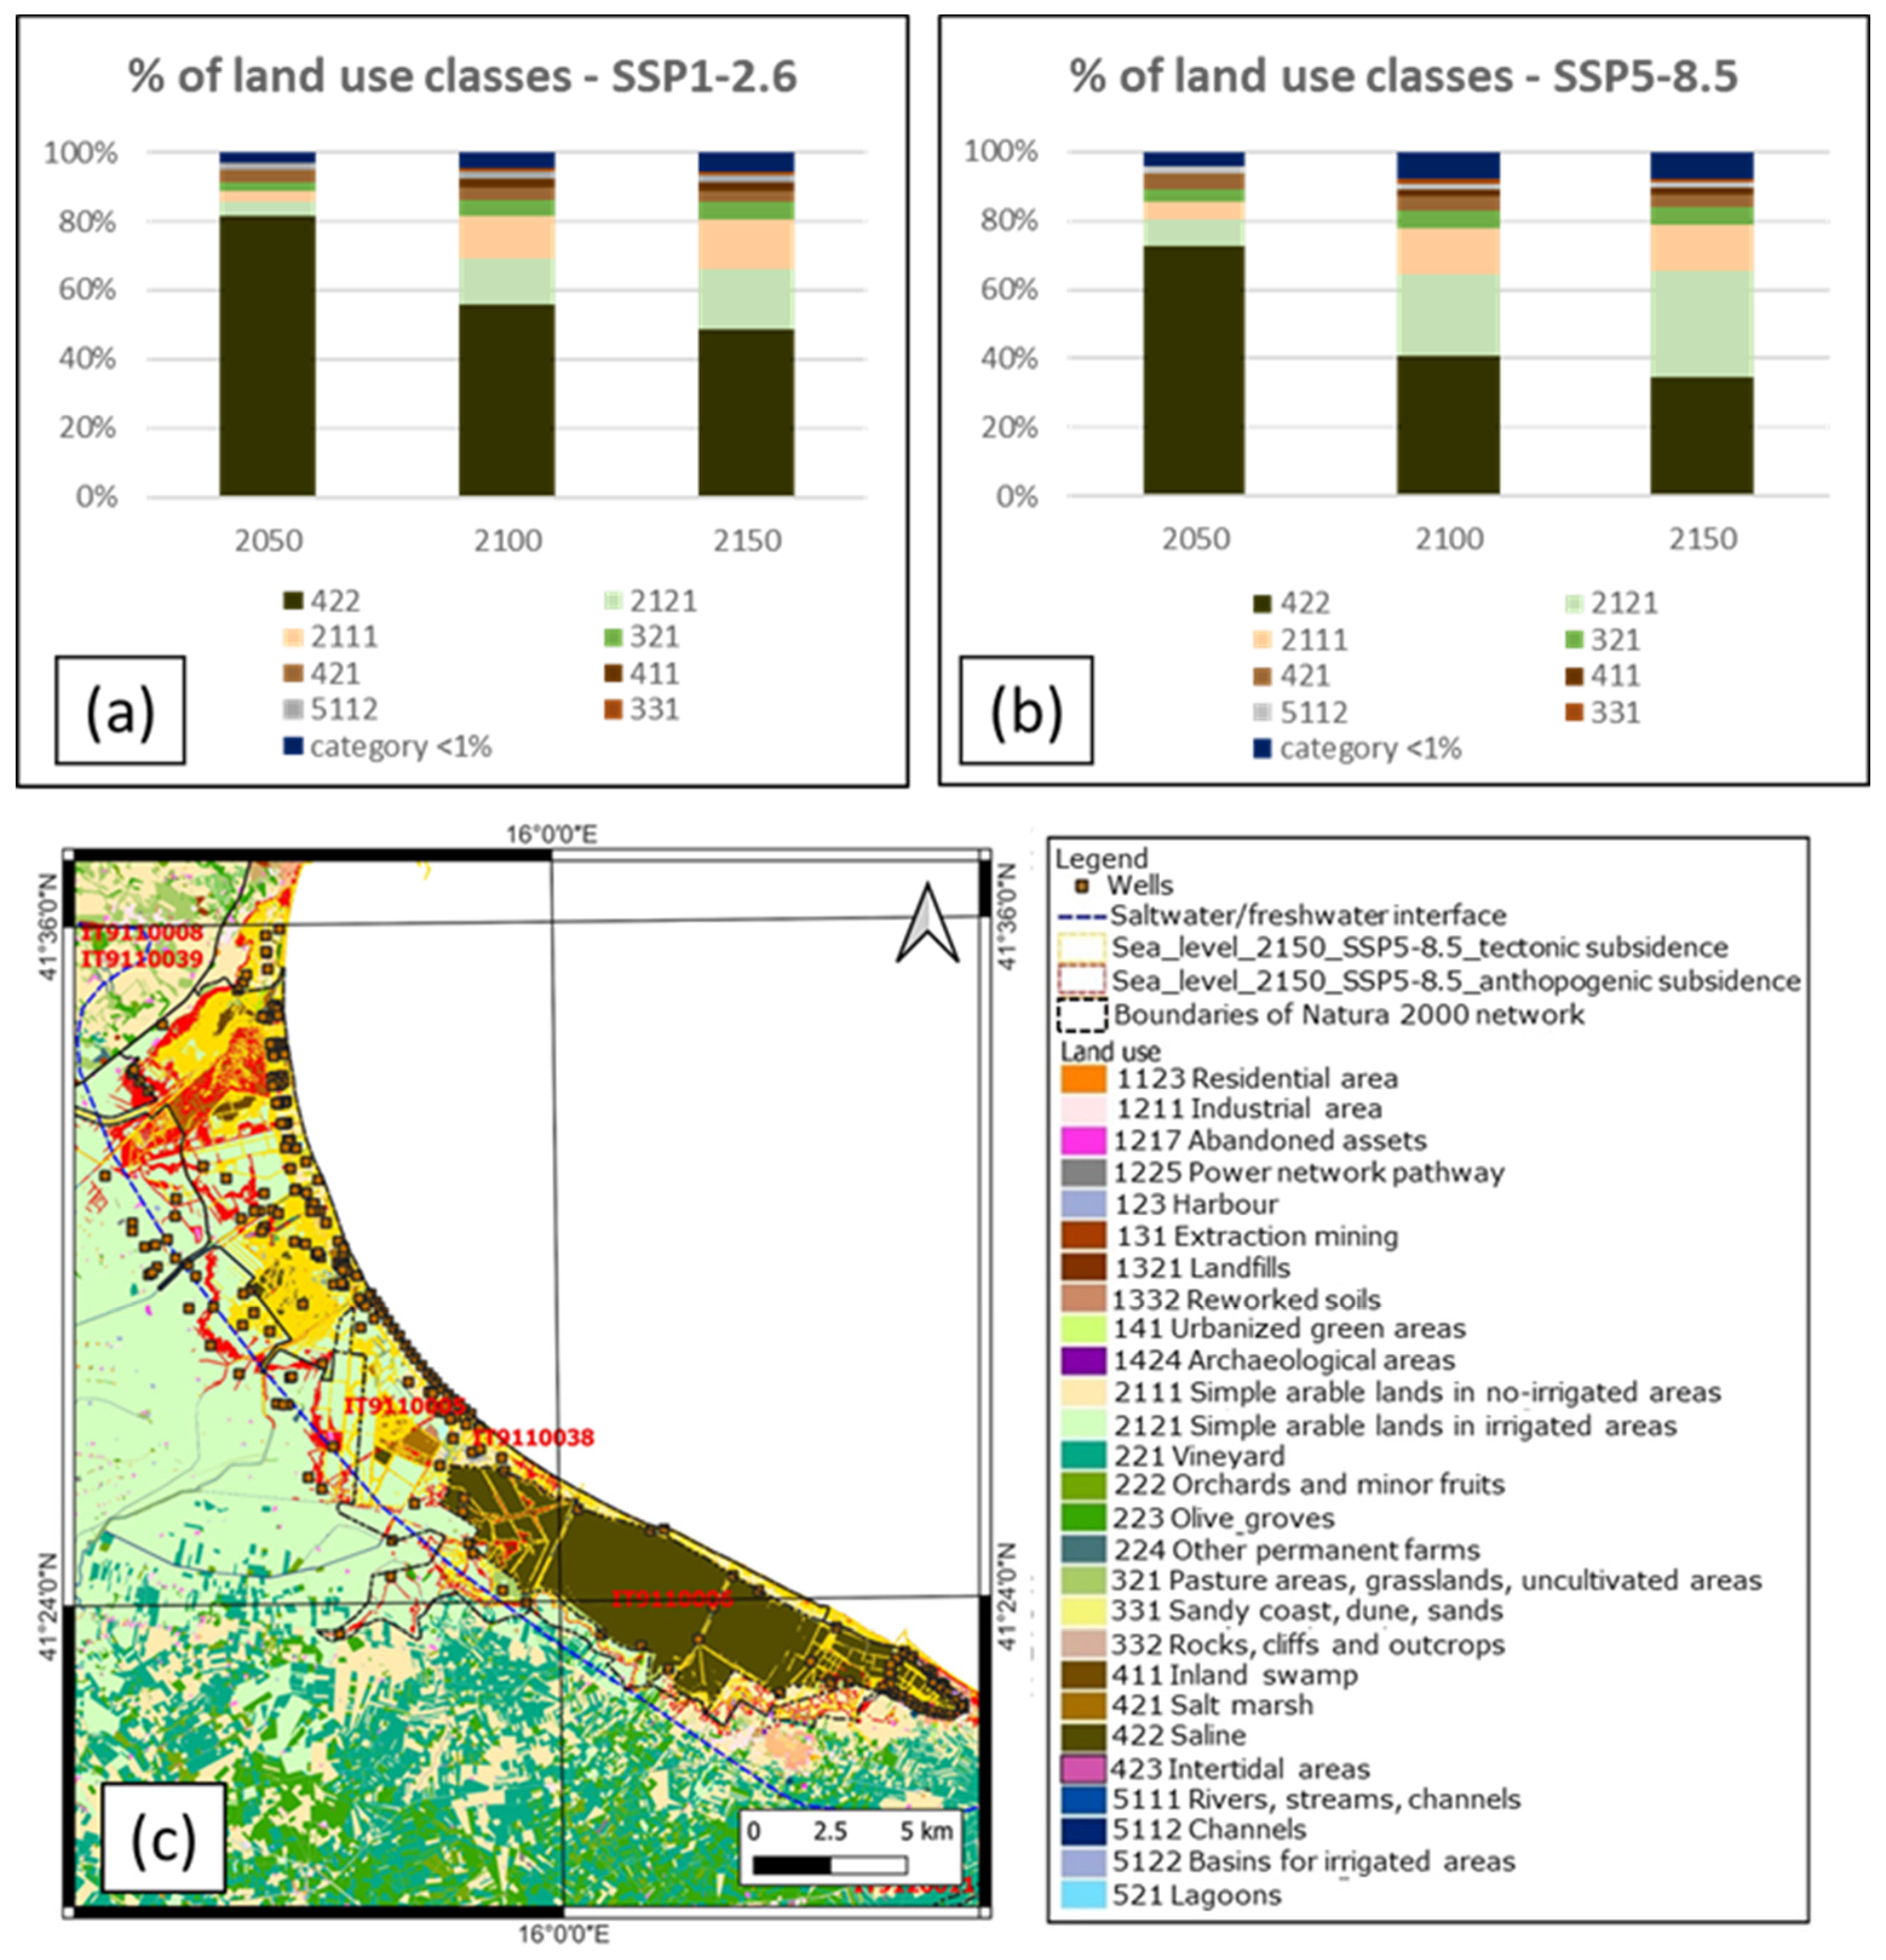
4.3. Land-Use and Surface Loss due to Sea-Level Rise

The analysis of the assets potentially exposed to sea level rise allowed the evaluation of the percentage of land-use categories lost as a consequence of sea submersion by 2050, 2100, and 2150. The results refer to both the SSP1-2.6 (Figure 11a) and SSP5-8.5 scenarios (Figure 11b). Focusing on the SSP5-8.5 scenario, which represents the potential worst case, some general trends can be observed. By 2050, a large part (72.5%) of the flooded area will comprise land classified as saltmarshes and depressed areas, which are already subjected to periodic inundation. This suggests that areas now undergoing only periodic inundation will be permanently submerged. From 2050 onwards, an increase in the flooded land surrounding this area, which is currently not yet subject to inundation, will likely occur; for instance, 13.3% of arable land (classes 2111 and 2121) will be flooded in 2050 and 44.5% in 2150. As the sea level continues to rise, the submersion will affect the more elevated areas surrounding the saline zones. Another issue arising from the analysis of the land-use data is related to sandy coasts, dunes, and sands (class 331): in this case, the percentage of land occupied in the 2050 flood scenario will be lower than 1%, while it will increase in 2100 and 2150 (Figure 11a,b). This can be explained by considering that in the study area, inundation is expected to affect the low-lying areas located behind the present-day sandy-dune coastal belt first. The latter are expected to be flooded progressively over time by rising sea levels (scenarios for 2100 and 2150).
In addition, a specific analysis was performed to evaluate the effects on natural protected areas. A wide part of the flooded area (approximately 50 km2, 105 km2 and 147 km2 in the 2050, 2100, and 2150 scenarios, respectively) is included in the protected areas of the Natura 2000 network (Figure 11c).
The continuing RSLR is already affecting the groundwater in terms of freshwater quality and quantity, due to the saline wedge into the coastal aquifers. The blue dotted lines in Figure 2 and Figure 11c indicate low-quality groundwater with salt contamination, as defined by the safeguarding and decontamination plan established by the Local Authorities in 1984 [51]. After 1984, the new Water Management Plan was released in 2009 [85]; on the accompanying maps, however, the saline intrusion in northern Apulia (namely, in the Gargano Promontory and in the Tavoliere delle Puglie) diminished compared with the previous documents, even though the monitoring wells, which were widespread along the whole territory, revealed the very low quality and significant deterioration of underground resources. By contrast, in the last update to the Water Management Plan (2019) [46], the new maps report a critical situation for the whole of Tavoliere, with the aquifer highly degraded in terms of freshwater quality and quantity; therefore, the area is classified as high-risk for groundwater-resource loss. Considering the need for agricultural water in the Tavoliere Plain and the growing number of wells (which are often not officially registered), its current groundwater status might be even worse. In practice, the Tavoliere Plain is already in a critical state; this is further exacerbated not only by sea-level rises but also by the decrease in effective rainfall recharging groundwater and the increasing freshwater demand for agricultural and drinking purposes. All these conditions make the implementation of effective protection actions necessary and urgent in order to avoid severe water-supply problems in the future.

5. Conclusions

Ongoing global warming is melting the world’s ice sheets, increasing the rate of global SLR, causing the thermal expansion of the oceans and intense droughts, which lead, in turn, to unprecedented groundwater overexploitation and associated localized coastal land subsidence. Because climate change, land subsidence, and SLR pose unprecedented threats to coastal environments and urban centers and populations, multidisciplinary studies that include Earth Observation in combination with ground data and sea-level projections provide crucial information on the evolution of these coastal zones and their future changes.
Our results show that several areas on the Tavoliere delle Puglie plain (Italy),underwent coastal retreat of up to 70 m in the last few years, while diffuse land subsidence locally exceeding −7 mm/yr is accelerating the SLR. Given the ongoing land subsidence, shoreline retreat, and erosion, high levels of RSLR at 0.39 ± 0.12 mm, 1.23 ± 0.31 mm, 2.07 ± 0.56 mm are expected for 2050, 2100, and 2150 AD, respectively, in the SSP5-8.5 scenario, leading to about 140 km2 of lost land. The flooding scenarios we have presented should be considered for the cognizant management of the coastal zones in response to the ongoing climate change. In the next years, sea-level rises, natural and anthropogenic land subsidence, the increasing energy of storm events, and seawater intrusion into coastal aquifers are likely to cause the following, mostly along the coasts of Zapponeta, Ippocampo, and Margherita di Savoia:
  • accelerated RSLR;
  • loss of land and socioeconomic effects;
  • changes in land use in the Tavoliere delle Puglie, since the sea-level rise and storms under SLR conditions could lead to up to 5 km of inland sea extension;
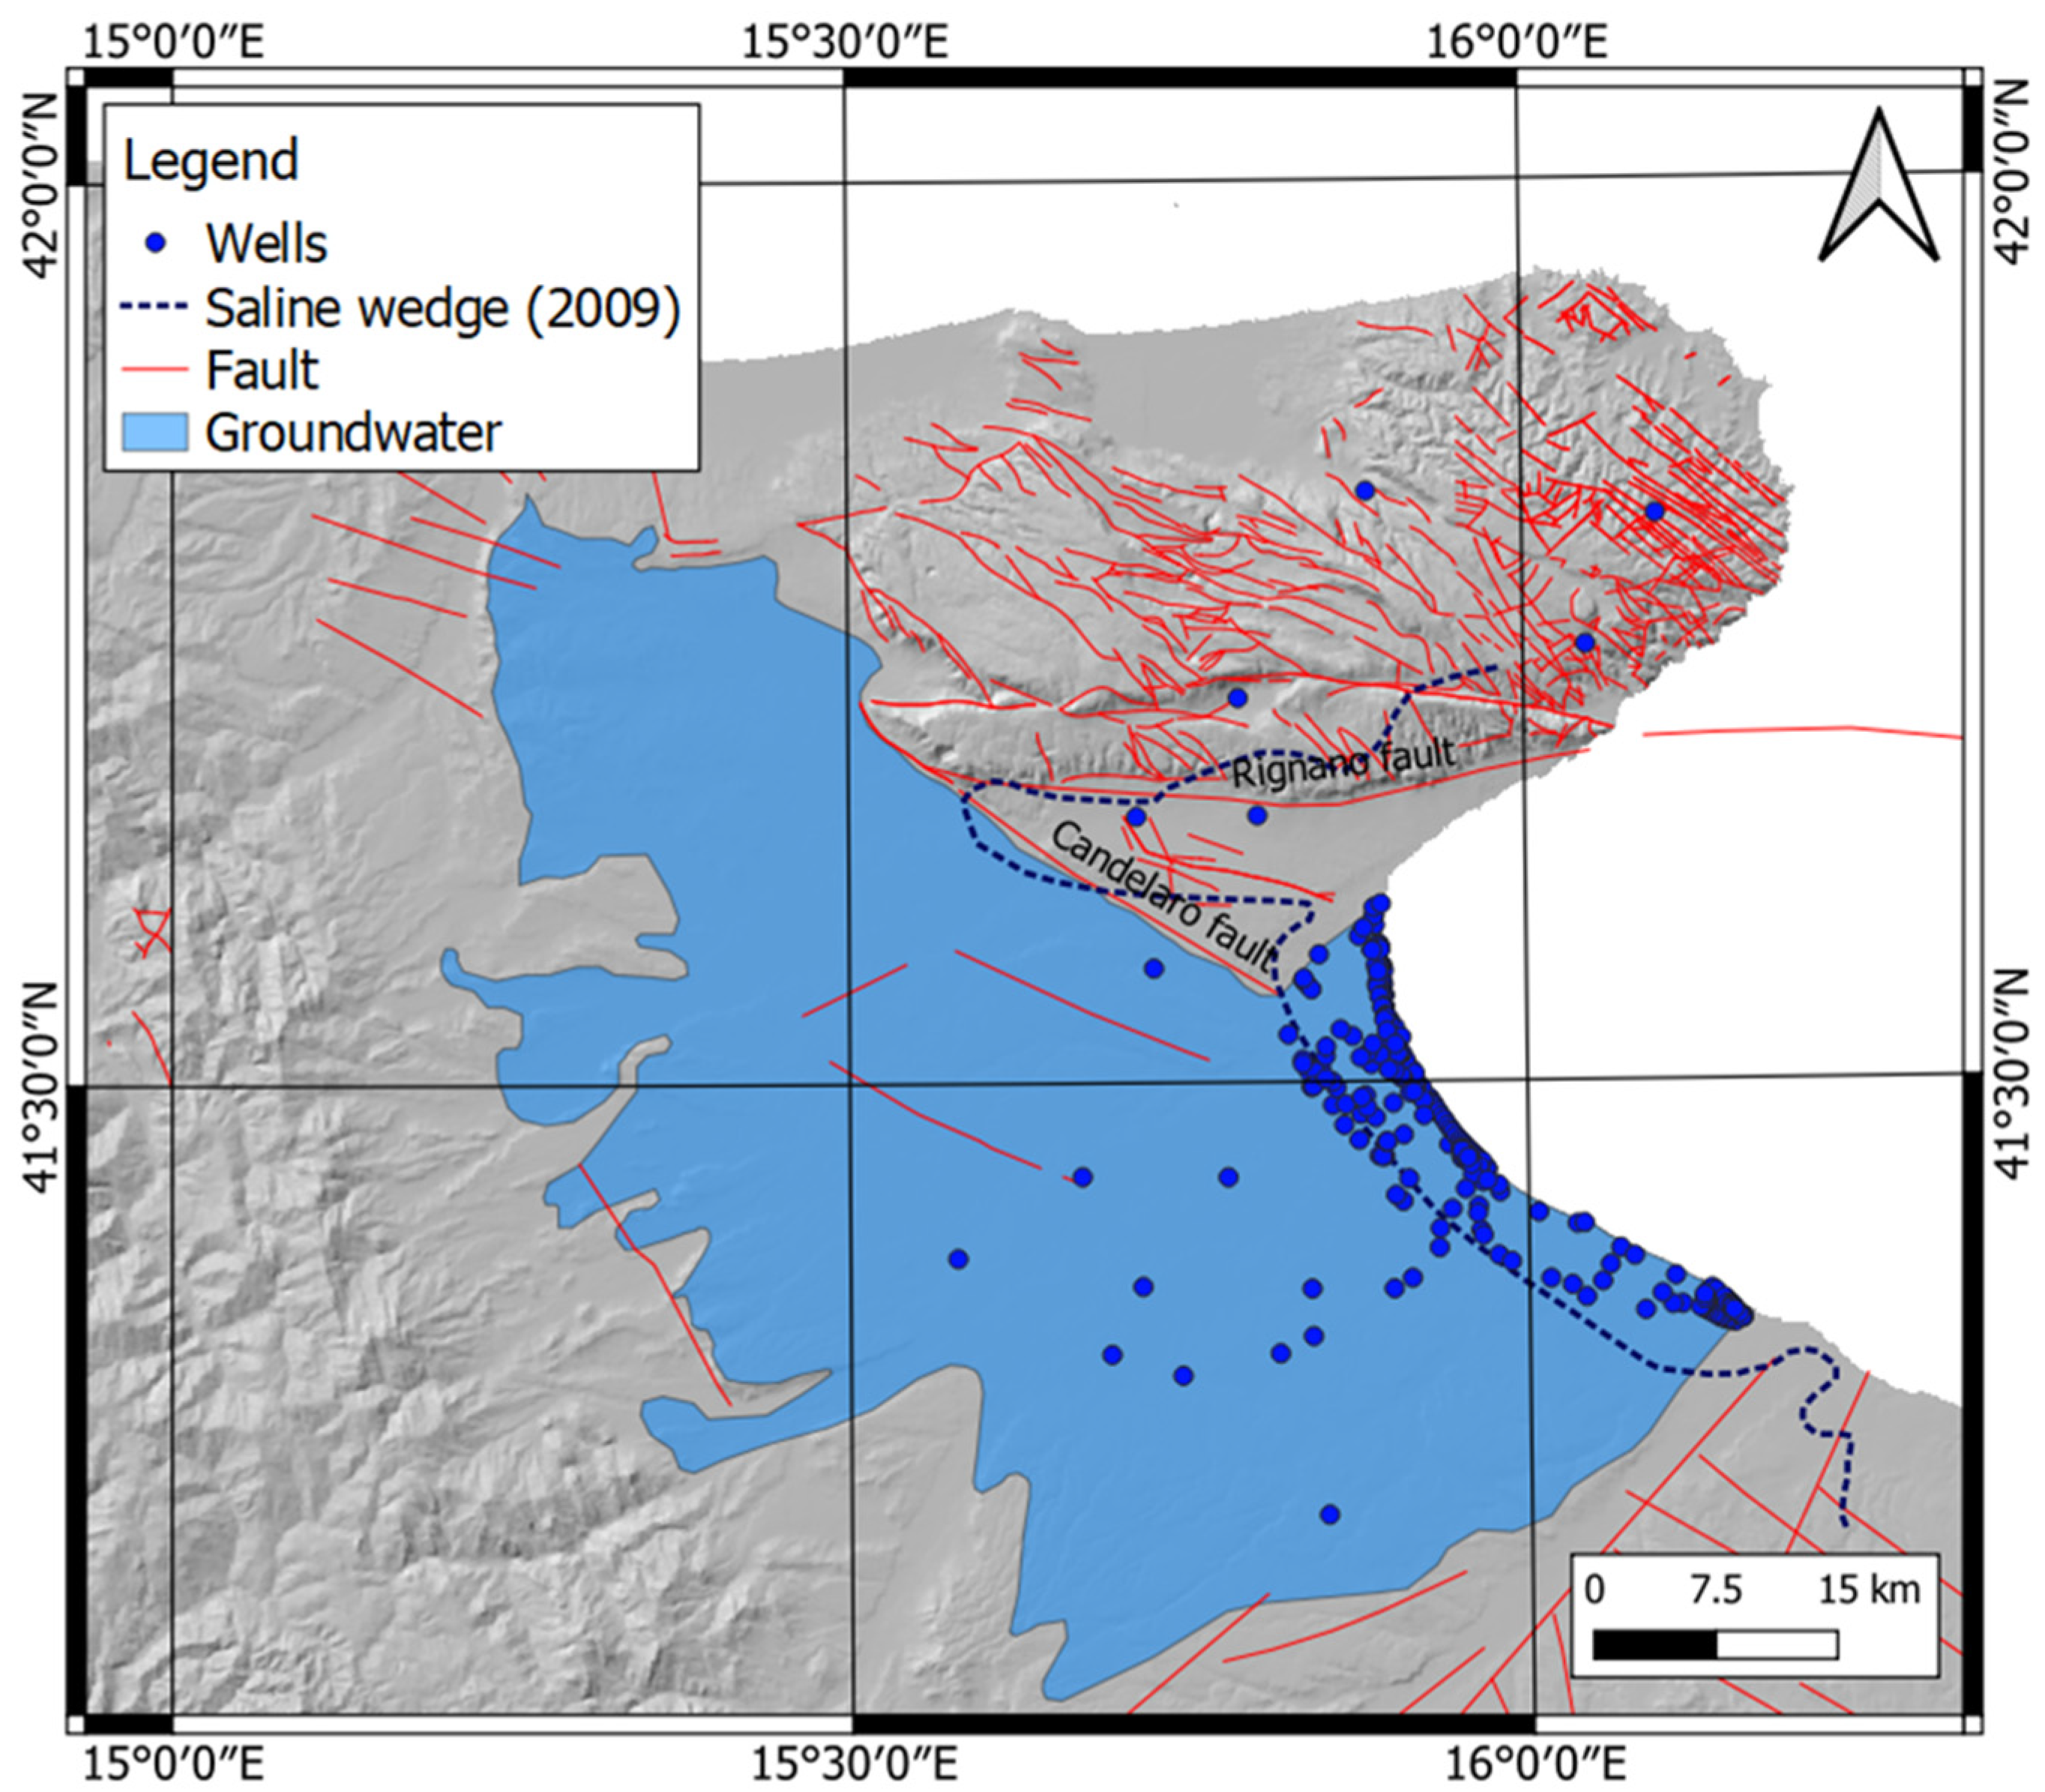
  • groundwater depletion and pollution due to saline wedge with related effects on agricultural and urban activities.

Supplementary Materials

The following supporting information can be downloaded at: https://www.mdpi.com/article/10.3390/rs14194936/s1. Figure S1: Time series of tidal data recorded at the station of Manfredonia (property of Autorità di Bacino della Puglia); the linear regression is equal to 3.5 ± 0.2 mm/yr.; Figure S2: Shoreline erosion in the Ippocampo area, as assessed through historic maps, aerial photographs, and satellite images. Here, digitized contours of the shoreline over several years are shown superposed on two representative images: an aerial photograph acquired in 1988 (left—aerial photograph of Istituto Geografico Militare) and a satellite image acquired in 2019 (right—aerial photograph of Agenzia per Erogazioni in Agricolutra AGEA); Figure S3: Shoreline erosion in the Margherita di Savoia and Ofanto river mouths, as assessed through historic maps, aerial photographs, and satellite images. As in Figure 6, shoreline contours are superposed on a historic 1954 map (top—source of Istituto Geografico Militare) and on a satellite image acquired in 2019 (bottom—aerial photograph of Agenzia per Erogazioni in Agricolutra AGEA); Table S1: Dataset used for the assessment of shoreline positions in the different years; Table S2: Shoreline-rate changes assessed in the studied areas of Tavoliere delle Puglie (Figure 4 of the main text); A—the six study areas used for the sea-level projections; B—coastal slope; C—rates of shoreline erosion in steady-state conditions of the coastal zone; D—rates of shoreline erosion assessed through linear regression of the data; E— effective shoreline changes obtained from the difference between columns D and C. Table S3: Spectral parameters of JONSWAP for the assessment of storm impact; Hm0: significant wave height; Tp(s): peak period; mainang: wave direction in nautical degree. Figure S4. Spectral parameters of JONSWAP; (a) time series of significant wave height Hm0; (b) time-series of peak period Tp; (c) time series of water level during the storm event of 11–14 November 2019.

Author Contributions

Conceptualization, G.S. (Giovanni Scardino), G.S. (Giovanni Scicchitano) and M.A.; methodology, G.S. (Giovanni Scardino), G.S. (Giovanni Scicchitano), P.P., S.I.L., M.Z. and A.V.; software, G.S. (Giovanni Scardino), P.P., E.S., V.D.S., A.R. (Angela Rizzo), S.I.L. and M.Z.; validation, E.S. and A.R. (Alberto Refice); formal analysis, G.S. (Giovanni Scardino), E.S., V.D.S., A.R. (Angela Rizzo), S.I.L., D.C., A.V. and A.R. (Alberto Refice); investigation, M.A. and V.D.S.; resources, M.A. and G.S. (Giovanni Scicchitano); data curation, M.A., P.P., A.R. (Angela Rizzo), V.D.S., M.Z., S.I.L. and A.R. (Alberto Refice); writing—original draft preparation, G.S. (Giovanni Scardino), P.P. and M.Z.; writing—review and editing, E.S., A.R. (Angela Rizzo), D.C., A.R. (Alberto Refice) and G.S. (Giovanni Scicchitano); supervision, G.S. (Giovanni Scicchitano) and M.A.; project administration, G.S. (Giovanni Scicchitano) and M.A.; funding acquisition, G.S. (Giovanni Scicchitano) and M.A. All authors have read and agreed to the published version of the manuscript.

Funding

This research was funded by the Apulia Region (Italy) under the European Regional Development Fund and the European Social Fund (POR Puglia FESR-FSE 2014-2020-Action 10.4 “Research for Innovation” (REFIN): F675E915 and by the INGV Project Dynamic Planet, funded by the Ministry of University and Research. Furthermore, this research benefited from the methodology developed in SAVEMEDCOASTS (Grant Agreement ECHO/SUB/2016/742473/PREV16) and SAVEMEDCOASTS2 (contract n.874398) projects, both funded by the EU under the umbrella of the DGECHO.

Data Availability Statement

Not applicable.

Acknowledgments

This work was developed as part of the activities of the Research Agreement stipulated between the University of Bari Aldo Moro and the Agenzia Regionale Strategica per lo Sviluppo Ecosostenibile del Territorio (ASSET, Italy) (Scientific Coordinator G. Scicchitano). This research benefited from the methodology developed in the SAVEMEDCOASTS savemedcoasts.eu (Grant Agreement ECHO/SUB/2016/742473/PREV16) and SAVEMEDCOASTS2 www.savemedcoasts2.eu (accessed on 18 August 2022) (contract n. 874398) projects, both funded by the EU, under the umbrella of the DGECHO, and the Pianeta DInamico project by INGV, funded by the Ministry of Universities and Research. Sentinel-1 data were provided through the Copernicus Program of the European Union. A.Re. thanks A. Belmonte, IREA-CNR, for help in S1 data processing. We are grateful to the anonymous reviewers for their suggestions, which improved the quality of the paper.

Conflicts of Interest

The authors declare no conflict of interest.

References

  1. Intergovernmental Panel of Climate Change. IPCC Summary for Policymakers. In Climate Change 2021: The Physical Science Basis. Contribution of Working Group I to the Sixth Assessment Report of the Intergovernmental Panel on Climate Change; Masson-Delmotte, V., Zhai, P., Pirani, A., Connors, S.L., Péan, C., Berger, S., Caud, N., Chen, Y., Goldfarb, L., Gomis, M.I., Eds.; Cambridge University Press: Cambridge, MA, USA, 2021; p. 3949. [Google Scholar]
  2. Pörtner, H.-O.; Roberts, D.C.; Masson-Delmotte, V.; Zhai, P.; Tignor, M.; Poloczanska, E.; Mintenbeck, K.; Alegría, A.; Nicolai, M.; Okem, A.; et al. (Eds.) IPCC Special Report on the Ocean and Cryosphere in a Changing Climate; Working Group II Technical Support Unit: Geneva, Switzerland, 2019; p. 765. [Google Scholar]
  3. Ezer, T.; Atkinson, L.P. Accelerated Flooding along the U.S. East Coast: On the Impact of Sea-Level Rise, Tides, Storms, the Gulf Stream, and the North Atlantic Oscillations. Earth’s Future 2014, 2, 362–382. [Google Scholar] [CrossRef]
  4. Le Cozannet, G.; Garcin, M.; Yates, M.; Idier, D.; Meyssignac, B. Approaches to Evaluate the Recent Impacts of Sea-Level Rise on Shoreline Changes. Earth Sci. Rev. 2014, 138, 47–60. [Google Scholar] [CrossRef] [Green Version]
  5. Anzidei, M.; Scicchitano, G.; Scardino, G.; Bignami, C.; Tolomei, C.; Vecchio, A.; Serpelloni, E.; De Santis, V.; Monaco, C.; Milella, M.; et al. Relative Sea-Level Rise Scenario for 2100 along the Coast of South Eastern Sicily (Italy) by InSAR Data, Satellite Images and High-Resolution Topography. Remote Sens. 2021, 13, 1108. [Google Scholar] [CrossRef]
  6. Vacchi, M.; Joyse, K.M.; Kopp, R.E.; Marriner, N.; Kaniewski, D.; Rovere, A. Climate Pacing of Millennial Sea-Level Change Variability in the Central and Western Mediterranean. Nat. Commun. 2021, 12, 4013. [Google Scholar] [CrossRef]
  7. Anzidei, M. SAVEMEDCOASTS. Un progetto europeo di protezione civile per la valutazione degli impatti di aumento del livello marino e dei rischi costieri nel Mediterraneo. GEOmedia 2018, 22, 42–45. [Google Scholar]
  8. Anzidei, M.; Carluccio, R.; D’Ajello Caracciolo, F.; Esposito, A.; Nicolosi, I.; Pietrantonio, G.; Vecchio, A.; Carmisciano, C.; Chiappini, M.; Chiocci, F.; et al. Flooding Scenarios Due to Land Subsidence and Sea-Level Rise: A Case Study for Lipari Island (Italy). Terra Nova 2016, 29, 44–51. [Google Scholar] [CrossRef]
  9. Anzidei, M.; Doumaz, F.; Vecchio, A.; Serpelloni, E.; Pizzimenti, L.; Civico, R.; Greco, M.; Martino, G.; Enei, F. Sea Level Rise Scenario for 2100 A.D. in the Heritage Site of Pyrgi (Santa Severa, Italy). J. Mar. Sci. Eng. 2020, 8, 64. [Google Scholar] [CrossRef] [Green Version]
  10. Aucelli, P.P.C.; Di Paola, G.; Incontri, P.; Rizzo, A.; Vilardo, G.; Benassai, G.; Buonocore, B.; Pappone, G. Coastal Inundation Risk Assessment Due to Subsidence and Sea Level Rise in a Mediterranean Alluvial Plain (Volturno Coastal Plain–Southern Italy). Estuar. Coast. Shelf Sci. 2017, 198, 597–609. [Google Scholar] [CrossRef]
  11. Antonioli, F.; Falco, G.D.; Presti, V.L.; Moretti, L.; Scardino, G.; Anzidei, M.; Bonaldo, D.; Carniel, S.; Leoni, G.; Furlani, S.; et al. Relative Sea-Level Rise and Potential Submersion Risk for 2100 on 16 Coastal Plains of the Mediterranean Sea. Water 2020, 12, 2173. [Google Scholar] [CrossRef]
  12. Di Paola, G.; Rizzo, A.; Benassai, G.; Corrado, G.; Matano, F.; Aucelli, P.P.C. Sea-Level Rise Impact and Future Scenarios of Inundation Risk along the Coastal Plains in Campania (Italy). Environ. Earth Sci. 2021, 80, 608. [Google Scholar] [CrossRef]
  13. Vött, A.; Bruins, H.J.; Gawehn, M.; Goodman-Tchernov, B.N.; De Martini, P.M.; Kelletat, D.; Mastronuzzi, G.; Reicherter, K.; Röbke, B.R.; Scheffers, A.; et al. Publicity Waves Based on Manipulated Geoscientific Data Suggesting Climatic Trigger for Majority of Tsunami Findings in the Mediterranean–Response to ‘Tsunamis in the Geological Record: Making Waves with a Cautionary Tale from the Mediterranean’ by Marriner et al. (2017). Z. Geomorphol. 2019, 62, 7–45. [Google Scholar] [CrossRef]
  14. Biolchi, S.; Denamiel, C.; Devoto, S.; Korbar, T.; Macovaz, V.; Scicchitano, G.; Vilibić, I.; Furlani, S. Impact of the October 2018 Storm Vaia on Coastal Boulders in the Northern Adriatic Sea. Water 2019, 11, 2229. [Google Scholar] [CrossRef] [Green Version]
  15. Ericson, J.P.; Vörösmarty, C.J.; Dingman, S.L.; Ward, L.G.; Meybeck, M. Effective Sea-Level Rise and Deltas: Causes of Change and Human Dimension Implications. Glob. Planet. Change 2006, 50, 63–82. [Google Scholar] [CrossRef]
  16. Lambeck, K.; Antonioli, F.; Purcell, A.; Silenzi, S. Sea-Level Change along the Italian Coast for the Past 10,000 Yr. Quat. Sci. Rev. 2004, 23, 1567–1598. [Google Scholar] [CrossRef]
  17. Lambeck, K.; Woodroffe, C.; Antonioli, F.; Anzidei, M.; Gehrels, W.; Laborel, J.; Wright, A. Paleoenvironmental Records, Geophysical Modeling, and Reconstruction of Sea-Level Trends and Variability on Centennial and Longer Timescales. Fac. Sci. Pap. Arch. 2010, c04, 61–121. [Google Scholar]
  18. Rovere, A.; Stocchi, P.; Vacchi, M. Eustatic and Relative Sea Level Changes. Curr. Clim. Chang. Rep. 2016, 2, 221–231. [Google Scholar] [CrossRef] [Green Version]
  19. Caldara, M.; Capolongo, D.; Damato, B.; Pennetta, L. Can the Ground Laser Scanning Technology Be Useful for Coastal Defenses Monitoring? Ital. J. Eng. Geol. Environ. 2006, 1, 35–49. [Google Scholar]
  20. Cianflone, G.; Tolomei, C.; Brunori, C.A.; Monna, S.; Dominici, R. Landslides and Subsidence Assessment in the Crati Valley (Southern Italy) Using InSAR Data. Geosciences 2018, 8, 67. [Google Scholar] [CrossRef] [Green Version]
  21. Tosi, L.; Lio, C.D.; Teatini, P.; Strozzi, T. Land Subsidence in Coastal Environments: Knowledge Advance in the Venice Coastland by TerraSAR-X PSI. Remote Sens. 2018, 10, 1191. [Google Scholar] [CrossRef] [Green Version]
  22. Cenni, N.; Fiaschi, S.; Fabris, M. Monitoring of Land Subsidence in the Po River Delta (Northern Italy) Using Geodetic Networks. Remote Sens. 2021, 13, 1488. [Google Scholar] [CrossRef]
  23. Antonioli, F.; Anzidei, M.; Amorosi, A.; Lo Presti, V.; Mastronuzzi, G.; Deiana, G.; De Falco, G.; Fontana, A.; Fontolan, G.; Lisco, S.; et al. Sea-Level Rise and Potential Drowning of the Italian Coastal Plains: Flooding Risk Scenarios for 2100. Quat. Sci. Rev. 2017, 158, 29–43. [Google Scholar] [CrossRef] [Green Version]
  24. Vecchio, A.; Anzidei, M.; Serpelloni, E.; Florindo, F. Natural Variability and Vertical Land Motion Contributions in the Mediterranean Sea-Level Records over the Last Two Centuries and Projections for 2100. Water 2019, 11, 1480. [Google Scholar] [CrossRef] [Green Version]
  25. Zanchettin, D.; Bruni, S.; Raicich, F.; Lionello, P.; Adloff, F.; Androsov, A.; Antonioli, F.; Artale, V.; Carminati, E.; Ferrarin, C.; et al. Sea-Level Rise in Venice: Historic and Future Trends (Review Article). Nat. Hazards Earth Syst. Sci. 2021, 21, 2643–2678. [Google Scholar] [CrossRef]
  26. Scicchitano, G.; Scardino, G.; Monaco, C.; Piscitelli, A.; Milella, M.; De Giosa, F.; Mastronuzzi, G. Comparing Impact Effects of Common Storms and Medicanes along the Coast of South-Eastern Sicily. Mar. Geol. 2021, 439, 106556. [Google Scholar] [CrossRef]
  27. Caldara, M.; Pennetta, L.; Simone, O. Holocene Evolution of the Salpi Lagoon (Puglia, Italy). J. Coast. Res. 2002, 36, 124–133. [Google Scholar] [CrossRef]
  28. Boenzi, F.; Caldara, M.; Capolongo, D.; Dellino, P.; Piccarreta, M.; Simone, O. Late Pleistocene–Holocene Landscape Evolution in Fossa Bradanica, Basilicata (Southern Italy). Geomorphology 2008, 102, 297–306. [Google Scholar] [CrossRef]
  29. De Santis, V.; Caldara, M.; Pennetta, L. The Marine and Alluvial Terraces of Tavoliere Di Puglia Plain (Southern Italy). J. Maps 2014, 10, 114–125. [Google Scholar] [CrossRef]
  30. Doglioni, C.; Mongelli, F.; Pieri, P. The Puglia Uplift (SE Italy): An Anomaly in the Foreland of the Apenninic Subduction Due to Buckling of a Thick Continental Lithosphere. Tectonics 1994, 13, 1309–1321. [Google Scholar] [CrossRef]
  31. Ricchetti, G.; Ciaranfi, N.; Luperto Sinni, E.; Mongelli, F.; Pieri, P. Geodinamica Ed Evoluzione Sedimentaria e Tettonica Dell’Avampaese Apulo. Mem. Della Soc. Geol. Ital. 1988, 41, 57–82. [Google Scholar]
  32. De Santis, V.; Caldara, M.; de Torres, T.; Ortiz, J.E. Stratigraphic Units of the Apulian Tavoliere Plain (Southern Italy): Chronology, Correlation with Marine Isotope Stages and Implications Regarding Vertical Movements. Sediment. Geol. 2010, 228, 255–270. [Google Scholar] [CrossRef] [Green Version]
  33. De Santis, V.; Caldara, M.; Pennetta, L.; Torres, T.; Ortiz, J.E. Unconformity-Bounded Stratigraphic Units (UBSUs) in an Italian Alluvial-Plain Area: Recognizing and Dating. J. Sediment. Res. 2013, 83, 96–114. [Google Scholar] [CrossRef]
  34. Doglioni, C.; Tropeano, M.; Mongelli, F.; Pieri, P. Middle-Late Pleistocene Uplift of Puglia: An “Anomaly” in the Apenninic Foreland. Mem. Soc. Geol. Ital. 1996, 51, 101–117. [Google Scholar]
  35. De Santis, V.; Caldara, M.; Torres, T.; Ortiz, J.E.; Sánchez-Palencia, Y. The Role of Beach Ridges, Spits, or Barriers in Understanding Marine Terraces Processes on Loose or Semiconsolidated Substrates: Insights from the Givoni of the Gulf of Taranto (Southern Italy). Geol. J. 2019, 55, 2951–2975. [Google Scholar] [CrossRef]
  36. Caldara, M.; Centenaro, E.; Mastronuzzi, G.; Sansò, P.; Sergio, A. Features and Present Evolution of Apulian Coast (Southern Italy). J. Coast. Res. 1998, 26, 55–64. [Google Scholar]
  37. De Santis, V.; Caldara, M.; Torres, T.; Ortiz, J.E. Two Middle Pleistocene Warm Stages in the Terrace Deposits of the Apulia Region (Southern Italy). Quat. Int. 2014, 332, 2–18. [Google Scholar] [CrossRef]
  38. De Santis, V.; Caldara, M.; Marsico, A.; Capolongo, D.; Pennetta, L. Evolution of the Ofanto River Delta from the ‘Little Ice Age’ to Modern Times: Implications of Large-Scale Synoptic Patterns. Holocene 2018, 28, 1948–1967. [Google Scholar] [CrossRef]
  39. De Santis, V.; Caldara, M.; Pennetta, L. “Continuous” Backstepping of Holocene Coastal Barrier Systems into Incised Valleys: Insights from the Ofanto and Carapelle-Cervaro Valleys. Water 2020, 12, 1799. [Google Scholar] [CrossRef]
  40. Boenzi, F.; Caldara, M.; Pennetta, L.; Simone, O. Environmental Aspects Related to the Physical Evolution of Some Wetlands Along the Adriatic Coast of Apulia (Southern Italy): A Review. J. Coast. Res. 2006, 1, 170–175. [Google Scholar]
  41. De Santis, V.; Caldara, M. The 5.5–4.5 Kyr Climatic Transition as Recorded by the Sedimentation Pattern of Coastal Deposits of the Apulia Region, Southern Italy. Holocene 2015, 25, 1313–1329. [Google Scholar] [CrossRef]
  42. Grant, K.M.; Rohling, E.J.; Ramsey, C.B.; Cheng, H.; Edwards, R.L.; Florindo, F.; Heslop, D.; Marra, F.; Roberts, A.P.; Tamisiea, M.E.; et al. Sea-Level Variability over Five Glacial Cycles. Nat. Commun. 2014, 5, 5076. [Google Scholar] [CrossRef] [Green Version]
  43. Rohling, E.J.; Foster, G.L.; Grant, K.M.; Marino, G.; Roberts, A.P.; Tamisiea, M.E.; Williams, F. Sea-Level and Deep-Sea-Temperature Variability over the Past 5.3 Million Years. Nature 2014, 508, 477–482. [Google Scholar] [CrossRef] [PubMed]
  44. Ferranti, L.; Antonioli, F.; Anzidei, M.; Monaco, C.; Stocchi, P. The Timescale and Spatial Extent of Vertical Tectonic Motions in Italy: Insights from Relative Sea-Level Changes Studies. J. Virtual Explor. 2010, 36, 3–34. [Google Scholar] [CrossRef]
  45. Triggiani, M.; Refice, A.; Capolongo, D.; Bovenga, F.; Caldara, M. Investigation of Subsidence in the Manfredonia Gulf (Southern Italy) through Multitemporal DInSAR Techniques; EGU General Assembly: Wien, Austria, 2009; p. 7341. [Google Scholar]
  46. Apulia Region. Piano Di Tutela Delle Acque, Aggiornamento 2015–2021. Relazione Generale; Dipartimento Agricoltura Sviluppo Rurale Ed Ambientale Sezione Risorse Idriche: Bari, Italia, 2019; Volume 1, pp. 1–188. [Google Scholar]
  47. Cotecchia, V.; Magri, G. Idrogeologia Del Gargano. Geol. Appl. E Idrogeol. 1966, 1, 1–80. [Google Scholar]
  48. Mongelli, F.; Ricchetti, G. Heat Flow along the Candelaro Fault—Gargano Headland (Italy). Geothermics 1970, 2, 450–458. [Google Scholar] [CrossRef]
  49. Maggiore, M.; Mongelli, F. Hydrogeothermal Model of Ground-Water Supply to San Nazario Spring (Gargano, Southern Italy). In Proceedings of the International Conference on Enviromental Changes in Karst Areas, Padova, Italy, 27 September 1991; Quaderni del Dipartimento di Geografia n. 13, Università di Padova: Padova, Italy, 1991; pp. 307–324. [Google Scholar]
  50. Grassi, D.; Tadolini, T. Caratteristiche Chimico-Fisiche Delle Acque Della Falda Carsica Del Gargano. CNR-GNDCI 1992, 538, 375–416. [Google Scholar]
  51. Apulia Region. Piano Regionale Risanamento Delle Acque. Boll. Uff. Reg. Puglia Bari Italy 1984, 1, 57. [Google Scholar]
  52. Progetto PST-Dati Lidar. Available online: http://www.pcn.minambiente.it/mattm/progetto-pst-dati-lidar/ (accessed on 7 January 2021).
  53. Santillan, J.R.; Makinano-Santillan, M. Vertical Accuracy Assessment of 30-M Resolution Alos, Aster, and Srtm Global Dems Over Northeastern Mindanao, Philippines. ISPRS Int. Arch. Photogramm. Remote Sens. Spat. Inf. Sci. 2016, 41B4, 149–156. [Google Scholar] [CrossRef] [Green Version]
  54. Alganci, U.; Besol, B.; Sertel, E. Accuracy Assessment of Different Digital Surface Models. ISPRS Int. J. Geo-Inf. 2018, 7, 114. [Google Scholar] [CrossRef] [Green Version]
  55. Uuemaa, E.; Ahi, S.; Montibeller, B.; Muru, M.; Kmoch, A. Vertical Accuracy of Freely Available Global Digital Elevation Models (ASTER, AW3D30, MERIT, TanDEM-X, SRTM, and NASADEM). Remote Sens. 2020, 12, 3482. [Google Scholar] [CrossRef]
  56. Zingaro, M.; La Salandra, M.; Colacicco, R.; Roseto, R.; Petio, P.; Capolongo, D. Suitability Assessment of Global, Continental and National Digital Elevation Models for Geomorphological Analyses in Italy. Trans. GIS 2021, 25, 2283–2308. [Google Scholar] [CrossRef]
  57. Anzidei, M.; Scicchitano, G.; Tarascio, S.; de Guidi, G.; Monaco, C.; Barreca, G.; Mazza, G.; Serpelloni, E.; Vecchio, A. Coastal Retreat and Marine Flooding Scenario for 2100: A Case Study along the Coast of Maddalena Peninsula (Southeastern Sicily). Geogr. Fis. E Din. Quat. 2018, 41, 5–16. [Google Scholar] [CrossRef]
  58. Hooper, A. A Multi-Temporal InSAR Method Incorporating Both Persistent Scatterer and Small Baseline Approaches. Geophys. Res. Lett. 2008, 35, 1–5. [Google Scholar] [CrossRef] [Green Version]
  59. Rosi, A.; Agostini, A.; Tofani, V.; Casagli, N. A Procedure to Map Subsidence at the Regional Scale Using the Persistent Scatterer Interferometry (PSI) Technique. Remote Sens. 2014, 6, 10510–10522. [Google Scholar] [CrossRef]
  60. Avallone, A.; Latorre, D.; Serpelloni, E.; Cavaliere, A.; Herrero, A.; Cecere, G.; D’Agostino, N.; D’Ambrosio, C.; Devoti, R.; Giuliani, R.; et al. Coseismic Displacement Waveforms for the 2016 August 24 Mw 6.0 Amatrice Earthquake (Central Italy) Carried out from High-Rate GPS Data. Ann. Geophys. 2016, 59, 1–11. [Google Scholar] [CrossRef]
  61. Serpelloni, E.; Faccenna, C.; Spada, G.; Dong, D.; Williams, S.D.P. Vertical GPS Ground Motion Rates in the Euro-Mediterranean Region: New Evidence of Velocity Gradients at Different Spatial Scales along the Nubia-Eurasia Plate Boundary. J. Geophys. Res. Solid Earth 2013, 118, 6003–6024. [Google Scholar] [CrossRef] [Green Version]
  62. Devoti, R.; D’Agostino, N.; Serpelloni, E.; Pietrantonio, G.; Riguzzi, F.; Avallone, A.; Cavaliere, A.; Cheloni, D.; Cecere, G.; D’Ambrosio, C.; et al. A Combined Velocity Field of the Mediterranean Region. Ann. Geophys. 2017, 60, 0215. [Google Scholar] [CrossRef] [Green Version]
  63. Serpelloni, E.; Cavaliere, A.; Martelli, L.; Pintori, F.; Anderlini, L.; Borghi, A.; Randazzo, D.; Bruni, S.; Devoti, R.; Perfetti, P.; et al. Surface Velocities and Strain-Rates in the Euro-Mediterranean Region From Massive GPS Data Processing. Front. Earth Sci. 2022, 10, 1–22. [Google Scholar] [CrossRef]
  64. Farolfi, G.; Del Soldato, M.; Bianchini, S.; Casagli, N. A Procedure to Use GNSS Data to Calibrate Satellite PSI Data for the Study of Subsidence:An Example from the North-Western Adriatic Coast (Italy). Eur. J. Remote Sens. 2019, 52, 54–63. [Google Scholar] [CrossRef] [Green Version]
  65. Anderlini, L.; Serpelloni, E.; Tolomei, C.; De Martini, P.M.; Pezzo, G.; Gualandi, A.; Spada, G. New Insights into Active Tectonics and Seismogenic Potential of the Italian Southern Alps from Vertical Geodetic Velocities. Solid Earth 2020, 11, 1681–1698. [Google Scholar] [CrossRef]
  66. Scardino, G.; Sabatier, F.; Scicchitano, G.; Piscitelli, A.; Milella, M.; Vecchio, A.; Anzidei, M.; Mastronuzzi, G. Sea-Level Rise and Shoreline Changes Along an Open Sandy Coast: Case Study of Gulf of Taranto, Italy. Water 2020, 12, 1414. [Google Scholar] [CrossRef]
  67. Theiler, E.; Himmelstoss, E.; Zichichi, J.; Ergul, A. Digital Shoreline Analysis System (DSAS) Version 4.0-An ArcGIS Extension for Calculating Shoreline Change (Ver. 4.4, July 2017). U.S. Geol. Surv. Open-File Rep. 2017, 1, 1278. [Google Scholar]
  68. Lionello, P.; Conte, D.; Marzo, L.; Scarascia, L. The Contrasting Effect of Increasing Mean Sea Level and Decreasing Storminess on the Maximum Water Level during Storms along the Coast of the Mediterranean Sea in the Mid 21st Century. Glob. Planet. Chang. 2017, 151, 80–91. [Google Scholar] [CrossRef]
  69. McCall, R.T.; Masselink, G.; Poate, T.G.; Roelvink, J.A.; Almeida, L.P.; Davidson, M.; Russell, P.E. Modelling Storm Hydrodynamics on Gravel Beaches with XBeach-G. Coast. Eng. 2014, 91, 231–250. [Google Scholar] [CrossRef] [Green Version]
  70. Roelvink, D.; Costas, S. Coupling Nearshore and Aeolian Processes: XBeach and Duna Process-Based Models. Environ. Model. Softw. 2019, 115, 98–112. [Google Scholar] [CrossRef]
  71. Ferrarin, C.; Bajo, M.; Benetazzo, A.; Cavaleri, L.; Chiggiato, J.; Davison, S.; Davolio, S.; Lionello, P.; Orlic, M.; Umgiesser, G. Local and Large-Scale Controls of the Exceptional Venice Floods of November 2019. Prog. Oceanogr. 2021, 197, 102628. [Google Scholar] [CrossRef]
  72. Ferrarin, C.; Lionello, P.; Orlić, M.; Raicich, F.; Salvadori, G. Venice as a Paradigm of Coastal Flooding under Multiple Compound Drivers. Sci. Rep. 2022, 12, 5754. [Google Scholar] [CrossRef] [PubMed]
  73. Home-S.I.T.-SIT Puglia. Available online: https://pugliacon.regione.puglia.it/web/sit-puglia-sit/home (accessed on 18 August 2022).
  74. De Santis, V.; Scardino, G.; Ortiz, J.E.; Sánchez-Palencia, Y.; Caldara, M. Pleistocene terracing phases in the metropolitan area of Bari—AAR dating and deduced uplift rates of the Apulian Foreland. ROL 2021, 54, 49–61. [Google Scholar] [CrossRef]
  75. De Santis, V.; Scardino, G.; Meschis, M.; Ortiz, J.E.; Sánchez-Palencia, Y.; Caldara, M. Refining the Middle-Late Pleistocene Chronology of Marine Terraces and Uplift History in a Sector of the Apulian Foreland (Southern Italy) by Applying a Synchronous Correlation Technique and Amino Acid Racemization to Patella Spp. and Thetystrombus Latus. Ital. J. Geosci. 2021, 140, 438–463. [Google Scholar] [CrossRef]
  76. Cocchi, L.; Stefanelli, P.; Carmisciano, C.; Caratori Tontini, F.; Taramaschi, L.; Cipriani, S. Marine Archaeogeophysical Prospection of Roman Salapia Settlement (Puglia, Italy): Detecting Ancient Harbour Remains. Archaeol. Prospect. 2012, 19, 89–101. [Google Scholar] [CrossRef]
  77. De Serio, F.; Armenio, E.; Mossa, M.; Petrillo, A.F. How to Define Priorities in Coastal Vulnerability Assessment. Geosciences 2018, 8, 415. [Google Scholar] [CrossRef] [Green Version]
  78. Apollonio, C.; Bruno, M.F.; Iemmolo, G.; Molfetta, M.G.; Pellicani, R. Flood Risk Evaluation in Ungauged Coastal Areas: The Case Study of Ippocampo (Southern Italy). Water 2020, 12, 1466. [Google Scholar] [CrossRef]
  79. Fiesoletti, F.; Spagnoli, F.; Specchiulli, A. Coastal Monitoring Programme in the Gulf of Manfredonia (Southern Adriatic Sea): Preliminary Results. In Maritime lndustry, Ocean Engineering and Coastal Resources; Soares, G., Kolev, P., Eds.; Taylor & Francis Ltd.: London, UK, 2008; pp. 721–728. ISBN 978-0-415-45523-7. [Google Scholar]
  80. Ferrarin, C.; Valentini, A.; Vodopivec, M.; Klaric, D.; Massaro, G.; Bajo, M.; Pascalis, F.D.; Fadini, A.; Ghezzo, M.; Menegon, S.; et al. Integrated Sea Storm Management Strategy: The 29 October 2018 Event in the Adriatic Sea. Nat. Hazards Earth Syst. Sci. 2020, 20, 73–93. [Google Scholar] [CrossRef] [Green Version]
  81. Sartini, L.; Mentaschi, L.; Besio, G. Comparing Different Extreme Wave Analysis Models for Wave Climate Assessment along the Italian Coast. Coast. Eng. 2015, 100, 37. [Google Scholar] [CrossRef]
  82. Masciale, R.; Barca, E.; Passarella, G. A Methodology for Rapid Assessment of the Environmental Status of the Shallow Aquifer of “Tavoliere Di Puglia” (Southern Italy). Environ. Monit. Assess. 2010, 177, 245–261. [Google Scholar] [CrossRef] [PubMed]
  83. De Filippis, G.; Foglia, L.; Giudici, M.; Mehl, S.; Margiotta, S.; Negri, S.L. Effects of Different Boundary Conditions on the Simulation of Groundwater Flow in a Multi-Layered Coastal Aquifer System (Taranto Gulf, Southern Italy). Hydrogeol. J. 2017, 25, 2123–2138. [Google Scholar] [CrossRef]
  84. Margiotta, S.; Marini, G.; Fay, S.; D’Onghia, F.M.; Liso, I.S.; Parise, M.; Pinna, M. Hydro-Stratigraphic Conditions and Human Activity Leading to Development of a Sinkhole Cluster in a Mediterranean Water Ecosystem. Hydrology 2021, 8, 111. [Google Scholar] [CrossRef]
  85. Apulia Region. Piano Di Tutela Delle Acque (PTA); Regional Water Protection Plan (PTA); Water Protection Service: Bari, Italy, 2009; Volume 1, pp. 1–103. [Google Scholar]
Figure 1. The coastal plain of Tavoliere delle Puglie: (a) geographic map of the coastal plain; (b) aerial photograph of the salt marshes located in the Zapponeta area with defenses built along the coast.
Remotesensing 14 04936 g001
Figure 2. Sketch of Tavoliere hydrogeological districts, showing the low-quality groundwater with salt contamination (data from Apulia Region, 1984 [51]). Wells data are property of Apulia Region, Agenzia Regionale per la Prevenzione e la Protezione dell’Ambiente (ARPA) and Istituto Superiore per la Ricerca e Protezione Ambientale (ISPRA).
Remotesensing 14 04936 g002
Figure 3. Digital Surface Model (DSM) obtained for the coastal area. The ALS data were acquired for the inland areas [52] while TLS surveys were performed for the coastal area (light blue and green polygons). The Ground Reference Points (GRPs, white points) were obtained through GPS static survey and Total Station leveling; the GRPs reported in yellow were used for the vertical error assessment of DSM. Background map was obtained from Google Satellite.
Remotesensing 14 04936 g003
Figure 4. Vertical Land Movement assessed in northern Apulia: (a) GNSS stations’ positions with the background VLM map obtained from PS InSAR data (interpolated on a regular grid with 250-m posting by means of nearest-neighbour gridding method), draped over a shaded DEM of the study area; the six representative areas, discussed in the text, are indicated by ellipses; (b) comparison (scatter plot) between GNSS-velocity (projected onto the SAR LoS) and SAR-velocity components.
Remotesensing 14 04936 g004
Figure 5. SLR projections estimated at the upper 95% bounds of the regional IPCC, integrated with the contribution of the mean Vertical Land Movement (VLM) rate derived from the InSAR data and long-term geological elevation of the MIS 5.5 marine terrace, relative to 2019 AD. Blue and red curves refer to the SSP1-2.6 and SSP5-8.5 climate scenarios, respectively.
Remotesensing 14 04936 g005
Figure 6. Comparison of relative sea-level-rise scenarios for tectonic and anthropogenic contributions of land subsidence: (a) flooding surface with tectonic subsidence (yellow color) and with anthropogenic subsidence (red color); (b) histograms of multitemporal (2050, 2100, 2150) flooding area as a function of the tectonic and anthropogenic subsidence.
Remotesensing 14 04936 g006
Figure 7. Expected RSLR scenario and coastline positions estimated for the low-emission scenario (SSP1-2.6—IPCC 2021) and current land subsidence for 2050, 2100, and 2150.
Remotesensing 14 04936 g007
Figure 8. Expected RSLR scenario and coastline positions estimated for the high-emission scenario (SSP5-8.5—IPCC 2021) and current land subsidence for 2050, 2100, and 2150.
Remotesensing 14 04936 g008
Figure 9. VLM rates inferred from the geodetic analysis (InSAR and GNSS data): (a) map of VLM rates in the Manfredonia municipality, computed on a regular grid of points, as explained in Section 3.2, with the greatest VLM at point PS1; (b) vertical displacement assessed through InSAR data for the dock, corresponding to point PS1.
Remotesensing 14 04936 g009
Figure 10. Potential inland flooding caused by propagation of the storm waves from offshore to inland in different SLR scenarios; boundary conditions of the storm event are reported in Supplementary Material. (a) Flooding in SSP1-2.6 scenario by 2050 (sea-level limit represented with light blue line); (b) flooding in SSP5-8.5 scenario by 2050 (sea-level limit represented with red line); (c) flooding in SSP1-2.6 scenario by 2150 (sea-level limit represented with light blue line); (d) flooding in SSP5-8.5 scenario by 2150 (sea-level limit represented with red line).
Remotesensing 14 04936 g010
Figure 11. Percentage values of areas in each land-use category affected by sea-level rise in 2050, 2100, and 2150. (a) The percentages refer to the total area flooded in the SSP1-2.6 scenario. (b) The percentages refer to the total area flooded in the SSP5-8.5 scenario. All the land-use categories showing a percentage value of lower than 1% are grouped in a single class. (c) Influence of sea-level rise (SSP5-8.5, time step 2150) on the land use of Tavoliere delle Puglie with associated saltwater/freshwater edge (data from Apulia Region, 1984 [51]).
Remotesensing 14 04936 g011
Table 1. Accuracy analysis of the DSMs used for the Tavoliere delle Puglie; for the different DSMs, root mean square error (RMSE), standard deviation (SD), and mean error were assessed.
Type of DSMRMSE (m)SD (m)Mean Error (m)
TLS DSM0.320.190.26
ALS-DSM0.280.180.21
Merged DSM0.350.230.26
Table 2. Projections of sea-level rises for the areas of Tavoliere delle Puglie; SSP1-2.6 and SSP5-8.5 represent the low and high atmospheric-greenhouse-gas-concentration scenarios, respectively.
Area 1Area 2Area 3Area 4Area 5Area 6
SSP1-2.62050139.65 ± 109.13 mm158.55 ± 109.04 mm351.15 ± 120.23 mm249.15 ± 117.81 mm186.15 ± 117.81 mm133.8 ± 106.53 mm
2100382.52 ± 247.25 mm432.92 ± 246.96 mm946.52 ± 281.48 mm674.52 ± 274.1 mm506.52 ± 274.1 mm361.16 ± 240.13 mm
2150602.09 ± 410.76 mm683.99 ± 410.3 mm1518.59 ± 465.31 mm1076.59 ± 453.53 mm803.59 ± 453.53 mm565.7 ± 403.48 mm
SSP5-8.52050178.23 ± 108.85 mm197.13 ± 108.75 mm389.73 ± 119.97 mm287.73 ± 117.54 mm224.73 ± 117.54 mm172.46 ± 107.36 mm
2100666.15 ± 275.31 mm716.55 ± 275.05 mm1230.15 ± 306.42 mm958.15 ± 299.66 mm790.15 ± 299.66 mm654.39 ± 269.06 mm
21501148.62 ± 520.98 mm1230.52 ± 520.62 mm2065.12 ± 564.99 mm1623.12 ± 555.33 mm1350.12 ± 555.33 mm1132.09 ± 509.61 mm
Table 3. Average VLM- and shoreline-change rates for the study areas. The assessment of effective shoreline-change rates is reported in Table S2—Supplementary Material.
Study AreasSitesVLM RatesEffective Shoreline Change Rate
Area 1Manfredonia−0.45 ± 0.25 mm/yr−0.196 ± 0.06 m/yr
Area 2Siponto sandy coast−1.08 ± 0.2 mm/yr−1.079 ± 0.32 m/yr
Area 3Ippocampo−7.5 ± 1.7 mm/yr−2.983 ± 0.89 m/yr
Area 4Zapponeta−4.1 ± 1.5 mm/yr−2.733 ± 0.82 m/yr
Area 5Torre Pietra−2 ± 1.5 mm/yr−2.762 ± 0.83 m/yr
Area 6Margherita di Savoia−0.13 ± 0.08 mm/yr−5.825 ± 1.75 m/yr
Table 4. Flooding surfaces were assessed for the studied areas under different sea-level projections.
Study AreasFlooding Surface SSP1-2.6 (km2)Flooding Surface SSP5-8.5 (km2)
205021002150205021002150
Area 10.1140.3250.4180.1470.7720.906
Area 21.4535.3948.1021.91323.73923.739
Area 30.4153.6966.9080.75520.70922.289
Area 44.85416.63521.4749.16120.33135.448
Area 535.73545.61549.17135.73645.61555.071
Area 61.9634.8726.0722.7857.5310.289
Total44.53476.53792.14550.497118.696147.742
Publisher’s Note: MDPI stays neutral with regard to jurisdictional claims in published maps and institutional affiliations.

