

Recognition of Sago Palm Trees Based on Transfer Learning

 , ,
, , 
Abstract

1. Introduction
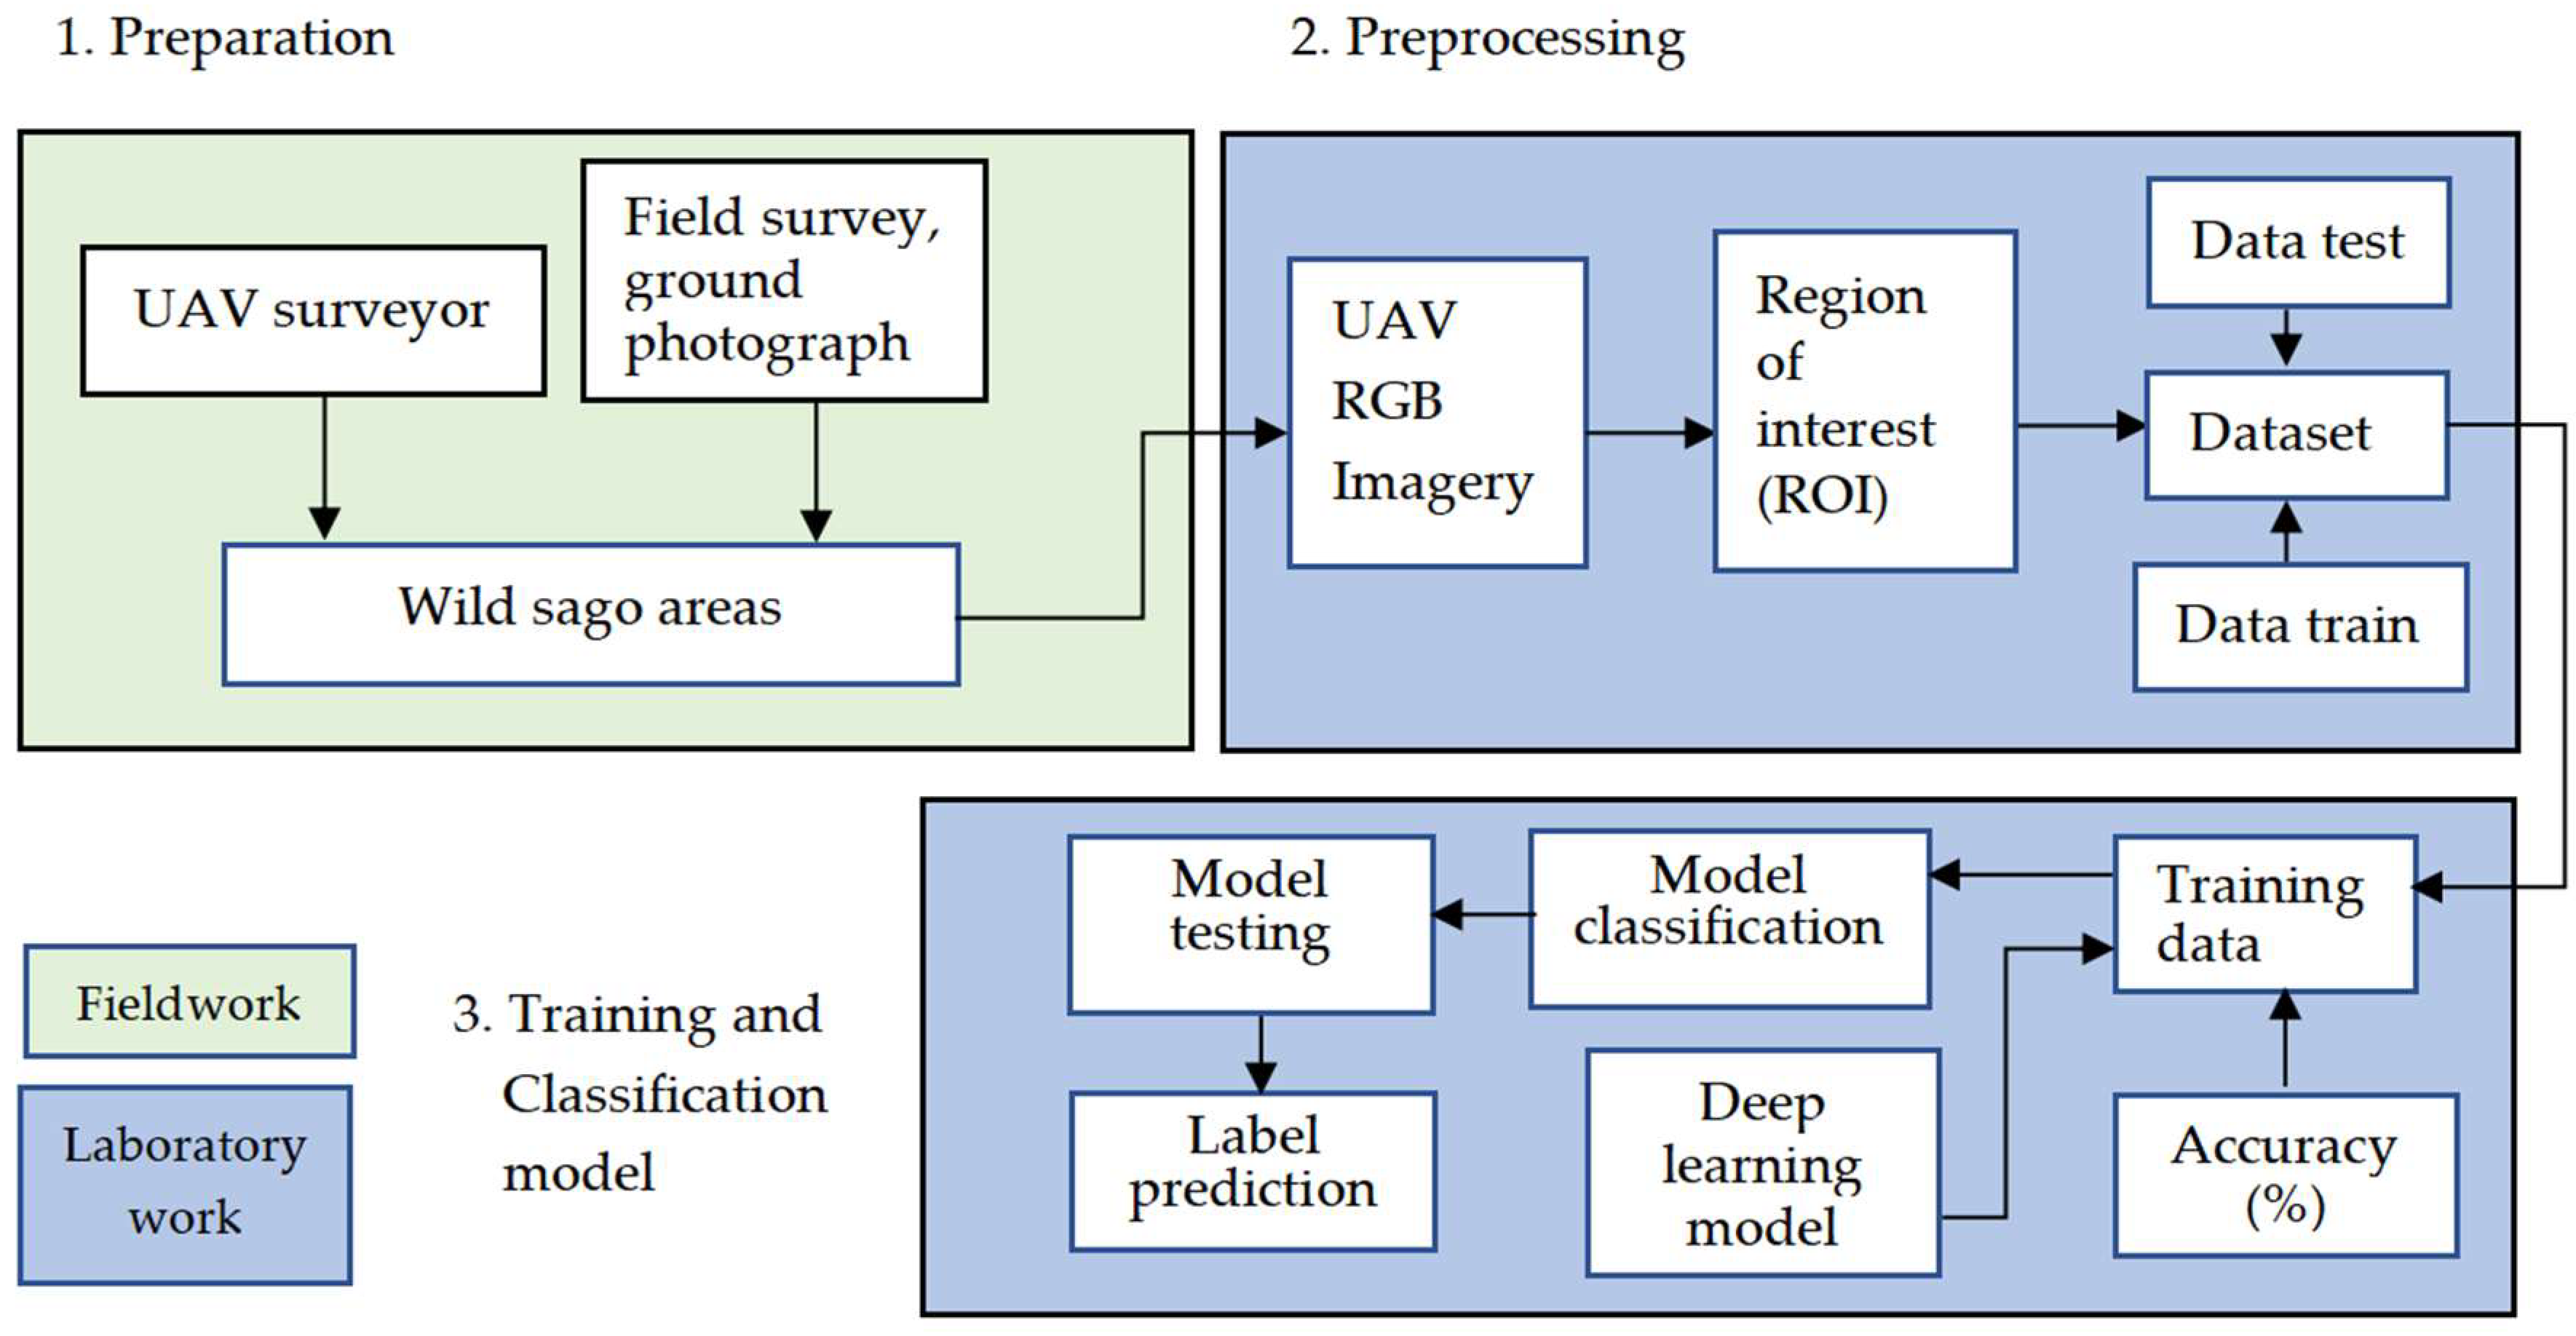
2. Materials and Methods
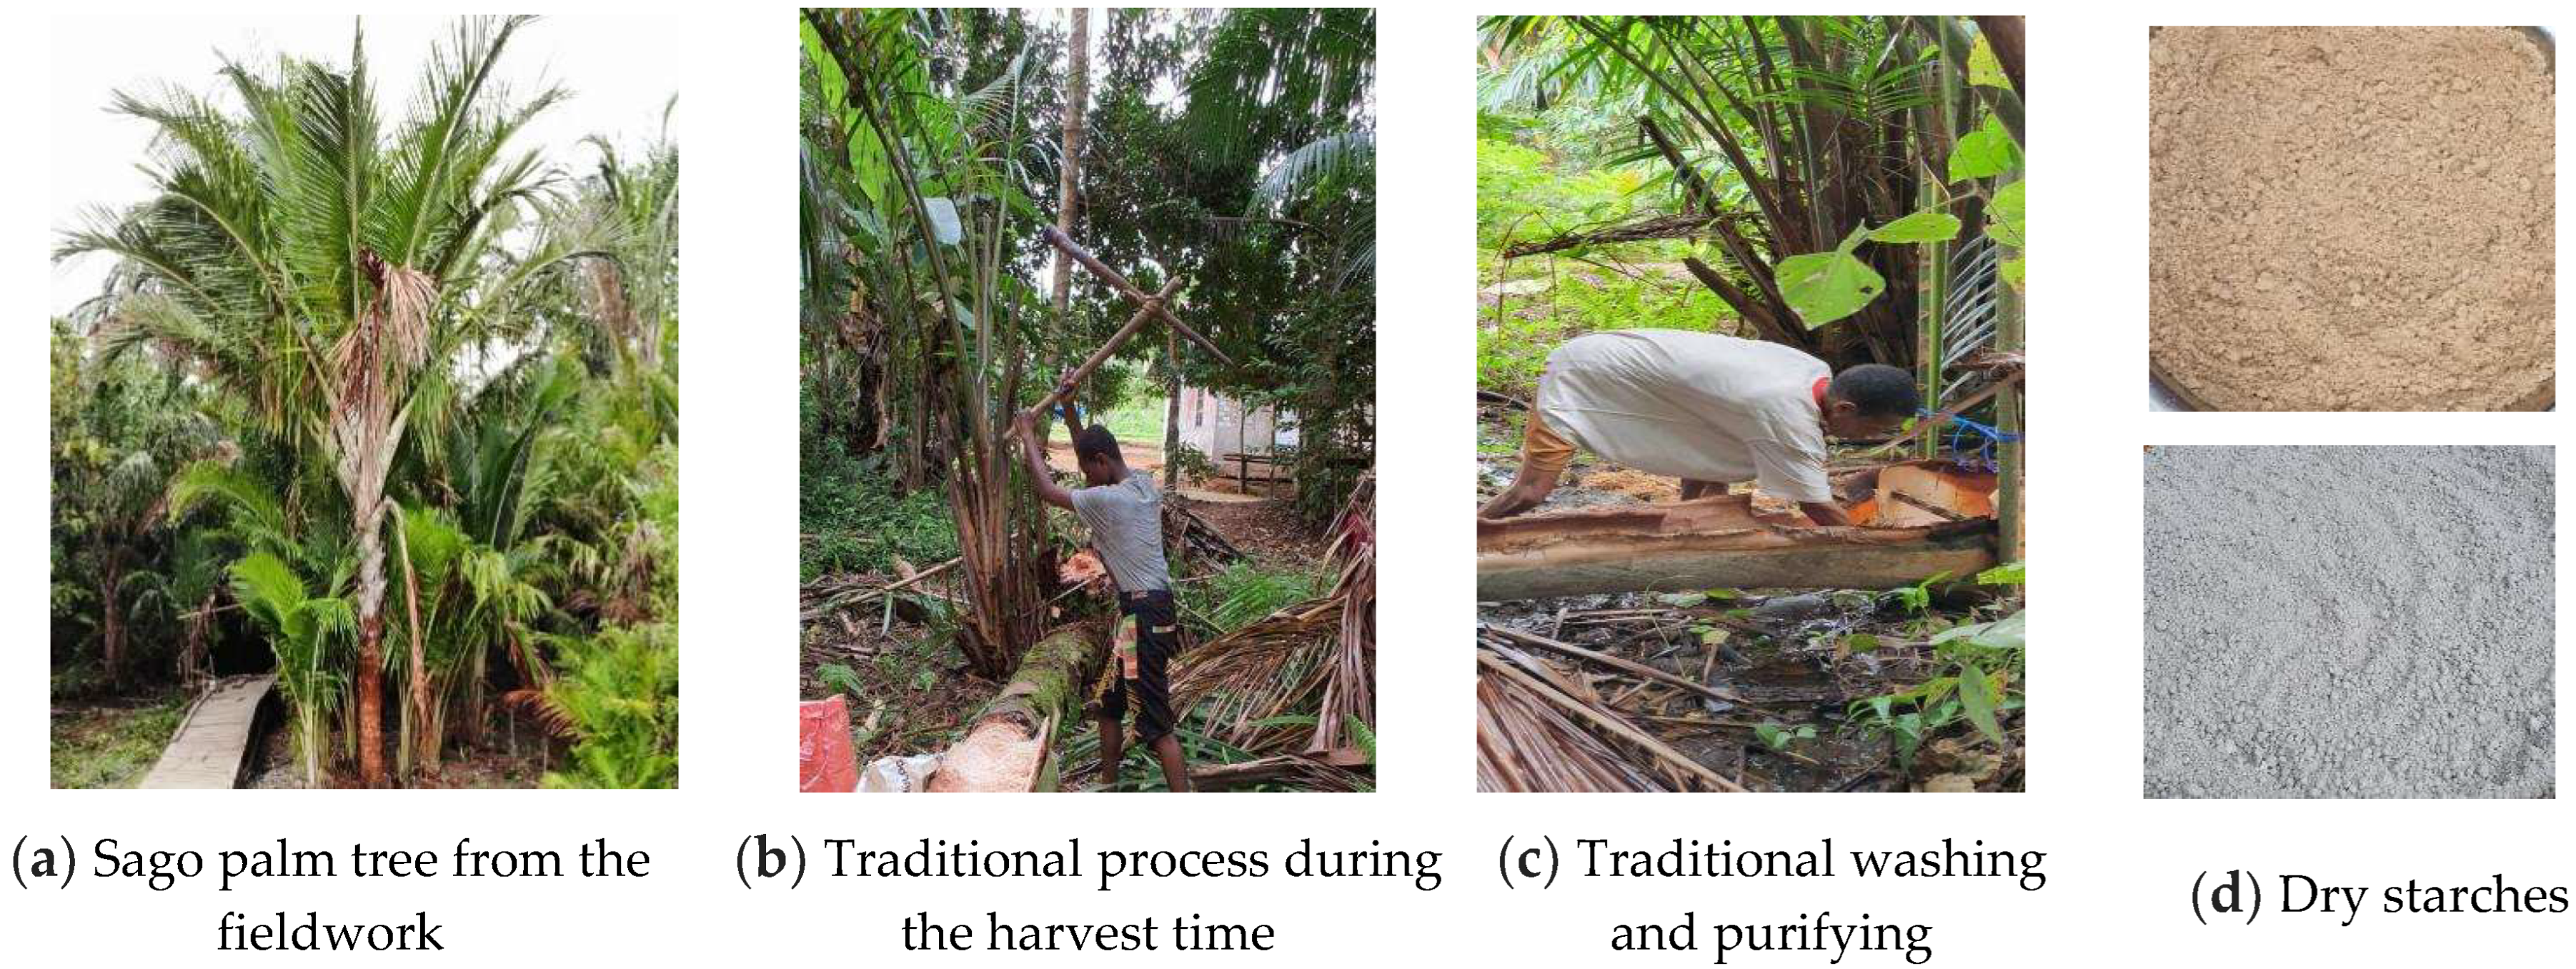
2.1. Study Region
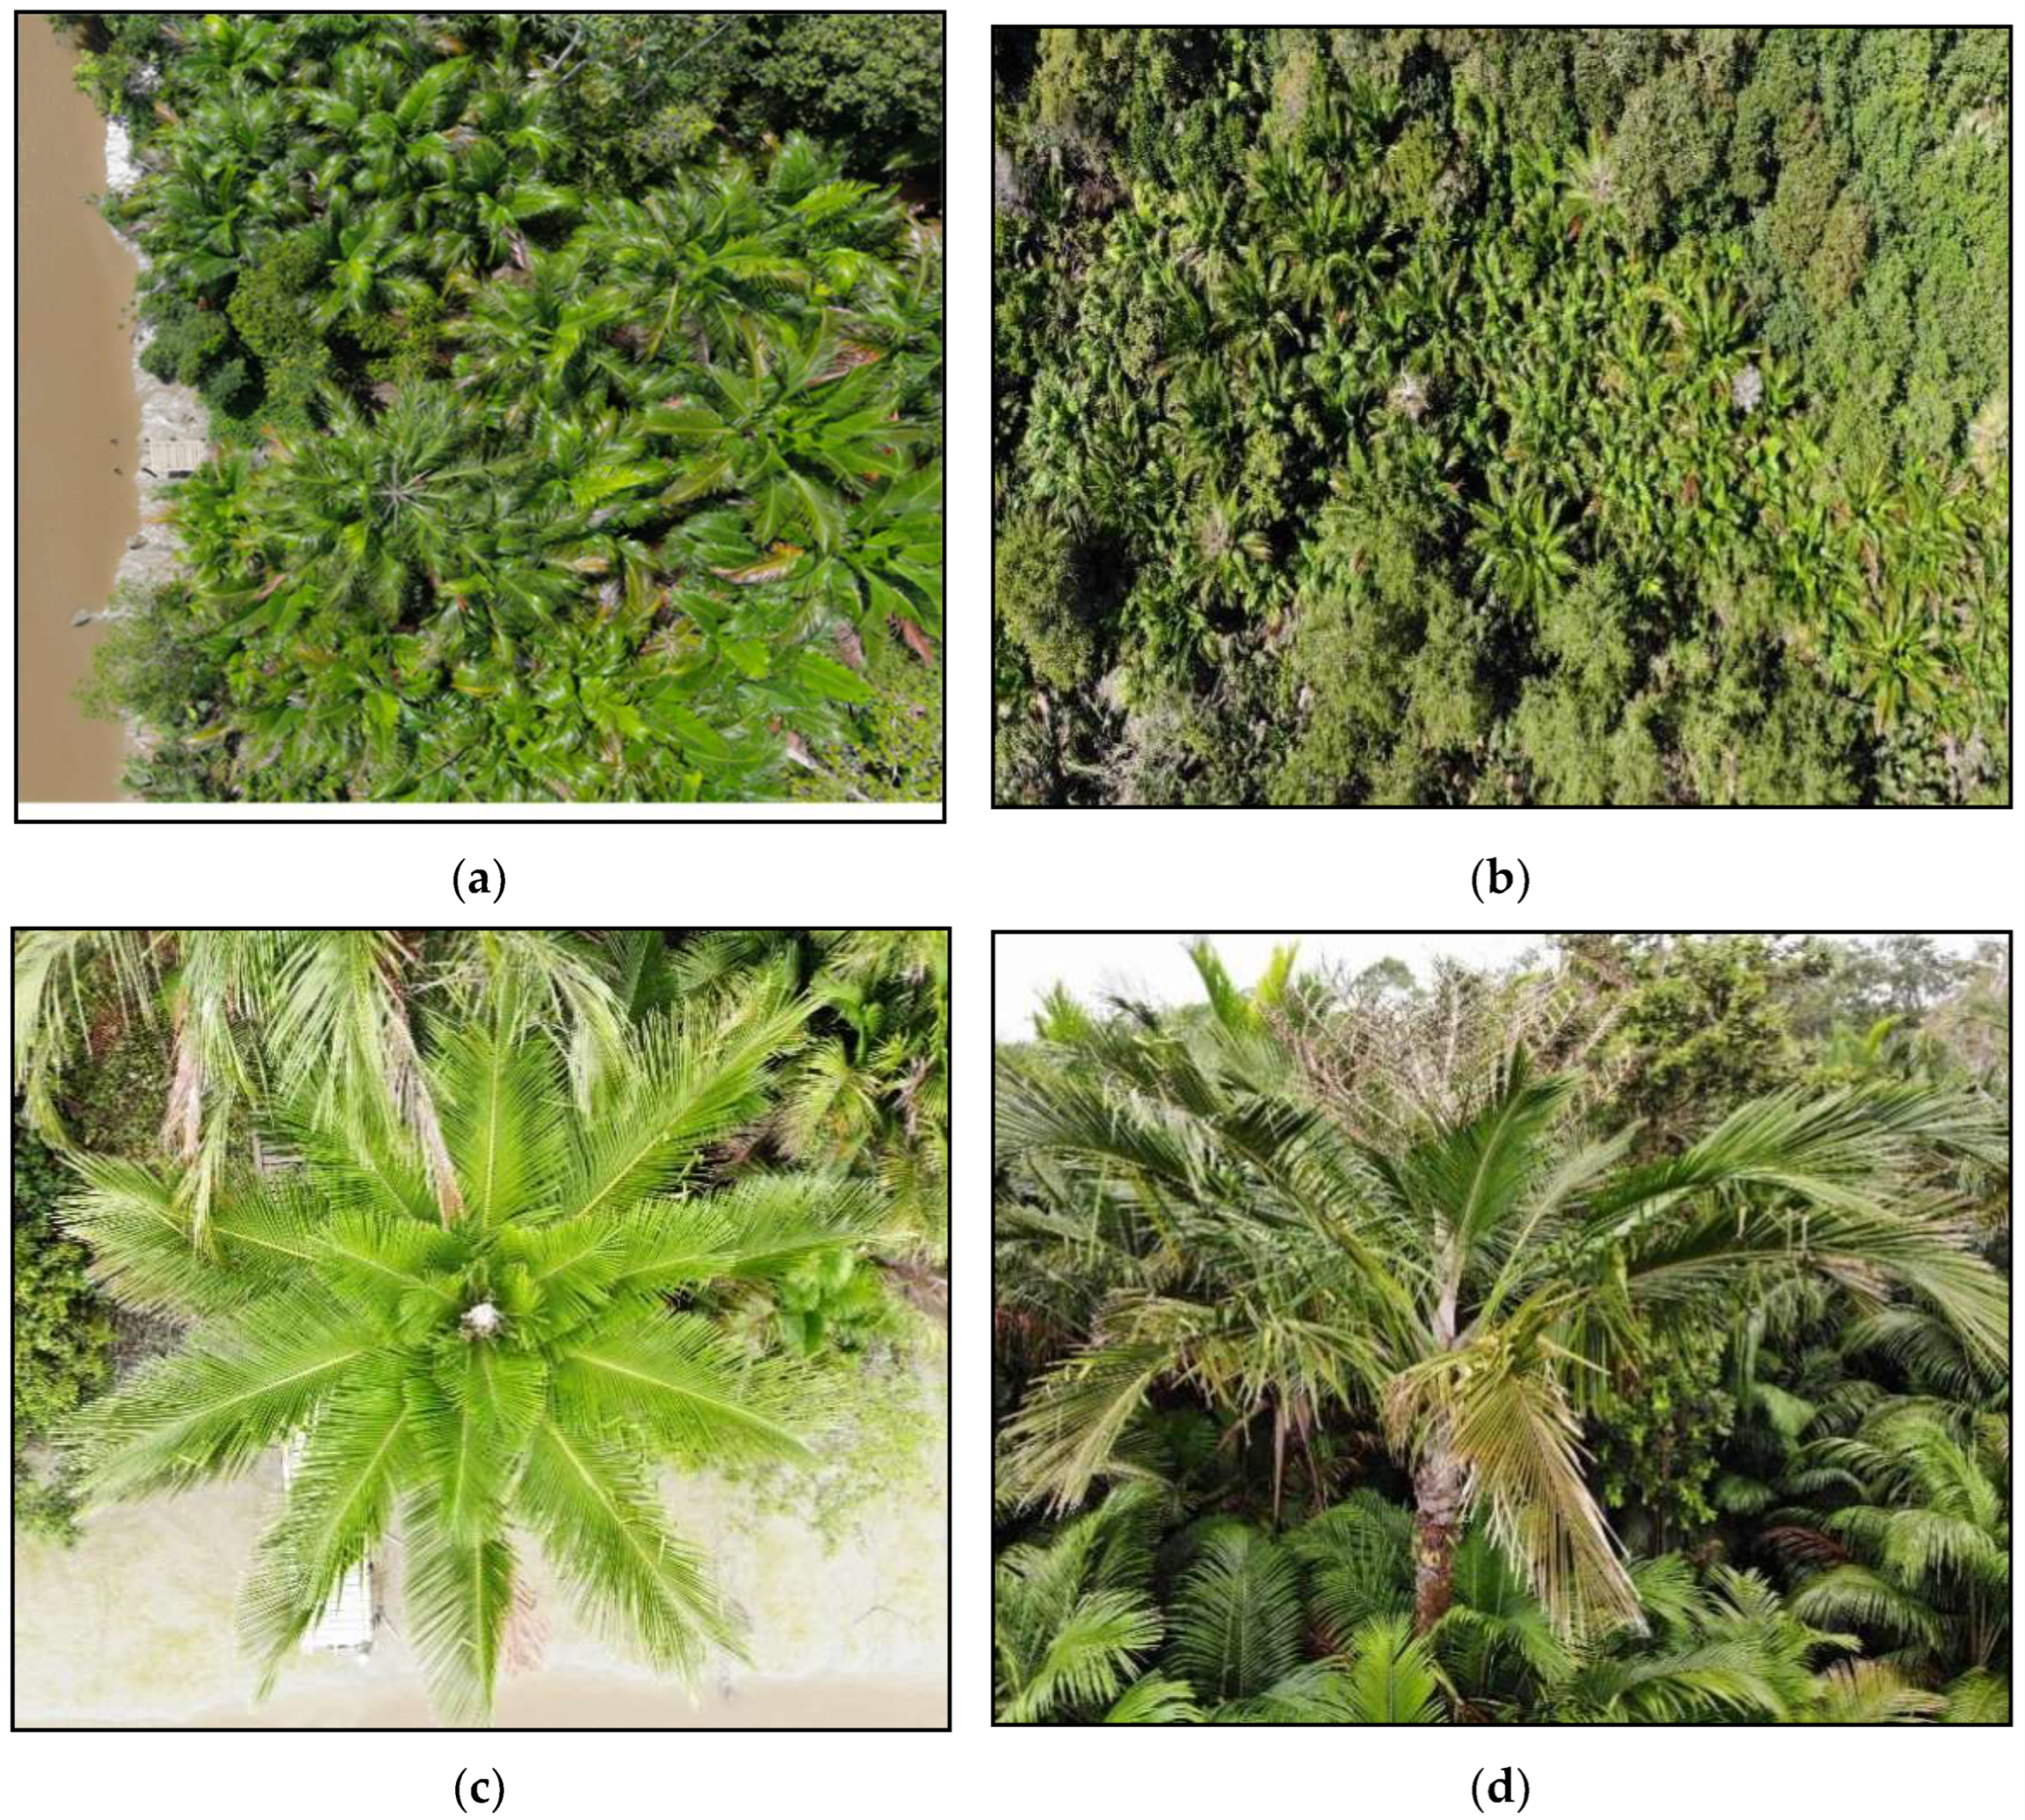
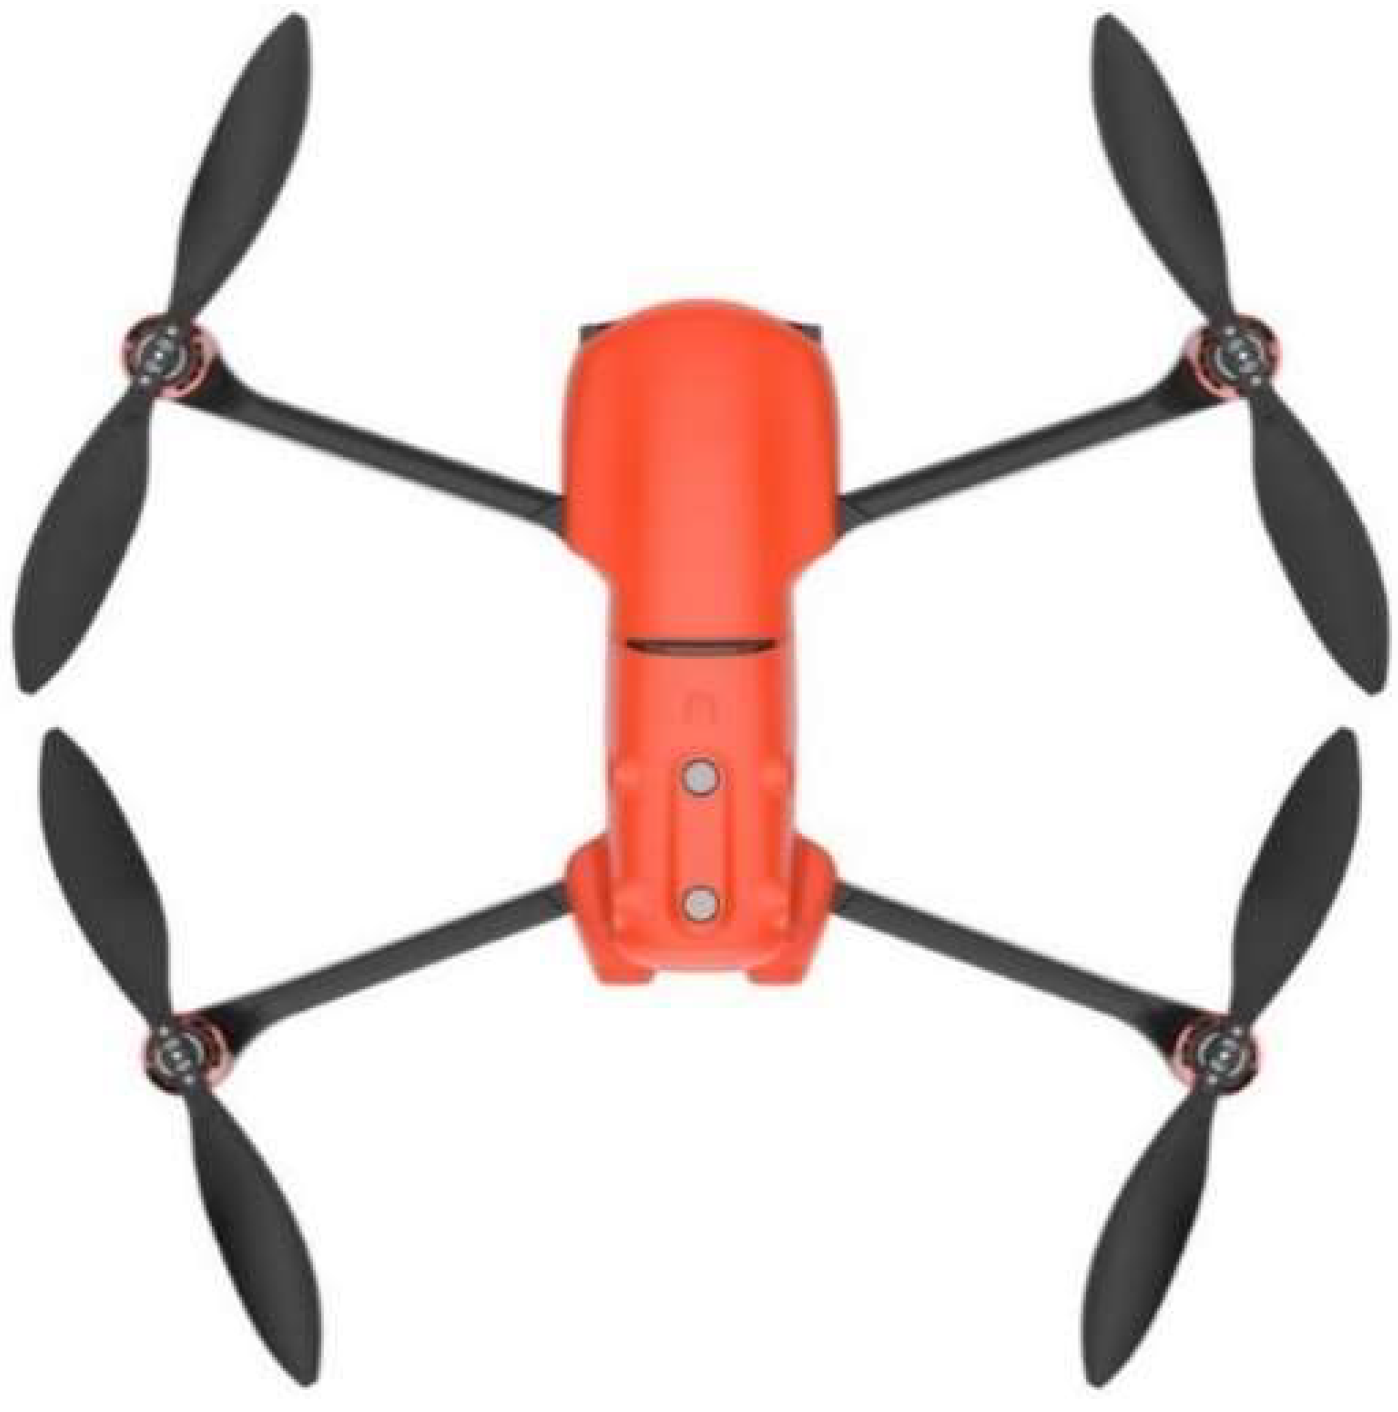
2.2. UAV Imagery
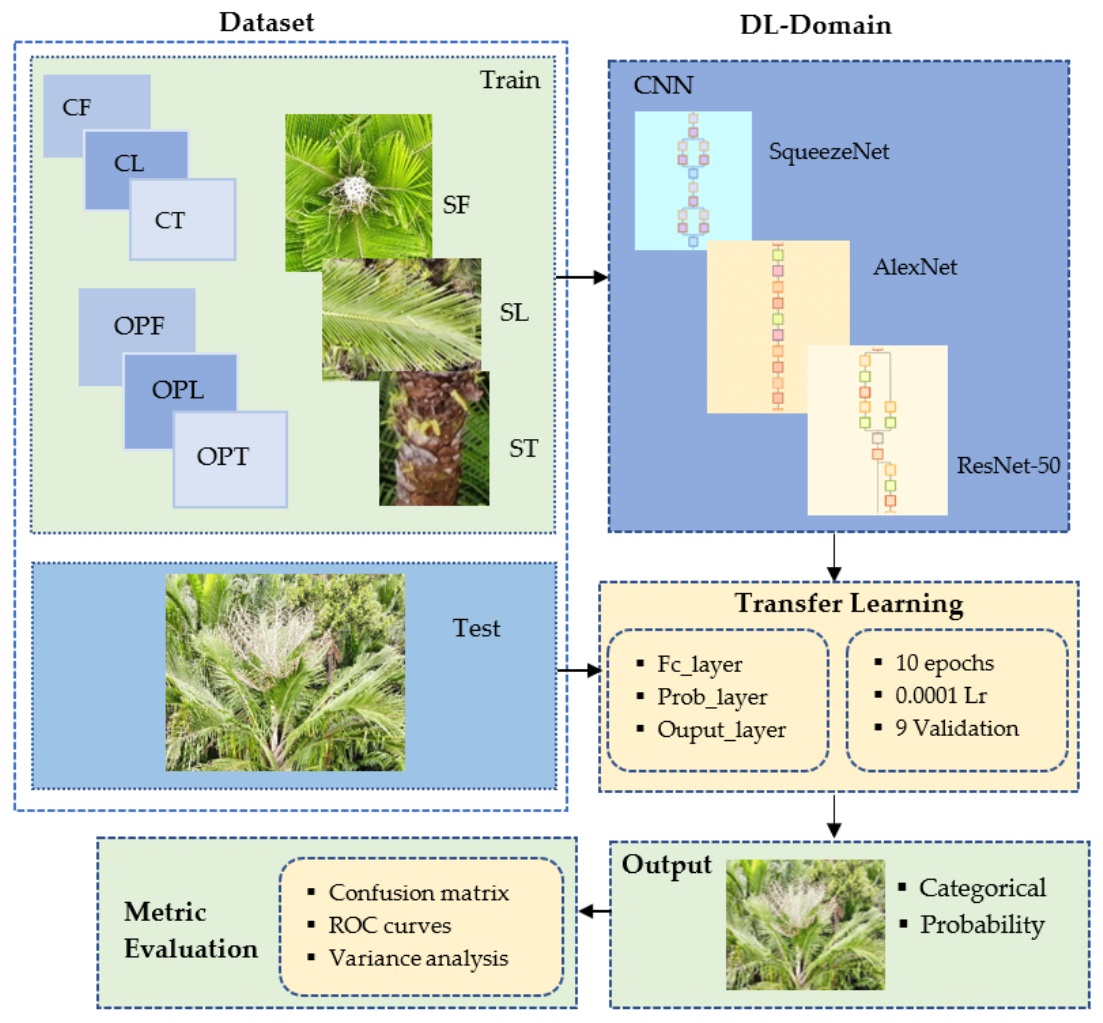
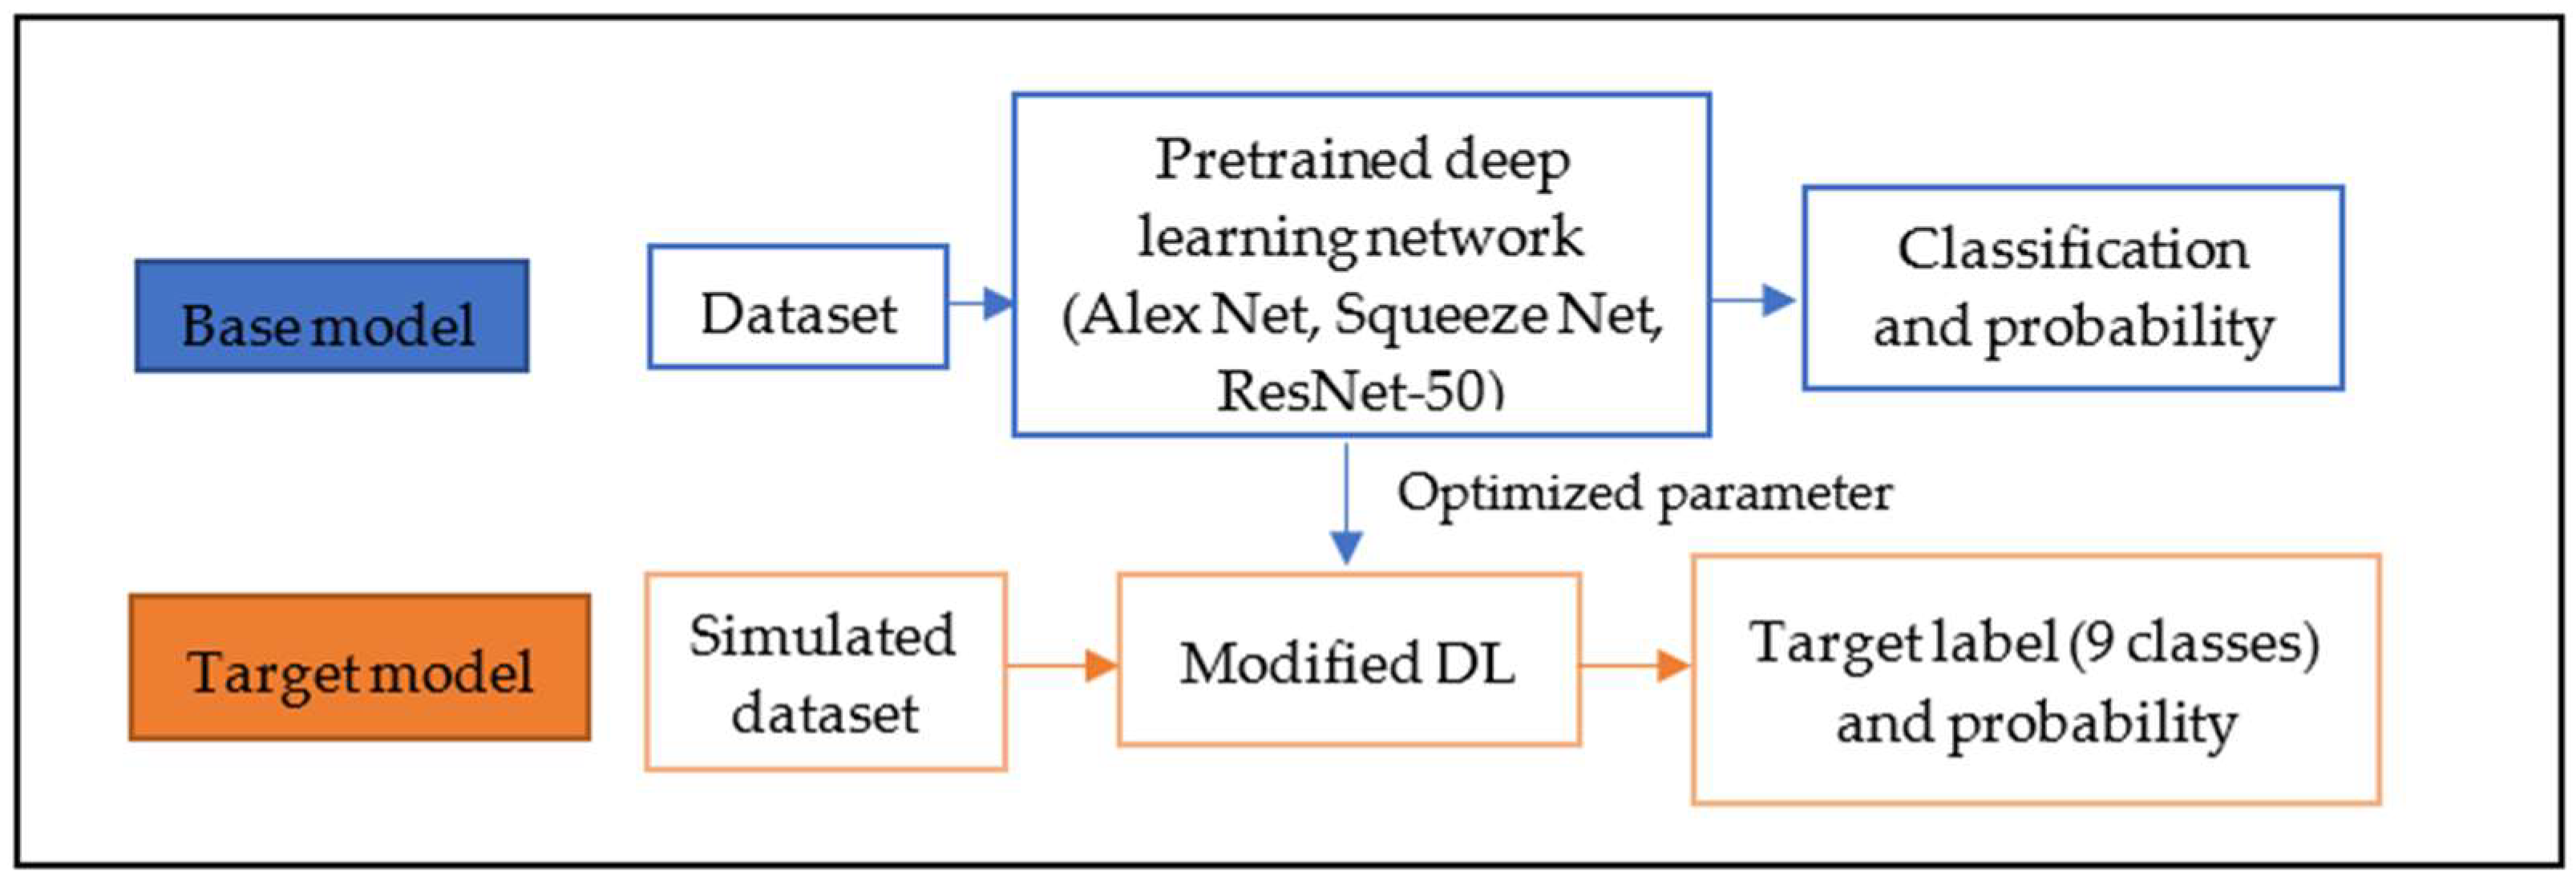
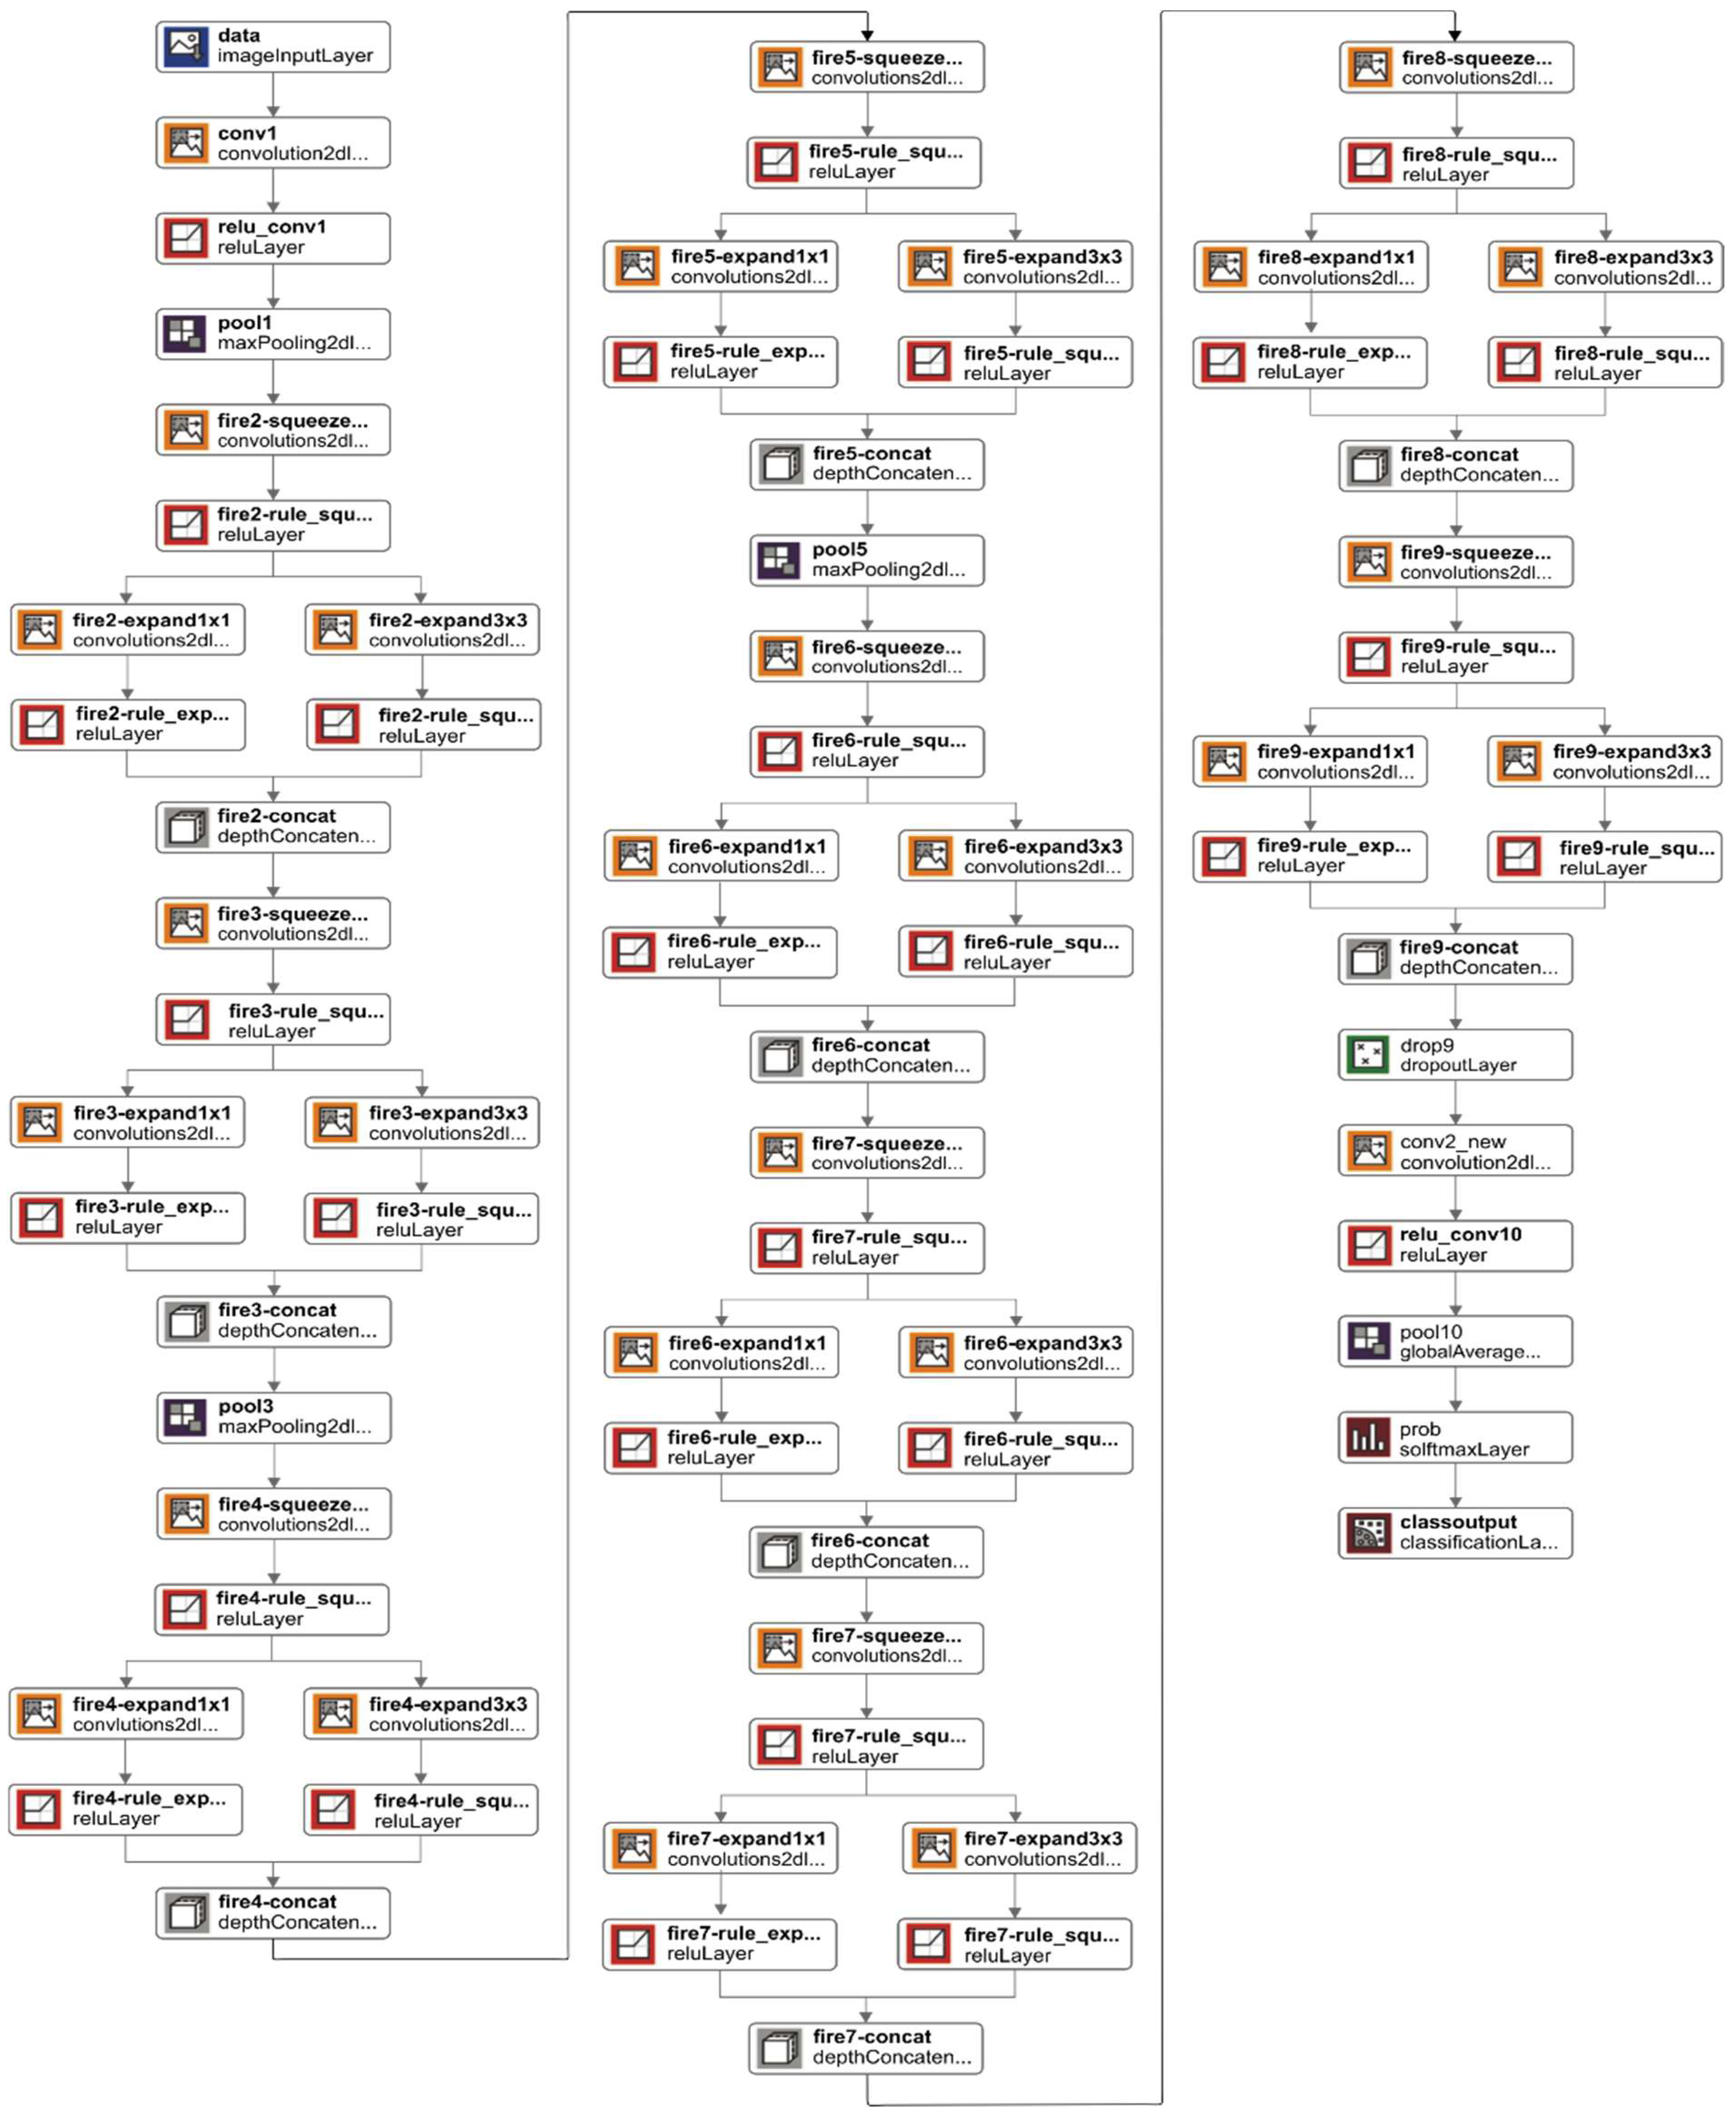
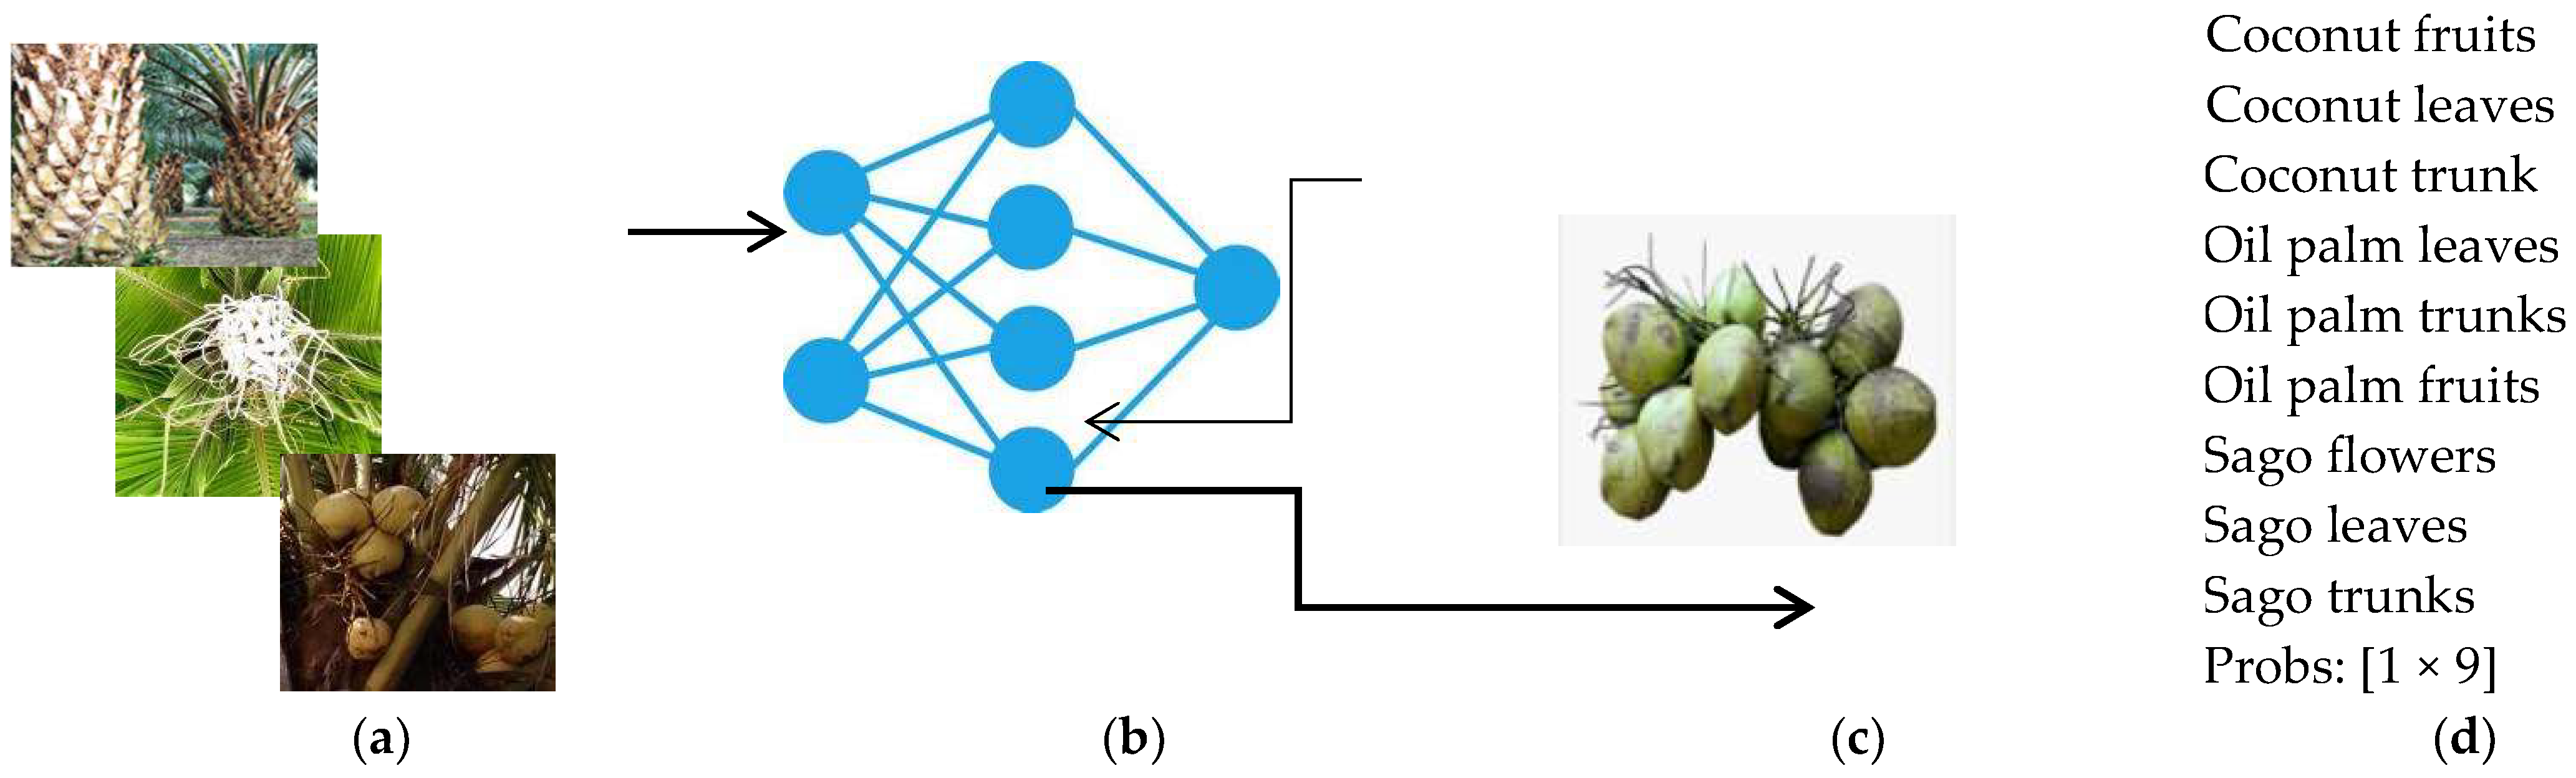
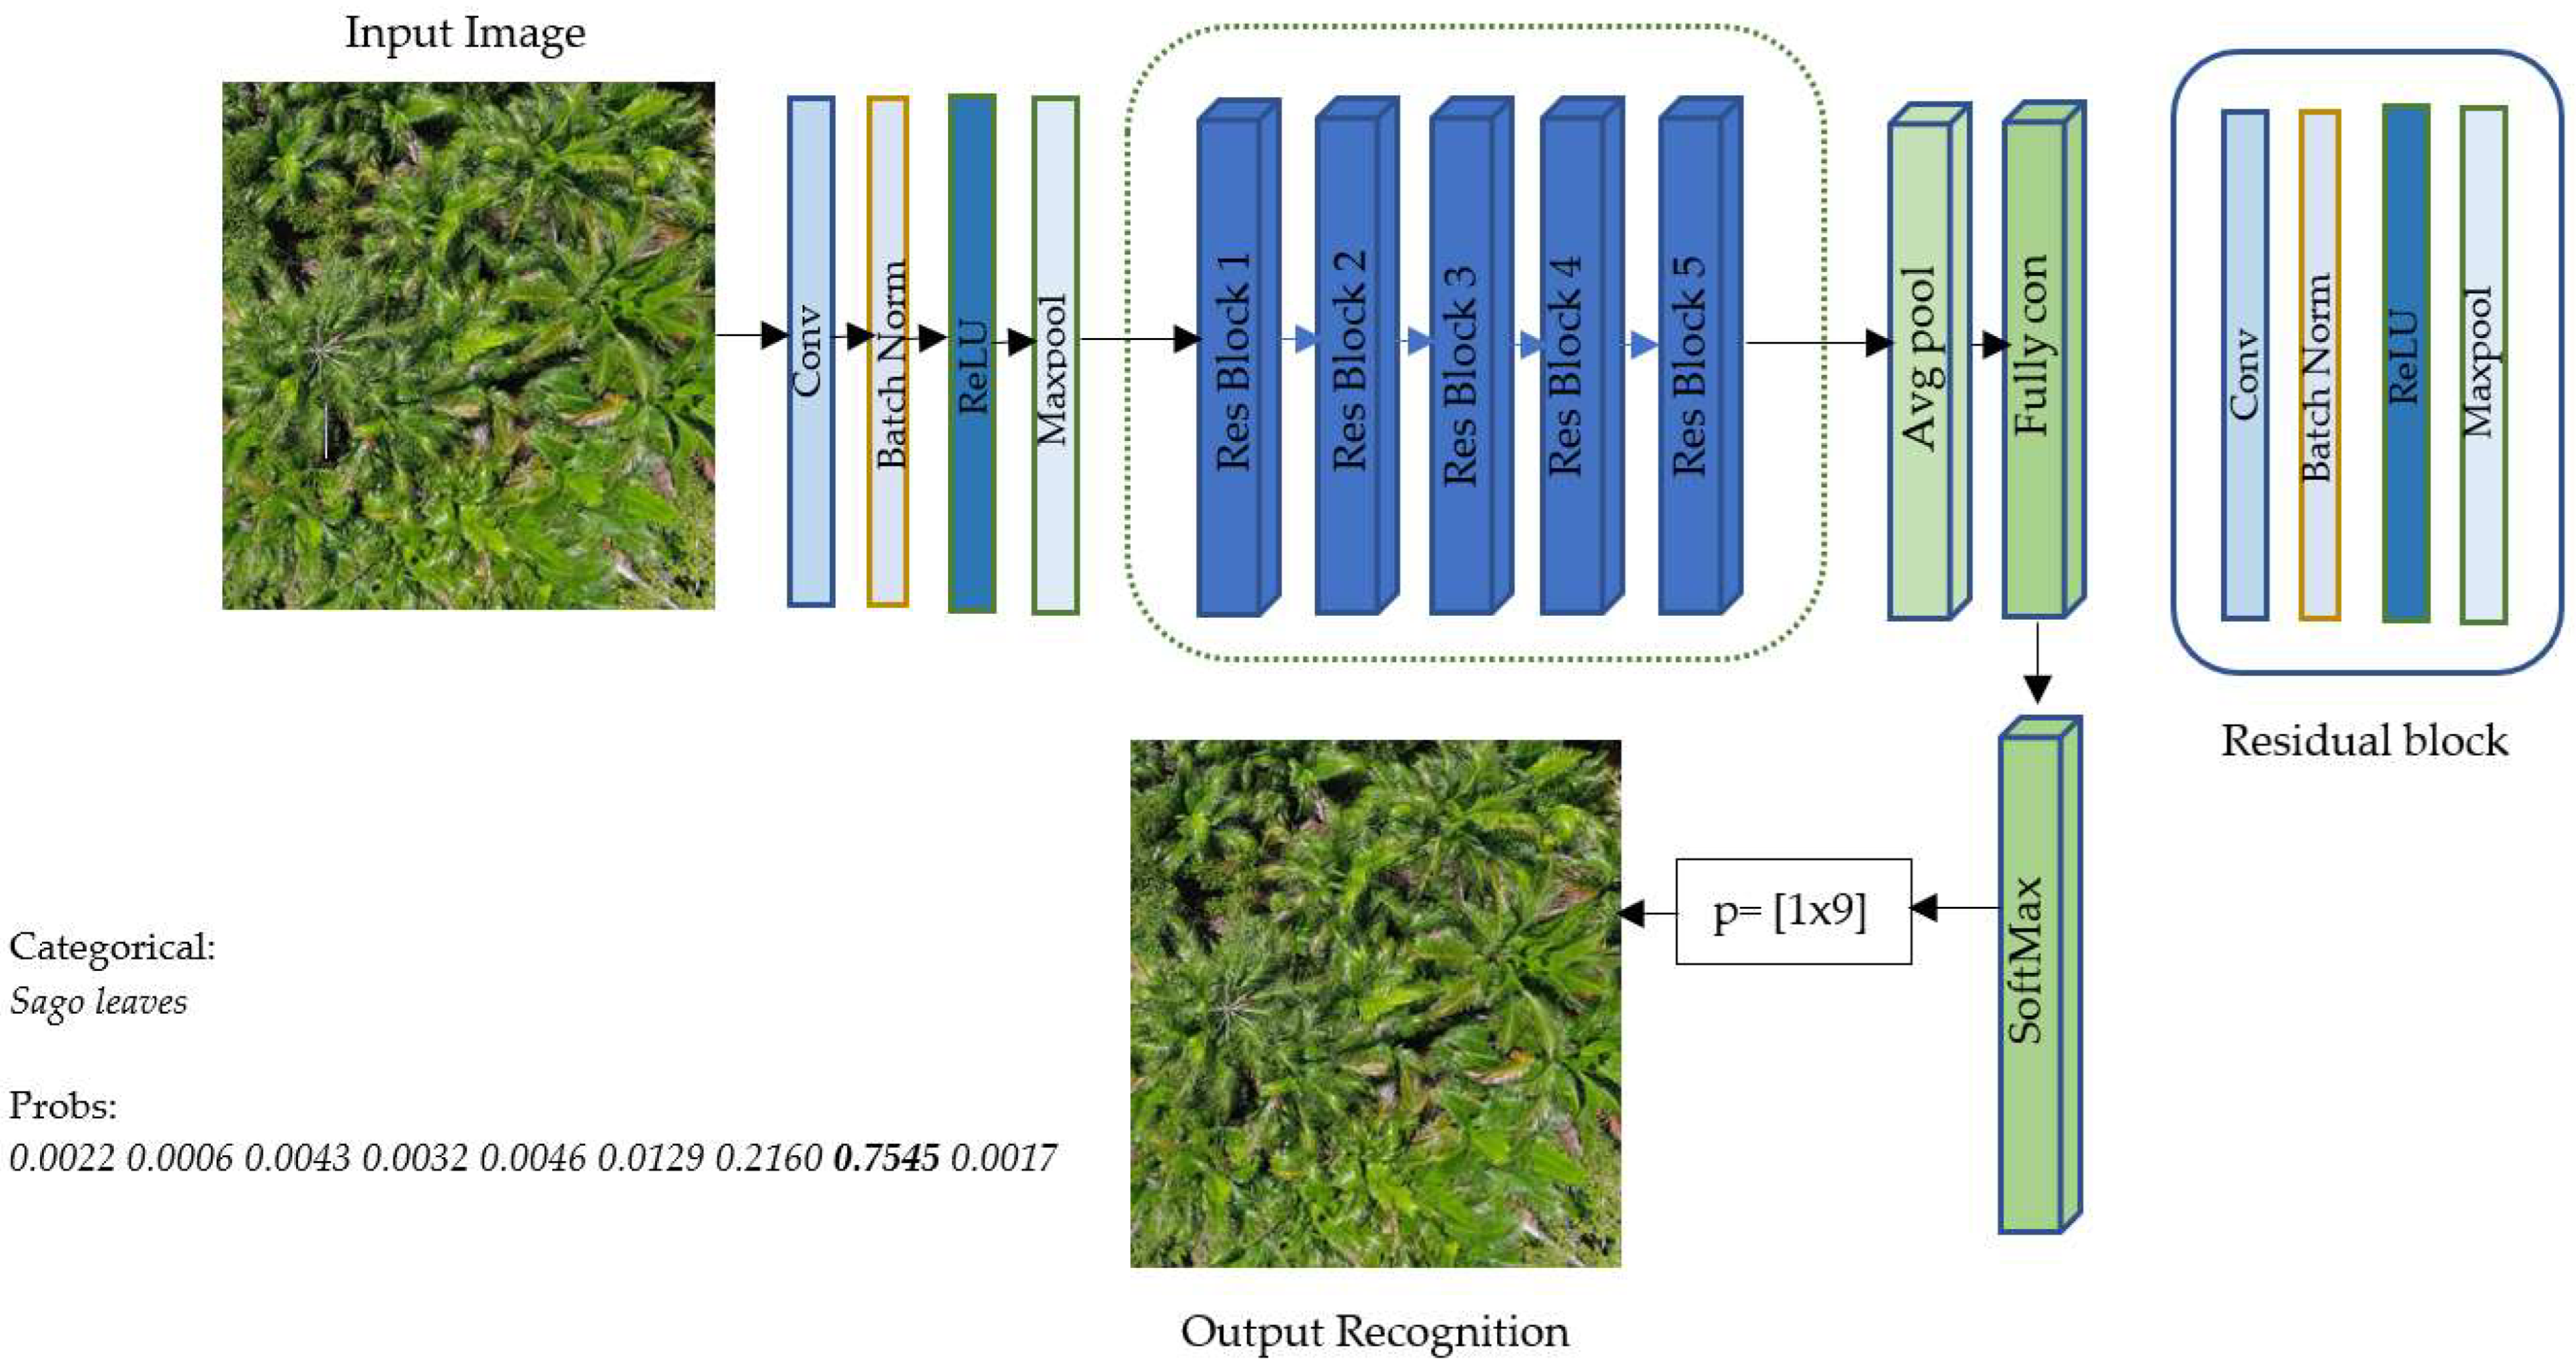
2.3. Deep Learning and Transfer Learning Models
2.4. Performance Evaluation
- TP, the number of actual images that are displaying sago flowers (true) and are classified as sago flowers (predicted).
- FP, the number of actual images that are not displaying sago flowers (not true) and are classified as sago flowers (predicted).
- FN, the number of actual images that are displaying sago flowers (true) and are classified as a different class (predicted).
- TN, the number of actual images that are not displaying sago flowers (not true) and are classified as a different class (predicted).
3. Results
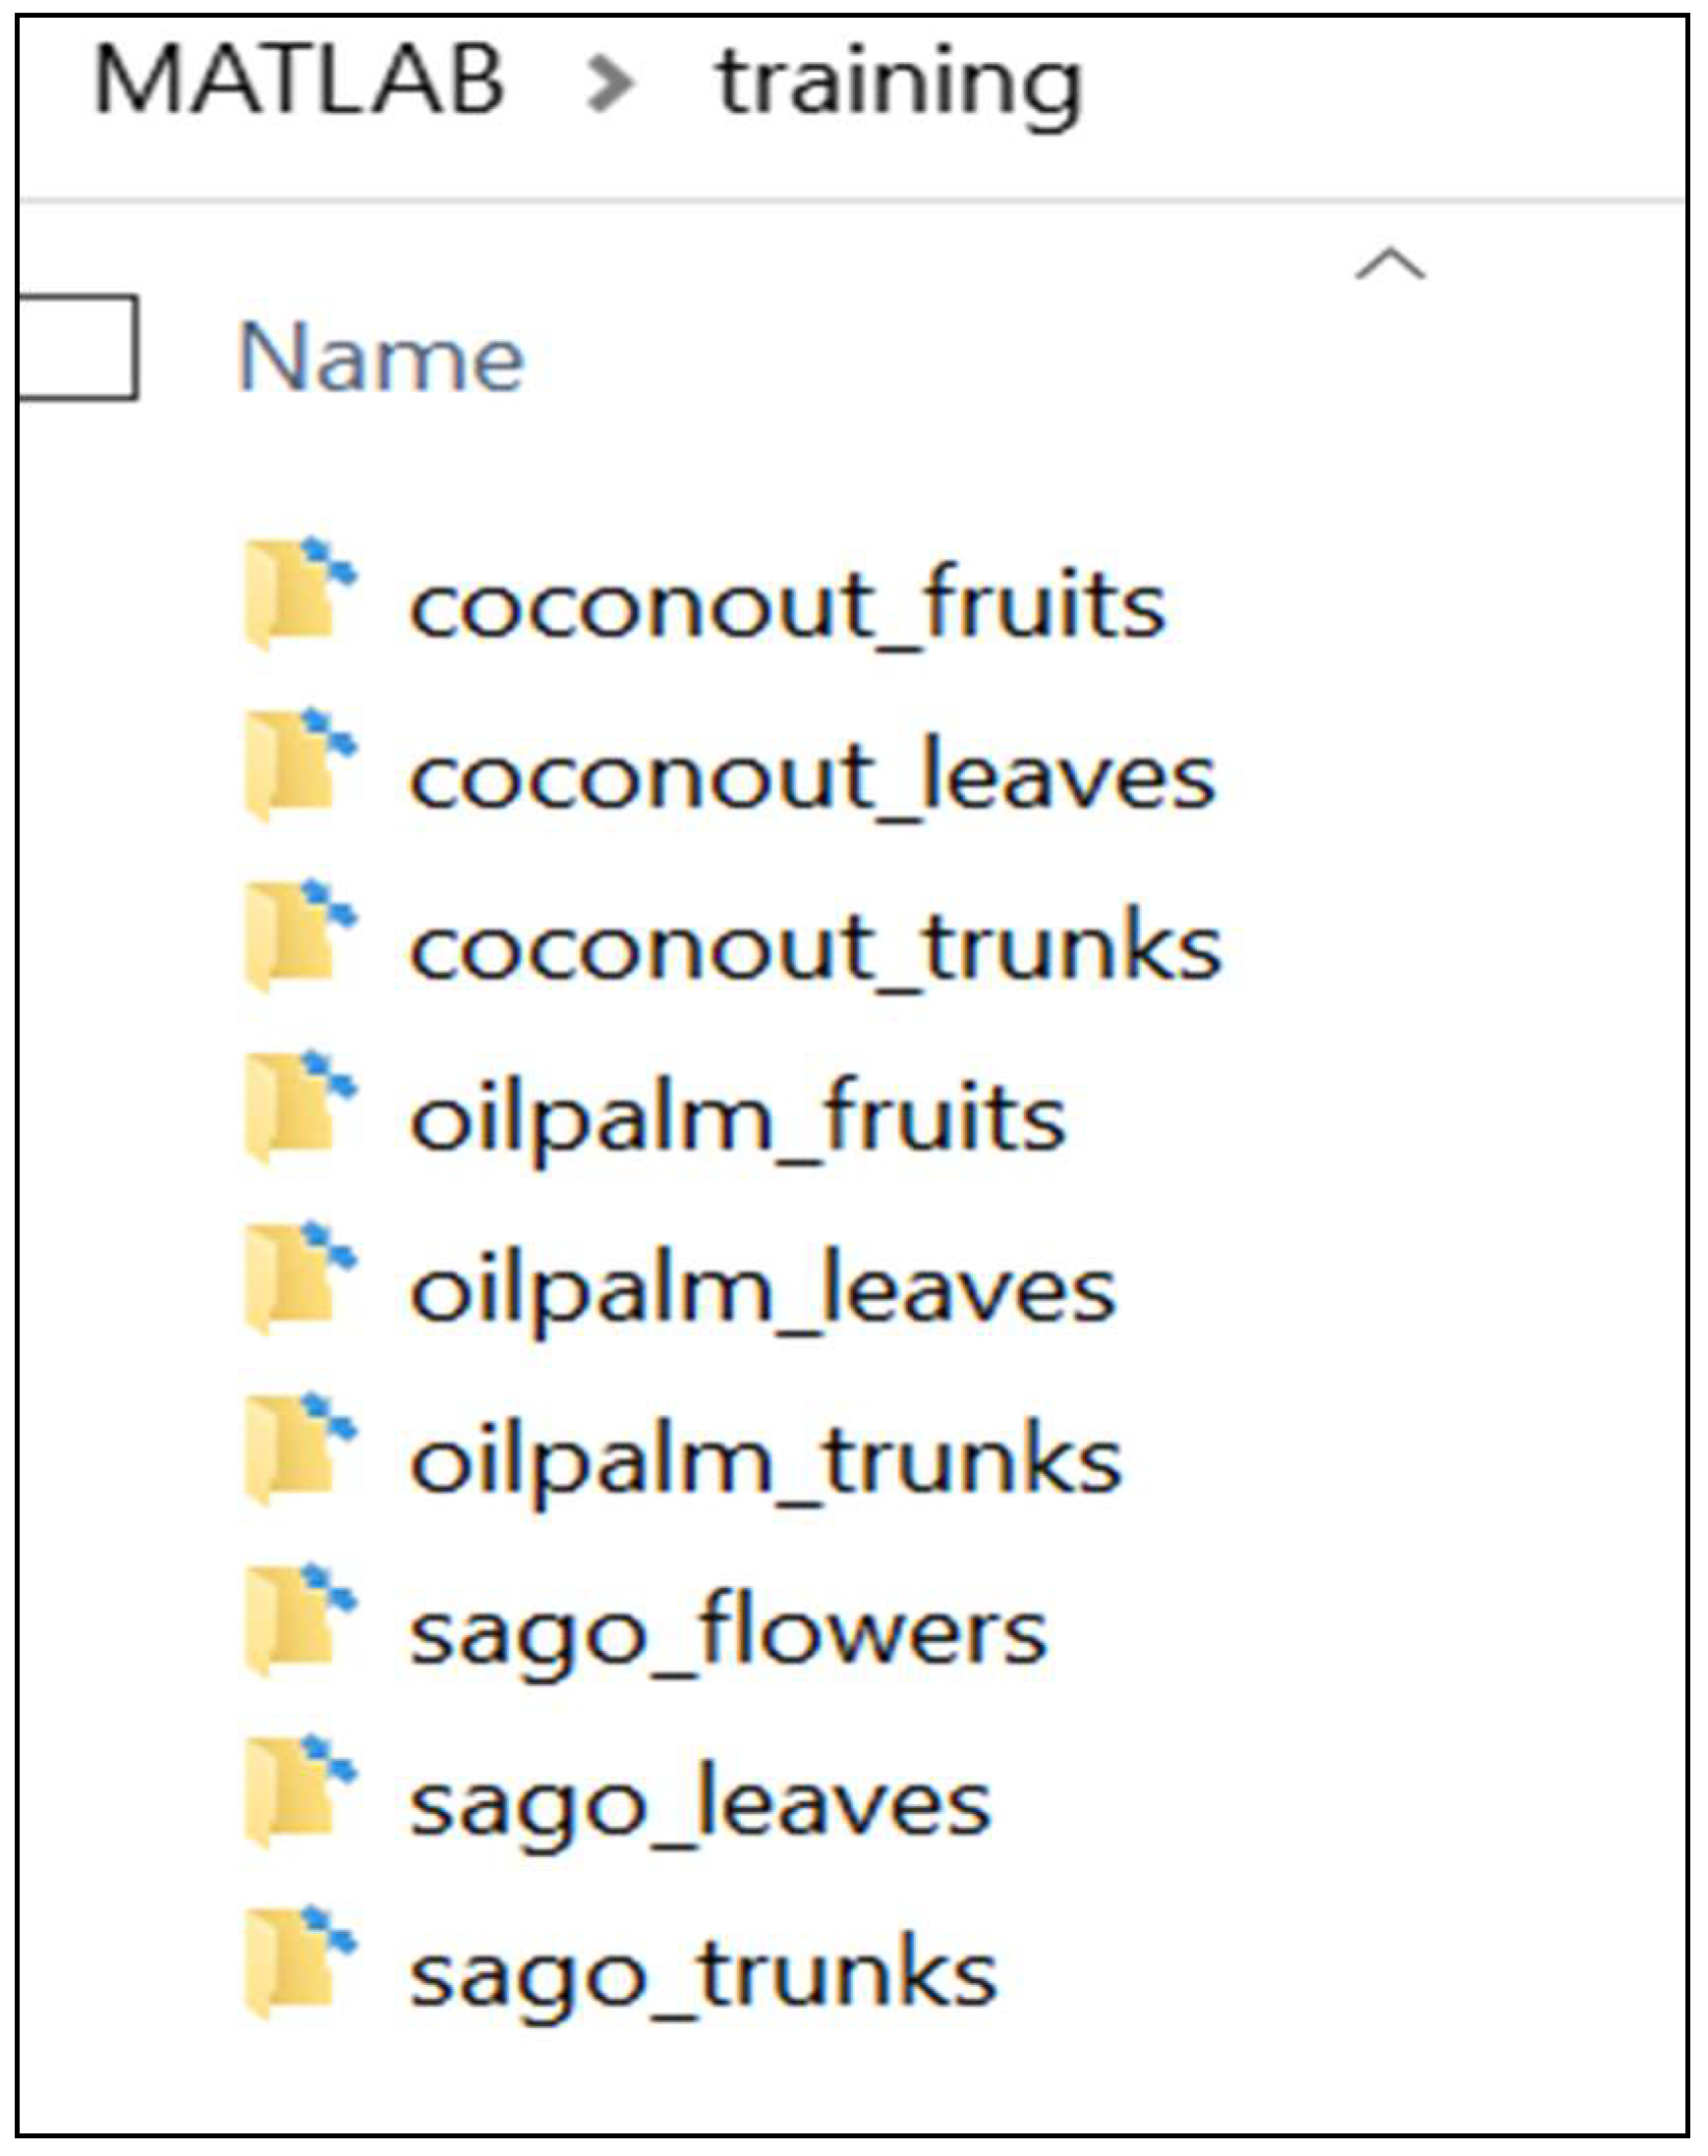
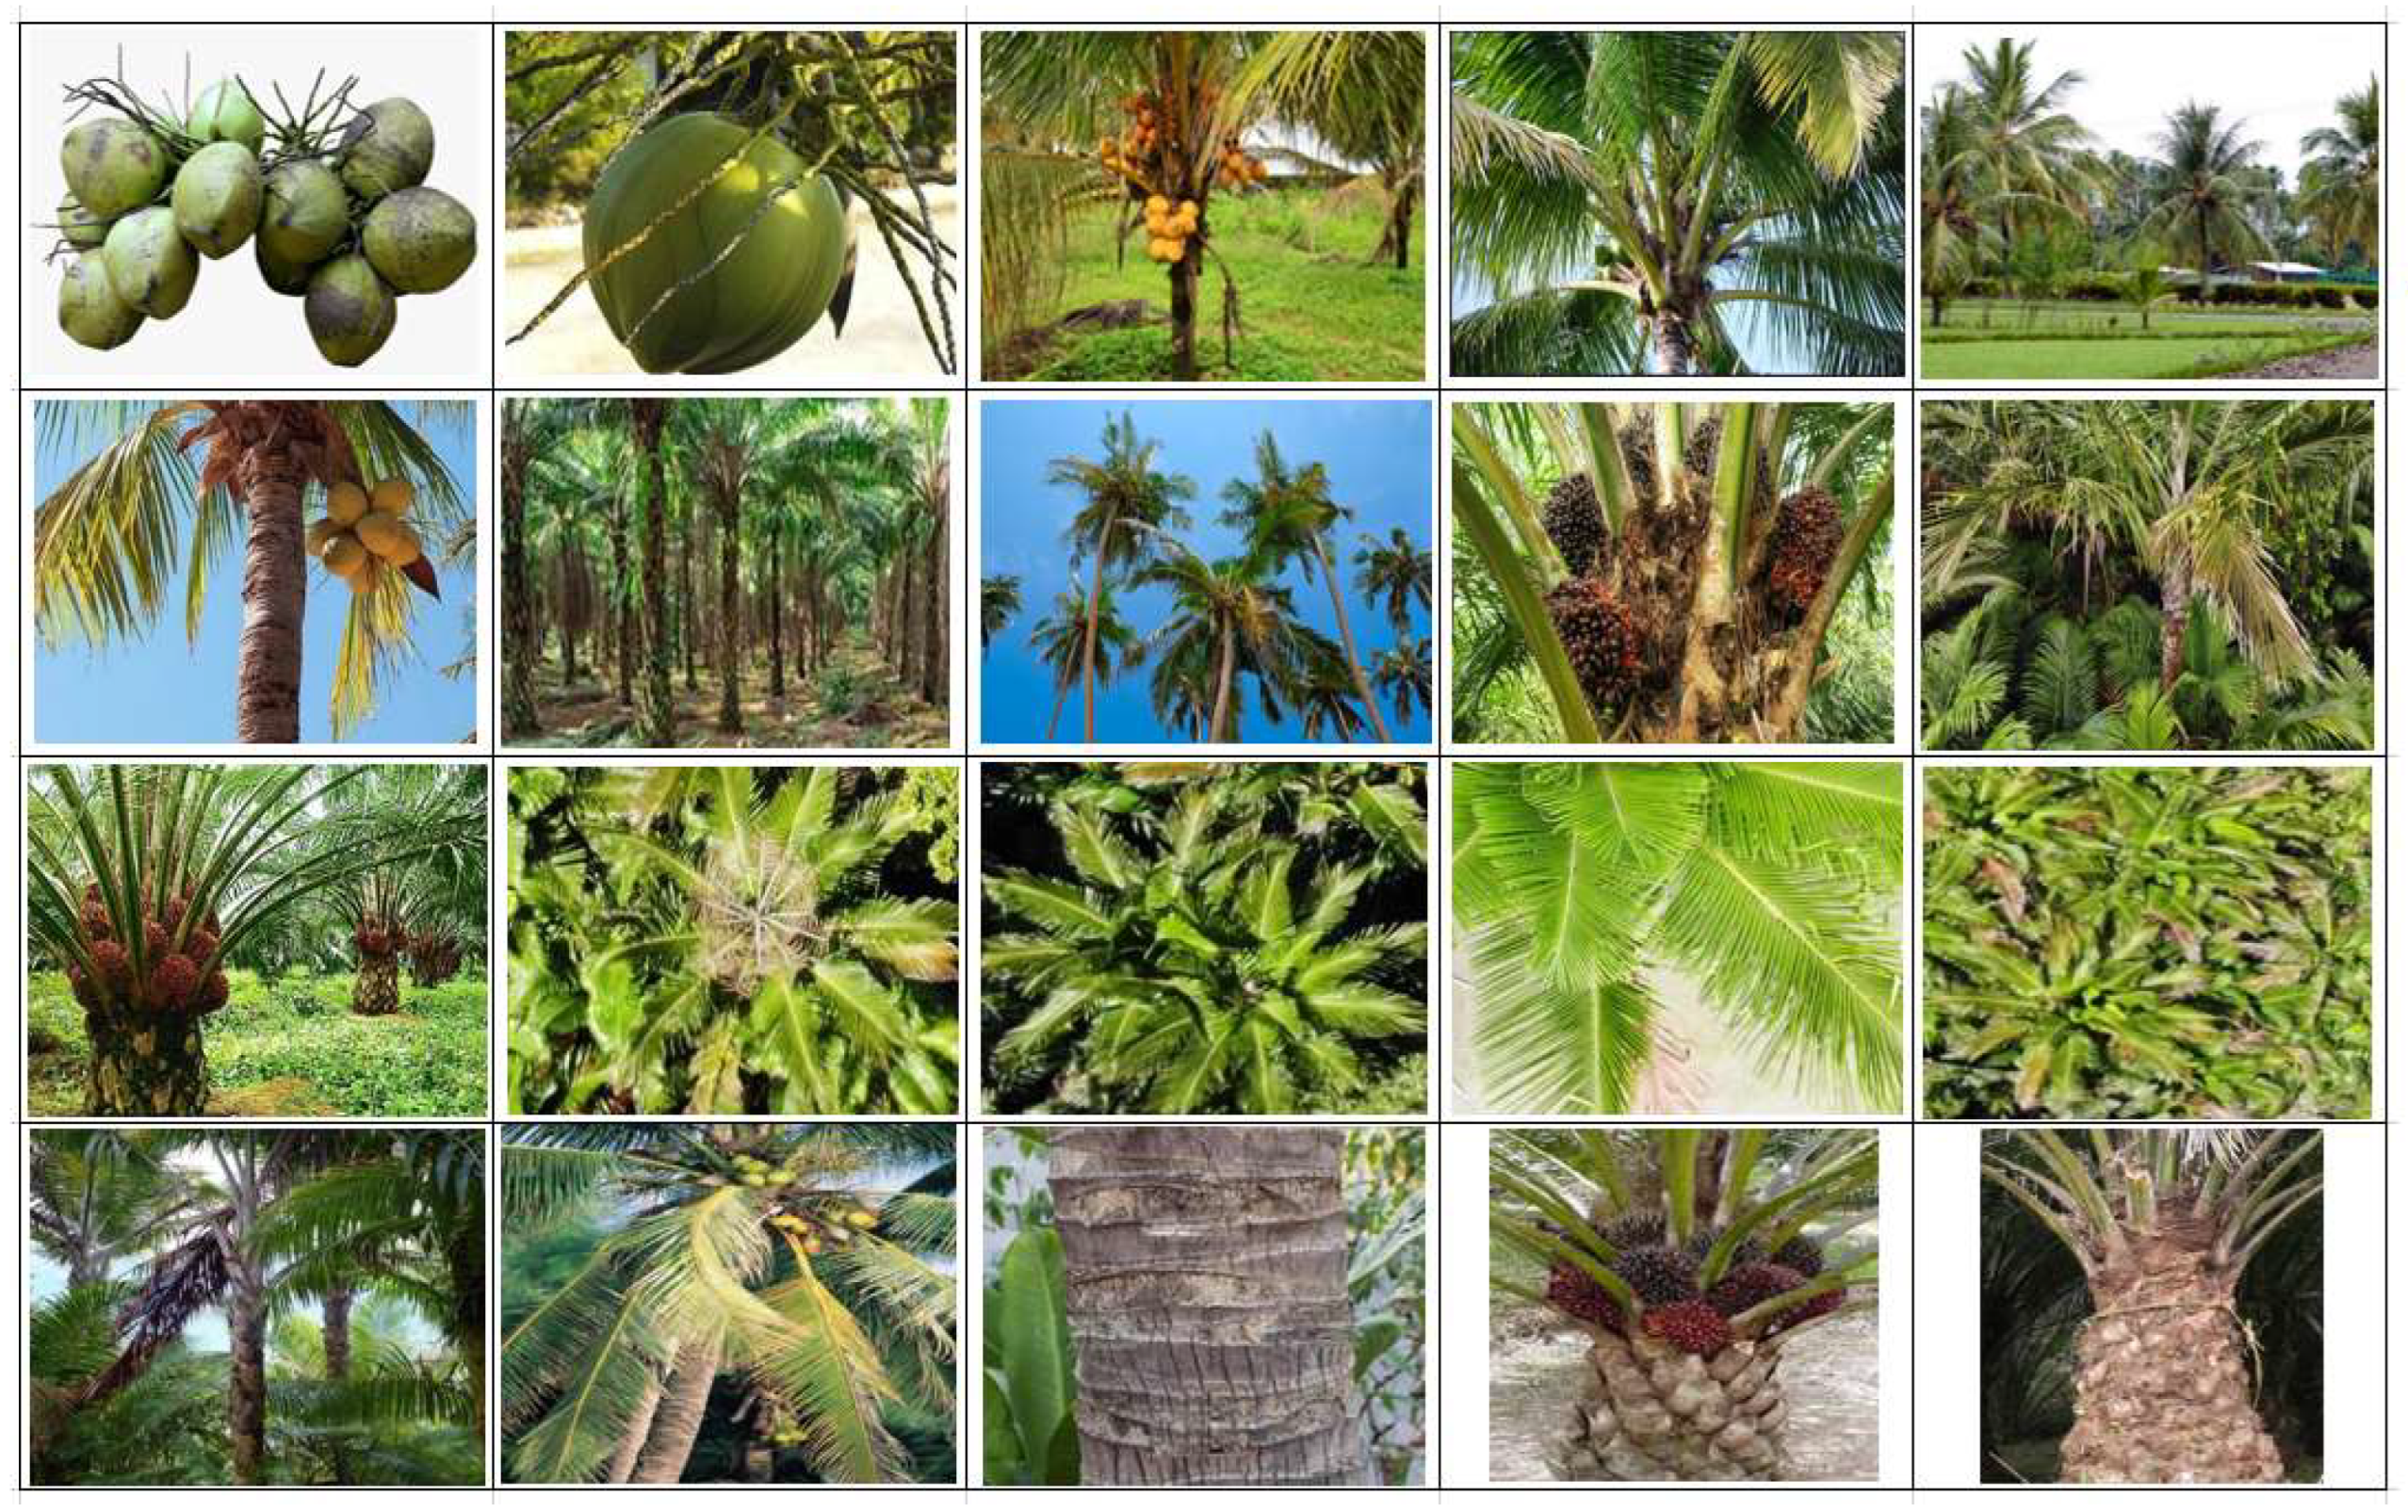
3.1. Dataset Development
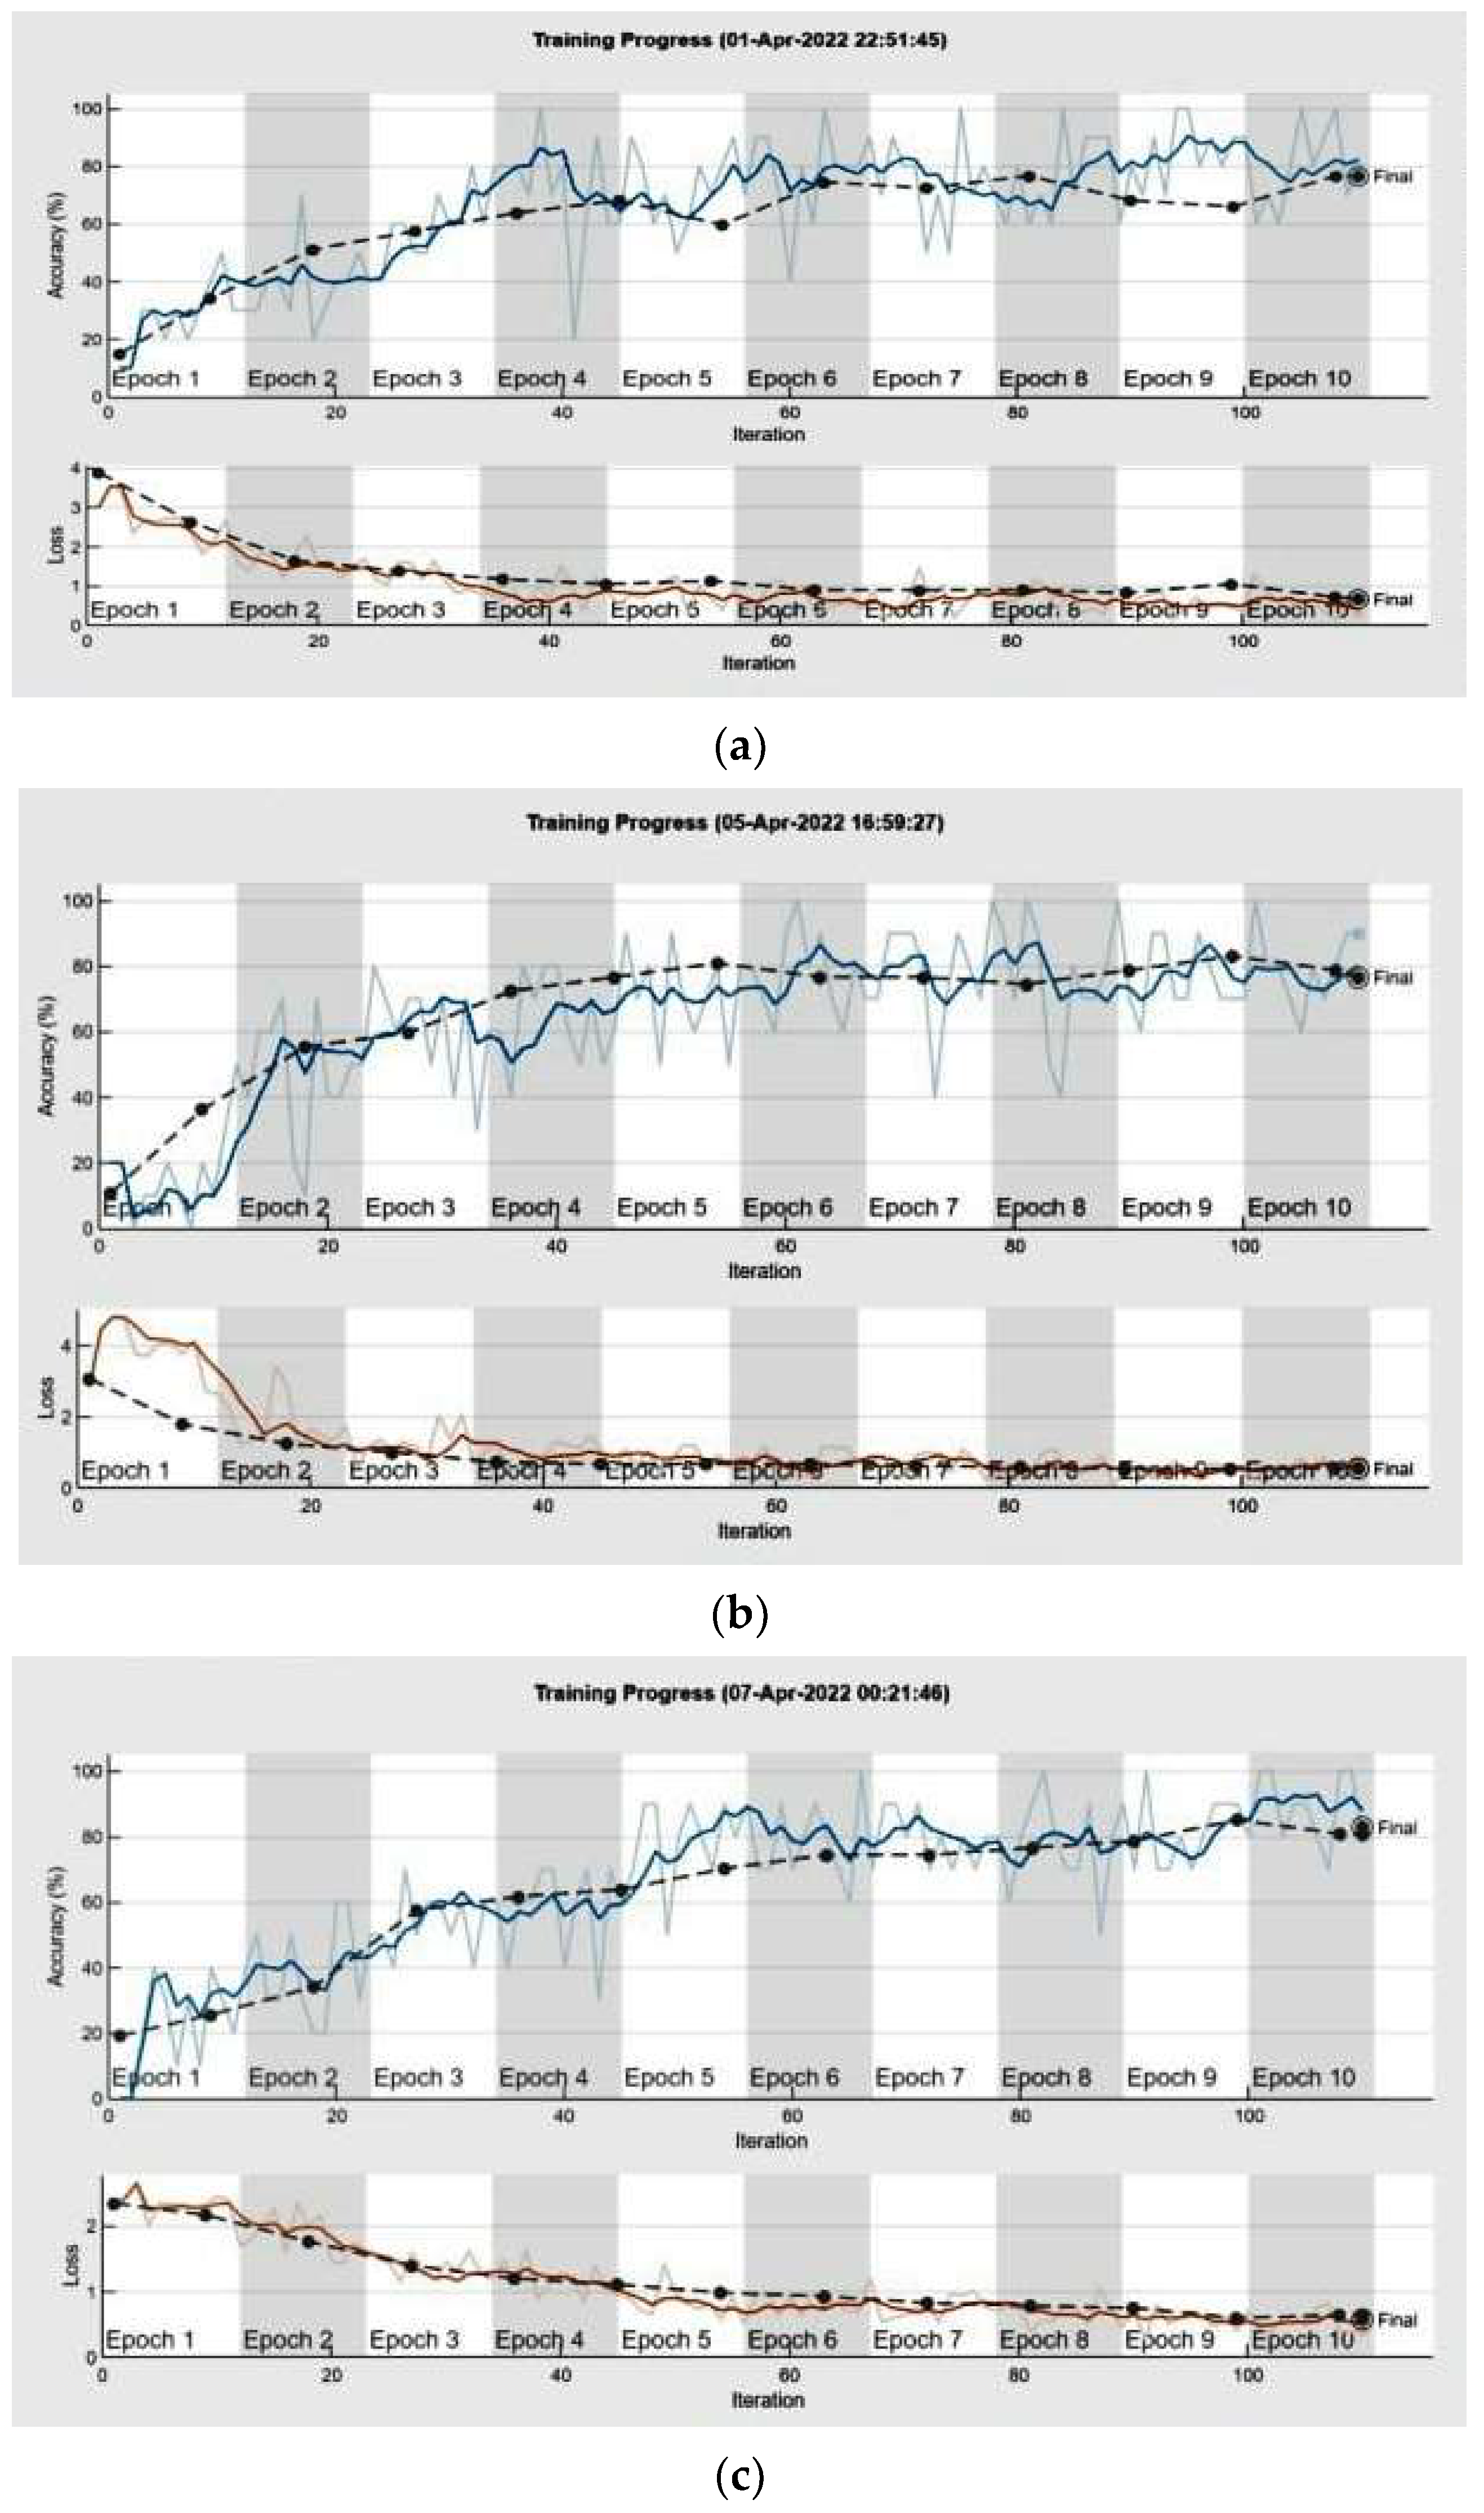
3.2. Training and Testing Data Performance
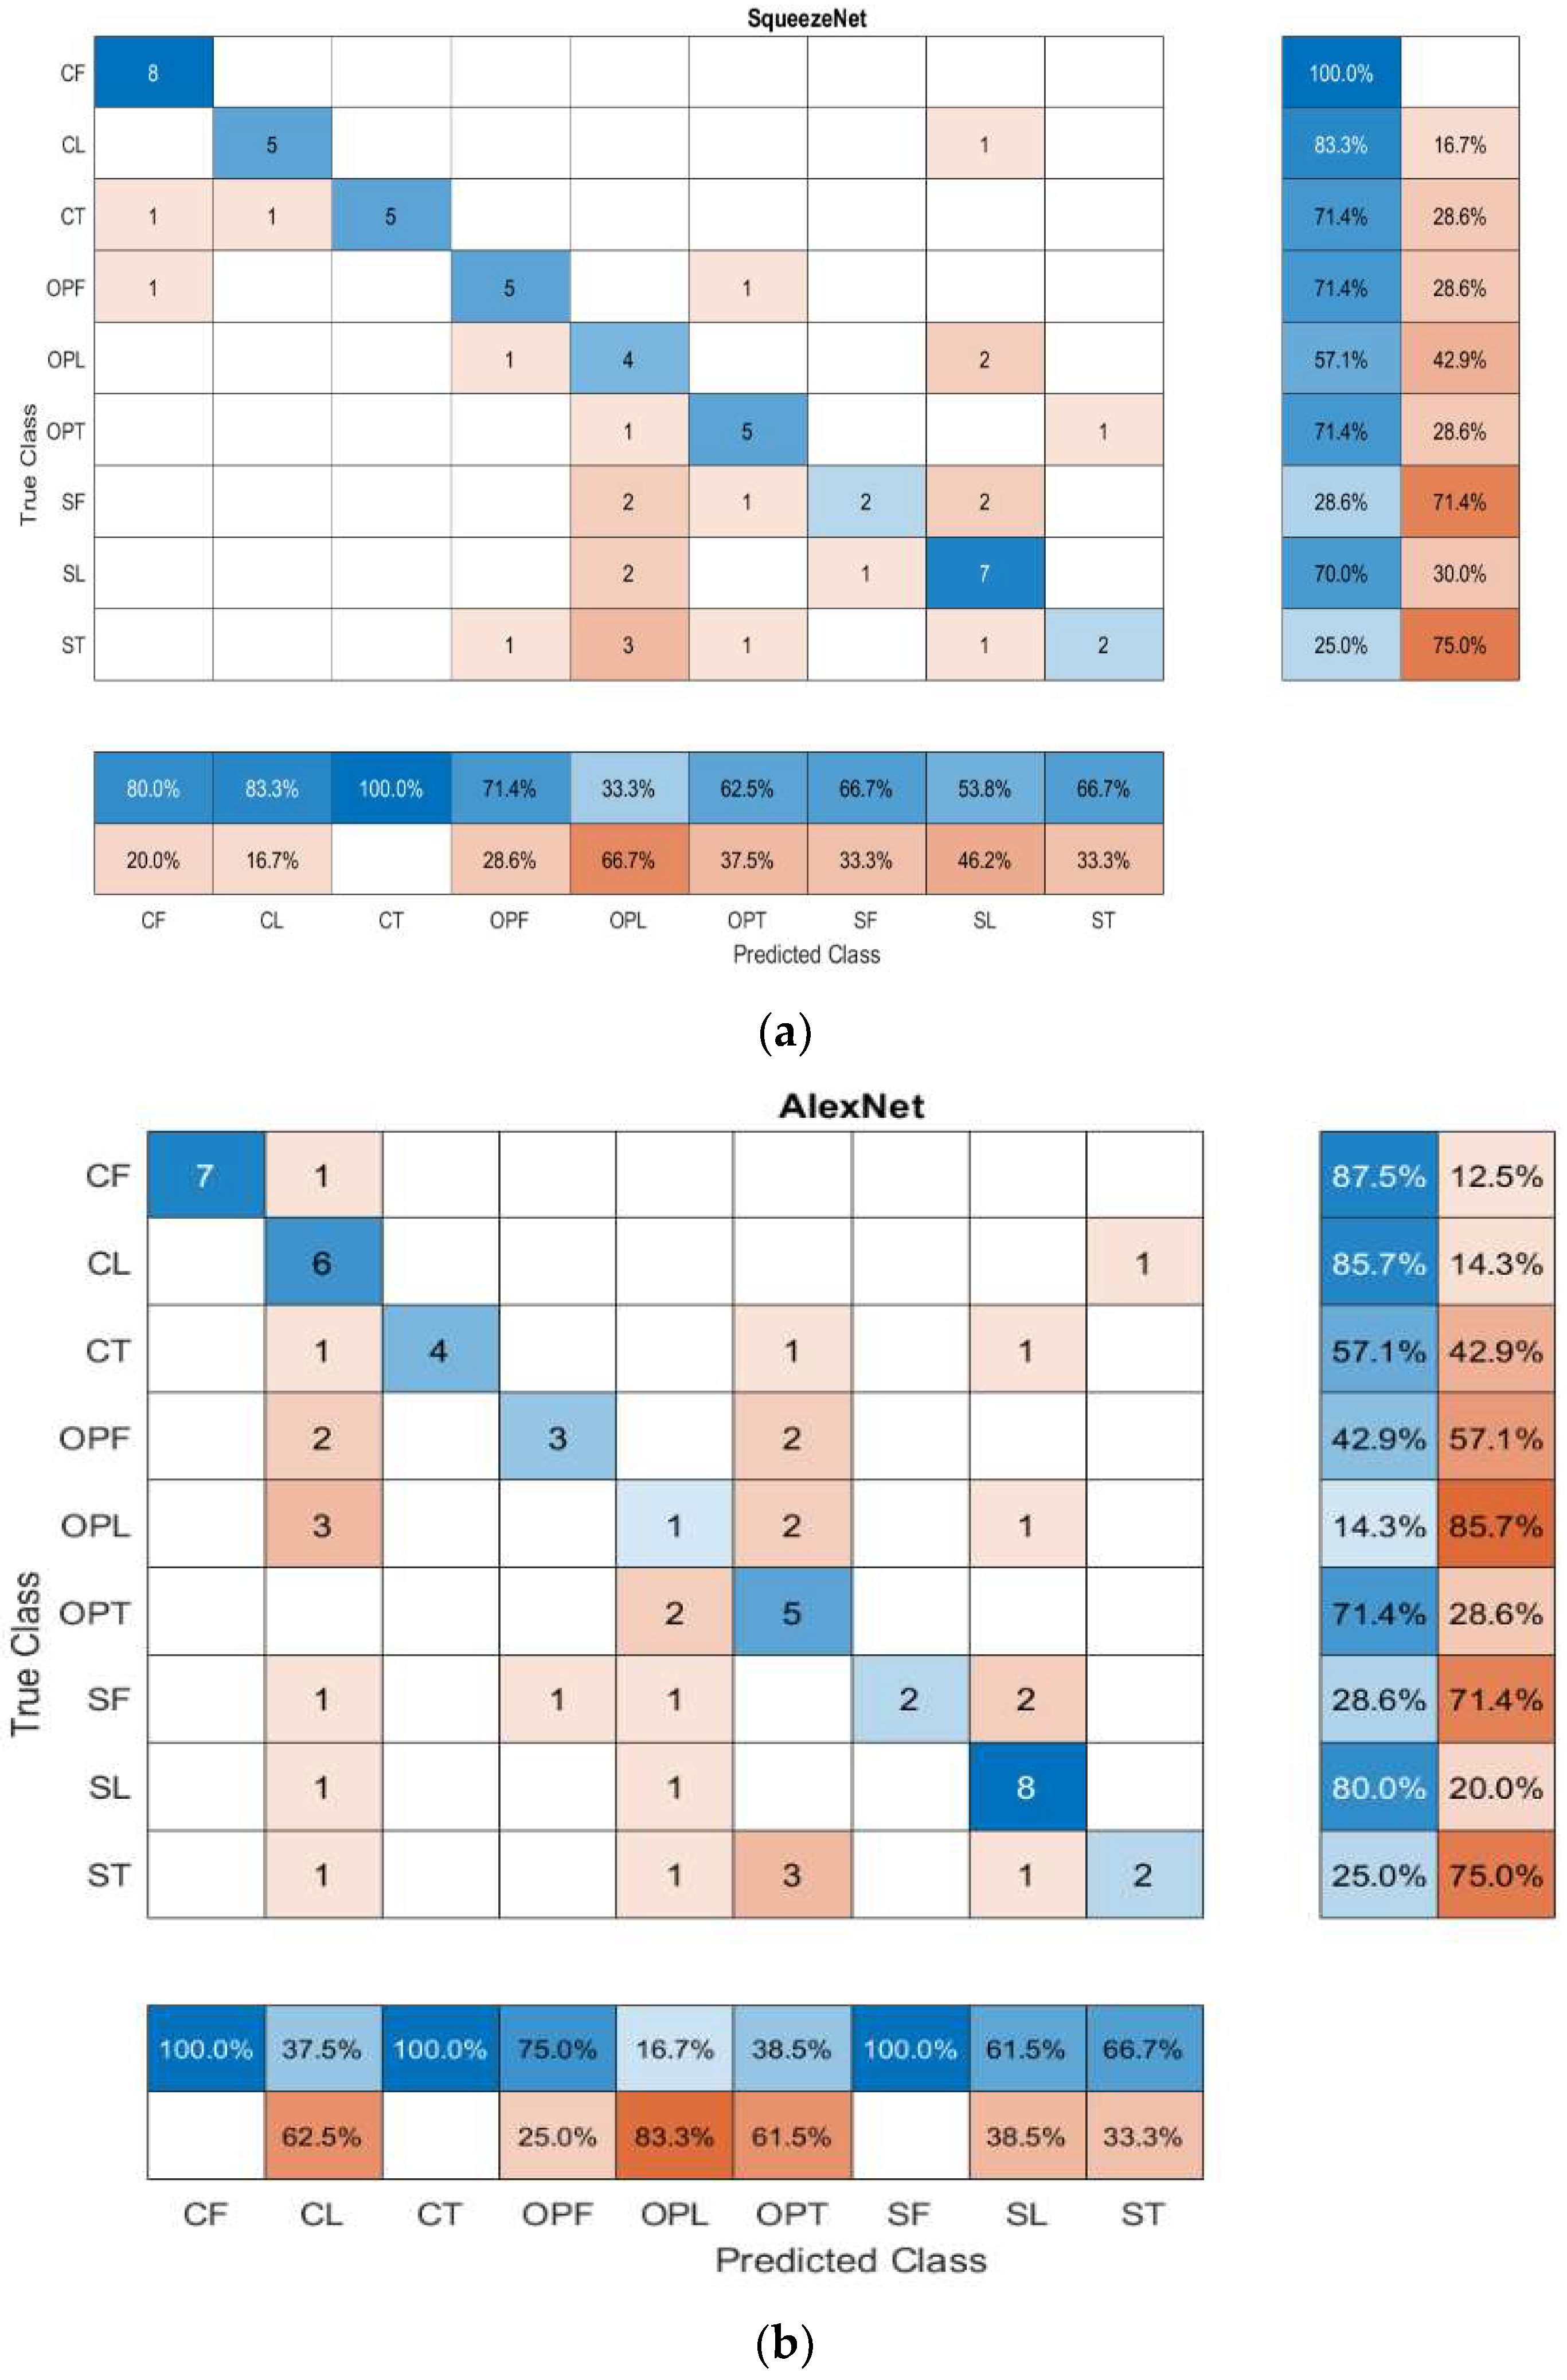
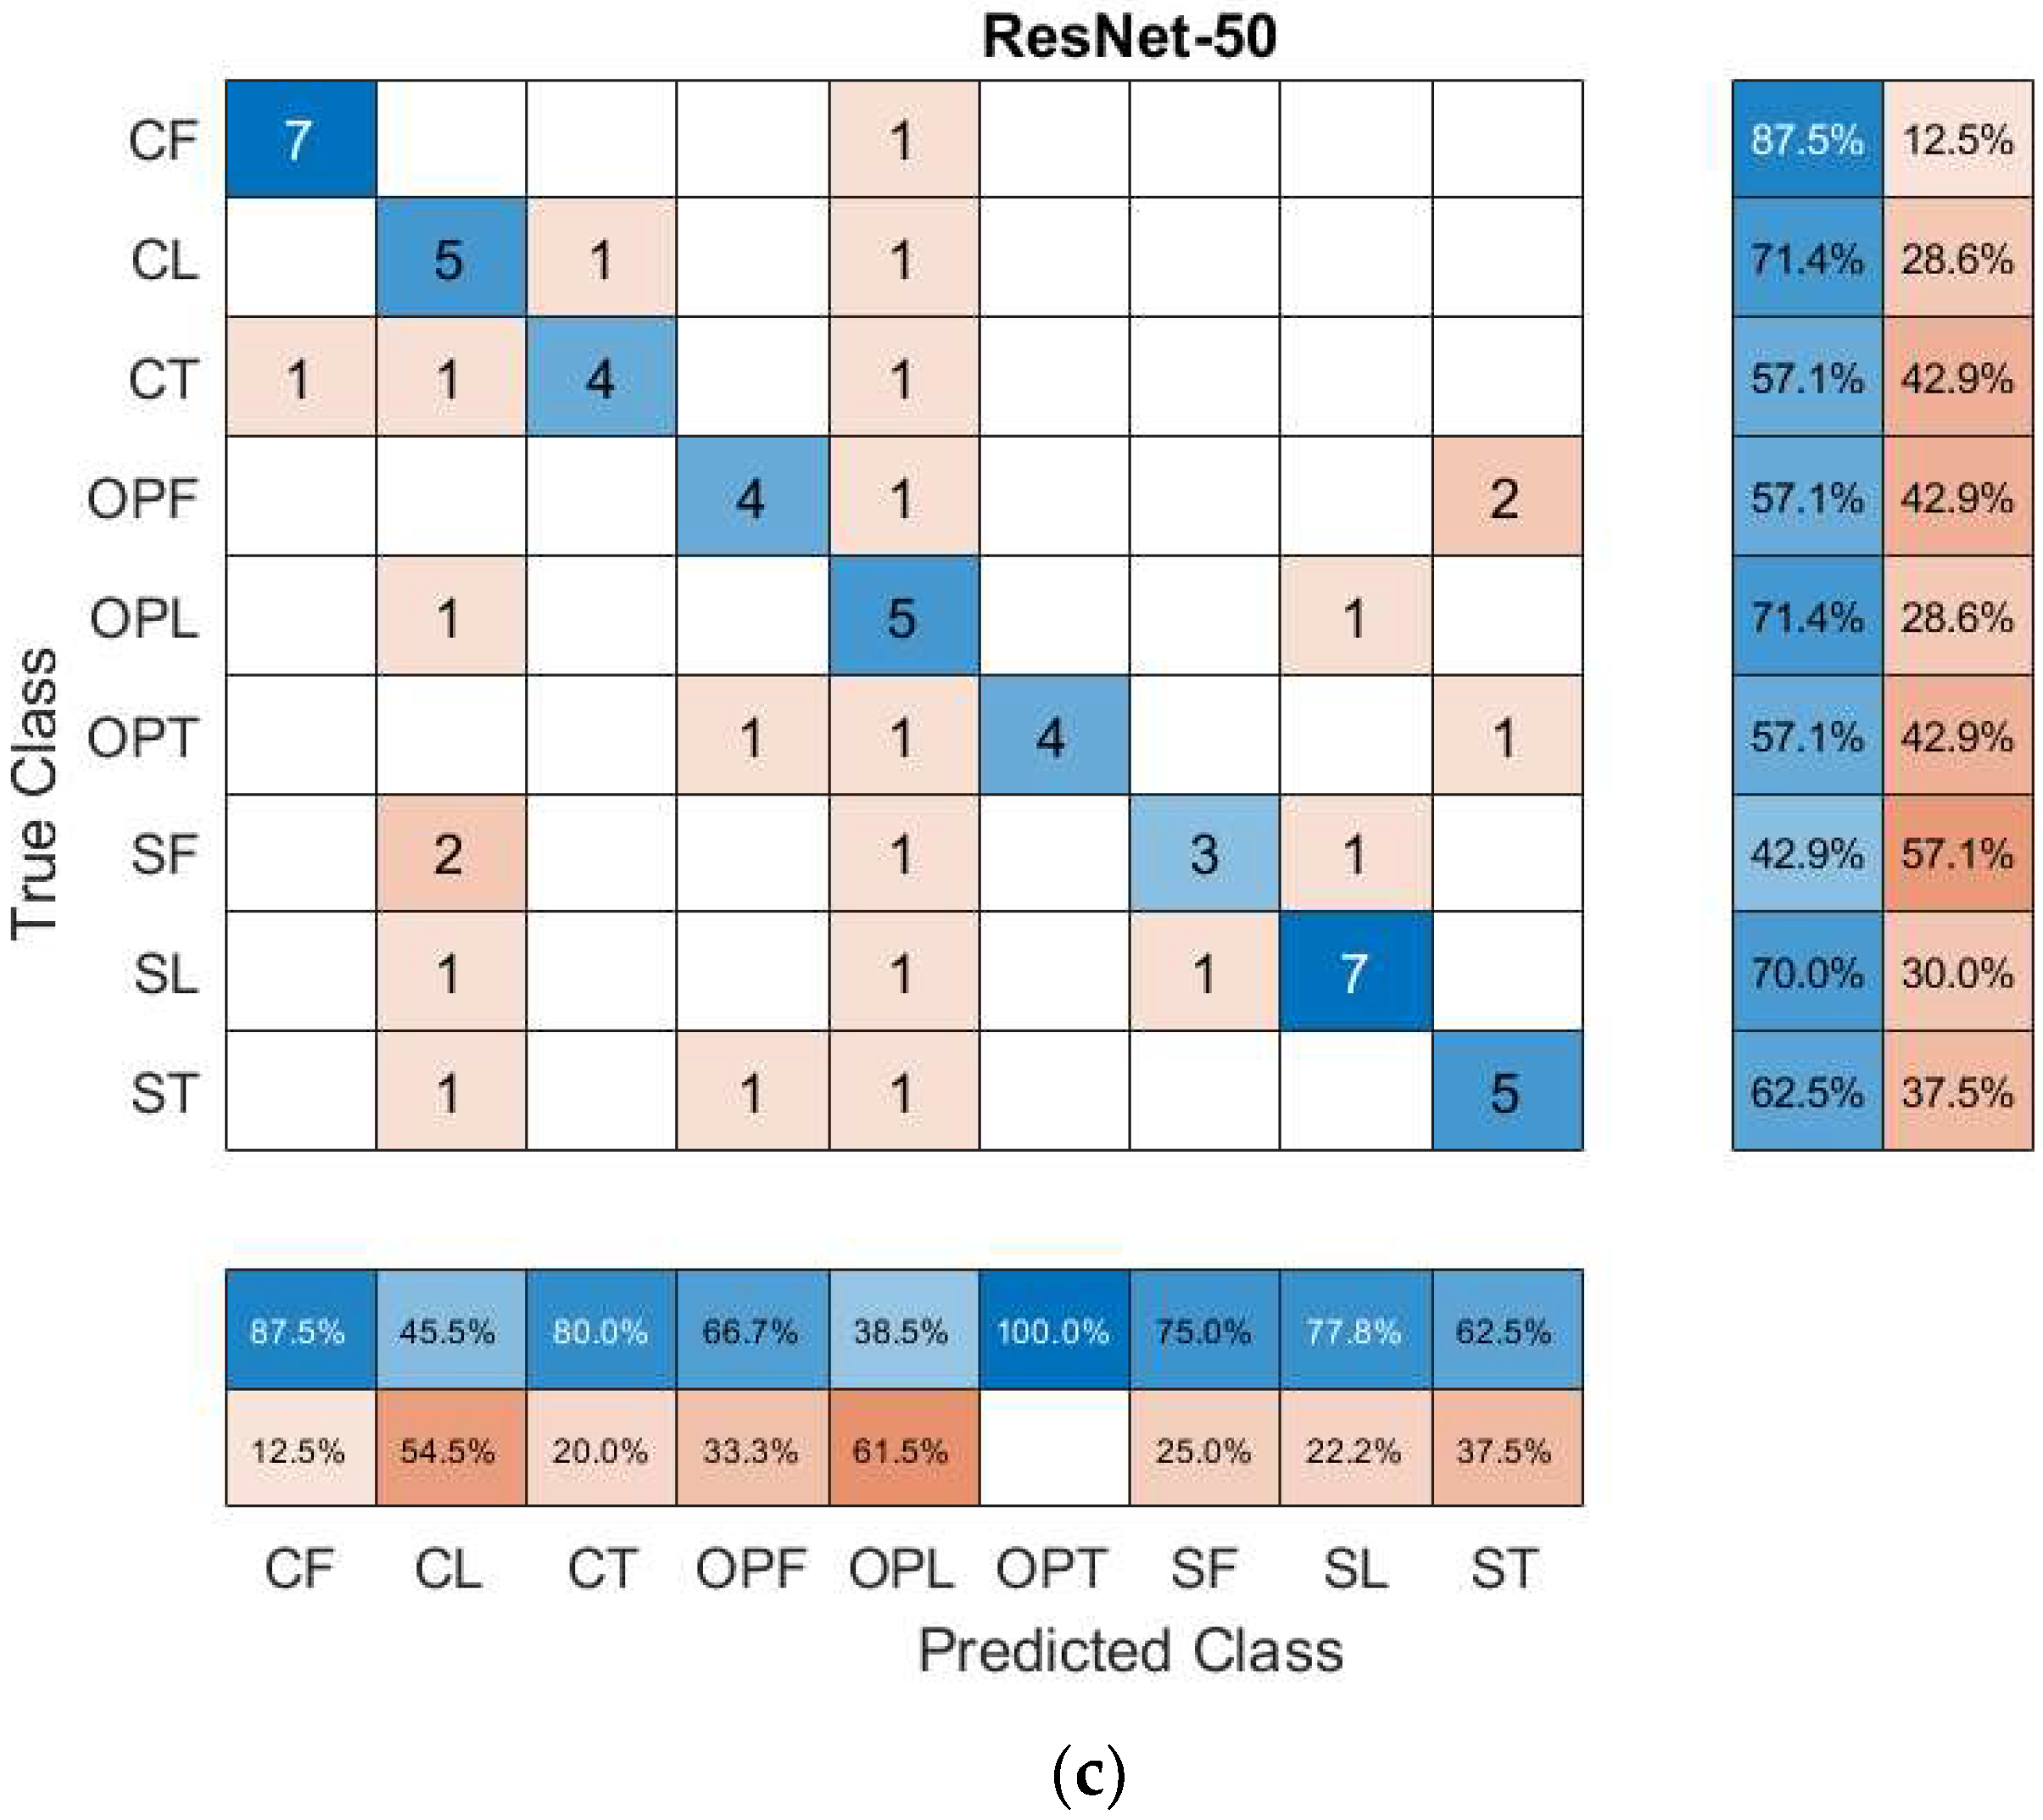
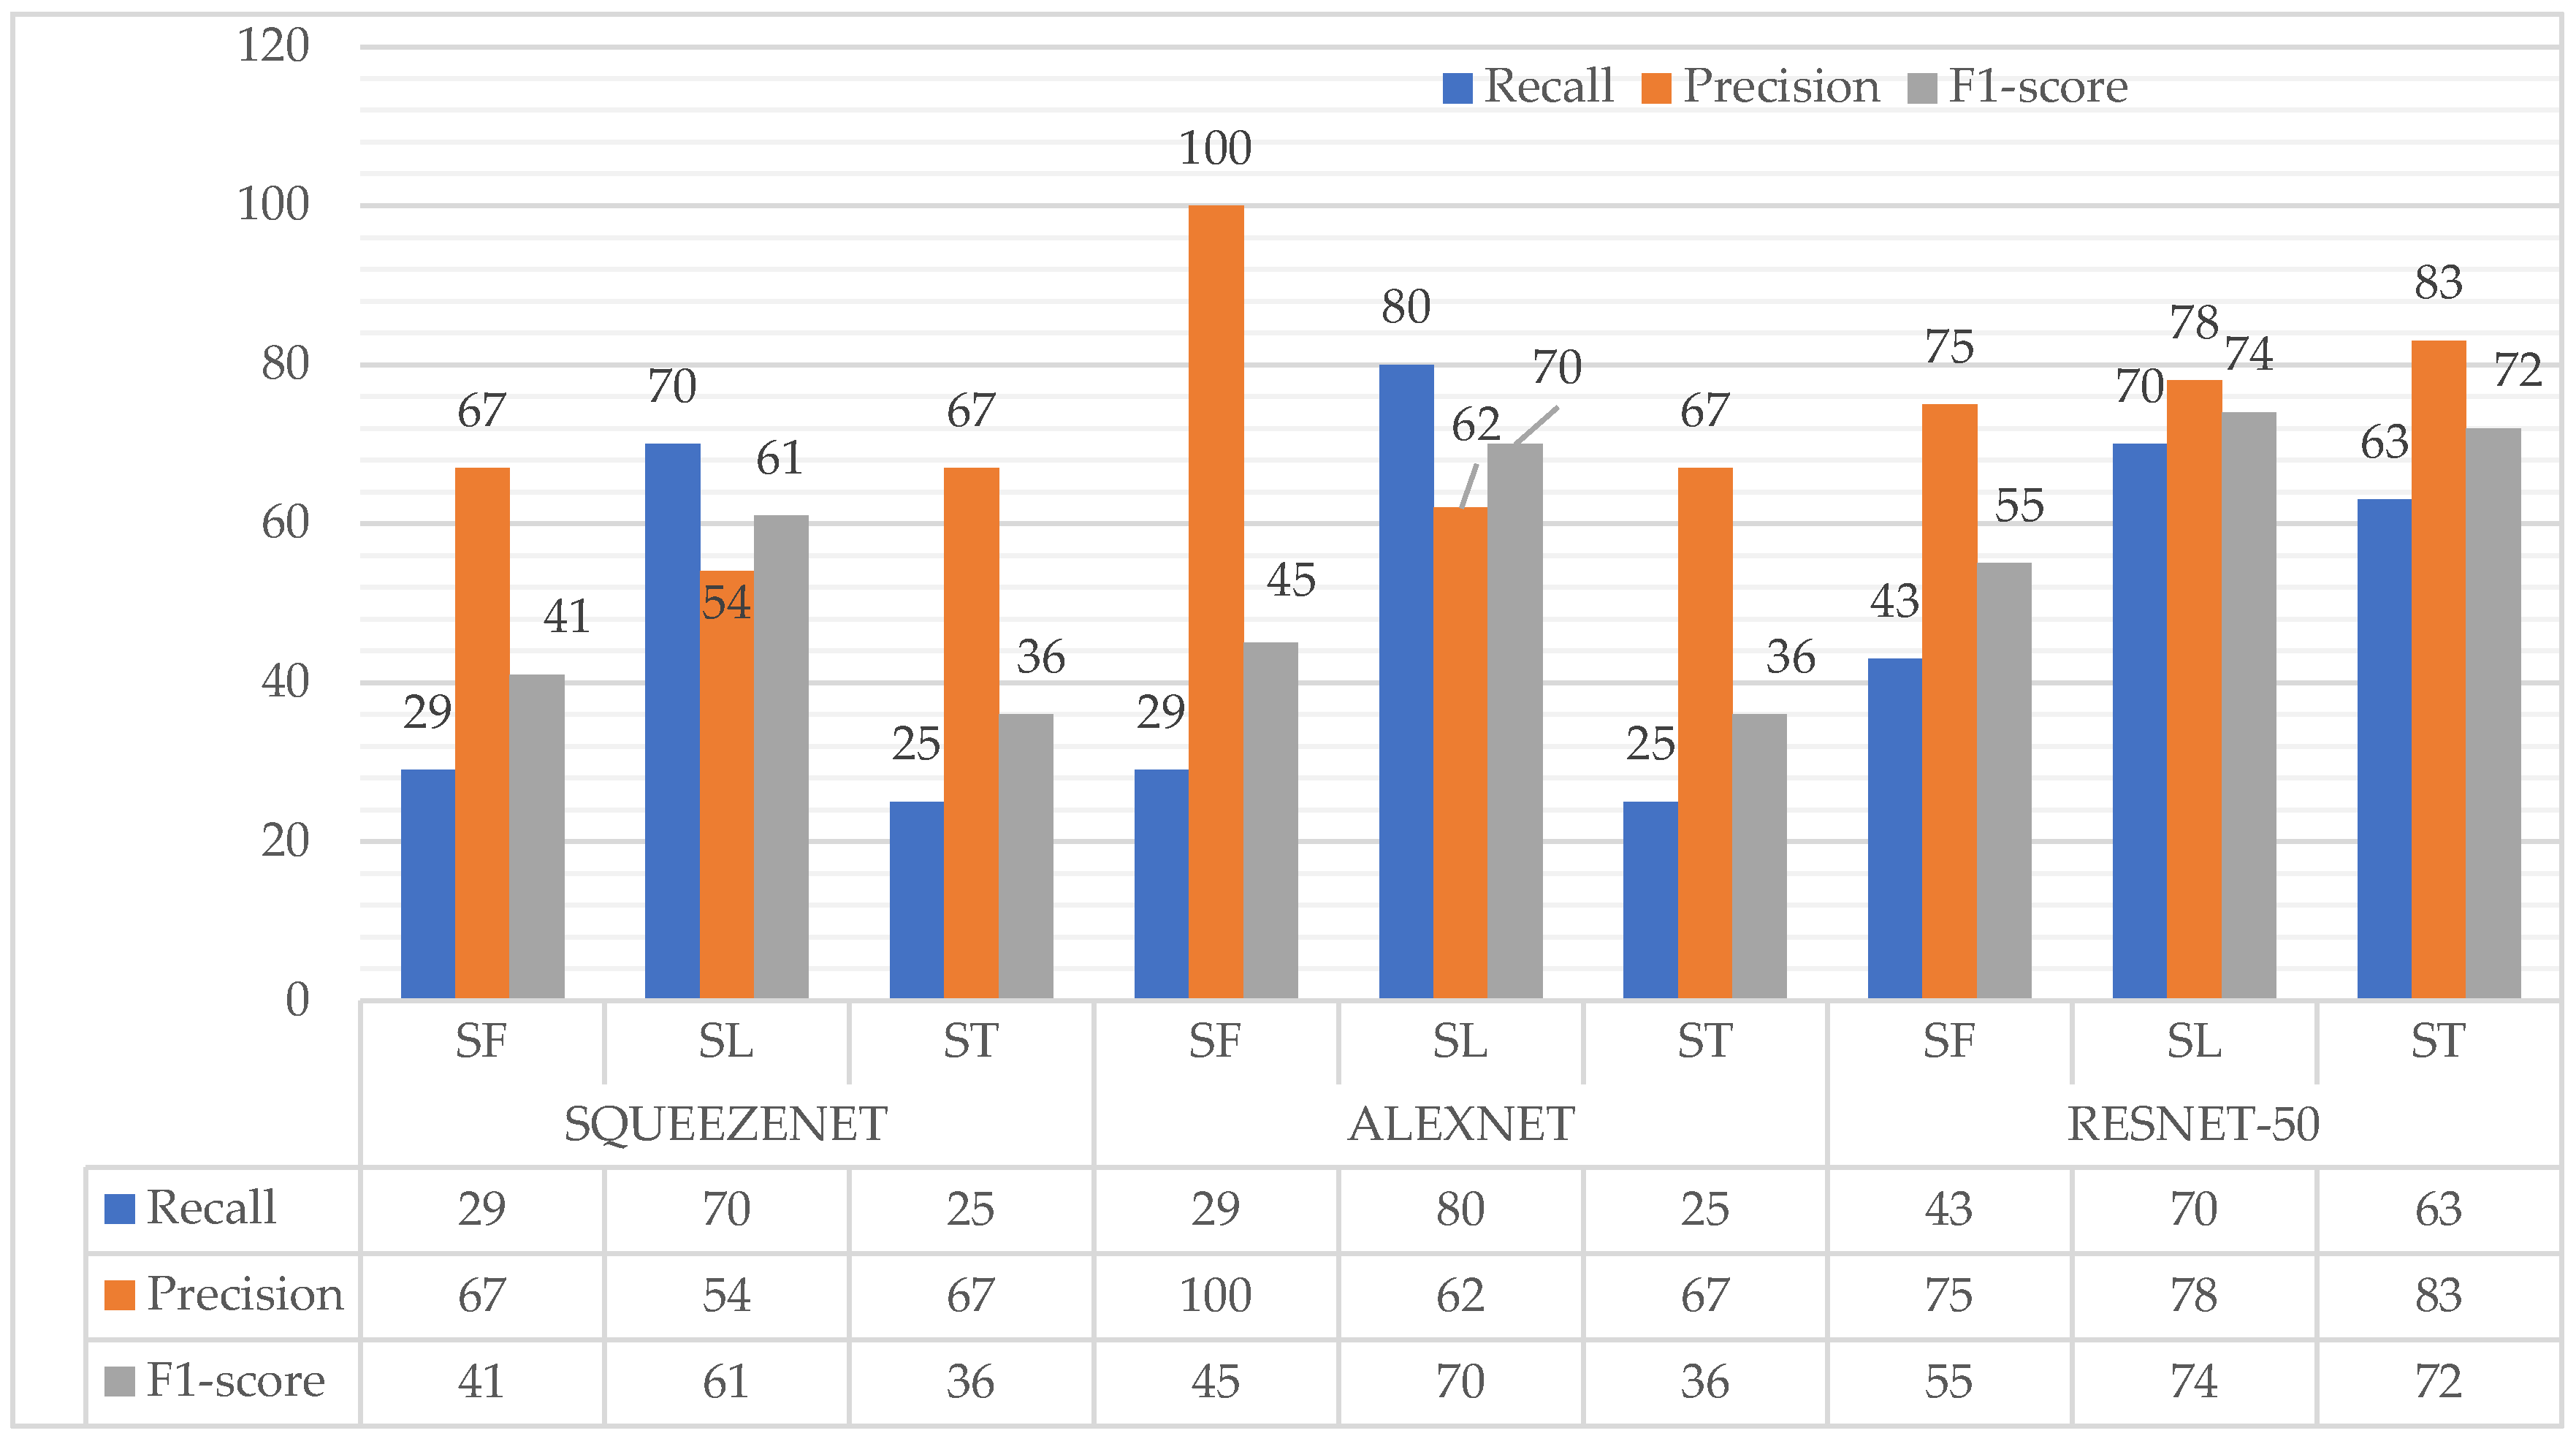
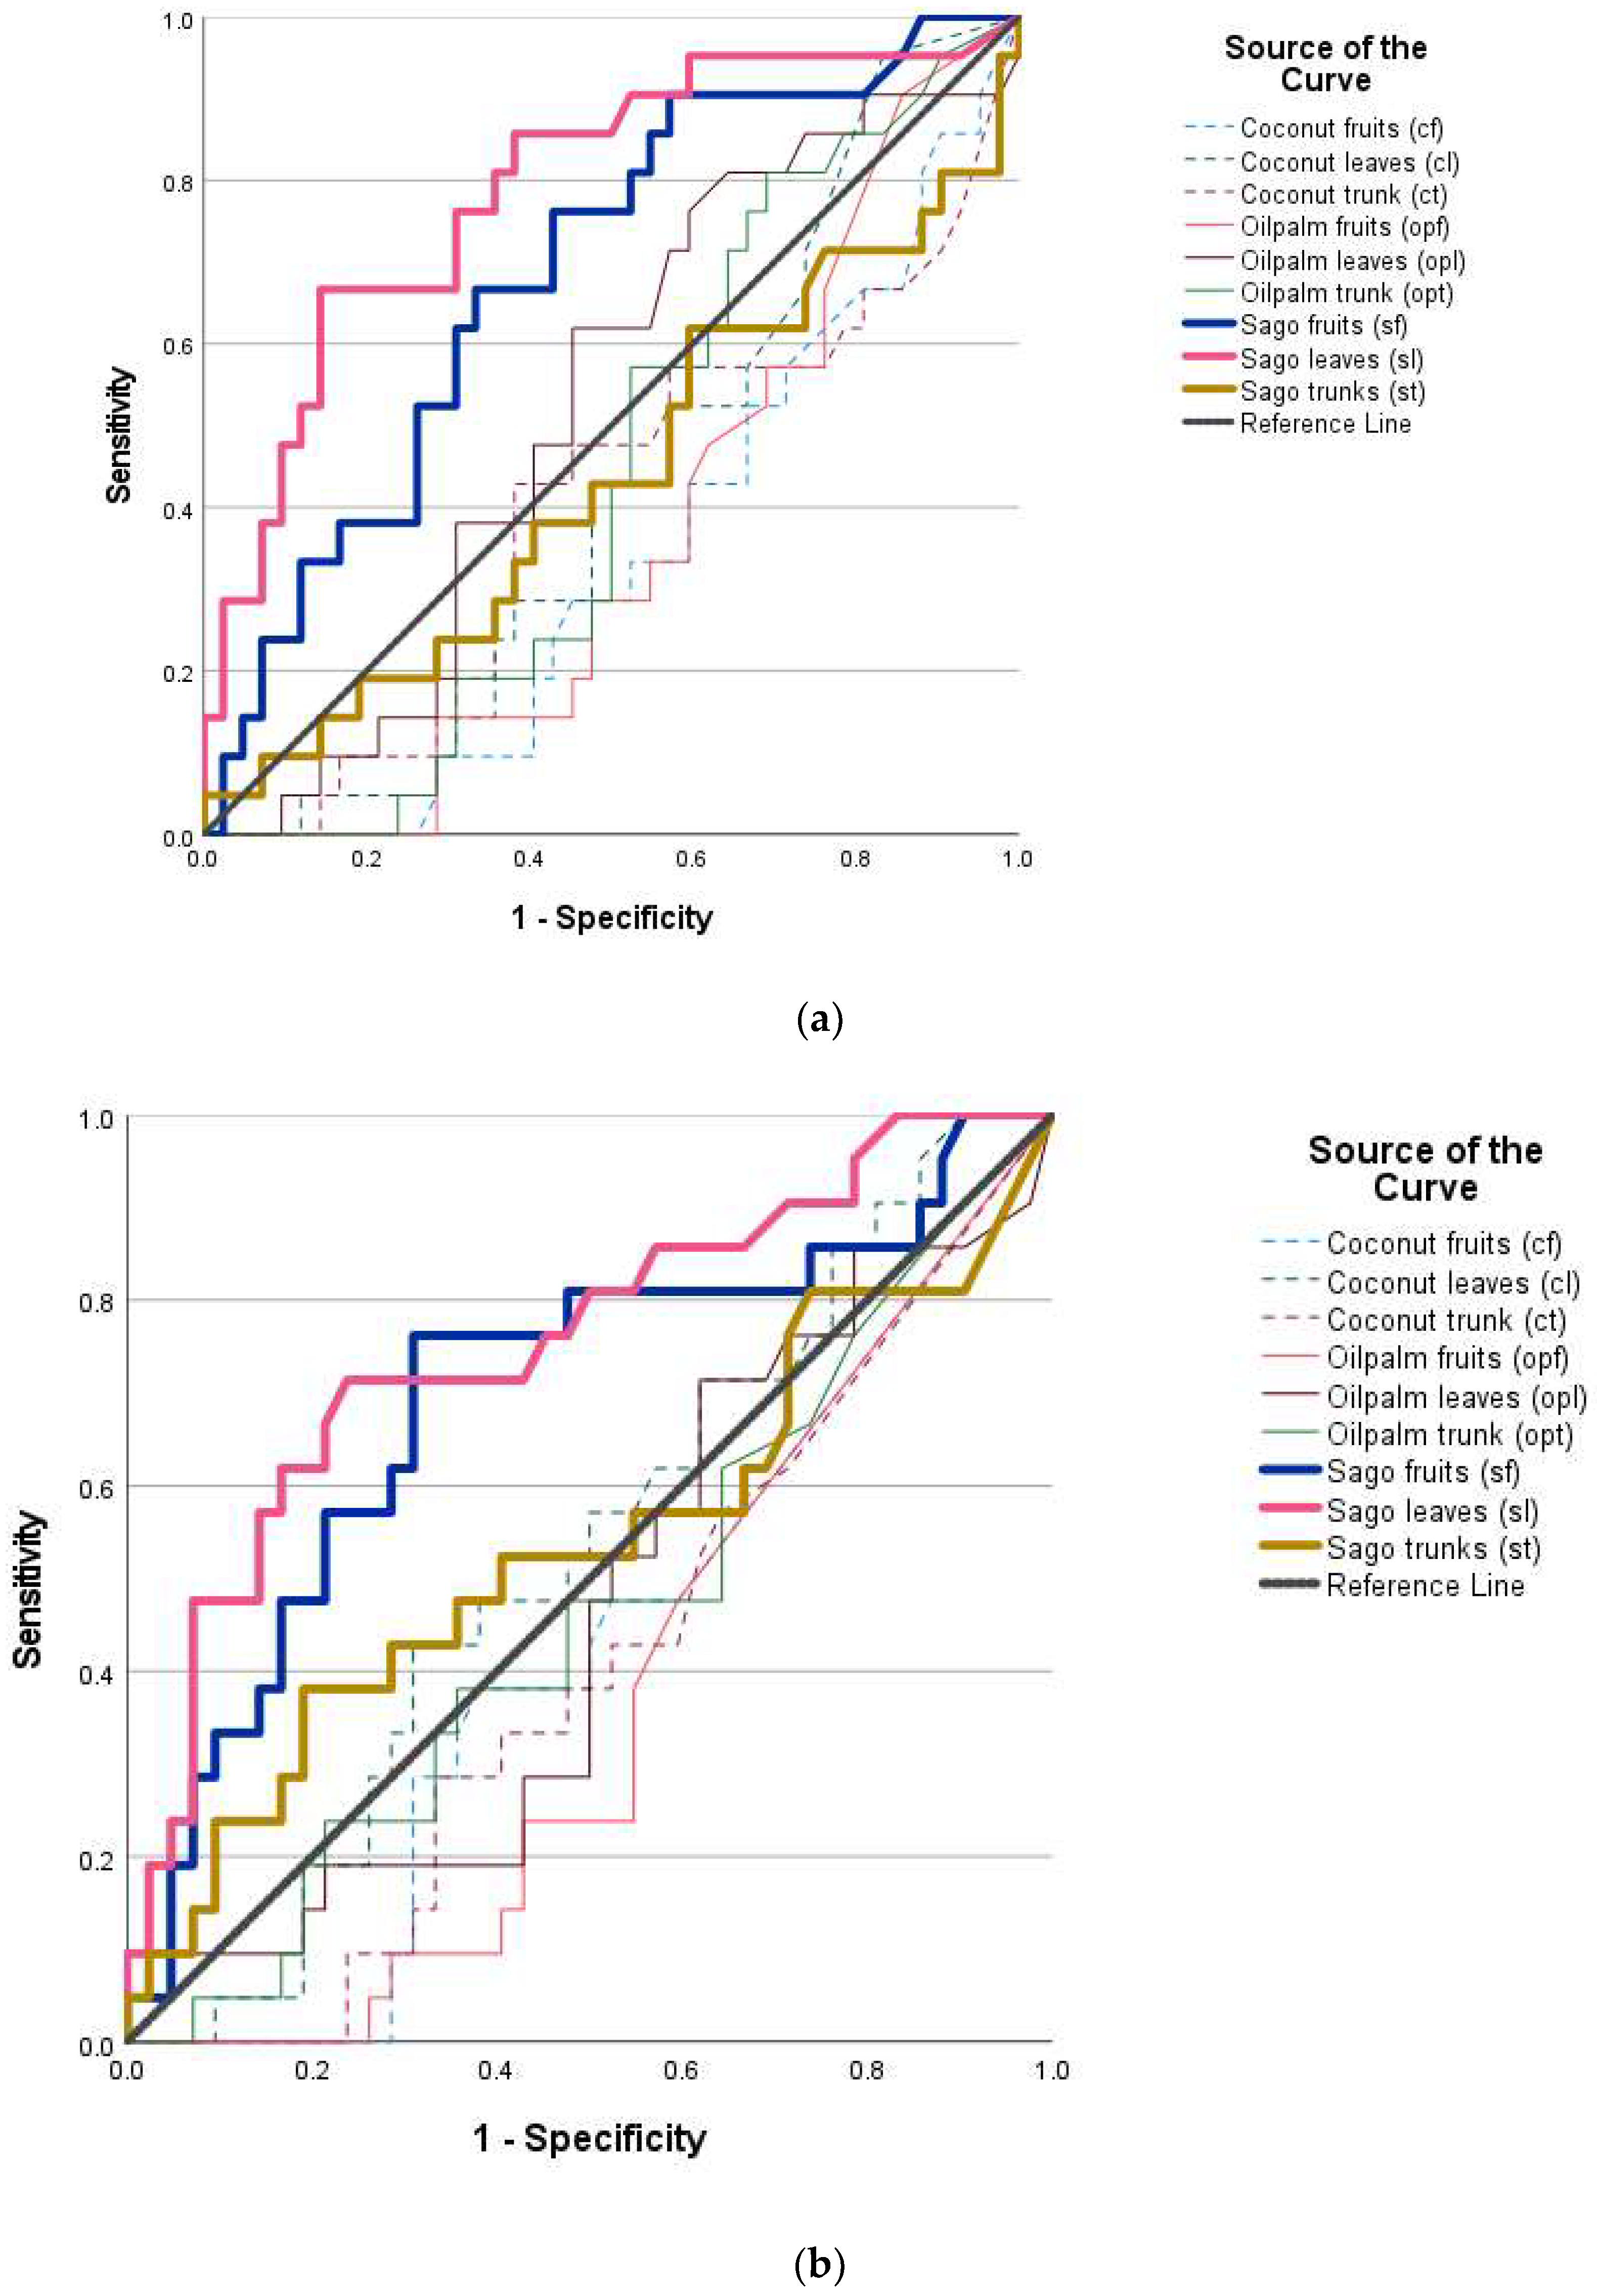
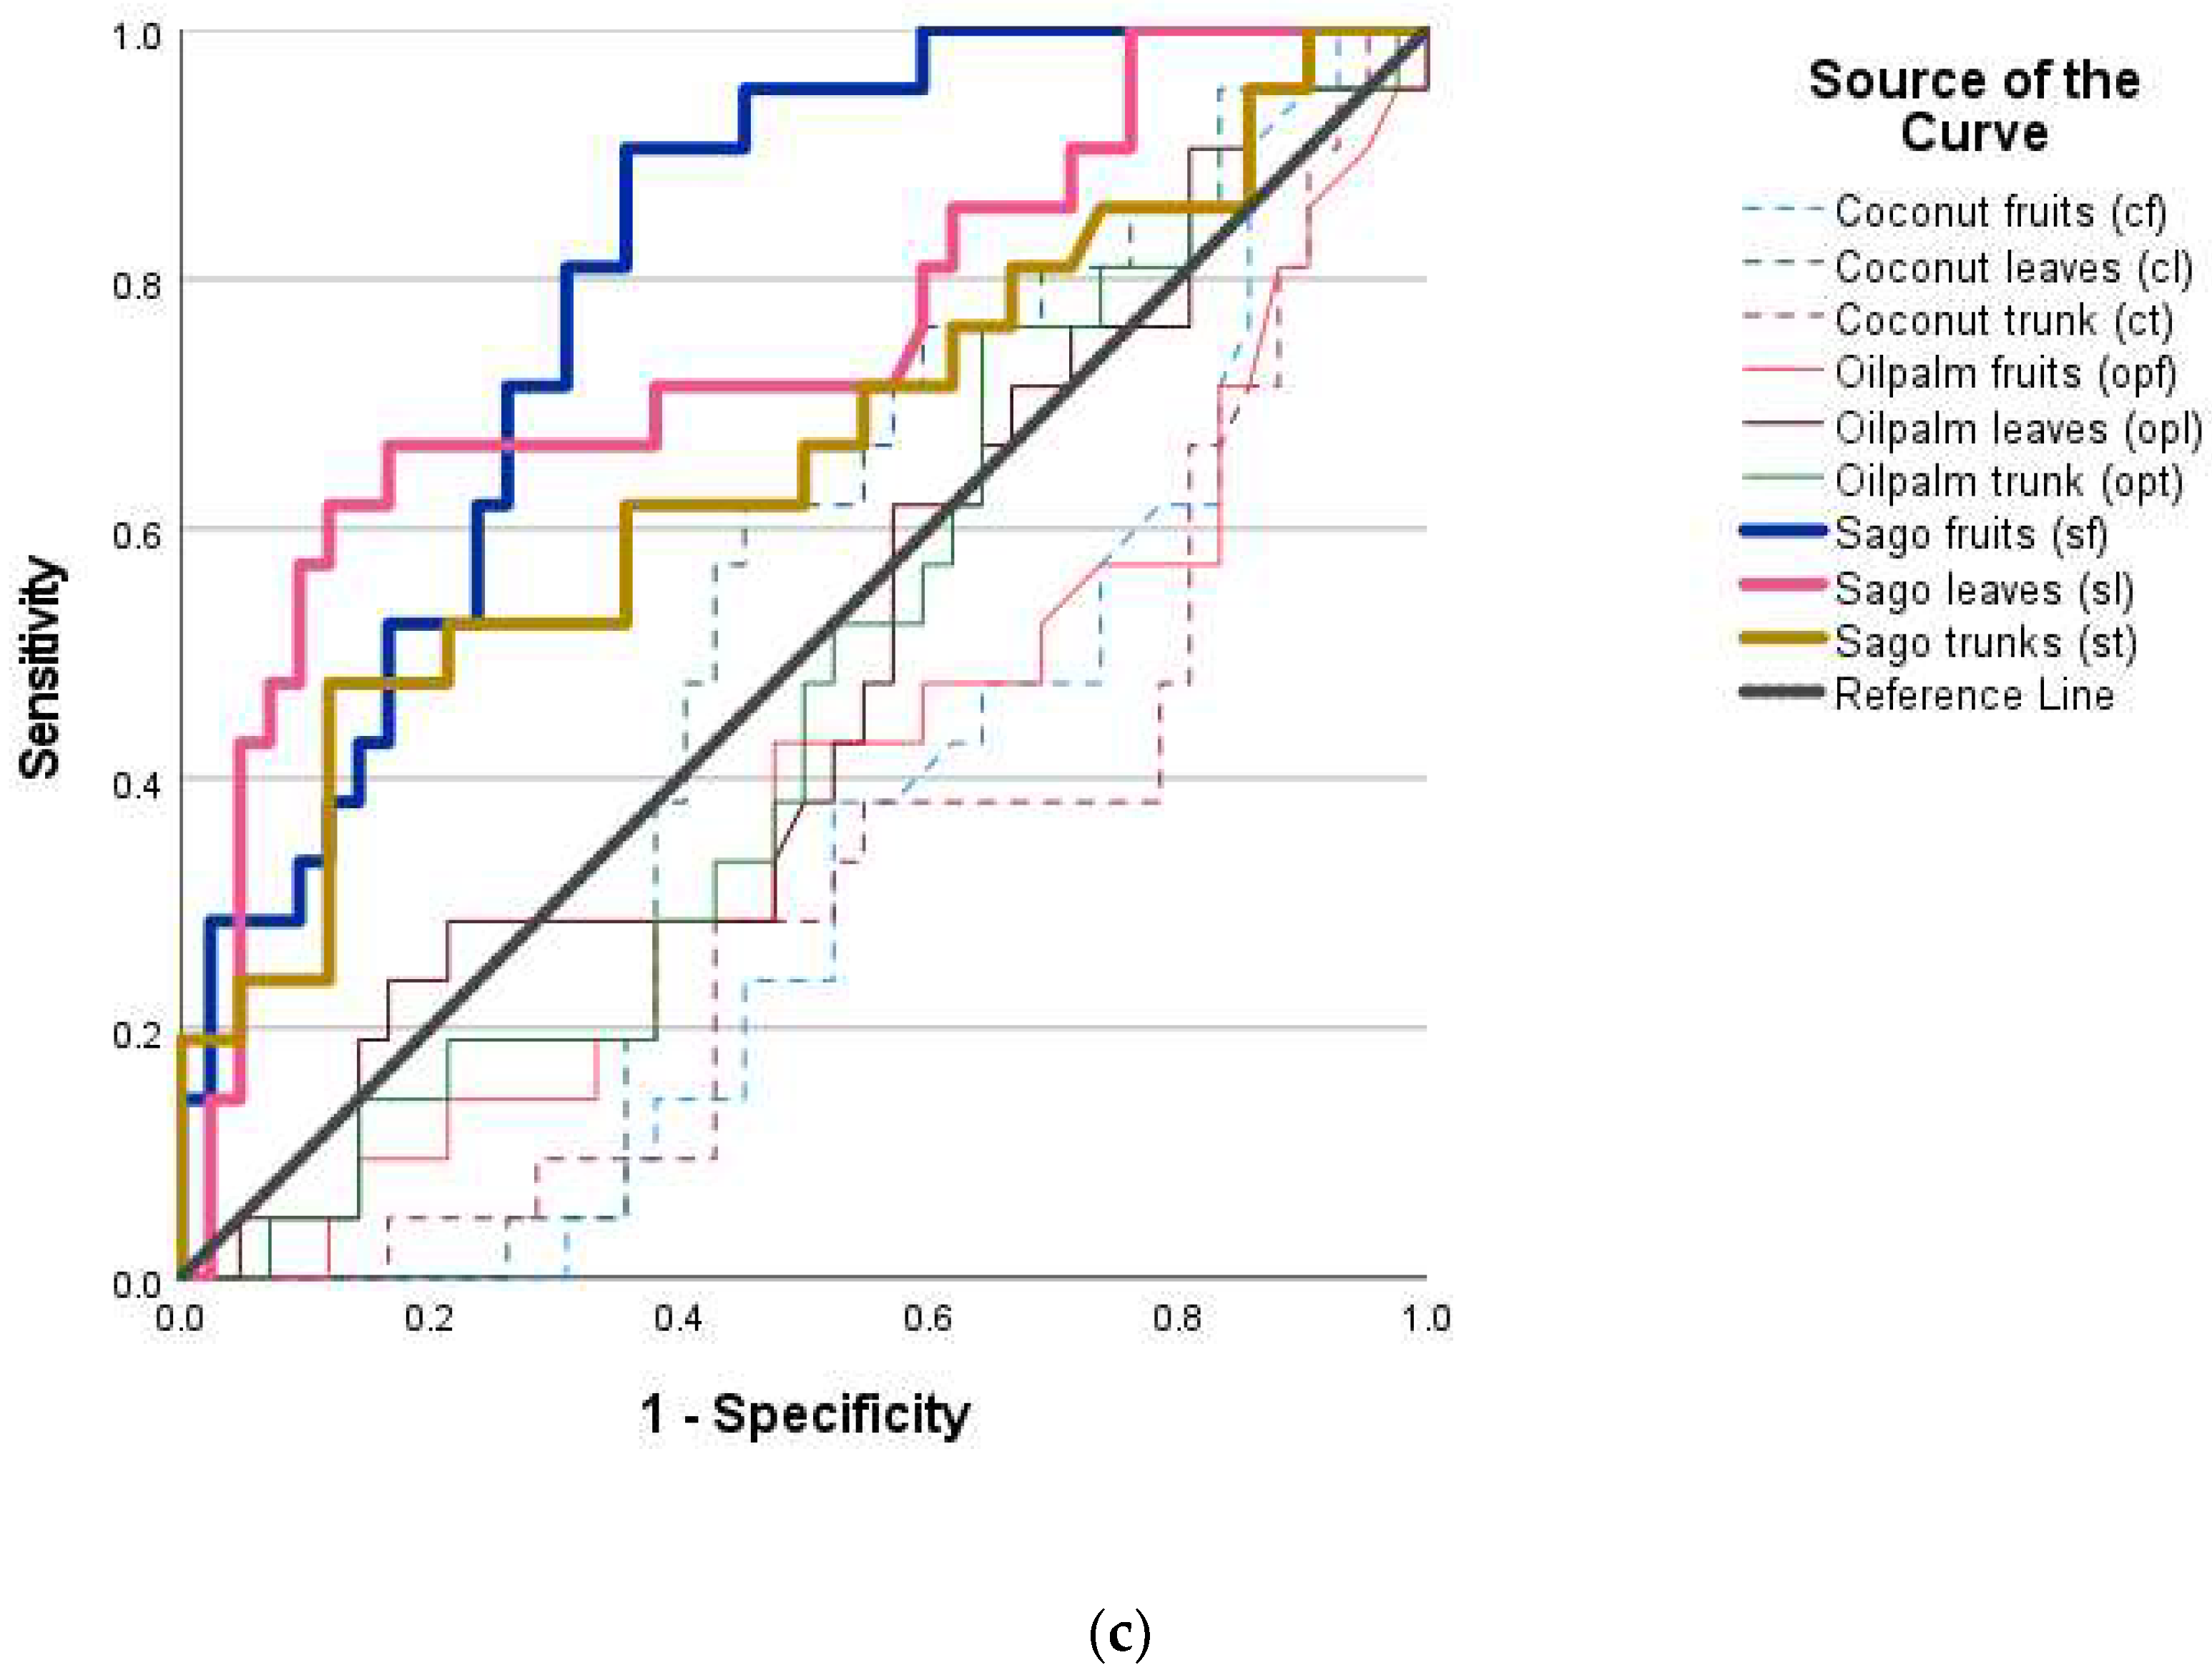
3.3. Model Performance Evaluation
4. Discussion
5. Conclusions
Author Contributions
Funding
Data Availability Statement
Acknowledgments
Conflicts of Interest
Appendix A

| Index | Specification |
|---|---|
| Dimensions | 42.4 × 35.4 × 11 cm |
| Battery (life and weight) | Li-Ion 7100 mAh 82 Wh; 40 min; 360 g |
| Video resolution | 6K (5472 × 3076) |
| ISO range | Video-ISO 100-3200 Cr/100-6400 Manual, Photo-ISO100-3200 Car/100-12800 Manual |
| Camera resolution | 20 Mpx; camera chip: 1′ CMOS IMX383 Sony |
| Maximum flight time | 40 min (single charge) |
| Field of view | 82° |
| Gesture control, Wi-Fi, GPS, controller control, Mobile App, homecoming, anti-collision sensors, automatic propeller stop | Provided |
| Speeds | 72 km/h to 5 km; winds of 62–74 km/h at up to 7000 m above sea level |

Appendix B


References
- Chua, S.N.D.; Kho, E.P.; Lim, S.F.; Hussain, M.H. Sago Palm (Metroxylon sagu) Starch Yield, Influencing Factors and Estimation from Morphological Traits. Adv. Mater. Process. Technol. 2021, 1–23. [Google Scholar] [CrossRef]
- Ehara, H.; Toyoda, Y.; Johnson, D.V. (Eds.) Sago Palm: Multiple Contributions to Food Security and Sustainable Livelihoods; Springer: Singapore, 2018; ISBN 978-981-10-5268-2. [Google Scholar]
- Hidayat, S.; Matsuoka, M.; Baja, S.; Rampisela, D.A. Object-Based Image Analysis for Sago Palm Classification: The Most Important Features from High-Resolution Satellite Imagery. Remote Sens. 2018, 10, 1319. [Google Scholar] [CrossRef]
- Lim, L.W.K.; Chung, H.H.; Hussain, H.; Bujang, K. Sago Palm (Metroxylon sagu Rottb.): Now and Beyond. Pertanika J. Trop. Agric. Sci. 2019, 42, 435–451. [Google Scholar]
- Letsoin, S.M.A.; Herak, D.; Rahmawan, F.; Purwestri, R.C. Land Cover Changes from 1990 to 2019 in Papua, Indonesia: Results of the Remote Sensing Imagery. Sustainability 2020, 12, 6623. [Google Scholar] [CrossRef]
- Jonatan, N.J.; Ekayuliana, A.; Dhiputra, I.M.K.; Nugroho, Y.S. The Utilization of Metroxylon sago (Rottb.) Dregs for Low Bioethanol as Fuel Households Needs in Papua Province Indonesia. KLS 2017, 3, 150. [Google Scholar] [CrossRef]
- Nanlohy, L.H.; Gafur, M.A. Potensi Pati Sagu Dan Pendapatan Masyarakat Di Kampung Mega Distrik Mega Kabupaten Sorong. Median 2020, 12, 21. [Google Scholar] [CrossRef]
- Pandey, A.; Jain, K. An Intelligent System for Crop Identification and Classification from UAV Images Using Conjugated Dense Convolutional Neural Network. Comput. Electron. Agric. 2022, 192, 106543. [Google Scholar] [CrossRef]
- Tahir, A.; Munawar, H.S.; Akram, J.; Adil, M.; Ali, S.; Kouzani, A.Z.; Mahmud, M.A.P. Automatic Target Detection from Satellite Imagery Using Machine Learning. Sensors 2022, 22, 1147. [Google Scholar] [CrossRef] [PubMed]
- Kentsch, S.; Cabezas, M.; Tomhave, L.; Groß, J.; Burkhard, B.; Lopez Caceres, M.L.; Waki, K.; Diez, Y. Analysis of UAV-Acquired Wetland Orthomosaics Using GIS, Computer Vision, Computational Topology and Deep Learning. Sensors 2021, 21, 471. [Google Scholar] [CrossRef] [PubMed]
- Mhango, J.K.; Grove, I.G.; Hartley, W.; Harris, E.W.; Monaghan, J.M. Applying Colour-Based Feature Extraction and Transfer Learning to Develop a High Throughput Inference System for Potato (Solanum tuberosum L.) Stems with Images from Unmanned Aerial Vehicles after Canopy Consolidation. Precis. Agric. 2022, 23, 643–669. [Google Scholar] [CrossRef]
- Niu, Z.; Deng, J.; Zhang, X.; Zhang, J.; Pan, S.; Mu, H. Identifying the Branch of Kiwifruit Based on Unmanned Aerial Vehicle (UAV) Images Using Deep Learning Method. Sensors 2021, 21, 4442. [Google Scholar] [CrossRef]
- Yang, X.; Zhang, Y.; Lv, W.; Wang, D. Image Recognition of Wind Turbine Blade Damage Based on a Deep Learning Model with Transfer Learning and an Ensemble Learning Classifier. Renew. Energy 2021, 163, 386–397. [Google Scholar] [CrossRef]
- Srivastava, A.; Badal, T.; Saxena, P.; Vidyarthi, A.; Singh, R. UAV Surveillance for Violence Detection and Individual Identification. Autom. Softw. Eng. 2022, 29, 28. [Google Scholar] [CrossRef]
- Liu, Y. Transfer Learning Based Multi-Layer Extreme Learning Machine for Probabilistic Wind Power Forecasting. Appl. Energy 2022, 12, 118729. [Google Scholar] [CrossRef]
- Zhao, W.; Yamada, W.; Li, T.; Digman, M.; Runge, T. Augmenting Crop Detection for Precision Agriculture with Deep Visual Transfer Learning—A Case Study of Bale Detection. Remote Sens. 2020, 13, 23. [Google Scholar] [CrossRef]
- Zheng, J.; Fu, H.; Li, W.; Wu, W.; Yu, L.; Yuan, S.; Tao, W.Y.W.; Pang, T.K.; Kanniah, K.D. Growing Status Observation for Oil Palm Trees Using Unmanned Aerial Vehicle (UAV) Images. ISPRS J. Photogramm. Remote Sens. 2021, 173, 95–121. [Google Scholar] [CrossRef]
- Traore, B.B.; Kamsu-Foguem, B.; Tangara, F. Deep Convolution Neural Network for Image Recognition. Ecol. Inform. 2018, 48, 257–268. [Google Scholar] [CrossRef]
- Altuntaş, Y.; Cömert, Z.; Kocamaz, A.F. Identification of Haploid and Diploid Maize Seeds Using Convolutional Neural Networks and a Transfer Learning Approach. Comput. Electron. Agric. 2019, 163, 104874. [Google Scholar] [CrossRef]
- Omara, E.; Mosa, M.; Ismail, N. Emotion Analysis in Arabic Language Applying Transfer Learning. In Proceedings of the 2019 15th International Computer Engineering Conference (ICENCO), Cairo, Egypt, 29–30 December 2019; pp. 204–209. [Google Scholar]
- Xiang, Q.; Wang, X.; Li, R.; Zhang, G.; Lai, J.; Hu, Q. Fruit Image Classification Based on MobileNetV2 with Transfer Learning Technique. In Proceedings of the 3rd International Conference on Computer Science and Application Engineering—CSAE 2019, Sanya, China, 22–24 October 2019; ACM Press: New York, NY, USA, 2019; pp. 1–7. [Google Scholar]
- Huang, J.; Lu, X.; Chen, L.; Sun, H.; Wang, S.; Fang, G. Accurate Identification of Pine Wood Nematode Disease with a Deep Convolution Neural Network. Remote Sens. 2022, 14, 913. [Google Scholar] [CrossRef]
- Thenmozhi, K.; Reddy, U.S. Crop Pest Classification Based on Deep Convolutional Neural Network and Transfer Learning. Comput. Electron. Agric. 2019, 164, 104906. [Google Scholar] [CrossRef]
- Shaha, M.; Pawar, M. Transfer Learning for Image Classification. In Proceedings of the 2018 Second International Conference on Electronics, Communication and Aerospace Technology (ICECA), Coimbatore, India, 29–31 March 2018; pp. 656–660. [Google Scholar]
- Gao, C.; Gong, Z.; Ji, X.; Dang, M.; He, Q.; Sun, H.; Guo, W. Estimation of Fusarium Head Blight Severity Based on Transfer Learning. Agronomy 2022, 12, 1876. [Google Scholar] [CrossRef]
- Krizhevsky, A.; Sutskever, I.; Hinton, G.E. ImageNet Classification with Deep Convolutional Neural Networks. Commun. ACM 2017, 60, 84–90. [Google Scholar] [CrossRef]
- Minowa, Y.; Kubota, Y. Identification of Broad-Leaf Trees Using Deep Learning Based on Field Photographs of Multiple Leaves. J. For. Res. 2022, 27, 246–254. [Google Scholar] [CrossRef]
- Jin, B.; Zhang, C.; Jia, L.; Tang, Q.; Gao, L.; Zhao, G.; Qi, H. Identification of Rice Seed Varieties Based on Near-Infrared Hyperspectral Imaging Technology Combined with Deep Learning. ACS Omega 2022, 7, 4735–4749. [Google Scholar] [CrossRef] [PubMed]
- Jahandad; Sam, S.M.; Kamardin, K.; Amir Sjarif, N.N.; Mohamed, N. Offline Signature Verification Using Deep Learning Convolutional Neural Network (CNN) Architectures GoogLeNet Inception-v1 and Inception-V3. Procedia Comput. Sci. 2019, 161, 475–483. [Google Scholar] [CrossRef]
- Iandola, F.N.; Han, S.; Moskewicz, M.W.; Ashraf, K.; Dally, W.J.; Keutzer, K. SqueezeNet: AlexNet-Level Accuracy with 50x Fewer Parameters and <0.5 MB Model Size. arXiv 2016, arXiv:1602.07360. [Google Scholar]
- Alom, Z.; Taha, T.M.; Yakopcic, C.; Westberg, S.; Sidike, P.; Nasrin, M.S. The History Began from AlexNet: A Comprehensive Survey on Deep Learning Approaches. arXiv 2018, arXiv:1803.01164. [Google Scholar]
- Minaee, S.; Boykov, Y.Y.; Porikli, F.; Plaza, A.J.; Kehtarnavaz, N.; Terzopoulos, D. Image Segmentation Using Deep Learning: A Survey. IEEE Trans. Pattern Anal. Mach. Intell. 2021, 44, 3523–3542. [Google Scholar] [CrossRef] [PubMed]
- Yasmeen, U.; Khan, M.A.; Tariq, U.; Khan, J.A.; Yar, M.A.E.; Hanif, C.A.; Mey, S.; Nam, Y. Citrus Diseases Recognition Using Deep Improved Genetic Algorithm. Comput. Mater. Contin. 2022, 71, 3667–3684. [Google Scholar] [CrossRef]
- Zhang, X.; Pan, W.; Xiao, P. In-Vivo Skin Capacitive Image Classification Using AlexNet Convolution Neural Network. In Proceedings of the 2018 IEEE 3rd International Conference on Image, Vision and Computing (ICIVC), Chongqing, China, 27–29 June 2018; pp. 439–443. [Google Scholar]
- Sun, P.; Feng, W.; Han, R.; Yan, S.; Wen, Y. Optimizing Network Performance for Distributed DNN Training on GPU Clusters: ImageNet/AlexNet Training in 1.5 Minutes. arXiv 2019, arXiv:1902.06855. [Google Scholar]
- Izzo, S.; Prezioso, E.; Giampaolo, F.; Mele, V.; Di Somma, V.; Mei, G. Classification of Urban Functional Zones through Deep Learning. Neural Comput. Appl. 2022, 34, 6973–6990. [Google Scholar] [CrossRef]
- Muhammad, W.; Aramvith, S. Multi-Scale Inception Based Super-Resolution Using Deep Learning Approach. Electronics 2019, 8, 892. [Google Scholar] [CrossRef]
- Sarwinda, D.; Paradisa, R.H.; Bustamam, A.; Anggia, P. Deep Learning in Image Classification Using Residual Network (ResNet) Variants for Detection of Colorectal Cancer. Procedia Comput. Sci. 2021, 179, 423–431. [Google Scholar] [CrossRef]
- He, K.; Zhang, X.; Ren, S.; Sun, J. Deep Residual Learning for Image Recognition. In Proceedings of the 2016 IEEE Conference on Computer Vision and Pattern Recognition (CVPR), Las Vegas, NV, USA, 27–30 June 2016; IEEE: Piscataway, NJ, USA, 2016; pp. 770–778. [Google Scholar]
- Bouguettaya, A.; Zarzour, H.; Kechida, A.; Taberkit, A.M. Deep Learning Techniques to Classify Agricultural Crops through UAV Imagery: A Review. Neural Comput. Appl. 2022, 34, 9511–9536. [Google Scholar] [CrossRef] [PubMed]
- Chirra, S.M.R.; Reza, H. A Survey on Software Cost Estimation Techniques. JSEA 2019, 12, 226–248. [Google Scholar] [CrossRef]
- Hai, V.V.; Nhung, H.L.T.K.; Prokopova, Z.; Silhavy, R.; Silhavy, P. A New Approach to Calibrating Functional Complexity Weight in Software Development Effort Estimation. Computers 2022, 11, 15. [Google Scholar] [CrossRef]
- Zhang, C.; Xia, K.; Feng, H.; Yang, Y.; Du, X. Tree Species Classification Using Deep Learning and RGB Optical Images Obtained by an Unmanned Aerial Vehicle. J. For. Res. 2021, 32, 1879–1888. [Google Scholar] [CrossRef]
- Barmpoutis, P.; Dimitropoulos, K.; Barboutis, I.; Grammalidis, N.; Lefakis, P. Wood Species Recognition through Multidimensional Texture Analysis. Comput. Electron. Agric. 2018, 144, 241–248. [Google Scholar] [CrossRef]
- Huang, P.; Zhao, F.; Zhu, Z.; Zhang, Y.; Li, X.; Wu, Z. Application of Variant Transfer Learning in Wood Recognition. BioRes 2021, 16, 2557–2569. [Google Scholar] [CrossRef]
- Xie, W.; Wei, S.; Zheng, Z.; Jiang, Y.; Yang, D. Recognition of Defective Carrots Based on Deep Learning and Transfer Learning. Food Bioprocess Technol. 2021, 14, 1361–1374. [Google Scholar] [CrossRef]
- Diez, Y.; Kentsch, S.; Fukuda, M.; Caceres, M.L.L.; Moritake, K.; Cabezas, M. Deep Learning in Forestry Using UAV-Acquired RGB Data: A Practical Review. Remote Sens. 2021, 13, 2837. [Google Scholar] [CrossRef]
- Deng, J.; Dong, W.; Socher, R.; Li, L.-J.; Li, K.; Fei-Fei, L. ImageNet: A Large-Scale Hierarchical Image Database. In Proceedings of the 2009 IEEE Conference on Computer Vision and Pattern Recognition, Miami, FL, USA, 20–25 June 2009. [Google Scholar]
- Chakraborty, S.; Mondal, R.; Singh, P.K.; Sarkar, R.; Bhattacharjee, D. Transfer Learning with Fine Tuning for Human Action Recognition from Still Images. Multimed. Tools Appl. 2021, 80, 20547–20578. [Google Scholar] [CrossRef]
- Han, X.; Zhong, Y.; Cao, L.; Zhang, L. Pre-Trained AlexNet Architecture with Pyramid Pooling and Supervision for High Spatial Resolution Remote Sensing Image Scene Classification. Remote Sens. 2017, 9, 848. [Google Scholar] [CrossRef]
- Chew, R.; Rineer, J.; Beach, R.; O’Neil, M.; Ujeneza, N.; Lapidus, D.; Miano, T.; Hegarty-Craver, M.; Polly, J.; Temple, D.S. Deep Neural Networks and Transfer Learning for Food Crop Identification in UAV Images. Drones 2020, 4, 7. [Google Scholar] [CrossRef]
- Cengil, E.; Cinar, A. Multiple Classification of Flower Images Using Transfer Learning. In Proceedings of the 2019 International Artificial Intelligence and Data Processing Symposium (IDAP), Malatya, Turkey, 21–22 September 2019; IEEE: Piscataway, NJ, USA, 2019; pp. 1–6. [Google Scholar]
- Feng, J.; Wang, Z.; Zha, M.; Cao, X. Flower Recognition Based on Transfer Learning and Adam Deep Learning Optimization Algorithm. In Proceedings of the 2019 International Conference on Robotics, Intelligent Control and Artificial Intelligence—RICAI 2019, Shanghai, China, 20–22 September 2019; ACM Press: New York, NY, USA, 2019; pp. 598–604. [Google Scholar]


| Layer | Layer Name | Layer Type | Layer Details |
|---|---|---|---|
| 1 | Data | Image input | 227 × 227 × 3 images with zero center normalization |
| 2 | Conv1 | Convolution | 96 11 × 11 × 3 convolutions with stride [4 4] and padding [0 0 0 0] |
| 3 | Relu1 | ReLU | ReLU |
| 4 | Norm1 | Cross channel normalization | Cross channel normalization with 5 channels per elemen |
| 5 | Pool1 | Max pooling | 3 × 3 max pooling with stride [2 2] and padding [0 0 0 0] |
| 6 | Conv2 | Grouped convolution | 2 groups of 128 5× 5 × 48 conv with stride [1 1] and padding [2 2 2 2] |
| 7 | Relu2 | ReLU | ReLU |
| 8 | Norm2 | Cross channel normalization | Cross channels normalization with 5 channels per element |
| 9 | Pool2 | Max pooling | 3 × 3 max pooling with stride [2 2] and padding [0 0 0 0] |
| 10 | Conv3 | Convolution | 384 3 × 3 × 256 convolutions with stride [1 1] and padding [1 1 1 1] |
| 11 | Relu | ReLU | ReLU |
| 12 | Conv4 | Grouped convolution | 2 groups of 192 3 × 3 × 192 convolutions with stride [1 1] and padding [1 1 1 1] |
| 13 | Relu4 | ReLU | ReLU |
| 14 | Conv5 | Grouped convolution | 2 groups of 128 3 × 3 × 192 convoutions with stride [1 1] and padding [1 1 1 1] |
| 15 | Relu5 | ReLU | ReLU |
| 16 | Pool5 | Max pooling | 3 × 3 max pooling with stride [2 2] and padding [0 0 0 0] |
| 17 | Fc6 | Fully connected | 4096 fully connected layer |
| 18 | Relu6 | ReLU | ReLU |
| 19 | Drop6 | Dropout | 50% dropout |
| 20 | Fc7 | Fully connected | 4096 fully connected layer |
| 21 | Relu7 | ReLU | ReLU |
| 22 | Drop7 | Dropout | 50% dropout |
| 23 | Fc_new | Fully connected | 9 fully connected layer |
| 24 | Prob | Softmax | |
| 25 | Classoutput | Classification output |
| Network Name | Depth | Image Input Size | Parameters (Millions) | Total Memory (MB) |
|---|---|---|---|---|
| SqueezeNet | 18 | 227 × 227 × 3 | 1.24 | 5.20 |
| ResNet-50 | 50 | 224 × 224 × 3 | 25.6 | 96 |
| AlexNet | 8 | 227 × 227 × 3 | 61 | 227 |
| Metric | Formula | Criteria |
|---|---|---|
| F1-score | Denotes a high value, which validates the model. | |
| Precision | Examines the ability of the model to predict positive label. | |
| Sensitivity (Recall) | Defines the ability of the model to detect instances of certain classes well. | |
| Specificity | Defines the true negatives that are correctly identified by the model. | |
| Accuracy | Examines the accurately in identifying the images to the classes. |
| Parameter Name | Value |
|---|---|
| Epochs | 10 |
| Initial learning rate | 0.0001 |
| Validation frequency | 9 |
| Learning rate weight coefficient | 10 |
| Learning rate bias coefficient | 10 |
| Learning rate schedule | Constant |
| Momentum | 0.9 |
| L2 Regulation | 0.0001 |
| Min batch size | 10 |
| Model | Training Accuracy (%) | Training Time | Image Input Size | Class | Recall (Sensitivity) | Precision | F1 Score |
|---|---|---|---|---|---|---|---|
| SqueezeNet | 76.60 | 3 min 39 s | 227 × 227 | CF CL CT OPF OPL OPT SF SL ST | 1.00 0.83 0.71 0.71 0.57 0.71 0.29 0.70 0.25 | 0.80 0.83 1.00 0.71 0.33 0.63 0.67 0.54 0.67 | 0.89 0.83 0.84 0.71 0.42 0.67 0.41 0.61 0.36 |
| AlexNet | 76.60 | 5 min 8 s | 227 × 227 | CF CL CT OPF OPL OPT SF SL ST | 0.88 0.86 0.57 0.43 0.14 0.71 0.29 0.80 0.25 | 1.00 0.38 1.00 0.75 0.17 0.39 1.00 0.62 0.67 | 0.94 0.53 0.73 0.55 0.48 0.51 0.45 0.70 0.36 |
| ResNet-50 | 82.98 | 18 min 29 s | 224 × 224 | CF CL CT OPF OPL OPT SF SL ST | 0.88 0.71 0.57 0.57 0.71 0.57 0.43 0.70 0.63 | 0.88 0.46 0.80 0.67 0.39 1.00 0.75 0.78 0.83 | 0.88 0.56 0.67 0.62 0.50 0.73 0.55 0.74 0.72 |
Publisher’s Note: MDPI stays neutral with regard to jurisdictional claims in published maps and institutional affiliations. |
© 2022 by the authors. Licensee MDPI, Basel, Switzerland. This article is an open access article distributed under the terms and conditions of the Creative Commons Attribution (CC BY) license (https://creativecommons.org/licenses/by/4.0/).
Share and Cite
Letsoin, S.M.A.; Purwestri, R.C.; Rahmawan, F.; Herak, D. Recognition of Sago Palm Trees Based on Transfer Learning. Remote Sens. 2022, 14, 4932. https://doi.org/10.3390/rs14194932
Letsoin SMA, Purwestri RC, Rahmawan F, Herak D. Recognition of Sago Palm Trees Based on Transfer Learning. Remote Sensing. 2022; 14(19):4932. https://doi.org/10.3390/rs14194932
Chicago/Turabian StyleLetsoin, Sri Murniani Angelina, Ratna Chrismiari Purwestri, Fajar Rahmawan, and David Herak. 2022. "Recognition of Sago Palm Trees Based on Transfer Learning" Remote Sensing 14, no. 19: 4932. https://doi.org/10.3390/rs14194932
APA StyleLetsoin, S. M. A., Purwestri, R. C., Rahmawan, F., & Herak, D. (2022). Recognition of Sago Palm Trees Based on Transfer Learning. Remote Sensing, 14(19), 4932. https://doi.org/10.3390/rs14194932