
Interferometric Orbit Determination System for Geosynchronous SAR Missions: Experimental Proof of Concept
 , , , , , and
Abstract
:
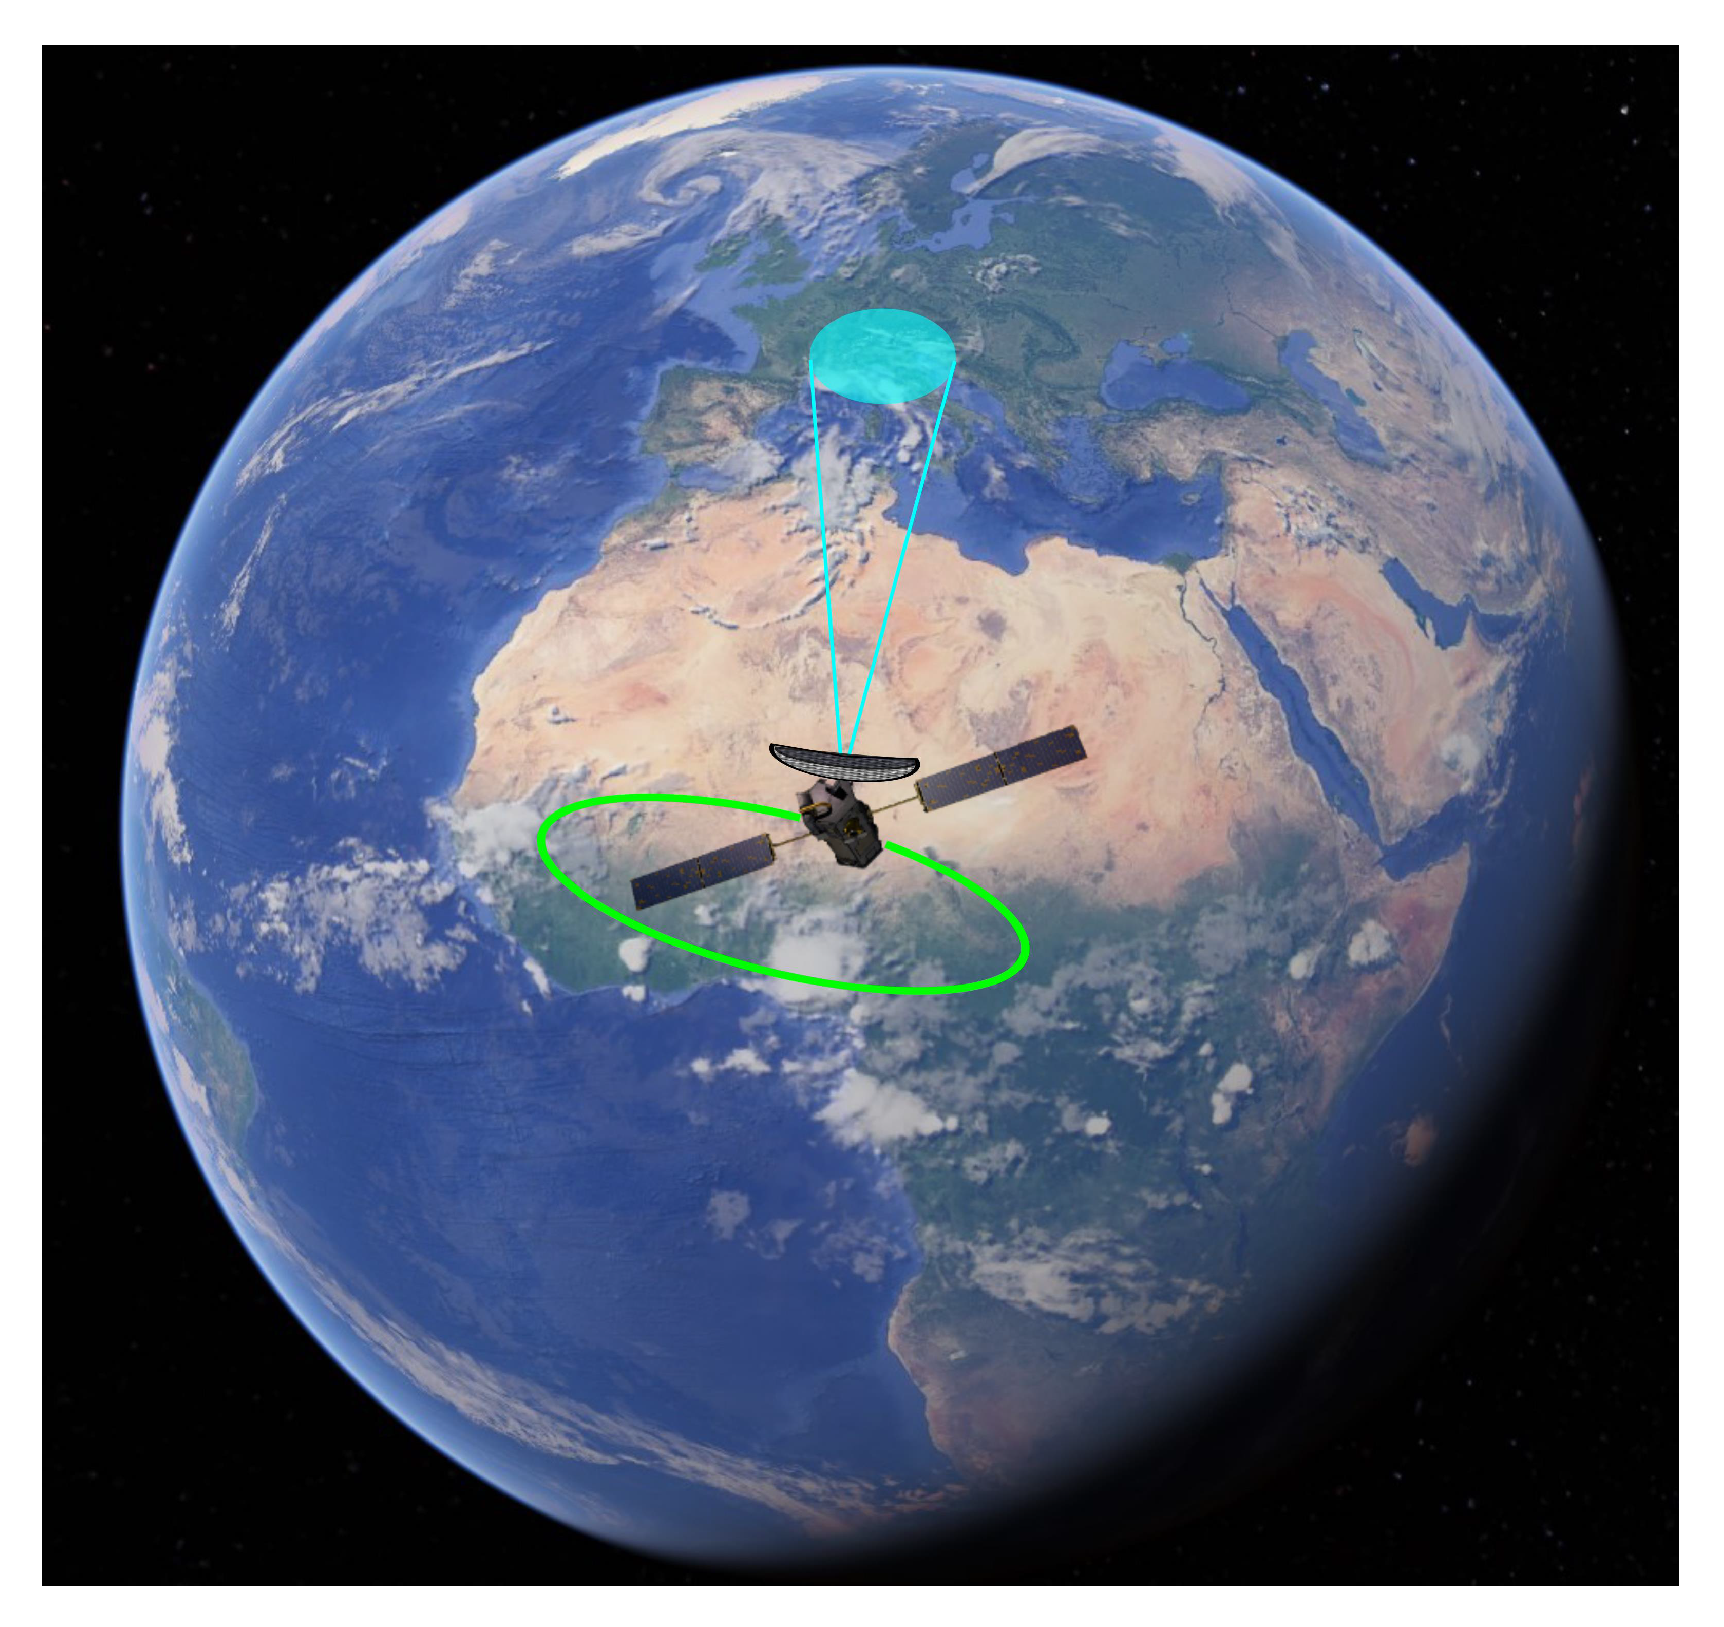
1. Introduction
2. Methodology
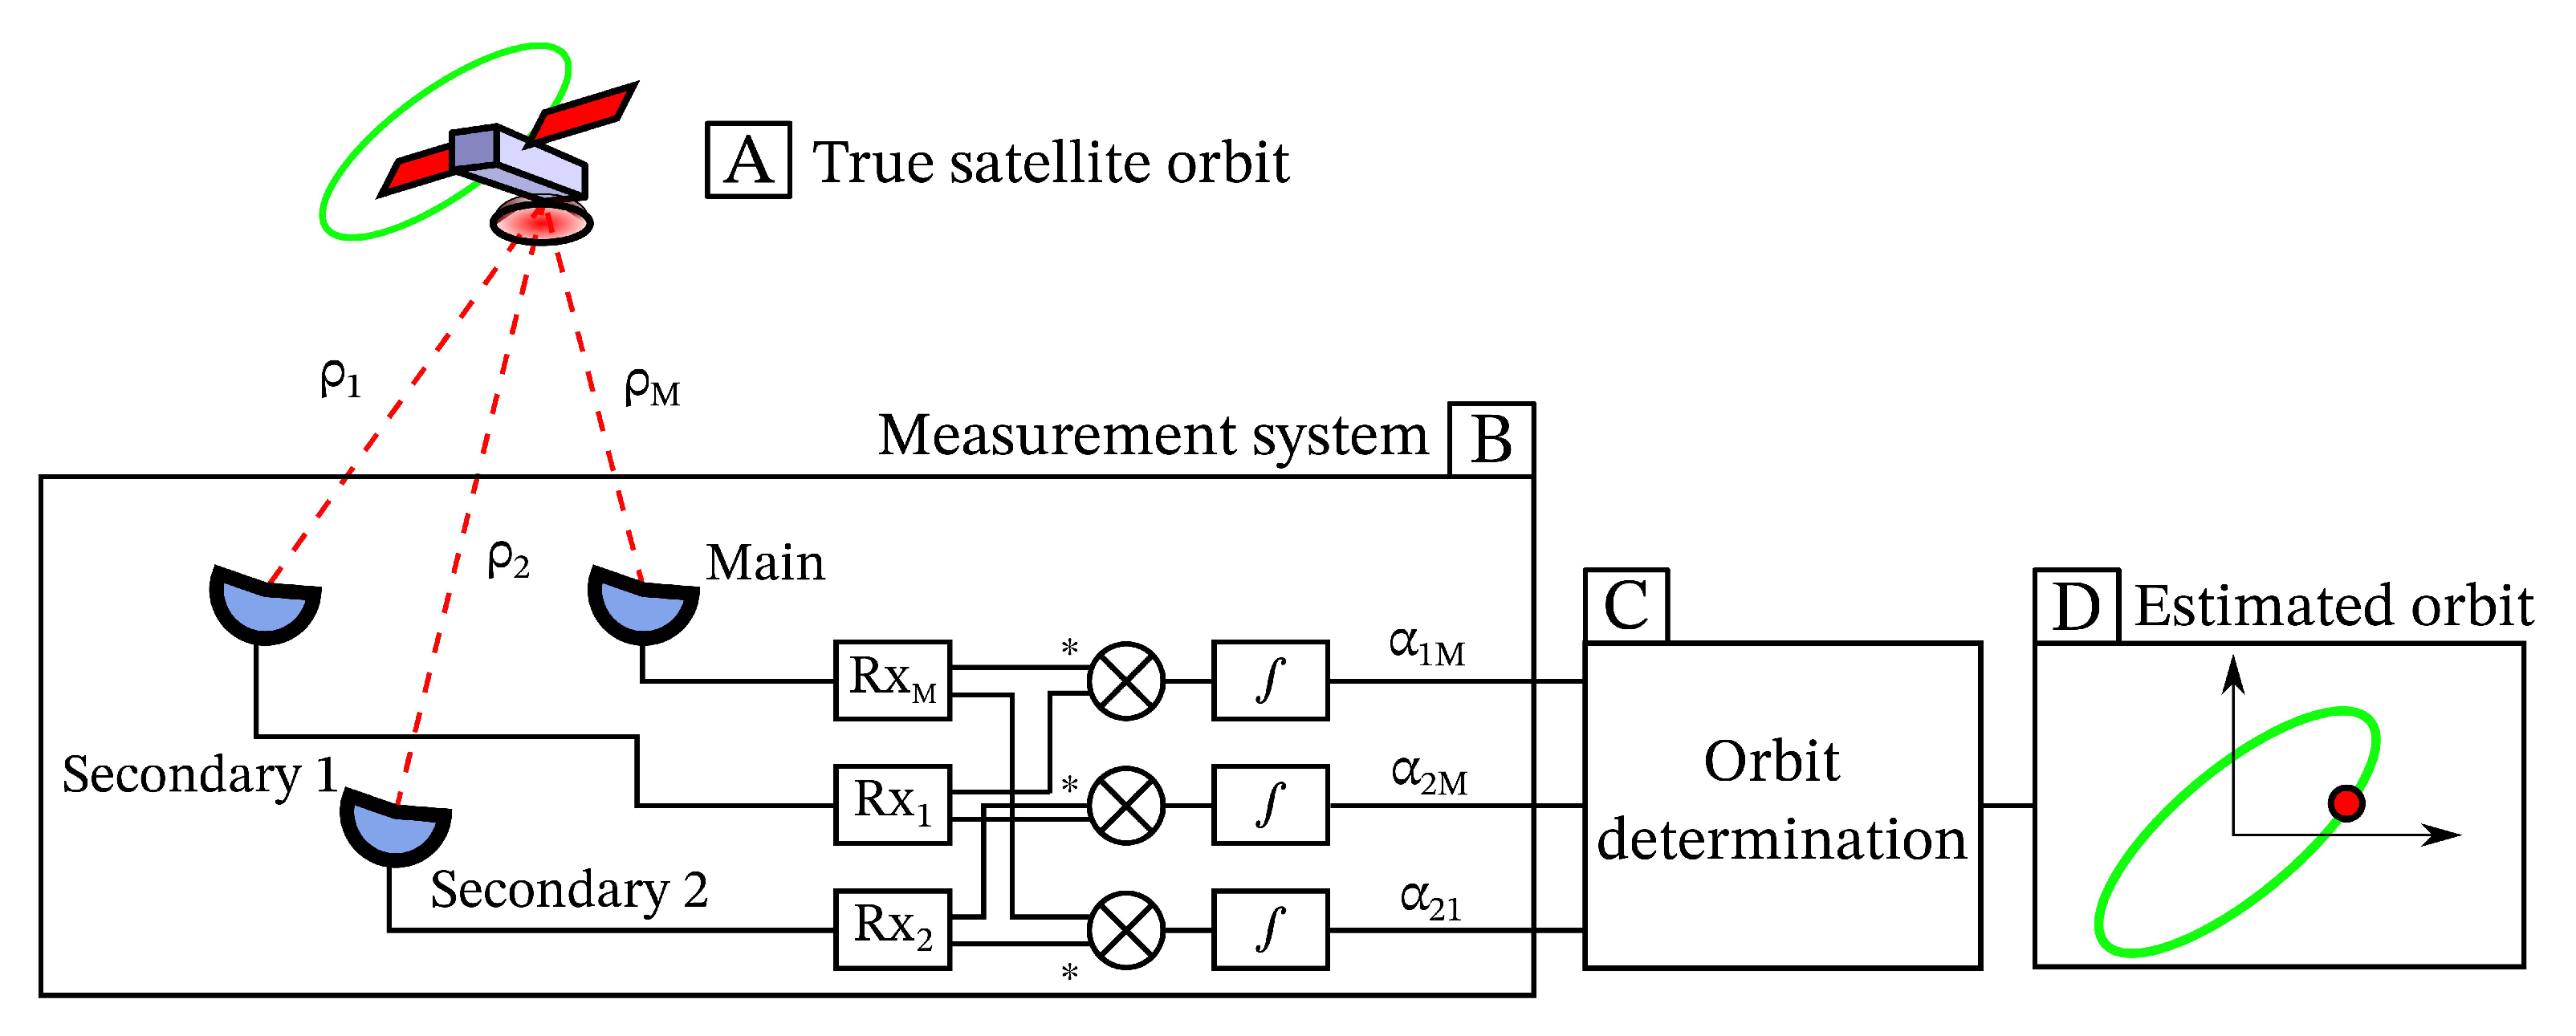
2.1. Radio Interferometer Phase Detection
2.2. Orbit Determination
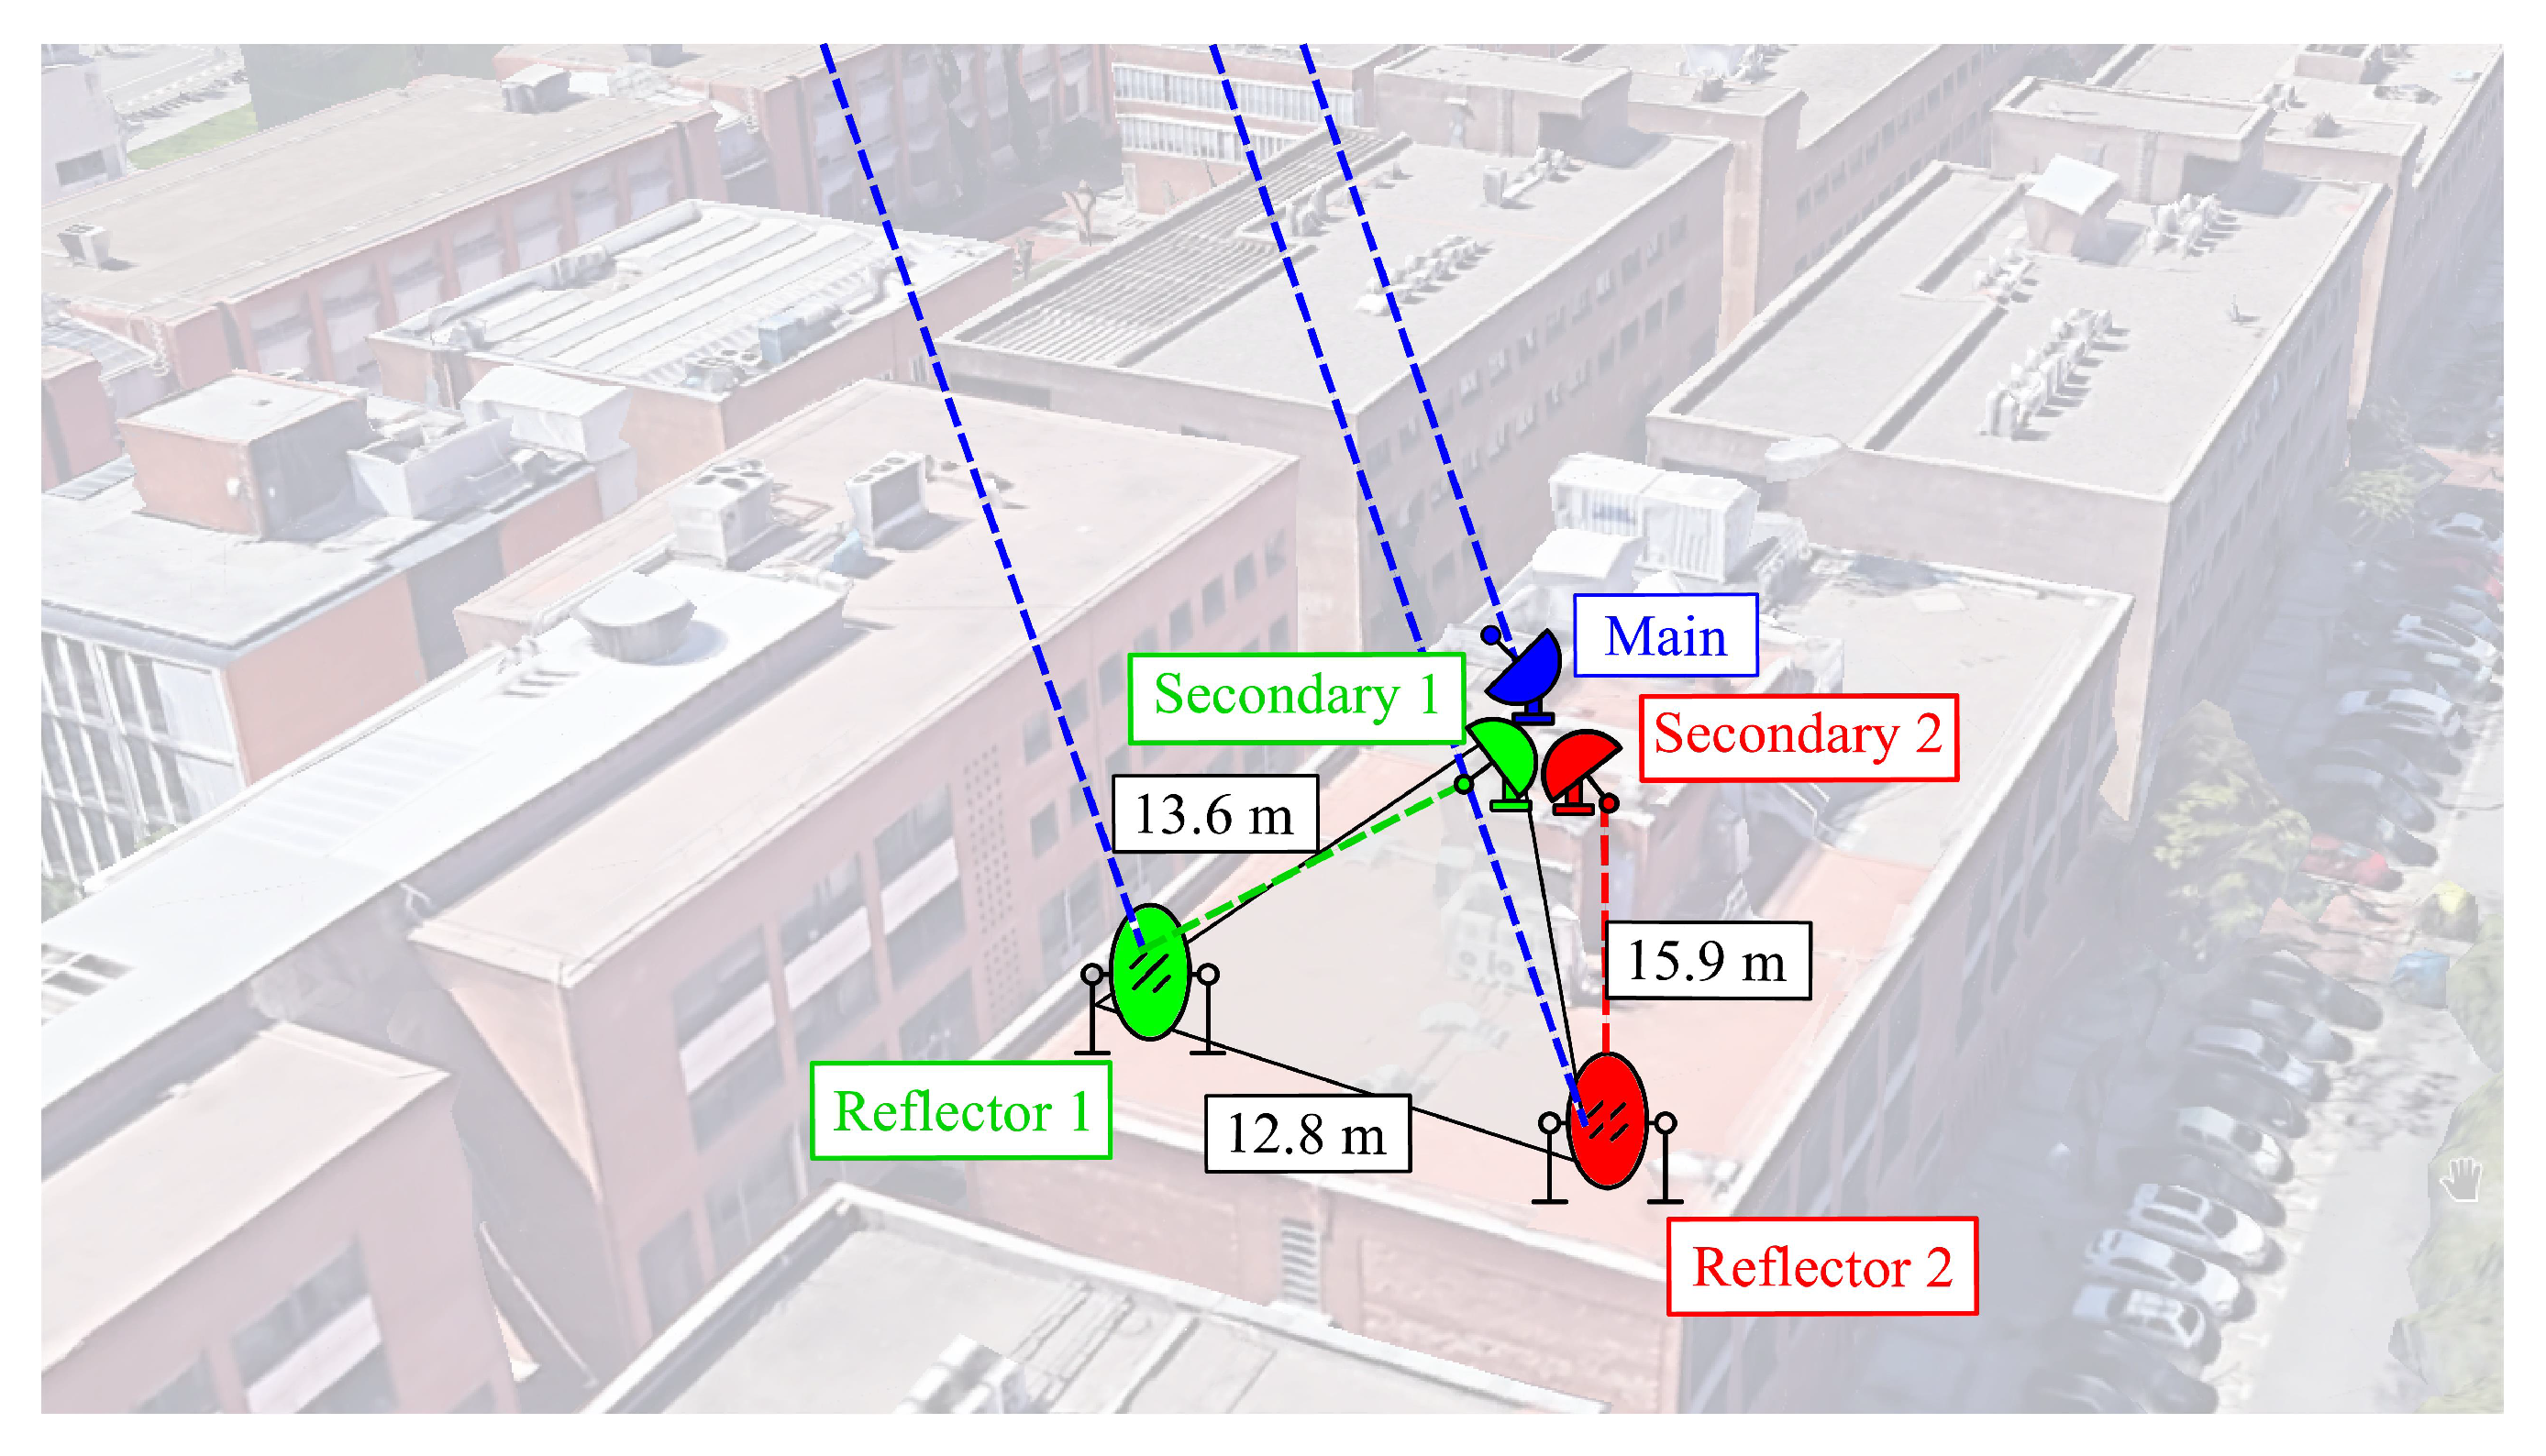
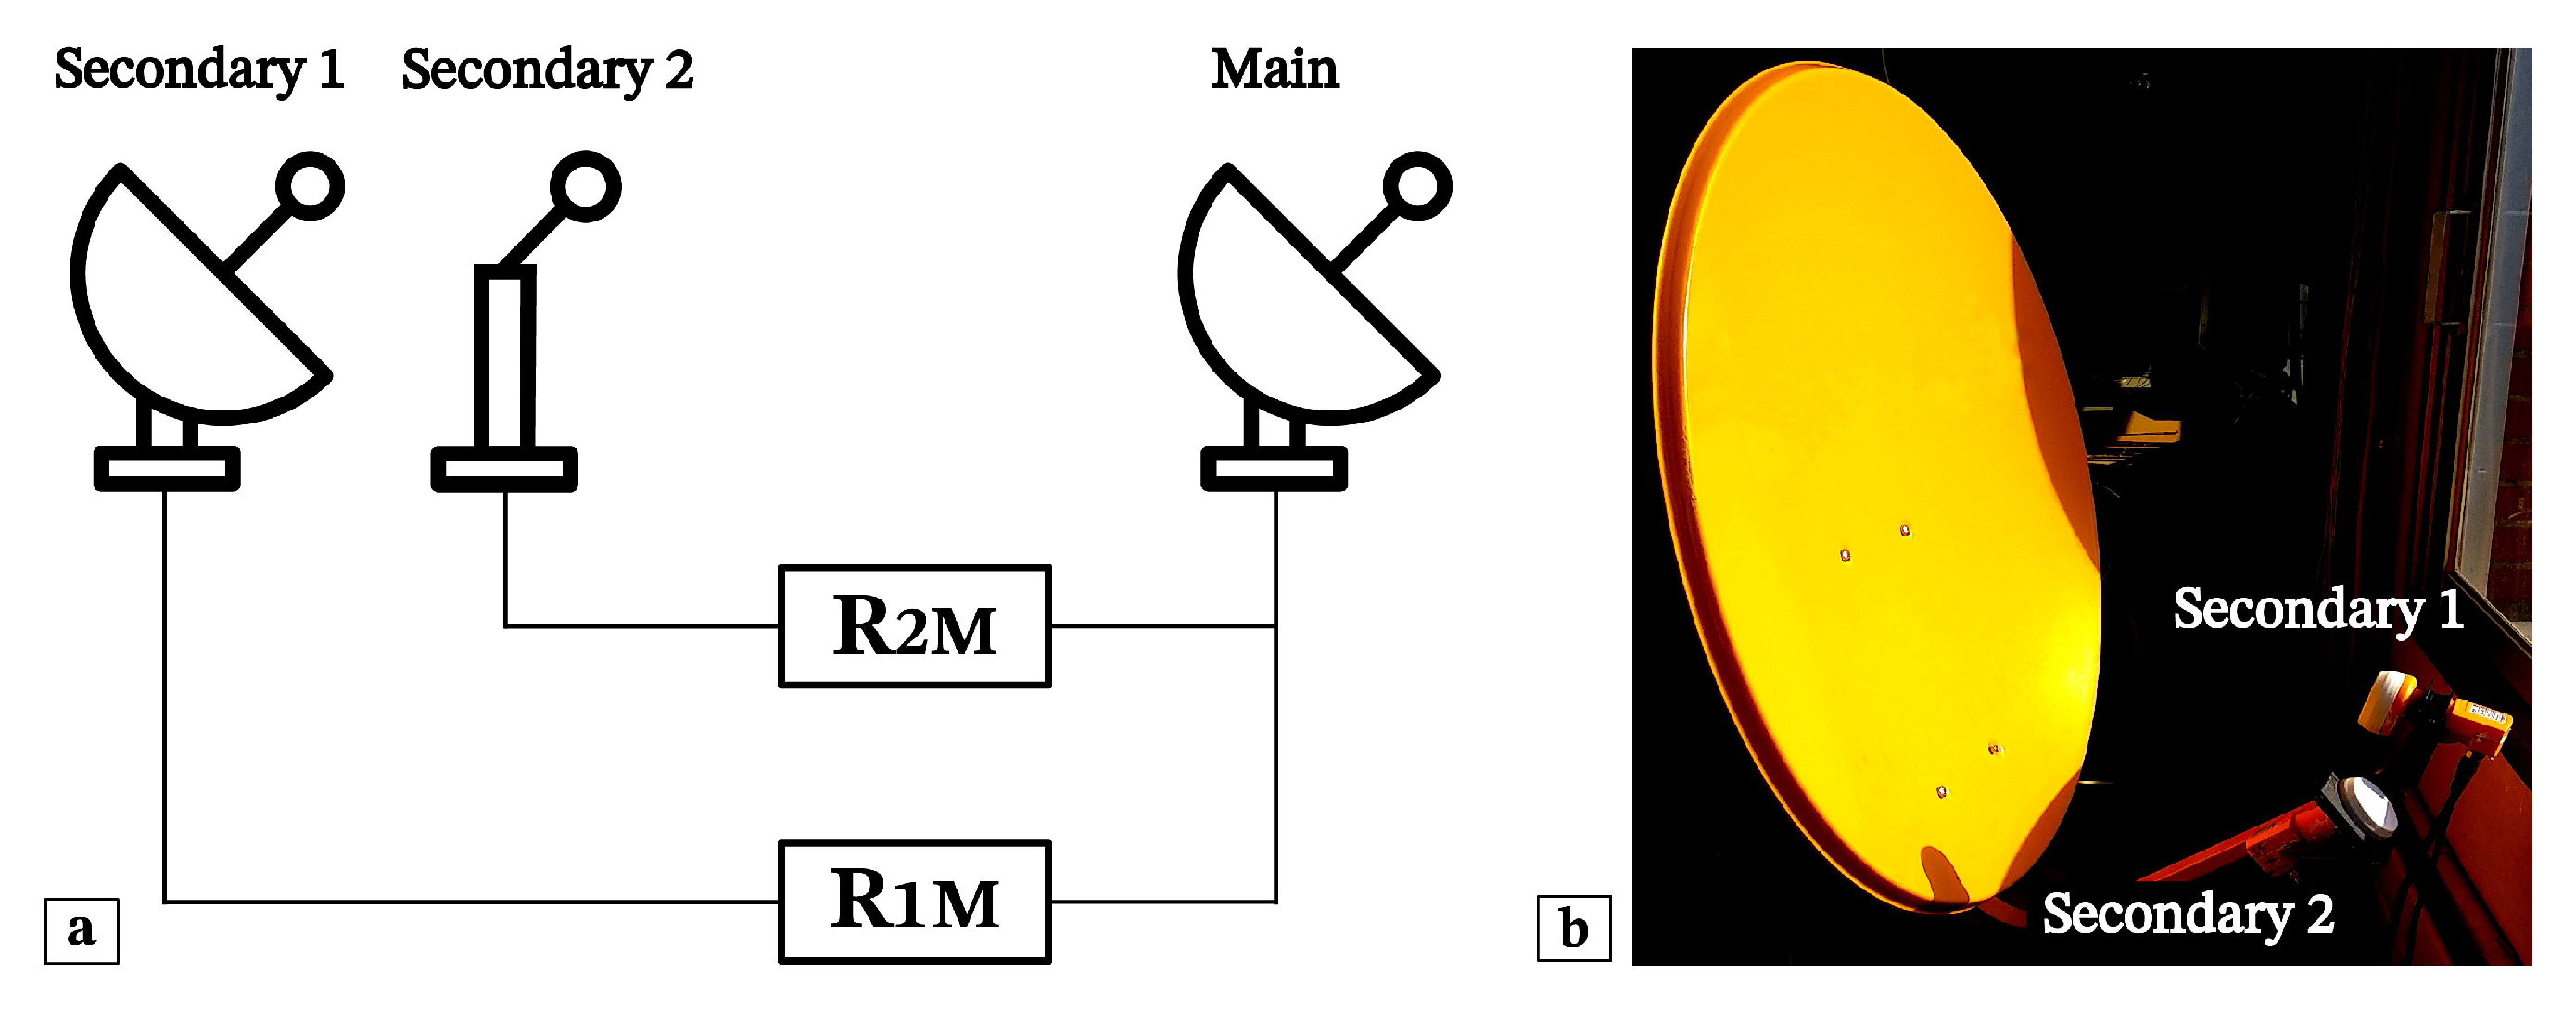
2.3. Experimental Setup
3. Results
3.1. SNR Degradation Experiment
3.2. Experimental Orbit Determination from Interferometric Observables
4. Conclusions
Author Contributions
Funding
Data Availability Statement
Conflicts of Interest
Abbreviations
| AWGN | Additive White Gaussian Noise |
| ECEF | Earth-Centered Earth-Fixed coordinate system |
| GEO | Geosynchronous Orbit |
| GEOSAR | Geosynchronous Orbit Synthetic Aperture Radar |
| LEO | Low Earth Orbit |
| LNB | Low-Noise Block |
| MUOS | Mobile Users Objective System |
| NORAD | North American Aerospace Defense Command |
| NZI | Near-Zero Inclination |
| SAR | Synthetic Aperture Radar |
| SNR | Signal-to-Noise Ratio |
| SoOp | Signal of Opportunity |
| SRP | Solar Radiation Pressure |
| TLE | Two-Line Element |
References
- Tomiyasu, K. Synthetic aperture radar in geosynchronous orbit. In Proceedings of the New Mexico State University Proceedings of the 1978 Synthetic Aperture Radar Technologies Conference, Las Cruces, NM, USA, 8–10 March 1978. [Google Scholar]
- Ruiz-Rodon, J.; Broquetas, A.; Makhoul, E.; Guarnieri, A.M.; Rocca, F. Nearly zero inclination geosynchronous SAR mission analysis with long integration time for earth observation. IEEE Trans. Geosci. Remote Sens. 2014, 52, 6379–6391. [Google Scholar] [CrossRef]
- Monti-Guarnieri, A.V.; Recchia, A.; Rocca, F.; Bombaci, O.; Germani, C.; Broquetas, A.; Wadge, G.; Hobbs, S. Geosynchronous SAR for Terrain & atmosphere with short revisit (GeoSTARe). In Proceedings of the Living Planet Symposium, Prague, Czech Republic, 9–13 May 2016; European Space Agency: Paris, France, 2016; pp. 1–7. [Google Scholar]
- Hobbs, S.E.; Guarnieri, A.M.; Broquetas, A.; Calvet, J.C.; Casagli, N.; Chini, M.; Ferretti, R.; Nagler, T.; Pierdicca, N.; Prudhomme, C.; et al. G-CLASS: Geosynchronous radar for water cycle science–orbit selection and system design. J. Eng. 2019, 2019, 7534–7537. [Google Scholar] [CrossRef]
- Guarnieri, A.M.; Broquetas, A.; Recchia, A.; Rocca, F.; Ruiz-Rodon, J. Advanced radar geosynchronous observation system: ARGOS. IEEE Geosci. Remote Sens. Lett. 2015, 12, 1406–1410. [Google Scholar] [CrossRef]
- Guarnieri, A.M.; Bombaci, O.; Catalano, T.; Germani, C.; Koppel, C.; Rocca, F.; Wadge, G. ARGOS: A fractioned geosynchronous SAR. Acta Astronaut. 2019, 164, 444–457. [Google Scholar] [CrossRef]
- Tomiyasu, K.; Pacelli, J.L. Synthetic aperture radar imaging from an inclined geosynchronous orbit. IEEE Trans. Geosci. Remote Sens. 1983, GE-21, 324–329. [Google Scholar] [CrossRef]
- Madsen, S.; Edelstein, W.; DiDomenico, L.D.; LaBrecque, J. A geosynchronous synthetic aperture radar; for tectonic mapping, disaster management and measurements of vegetation and soil moisture. In Proceedings of the IGARSS 2001. Scanning the Present and Resolving the Future. Proceedings, IEEE 2001 International Geoscience and Remote Sensing Symposium (Cat. No. 01CH37217), Sydney, Australia, 9–13 July 2001; IEEE: Piscataway, NJ, USA, 2001; Volume 1, pp. 447–449. [Google Scholar]
- Hu, C.; Li, Y.; Dong, X.; Wang, R.; Cui, C. Optimal 3D deformation measuring in inclined geosynchronous orbit SAR differential interferometry. Sci. China Inf. Sci. 2017, 60, 060303. [Google Scholar] [CrossRef]
- Hu, C.; Li, Y.; Dong, X.; Ao, D. Avoiding the ionospheric scintillation interference on geosynchronous SAR by orbit optimization. IEEE Geosci. Remote Sens. Lett. 2016, 13, 1676–1680. [Google Scholar] [CrossRef]
- Chen, Z.; Dong, X.; Li, Y.; Hu, C. Formation design for single-pass GEO InSAR considering earth rotation based on coordinate rotational transformation. Remote Sens. 2020, 12, 573. [Google Scholar] [CrossRef]
- Shah, R.; Xu, X.; Yueh, S.; Chae, C.S.; Elder, K.; Starr, B.; Kim, Y. Remote sensing of snow water equivalent using P-band coherent reflection. IEEE Geosci. Remote Sens. Lett. 2017, 14, 309–313. [Google Scholar] [CrossRef]
- Yueh, S.H.; Xu, X.; Shah, R.; Kim, Y.; Garrison, J.L.; Komanduru, A.; Elder, K. Remote sensing of snow water equivalent using coherent reflection from satellite signals of opportunity: Theoretical modeling. IEEE J. Sel. Top. Appl. Earth Obs. Remote Sens. 2017, 10, 5529–5540. [Google Scholar] [CrossRef]
- Yueh, S.; Shah, R.; Xu, X.; Elder, K.; Starr, B. Experimental demonstration of soil moisture remote sensing using P-band satellite signals of opportunity. IEEE Geosci. Remote Sens. Lett. 2019, 17, 207–211. [Google Scholar] [CrossRef]
- Carreno-Megias, X.; Nicolas-Alvarez, J.; Fuste, O.; Broquetas, A.; Aguasca, A. Orbit error impacts and autofocus applied to Geosynchronous SAR (GEOSAR). In Proceedings of the EUSAR 2021, 13th European Conference on Synthetic Aperture Radar. VDE, Online. 29 March–1 April 2021; pp. 1–5. [Google Scholar]
- Rodon, J.R.; Broquetas, A.; Guarnieri, A.M.; Rocca, F. Geosynchronous SAR focusing with atmospheric phase screen retrieval and compensation. IEEE Trans. Geosci. Remote Sens. 2013, 51, 4397–4404. [Google Scholar] [CrossRef]
- Hu, C.; Chen, Z.; Li, Y.; Dong, X.; Hobbs, S. Research progress on geosynchronous synthetic aperture radar. Fundam. Res. 2021, 1, 346–363. [Google Scholar] [CrossRef]
- Nicolás-Álvarez, J.; Broquetas, A.; Aguasca, A. Precise Orbit Observation Techniques for Geosynchronous Synthetic Aperture Radar (GEOSAR). In Proceedings of the IEEE International Geoscience and Remote Sensing Symposium (IGARSS), Proceedings of the IGARSS-2019 IEEE, Yokohama, Japan, 28 July–2 August 2019; pp. 1–4. [Google Scholar]
- Capuano, V.; Shehaj, E.; Blunt, P.; Botteron, C.; Farine, P. High accuracy GNSS based navigation in GEO. Acta Astronaut. 2017, 136, 332–341. [Google Scholar] [CrossRef]
- Guan, M.; Xu, T.; Li, M.; Gao, F.; Mu, D. Navigation in GEO, HEO, and Lunar Trajectory Using Multi-GNSS Sidelobe Signals. Remote Sens. 2022, 14, 318. [Google Scholar] [CrossRef]
- Chen, M.; Liu, Y.; Guo, J.; Song, W.; Zhang, P.; Wu, J.; Zhang, D. Precise orbit determination of BeiDou satellites with contributions from Chinese national continuous operating reference stations. Remote Sens. 2017, 9, 810. [Google Scholar] [CrossRef]
- Gómez, J.L.; Traianou, E.; Krichbaum, T.P.; Lobanov, A.P.; Fuentes, A.; Lico, R.; Zhao, G.Y.; Bruni, G.; Kovalev, Y.Y.; Lähteenmäki, A.; et al. Probing the innermost regions of AGN jets and their magnetic fields with RadioAstron. V. Space and ground millimeter-VLBI imaging of OJ 287. Astrophys. J. 2022, 924, 122. [Google Scholar]
- Akiyama, K.; Alberdi, A.; Alef, W.; Asada, K.; Azulay, R.; Baczko, A.K.; Ball, D.; Baloković, M.; Barrett, J.; Bintley, D.; et al. First M87 event horizon telescope results. II. Array and instrumentation. Astrophys. J. Lett. 2019, 875, L2. [Google Scholar]
- Akiyama, K.; Alberdi, A.; Alef, W.; Algaba, J.C.; Anantua, R.; Asada, K.; Azulay, R.; Bach, U.; Baczko, A.K.; Ball, D.; et al. First Sagittarius A* Event Horizon Telescope Results. II. EHT and Multiwavelength Observations, Data Processing, and Calibration. Astrophys. J. Lett. 2022, 930, L13. [Google Scholar]
- Border, J.; Donivan, F.; Finley, S.; Hildebrand, C.; Moultrie, B.; Skjerve, L. Determining spacecraft angular position with Delta VLBI—The Voyager demonstration. In Proceedings of the Astrodynamics Conference, San Diego, CA, USA, 9–11 August 1982; p. 1471. [Google Scholar]
- Kawase, S. Radio Interferometry and Satellite Tracking; Artech House: Norwood, MA, USA, 2012; pp. 32–35. [Google Scholar]
- Luthcke, S.; Zelensky, N.; Rowlands, D.; Lemoine, F.; Williams, T. The 1-centimeter orbit: Jason-1 precision orbit determination using GPS, SLR, DORIS, and altimeter data special issue: Jason-1 calibration/validation. Mar. Geod. 2003, 26, 399–421. [Google Scholar] [CrossRef]
- Saint-Venant, M.; Mouty, S.; Assaad, J.; Lefebvre, F.; Deloof, P. Detection of multiple signal echoes with a one bit correlator receiver. In Proceedings of the ITSC2000, 2000 IEEE Intelligent Transportation Systems. Proceedings (Cat. No. 00TH8493), Dearborn, MI, USA, 1–3 October 2000; IEEE: Piscataway, NJ, USA, 2000; pp. 196–201. [Google Scholar]
- Series, P. Ionospheric propagation data and prediction methods required for the design of satellite services and systems. Recomm. ITU-R 2016, 531–613. Available online: https://www.itu.int/dms_pubrec/itu-r/rec/p/R-REC-P.531-12-201309-S!!PDF-E.pdf (accessed on 15 September 2022).
- Soop, E.M. Handbook of Geostationary Orbits; Springer Science & Business Media: Berlin/Heidelberg, Germany, 1994; Volume 3. [Google Scholar]
- Fehlberg, E. Classical Fifth-, Sixth-, Seventh-, and Eighth-order Runge-Kutta Formulas with Stepsize Control; National Aeronautics and Space Administration: Washington, DC, USA, 1968.
- Carilli, C.; Holdaway, M. Tropospheric phase calibration in millimeter interferometry. Radio Sci. 1999, 34, 817–840. [Google Scholar] [CrossRef]
- Vallado, D. Fundamentals of Astrodynamics and Applications; Space Technology Library; Springer: Dordrecht, the Netherlands, 2001. [Google Scholar]
- Thompson, A.; Moran, J.; Swenson, G. Interferometry and Synthesis in Radio Astronomy; Krieger Publishing Company: Malabar, FL, USA, 1998. [Google Scholar]
- Jacobs, E.; Ralston, E.W. Ambiguity resolution in interferometry. IEEE Trans. Aerosp. Electron. Syst. 1981, AES-17, 766–780. [Google Scholar] [CrossRef]


Publisher’s Note: MDPI stays neutral with regard to jurisdictional claims in published maps and institutional affiliations. |
© 2022 by the authors. Licensee MDPI, Basel, Switzerland. This article is an open access article distributed under the terms and conditions of the Creative Commons Attribution (CC BY) license (https://creativecommons.org/licenses/by/4.0/).
Share and Cite
Nicolás-Álvarez, J.; Carreño-Megias, X.; Ferrer, E.; Albert-Galí, M.; Rodríguez-Tersa, J.; Aguasca, A.; Broquetas, A. Interferometric Orbit Determination System for Geosynchronous SAR Missions: Experimental Proof of Concept. Remote Sens. 2022, 14, 4871. https://doi.org/10.3390/rs14194871
Nicolás-Álvarez J, Carreño-Megias X, Ferrer E, Albert-Galí M, Rodríguez-Tersa J, Aguasca A, Broquetas A. Interferometric Orbit Determination System for Geosynchronous SAR Missions: Experimental Proof of Concept. Remote Sensing. 2022; 14(19):4871. https://doi.org/10.3390/rs14194871
Chicago/Turabian StyleNicolás-Álvarez, Jorge, Xavier Carreño-Megias, Estel Ferrer, Miquel Albert-Galí, Judith Rodríguez-Tersa, Albert Aguasca, and Antoni Broquetas. 2022. "Interferometric Orbit Determination System for Geosynchronous SAR Missions: Experimental Proof of Concept" Remote Sensing 14, no. 19: 4871. https://doi.org/10.3390/rs14194871
APA StyleNicolás-Álvarez, J., Carreño-Megias, X., Ferrer, E., Albert-Galí, M., Rodríguez-Tersa, J., Aguasca, A., & Broquetas, A. (2022). Interferometric Orbit Determination System for Geosynchronous SAR Missions: Experimental Proof of Concept. Remote Sensing, 14(19), 4871. https://doi.org/10.3390/rs14194871