Abstract
Reduction in visibility (Vis) due to fog is one of the deadliest severe weather hazards affecting aviation and public transportation. Nowcasting/forecasting of Vis reduction due to fog using current models is still problematic, with most using some type of empirical parameterization. To improve the models, further observational studies to better understand fog microphysics and seasonal variability are required. To help achieve these goals, the seasonal and microphysical characteristics of different fog types at Cold Lake airport (CYOD), Alberta, Canada were analyzed using hourly and sub-hourly METAR data. Microphysical and meteorological measurements obtained using the DMT Fog Monitor FM-120 and the Vaisala PWD22 were examined. The results showed that radiation fog (RF) dominates at CYOD in summer while precipitation, advection and cloud-base-lowering fogs mostly occur in fall and winter. All fog types usually form at night or early morning and dissipate after sunrise. The observed dense fog events (Vis < 400 m) were mainly caused by RF. The observed mean fog particle spectra () for different fog types and temperatures showed bimodal n(D) (with two modes near 4 μm and 17–25 μm; the maximum total number concentration () was 100 cm−3 and 20 cm−3, respectively, corresponding to each mode). Parameterizations of Vis as a function of liquid water content () and were developed using both the observed Vis and calculated Vis based on . It was found that the observed Vis was higher than the calculated Vis for warm fog with > 0.1 gm−3 and most of the mass was contributed by the large drops. Based on the observed Vis, the relative error of the visibility parameterization as a function of both and (32%) was slightly lower than that (34%) using alone for warm fogs.
1. Introduction
According to the World Meteorological Organization (WMO) definition [1], fog consists of very small cloud particles suspended in the air near the surface of the Earth, usually in the form of microscopic water droplets, which reduce horizontal visibility to less than 1 km. Low visibility associated with fog is one of the most common weather factors that cause transportation accidents [2,3]. Based on data collected from 1982 to 2013 by the United States National Transportation Safety Board (NTSB), the authors of [4] showed that fog represents the second most prevalent factor in fatal weather-related general aviation accidents.
Fog forms when water vapor is condensed to form water droplets, mainly through a heterogeneous nucleation process, either by cooling the air or adding moisture to the air. There are many factors that can affect fog formation mechanisms, such as the concentration of cloud condensation nuclei (CCN), moisture content, temperature, topography, drop deposition, and small-scale boundary layer dynamics that most numerical weather prediction (NWP) models have difficulty capturing. Therefore, fog forecasting/nowcasting is still a challenging problem. According to [5], the CCN concentration affects droplet concentration more in fogs than in clouds and increasing CCN extends the lifetime of radiation fog. Based on the mechanisms of formation of several fog types, the authors of [6] described five distinct fog types: precipitation fog, radiation fog, advection fog, fog resulting from the lowering of the cloud base, and morning evaporation fog. Radiation fog occurs due to a radiative cooling over land; it is the most common fog type that usually occurs on a clear night before sunrise and is normally associated with a strong inversion zone in the lower atmospheric layer. Advection fog normally refers to the advection of moist air over a colder underlying surface, which can be land [7,8,9]. Precipitation fog occurs because of a gradual lowering of the cloud base an hour before, or during, continuous light rain or light drizzle [6]. This is normally associated with a warm front and can also occur during slow-moving cold fronts. Cloud-base-lowering fog results from the lowering of cloud bases, because of evaporation of rain falling through relatively dry air and the condensation process. The authors of [6,10] classified a considerable number of cloud-base-lowering fogs that occur in winter, autumn or spring in their climatological analysis. In the morning, evaporation fog is formed when water vapor evaporates from a water surface and usually occurs when cold, stable air moves over a much warmer body of water. Deposition of dew during the night can be considered an important secondary mechanism preceding morning evaporation fog [6].
Previous studies suggest that a better understanding of fog microphysics, such as the shape of the droplet size distribution and formation mechanisms, is necessary to develop better cloud microphysical parameterizations that can be implemented in NWP models to improve forecasting/nowcasting of severe weather phenomena, such as low ceiling and visibility [2,11]. Based on in situ measurements, previous studies revealed that the shape of droplet spectra and droplet number concentration vary considerably based on fog type [12,13,14]. The authors of [15] reported single-mode droplet spectra with peaks near 2–3 µm with high droplet number concentration in a polluted area in northern China. Another study [2] found bimodal droplet spectra with peaks located at D ≈ 3 µm and D ≈ 25 µm based on data collected in a relatively clean area. Bimodal droplet spectra were also reported in [14] based on 550 h of measurements in open ocean or marine fog with a peak diameter near 6 µm and another peak near 25 to 40 µm, which contained most of the LWC.
A detailed definition of visibility is given in [11,16]. There are two formulations for calculating visibility, one for during daytime and the other for during nighttime. The visibility calculation during daytime is based on the theoretical consideration of scattering light by a black object [17] and is calculated as
where α is the visual contrast normally assumed to be 0.05 [16] and is the extinction coefficient. During nighttime, the derivation of visibility is much more involved and is based on the scattering of undirected artificial light [18]. It requires some knowledge of the illuminance (E) of a light source of a given intensity (I) used at some distance, in addition to extinction [16]. In this case, there is no simple formulation as in Equation (1), but the daytime visibility can be non-linearly related to the nighttime visibility as
where is the threshold illuminance that normally depends on the background light. By taking typical runway light intensity and nighttime background light levels used for aviation, the authors of [11] numerically derived as
where both Vd and Vn are given in km. In the subsequent discussions in this paper, unless specified, the daytime visibility is referred to as for clarity. The relationships between and have been studied for decades [19,20] and most have focused on power-law relationships given as:
where is in , the parameters b and a vary due to the different instruments and experimental designs, as well as variability in ambient conditions, such as polluted versus clean air masses [13]. The general empirical form of LWC and visibility relationship derived from a modified gamma distribution proposed by [21] has a fixed value of parameter a = 2/3 and a varying parameter b with different fog types [22,23]. The authors of [24] proposed a relationship between visibility and the product of droplet number concentration and and showed smaller relative errors compared to the visibility derived using alone. According to [15], the calculated visibility using droplet spectra is higher than the observed visibility using the Vaisala FD12P present weather sensor, particularly in relatively light fog events and suggested that the extinction effect caused by aerosols should be considered in fog visibility parameterization for polluted areas. Another study reported in [25] showed that, when fog formed, the observed LWC was greater than 7 mgm−3 and the significant part of the extinction of visible radiation was due to fog droplets. This study also found that the contribution of other constituents, such as hydrated aerosols (D < 2.5 μm) and other aerosols (D > 2.5 μm), were 20 ± 15% and 6 ± 7%, respectively.
In this study, a combination of both METAR data and in situ measurements were used to better understand the statistical distribution of fog types and associated formation mechanisms. The analyses were performed using statistical descriptions of the type, frequency and duration of the observed fog events, and the associated local weather conditions, such as temperature, RH, surface pressure and wind. The in situ measurements of cloud microphysical properties, such as fog droplet spectra, LWC and concertation, were used to better understand the microphysical characteristics of different fog types and their impact on visibility. The new visibility parameterizations were developed using the observed visibility, LWC and . The paper is organized as follows: Section 2 describes the materials and methods, Section 3 presents the results of the climatological analysis, the microphysical characteristics of fog, and the relationship between visibility and and ; Section 4 gives the summary and conclusions.
2. Materials and Methods
2.1. Study Location
The study site is located at Cold Lake airport (CYOD) situated in northeastern Alberta, Canada (54.4073°N, 110.2783°W, 541 m ASL) and has a humid continental climate. Climatological data indicate that CYOD, Alberta, is affected by various fog conditions. The Google map in Figure 1a shows the location of CYOD and its surrounding areas. The two lakes (Cold Lake and Primrose Lake) are located in the northeast and Beaver Valley is in the south. Easterly winds bring moisture from the lakes to the airport; furthermore, a large oil refinery that is north-northwest of the airport is a source of a large quantity of anthropogenic aerosols and heated water vapor that may contribute to the formation of fog.
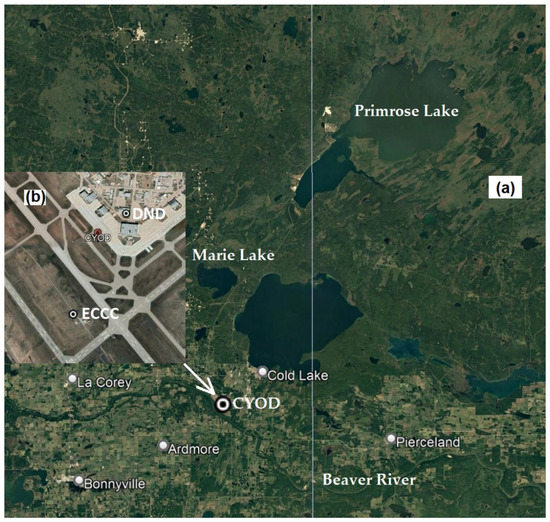
Figure 1.
Google earth map of CYOD and the surrounding terrain (a) and within the air force base where the ECCC and DND instrument sites (b) are located.
The Canadian Search and Rescue Secretariat commissioned a specialized observing platform at CYOD to further understand fog formation mechanisms. The Meteorological Research Division of Environment and Climate Change Canada (ECCC) undertook the work in collaboration with the Department of National Defense (DND). In December 2013, ECCC installed a set of ground-based instruments within the CYOD airport at the ECCC site (Figure 1b).
2.2. Instrumentation
The instruments used for this study included a Vaisala PWD22 [26] present weather sensor that measures visibility, precipitation intensity and type, a Rotronic MP102 RH/T sensor that measures humidity and temperature, and a droplet measuring technology (DMT) fog monitor (FM-120) probe that measures droplet sizes (2–50 µm) (see a description of these instruments in [27,28]). The Vaisala PWD22 measures visibility, precipitation intensity and type based on forward scattering of an 875 nm laser light beam at a 45° angle. The probe uses proprietary optical signal analysis software to calculate visibility from the scattering measurements. The measured visibility values are calibrated using a transmissometer, which is a more accurate light extinction probe using a light source near 550 nm where human vision is more sensitive. Based on these two measurements, the extinction can be determined using Equation (1) assuming a visual threshold value of 5%. The probe normally reports the daytime visibility.
The DMT fog monitor (FM-120) is a cloud-particle spectrometer designed for use during ground-based or tower-based studies. It measures particle size and concentration in the 2–50 μm size range by drawing air through a sampling tube by means of a special pump at a rate close to 15.6 ms−1. The probe has a sampling area of 0.24 mm2. The principle of operation is based on collecting a scattered 658 nm focused laser beam in a forward direction (4–12°) and by converting the scattered light intensity from individual particles into an optical scattering cross-section by application of light scattering principles [29]. The optical scattering calculation used for sizing the particles assumes that the particles are perfectly spherical pure water having a refractive index (ns) of 1.33. Since January 2017, the FM-120 was installed facing approximately towards the west and measuring fog particle size distributions at a one-second temporal resolution at CYOD.
2.3. Derivation of the Bulk Microphysical Parameters
The extinction coefficient (σ) can be calculated as
where is the extinction efficiency, D is the particle size, is the wavelength set at 685 nm in this case, ns is the refractive spectra and is the particle spectra. The extinction efficiency can be calculated using light scattering theory, assuming a spherical shape with ns = 1.33, by neglecting the absorption effect for liquid drops, and = 658 nm for visible light used by the probe, as indicated in Figure 2. The shown in Figure 2 is calculated using MATLAB codes [30], which is based on Mie light scattering theory [29]. The size bins used by the probe are also shown in the figure. As indicated in the figure, the approaches the geometric optics limit of 2 for D > 3 µm for the wavelength considered here. Thus, the approximation slightly underestimates the calculated , particularly for D < 6 µm; thus, a minor correction was applied in the calculation. The liquid water content (LWC) is calculated using the measured particle spectra as
where is the density of water. In this study, fog drops measured at sub-zero temperature (−15 °C < T < 0 °C) are assumed to be in a super-cooled liquid state. The area weighed mean dimeters (Dm) of the fog particles are calculated as
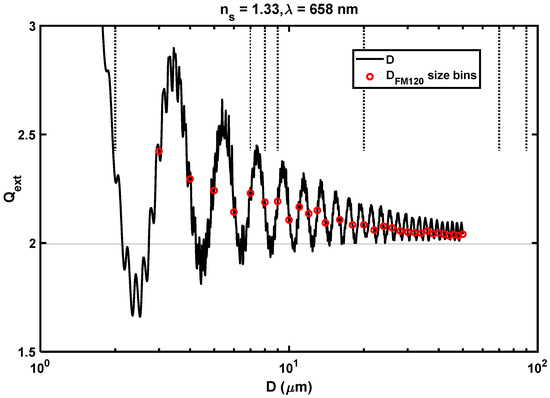
Figure 2.
Extinction efficiency calculated using Mie scattering theory. The red circles show the measured particle size bines for FM-120 probe.
The median volume diameter (MVD) was calculated following [28]. Earlier [31] noted two types of error associated with the FM-100 measurement technique, one related to the problem of the sizing of the particles using Mie scattering theory and the other to the loss of particles because of sampling and particle transportation through the sampling tube. According to their study, the approximation of the Mie scattering cross-section by a monotonic curve leads to a spike in the particle distribution. They also claimed that the particle loss is close to 10% for particles (D < 10 μm), but, for larger particles (D~50 μm) the loss can reach 90% for wind speed (WS < 4.4 ms−1). However, several recent studies [32,33,34,35] found no clear indication of particle loss and sizing discrepancy that warranted corrections in their datasets.
To understand the effects of wind speed and wind direction ( on the collection efficiency of the FM-120 probe, bivariate histograms or joint frequency distributions of the FM-120 data and meteorological observations during the period that fog occurred (Vis < 1 km) were analyzed; the results are given in Figure 3. The statistical data depicted in Figure 3 shows the joint frequency distribution of LWC and Figure 3a), and LWC (Figure 3b), and (Figure 3c), and (Figure 3d) and and LWC (Figure 3e). The majority of the mass was associated with wind speeds < 2.5 ms−1 and between 5 μm and 20 μm, indicating that most of the fog events were associated with calm conditions (Figure 3a,c). This will be discussed in more detail later. The smaller particles ( < 5 μm) were not collected when the wind speeds were greater than 2.5 ms−1 (Figure 3c). This could be attributed to the fact that advection fog usually forms at higher wind speeds and normally produces larger drop particles [36]; as will be discussed later, the observed MVDs during advection fog events were greater than 17 μm. Considering that the probe was directed towards the west (~270°), there was no significant sampling bias when the wind was blowing from other directions (Figure 3b,d). As will be discussed later, the FM-120 probe measured higher extinction than the PWD22 at higher LWC and, hence, based on these results, there is no indication that the probe was losing larger particles. In addition, no spikes in the particle distribution were observed. Therefore, no corrections were applied in this study.
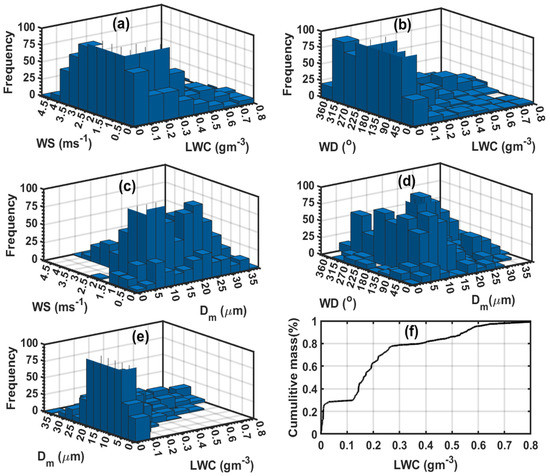
Figure 3.
The joint frequency distribution of LWC and (a), and LWC (b), and (c), and (d) and and LWC (e) during fog events (VIS < 1 km) and the percent cumulative distribution of LWC for the entire fog period (f).
2.4. Classification of Fog Type
The dataset used in this study included hourly and sub-hourly reported METAR data and high resolution microphysical and meteorological measurements obtained using the FM-120, PWD22 and Rotronic sensors during the period between January and September 2017 at CYOD. The METAR reports parameters including visibility, precipitation intensity and type, air temperature, dew point temperature, humidity, wind speed and direction, cloud-base height and surface pressure. In this study, fog events were identified when the prevailing visibilities were less than 1 km and the weather type was reported as fog (FG) in the METAR. Applying the classification scheme presented by [6], if precipitation occurred at onset or one hour prior to the fog event, then it was identified as precipitation fog. Under the non-precipitation condition, advection fog was identified when the wind speed was greater than 2.5 under clear sky conditions or the cloud ceiling was below 200 m one hour before the fog event. Radiation fog was classified when the wind speed was less than 2.5 and was accompanied with surface cooling before sunrise. Cloud-base lowing fog was classified when the cloud base was lower than 1 km and was gradually lowering. Morning evaporation fog was able to be identified through the increasing temperature and an increase in the dewpoint temperature leading to saturation before sunrise. A detailed classification algorithm is described in [6].
3. Results
3.1. Seasonal Characteristics of Fog at CYOD
Figure 4 shows the monthly and time of day statistical distribution of fog at CYOD. As indicated in Figure 4a, the most frequent fog type at CYOD was radiation fog and this was mostly observed in the summer season. The precipitation, advection and cloud-base-lowering fogs normally occurred in the fall and winter seasons (Figure 4a). Figure 4b shows the frequency of occurrence of fog events for a given month and the time of the day, indicating that most of the fog events occurred at night and early morning near sunrise, and usually dissipated after sunrise, as illustrated by the white and pink lines that show the local sunrise and sunset times, respectively. As shown in Figure 4b,c, most of the fog occurred during the night, but the fog could extend to the late morning during cloudy conditions that blocked the incoming solar radiation. During the study period, there were 59 fog events reported, representing a total of 115.3 h. Based on this study, the frequencies of fog events that occurred were 70%, 15%, 7%, 5% and 3% for radiation, precipitation, advection, cloud-base-lowering and unknown fog types, respectively.
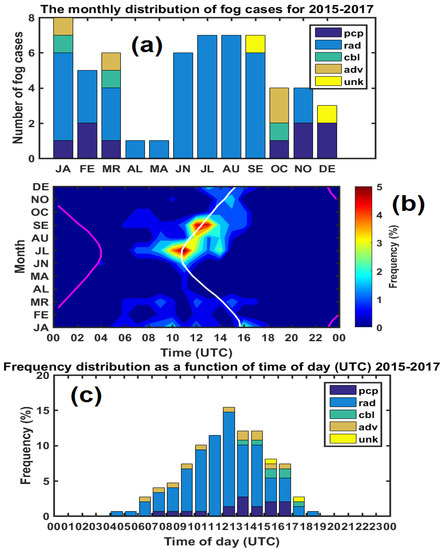
Figure 4.
Fog temporal distribution: (a) monthly distribution; (b) the frequency of fog occurrence versus month and time of day (UTC), with the white line indicating sunrise time and the pink line sunset time; (c) the frequency distribution as a function of time of day.
Figure 5 shows the distributions of fog events onset (Figure 5a), dissipation time (Figure 3b), and duration (Figure 3c) for different fog types. Radiation fog could last from several minutes to more than 8 h (Figure 5c). Based on this study, the mean fog duration for all fog types was 1.9 h, and the mean duration for radiation fog alone was 2 h, for precipitation fog 1.5 h, advection fog 2.7 h, cloud-base-lowering fog 2 h, while the unknown fog type only lasted for 0.6 h.
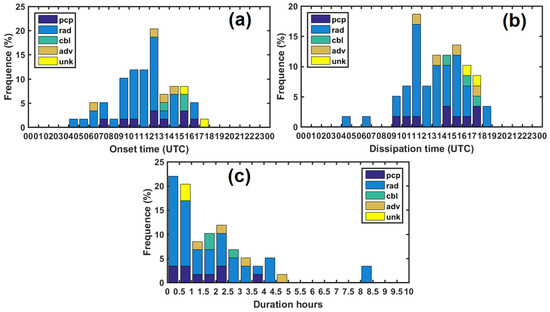
Figure 5.
Frequency distributions of (a) the onset time of fog and (b) the dissipation time of fog (c) the duration of fog in 2015–2017.
Figure 6 shows the time series of surface pressure (Figure 6a), temperature (Figure 6b) and relative humidity (Figure 6c) measured at 2 m height. The fog types are also plotted using five different colors. The surface pressure pattern depicted in Figure 6a shows that 25% of the fog events were associated with a high-pressure system (surface pressure over 1015 hPa [37], and 75% were associated with a low-pressure system. The time series of surface temperature (Figure 6b) suggested that fog events occurred at the coldest temperature of the day. A separate analysis confirmed that fog normally occurred near the minimum temperature of the day, except for some precipitation and cloud-base-lowering events. The corresponding relative humidity data shown in Figure 6c shows that the RH was usually greater than 95% during fog events, and only in very cold temperature cases (T ≈ −30 °C) was the relative humidity with respect to water near 70%, which would translate to 138% humidity with respect to ice, so these cases may be associated with ice fog.
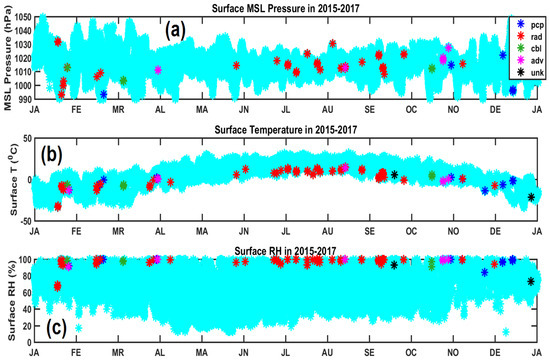
Figure 6.
The time series of surface pressure (a), temperature (b) and relative humidity (c) measured at 2 m height in 2015–2017. The types of fog that occurred are also indicated.
Figure 7 shows the frequency distribution of the observed visibility (Figure 7a), surface level temperature (Figure 7b) and relative humidity (Figure 7c), and the wind speed and direction (Figure 7d). The data in Figure 7a demonstrate that 94% of the low visibility (<0.4 km) cases were caused by radiation fog and the remainder, 6%, were caused by precipitation, advection, and cloud-base-lowering fogs. The distribution of surface wind speed and direction measured at about 2 m height (Figure 7d) shows that the wind speeds were greater than 2.5 during the cloud-base-lowering and advection fog events, and the corresponding wind directions were mainly coming from the southeast and east. Most of the radiation fogs occurred under calm wind conditions (<2 ), with the predominant wind coming from northwest, west, southwest, and south directions.
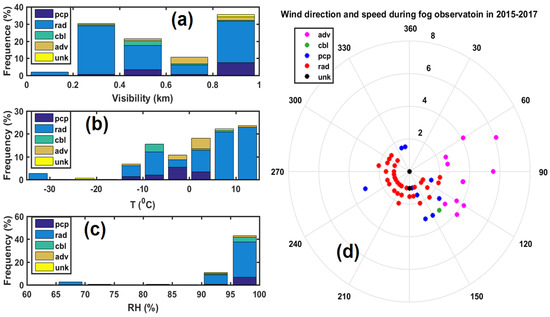
Figure 7.
The frequency of observed visibility (a), surface level temperature (b) and relative humidity (c), and wind speed and direction distribution (d) in 2015–2017.
3.2. Microphysical Characteristics of Fog at CYOD
To study the microphysical characteristics of the fog events observed at CYOD, the one-minute averaged observation data collected using the FM-120, PWD22 and Rotronic probes between January and September 2017 were used. The fog events were identified based on the METAR report when the visibility was less than 1 km and no precipitation was detected by the PWD22. According to the METAR reports, there were 18 fog events from January to September in 2017. The observed bulk microphysical parameters, such as the , droplet concentration and spectra, were used to investigate the microphysical characteristics of the different types of fog under various atmospheric conditions.
Figure 8 shows the one-minute averaged measured visibility using the PWD22 plotted against the one-minute averaged (Figure 8a), MVD (Figure 8b), and concentration Nd (Figure 8c), derived using the particle spectra measured using the FM-120 probe. The histogram of one-minute averaged concentration for different fog types (Figure 8d), the one-minute averaged fog particle spectra for different fog types (Figure 8e), the mean particle spectra of the period from January to September 2017 for a number of fog types (Figure 8f) with varying temperature (Figure 8g), and (Figure 8h) are also shown in the figure. There was no cloud-base-lowering fog event and only one unknown fog event was identified during this study period. The associated fog type is also shown in the figure (Figure 8a–f). As indicated in Figure 8a, radiation fog was dominant at CYOD, as discussed earlier, and was normally characterized by higher (>0.1 gm−3) and dense fog with visibility less than 400 m. The LWC during the advection and precipitation fog events was less than 0.06 gm−3 while the maximum one-minute averaged LWC during radiation fogs could exceed 1.2 gm−3. As indicated in Figure 8b, the observed MVD in advection and precipitation fog events were between 17 μm and 35 μm, while the MVD observed in the radiation fog events varied more widely between 7 μm and 45 μm. Figure 8c,d show that in radiation fog varied from near 5 cm−3 to more than 230 cm−3, the lower end being the most frequent, but, for precipitation and advection fog events, the values of were less than 40 cm−3. It was found that the visibility decreased when and increased (as seen in Figure 8a,c). The one-minute averaged particle spectra for different fog types (Figure 8e) indicated that the particle size and Nd of radiation fog were much greater compared to the other fog types. Each of the observed one-minute averaged drop spectra showed bimodal size distributions, with one mode around 4 μm and the other near the higher end of the spectrum, that varied from 17 μm to 25 μm depending on the meteorological condition. The maximum total concentrations were around 100 cm−3 and 20 cm−3 for the two modes, respectively. The observed mean particle spectra during the fog events (Figure 8f–h) showed clearly bimodal size distributions, as indicated in Figure 8e. Figure 8f illustrates that the second mode of the mean spectra of radiation fog shifted to large particle sizes compared to the other fog types. Figure 8g shows that there was no significant difference in droplet particle spectra between warm (T > 0 °C) and freezing (−10 < T ≤ 0 °C) conditions (possibly super-cooled), but, at colder temperatures (T ≤ −10 °C), where mixed phase conditions were expected, smaller particle concentrations were observed and the second mode of the bimodal distribution peaked at smaller sizes around 17 μm; however, the accuracy of the FM-120 probe when sizing non-spherical ice particles may be questionable since the probe assumes perfectly spherical water drops [38]. As shown in Figure 8h, the first mode of the distribution of large (>0.1 gm−3) was almost overlapped by those of small LWC (0.01 < LWC ≤ 0.1 gm−3), but the second mode of large LWC shifted to larger size with increasing , indicating that large LWC was mainly comprised of the large particle size (D > 7 μm).
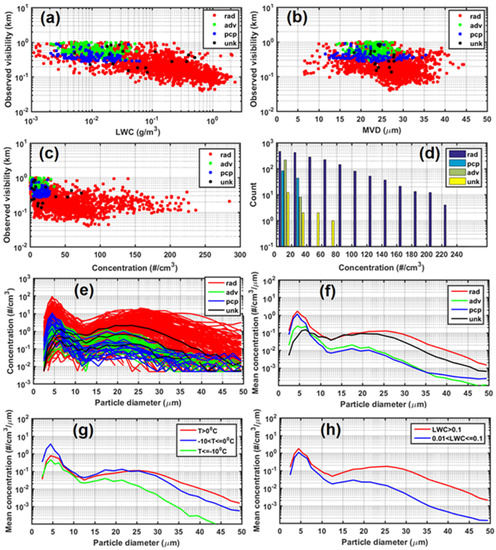
Figure 8.
The relationship between the one-minute visibility measured using the PWD22 against the one-minute averaged LWC (a), MVD (b) and concentration Nd (c) using the FM-120 probe; The histogram of one-minute averaged concentration for different fog types (d); The one-minute averaged fog particle spectra for different fog types (e); The mean fog particle spectra of the period from January to September 2017 for different fog types (f), temperatures (g), and different LWC (h).
3.3. Parametrization of Extinction/Visibility
To investigate the relationships between visibility/extinction, the relevant bulk microphysics parameters, such as LWC, drop spectra and concertation, were used. These parameters were measured using the DMT fog monitor (FM-120) that outputs data at a one-second temporal resolution. The Vaisala PWD22 weather probe measured the visibility, precipitation intensity and type. Additionally, the Rotronic MP102 T/RH probes measured the temperature and humidity data every minute. For this study, a one-minute averaged integrated dataset collected between January and September 2017 was used. The visibility reduction due to precipitation events was excluded using the present weather probe reports. The Vaisala PWD22 sensor estimated Vis using Equation (1) assuming a visual contrast of 0.05 [11,16].
A lower visual threshold of 2% has been used (e.g., [15]). In this study, the visual threshold of 5% was adopted since this is consistent with the PWD22 data and WMO recommendations. The more sophisticated current NWP models predict the bulk microphysical quantities, such as extinction and LWC, based on an assumed single-modal fog particle size distribution [28,39,40]. When such information is available, most models mainly rely on parameterization of extinction or visibility, mainly using surface-based observation data. Extinction or visibility in fog has been parameterized in terms of RH and dewpoint depression [11,21,41], LWC and Nd [2,14,15,22]. Based on definitions of the parameters, [14] determined the visibility as
where is the density of water and is the number concentration. The exponent of LWC in Equation (7) matches that proposed by [21] and the relationship shows that visibility is more sensitive to changes in LWC than . The authors of [2,21] and [15] parameterized visibility as
where c and d are constants; their values c (d) are given as 1.002 (0.87706) and 0.6473 (0.49034) in [21] and [2], respectively. On the other hand, in [15], the coefficients for all combined fog events were 0.797 and 0.535, respectively, for c and d. It is worth mentioning that when the measured visibility using the present weather sensors are used instead of the calculated visibility based on FM fog detector measurements, the relationship given in Equation (8) gives very different coefficients (see ref. [15] and references therein). Without performing regression, using Equations (3)–(5), and assuming extinction can be directly related to LWC and in a form as (see ref. [14]):
where the and the density of water are given in gm−3 and the area weighed diameter is given in m. The extinction is given in m−1. In order to investigate the dependence of on , , , and , scatterplots for each case are given in Figure 9 and the associated best-fit regression lines and the correlation coefficients are also given. Based on these results, although the correlation coefficients were close, the error variance (EV), or the square of root mean square error (RMSE), were higher when only was used (Figure 9b), by a factor of three compared to when LWC was used (Figure 9a), and by more than a factor of 10 when both Nd and LWC were used (Figure 9c). Figure 9d shows derived in this study; as indicated in the plot, there is excellent agreement with the FM-120 observation with R close to 1 and a mean square error (MES) of near zero.
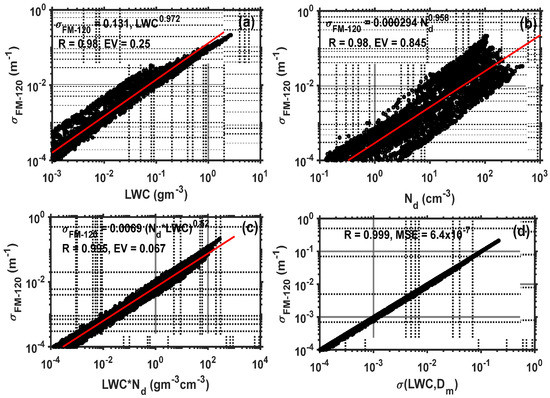
Figure 9.
Scatterplots of extinction derived from FM-120 against LWC (a), Nd (b), LWC × Nd (c), and LWC and (Equation (10)) (d). The correlation coefficient (R), error variance (EV), and root mean error (RME) are also given.
Figure 10 compares the relationships based on (I-2020) [14], (G-2009) [2], and (Z-2014) [15] and this investigation. All the relationships showed good agreement; however, based on these results, I-2020 and (Equation (10)) appeared to be closer, although I-2020 estimated slightly higher extinction compared to the other parameterizations. The better agreement of the extinction parameterization that included , other than , was because is inversely proportional to the cross-sectional area (Equation (7)), which is directly related to extinction (Equation (5)).
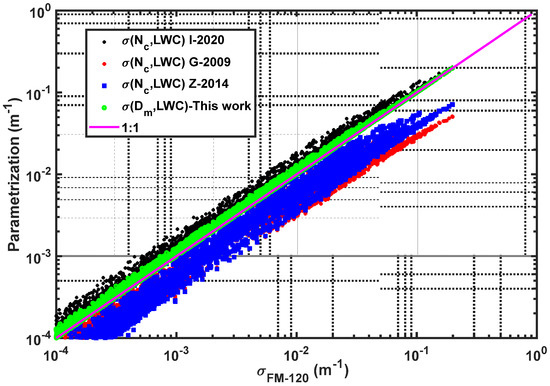
Figure 10.
Comparison of different relationships: (I-2020) [14], (G-2009) [2] and (Z-2014) [15] and based on this study.
3.4. Comparisons of FM-120 and PWD22
The Vaisala PWD22 probe measures extinction and then converts it to visibility using Equation (1) as stated earlier and hence it can be directly compared with FM-120 () data. Figure 11 shows extinction plotted against the extinction measured with the PWD22 (. As shown in the plot, the FM-120 estimated higher extinction as compared to the PWD22 for ( 0.002 m-1) or visibility less than approximately 1.5 km which is very close to moderate to heavy fog (FG). The mist (BR) and drizzle (DZ) case reported by the PWD22 are also shown and according these results the PWD22 detects more of the mist cases as compared to the FM-120. As mentioned earlier mist was identified mainly based on visibility and hence it cannot be directly related to size based on the PWD22 measurement alone.
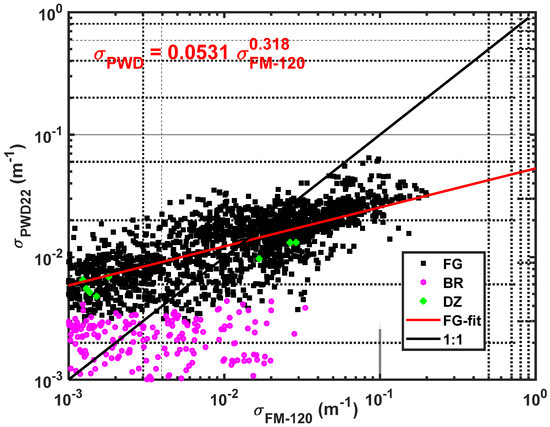
Figure 11.
Scatterplots of extinction based on FM-120 and PWD22. Mist (BR), fog (FG) and drizzle (DZ) cases are also shown.
Figure 12 shows the ratio plotted against (Figure 12a), (Figure 12b), (Figure 12c) and (Figure 12d) for both fog and mist cases. As indicated in the plots, there was some size dependence for the fog case showing higher ratios related to larger particle sizes, but for the mist case the FM-120 probe measured lower extinction for all sizes, except near 6 µm, where it showed a stronger peak, suggesting that the FM-120, under some misty conditions, detects more small particles (5 µm < < 7 µm) (Figure 12a). However, there was a clear , , and dependence indicating that the detection efficiency of increased with increasing , and (Figure 12b–d). In addition, there was a clear distinction between the fog and mist cases, particularly for > 0.002 gm−3, > 1 cm−3, and > 200 gm−4. As demonstrated in Figure 12a, all the ratios > 1 indicated in Figure 12b,c, and d during the mist events were associated with small particles in the size range mentioned above, and these were also characterized by higher LWC and thus, the discrepancy between these probes during the mist events cannot be explained based on the particle size alone. For the same mass, small and numerous particles are known to have higher effective surface area and, hence, higher extinction. According to these results , and appear to be more important than alone for both fog and mist cases. Based on these results, there was no clear evidence of particle losses for (D < 10 μm) and (D~50 μm), as suggested in [31]. In fact, as mentioned previously, the collection efficiency of the FM-120 probe, particularly in fog, increased with increasing particle size compared to the PWD22 probe. According to these results, the ratio showed a clearer relationship with , as would be expected from Equation (10); the best-fit lines for both mist and cases are shown in Figure 12d. This information could be used to make corrections to the visibility parameterization, rather than developing two separate parameterizations, one with visibility estimated using the present weather sensors, and the other estimated based on particle spectra measured, using probes such as the FM-120 probes.
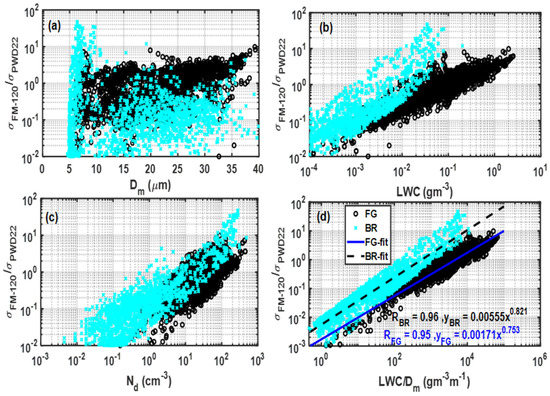
Figure 12.
The ratio plotted against (a), (b), (c) and (d) for both fog and mist cases.
However, further investigations are necessary to understand the causes of these discrepancies between these two probes. One way to test the accuracy of these probes would be to compare them against human vision, but there are a number of difficulties associated with doing this, including that there are some differences between nighttime and daytime human vision, as discussed earlier. One example is given in Figure 13 for 22 July 2017 that shows visibility estimated using both FM-120 and PWD22, and human observation based on METAR (Figure 13a) during nighttime, as indicated by the observed luminance measured using the Vaisala FS11P [42] (Figure 13c). The relative humidity was close to saturation during the fog event and the temperature was radiatively cooled overnight from 20 °C to close to 12 °C. As indicated in Figure 13a, visibility based on human observation is much greater compared to visibility calculated based on the two probes. As mentioned earlier, this is because the human eye sees further under an artificial light at night and, hence, needs to be corrected by using Equation (3). After corrections were applied to the values of measured visibilities, they were much closer to human observations, particularly that based on the PWD22 (Figure 13b).
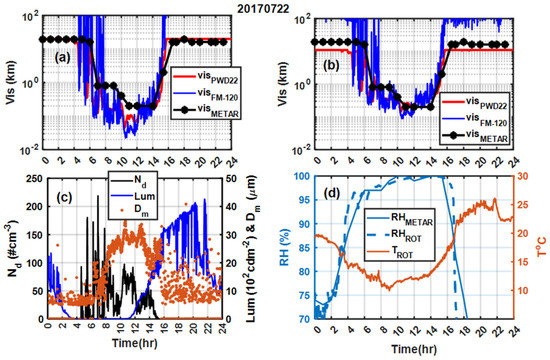
Figure 13.
Visibility estimated using both FM-120 and PWD22, and human observation (METAR) (a), after correction of measured visibilities for nighttime (b), for fog event occurring during nighttime as indicated by the observed luminance (c), and the relative humidity and temperature (d) for 22 July 2017 case.
The FM-120 probe estimated higher extinction when both and were relatively high (Figure 13c). Similar plots for a wintertime case on 20 January 2017 are shown in Figure 14. In this case, the fog event also occurred during the night (Figure 14c). The PWD22 also agreed better with human observation (Figure 14b), but, because of cold temperatures (−12 °C < T < −5 °C), it was a freezing fog event, potentially due to radiative cooling during the night. The RH sensors gave conflicting results; however, based on the one reported by the human observer (METAR), the RH values exceeded 95%. Similar to the 22 July case, the PWD22 data agreed with the human observation data, and the FM-120 results appeared to fluctuate more (a and b).
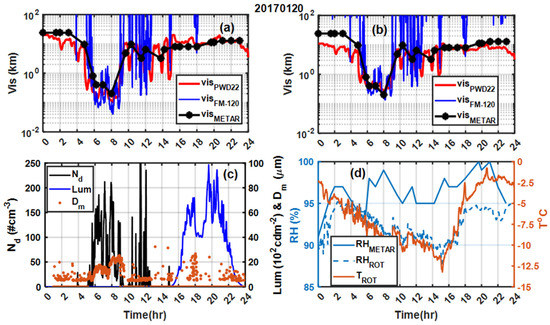
Figure 14.
As for Figure 13 but for the 20 January 2017 case (a–d).
As mentioned earlier, by combining the LWC and measured using the FM-120 and visibility obtained from the PWD22, a regression equation similar to Equation (8) can be derived. Figure 15 shows the scatterplots of visibility against LWC for different temperatures (Figure 15a), for warm fogs with binned data in red circles (Figure 15b), the same as Figure 15b but based on calculated visibility (Figure 15c), and, for warm fogs, the observed visibility is plotted against the inverse of the product of LWC and (Figure 15d). The parameterization equation with correlation coefficient R, standard deviation σ and relative error ε are shown in each panel. The best-fit lines for each panel are also shown in the figure. The binned data in red circles represent the mean value of LWC; visibility in each bin is matched with the fit line in Figure 15b. The regression relationships of observed visibility versus LWC for all temperatures and for warm fog events (T ≥ 0 °C) are given in Equations (11) and (12), respectively. For warm fogs, the regression relationship of calculated visibility versus LWC is given in Equation (13), and the relationship between observed visibility and both LWC and Nd is given in Equation (14).
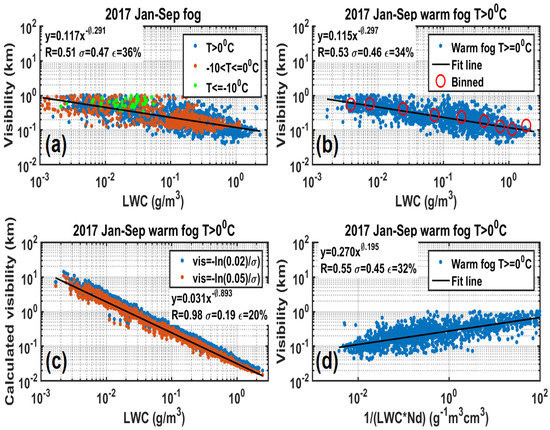
Figure 15.
Parameterization of observed visibility as a function of LWC for all temperature fogs (a), for warm fogs (T ≥ 0 °C) with binned data in red circle (b); Parameterization of calculated visibility using the visual contrast of 5% (blue dots) as a function of LWC, and the calculated visibility using the visual contrast of 2% shown in blue dots (c); Parameterization of observed visibility as a function of both LWC and Nd for warm fogs (T ≥ 0 °C) (d). The parameterization equation with correlation coefficient R and standard deviation σ are shown in each panel.
The parameter b (see Equation (4)), derived using the observed visibility and LWC in this study (Equations (11) and (12)), was close to 0.1 that would represent dense fog, but the value for a = 0.3 derived in this study deviates from the two-thirds assumption based on the gamma size distribution [21,22] or the theoretical derivation of [14]. In comparison to the results reported in [15], based on the observed visibility, the parameter b found in this study lies between their values for light and dense fog cases, but the parameter a derived in this study was higher than their value of 0.215 for dense fogs. The parameters (0.031, 0.893) shown in Equation (13), based on calculated visibility, were comparable to the values (0.027, 0.88) suggested by [41] and (0.0219, 0.960) by [24], and (0.017, 0.871) by [15] using calculated visibility. The parameters of parameterization given in Equation (14) (0.270 and 0.195) were closer to those for dense fogs (0.212 and 0.147) proposed by [15].
The relative error of observed visibility parameterization as a function of for all temperature and fog events (Equation (11)) was 36% and for warm fog events (Equation (12)) was 34%, with correlation coefficients of 0.51 and 0.53 and standard deviations of 0.47 km and 0.46 km, respectively (see Figure 15a,b). The relative error of the parameterization, as a function of both and (Equation (14)), as shown in Figure 15d, was 32%, with a correlation coefficient of 0.55 and standard deviation of 0.45 km, representing small improvements over the use of just (Figure 15b). In Figure 15c, the best-fit line, as shown in Equation (13), for the calculated visibility that included the fog particle spectra, gave a better correlation 0.98 and relatively lower relative error 20%, as would be expected since both and extinction were derived using the FM-120 probe data. However, the calculated visibilities based on the FM-120 data were smaller than the measured visibilities using the PWD22 present weather sensor when the > 0.1 gm−3, and larger when LWC < 0.1 gm−3, but the reasons are not well understood. According to this result, there was no indication that the FM-120 suffered from losing some particles as suggested by [31]. The authors of [15] found that the observed visibility was similar to the calculated visibility for dense fogs and smaller than the calculated visibility using the DMT FM-100 probe for light fogs. They attributed this discrepancy to the possible effect of aerosol concentrations which were not measured by the DMT FM-100 probe but were included in the extinction seen by the PWD22 probe. This is probably true for heavily polluted locations, but the effect seen in this study was the opposite when dense fogs occurred, and no clear explanation can be offered at this stage. Using a lower visual threshold of 2%, as shown in Equation (5), for visibility calculation (shown in Figure 15c as blue dots) as performed by [15], can enhance the visibility by a certain amount, but not enough to explain the phenomena.
No effect was found when the first modes (2–15 μm), which may have contained some aerosols, were removed from the observed spectra, with no significant effect observed on the calculated visibility. The FM-120 probe was installed at 2 m height, which was lower than where the PWD22 was installed (z~3 m). If there was a decrease in LWC within this layer, it is possible that the PWD22 may measure larger visibility, but this cannot be validated based on the available measurements. Another possible explanation is that when the was significant during heavy fog, the forward scattered radiation was obscured by a high concentration of drop particles that may have led to lower extinction data being recorded by the PWD22 probe. Furthermore, the PWD22 uses infrared light instead of visible light and different suspended particulates and water droplets in the air have different scattering properties; hence, the use of a fixed wavelength of light and a fixed scattering angle may make a particular forward-scatter sensor less suitable in certain weather conditions [43].
4. Conclusions
In this study, the climatological and microphysical statistical behaviors of different fog events were investigated using hourly and sub-hourly reported METAR data and high-resolution microphysical and meteorological measurements obtained at Cold Lake, Alberta, Canada (CYOD). Based on the observation data and using the fog classification scheme proposed by [6], four different fog types, radiation, advection, precipitation, and cloud-base-lowering were identified. Statistical analysis of the data showed that radiation fog dominated throughout the year, especially in spring and summer seasons. The other fog types. such as precipitation, advection and cloud-base-lowering fog occurred in the autumn and winter seasons. It was found that radiation fog was associated with lower visibilities, longer duration and larger compared to the other fog types. The measured mean fog spectra for different fog types and temperature showed a bimodal size distribution, with peaks near 4 μm and 17–25 μm and maximum total concentration of around 100 cm−3 and 20 cm−3 for the two modes, respectively. Most of the particle sizes that contributed to the observed mass ( > 0.1 gm−3) were D > 7 um. In this study, a number of extinction/visibility parameterizations, as a function of bulk microphysical parameters, such as , and , as well as combinations of these parameters and , were tested and the best relationship was found for The coefficients in the parameterization equations based on the observed visibility were closer to the parameters proposed by [15] using the observed visibility for dense fogs, and the parameters based on the calculated visibility were comparable with those for the calculated visibility using spectra [15,24,41]. The relative error of the parameterization using both Nd and was slightly smaller than for the parameterization using alone. The calculated visibility using fog droplet spectra was higher than the observed visibility for small (<0.1 gm−3), but lower for higher ( > 0.1 gm−3) or extinction (σ > 0.002 m−1). The case with small ( < 0.1 gm−3) was consistent with [15] who suggested that the difference may be due to the omission of aerosols in the calculation of extinction. However, this does not explain the high extinction case in this study, and further studies are required to better understand these discrepancies.
Author Contributions
Project administration, funding acquisition, conceptualization, methodology, validation, formal analysis, data curation, writing—original draft preparation, F.S.B.; formal analysis, writing—original draft preparation, D.W.; writing—review and editing, I.G. and G.A.I. All authors have read and agreed to the published version of the manuscript.
Funding
This research was funded by the Department of National Defense (DND) and the Canadian National Search and Rescue New Initiative Fund (SAR-NIF) under the SAR project SN201532.
Data Availability Statement
The datasets used in this study are not yet publicly available but can be requested from F.S.B.
Acknowledgments
The authors thank Mike Harwood and Robert Reed for helping with installation of the instruments at Cold Lake, and Robert Crawford for archiving the data. We would also like to extend our thanks to Jeff Baker, Maksim Houde, Amy Slade-Campbell, and Gordon Lee of DND for providing METAR data, and to Randy Blackwell for helping during the instrument installation process.
Conflicts of Interest
The authors declare no conflict of interest.
References
- World Meteorological Organization. Fog. Available online: https://cloudatlas.wmo.int/en/fog.html (accessed on 4 July 2022).
- Gultepe, I.; Pearson, G.; Milbrandt, J.A.; Hansen, B.; Platnick, S.; Taylor, P.; Gordon, M.; Oakley, J.P.; Cober, S.G. The fog remote sensing and modeling (FRAM) field project. Bull. Am. Meteorol. Soc. 2009, 90, 341–359. [Google Scholar] [CrossRef]
- Jung, S.; Qin, X.; Oh, C.A. Risk-based systematic method for identifying fog-related crash prone locations. Appl. Spat. Anal. Policy 2019, 12, 729–751. [Google Scholar] [CrossRef]
- Fultz, A.J.; Ashle, W.S. Fatal weather related general aviation accidents in the United States. Phys. Geogr. 2016, 37, 291–312. [Google Scholar] [CrossRef]
- Maalick, Z.; Kühn, T.; Korhonen, H.; Kokkola, H.; Laaksonen, A.; Romakkaniemi, S. Effect of aerosol concentration and absorbing aerosol on the radiation fog life cycle. Atmos. Environ. 2016, 133, 26–33. [Google Scholar] [CrossRef]
- Tardif, R.; Rasmussen, R.M. Process-oriented analysis of environmental conditions associated with precipitation fog events in the Near York city region. J. Appl. Meteor. Clim. 2008, 47, 1681–1703. [Google Scholar] [CrossRef]
- Friedlein, M.T. Dense fog climatology: Chicago O’Hare International Airport, July 1996–April 2002. Bull. Am. Meteor. Soc. 2004, 85, 515–517. [Google Scholar] [CrossRef]
- Cho, Y.-K.; Kim, M.-O.; Kim, B.-C. Sea fog around the Korean Peninsula. J. Appl. Meteor. 2000, 39, 2473–2479. [Google Scholar] [CrossRef]
- Lewis, J.; Koracin, D.; Rabin, R.; Businger, J. Sea fog off the California coast: Viewed in the context of transient weather systems. J. Geophys. Res. 2003, 108, 4457. [Google Scholar] [CrossRef]
- Stolaki, S.N.; Kazadzis, S.A.; Foris, D.V.; Karacostas, T.S. Fog characteristics at the airport of Thessaloniki, Greece. Nat. Hazards Earth Syst. Sci. 2009, 9, 1541–1549. [Google Scholar] [CrossRef]
- Boudala, F.S.; Isaac, G.A.; Crawford, R.; Reid, J. Parameterization of runway visual range as a function of visibility: Application in numerical weather prediction models. J. Atmos. Ocean. Technol. 2012, 29, 177–191. [Google Scholar] [CrossRef]
- Kunkel, B.A. Microphysical Properties of Fog at Otis AFB; Environmental Research Paper 767; AFGL-TR-82-0026, Meteorology Division, Air Force Geophysics Laboratory, Hanscom AFB: Bedford, MA, USA, 1982. [Google Scholar]
- Gultepe, I.; Tardif, R.; Michaelides, S.C.; Cermak, J.; Bott, A.; Bendix, J.; Müller, M.D.; Pagowski, M.; Hansen, B.; Ellrod, G.; et al. Fog research: A review of past achievements and future perspectives. J. Pure Appl. Geophys. 2007, 164, 1121–1159. [Google Scholar] [CrossRef]
- Isaac, G.A.; Bullock, T.; Beale, J.; Beale, S. Characterizing and Predicting Marine Fog Offshore Newfoundland and Labrador. Weather Forecast. 2020, 35, 347–365. [Google Scholar] [CrossRef]
- Zhang, J.; Xue, H.; Deng, Z.; Ma, N.; Zhao, C.; Zhang, Q. A comparison of the parameterization schemes of fog visibility using the in-situ measurements in the North China Plain. Atmos. Environ. 2014, 92, 44–50. [Google Scholar] [CrossRef]
- Boudala, F.S.; Isaac, G.A. Parameterization of visibility in snow: Application in numerical weather prediction models. J. Geophys. Res. 2009, 114, D19202. [Google Scholar] [CrossRef]
- Koschmieder, H. The´orie der horizontalen Sichweite. Beitr. Freien Atmos. 1924, 12, 171–181. [Google Scholar]
- Allard, E. Mémorie sur l’Intensité et la Porteé des Phares; Dunod: Paris, France, 1876; 70p. [Google Scholar]
- Tampieri, F.; Tomasi, C. Size distribution models of fog and cloud droplets in terms of the modified gamma function. Tellus 1976, 28, 333–347. [Google Scholar] [CrossRef][Green Version]
- Fisak, J.; Rezacova, D.; Mattanen, J. Calculated and measured values of liquid water content in clean and polluted environments. Stud. Geophys. Geod. 2006, 50, 121–130. [Google Scholar] [CrossRef]
- Eldridge, G.R. Haze and fog aerosol distributions. J. Atmos. Sci. 1966, 23, 605–613. [Google Scholar] [CrossRef]
- Tomasi, C.; Tampieri, F. Features of the proportionality coefficient in the relationship between visibility and liquid water content in haze and fog. Atmosphere 1976, 14, 61–76. [Google Scholar] [CrossRef]
- Muhammad, S.S.; Awan, M.S.; Rehman, A. PDF estimation and liquid water content based attenuation modeling for fog in terrestrial FSO links. Radioengineering 2010, 19, 228–236. [Google Scholar]
- Gultepe, I.; Muller, M.D.; Boybeyi, M.D. A new visibility parameterization for warm-fog application in numerical models. J. Appl. Meteor. Climatol. 2006, 45, 1469–1480. [Google Scholar] [CrossRef]
- Elias, T.; Dupont, J.-C.; Hammer, E.; Hoyle, C.R.; Haeffelin, M.; Burnet, F.; Jolivet, D. Enhanced extinction of visible radiation due to hydrated aerosols in mist and fog. Atmos. Chem. Phys. 2015, 15, 6605–6666. [Google Scholar] [CrossRef]
- Vaisala. Present Weather Detector PWD22 USER’S GUIDE. 2004. Available online: https://www.manualslib.com/manual/2118085/Vaisala-Pwd22-52.html (accessed on 22 July 2022).
- Boudala, F.S.; Isaac, G.A.; Filman, P.; Crawford, R.; Hudak, D.; Anderson, M. Performance of emerging technologies for Measuring Solid and Liquid Precipitation in Cold Climate as compared to the Traditional Manual Gauges. J. Atmos. Ocean. Technol. 2017, 34, 167–185. [Google Scholar] [CrossRef]
- Boudala, F.S.; Isaac, G.A.; Wu, D. Aircraft Icing Study Using Integrated Observations and Model Data. Weather Forecast. 2019, 34, 485–506. [Google Scholar] [CrossRef]
- Bohren, C.F.; Huffman, D.R. Absorption and Scattering of Light by Small Particles; Wiley: New York, NY, USA, 1983. [Google Scholar]
- Mätzler, C. MATLAB Functions for Mie Scattering and Absorption; Research Report; University of Bern: Bern, Switzerland, 2002. [Google Scholar]
- Spiegel, J.K.; Zieger, P.; Bukowiecki, N.; Hammer, E.; Weingartner, E.; Eugster, W. Evaluating the capabilities and uncertainties of droplet measurements for the fog droplet spectrometer (FM-100). Atmos. Meas. Tech. 2012, 5, 2237–2260. [Google Scholar] [CrossRef]
- Karlsson, L.; Krejci, R.; Koike, M.; Ebell, K.; Zieger, P. A long-term study of cloud residuals from low-level Arctic clouds. Atmos. Chem. Phys. 2021, 21, 8933–8959. [Google Scholar] [CrossRef]
- Koike, M.; Ukita, J.; Strom, J.; Tunved, P.; Shiobara, M.; Vitale, V.; Lupi, A.; Baumgardner, D.; Ritter, C.; Hermansen, O.; et al. Year- round in situ measurements of arctic low-level clouds: Microphysical properties andtheir relationships with aerosols. Geophys. Res. Atmos. 2019, 124, 1798–1822. [Google Scholar] [CrossRef]
- Duplessis, P.; Bhatia, S.; Hartery, S.; Wheeler, M.J.; Chang, R.Y.-W. Microphysics of aerosol, fog and droplet residuals on the Canadian Atlantic coast. Atmospheric Research. Atmos. Res. 2021, 264, 105859. [Google Scholar] [CrossRef]
- Misumi, R.; Uji, K.; Miura, T.; Mori, Y.; Tobo, Y. Iwamoto, 2022: Classification of aerosol-cloud interaction regimes over Tokyo. Atmos. Res. 2022, 272, 106150. [Google Scholar] [CrossRef]
- Zak, A.J. Drop Size Distributions and Related Properties of Fog for Five Locations Measured from Aircraft; NASA Technical Reports: Hampton, VA, USA, 1994. available online: https://ntrs.nasa.gov/search.jsp?R=19940028559 (accessed on 4 July 2022).
- Toanca, F.; Stefan, S.; Labzovskii, L.; Belegante, L.; Andrei, S.; Nicolae, D. Study of fog events using remote sensing data. Rom. Rep. Phys. 2017, 69, 703. [Google Scholar]
- Baumgardner, D.; Abel, S.J.; Axisa, D.; Cotton, R.; Crosier, J.; Field, P.; Gurganus, C.; Heymsfield, A.; Korolev, A.; Krämer, M.; et al. Cloud ice properties: In situ measurement challenges. Ice Formation and Evolution in Clouds and Precipitation: Measurement and Modeling Challenges. Meteor. Monogr. 2017, 58, 9.1–9.23. [Google Scholar] [CrossRef]
- Boutle, I.; Angevine, A.; Bao, J.-W.; Bergot, T.; Bhattacharya, R.; Bott, A.; Ducongé, L.; Forbes, R.; Goecke, T.; Grell, E.; et al. Demistify a large-eddy simulation (LES) and single-column model (SCM) Intercomparison of radiation fog. Atmos. Chem. Phys. 2022, 22, 319–333. [Google Scholar] [CrossRef]
- Geoffroy, O.; Brenguier, J.L.; Burnet, F. Parametric representation of the cloud droplet spectra for LES warm bulk microphysical schemes. Atmos. Chem. Phys. 2010, 10, 4835–4848. [Google Scholar] [CrossRef]
- Kunkel, B.A. Parameterization of Droplet Terminal Velocity and Extinction Coefficient in Fog Models. J. Clim. Appl. Meteor. 1984, 23, 34–41. [Google Scholar] [CrossRef]
- Boudala, F.S.; Gultepe, J.; Milbrandt, J.A. The Performance of Commonly Used Surface-Based Instruments for Measuring Visibility, Cloud Ceiling, and Humidity at Cold Lake, Alberta. Remote Sens. 2021, 13, 5058. [Google Scholar] [CrossRef]
- Chan, P.W. A test of visibility sensors at Hong Kong international airport. Weather 2016, 71, 241–246. [Google Scholar] [CrossRef]
Publisher’s Note: MDPI stays neutral with regard to jurisdictional claims in published maps and institutional affiliations. |
© 2022 by the authors. Licensee MDPI, Basel, Switzerland. This article is an open access article distributed under the terms and conditions of the Creative Commons Attribution (CC BY) license (https://creativecommons.org/licenses/by/4.0/).