Article

The Three Rivers Source Region Alpine Grassland Ecosystem Was a Weak Carbon Sink Based on BEPS Model Analysis

State Key Laboratory of Earth Surface Processes and Resource Ecology, Faculty of Geographical Science, Beijing Normal University, Beijing 100875, China
*
Author to whom correspondence should be addressed.
Remote Sens. 2022, 14(19), 4795; https://doi.org/10.3390/rs14194795
Submission received: 14 September 2022 / Accepted: 21 September 2022 / Published: 26 September 2022

Abstract

:
The Three Rivers Source Region (TRSR) is a natural habitat for rare animals and a genetic treasure trove of plateau organisms. It is an important eco-safety barrier in China and even Asia, and a priority of China’s to promote ecological advancement. Precisely assessing the dynamics and mechanisms of alpine grassland ecosystem carbon budgets is beneficial for quantifying the response to climate change on a regional scale. The spatial distribution and dynamic changes in carbon fluxes in the TRSR from 1985 to 2018 were analyzed by the Theil–Sen + Mann–Kendall and ensemble empirical mode decomposition (EEMD) methods, and multiple linear regression was used to quantify the contribution of meteorological elements to the carbon flux trends. The results indicated that (1) the alpine grassland ecosystem was a weak carbon sink. The multiyear mean gross primary production (GPP) and net ecosystem production (NEP) in the TRSR were 147.86 and 11.27 g C/m2/yr, respectively. The distribution of carbon fluxes progressively decreased from east to west. (2) The carbon fluxes of the alpine grassland ecosystem were dominated by a monotonically increasing trend, with increasing rates of GPP and NEP of 1.31 and 0.40 g C/m2/yr, respectively. A total of 48.60% of the alpine grassland showed a significant increase in NEP, whereas only 0.21% showed a significant decrease during the research term. (3) The alpine meadow sequestered carbon better than the alpine steppe did and accounted for more than 60% of the regional carbon sink. (4) In a correlation analysis between NEP and temperature, precipitation and solar radiation, the positive correlation accounted for 89.67%, 90.51%, and 21.16% of the TRSR, respectively. Rising temperatures and increased precipitation were the main drivers contributing to the increase in NEP. Research on carbon budget variability and mechanisms can help guide preservation zoning initiatives in national parks.

Graphical Abstract

1. Introduction

The grassland ecosystem is one of the most extensive ecosystems on earth, providing a massive foundation of resources and energy supply for human beings, as well as being critical to regional and global economic development [1,2,3,4]. This ecosystem also holds a substantial fraction of soil carbon and plays a pivotal role in terrestrial carbon fixation [5]. Multiple studies have indicated that the carbon budget of grassland ecosystems has dominated trends and interannual variability in global terrestrial carbon sinks over the past few decades [6,7]. Therefore, an accurate evaluation of carbon storage and dynamic changes will aid in the prediction of the feedback regulation between global climate change and grassland ecosystems [8].
The Three Rivers Source Region (TRSR) is positioned in the periphery of the Qinghai-Tibet Plateau and is the origin of the Yangtze, Huanghe, and Lancang Rivers and provides 25%, 49%, and 15% of the total freshwater supplies of the three rivers, respectively [9,10]. The region plays an irreplaceable role in China’s sustainable development [11,12]. Nevertheless, many studies have shown that the climate of the TRSR has altered dramatically in recent decades. For example, the rate of annual average temperature increase over the past half century has been 0.4 °C/10 years [13], which is more than double the rate of the global temperature rise [14], and the region is likely to continue to warm this century [15]. Precipitation in the winter and spring, on the other hand, has increased substantially, whereas precipitation in other seasons has not noticeably varied [16,17]. In addition, it is worth noting that the TRSR is experiencing vegetation deterioration, glacier retreat, wetland depletion, and decreased species diversity [18,19,20]. To halt the degradation of the ecological environment of the TRSR, the administration launched ecological protection and restoration of TRSR reserve zones in 2005. The government initiated the “Pilot Program of Three Rivers Source Region National Park System” in 2015, and the Three Rivers Source National Park (TRSNP) was codified in 2018 and proclaimed in 2021 [21]. Consequently, regional vegetation changes should be analyzed under the combined effect of climate change and human policy.
The balance between gross primary production (GPP) and ecosystem respiration (ER) is described as net ecosystem production (NEP), which is a crucial measure of ecosystem carbon budgets [22]. Due to the special geographical environment of the TRSR, such as its higher solar radiation and cooler temperature, the carbon budget of this ecosystem is of particular concern [23], but carbon source/sink dynamics are extremely unpredictable [24,25,26]. According to certain investigations, alpine meadows serve as “carbon sinks” [22,27,28,29,30]. Conversely, it has been demonstrated that steppe meadows in permafrost zones experience “sink–source” or “source–sink” transitions in response to the seasonal distribution and interannual fluctuation of external conditions such as temperature and precipitation [31,32]. For example, Koven et al. discovered that permafrost in high-elevation grassland ecosystems may change from a carbon sink to a carbon source under late 21st-century warming [33]. Climate variations often restrict grassland development and are the primary driver of interannual change in carbon sinks, as they can dramatically lower GPP and NEP [31]. Since previous research has mostly concentrated on single-point and short-term studies [34,35], the carbon budget of the TRSR has not been thoroughly characterized at regional and long-term scales. Therefore, the impact of climate change on the source/sink dynamics of alpine grassland ecosystems is not well understood, especially the effect of changes in the combination of hydrothermal factors on the interannual variability of carbon fluxes in alpine grassland ecosystems, which is more uncertain and needs to be studied in depth.
The boreal ecosystem productivity simulator (BEPS) model is an ecological remote sensing model developed on the basis of the forest biogeochemical cycles (forest-BGC) process model and was originally applied to Canadian boreal forest ecosystems [36,37]. This model is made up of modules for photosynthesis, energy balance, hydrology, and soil biogeochemistry, and it considers the coupling of terrestrial carbon, water, and nitrogen cycles [38]. The BEPS model introduces advanced radiative transfer theory and a sophisticated photosynthesis module, sorts the vegetation canopy leaves into sunlit and shaded leaves, and simulates the photosynthesis and evapotranspiration of these two types of leaves, thereby improving the accuracy of the simulation. Additionally, the model uses the Farquhar model to solve the compatibility problem of different types of data, as well as the spatio-temporal scale transformation of remote sensing data [39,40]. In recent years, the model has been widely used to simulate terrestrial carbon fluxes on regional and global scales [41,42,43,44].
In this study, the interannual dynamics of the carbon budget of the TRSR based on a long time series from 1985 to 2018 and its influencing factors were compared using the BEPS model. The objectives of this study were as follows: (1) to analyze the GPP and NEP variations within the TRSR and its subregions from 1985 to 2018; (2) to investigate the spatio-temporal distribution of carbon sources and sinks in the TRSR; (3) to evaluate the major mechanisms controlling carbon source and sink variability in alpine ecosystems.

2. Materials and Methods

2.1. Study Area

The TRSR, consisting of the Huanghe River Source Park (HRSP), the Yangtze River Source Park (YRSP), and the Lancang River Source Park (LRSP), is located on the northeastern Tibetan Plateau, with an average elevation more than 4500 m (Figure 1a). It covers an area of 35.05 × 10⁴ km2 (89°24′—102°15′E, 31°33′—36°17′N). In particular, the HRSP covers an area of 1.91 × 10⁴ km2, the YRSP covers an area of 9.03 × 10⁴ km2, and the area of LRSP is 1.37 × 10⁴ km2.
The TRSR is an ecotone between alpine meadow and alpine desert in the Qinghai-Tibet Plateau. The climate is plateau continental, and the terrain is dominated by high mountains, plateaus, and basins. The main vegetation types (Figure 1b) are alpine steppe, alpine meadow, and barren land, which are mostly found in the western part of the region, with a small mosaic of forests and shrubs. The average multiyear temperature ranges from −13.50 to 8.76 °C, with a 7–month cold season. The annual precipitation average is 194.02–769.55 mm, decreasing from the southeast to the northwest. There are 2000 ± 100 h of annual sunlight, >90 wind days per year, and the oxygen content in the study area is approximately 60~70% of the oxygen concentration at mean sea level.

2.2. Data Sources

2.2.1. Meteorological Data

In this study, meteorological data were used to estimate correlations and contributions to carbon fluxes (Table 1). The meteorological data were obtained from 1985 to 2018 at a spatial resolution of 0.1° from the China meteorological forcing dataset (http://data.tpdc.ac.cn, accessed on 10 December 2021) [45,46,47]. In this study, the data were calculated and transformed into yearly mean temperature, precipitation, and solar radiation.

2.2.2. Carbon Fluxes Production

The BEPS model has been shown to be capable of assessing the impact of changes in the leaf area index (LAI) on the carbon cycle [37,48]. In the BEPS, GPP is calculated as:
G P P = G P P s u n l i t L A I s u n l i t + G P P s h a d e L A I s h a d e
where GPPsunlit and GPPshade are GPP of sun leaves and shade leaves per unit area, respectively. LAIsunlit and LAIshade are the LAIs of sun leaves and shade leaves, respectively
L A I s u n l i t = 2 × cos θ × 1 exp 0.5 × Ω × L A I cos θ
L A I s h a d e = L A I L A I s u n l i t
where Ω is the clumping index derived from MODIS data at a 500 m resolution [49] and θ is the daily mean solar zenith angle. Moreover, the validation results using flux tower GPP demonstrated that this dataset has satisfactory precision in almost every biome [41]. In the BEPS model, NEP is calculated as:
N E P = G P P A R H R
where AR is autotrophic respiration and HR is heterotrophic respiration, both of which make up the total ecosystem respiration. AR consists of growth respiration (GR) and maintenance respiration (MR). GR is assumed to be 25% of GPP, the MR of plant carbon pools is estimated based on their size, temperature, and reference respiration rate, and the simulation of the HR part utilizes the CENTURY model approach [50]. Yearly BEPS carbon fluxes with a spatial resolution of 0.072727° × 0.072727° during the 1985–2018 period were used in this study (http://nesdc.org.cn/, accessed on 6 January 2022) [51,52].

2.3. Analysis Methods

2.3.1. Analysis of the Carbon Flux Trends

The Theil–Sen median trend analysis, in conjunction with the Mann–Kendall (MK) test, was used to explore long-term change trends of the impact of climate change on vegetation [53,54,55,56,57]. It has the advantage that it does not require the sample to adhere to a certain distribution and is unaffected by a few outliers.
It has the advantage of not requiring the sample to adhere to a certain distribution and is unaffected by a small number of abnormal values. It is better suited for type variables and ordinal variables, and the calculation is straightforward. The Theil–Sen median trend analysis and the MK test were carried out using the open–source software pymannkendall 1.4.2. (https://pypi.org/, accessed on 6 January 2022) [58]. The MK statistic β is given as follows:
β = Median ( x i x j i j ) , 1985 j < i 2018
where β is the changing trend of pixel GPP/NEP; i and j are time series; xi and xj represent the pixel GPP/NEP value at times i and j, respectively; when β > 0, it indicates that the GPP/NEP in the pixel shows an increasing trend; and when β < 0, it represents that the GPP/NEP in the pixel shows a decreasing trend. The MK test, a nonparametric statistical test, is commonly used to assess the significance of Theil–Sen median trends [53]. It has also been used to examine the trends in vegetation growth over long periods [54,59]. The MK statistic, i.e., Z, is defined as follows:
Z m k = { s 1 var ( s )   ( s > 0 ) 0 ( s = 0 ) s + 1 var ( s )   ( s < 0 )
var ( s ) = n ( n 1 ) ( 2 n + 5 ) 18
s = j = 1 n 1 i = j + 1 n f ( x i x j )
f ( x i x j ) = { 1   x i - x j < 0   0   x i - x j = 0 1   x i - x j > 0  
The Zmk statistic value ranges from −∞ to +∞, and |Zmk| indicates whether the long-term displays significance at the level of α. For this research, we set α to 0.05; thus, |Zmk| = 1.96.
Based on the detected trends and its significance test results, the GPP/NEP changing trends were re-classified into four classes, as indicated in Table 2.

2.3.2. Ensemble Empirical Mode Decomposition

Ensemble empirical mode decomposition (EEMD) was used to study the fluctuation and trend of carbon fluxes and meteorological factors [60,61,62,63]. The main principle of this method is to decompose the original data into independent modes, including intrinsic mode functions (IMFs) with different characteristic scales and a trend component.
X j ( t ) = i = 1 n S i j ( t ) + r j ( t )
Xj(t) is the original data sequence, Sij(t) is the component of different IMFs, and rj is the trend term. The variation period of each IMF component is:
P K = L E K
where L is the length of the IMF component and Ek is the number of extreme points of the k-th IMF component. The importance of the IMF components at various timescales can be estimated by the variance contribution rate:
V i = k = 1 k ( S i ( t ) ) 2 ( k = 1 k S i ( t ) ) 2
V = V i i = 1 i V i × 100 %
where Vi is the variance of the ith component Si(t), and V is the variance contribution rate of this component. The greater the V value is, the more powerful the ability of this component to reflect the original sequence, and the higher its importance.

2.3.3. Correlation Analysis

By calculating correlation coefficients and significance tests, the closeness of each influencing factor to the vegetation carbon fluxes was investigated. The correlation analysis between vegetation carbon fluxes and their influencing factors was conducted grid by grid.
R x y = i = 1 n ( x i x ¯ ) ( y i y ¯ ) i = 1 n ( x i x ¯ ) 2 i = 1 n ( y i y ¯ ) 2
where Rxy represents the correlation coefficient between vegetation carbon fluxes and each variable; xi represents the carbon flux value of the vegetation i-th year, yi represents the value of the variables at the i-th year; x ¯ and y ¯ are the mean values of each variable; and n is the amount of samples.

2.3.4. Contribution of Variables to Carbon Fluxes

Temperature, precipitation, and solar radiation were used as input data in a multiple linear regression model to simulate carbon flux trends [64,65]. The linear regression model used in our study was as follows:
Y = B 0 + B P × X P + B T × X T + B R × X R + ε  
where B0 is a constant term, XP, XT, and XR represent precipitation, annual average air temperature, and solar radiation, respectively; BP, BT, and BR represent the regression coefficients corresponding to these variables; and ε is an error term. Based on Equation (15), the contribution of different variables to the carbon flux trends can be estimated as:
C i = d ( B i × X i ) d t
where i represents different variables, and Ci represents the derivative concerning the time of the product of i and its coefficient in Equation (15). Ci also represents the contribution of variable i to the carbon flux trends.

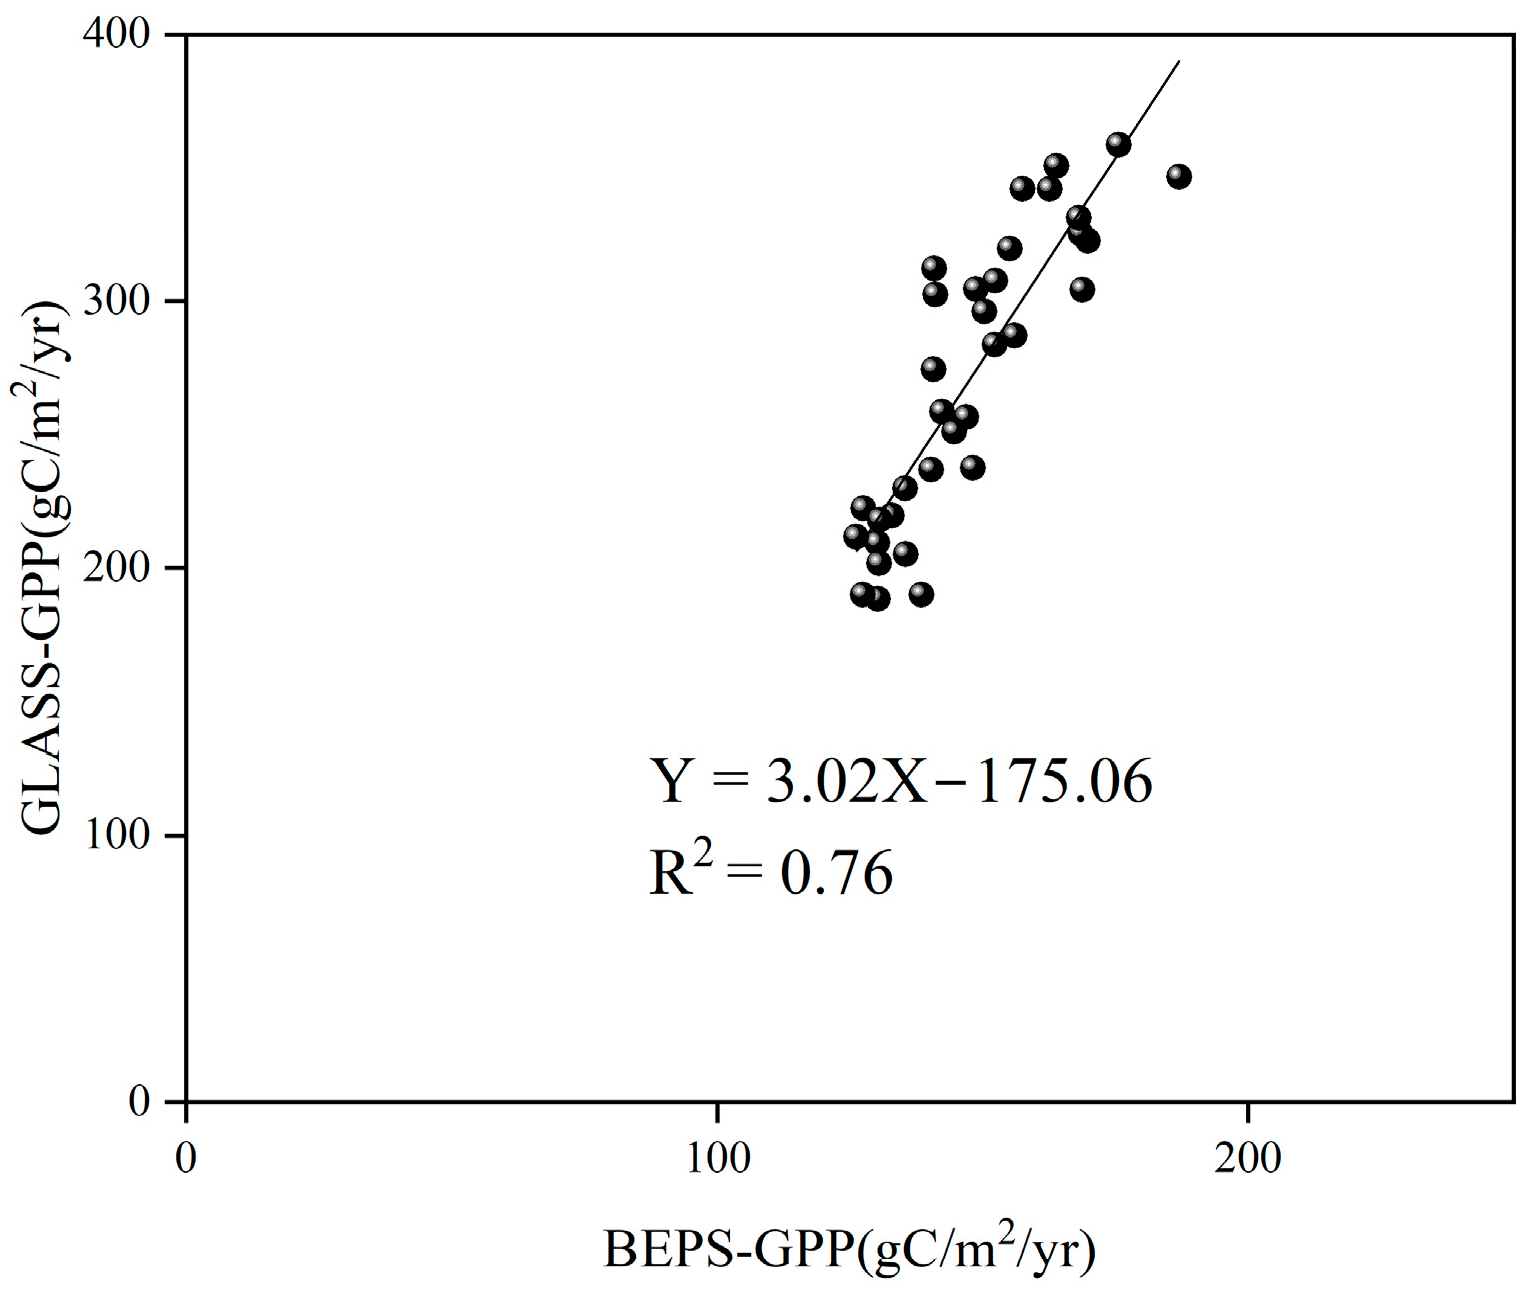
2.3.5. Validating Carbon Fluxes

We used Pearson’s correlation coefficient to compare the GPP simulated by the BEPS model and GLASS-GPP products, which were generated using a modified eddy covariance light-use efficiency model [66,67]. The results (Figure 2) displayed a strong correlation between the GLASS-GPP products and BEPS-GPP (R2 = 0.76, p < 0.001). Thus, the outcomes of the model simulations proved to be solid and dependable.

3. Results

3.1. Spatiotemporal Pattern of Carbon Fluxes

3.1.1. Interannual Variations in Carbon Fluxes

The carbon fluxes of alpine grassland in the TRSR increased consistently. The GPP was decomposed into four IMF components with average periods of 3, 6, 15, and 34 years (Figure 3, Table 3). The trend had the largest variance contribution, accounting for 77.43%, followed by IMF1 (26.62%). The other three IMF variance contributions were less than 10%, which indicated that the long-term upward trend of GPP in the TRSR was dominant. The EEMD decomposition of NEP showed that although the NEP was dominated by a long-term increasing trend, there were also short-term and interdecadal fluctuations. The variance contributions for the trend, IMF1, and IMF3 were 44.57%, 35.26%, and 31.33%, respectively.
The increasing rates of carbon fluxes were measured in the TRSR and its sub-park regions (Figure 4, Table 4). Generally, carbon fluxes in the TRSR increased significantly, with increasing rates of GPP and NEP of 1.31 and 0.40 g C/m2/yr, respectively. The LRSP had the greatest GPP and NEP of the three sub-park regions, with average values of 128.91 g C/m2/yr and 7.05 g C/m2/yr, respectively, followed by the HRSP, which had average GPP and NEP values of 89.87 g C/m2/yr and 6.57 g C/m2/yr, respectively. With average values of 49.52 g C/m2/yr and 4.06 g C/m2/yr, respectively, the YRSP had the lowest GPP and NEP. The GPP of all three parks exhibited a very strong increasing trend (p < 0.001). The NEP of the alpine ecosystem in the park also increased. The NEP of the HRSP and YRSP increased significantly at rates of 0.40 g C/m2/yr and 0.22 g C/m2/yr, respectively. Nevertheless, the increasing trend of NEP for LRSP did not achieve a statistically significant level (p = 0.16).

3.1.2. Spatial Characteristics of Carbon Fluxes

The changes in the geographical distribution of the mean annual GPP and NEP over the TRSR from 1985 to 2018 revealed significant geographic heterogeneity. The TRSR’s multiyear mean GPP and NEP were 147.86 and 11.27 g C/m2/yr, respectively. Figure 5 depicts a declining trend in GPP and NEP from east to west. The eastern half of the TRSR had the greatest GPP, with values generally ranging from 600 to 680 g C/m2/yr, followed by the middle part of the TRSR, whereas the western part of the TRSR had the lowest values, which were usually below 100 g C/m2/yr, such as in Zhiduo County and Geermu County.
The fundamental reason for this was that the eastern portion of the TRSR was dominated by high-coverage alpine meadow and forest shrubs, whereas the western portion of the TRSR was characterized by low coverage of alpine grassland and bare ground. According to the statistics (Figure 6), the majority of areas (85.26%) in the TRSR had less than 300 g C/m2/yr of GPP, with an area of 0–100 g C/m2/yr accounting for 44.14% of the total grassland area. During the study period, the multiyear average carbon sink area (NEP > 0) accounted for approximately 99.15% of the entire grassland area, whereas the extent of the carbon source area (NEP < 0) accounted for 0.85% of the total grassland area. The overall multiyear average carbon sequestration in the research area was 49.02 Tg C/yr.

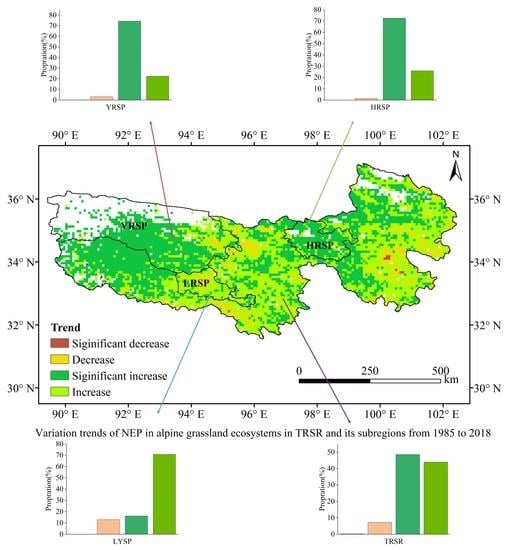
3.1.3. Trend Distribution of Carbon Fluxes

The carbon fluxes of the alpine grasslands in the study area were significantly increased using the Sen–MK approach. The GPP of TRSR alpine grassland demonstrated an overall rising trend over the 34-year time range (Figure 7). The locations with significant GPP increases accounted for the majority (90.12%); the regions with significant GPP decreases accounted for only 4.79%, indicating a remarkable upward trend in grassland ecosystem productivity. The regions with significant increases, increases, significant decreases, and decreases in NEP accounted for 48.60%, 43.98%, 0.21%, and 7.22% of the total area, respectively. The significantly increased pixels were mainly apparent in the YRSP’s western and southern regions, as well as in the majority of the HRSP. There were only a few isolated and dispersed areas with significant NEP declines, such as Dali County, east of the TRSR.
There were contrasts in the improvement effect of carbon fluxes in various time frames. From 1985 to 2000 (Figure 8a), the regions that increased significantly, accounting for 22.84% of GPP, were mostly concentrated in the western YRSP and the areas around the HRSP. However, between 2001 and 2018, approximately 68.53% of the grassland exhibited a significantly increasing tendency. Only 1.38% of the district saw a decrease, which was, for the most part, dispersed in the eastern part of the YRSP. Thus, grassland GPP increased significantly between 2001 and 2018 compared to the 1985–2000 period. A comparison of NEP in these two time periods revealed that the proportion of substantial increases in NEP in 2000–2018 (5.77%) was greater than that in 1985–2000 (2.11%). Additionally, the region with a considerable NEP decline after 2000 (0.21%) was reduced compared to that in the previous decade (1.49%). According to the geographical distribution, the dramatic decline in NEP from 1985 to 2000 was localized in the TRSR’s northeastern region. The western YRSP saw a significant increase from 2001 to 2018. As a whole, NEP after 2000 was slightly greater than before.
Carbon flux patterns across the three sub-park sections were investigated at different intervals of time (Figure 8). The grassland GPP increased dramatically across all three sub-park regions throughout the 34-year time range. The area with the greatest increase in GPP was the HRSP (96.12%). Meanwhile, the YRSP (94.97%) and LRSP (84.15%) regions with increased GPP were roughly comparable. Across the three sub-park regions, the percentages of locations with GPP reductions were all low. Prior to the 21st century, the three sub–park areas had a low percentage of regions that experienced significant increases in GPP. The percentages of significant increases in GPP in the YRSP, HRSP, and LRSP were 36.74%, 31.65%, and 5.28%, respectively. In contrast, there was a considerable spike in the number of regions with a significant increase in GPP after the 21st century for the three source regions. The area with the greatest increase in GPP also had the greatest share of the YRSP (84.34%). The proportions were identical in the HRSP (75.14%) and LRSP (49.16%) source areas, and practically no location showed a significant decrease in GPP. The NEP of the sub–park regions followed the same pattern as the GPP. In all three sub-park areas, the Prairie NEP expanded over the 34–year period. The proportion of regions with significantly increased NEP in both the YRSP and the HRSP was greater than 70%. Only 16.21% of the LRSP area had a significant increase in NEP, which was noteworthy to administrators. Between 1985 and 2000, the proportion of NEP increase in the HRSP, YRSP, and LRSP was 79.50%, 70.80%, and 88.55%, respectively; early 21st century, the percentage of NEP increase in the HRSP, YRSP, and LRSP was 98.07%, 89.49%, and 60.94%, respectively.

3.2. Different Grassland Types of Carbon Fluxes

The carbon flux variations in the alpine meadow and alpine steppe, the primary grassland categories in the TRSR, were calculated. The multiyear average GPP of the alpine meadow and alpine steppe, as shown in Figure 9, was 177.33 g C/m2/yr and 5.73 g C/m2/yr, respectively. Significant increases of 1.48 g C/m2/yr (R2 = 0.67, p < 0.001) and 0.68 g C/m2/yr (R2 = 0.73, p < 0.001) were seen in the alpine meadow and alpine steppe, respectively. The multiyear average NEP of the alpine steppe was 4.82 g C/m2/yr from 1985 to 2000, with an annual average total of 0.22 Tg C/yr. In 1985, 1987, 1995, and 1998, the alpine steppe was a carbon source, but in the other years, it was a carbon sink. During the research term, the alpine meadow NEP averaged 13.00 g C/m2/yr, with a multiyear average total of 2.43 Tg C/yr. The multiyear average carbon sequestration in the alpine meadow accounted for surpassing 60% of the total carbon sequestration in the TRSR.
Carbon fluxes were measured across the three sub-park regions (Figure 10). The LRSP alpine meadow and alpine steppe had the highest GPP, at 133.02 and 106.79 g C/m2/yr, respectively, followed by the HRSP, at 109.32 and 53.44 g C/m2/yr, respectively, and the YRSP alpine meadow and alpine steppe had the lowest GPP, at 76.69 and 33.48 g C/m2/yr, respectively. Carbon sequestration was more significant in the alpine meadow than in the alpine steppe, and the HRSP’s alpine meadow had the highest NEP, at 8.09 g C/m2/yr, followed by the LRSP (7.31 g C/m2/yr) and YRSP (5.39 g C/m2/yr). The NEP of the alpine steppe in the LRSP, HRSP, and YRSP was 5.74, 3.80, and 3.51 g C/m2/yr, respectively.

3.3. The Impact of Meteorological Factors on Carbon Fluxes

There was significant spatial and time heterogeneity in temperature, precipitation, and solar radiation in the TRSR (Figure 11a–c, Figure S1, Table S1). The temperature decreased from the northeast to the southwest, mainly due to altitude, and there was abundant precipitation in the east and southeast and little precipitation in the west, whereas solar radiation is more abundant in the west than in the east.

3.3.1. The Impact of Meteorological Factors on GPP

We calculated the correlation coefficients of GPP and temperature, precipitation, and solar radiation (Figure 11d–f) to determine the main driving meteorological factors. We noticed that temperature was the most influential factor on GPP. The correlation coefficients between GPP and temperature in the TRSR ranged from −0.46 to 0.92, of which 85.95% of the areas were significantly positively correlated. Simultaneously, the impact of precipitation on GPP could not be overlooked since there was a significant positive correlation between GPP and precipitation in 61.02% of the research region. In these places, yearly precipitation was typically less than 500 mm. The correlation between GPP and precipitation was not substantial in the eastern and south-eastern areas where precipitation was more plentiful. Unlike temperature and precipitation, GPP was negatively correlated with solar radiation in 80.65% of the TRSR, and it was significantly negatively correlated in 32.13% of the region. We speculated that the main cause of this phenomenon was because the research region was situated on a plateau and received a large amount of solar radiation.

3.3.2. The Impact of Meteorological Factors on NEP

In terms of geographical distribution, precipitation was the most essential element influencing NEP compared to other meteorological variables. According to the statistical analysis, the grassland area with a significant positive correlation between NEP and precipitation was approximately 15.03 × 10⁶ km2, accounting for roughly 45.35% of the TRSR grassland area. These locations were generally found in places with low annual average precipitation, which was a limiting factor for plant development (Figure 12b). Not unexpectedly, temperature remains one of the most critical elements determining NEP. A significant positive correlation between NEP and temperature existed in 36.59% of the zones, particularly in the southern half of the YRSP and the northern portion of the HRSP. In addition, the correlation between grassland NEP and solar radiation (Figure 11i) was statistically insignificant in most areas, and the total area of nonsignificant correlation was 28.71 × 10⁴ km2, accounting for 86.60% of the total grassland ecosystems.

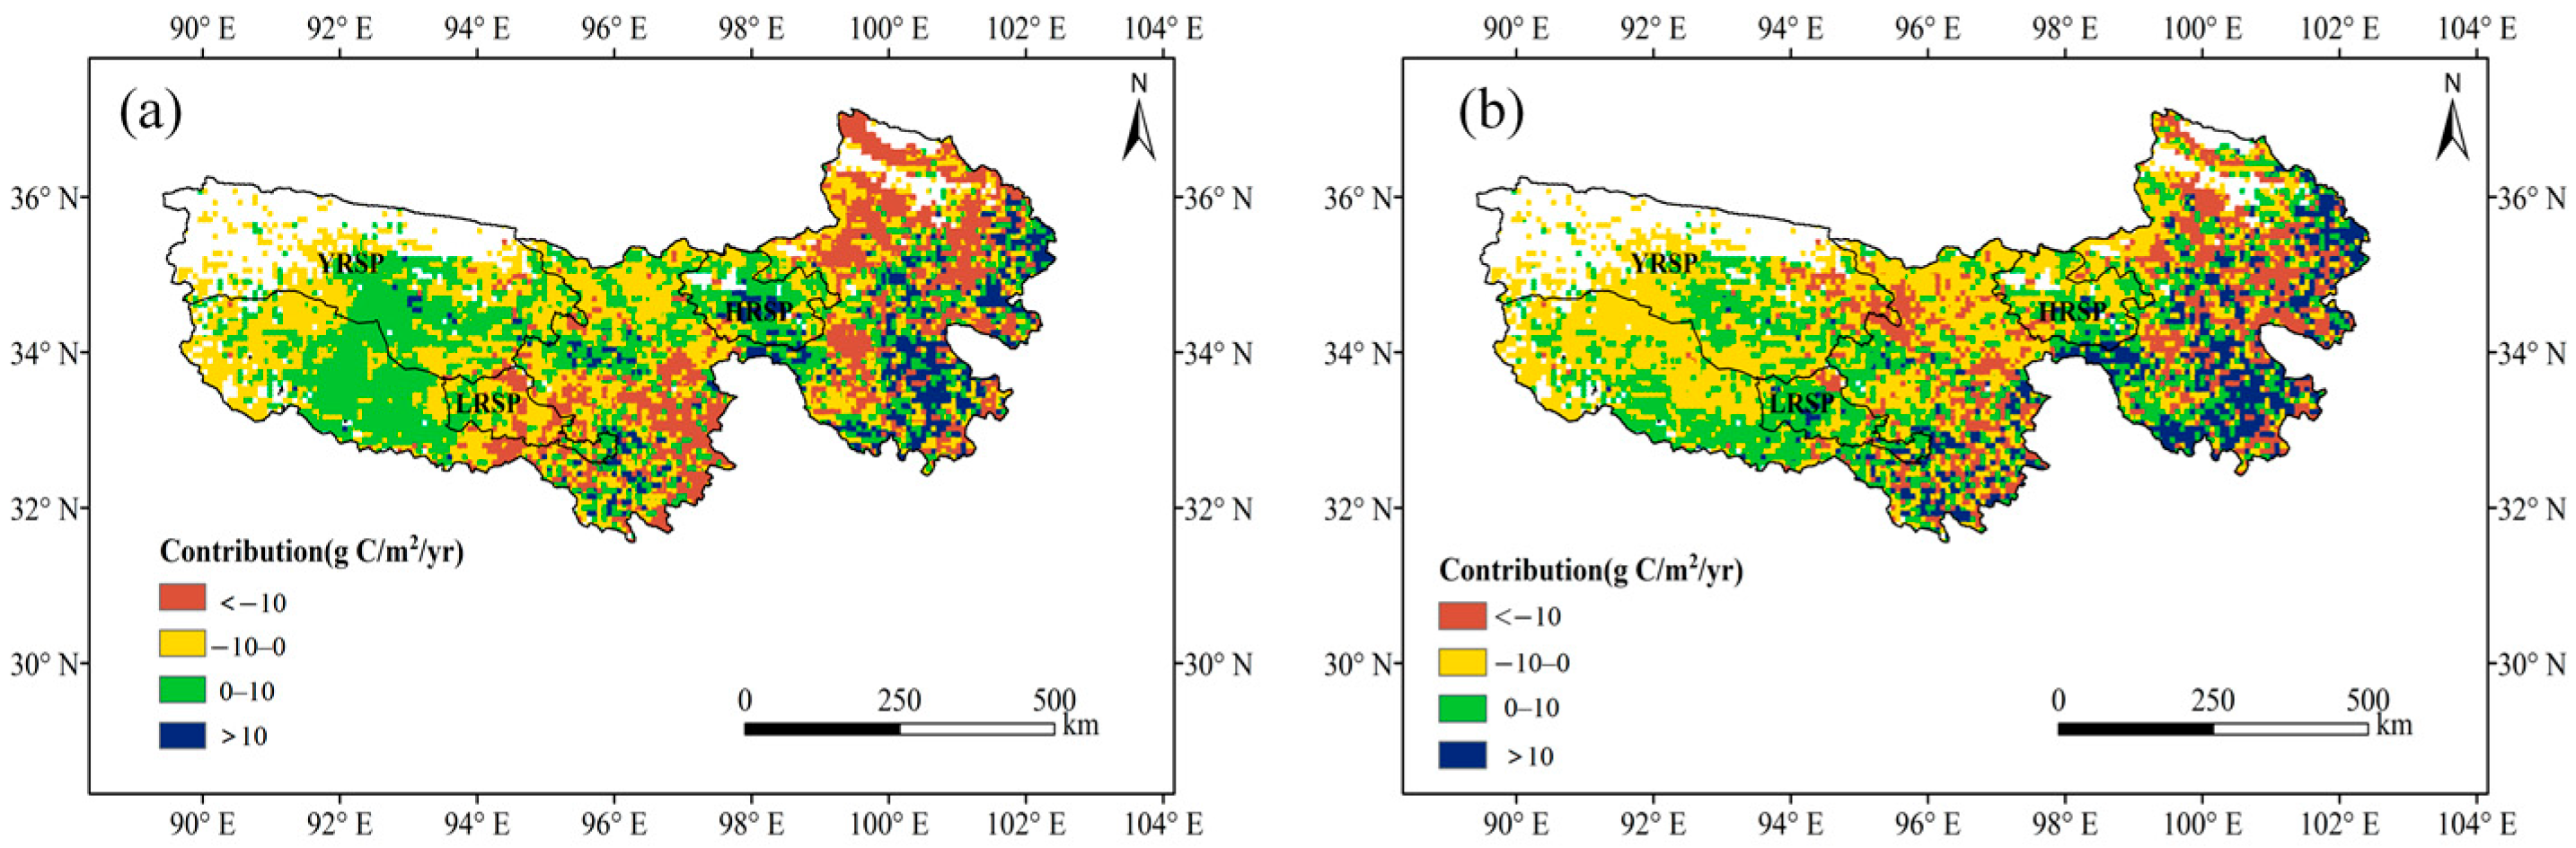
3.4. The Contribution of Multiple Variables to the Carbon Flux Trends of the TRSR

In quantifying the contribution of meteorological factors to the trend of carbon fluxes in the TRSR, we found, through multiple linear regression analysis, that the three variables (temperature, precipitation and solar radiation) could explain 69.40% and 52.20% of the variation in GPP and NEP, respectively, and we estimated the contribution of each variable to the trend of carbon fluxes through the regression coefficient of each variable (Figure 12).
Temperature was the predominant contributor to the increasing trend of GPP in the TRSR, with a contribution of 0.2326 g C/m2/yr. The regions with the greatest contribution were located in the eastern TRSR. It was noteworthy that temperature contributed negatively to GPP in 82.60% of the regions. Precipitation also positively contributed to the rising trend of GPP with a contribution of 0.2127 g C/m2/yr. Furthermore, 79.83% of the area had a positive contribution, and the north-eastern part of the TRSR was a high-contribution area; solar radiation had a minimal negative contribution to the trend of GPP (–0.050 g C/m2/yr), and positive and negative contributions accounted for 32.58% and 67.41%, respectively. In the sub-park area, precipitation continued to be a meteorological factor with a high contribution to the GPP trend, with contributions of 0.186, 0.084, and 0.056 g C/m2/yr in the HRSP, LRSP, and YRSP, respectively. Temperature was the largest contributor to the GPP trend at LRSP (0.1134 g C/m2/yr), and solar radiation contributed negatively to the GPP trend at HRSP and YRSP, whereas its contribution was positive in the LRSP.
Temperature and precipitation contribute synergistically to NEP growth trends. At TRSR, LRSP, and YRSP, temperature remained the largest contributor to the NEP trend, with 0.034, 0.035, and 0.002 g C/m2/yr, respectively. The contributions of precipitation to the NEP trend were 0.122, 0.046, and 0.061 g C/m2/yr, respectively. Solar radiation had an offsetting effect on the increasing NEP trend in the TRSR and LRSP, with contributions of −0.002 and –0.003 g /m2/yr, respectively. The difference was that precipitation was the largest contributor to the NEP trend in the HRSP, with 0.136 g C/m2/yr, followed by temperature and solar radiation, with contributions of 0.005 and −0.004 g C/m2/yr, respectively. In terms of spatial distribution, temperature negatively contributed to NEP in 87.30% of the study area. The proportion of regions with a negative contribution of precipitation to NEP was 24.45%, and the proportion of regions with a positive contribution was 75.55%. Solar radiation positively and negatively contributed to NEP in 41.60% and 58.40% of the study area, respectively.

4. Discussion

4.1. Carbon Uptake of the Alpine Grassland Ecosystem in the TRSR

This research analyzed the spatio-temporal distribution characteristics and mechanism of carbon fluxes in the TRSR from 1985 to 2018 and compared the differences in three sub-park regions. These results enrich the knowledge and comprehension of the dynamics of the carbon budget in the alpine ecosystem of the TRSR in recent decades. The average carbon sequestration rate of the TRSR alpine grassland during the study period was 3.74 Tg C, ranging from −3.30 to 11.51 Tg C/year, which was in concordance with previously published literature on carbon sequestration in alpine grassland ecosystems on the Tibetan Plateau [68,69,70,71,72].
More specifically, the carbon sink area accounted for approximately 99.15% of the total grassland ecosystems, and the average annual NEP in these areas was in the range of 0–20 g C/m2/yr. Concurrently, the NEP of the alpine grassland ecosystem showed a significant increasing trend with a growth rate of 0.40 g C/m2/yr. There was a decreasing trend of NEP in the TRSR before 2000, which was in concordance with the results of some earlier research work, mainly due to intense anthropogenic activities such as overgrazing [73,74,75,76]. The three sub-park areas showed an overall upward trend in NEP, with the YRSP displaying the most dramatic upward trend in NEP and the LRSP displaying a lower proportion of increasing NEP area [77,78,79].
Alpine meadow and alpine steppe were the major vegetation categories in the TRSR. Various meadow types contribute differently to carbon sinks [72]. From 1985 to 2018, the average annual NEP of alpine meadow and alpine steppe in the TRSR were 13.00 g C/m2/yr and 4.82 g C/m2/yr, respectively. Our results are lower than those observed at a single site but similar to those estimated by other models. The eddy covariance method estimated the NEP of the alpine meadow to be 58.5–192.5 g C/m2/yr during the growing season [34]. Based on the Terrestrial Ecosystem Model, researchers found that the NEP of alpine meadow and alpine steppe on the Tibetan Plateau were 19.11 g C/m2/yr and 2.17 g C/m2/yr, respectively [71].

4.2. Driving Meteorological Factors of Carbon Budgets

Alpine grassland ecosystems have been shown to be weak carbon sinks due to their special environments [2,80], where strong solar radiation during the day favors photosynthesis by plants, whereas low temperatures at night inhibit autotrophic and heterotrophic respiration in the ecosystem.
Past studies have shown that temperature and precipitation were the most important drivers of interannual variability in carbon fluxes in alpine grasslands [68,71,72,81,82,83], and the carbon sink area was concentrated in the eastern part of the TRSR, which was attributed to the combination of water and heat conditions and high vegetation cover.
The largest contribution of temperature to NEP in the TRSR was attributed to the earlier onset and faster rate of temperature increase in this region compared to other regions of China [15,70,84], which promoted the expansion of vegetation biomass and further led to more litter decomposition into the soil carbon pool. As a result, the carbon sink of alpine ecosystems increased [22,71,85].
Through the analysis of meteorological data, it was found that the precipitation in the TRSR has increased in the past 20 years, especially in spring and winter [86]. The available evidence has indicated that water is one of the main controlling drivers affecting the carbon budget of alpine steppe ecosystems [87,88,89]. Our analysis found that the regions on which grassland NEP was significantly positively correlated with precipitation were concentrated in areas with precipitation levels below 500 mm in the TRSR, whereas in the south-eastern humid region, the correlation between precipitation and NEP did not reach a significant level (Figure 11h). Furthermore, some researchers have found that there was a time lag in the response of grassland ecosystems to precipitation [68], so we speculate that the increase in spring precipitation was also a significant cause for the increase in carbon sequestration in the TRSR.
Solar radiation is the basic source of energy for photosynthesis in plants and directly affects their physiological and ecological mechanisms. The present study showed a significant negative correlation between solar radiation and NEP in some areas of the TRSR (20.71%). As precipitation is scarce in these areas, intense solar radiation exacerbates water evaporation, which negatively affects plant growth and NEP [90]. We also found that solar radiation positively and negatively contributed to NEP in 41.60% and 58.40% of the study area, respectively. Consistently, Zhang et al. [76] also found that solar radiation fluctuations affected the interannual variability of carbon fluxes. This intense solar radiation may have resulted in a substantial net CO2 sink in these alpine grassland ecosystems. Freezing winters restrain the release of CO2 and help ecosystems sequester carbon, meaning that the winter loss of CO2 is nearly 1/3 of the summer CO2 sequestration [30].
As noted above, different carbon cycle models and analytical methods may lead to different effects and contributions of meteorological factors to carbon fluxes. In addition, considering the multiple effects of meteorological factors on carbon fluxes, more fine-scale field observations are imperative.

4.3. Limitations and Uncertainty

The results acquired in this study were comparable to previous studies, namely, the findings reported in this paper were robust and could be used in future studies. Published estimates of alpine grassland NEP were used to validate the NEP in this research (Table 5). We compared the results of the BEPS-NEP with those of other models. The NEP of alpine steppe and alpine meadow matched the simulation results of other models [68,69,71]; however, the simulation results of all these models were lower than the values at the flux tower observation [30], and this was because carbon fluxes measured by eddy correlation observations generally do not include the effects of disturbances such as grazing and fire and therefore may overestimate carbon sinks at the regional scale. For instance, based on the carbon fluxes from global eddy correlation observations, the global NEP was estimated by scaling to be 23 Pg C/yr, which is approximately eight times greater than the global terrestrial carbon sink [91]. In conclusion, due to the prevalence of anthropogenic influences at regional scales and their obvious impact on carbon sinks, eddy correlation is rarely used to directly estimate the size of the carbon sinks on regional scales, but is more often used to recognize the ecosystem-scale response of the carbon cycle to climate change [92].
The uncertainty in the results is can be explained by three main reasons. One reason is that the uncertainty in the BEPS model results arises from the differences in simulation results using different LAI products; this uncertainty was analogous to the uncertainty in the model parameters that affect the simulated time trends [41]. Another reason was the low number of observations in the TRSR, which affected the reliability of the meteorological data used as model inputs [71]. Finally, the response of NEP to climate change was mainly controlled by the sensitivity of autotrophic and heterotrophic respiration to temperature [68], and there was great heterogeneity in soil temperature in the TRSR due to the presence of permafrost, which undoubtedly posed a great challenge to the accuracy of the simulations.
Apart from temperature, precipitation, and solar radiation, there were other external factors that had vital effects on carbon fluxes, such as grazing intensity, indiscriminate mining, and human activities [69]. This was particularly true for the restoration of previously destroyed vegetation through anthropogenic measures such as the establishment of protected areas, the implementation of fencing, the return of farmland to grassland, the ecological migration pioneered by the Chinese government in the TRSR via ecological compensation in 2005, and the official establishment of the TRSNP in 2020 [21,93]. In Equation (15), ε is the residual between the variation rates of carbon fluxes and climate factor contribution, representing the contribution of human activities and some uncertainty to carbon fluxes. We analyze the spatial distribution of the contribution of other factors to carbon flux trends (Figure 13). The positive contributions of other factors to the GPP trend were mainly concentrated in the YRSP and HRSP, and the positive contributions of other factors to the NEP were distributed in the southern regions of the TRSR and LRSP. In future studies, the multiple coupled effects of natural and anthropogenic factors on the carbon dynamics of alpine grasslands in the TRSR should be considered.
Although the EEMD method has certain applicability in the trend decomposition of carbon fluxes and meteorological elements, the processing of EEMD components as robust indicators of interannual variation has not been approached and has many challenges. First, the ability to attribute components to their potential physical processes (e.g., annual climatology, noise) was suggested to be temporary but has not yet been formalized in big data processing [94]. Second, how to distinguish between critical signal components and noise-induced components can be critical to the performance of the approach and the results from its output. Significance tests for EEMD components are available but unvalidated, which is a necessity for a universal processing tool [60].

5. Conclusions

Our findings reflect the spatiotemporal variations in carbon sources/sinks in the TRSR. The alpine grassland ecosystem has carbon sequestration potential, with an average NEP of 3.74 Tg C/yr, and the carbon sink area accounts for approximately 99.15% of the total grassland area. In its spatial pattern, the NEP of the alpine grassland showed a decreasing trend from east to west. From 1985 to 2018, the NEP trend increased significantly, with an average annual growth rate of 0.40 g C/m2/yr. There were significant differences in carbon uptake capacity between the alpine meadow and alpine steppe. The alpine meadow contributed the most to the regional carbon sink, with an annual average of 2.43 Tg C/yr, whereas the alpine steppe contributed only 0.22 Tg C/yr.
The correlation between precipitation and NEP was the strongest in the TRSR, and the grassland ecosystem with a statistically significantly positively correlated NEP with precipitation was approximately 15.03×10⁶ km2, accounting for probably 45.35% of the total grassland area. In addition, temperature and NEP were also positively correlated, with a significant positive correlation area of 36.59%. Temperature and precipitation contributed synergistically to the NEP growth trends, and solar radiation had an offsetting effect on the increasing NEP trend in the TRSR. In most regions, the contribution of temperature to increasing NEP trends was greater than that of precipitation; nevertheless, precipitation was the main positive contributor to the NEP trend in the HRSP.
The study of the spatio-temporal variability of carbon sequestration in the TRSR helps us understand the biogeochemical cycles of alpine ecosystems and their response to climate change, which are vital for implementing science-based classification and zoning conservation measures in the TRSNP.

Supplementary Materials

The following supporting information can be downloaded at: https://www.mdpi.com/article/10.3390/rs14194795/s1, Figure S1: Interannual variations in mean annual temperature, precipitation, and solar radiation in the grassland ecosystem of the TRSR from 1985 to 2018; Table S1: Average periods and their variance contributions to carbon fluxes.

Author Contributions

Conceptualization, F.L. and X.Y.; methodology, F.L.; software, F.L.; validation, F.L. and X.Y.; formal analysis, F.L.; writing—original draft preparation, F.L.; writing—review and editing, F.L.; visualization, F.L.; supervision, X.Y.; funding acquisition, X.Y. All authors have read and agreed to the published version of the manuscript.

Funding

This research was supported by the State Key Laboratory of Earth Surface Processes and Resource Ecology (2022-GS-01), the National Key Research and Development Program of China (2019YFA0606904 & 2018YFC509003).

Data Availability Statement

The China meteorological forcing dataset from the website: http://data.tpdc.ac.cn, accessed on 10 December 2021. Carbon fluxes stimulated by BEPS is available at http://www.nesdc.org.cn, accessed on 6 January 2022. The GLASS-GPP products used for validation is available at https://pan.baidu.com/s/1Ts4g6_mnW_QJ6Yv2w3Mbig, accessed on 5 September 2022. The LAI dataset can be downloaded at https://www.resdc.cn/data.aspx?DATAID=336, accessed on 6 January 2022.

Acknowledgments

We sincerely thank National Ecological Science Data Center and National Tibetan Plateau Data Center of China, and especially Ju Weimin of Nanjing University and Yang Kun of Tsinghua University for their patient guidance in data.

Conflicts of Interest

The authors declare no conflict of interest.

References

  1. Adams, J.M.; Faure, H.; Faure-Denard, L.; McGlade, J.M.; Woodward, F.I. Increases in terrestrial carbon storage from the Last Glacial Maximum to the present. Nature 1990, 348, 711–714. [Google Scholar] [CrossRef]
  2. Ni, J. Carbon storage in grasslands of China. J. Arid Environ. 2002, 50, 205–218. [Google Scholar] [CrossRef]
  3. Petsri, S.; Chidthaisong, A.; Pumijumnong, N.; Wachrinrat, C. Greenhouse gas emissions and carbon stock changes in rubber tree plantations in Thailand from 1990 to 2004. J. Clean. Prod. 2013, 52, 61–70. [Google Scholar] [CrossRef]
  4. Scurlock, J.M.O.; Hall, D.O. The global carbon sink: A grassland perspective. Glob. Chang. Biol. 1998, 4, 229–233. [Google Scholar] [CrossRef]
  5. Schuman, G.E.; Janzen, H.H.; Herrick, J.E. Soil carbon dynamics and potential carbon sequestration by rangelands. Environ. Pollut. 2002, 116, 391–396. [Google Scholar] [CrossRef]
  6. Poulter, B.; Frank, D.; Ciais, P.; Myneni, R.B.; Andela, N.; Bi, J.; Broquet, G.; Canadell, J.G.; Chevallier, F.; Liu, Y.Y.; et al. Contribution of semi-arid ecosystems to interannual variability of the global carbon cycle. Nature 2014, 509, 600–603. [Google Scholar] [CrossRef]
  7. Ahlström, A.; Raupach, M.R.; Schurgers, G.; Smith, B.; Arneth, A.; Jung, M.; Reichstein, M.; Canadell, J.G.; Friedlingstein, P.; Jain, A.K.; et al. The dominant role of semi-arid ecosystems in the trend and variability of the land CO2 sink. Science 2015, 348, 895–899. [Google Scholar] [CrossRef]
  8. Bengtsson, J.; Bullock, J.M.; Egoh, B.; Everson, C.; Everson, T.; O’Connor, T.; O’Farrell, P.J.; Smith, H.G.; Lindborg, R. Grasslands—More important for ecosystem services than you might think. Ecosphere 2019, 10, e02582. [Google Scholar] [CrossRef]
  9. Harris, R.B. Rangeland degradation on the Qinghai-Tibetan plateau: A review of the evidence of its magnitude and causes. J. Arid Environ. 2010, 74, 1–12. [Google Scholar] [CrossRef]
  10. Zhang, Y.; Zhang, S.; Zhai, X.; Xia, J. Runoff variation and its response to climate change in the Three Rivers Source Region. J. Geogr. Sci. 2012, 22, 781–794. [Google Scholar] [CrossRef]
  11. Dong, Y.; Zhai, J.; Zhao, Y.; Li, H.; Wang, Q.; Jiang, S.; Chang, H.; Ding, Z. Teleconnection patterns of precipitation in the Three-River Headwaters region, China. Environ. Res. Lett. 2020, 15, 104050. [Google Scholar] [CrossRef]
  12. Gao, J.; Huang, X.; Ma, X.; Feng, Q.; Liang, T.; Xie, H. Snow Disaster Early Warning in Pastoral Areas of Qinghai Province, China. Remote Sens. 2017, 9, 475. [Google Scholar] [CrossRef]
  13. Dong, M.; Jiang, Y.; Zheng, C.; Zhang, D. Trends in the thermal growing season throughout the Tibetan Plateau during 1960–2009. Agric. For. Meteorol. 2012, 166–167, 201–206. [Google Scholar] [CrossRef]
  14. Shen, M.; Piao, S.; Dorji, T.; Liu, Q.; Cong, N.; Chen, X.; An, S.; Wang, S.; Wang, T.; Zhang, G. Plant phenological responses to climate change on the Tibetan Plateau: Research status and challenges. Natl. Sci. Rev. 2015, 2, 454–467. [Google Scholar] [CrossRef]
  15. Piao, S.; Ciais, P.; Huang, Y.; Shen, Z.; Peng, S.; Li, J.; Zhou, L.; Liu, H.; Ma, Y.; Ding, Y.; et al. The impacts of climate change on water resources and agriculture in China. Nature 2010, 467, 43–51. [Google Scholar] [CrossRef]
  16. Chen, H.; Zhu, Q.; Peng, C.; Wu, N.; Wang, Y.; Fang, X.; Gao, Y.; Zhu, D.; Yang, G.; Tian, J.; et al. The impacts of climate change and human activities on biogeochemical cycles on the Qinghai-Tibetan Plateau. Glob. Chang. Biol. 2013, 19, 2940–2955. [Google Scholar] [CrossRef]
  17. Liu, X.; Yin, Z.-Y.; Shao, X.; Qin, N. Temporal trends and variability of daily maximum and minimum, extreme temperature events, and growing season length over the eastern and central Tibetan Plateau during 1961–2003. J. Geophys. Res. Atmos. 2006, 111, 6915. [Google Scholar] [CrossRef]
  18. Liu, L.; Zhang, Y.; Bai, W.; Yan, J.; Ding, M.; Shen, Z.; Li, S.; Zheng, D. Characteristics of grassland degradation and driving forces in the source region of the Yellow River from 1985 to 2000. J. Geogr. Sci. 2006, 16, 131–142. [Google Scholar] [CrossRef]
  19. Feng, J.; Wang, T.; Qi, S.; Xie, C. Land degradation in the source region of the Yellow River, northeast Qinghai-Xizang Plateau: Classification and evaluation. Environ. Geol. 2005, 47, 459–466. [Google Scholar] [CrossRef]
  20. Liu, J.; Xu, X.; Shao, Q. Grassland degradation in the “Three-River Headwaters” region, Qinghai Province. J. Geogr. Sci. 2008, 18, 259–273. [Google Scholar] [CrossRef]
  21. Cao, W.; Wu, D.; Huang, L.; Liu, L. Spatial and temporal variations and significance identification of ecosystem services in the Sanjiangyuan National Park, China. Sci. Rep. 2020, 10, 6151. [Google Scholar] [CrossRef] [PubMed]
  22. Lin, X.; Han, P.; Zhang, W.; Wang, G. Sensitivity of alpine grassland carbon balance to interannual variability in climate and atmospheric CO2 on the Tibetan Plateau during the last century. Glob. Planet. Chang. 2017, 154, 23–32. [Google Scholar] [CrossRef]
  23. Liu, D.; Li, Y.; Wang, T.; Peylin, P.; MacBean, N.; Ciais, P.; Jia, G.; Ma, M.; Ma, Y.; Shen, M.; et al. Contrasting responses of grassland water and carbon exchanges to climate change between Tibetan Plateau and Inner Mongolia. Agric. For. Meteorol. 2018, 249, 163–175. [Google Scholar] [CrossRef]
  24. Kwon, H.; Pendall, E.; Ewers, B.E.; Cleary, M.; Naithani, K. Spring drought regulates summer net ecosystem CO2 exchange in a sagebrush-steppe ecosystem. Agric. For. Meteorol. 2008, 148, 381–391. [Google Scholar] [CrossRef]
  25. Pereira, J.S.; Mateus, J.A.; Aires, L.M.; Pita, G.; Pio, C.; David, J.S.; Andrade, V.; Banza, J.; David, T.S.; Paço, T.A.; et al. Net ecosystem carbon exchange in three contrasting Mediterranean ecosystems—The effect of drought. Biogeosciences 2007, 4, 791–802. [Google Scholar] [CrossRef]
  26. Zhang, L.; Wylie, B.K.; Ji, L.; Gilmanov, T.G.; Tieszen, L.L.; Howard, D.M. Upscaling carbon fluxes over the Great Plains grasslands: Sinks and sources. J. Geophys. Res. Biogeosci. 2011, 116, 1504. [Google Scholar] [CrossRef]
  27. Liu, S.; Zhang, F.; Du, Y.; Guo, X.; Lin, L.; Li, Y.; Li, Q.; Cao, G.J.P.O. Ecosystem Carbon Storage in Alpine Grassland on the Qinghai Plateau. PLoS ONE 2016, 11, e0160420. [Google Scholar] [CrossRef]
  28. Song, C.; Wang, G.; Hu, Z.; Zhang, T.; Huang, K.; Chen, X.; Li, Y. Net ecosystem carbon budget of a grassland ecosystem in central Qinghai-Tibet Plateau: Integrating terrestrial and aquatic carbon fluxes at catchment scale. Agric. For. Meteorol. 2020, 290, 108021. [Google Scholar] [CrossRef]
  29. Sun, S.; Che, T.; Li, H.; Wang, T.; Ma, C.; Liu, B.; Wu, Y.; Song, Z. Water and carbon dioxide exchange of an alpine meadow ecosystem in the northeastern Tibetan Plateau is energy-limited. Agric. For. Meteorol. 2019, 275, 283–295. [Google Scholar] [CrossRef]
  30. Wei, D.; Qi, Y.; Ma, Y.; Wang, X.; Ma, W.; Gao, T.; Huang, L.; Zhao, H.; Zhang, J.; Wang, X. Plant uptake of CO2 outpaces losses from permafrost and plant respiration on the Tibetan Plateau. Proc. Natl. Acad. Sci. USA 2021, 118, e2015283118. [Google Scholar] [CrossRef]
  31. Ma, W.; Wu, T.; Wu, X.; Yue, G.; Li, R.; Li, X.; Zhu, X.; Hu, G.; Qiao, Y.; Hao, J.; et al. Warming could shift steppes to carbon sinks and meadows to carbon sources in permafrost regions: Evidence from the improved IBIS model. CATENA 2021, 200, 105168. [Google Scholar] [CrossRef]
  32. Zhao, L.; Li, J.; Xu, S.; Zhou, H.; Li, Y.; Gu, S.; Zhao, X. Seasonal variations in carbon dioxide exchange in an alpine wetland meadow on the Qinghai-Tibetan Plateau. Biogeosciences 2010, 7, 1207–1221. [Google Scholar] [CrossRef]
  33. Koven, C.D.; Ringeval, B.; Friedlingstein, P.; Ciais, P.; Cadule, P.; Khvorostyanov, D.; Krinner, G.; Tarnocai, C. Permafrost carbon-climate feedbacks accelerate global warming. Proc. Natl. Acad. Sci. USA 2011, 108, 14769–14774. [Google Scholar] [CrossRef] [PubMed]
  34. Kato, T.; Tang, Y.; Gu, S.; Cui, X.; Hirota, M.; Du, M.; Li, Y.; Zhao, X.; Oikawa, T. Carbon dioxide exchange between the atmosphere and an alpine meadow ecosystem on the Qinghai–Tibetan Plateau, China. Agric. For. Meteorol. 2004, 124, 121–134. [Google Scholar] [CrossRef]
  35. Tang, Y.; Wan, S.; He, J.; Zhao, X. Foreword to the special issue: Looking into the impacts of global warming from the roof of the world. J. Plant Ecol. 2009, 2, 169–171. [Google Scholar] [CrossRef]
  36. Running, S.W.; Coughlan, J.C. A general model of forest ecosystem processes for regional applications I. Hydrologic balance, canopy gas exchange and primary production processes. Ecol. Model. 1988, 42, 125–154. [Google Scholar] [CrossRef]
  37. Liu, J.; Chen, J.M.; Cihlar, J.; Park, W.M. A process-based boreal ecosystem productivity simulator using remote sensing inputs. Remote Sens. Environ. 1997, 62, 158–175. [Google Scholar] [CrossRef]
  38. Ju, W.; Gao, P.; Wang, J.; Zhou, Y.; Zhang, X. Combining an ecological model with remote sensing and GIS techniques to monitor soil water content of croplands with a monsoon climate. Agric. Water Manag. 2010, 97, 1221–1231. [Google Scholar] [CrossRef]
  39. Chen, J.M.; Liu, J.; Cihlar, J.; Goulden, M.L. Daily canopy photosynthesis model through temporal and spatial scaling for remote sensing applications. Ecol. Model. 1999, 124, 99–119. [Google Scholar] [CrossRef]
  40. Farquhar, G.D.; von Caemmerer, S.; Berry, J.A. A biochemical model of photosynthetic CO2 assimilation in leaves of C3 species. Planta 1980, 149, 78–90. [Google Scholar] [CrossRef] [Green Version]
  41. Chen, J.M.; Ju, W.; Ciais, P.; Viovy, N.; Liu, R.; Liu, Y.; Lu, X. Vegetation structural change since 1981 significantly enhanced the terrestrial carbon sink. Nat. Commun. 2019, 10, 4259. [Google Scholar] [CrossRef]
  42. Chen, J.M.; Mo, G.; Pisek, J.; Liu, J.; Deng, F.; Ishizawa, M.; Chan, D. Effects of foliage clumping on the estimation of global terrestrial gross primary productivity. Glob. Biogeochem. Cycles 2012, 26, 3996. [Google Scholar] [CrossRef]
  43. Feng, X.; Liu, G.; Chen, J.M.; Chen, M.; Liu, J.; Ju, W.M.; Sun, R.; Zhou, W. Net primary productivity of China’s terrestrial ecosystems from a process model driven by remote sensing. J. Environ. Manag. 2007, 85, 563–573. [Google Scholar] [CrossRef] [PubMed]
  44. Liu, Y.; Xiao, J.; Ju, W.; Zhu, G.; Wu, X.; Fan, W.; Li, D.; Zhou, Y. Satellite-derived LAI products exhibit large discrepancies and can lead to substantial uncertainty in simulated carbon and water fluxes. Remote Sens. Environ. 2018, 206, 174–188. [Google Scholar] [CrossRef]
  45. He, J.; Yang, K.; Tang, W.; Lu, H.; Qin, J.; Chen, Y.; Li, X. The first high-resolution meteorological forcing dataset for land process studies over China. Sci. Data 2020, 7, 25. [Google Scholar] [CrossRef]
  46. He, J.; Yang, K. China meteorological forcing dataset (1979–2018). National Tibetan Plateau Data Center. Available online: http://data.tpdc.ac.cn/en/data/8028b944-daaa-4511-8769-965612652c49/ (accessed on 10 December 2021).
  47. Yang, K.; He, J.; Tang, W.; Qin, J.; Cheng, C.C.K. On downward shortwave and longwave radiations over high altitude regions: Observation and modeling in the Tibetan Plateau. Agric. For. Meteorol. 2010, 150, 38–46. [Google Scholar] [CrossRef]
  48. Liu, J.; Chen, J.M.; Cihlar, J.; Chen, W. Net primary productivity mapped for Canada at 1-km resolution. Glob. Ecol. Biogeogr. 2002, 11, 115–129. [Google Scholar] [CrossRef]
  49. He, L.; Chen, J.M.; Pisek, J.; Schaaf, C.B.; Strahler, A.H. Global clumping index map derived from the MODIS BRDF product. Remote Sens. Environ. 2012, 119, 118–130. [Google Scholar] [CrossRef]
  50. Parton, W.J.; Scurlock, J.M.O.; Ojima, D.S.; Gilmanov, T.G.; Scholes, R.J.; Schimel, D.S.; Kirchner, T.; Menaut, J.C.; Seastedt, T.; Moya, E.G.; et al. Observations and modeling of biomass and soil organic-matter dynamics for the grassland biome worldwide. Glob. Biogeochem. Cycles 1993, 7, 785–809. [Google Scholar] [CrossRef]
  51. He, Q.; Ju, W.; Dai, S.; He, W.; Song, L.; Wang, S.; Li, X.; Mao, G. Drought Risk of Global Terrestrial Gross Primary Productivity Over the Last 40 Years Detected by a Remote Sensing-Driven Process Model. J. Geophys. Res. Biogeosci. 2021, 126, e2020JG005944. [Google Scholar] [CrossRef]
  52. Wang, S.; Li, Y.; Ju, W.; Chen, B.; Chen, J.; Croft, H.; Mickler, R.A.; Yang, F. Estimation of Leaf Photosynthetic Capacity from Leaf Chlorophyll Content and Leaf Age in a Subtropical Evergreen Coniferous Plantation. J. Geophys. Res. Biogeosci. 2020, 125, e2019JG005020. [Google Scholar] [CrossRef]
  53. Ji, R.; Tan, K.; Wang, X.; Pan, C.; Xin, L. Spatiotemporal Monitoring of a Grassland Ecosystem and Its Net Primary Production Using Google Earth Engine: A Case Study of Inner Mongolia from 2000 to 2020. Remote Sens. 2021, 13, 4480. [Google Scholar] [CrossRef]
  54. Jiang, W.; Yuan, L.; Wang, W.; Cao, R.; Zhang, Y.; Shen, W. Spatio-temporal analysis of vegetation variation in the Yellow River Basin. Ecol. Indic. 2015, 51, 117–126. [Google Scholar] [CrossRef]
  55. Sen, P.K. Estimates of the Regression Coefficient Based on Kendall’s Tau. J. Am. Stat. Assoc. 1968, 63, 1379–1389. [Google Scholar] [CrossRef]
  56. Kendall, M.G. Rank Correlation Methods, 4th ed.; Griffin: London, UK, 1975. [Google Scholar]
  57. Theil, H. A rank-invariant method of linear and polynomial regression analysis. Indag. Math. 1950, 53, 386–392. [Google Scholar]
  58. Hussain, M.M.; Mahmud, I. pyMannKendall: A python package for non parametric Mann Kendall family of trend tests. J. Open Source Softw. 2019, 4, 1556. [Google Scholar] [CrossRef]
  59. Kamali, A.; Khosravi, M.; Hamidianpour, M. Spatial–temporal analysis of net primary production (NPP) and its relationship with climatic factors in Iran. Environ. Monit. Assess. 2020, 192, 718. [Google Scholar] [CrossRef]
  60. Hawinkel, P.; Swinnen, E.; Lhermitte, S.; Verbist, B.; Van Orshoven, J.; Muys, B. A time series processing tool to extract climate-driven interannual vegetation dynamics using Ensemble Empirical Mode Decomposition (EEMD). Remote Sens. Environ. 2015, 169, 375–389. [Google Scholar] [CrossRef]
  61. Wu, Z.; Huang Norden, E.; Long Steven, R.; Peng, C.-K. On the trend, detrending, and variability of nonlinear and nonstationary time series. Proc. Natl. Acad. Sci. USA 2007, 104, 14889–14894. [Google Scholar] [CrossRef]
  62. Jiao, F.; Liu, H.; Xu, X.; Gong, H.; Lin, Z. Trend Evolution of Vegetation Phenology in China during the Period of 1981–2016. Remote Sens. 2020, 12, 572. [Google Scholar] [CrossRef]
  63. Xue, P.; Liu, H.; Zhang, M.; Gong, H.; Cao, L. Nonlinear Characteristics of NPP Based on Ensemble Empirical Mode Decomposition from 1982 to 2015—A Case Study of Six Coastal Provinces in Southeast China. Remote Sens. 2022, 14, 15. [Google Scholar] [CrossRef]
  64. Feng, Y.; Zhu, J.; Zhao, X.; Tang, Z.; Zhu, J.; Fang, J. Changes in the trends of vegetation net primary productivity in China between 1982 and 2015. Environ. Res. Lett. 2019, 14, 124009. [Google Scholar] [CrossRef]
  65. He, H.; Wang, S.; Zhang, L.; Wang, J.; Ren, X.; Zhou, L.; Piao, S.; Yan, H.; Ju, W.; Gu, F.; et al. Altered trends in carbon uptake in China’s terrestrial ecosystems under the enhanced summer monsoon and warming hiatus. Natl. Sci. Rev. 2019, 6, 505–514. [Google Scholar] [CrossRef] [PubMed]
  66. Yuan, W.; Liu, S.; Yu, G.; Bonnefond, J.-M.; Chen, J.; Davis, K.; Desai, A.R.; Goldstein, A.H.; Gianelle, D.; Rossi, F.; et al. Global estimates of evapotranspiration and gross primary production based on MODIS and global meteorology data. Remote Sens. Environ. 2010, 114, 1416–1431. [Google Scholar] [CrossRef]
  67. Zheng, Y.; Shen, R.; Wang, Y.; Li, X.; Liu, S.; Liang, S.; Chen, J.M.; Ju, W.; Zhang, L.; Yuan, W. Improved estimate of global gross primary production for reproducing its long-term variation, 1982–2017. Earth Syst. Sci. Data 2020, 12, 2725–2746. [Google Scholar] [CrossRef]
  68. Guo, D.; Song, X.; Hu, R.; Zhu, X.; Jiang, Y.; Cai, S.; Zhang, Y.; Cui, X. Large-Scale Analysis of the Spatiotemporal Changes of Net Ecosystem Production in Hindu Kush Himalayan Region. Remote Sens. 2021, 13, 1180. [Google Scholar] [CrossRef]
  69. Huang, X.; Chen, C.; Yao, B.; Ma, Z.; Zhou, H. Spatiotemporal Dynamics of the Carbon Budget and the Response to Grazing in Qinghai Grasslands. Front. Plant Sci. 2022, 12, 775015. [Google Scholar] [CrossRef]
  70. Piao, S.; Tan, K.; Nan, H.; Ciais, P.; Fang, J.; Wang, T.; Vuichard, N.; Zhu, B. Impacts of climate and CO2 changes on the vegetation growth and carbon balance of Qinghai–Tibetan grasslands over the past five decades. Glob. Planet. Chang. 2012, 98–99, 73–80. [Google Scholar] [CrossRef]
  71. Yan, L.; Zhou, G.S.; Wang, Y.H.; Hu, T.Y.; Sui, X.H. The spatial and temporal dynamics of carbon budget in the alpine grasslands on the Qinghai-Tibetan Plateau using the Terrestrial Ecosystem Model. J. Clean. Prod. 2015, 107, 195–201. [Google Scholar] [CrossRef]
  72. Zhuang, Q.; He, J.; Lu, Y.; Ji, L.; Xiao, J.; Luo, T. Carbon dynamics of terrestrial ecosystems on the Tibetan Plateau during the 20th century: An analysis with a process-based biogeochemical model. Glob. Ecol. Biogeogr. 2010, 19, 649–662. [Google Scholar] [CrossRef]
  73. Piao, S.; Cui, M.; Chen, A.; Wang, X.; Ciais, P.; Liu, J.; Tang, Y. Altitude and temperature dependence of change in the spring vegetation green-up date from 1982 to 2006 in the Qinghai-Xizang Plateau. Agric. For. Meteorol. 2011, 151, 1599–1608. [Google Scholar] [CrossRef]
  74. Xu, W.; Gu, S.; Zhao, X.; Xiao, J.; Tang, Y.; Fang, J.; Zhang, J.; Jiang, S. High positive correlation between soil temperature and NDVI from 1982 to 2006 in alpine meadow of the Three-River Source Region on the Qinghai-Tibetan Plateau. Int. J. Appl. Earth Obs. Geoinf. 2011, 13, 528–535. [Google Scholar] [CrossRef]
  75. Xu, X.; Chen, H.; Levy, J.K. Spatiotemporal vegetation cover variations in the Qinghai-Tibet Plateau under global climate change. Chin. Sci. Bull. 2008, 53, 915–922. [Google Scholar] [CrossRef]
  76. Zhang, Y.; Zhang, C.; Wang, Z.; Chen, Y.; Gang, C.; An, R.; Li, J. Vegetation dynamics and its driving forces from climate change and human activities in the Three-River Source Region, China from 1982 to 2012. Sci. Total Environ. 2016, 563–564, 210–220. [Google Scholar] [CrossRef]
  77. Fan, J.-W.; Shao, Q.-Q.; Liu, J.-Y.; Wang, J.-B.; Harris, W.; Chen, Z.-Q.; Zhong, H.-P.; Xu, X.-L.; Liu, R.-G. Assessment of effects of climate change and grazing activity on grassland yield in the Three Rivers Headwaters Region of Qinghai–Tibet Plateau, China. Environ. Monit. Assess. 2010, 170, 571–584. [Google Scholar] [CrossRef]
  78. Zhang, Y.; Zhang, C.; Wang, Z.; An, R.; Li, J. Comprehensive Research on Remote Sensing Monitoring of Grassland Degradation: A Case Study in the Three-River Source Region, China. Sustainability 2019, 11, 1845. [Google Scholar] [CrossRef]
  79. Zhang, Y.; Qi, W.; Zhou, C.; Ding, M.; Liu, L.; Gao, J.; Bai, W.; Wang, Z.; Zheng, D. Spatial and temporal variability in the net primary production of alpine grassland on the Tibetan Plateau since 1982. J. Geogr. Sci. 2014, 24, 269–287. [Google Scholar] [CrossRef]
  80. Zhang, P.; Hirota, M.; Shen, H.; Yamamoto, A.; Mariko, S.; Tang, Y. Characterization of CO2 flux in three Kobresia meadows differing in dominant species. J. Plant Ecol. 2009, 2, 187–196. [Google Scholar] [CrossRef]
  81. Cuo, L.; Zhang, Y.; Xu, R.; Zhou, B. Decadal change and inter-annual variability of net primary productivity on the Tibetan Plateau. Clim. Dyn. 2021, 56, 1837–1857. [Google Scholar] [CrossRef]
  82. Yihan, Y.; Junbang, W.; Peng, L.; Guangxin, L.; Yingnian, L. Climatic Changes Dominant Interannual Trend in Net Primary Productivity of Alpine Vulnerable Ecosystems. J. Resour. Ecol. 2019, 10, 379–388. [Google Scholar] [CrossRef]
  83. Zhang, T.; Zhang, Y.; Xu, M.; Zhu, J.; Chen, N.; Jiang, Y.; Huang, K.; Zu, J.; Liu, Y.; Yu, G. Water availability is more important than temperature in driving the carbon fluxes of an alpine meadow on the Tibetan Plateau. Agric. For. Meteorol. 2018, 256–257, 22–31. [Google Scholar] [CrossRef]
  84. Feng, S.; Tang, M.; Wang, D. New evidence for the Qinghai-Xizang (Tibet) Plateau as a pilot region of climatic fluctuation in China. Chin. Sci. Bull. 1998, 43, 1745–1749. [Google Scholar] [CrossRef]
  85. Zhang, Y.; Hu, Q.; Zou, F. Spatio-Temporal Changes of Vegetation Net Primary Productivity and Its Driving Factors on the Qinghai-Tibetan Plateau from 2001 to 2017. Remote Sens. 2021, 13, 1566. [Google Scholar] [CrossRef]
  86. Sun, B.; Wang, H. Enhanced connections between summer precipitation over the Three-River-Source region of China and the global climate system. Clim. Dyn. 2019, 52, 3471–3488. [Google Scholar] [CrossRef]
  87. Bai, Y.; Wu, J.; Xing, Q.; Pan, Q.; Huang, J.; Yang, D.; Han, X. Primary production and rain use efficiency across a precipitation gradient on the Mongolia plateau. Ecology 2008, 89, 2140–2153. [Google Scholar] [CrossRef] [PubMed]
  88. Heisler-White, J.L.; Knapp, A.K.; Kelly, E.F. Increasing precipitation event size increases aboveground net primary productivity in a semi-arid grassland. Oecologia 2008, 158, 129–140. [Google Scholar] [CrossRef] [PubMed]
  89. Yan, L.; Chen, S.; Huang, J.; Lin, G. Water regulated effects of photosynthetic substrate supply on soil respiration in a semiarid steppe. Glob. Chang. Biol. 2011, 17, 1990–2001. [Google Scholar] [CrossRef]
  90. Wang, H.; Liu, D.; Lin, H.; Montenegro, A.; Zhu, X. NDVI and vegetation phenology dynamics under the influence of sunshine duration on the Tibetan plateau. Int. J. Climatol. 2015, 35, 687–698. [Google Scholar] [CrossRef]
  91. Jung, M.; Reichstein, M.; Margolis, H.A.; Cescatti, A.; Richardson, A.D.; Arain, M.A.; Arneth, A.; Bernhofer, C.; Bonal, D.; Chen, J.; et al. Global patterns of land-atmosphere fluxes of carbon dioxide, latent heat, and sensible heat derived from eddy covariance, satellite, and meteorological observations. J. Geophys. Res. Biogeosci. 2011, 116, 1566. [Google Scholar] [CrossRef]
  92. Piao, S.; Fang, J.; Ciais, P.; Peylin, P.; Huang, Y.; Sitch, S.; Wang, T. The carbon balance of terrestrial ecosystems in China. Nature 2009, 458, 1009–1013. [Google Scholar] [CrossRef]
  93. Fu, M.; Tian, J.; Zhu, Y.; Tian, Y.; Zhao, Z.; Li, J. Identification of functional zones and methods of target management in Sanjiangyuan National Park. Biodivers. Sci. 2017, 25, 71–79. [Google Scholar] [CrossRef] [Green Version]
  94. Coughlin, K.; Tung, K.K. Empirical Mode Decomposition and Climate Variability. In Hilbert-Huang Transform and Its Applications; Interdisciplinary Mathematical Sciences; World Scientific: Singapore, 2005; Volume 5, pp. 149–165. [Google Scholar]
Figure 1. Spatial distribution of elevation (a) and vegetation types (b) in the TRSR and its subregions.
Remotesensing 14 04795 g001
Figure 2. Correlation analysis between two GPPs products in the TRSR.
Remotesensing 14 04795 g002
Figure 3. EEMD analysis of the average GPP (a) and NEP (b) changes during 1985–2018. IMF1–IMF 4 and Trend represent variations on different time scales and long-term trends, respectively.
Remotesensing 14 04795 g003
Figure 4. Trends of GPP (green line) and NEP (red line) in the TRSR from 1985 to 2018.
Remotesensing 14 04795 g004
Figure 5. The spatial distribution variation in the average annual GPP (a) and NEP (b) over the TRSR from 1985 to 2018.
Remotesensing 14 04795 g005
Figure 6. Area proportion of the different carbon flux distribution intervals.
Remotesensing 14 04795 g006
Figure 7. The spatial distribution of the trend of alpine grassland GPP (a,c,e) and NEP (b,d,f) in the TRSR during the different periods.
Remotesensing 14 04795 g007
Figure 8. Area percentages of changes in GPP (a) and NEP (b) in different regions.
Remotesensing 14 04795 g008
Figure 9. Alpine meadow and alpine steppe carbon fluxes in the TRSR.
Remotesensing 14 04795 g009
Figure 10. Carbon fluxes in the alpine meadow and alpine steppe of the three sub-park regions.
Remotesensing 14 04795 g010
Figure 11. Spatial distribution of temperature (a), precipitation (b), and solar radiation (c) and the correlations between (d) GPP and temperature, (e) GPP and precipitation, (f) GPP and solar radiation, (g) NEP and temperature, (h) NEP and precipitation, and (i) NEP and solar radiation during 1985–2018.
Remotesensing 14 04795 g011
Figure 12. The contributions of temperature (a,d), precipitation (b,e) and solar radiation (c,f) to the GPP and NEP trends in the TRSR.
Remotesensing 14 04795 g012
Figure 13. The contributions of other factors to the GPP (a) and NEP (b) trends in the TRSR.
Remotesensing 14 04795 g013
Table 1. Description of the data used in this study.
Data TypeDate NameSpatial ResolutionTemporal ResolutionProvider
Meteorological dataMean annual temperature, Precipitation, Solar radiation0.1°YearlyNational Tibetan Plateau Data Center, China.
Vegetation dataLAI0.072727°Every 15/16 days from 1985 to 1999, Every 8 days from 2000 to 2018AVHRR and MODIS
Carbon fluxes stimulated by BEPSGPP, NEP0.072727°YearlyNational Ecosystem Science Data Center, China.
Table 2. Classification of Carbon Flux Trend.
β|Zmk|Meaning
>0>1.96Significant increase
>0≤1.96Increase
<0>1.96Significant decrease
<0≤1.96Decrease
Table 3. Average periods and their variance contributions to carbon fluxes.
Carbon FluxesVariablesIMF1IMF2IMF3IMF4Trend
GPPPeriod (yr)361734-
Variance Contribution (%)24.419.045.570.0077.43
NEPPeriod (yr)361734-
Variance Contribution (%)35.2611.1831.330.0044.57
Table 4. Alpine grassland trends in the TRSR and its subregions.
GPP NEP
RegionsMean (g C/m2/yr)Trend
(g C/m2/yr)
R2p ValueMean (g C/m2/yr)Trend
(g C/m2/yr)
R2p Value
TRSR147.861.310.69<0.00111.270.400.180.01
YRSP49.520.490.64<0.0014.060.220.22<0.01
HRSP89.870.980.63<0.0016.570.400.190.01
LRSP128.910.820.52<0.0017.050.210.060.16
Table 5. Comparison with other NEP estimation results.
TypesResearch CaseResearch AreaTotal NEP
(Tg C/yr)
Mean NEP
(g/m2/yr)
Study PeriodStudy Method
Alpine steppeYan et al. 2015 [71]Qinghai–Tibetan Plateau1.152.171961–2010Terrestrial Ecosystem Model
Alpine meadowYan et al. 2015 [71]Qinghai–Tibetan Plateau9.0119.111961–2010Terrestrial Ecosystem Model
Alpine meadowWei et al. 2021 [30]Qinghai–Tibetan Plateau-98.6 ± 28.82002–2020Tower–based flux
Alpine steppeWei et al. 2021 [30]Qinghai–Tibetan Plateau-64.3 ± 38.72002–2020Tower–based flux
All vegetationGuo et al. 2021 [68]The Hindu Kush Himalayan7742.032001–2018Carnegie–Ames StanfordApproach
GrasslandHuang et al. 2022 [69]Qinghai Province2.435.161979–2018Biome–BGCMuSo model
Alpine steppeThis studyThree River Source Region0.224.821985–2018BEPS
Alpine meadowThis studyThree River Source Region2.4313.001985–2018BEPS
All of VegetationThis studyThree River Source Region3.7411.271985–2018BEPS
Publisher’s Note: MDPI stays neutral with regard to jurisdictional claims in published maps and institutional affiliations.

