Technical Note

Sensitivity Analysis of 1,3-Butadiene Monitoring Based on Space-Based Detection in the Infrared Band

1
School of Physics, Xidian University, Xi’an 710000, China
2
Collaborative Innovation Center of Information Sensing and Understanding, Xidian University, Xi’an 710000, China
*
Author to whom correspondence should be addressed.
Remote Sens. 2022, 14(19), 4788; https://doi.org/10.3390/rs14194788
Submission received: 24 July 2022 / Revised: 16 September 2022 / Accepted: 23 September 2022 / Published: 25 September 2022

Abstract

:
The monitoring of the Volatile Organic Compounds (VOCs) in the atmosphere is of great significance for reducing chemical pollution, warning of fires, and improving air quality. Among the VOCs, 1,3-butadiene is essential to monitor as a carcinogenic environmental pollutant. The space-based detection of 1,3-butadiene was made possible by recently development of infrared detection satellites and advances in spectroscopic techniques. In this work, based on the demand for space-based infrared detection of 1,3-butadiene, a modeling method of Earth background radiance characteristics coupled with remote sensing data and physical model is proposed, which can effectively simulate the Earth background radiance field distribution under any atmospheric conditions. Specifically, infrared spectral radiance of 1,3-butadiene was simulated from absorption cross-section data. Further, combined with the radiative transfer model and atmospheric profiles of satellite sensor data, such as temperature, pressure, and H2O and O3 mixing ratio, the atmospheric transmittance and atmospheric background radiance are simulated. Finally, infrared space-based detection of 1,3-butadiene is simulated by coupling Earth background radiance and the detectability is analyzed and discussed by using signal-to-clutter ratio (SCR). The results show that 1,3-butadiene has an absorption effect in space-based infrared detection. The detectability of the narrow band 9.8–10.0 μm and 10.9–11.1 μm is better than that of the wide band 9.0–12.0 μm, and 10.9–11.1 μm is a better detection band for 1,3-butadiene than other bands. This paper provides a method for the space-based infrared detection of 1,3-butadiene. It also provides a reference for selecting the appropriate band for the detector.

1. Introduction

1,3-butadiene is an important industrial material, which is primarily used in the manufacturing of synthetic elastomers, such as rubbers and latexes. It is emitted into the atmosphere, water, and food from automobile exhaust fumes, domestic fires, forest fires, petroleum refining, and wastewater treatment [1]. In smoke from domestic fires, concentrations of 1,3-butadiene gas are monitored up to 15 ppm, which raises the risk of cancer in humans [2,3]. 1,3-butadiene has harmful effects on human health and the ecological system [4,5,6]. The Expert Panel on Air Quality Standards (EPAQS) accepted 1,3-butadiene as a genotoxic carcinogen as early as 1994, and the U.S. Environmental Protection Agency (USEPA) has classified 1,3-butadiene as a Group B2 carcinogen. 1,3-butadiene can also react with O3 to form secondary organic aerosols, contributing to particulate pollution [7,8]. The monitoring of 1,3-butadiene is important for pollution emission from chemical gas leaks and forest fires [9].
The current method of detecting 1,3-butadiene is to establish an environmental monitoring network [10]. Passive air sampling for VOCs included 1,3-butadiene, and a benzene compound species was conducted at 24 fire stations and one compliance monitoring site in Dallas, TX, USA [11]. The UK Hydrocarbon Monitoring Network provides continuous hourly measurements of 1,3-butadiene at 13 sites [12]. The National Air Pollution Surveillance (NAPS) has established 53 sites to monitor 1,3-butadiene, benzene, and ethylbenzene [13]. Ground-based detection usually requires the establishment of multiple environmental monitoring stations to monitor changes in pollutant gas concentrations, which makes it difficult for ground-based detection to monitor larger regions. With the development of space-based infrared detection technology, space-based infrared detection of VOCs is possible [14]. Compared with the establishment of a ground-based environmental monitoring network, space-based detection has less influence on the atmospheric environment, can detect a larger area, and has a higher detection capacity [15,16]. Currently, space-based infrared detection is widely used for the detection of VOCs, such as, according to the Air Quality System (AQS) and Ozone Monitoring Instrument (OMI) satellite data, inform patterns, trends, and processes of ground-based HCHO [17]. Ozone-VOC sensitivity is characterized by using space-based observations from the Global Ozone Monitoring Experiment (GOME) [14,18]. The three-dimensional chemical transport model GEOS-Chem was used to analyze the concentration of CO combined with the satellite measurement data [19]. In addition, the development of an accurate spectrum of trace gases provides advantages for space-based infrared detection of VOCs, such as the measurement of high-resolution infrared spectra of butadiene [20] and the measurement of infrared absorption characteristics of VOCs using Fourier infrared spectroscopy [21]. Having an accurate spectral characteristic can effectively improve the detectability of space-based observations of 1,3-butadiene. It is possible to infer atmospheric 1,3-butadiene concentrations and distributions using space-based observations, which may be useful for studying emissions and tropospheric chemistry at urban to global scales depending on the quality of the retrievals. Since the spectral radiance characteristics of VOCs are mainly concentrated in the infrared band, space-based infrared detection of 1,3-butadiene gas has good application prospects [22,23,24].
However, the space-based infrared detection of 1,3-butadiene has many difficulties. Space-based detection is affected by many factors. In addition to the emission radiance of 1,3-butadiene itself, the absorption properties of various gas molecules in the atmosphere will also affect the detection of 1,3-butadiene. When the selected detection band is the same as the characteristic radiance band of major gases in the atmosphere, the detected spectral radiances of 1,3-butadiene experience significantly interference [25]. At the same time, the Earth background radiance, atmospheric absorption, and radiance all have an impact on the spectral radiance observed by the detector [15,26]. Usually, the background radiance is calculated by using generic atmospheric models [27,28], but the generic atmospheric models cannot represent the details of the Earth’s surface characteristic and atmospheric characteristic, resulting in large errors in the calculation of background radiance. Therefore, space-based infrared detection of 1,3-butadiene requires the selection of an infrared band in which 1,3-butadiene is well characterized and the major gases that exist in the atmosphere are not well characterized. Additionally, it is necessary to obtain the atmospheric profile of a region to accurately calculate the Earth background radiance.
This paper focuses on the accurate calculation of the spectral emission radiance of 1,3-butadiene and the Earth background radiance in 1,3-butadiene space-based infrared detection. The infrared spectral radiance of 1,3-butadiene at different concentrations was calculated from the high-resolution TRANsmission (HITRAN) infrared spectral database and coupled with the Earth’s infrared background spectral radiation simulated by Thermosphere, Ionosphere, Mesosphere Energetics and Dynamics/Sounding of the Atmosphere using Broadband Emission Radiometry(TIMED/SABER) satellite-observed atmospheric profile data to discuss the detectability of 1,3-butadiene in the infrared spectral range. Section 2 presents the infrared absorption cross-sections of 1,3-butadiene and satellite-observed atmospheric profile data and describes the calculation method of infrared spectral radiance. Section 3 shows the simulated results of the infrared spectral radiance of 1,3-butadiene coupled to the Earth background radiance and discusses the infrared detectability of 1,3-butadiene. Finally, the conclusion is presented in Section 4.

2. Data and Methods

For space-based infrared detection, Earth surface radiance and atmospheric background radiation have a significant impact on the detection of 1,3-butadiene. As shown in Figure 1, there are five types of radiance observed by the detector during the space-based detection of 1,3-butadiene. I 1 is reflected downing radiance from the atmosphere, I 2 is total atmospheric path radiance, I 3 is 1,3-butadiene emission radiance, I4 is directly transmitted reflected solar irradiance and surface reflected downward flux, I5 is surface-emitted radiance. The detectability of 1,3-butadiene spectral radiance can be analyzed by calculating the various types of radiance reaching the detector.

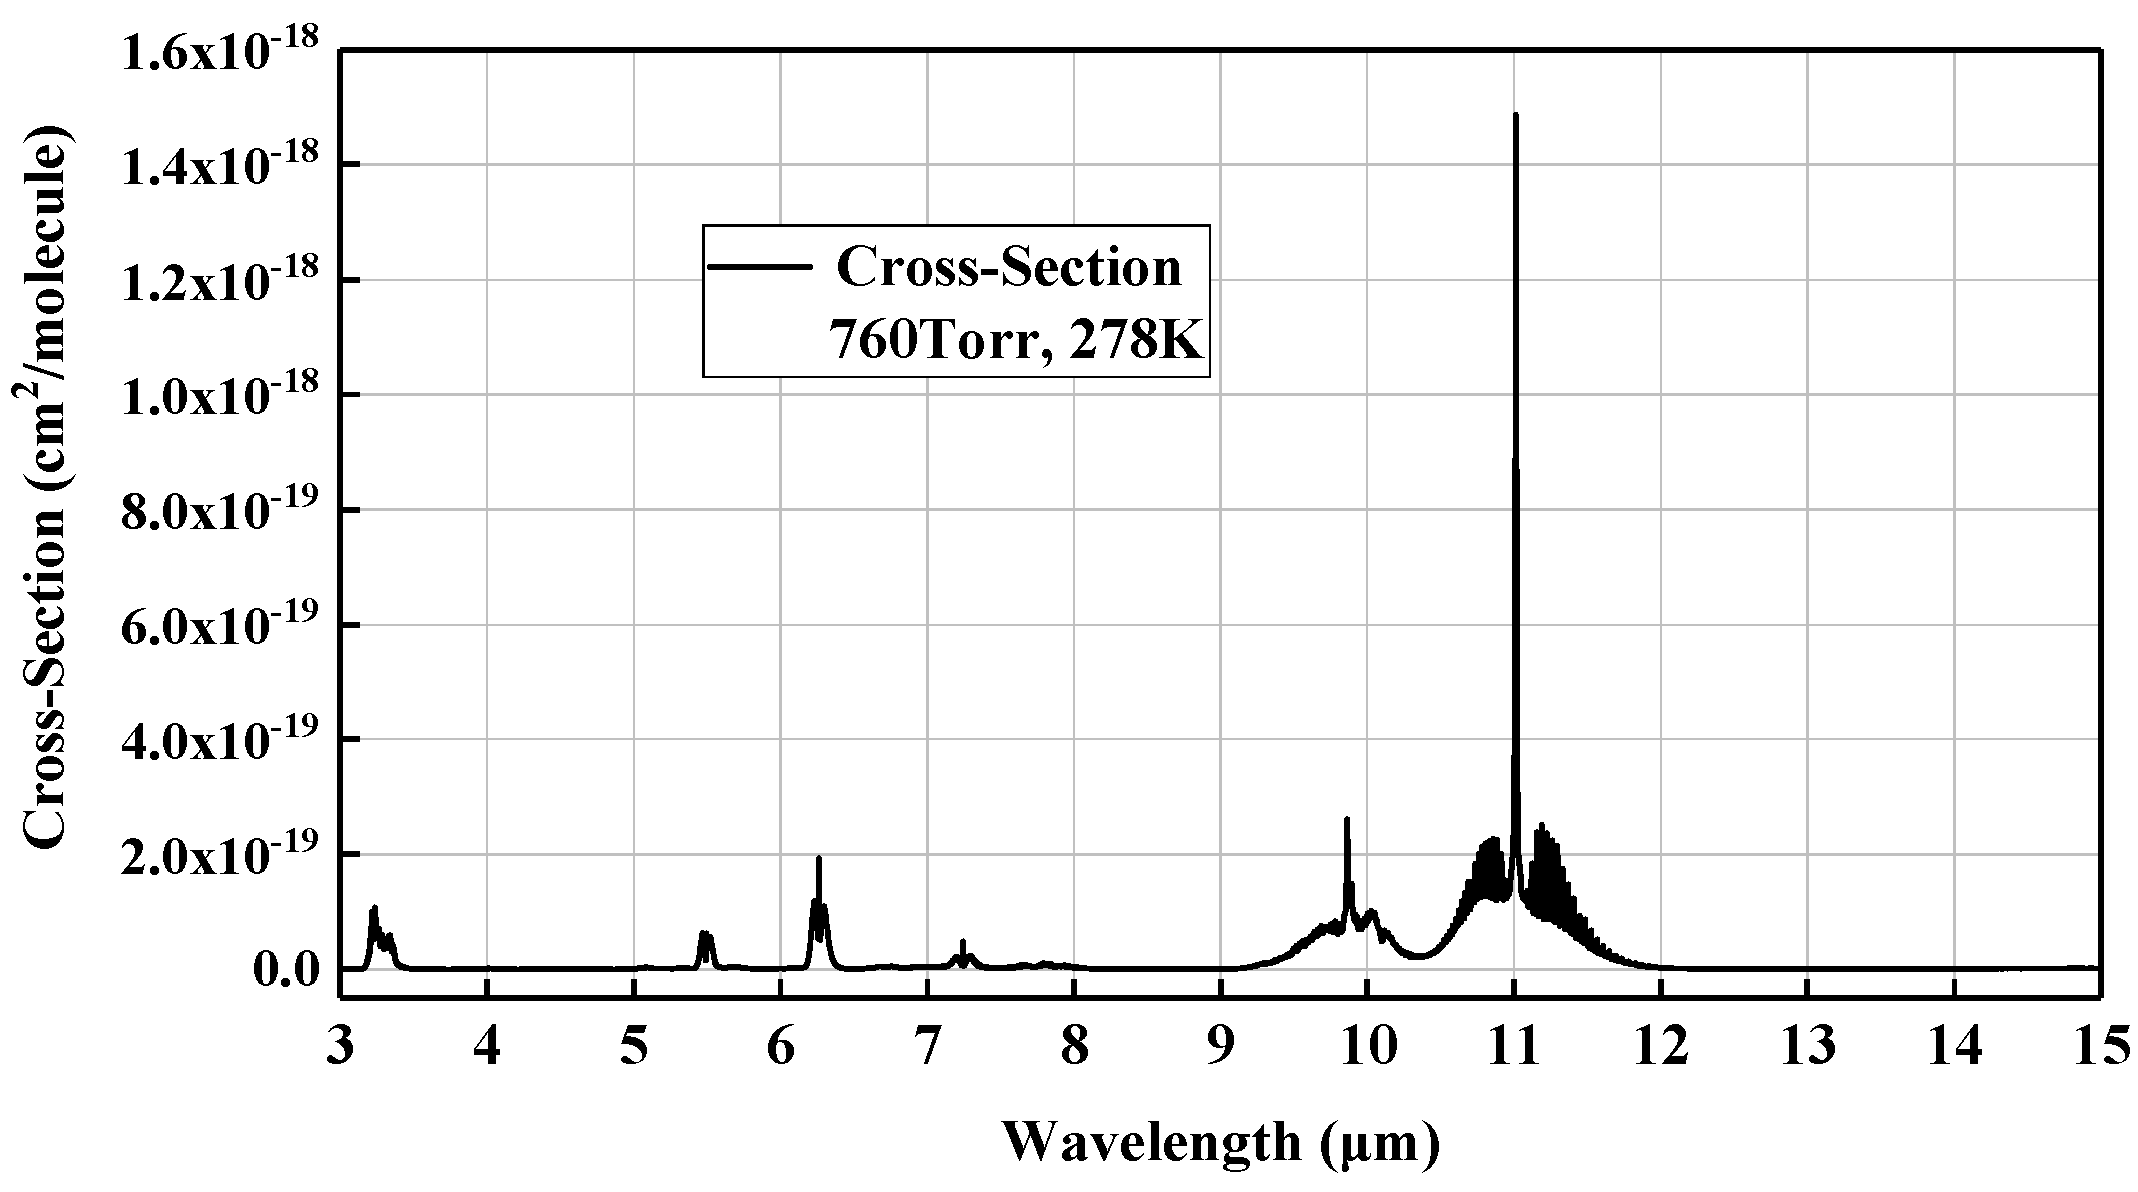
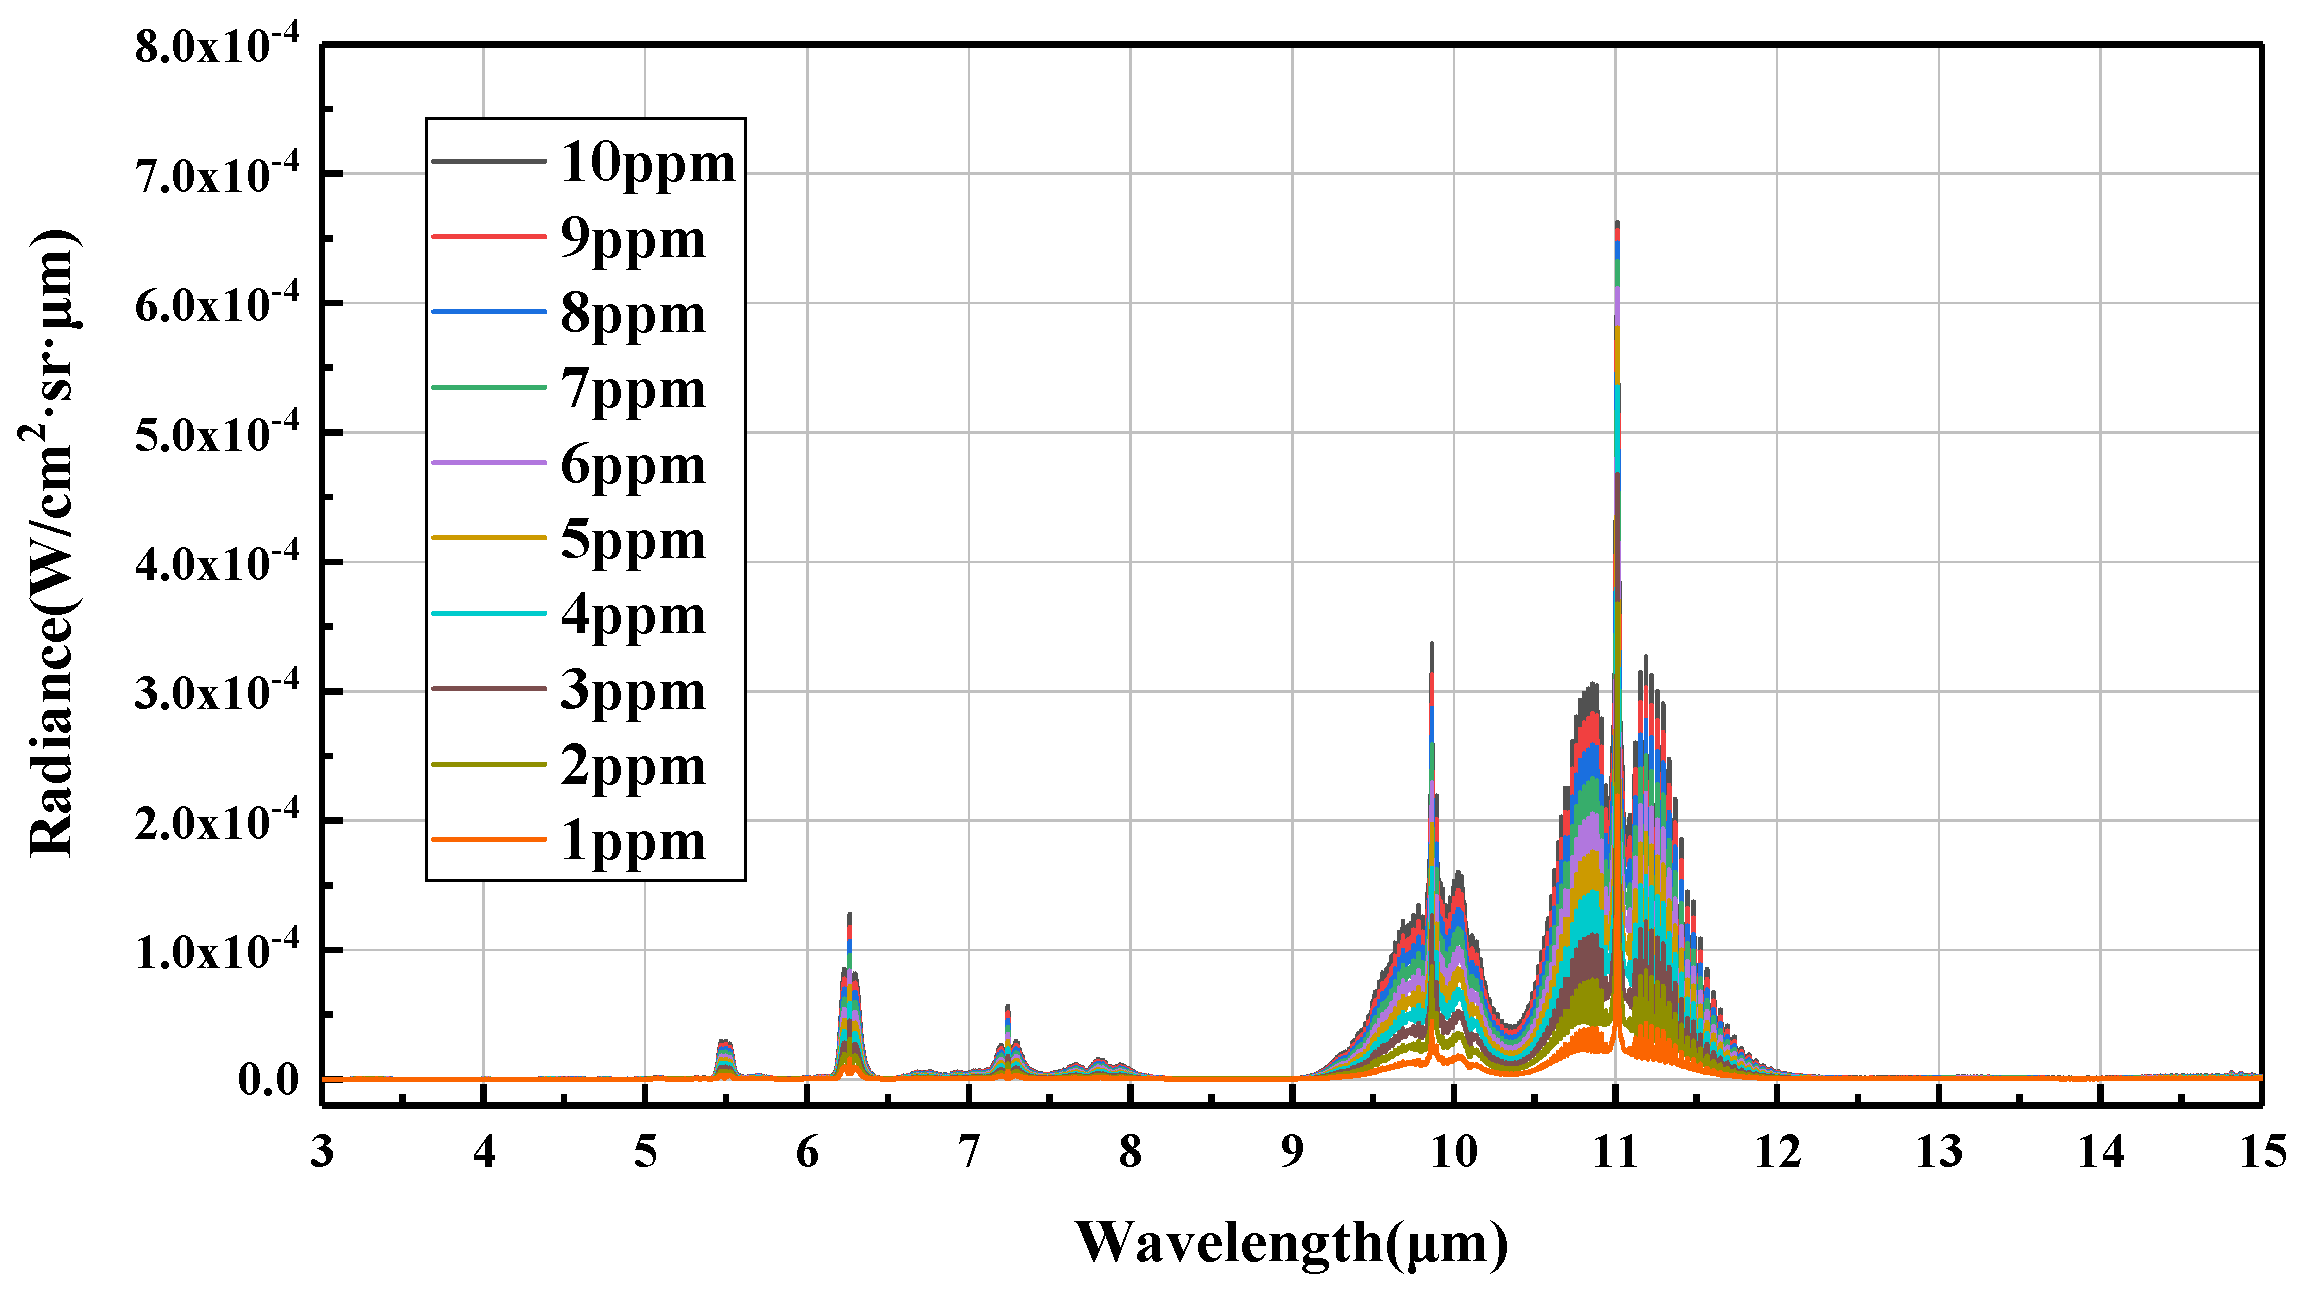
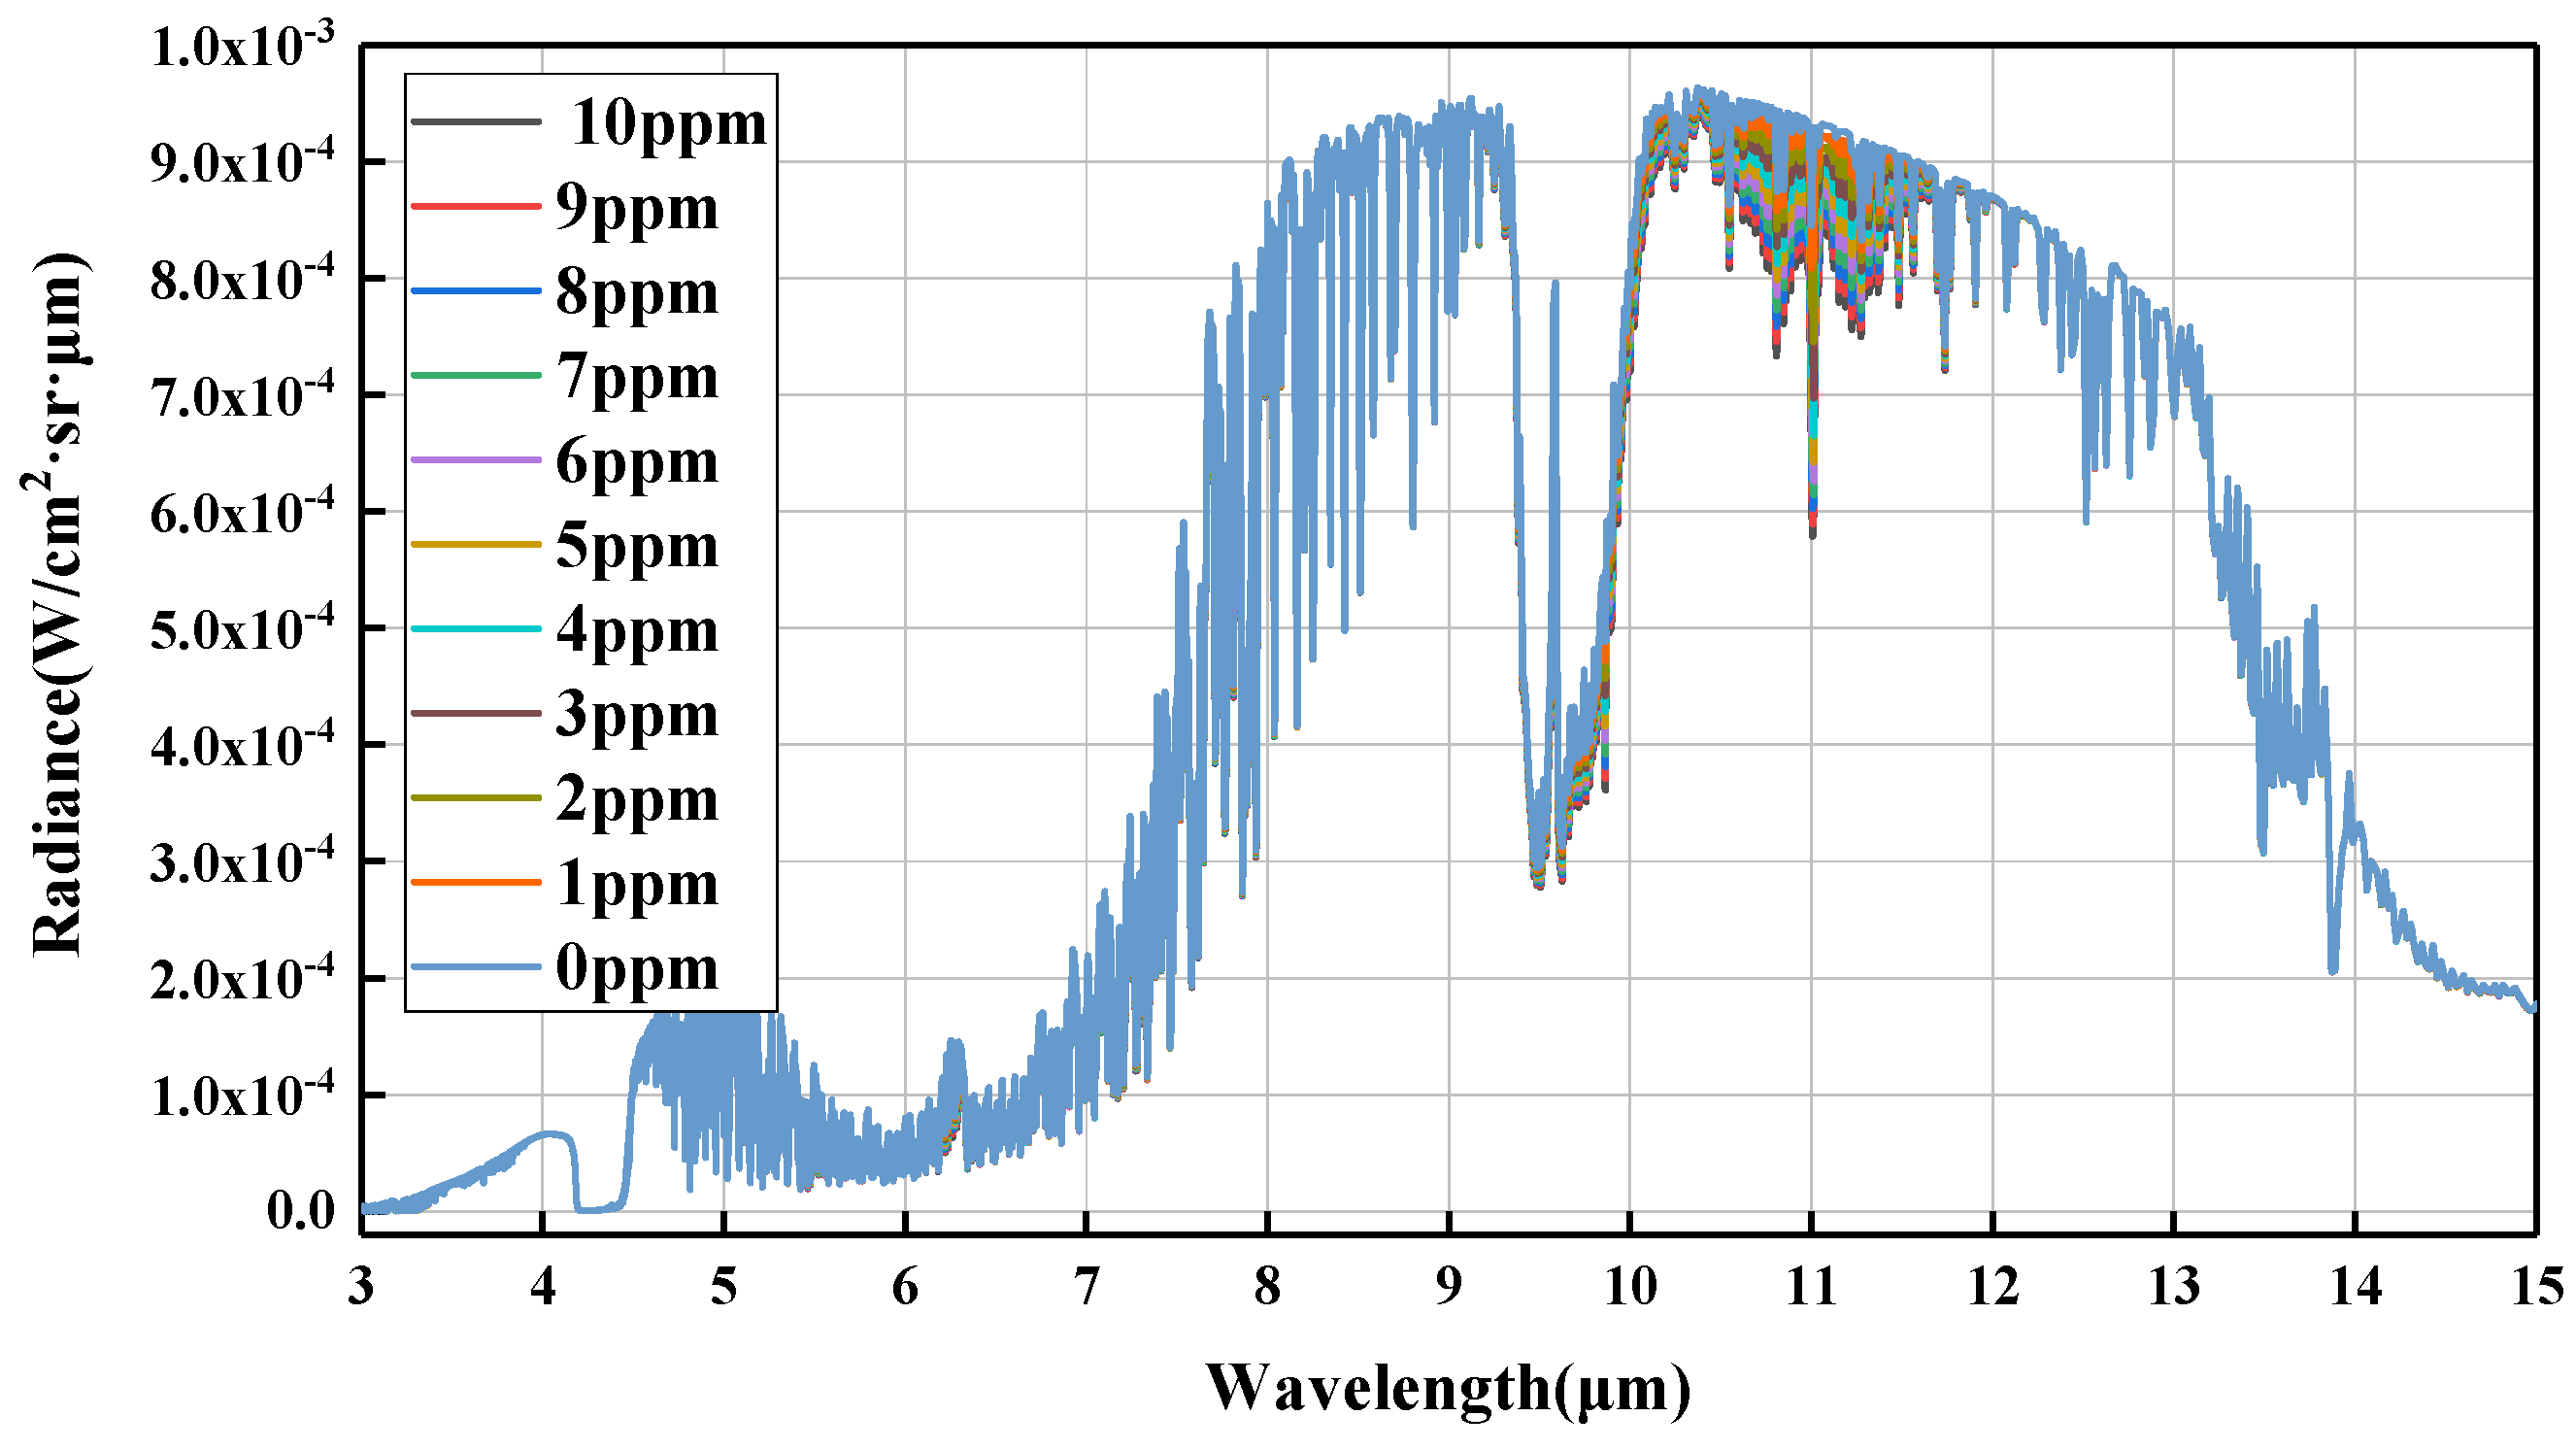
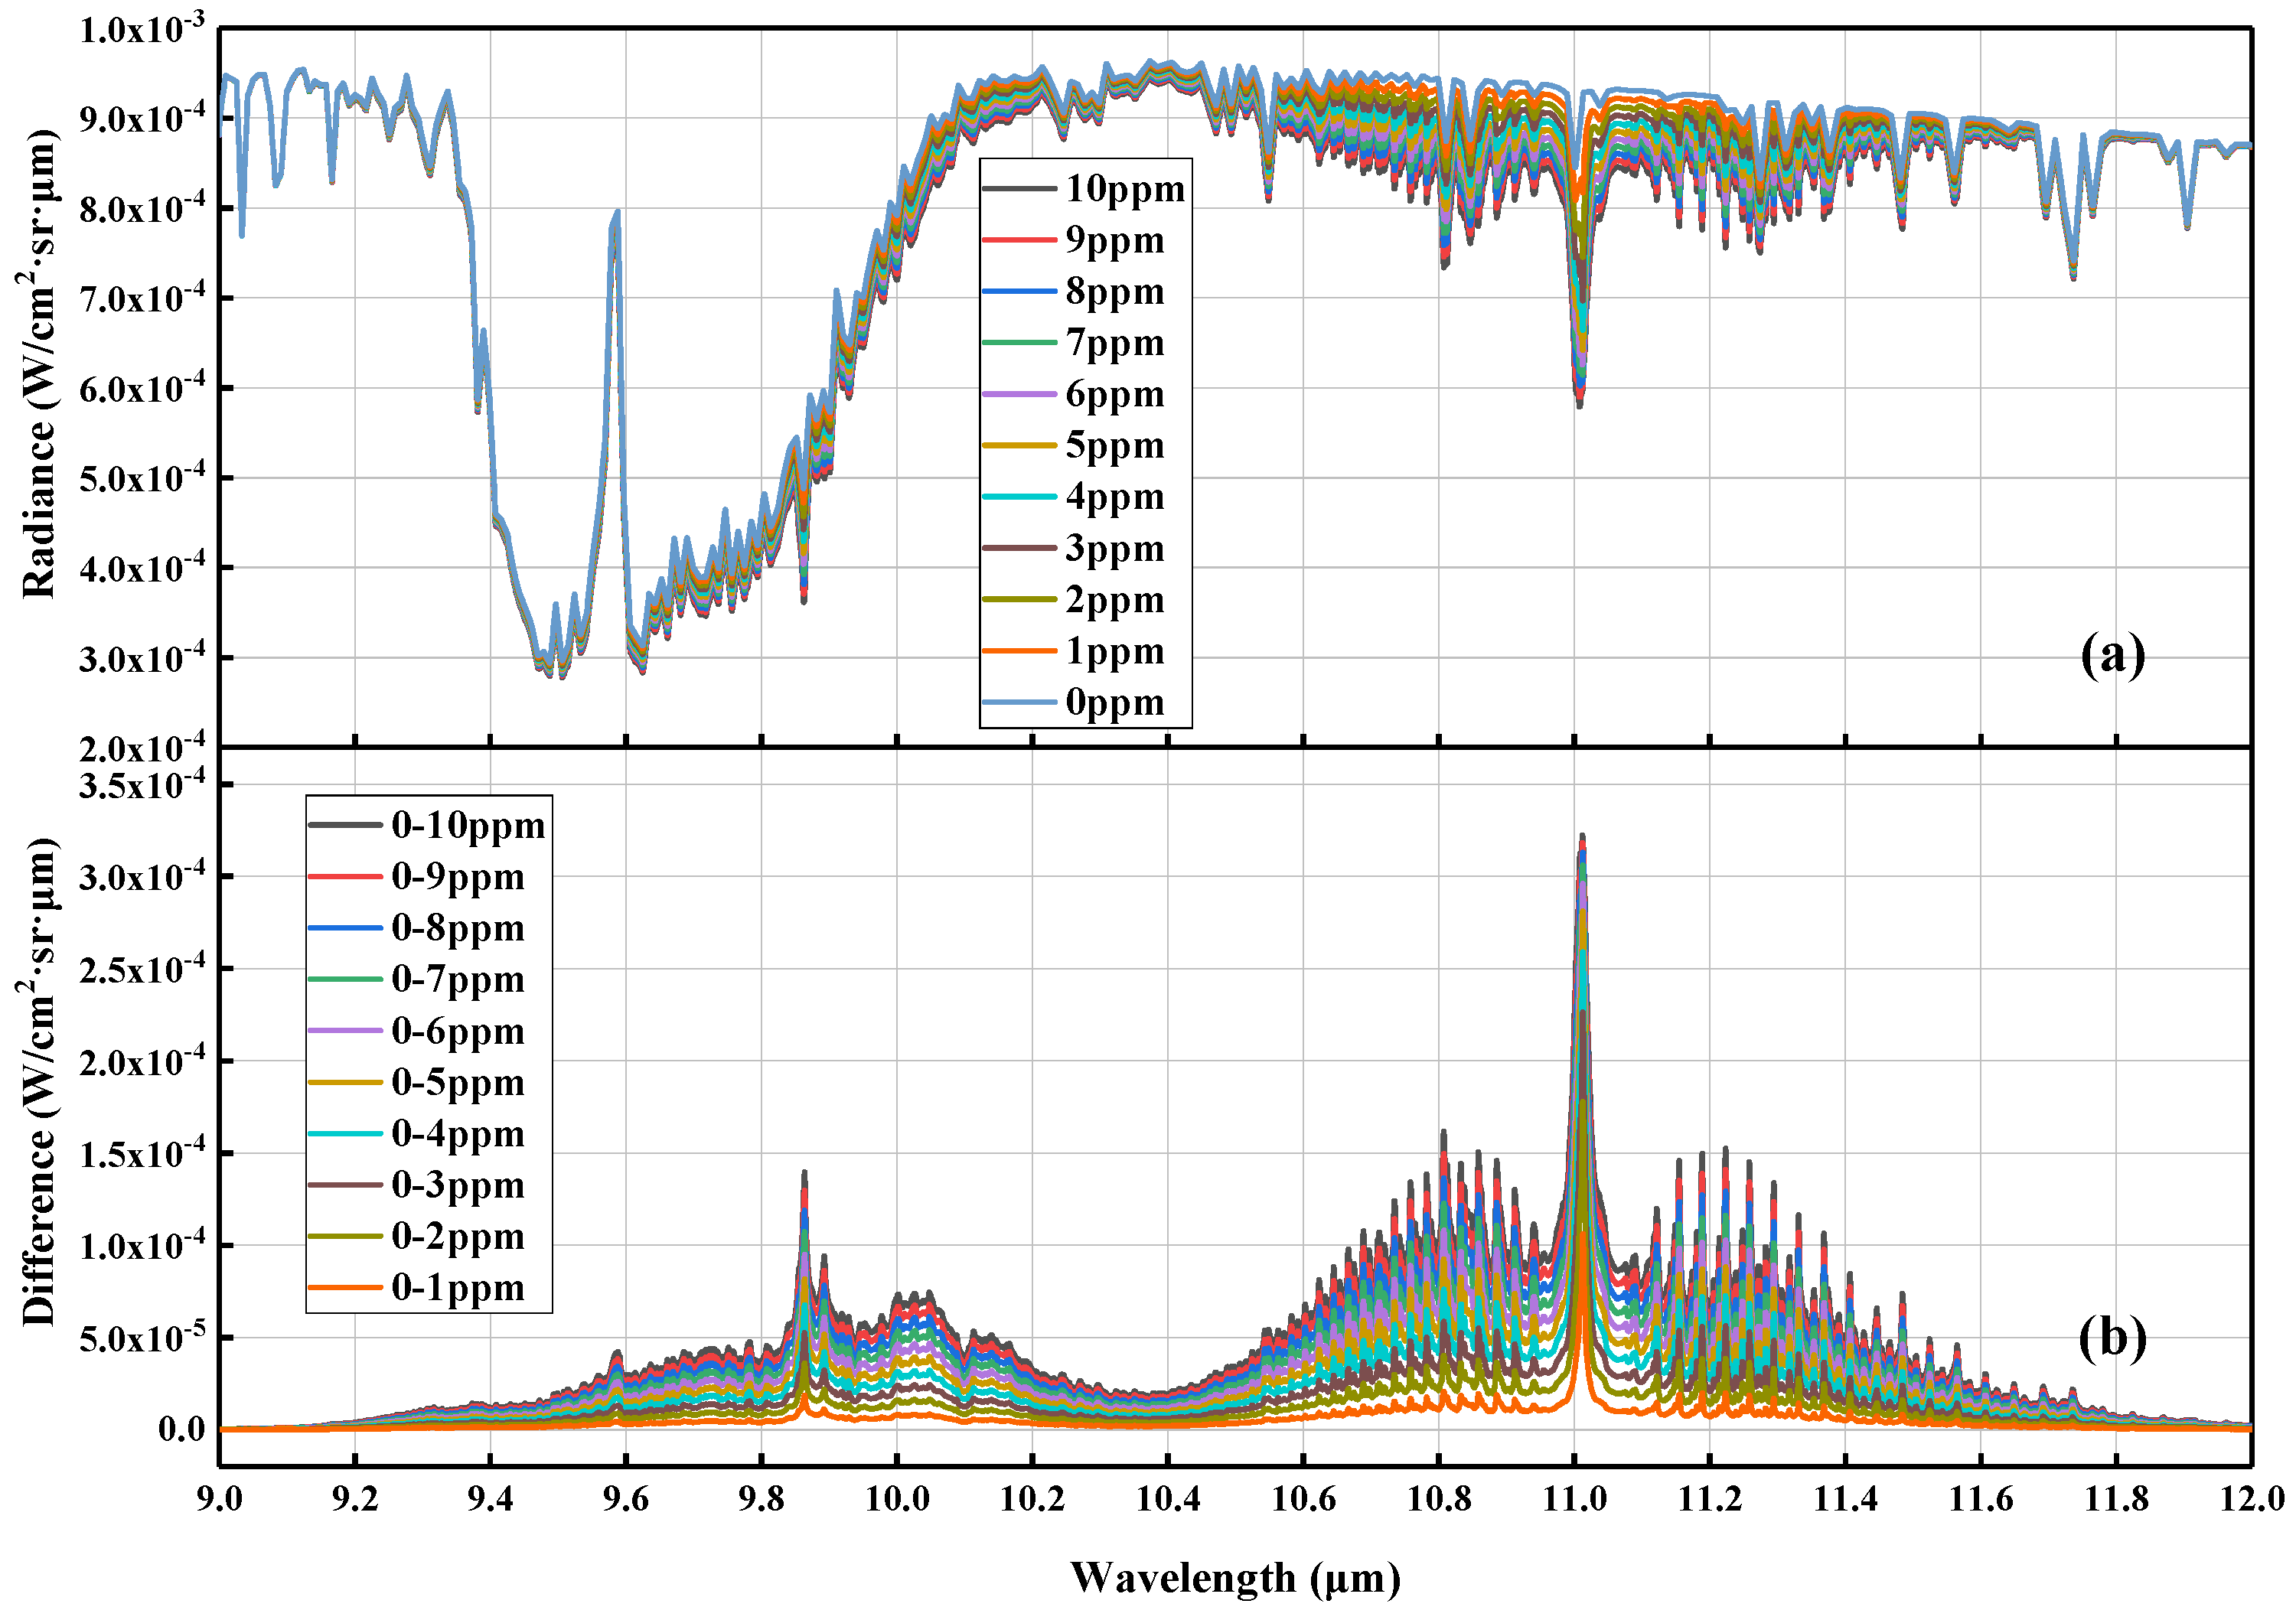
2.1. 1,3-Butadiene Infrared Spectral Radiance

The HITRAN database is the most commonly used source of reference molecular spectroscopic data for molecules of atmospheric interest [29]. In this work, the absorption cross-sections of 1,3-butadiene were obtained from HITRAN online [30]. The absorption cross-section parameters used in this paper are experimental cross-sections, with the following experimental conditions: temperature 278.15 K, pressure 760.0 Torr. The spectral resolution of the absorption cross section is 0.112 cm−1. Figure 2 shows the absorption cross-sections of 1,3-butadiene in the infrared wavelength.
The infrared spectral radiance of 1,3-butadiene was calculated by the absorption coefficient, which was calculated by the absorption cross section and number density. The number density of the gas is calculated according to the ideal gas state equation, and the infrared spectral radiance is calculated by the Beer–Lambert law:
I = B ( T ; ν ) { 1 exp [ α ( ν ) l ] }
α ( ν ) = K a N
N = P / k T
where I is spectral radiance, B ( T ; ν ) is blackbody radiance at temperature T and frequency ν, α is absorption coefficient, l is path length, K a is absorption cross-section, N is number density, P is pressure, and k is Boltzmann’s constant. The spectral radiance of monolayer 1,3-butadiene can be calculated by Equations (1)–(3). To simulate the total spectral radiance of multilayer 1,3-butadiene, the Line-Of-Sight (LOS) method was used. The 1,3-butadiene emission radiance I 3 can be calculated according to Equation (4):
I 3 = I 1 e m = 1 N α m l m + n = 2 N [ I n 1 ( 1 e α n 1 l n 1 ) e j = n N α n l n ]
where I 1 is the emission radiance of the first layer, I n is the emission radiance of the n th layer, α n is the absorption coefficient of the n th layer, and l n is the path length of the n th layer.

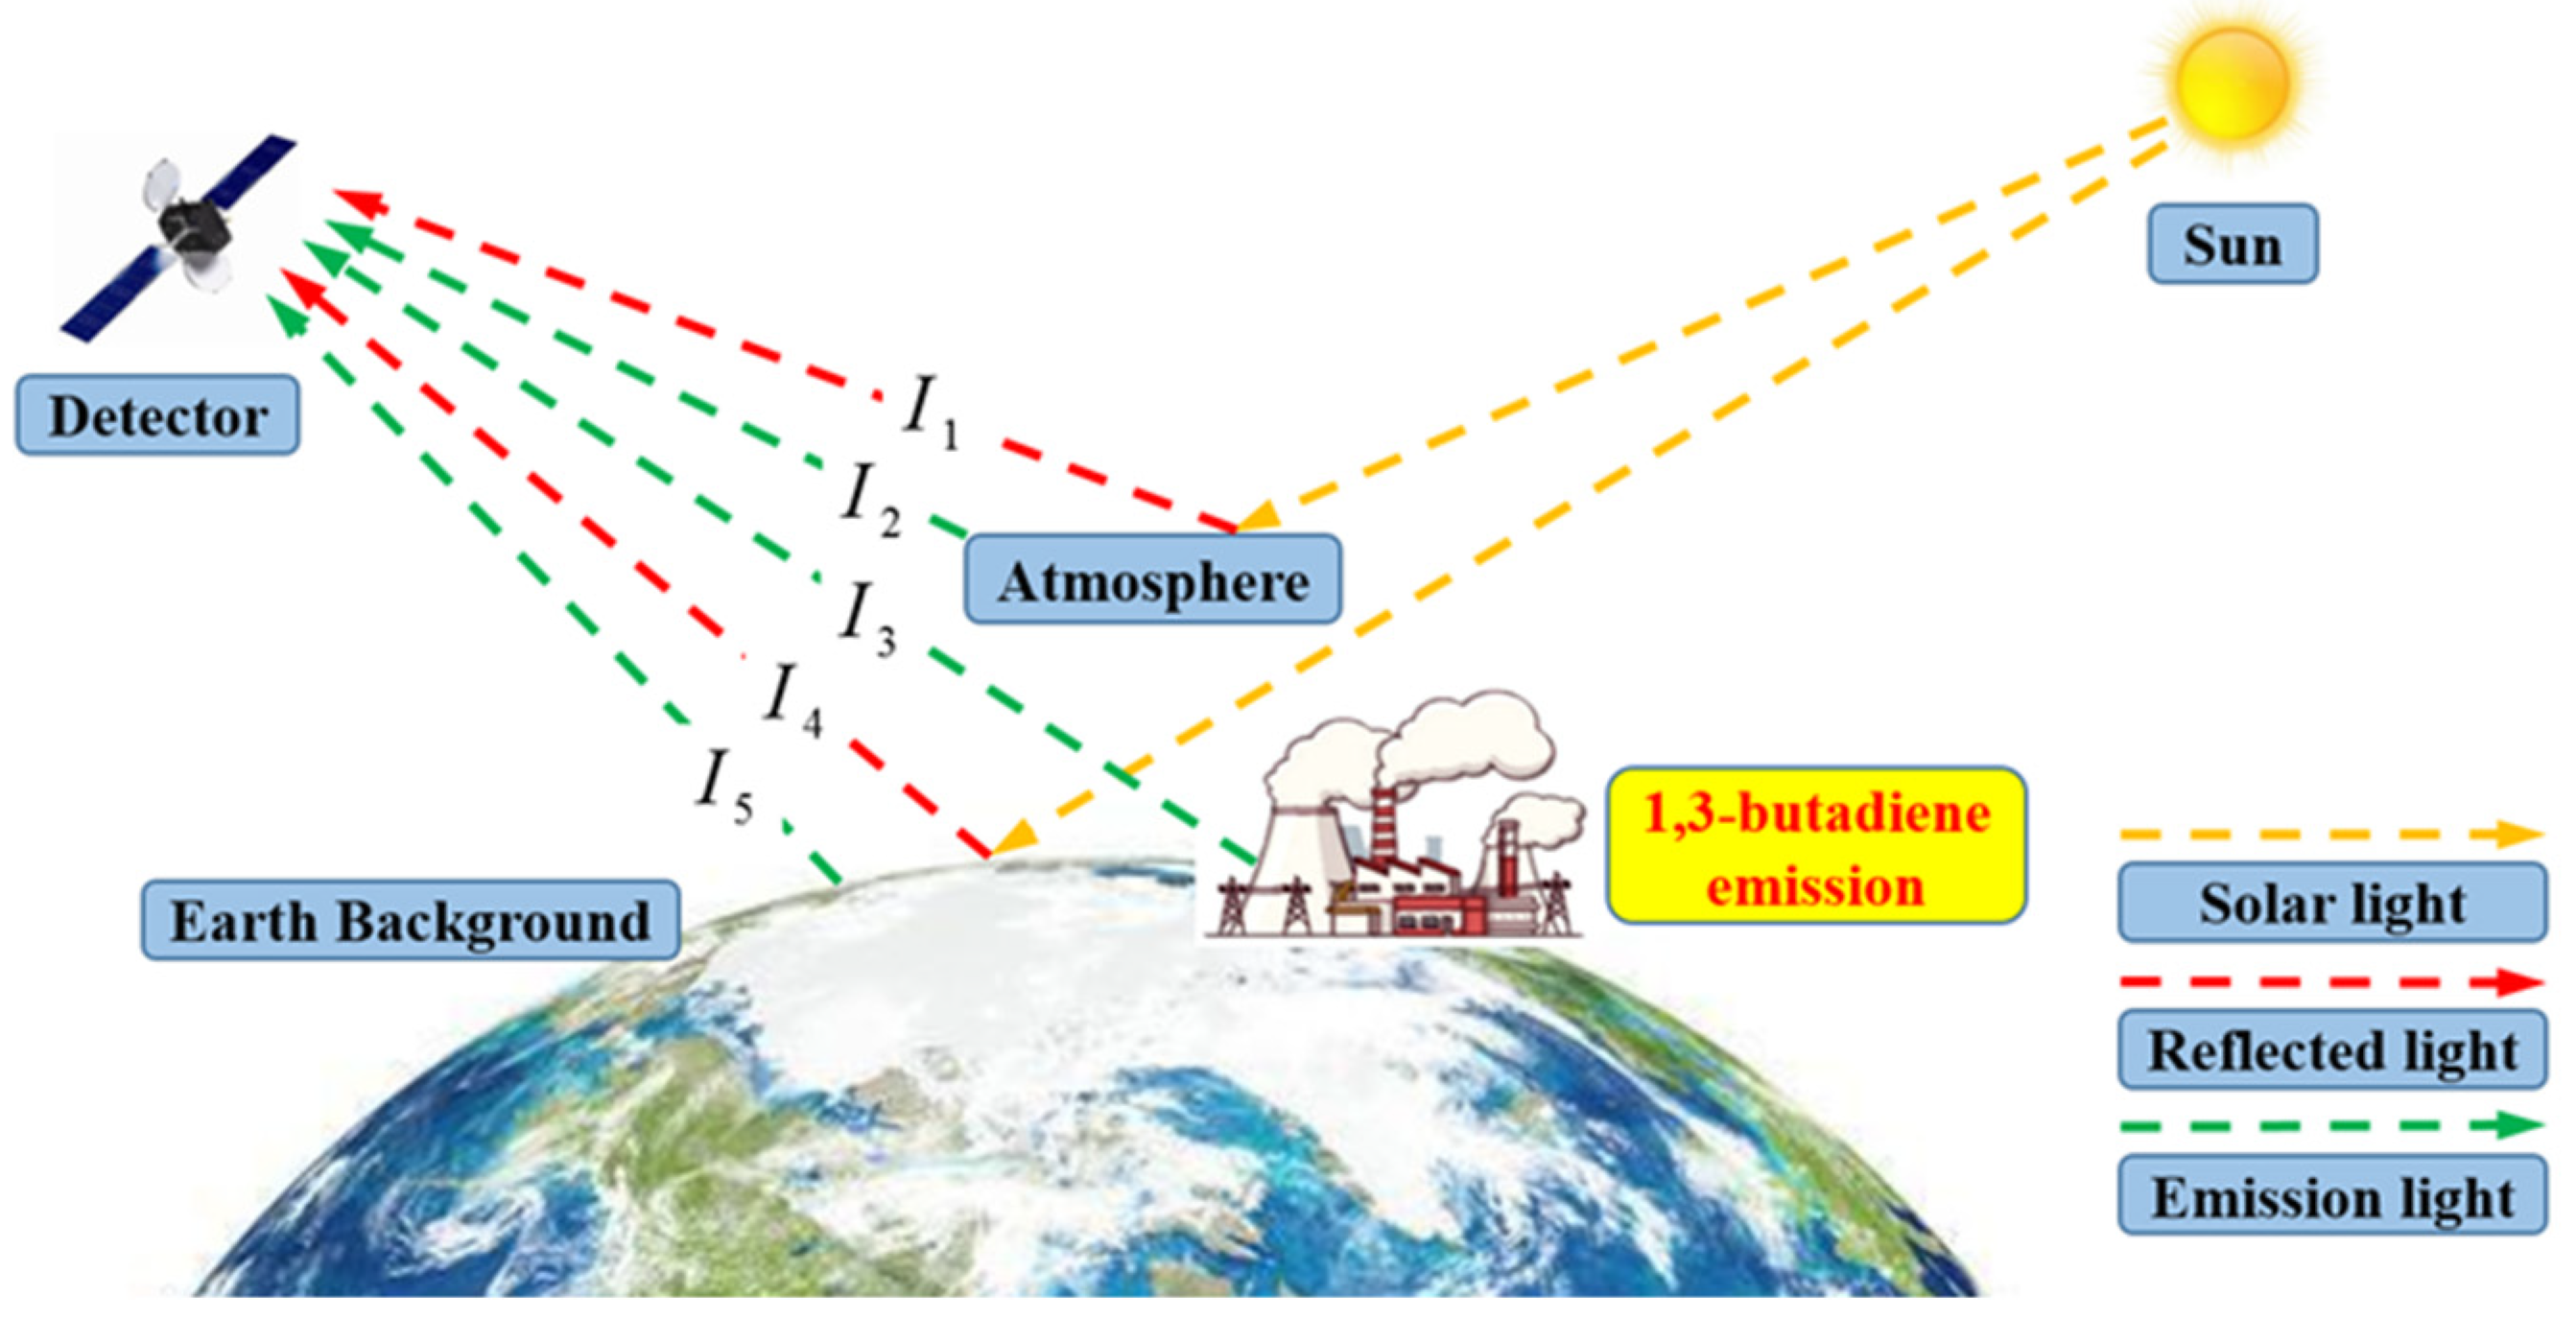
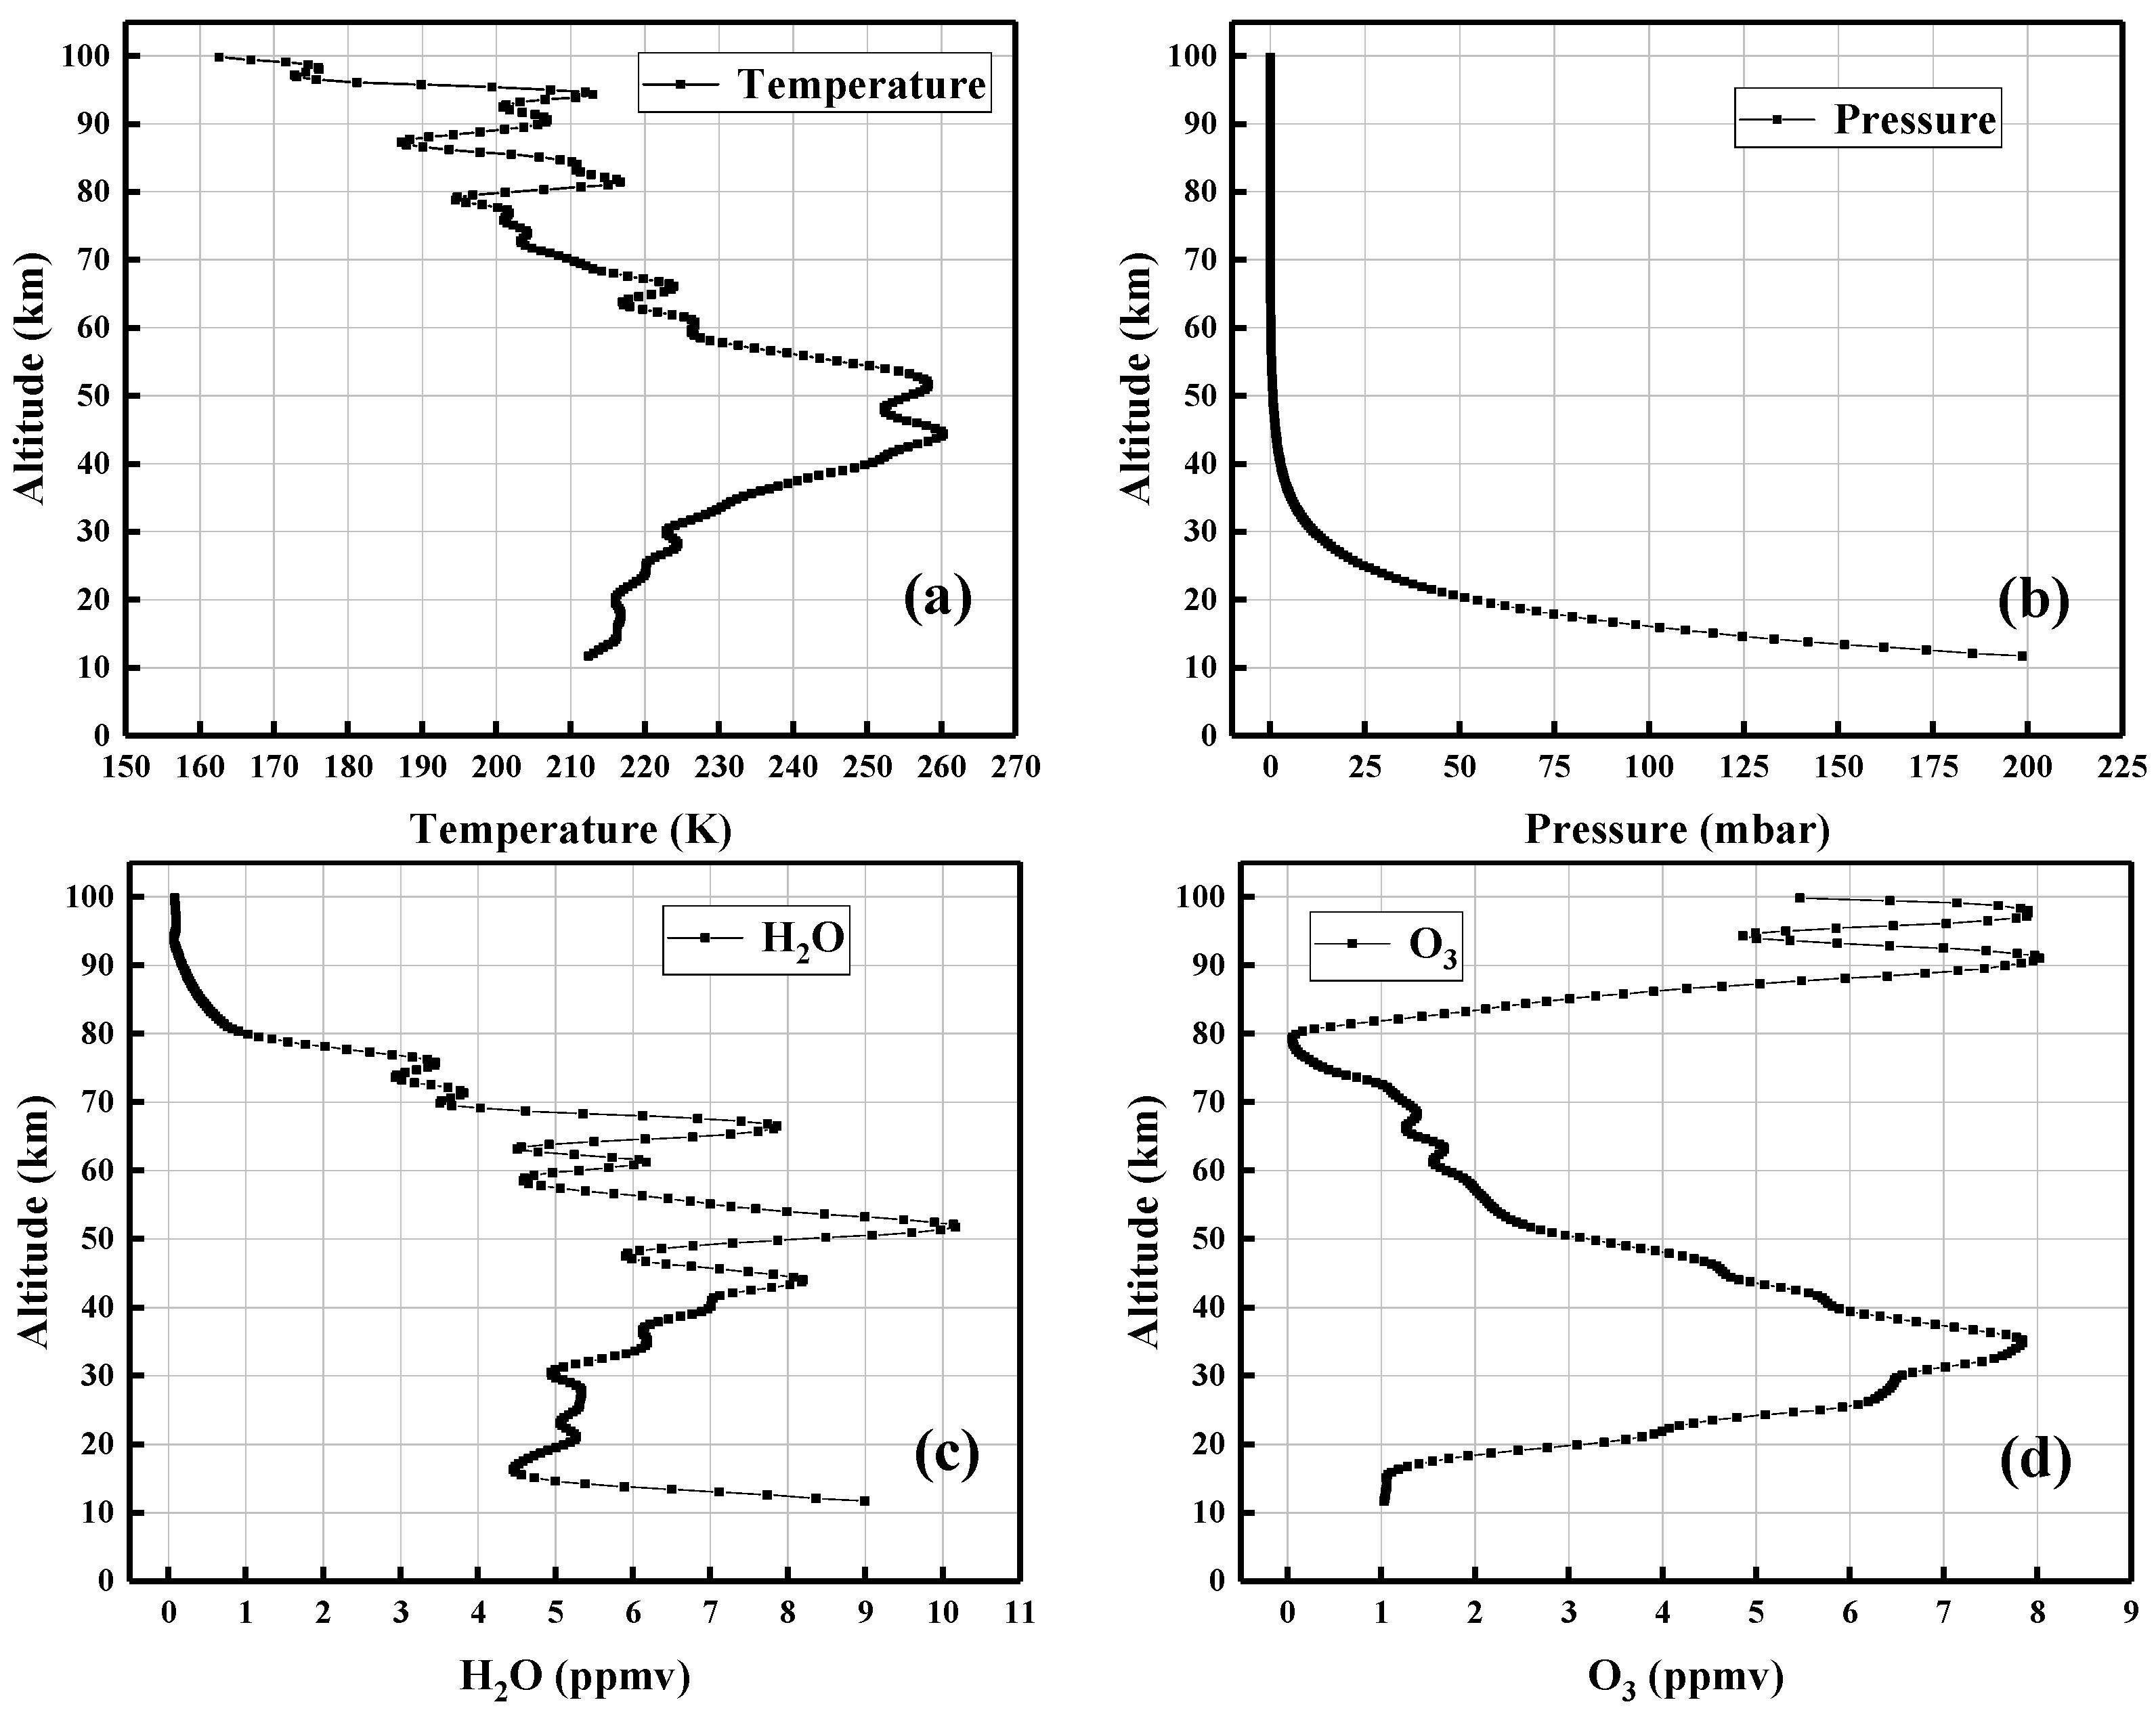
2.2. Atmospheric Infrared Background Radiance

DIScrete Ordinate method for Radiative Transfer (DISORT) was used to simulate the infrared Earth background radiance at the satellite detector [31]. DISORT is based on the radiative transfer Equation (5). For space-based detection, the Earth background radiance at the detector of infrared spectral bands is a combination of two terms: Earth-emitted radiance and path radiance. The radiative transfer equation in integral from is as follows:
I b a c k g r o u n d ( ν ) = exp [ τ ( ν ) ] I Ω ( ν ) + 0 τ ( ν ) exp [ τ ( ν ) ] J Ω ( ν ) d τ ( ν )
where I b a c k g r o u n d ( ν ) is the monochromatic background radiance, Ω is the detector view direction, and ν is the spectral frequency. The first term in Equation (5) is the Earth-emitted radiance, equal to the radiance I Ω ( ν ) towards the detector at optical depth τ ( ν ) , and exp [ τ ( ν ) ] is transmittance. The optical depth terms’ path integrals over extinction coefficients are as follows:
τ ( v ) = 0 l α ( v ) d l
The extinction coefficients consist of absorption α a b s ( ν ) and scattering α s c a ( ν ) components:
α ( ν ) = α a b s ( ν ) + α s c a ( ν )
The Earth-emitted radiance is a combination of three terms: surface emission I 5 , directly transmitted reflected solar irradiance, and surface-reflected downward flux I 4 :
I 4 = μ Ω s u n f Ω exp [ τ ( ν ) ] F s u n ( ν ) + μ Ω 0 2 π I Ω ( ν ) f Ω d Ω  
where μ Ω s u n is the cosine of the solar zenith angle, f Ω is the monochromatic directional surface bi-direction reflectance distribution function, F s u n ( ν ) is the Top Of Atmosphere (TOA) solar irradiance, μ Ω is the cosine of the downward flux, I Ω ( ν ) is downward flux, and f Ω is the monochromatic directional surface bi-direction reflectance distribution function of the downward flux.
I 5 = ε Ω B ( T ; ν )
where ε Ω is the monochromatic directional emissivity.
The second term of Equation (5) is the path radiance I1 + I2 (reflected downing radiance from the atmosphere, total atmospheric path radiance), and equal to the integral over the source radiance J Ω ( ν ) directed towards the detector. The atmospheric source term J Ω ( ν ) is a combination of three terms: local thermal emission J Ω e m ( ν ) , directly transmitted single-scattered solar irradiance J Ω s s ( ν ) , and diffuse radiance scattered into the sight J Ω m s ( ν ) :
J Ω ( ν ) = J Ω e m ( ν ) + J Ω s s ( ν ) + J Ω m s ( ν )   = α a b s ( ν ) α ( ν ) B ( T ; ν ) + α s c a ( ν ) α ( ν ) p Ω s ( ν ) exp [ τ ( ν ) ] F s u n ( ν ) + α s c a ( ν ) α ( ν ) 0 4 π p Ω s ( ν ) I Ω s ( ν ) d Ω s
where p Ω s ( ν ) is scattering phase function of single scattered, p Ω s ( ν ) is scattering phase function of multiple scattered, and I Ω s ( ν ) is atmospheric radiance flux. The reflected downing radiance from atmosphere I 1 and the total atmospheric path radiance I 2 can be represented by the source function:
I 1 = 0 τ ( ν ) exp [ τ ( ν ) ] J Ω e m ( ν ) d τ ( ν )
I 2 = 0 τ ( ν ) exp [ τ ( ν ) ] [ J Ω s s ( ν ) + J Ω m s ( ν ) ] d τ ( ν )
According to Equations (5)–(12), the Earth background radiance observed by the space-based detector can be calculated.
In order to simulate the infrared Earth background radiance more accurately in the real environment, the simulations in this work were operated using satellite-measured atmospheric profiles of temperature, pressure, H2O mixing ratio, and O3 mixing ratio obtained from the TIMED/SABER instrument sounding on Xi’an (Shaanxi, China). The TIMED satellite, which has an orbital altitude of about 625 km and an orbital inclination of about 74.1°, is a multichannel infrared radiometer that measures infrared radiance over a wide range of altitude and spectra 8 (1.27–17.0 μm) [32,33]. In this paper, the atmospheric profiles were obtained on 20 March 2022. Figure 3 shows the atmospheric profiles of a typical mid-latitude region spring on a stable atmospheric day.
In this work, the atmospheric profiles are divided into 46 layers to simulate the infrared atmospheric background radiance. From 0–100km, the atmospheric profile is divided into a 1 km layer for 0–25 km, a 2.5 km layer for 25–50 km, and a 5 km layer for 50–100 km.
In order to assess the infrared detectability of 1,3-butadiene, based on the calculated results of 1,3-butadiene infrared radiance observed by the detector, the sensibility of 1,3-butadiene is discussed according to a signal-to-clutter ratio (SCR). The signal-to-clutter ratio is defined as [34]:
S C R = | μ t μ b | σ b
where μ t is the variables correspond to the average gray value of target pixels, μ b is the average gray value of the background pixels, and σ b is the standard deviation of the gray value of the background area.

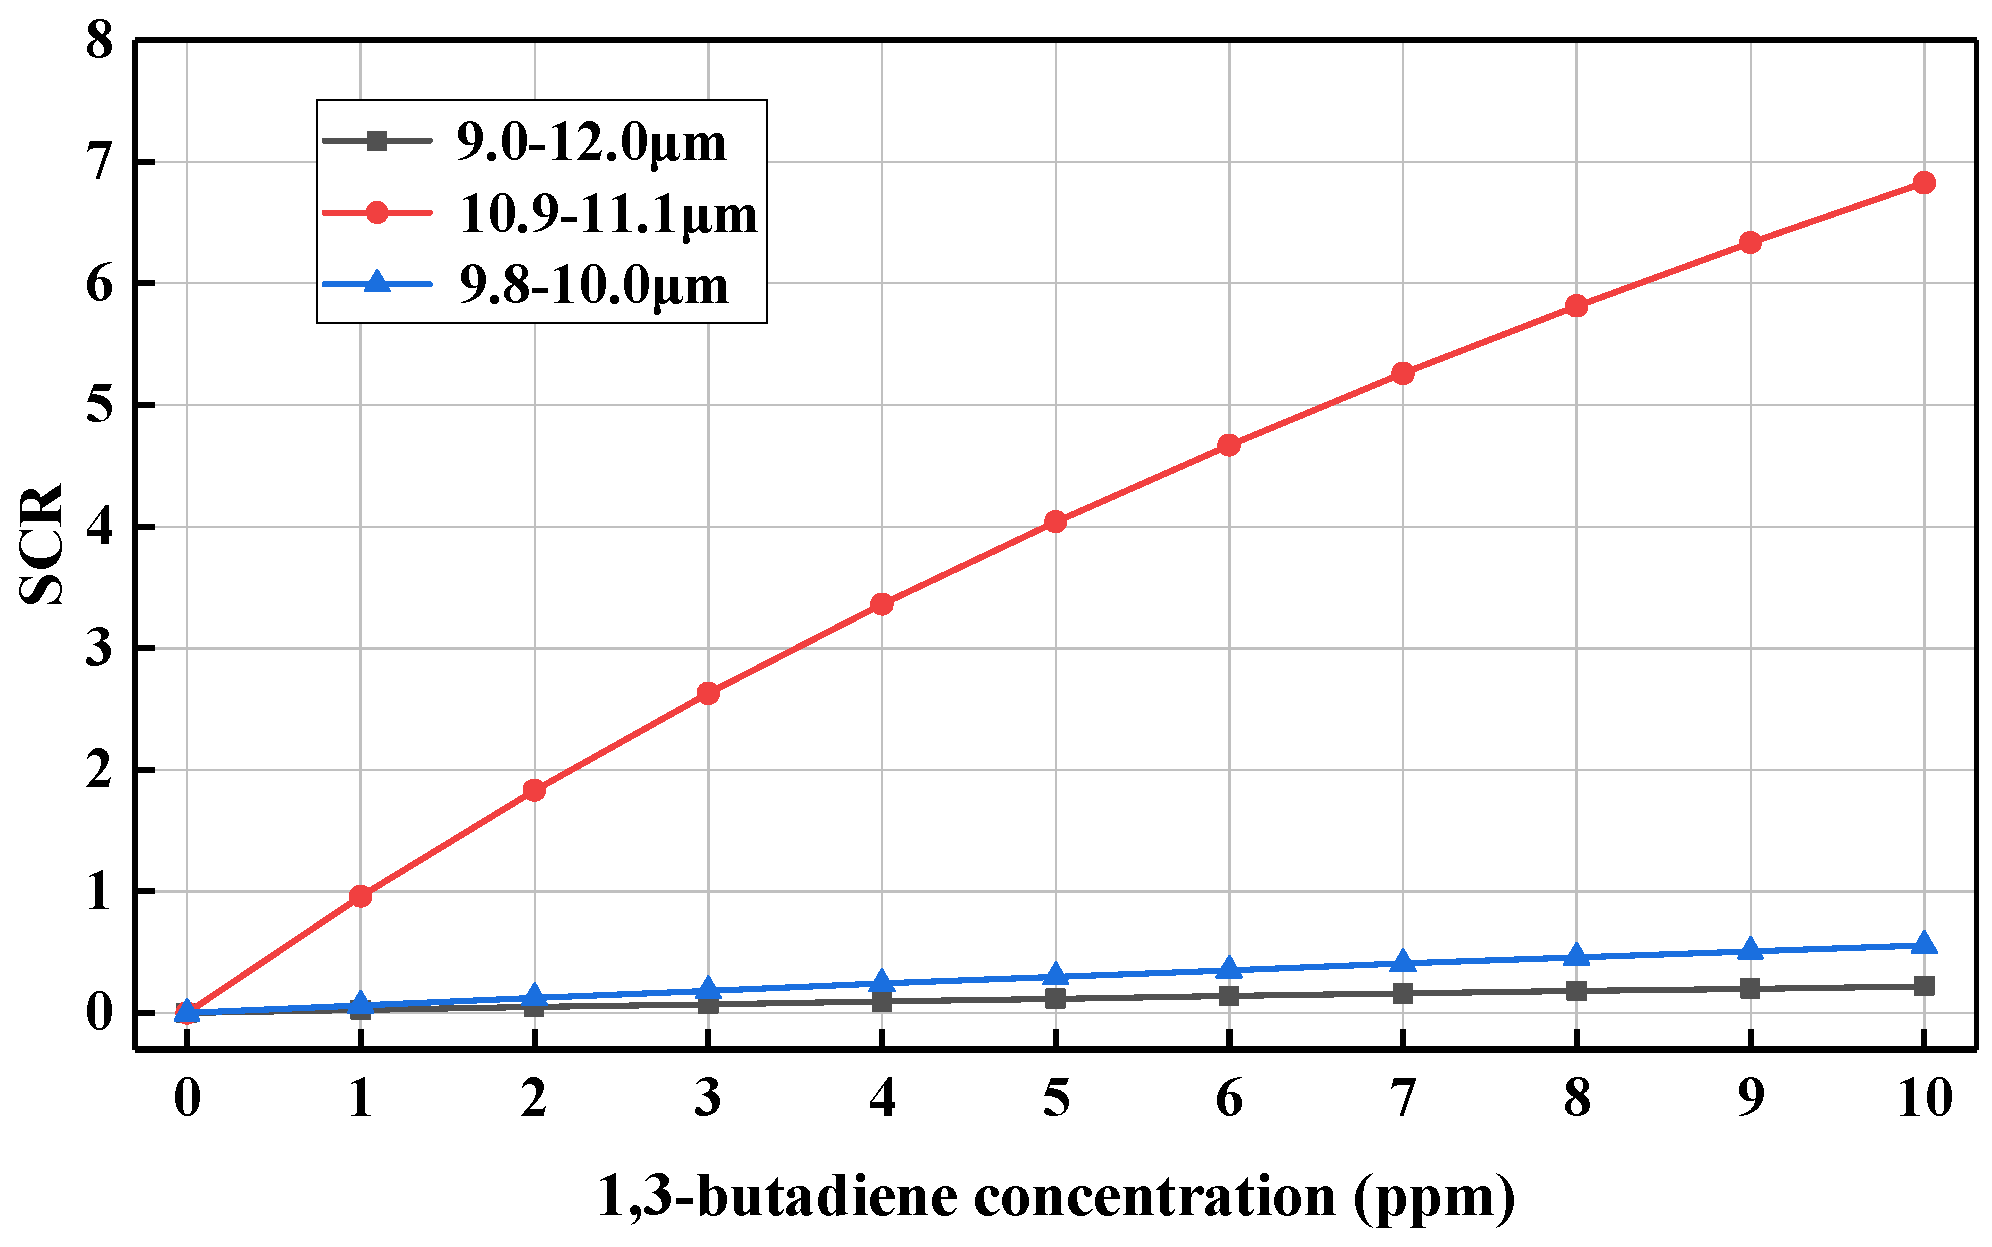
3. Results and Discussion

As shown in Figure 4, the infrared spectral radiance of 1,3-butadiene at 1–10 ppm concentrations were simulated, and the path length of 1,3-butadiene is 100 m. The parameters are set with reference to the smoke from a domestic fire [3]. Figure 4 shows the infrared spectral radiance of 1,3-butadiene increases with increasing concentration, and the peak radiance exceeds 6.0 × 10⁻⁴ W/(cm2·sr·μm) at 10 ppm. The infrared radiance of 1,3-butadiene is mainly concentrated within 9.0–12.0 μm, which has two distinct radiance peaks in it. Among them, the infrared spectral radiance characteristics of 1,3-butadiene in the 9.0–12.0 μm band are more distinct.
Figure 5 shows the TOA radiance for 1,3-butadiene in the infrared spectral bands. As can be seen from Figure 5, 1,3-butadiene decreases the infrared spectral radiance observed by the detector, which decreases as the concentration of 1,3-butadiene increases. 1,3 Butadiene has an absorption effect on atmospheric background radiance. In the 9–12 μm band, 1–10 ppm of 1,3-butadiene causes the detector to detect spectral radiance significantly below 0 ppm, while in the other bands, this difference is not significant, suggesting that 1,3-butadiene absorbs more atmospheric background radiance in the 9.0–12.0 μm band than in other bands. In the following discussion, the best infrared band of space-based infrared detection for 1,3-butadiene focuses on the 9.0–12.0 μm band.
Figure 6a shows the observed radiance of 1,3-butadiene within 9.0–12.0 μm. Figure 6b shows the difference between the observed radiance of 0 ppm 1,3-butadiene with the other 1,3-butadiene concentrations. In the 9.0–12.0 μm band, as the concentration of 1,3-butadiene increases, the spectral radiance observed by the detector decreases. In the narrow bands of 9.8–10 μm and 10.9–11.1 μm, 1,3-butadiene has two absorption peaks. Therefore, in this work, three detection bands of the narrow band 9.8–10.0 µm, 10.9–11.1 µm, and the wide band 9.0–12.0 µm were used to analyze the best detection bands.
Figure 7 shows that, as the concentration of 1,3-butadiene increases, the SCR increases, and the infrared spectral detectability of 1,3-butadiene increases. In the 10.9–11.1 μm band, the SCR increases faster than the other two bands; the 9.8–10.0 μm band is the second, and the 9.0–12.0 μm band is the slowest. In the 9.0–12.0 μm, the radiance energy of 1,3-butadiene is much larger than in the other two bands. However, the background radiance through the atmosphere to the sensor is also large, and the 1,3-butadiene cannot be detected. In the wide spectral band, the spectral radiance of 1,3-butadiene is drowned out by the atmospheric background, and the detectability is low in wide bands. It is more reliable to detect 1,3-butadiene at the narrow band, such as 9.8–10.0 μm and 10.9–11.1 μm, and the detectability of 10.9–11.1 μm is the best.

4. Conclusions

Based on the demand of the space-based infrared detection of 1,3-butadiene, a modeling method of the Earth’s background radiance characteristics coupled with remote sensing data and a physical model is proposed, which can effectively simulate the Earth’s background radiance field distribution under a global space–time condition. In this work, the HITRAN database was used to obtain absorption cross sections to simulate infrared spectral absorption coefficient of 1,3-butadiene. The infrared spectral radiance of 1,3-butadiene was calculated by combining with the LOS method. The TIMED/SABER satellite measured data were used to obtain atmospheric profiles, and the Earth’s background radiance was simulated by DISORT. Combined with infrared radiance characteristics of different 1,3-butadiene concentrations, the space-based infrared radiance of 1,3-butadiene at a 1ppm concentration gradient was calculated, and the detectability of 1,3-butadiene at different wave bands is discussed. The TOA radiance of earth background with increasing concentration of 1,3-butadiene. The absorption effect of 1,3-butadiene on Earth background radiance ranges from 1.0 × 10⁻⁴ W/(cm2·sr·μm) to 3.0 × 10⁻⁴ W/(cm2·sr·μm). The results show that it is feasible to monitor 1,3-butadiene by space-based infrared detection, the sensibility of the narrow band (9.8–10.0 μm and 10.9–11.1 μm) is better than that of broadband (9.0–12.0 μm), and 10.9–11.1 μm is the best detection band for 1,3 butadiene. At present, sensors with 1,3-butadiene characteristic infrared channels can be used for space-based detection of 1,3-butadiene. This article provides a method for modeling the atmospheric background radiance under satellite measurement and 1,3-butadiene infrared spectral radiance with this database and provides support for space-based infrared VOCs detection.

Author Contributions

Methodology, J.B.; Software, J.L.; Validation, Y.W.; Formal analysis, J.X.; Investigation, D.Z.; Writing—original draft preparation, L.B.; Writing—review and editing, J.B.; Project administration, L.B.; Funding acquisition, L.G. All authors have read and agreed to the published version of the manuscript.

Funding

This study was supported by the National Natural Science Foundation of China (No. U20B2059, 61875156).

Data Availability Statement

The data presented in this study are available upon request.

Acknowledgments

The authors would thank the National Natural Science Foundation of China (No. U20B2059, 61875156).

Conflicts of Interest

The authors declare that they have no known competing financial interests or personal relationships that could have appeared to influence the work reported in this paper.

References

  1. Beauregard, M.D. Locating and Estimating Air Emissions from Sources Of 1,3-Butadiene; United States Environmental Protection Agency: Washington, DC, USA, 1996.
  2. Gustafson, P.; Barregard, L.; Strandberg, B.; Sallsten, G. The impact of domestic wood burning on personal, indoor and outdoor levels of 1,3-butadiene, benzene, formaldehyde and acetaldehyde. J. Environ. Monit. 2007, 9, 23–32. [Google Scholar] [CrossRef] [PubMed]
  3. Perbellini, L.; Princivalle, A.; Cerpelloni, M.; Pasini, F.; Brugnone, F. Comparison of breath, blood and urine concentrations in the biomonitoring of environmental exposure to 1,3-butadiene, 2,5-dimethylfuran, and benzene. Int. Arch. Occup. Environ. Health 2003, 76, 461–466. [Google Scholar] [CrossRef] [PubMed]
  4. Sathiakumar, N.; Brill, I.; Leader, M.; Delzell, E. 1, 3-butadiene, styrene and lymphohematopoietic cancer among male synthetic rubber industry workers–preliminary exposure-response analyses. Chem.-Biol. Interact. 2015, 241, 40–49. [Google Scholar] [CrossRef] [PubMed]
  5. Thepanondh, S.; Varoonphan, J.; Sarutichart, P.; Makkasap, T. Airborne Volatile Organic Compounds and Their Potential Health Impact on the Vicinity of Petrochemical Industrial Complex. Water Air Soil Pollut. 2010, 214, 83–92. [Google Scholar] [CrossRef]
  6. van Sittert, N.J.; Megens, H.J.; Watson, W.P.; Boogaard, P.J. Biomarkers of exposure to 1, 3-butadiene as a basis for cancer risk assessment. Toxicol. Sci. 2000, 56, 189–202. [Google Scholar] [CrossRef]
  7. Kramp, F.; Paulson, S.E. The gas phase reaction of ozone with 1, 3-butadiene: Formation yields of some toxic products. Atmos. Environ. 2000, 34, 35–43. [Google Scholar] [CrossRef]
  8. Wu, R.; Xie, S. Spatial Distribution of Ozone Formation in China Derived from Emissions of Speciated Volatile Organic Compounds. Environ. Sci. Technol. 2017, 51, 2574–2583. [Google Scholar] [CrossRef]
  9. Liao, J.; Wolfe, G.M.; Hannun, R.A.; St. Clair, J.M.; Hanisco, T.F.; Gilman, J.B.; Lamplugh, A.; Selimovic, V.; Diskin, G.S.; Nowak, J.B.; et al. Formaldehyde evolution in US wildfire plumes during the Fire Influence on Regional to Global Environments and Air Quality experiment (FIREX-AQ). Atmos. Chem. Phys. 2021, 21, 18319–18331. [Google Scholar] [CrossRef]
  10. Amini, H.; Yunesian, M.; Hosseini, V.; Schindler, C.; Henderson, S.B.; Künzli, N. A systematic review of land use regression models for volatile organic compounds. Atmos. Environ. 2017, 171, 1–16. [Google Scholar] [CrossRef]
  11. Smith, L.A.; Mukerjee, S.; Chung, K.C.; Afghani, J. Spatial analysis and land use regression of VOCs and NO2 in Dallas, Texas during two seasons. J. Environ. Monit. 2011, 13, 999–1007. [Google Scholar] [CrossRef]
  12. Dollard, G.; Dore, C.; Jenkin, M. Ambient concentrations of 1, 3-butadiene in the UK. Chem.-Biol. Interact. 2001, 135, 177–206. [Google Scholar] [CrossRef]
  13. Hystad, P.; Setton, E.; Cervantes, A.; Poplawski, K.; Deschenes, S.; Brauer, M.; van Donkelaar, A.; Lamsal, L.; Martin, R.; Jerrett, M.; et al. Creating national air pollution models for population exposure assessment in Canada. Environ. Health Perspect. 2011, 119, 1123–1129. [Google Scholar] [CrossRef] [PubMed]
  14. Martin, R.V.; Fiore, A.M.; Van Donkelaar, A. Space-based diagnosis of surface ozone sensitivity to anthropogenic emissions. Geophys. Res. Lett. 2004, 31, 19416–19420. [Google Scholar] [CrossRef]
  15. Zhao, L.; Liu, J.; Peters, S.; Li, J.; Oliver, S.; Mueller, N. Investigating the Impact of Using IR Bands on Early Fire Smoke Detection from Landsat Imagery with a Lightweight CNN Model. Remote Sens. 2022, 14, 3047. [Google Scholar] [CrossRef]
  16. Venter, Z.S.; Barton, D.N.; Chakraborty, T.; Simensen, T.; Singh, G. Global 10m Land Use Land Cover Datasets: A Comparison of Dynamic World, World Cover and Esri Land Cover. Remote Sens. 2022, 14, 4101. [Google Scholar] [CrossRef]
  17. Wang, P.; Holloway, T.; Bindl, M.; Harkey, M.; De Smedt, I. Ambient Formaldehyde over the United States from Ground-Based (AQS) and Satellite (OMI) Observations. Remote Sens. 2022, 14, 2191. [Google Scholar] [CrossRef]
  18. Yu, J.; Meng, L.; Chen, Y.; Zhang, H.; Liu, J. Ozone Profiles, Precursors, and Vertical Distribution in Urban Lhasa, Tibetan Plateau. Remote Sens. 2022, 14, 2533. [Google Scholar] [CrossRef]
  19. Yang, Y.; Li, Q.; Wang, H.; Bai, Z.; Li, D.; Wang, W.; Bian, J. Contributions of Various Sources to the Higher-Concentration Center of CO within the ASM Anticyclone Based on GEOS-Chem Simulations. Remote Sens. 2022, 14, 3322. [Google Scholar] [CrossRef]
  20. Craig, N.C.; Moore, M.C.; Patchen, A.K.; Sams, R.L. Analysis of rotational structure in the high-resolution infrared spectrum and assignment of vibrational fundamentals of butadiene-2,3-13C2. J. Mol. Spectrosc. 2006, 235, 181–189. [Google Scholar] [CrossRef]
  21. D’Arco, A.; Mancini, T.; Paolozzi, M.C.; Macis, S.; Mosesso, L.; Marcelli, A.; Petrarca, M.; Radica, F.; Tranfo, G.; Lupi, S.; et al. High Sensitivity Monitoring of VOCs in Air through FTIR Spectroscopy Using a Multipass Gas Cell Setup. Sensors 2022, 22, 5624. [Google Scholar] [CrossRef]
  22. Craig, N.C.; Hanson, K.A.; Moore, M.C.; Sams, R.L. Rotational analysis of several bands in the high-resolution infrared spectrum of butadiene-1-13C1: Assignment of vibrational fundamentals. J. Mol. Struct. 2005, 742, 21–29. [Google Scholar] [CrossRef]
  23. Craig, N.C.; Hanson, K.A.; Pierce, R.W.; Saylor, S.D.; Sams, R.L. Rotational analysis of bands in the high-resolution infrared spectra of the three species of butadiene-1,4-d2; refinement of the assignments of the vibrational fundamentals. J. Mol. Spectrosc. 2004, 228, 401–413. [Google Scholar] [CrossRef]
  24. Jin, T.; Zhou, J.; Lin, H.G.; Lin, P.T. Mid-Infrared Chalcogenide Waveguides for Real-Time and Nondestructive Volatile Organic Compound Detection. Anal. Chem. 2019, 91, 817–822. [Google Scholar] [CrossRef] [PubMed]
  25. Siozos, P.; Psyllakis, G.; Samartzis, P.C.; Velegrakis, M. Autonomous Differential Absorption Laser Device for Remote Sensing of Atmospheric Greenhouse Gases. Remote Sens. 2022, 14, 460. [Google Scholar] [CrossRef]
  26. Prata, F. Detection and Avoidance of Atmospheric Aviation Hazards Using Infrared Spectroscopic Imaging. Remote Sens. 2020, 12, 2309. [Google Scholar] [CrossRef]
  27. Lu, X.; Huang, Y.; Wu, P.; Liu, D.; Ma, H.; Wang, G.; Cao, Z. Distributed Feedback Interband Cascade Laser Based Laser Heterodyne Radiometer for Column Density of HDO and CH4 Measurements at Dunhuang, Northwest of China. Remote Sens. 2022, 14, 1489. [Google Scholar] [CrossRef]
  28. Zhang, F.; Zhu, M.; Li, J.; Li, W.; Di, D.; Shi, Y.-N.; Wu, K. Alternate Mapping Correlated k-Distribution Method for Infrared Radiative Transfer Forward Simulation. Remote Sens. 2019, 11, 994. [Google Scholar] [CrossRef]
  29. Gordon, I.E.; Rothman, L.S.; Hargreaves, R.J.; Hashemi, R.; Karlovets, E.V.; Skinner, F.M.; Conway, E.K.; Hill, C.; Kochanov, R.V.; Tan, Y.; et al. The HITRAN2020 molecular spectroscopic database. J. Quant. Spectrosc. Radiat. Transf. 2022, 277, 107949–108030. [Google Scholar] [CrossRef]
  30. Kochanov, R.V.; Gordon, I.E.; Rothman, L.S.; Shine, K.P.; Sharpe, S.W.; Johnson, T.J.; Wallington, T.J.; Harrison, J.J.; Bernath, P.F.; Birk, M.; et al. Infrared absorption cross-sections in HITRAN2016 and beyond: Expansion for climate, environment, and atmospheric applications. J. Quant. Spectrosc. Radiat. Transf. 2019, 230, 172–221. [Google Scholar] [CrossRef]
  31. Berk, A. Algorithm Theoretic Basis Document (ATBD) for Next Generation MODTRAN; Air Force Research Laboratory: Wright-Patterson Air Force Base, OH, USA, 2016. [Google Scholar]
  32. Mlynczak, M.G. Energetics of the mesosphere and lower thermosphere and the SABER experiment. Adv. Space Res. 1997, 20, 1177–1183. [Google Scholar] [CrossRef]
  33. Zhao, X.; Sheng, Z.; Shi, H.; Weng, L.; Liao, Q. Long-term trends and solar responses of the mesopause temperatures observed by SABER during the 2002–2019 period. J. Geophys. Res. Atmos. 2020, 125, 125–141. [Google Scholar] [CrossRef]
  34. Li, X.; Wang, J.; Li, M.; Peng, Z.; Liu, X. Investigating Detectability of Infrared Radiation Based on Image Evaluation for Engine Flame. Entropy 2019, 21, 946. [Google Scholar] [CrossRef] [Green Version]
Figure 1. Schematic diagram of 1,3-butadiene space-based detection.
Remotesensing 14 04788 g001
Figure 2. 1,3-butadiene absorption cross sections from the HITRAN database 2020.
Remotesensing 14 04788 g002
Figure 3. Atmospheric profiles of (a) temperature, (b) pressure, (c) H2O mixing ratio, and (d) O3 mixing ratio from TIMED/SABER on Xi’an (Shaanxi, China, 20 March 2022).
Remotesensing 14 04788 g003
Figure 4. 1,3-butadiene infrared spectral radiance at 1–10 ppm.
Remotesensing 14 04788 g004
Figure 5. Simulated TOA radiance observed by detector for 1,3-butadiene.
Remotesensing 14 04788 g005
Figure 6. (a) The at-detector radiance of 9.0–12.0 μm for 1,3-butadiene concentrations (0–10 ppm), (b) the difference between the radiance of 0 ppm 1,3-butadiene, and the other 1,3-butadiene concentrations (1–10 ppm).
Remotesensing 14 04788 g006
Figure 7. The relationship between the SCR and concentration.
Remotesensing 14 04788 g007
Publisher’s Note: MDPI stays neutral with regard to jurisdictional claims in published maps and institutional affiliations.

