Abstract
Efficient and accurate identification of canopy gaps is the basis of forest ecosystem research, which is of great significance to further forest monitoring and management. Among the existing studies that incorporate remote sensing to map canopy gaps, the object-oriented classification has proved successful due to its merits in overcoming the problem that the same object may have different spectra while different objects may have the same spectra. However, mountainous land cover is unusually fragmented, and the terrain is undulating. One major limitation of the traditional methods is that they cannot finely extract the complex edges of canopy gaps in mountainous areas. To address this problem, we proposed an object-oriented classification method that integrates multi-source information. Firstly, we used the Roberts operator to obtain image edge information for segmentation. Secondly, a variety of features extracted from the image objects, including spectral information, texture, and the vegetation index, were used as input for three classifiers, namely, random forest (RF), support vector machine (SVM), and k-nearest neighbor (KNN). To evaluate the performance of this method, we used confusion matrices to assess the classification accuracy of different geo-objects. Then, the classification results were screened and verified according to the area and height information. Finally, canopy gap maps of two mountainous forest areas in Yunnan Province, China, were generated. The results show that the proposed method can effectively improve the segmentation quality and classification accuracy. After adding edge information, the overall accuracy (OA) of the three classifiers in the two study areas improved to more than 90%, and the classification accuracy of canopy gaps reached a high level. The random forest classifier obtained the highest OA and Kappa coefficient, which could be used for extracting canopy gap information effectively. The research shows that the combination of the object-oriented method integrating multi-source information and the RF classifier provides an efficient and powerful method for extracting forest gaps from UAV images in mountainous areas.
1. Introduction
Watt [1] defined the canopy gaps as the discontinuous openings of the canopy, which are medium- and small-scale disturbances with high frequency in the forest ecosystem. They are usually formed from human activities such as deforestation or natural factors such as the natural aging of trees, typhoons, and rainstorms [2,3]. In practical research, people generally accept the two concepts of the “canopy gap” and the “extended gap” proposed by American ecologist Runkle. The former is the space under the vertical projection of the canopy opening, while the latter refers to the area surrounded by the edge trees of the canopy opening [4,5]. This study focuses on the canopy gap. The canopy gap is an index to reflect the dynamic change in the forest canopy, an essential factor in promoting the cyclic succession of the forest ecosystem and maintaining forest structure and function. In addition, the canopy gap can improve the light conditions, accelerate the circulation of nutrients among forests and promote the continuous regeneration of the forest [6,7]. The spatiotemporal heterogeneity due to different disturbance patterns, scales, frequencies, and other aspects provides rich habitat conditions for organisms, thus affecting the species composition and community structure of forests, which is conducive to the conservation and maintenance of biodiversity [8,9]. In summary, it is of great significance to investigate the number, size, and change in canopy gaps to study forest ecosystems.
The early monitoring of canopy gaps was based on ground surveys and needed to be observed from the bottom up. In the 1970s, Perry proposed the single-rope climbing method. Later, the advent of hot air balloons, air corridors, tower cranes, and other equipment also promoted the development of forest canopy research to a certain extent [10]. However, these observation methods are not only time-consuming and labor-intensive but also affected by many factors such as the forest area and traffic accessibility. Moreover, the observation results rely on subjective judgment and a lack of objectivity. The birth and rapid development of remote sensing has broken through the limitations of traditional methods. However, many satellite images cannot meet the requirements of high-resolution forest gap extraction due to limitations such as the severe influence of weather, a low resolution, and fixed orbits. Light detection and ranging (LiDAR) can obtain complex three-dimensional structure information of forests and effectively improve the mapping accuracy, but LiDAR data acquisition is relatively expensive [11,12]. Unmanned aerial vehicles (UAVs), by contrast, are more flexible, easy to operate, less expensive, and can acquire images with higher resolution than many other remotely sensed images. In the past few years, UAVs have been extensively used to monitor and study small forest ecosystems, such as canopy species identification [13], canopy height estimation [14], forest gap extraction [15,16], tree classification [17,18], exploring the relationship between gap change and terrain [19], and the identification of canopy opening in a beech mixed forest [20]. The maturity of UAV remote sensing technology provides a new opportunity for the extraction of mountain land cover information, and it is possible to carry out three-dimensional and continuous observation in mountainous areas with difficult accessibility.
The traditional per-pixel classification method only uses the spectral features of pixels, which are prone to the phenomenon of “salt and pepper”. In contrast, the processing units of object-oriented classification are image objects composed of multiple pixels. The differences within image objects are small, while the differences between image objects are large, and the signal-to-noise ratio of extraction can be significantly increased with object-oriented classification [21]. At the same time, object-based classification not only makes full use of the spectral information of geo-objects but also integrates the geometric, textural, and topological relations among objects, which can identify geo-objects more accurately [22,23]. Although some achievements have been made based on object-oriented methods, due to the complexity of the mountain environment, the general methods have difficulty accurately extracting the canopy gaps in mountainous areas.
At present, studies on canopy gaps are more inclined to the pattern and characteristics of the gaps [24,25,26] and ecological restoration [27]. Specific methods of canopy gap extraction from remotely sensed images, especially UAV images, are less documented. Manual vectorization is often used for the extraction of canopy gaps, but it is time-consuming and not suitable for a large range of forest areas.
In this study, we took two mountainous forest areas in Yunnan Province as the study area, and used UAV images to extract canopy gaps by object-oriented classification based on multi-source information fusion. The main objectives of this study are as follows: (1) to explore the contribution of multi-source information, especially the edge information, to the extraction of canopy gaps in mountainous areas; (2) to compare the performance of the random forest (RF), support vector machine (SVM), and K-nearest neighbor (KNN) algorithms in extracting forest gaps; (3) to obtain the canopy gap distribution maps of the study area to support forest ecosystem studies. It is hoped that through the analysis and verification of the classification methods, a practical and efficient method for canopy gap extraction can be obtained so as to provide reference and ideas for the extraction of forest information in mountainous areas.
2. Materials and Methods
2.1. Study Areas
Songmao reservoir is located upstream of Laoyu River in Chenggong District, Kunming City, Yunnan Province, 10 km away from the east of Dianchi Lake, with an elevation of 2016.75 m. This area is a low mountain and hilly area around Kunming Basin, a flat dam area of low latitude plateau with typical red soils. The climate here belongs to the subtropical plateau monsoon climate. Its annual average temperature is around 14 °C, and the annual average precipitation is over 1000 mm. Songmao Reservoir is surrounded by mountains with dense forests, and the dominant tree species are Pinus yunnanensis and Podocarpus macrophyllus. Longtan Town is under the jurisdiction of Xuanwei City, Qujing City, Yunnan Province, located in the middle mountain range of Wumeng Mountain in the northwest of Xuanwei City. The terrain is mainly plateau mountains. Due to the influence of ocean air mass in summer and autumn and continental air mass in winter and spring, the area has a low latitude plateau monsoon climate with a variety of climatic zones. The average annual temperature is 13.8 °C, the average annual precipitation is 973.9 mm, and the dominant tree species is Pinus yunnanensis. The location of the two study areas is shown in Figure 1a.
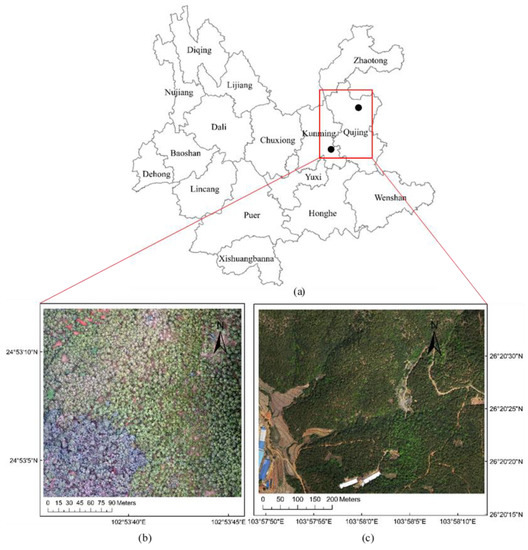
Figure 1.
Location (a) and orthophotos of study area I: Songmao Reservoir (b) and study area II: Longtan town (c).
2.2. Data Source
The image data of Songmao Reservoir (Figure 1b) was captured by a Phantom 4 RTK-DJI on 13 July 2020, with a flying height of 180 m and a resolution of 0.039 m. The image data of Longtan town (Figure 1c) was captured by a Phantom 4 Pro-DJI on 16 April 2021, with a flying height of 160 m and a resolution of 0.064 m. The course overlap degree and side overlap degree of the two shots were 80%. Both were low-altitude shots, which effectively reduced or even avoided the interference caused by atmospheric factors on the image. The software ContextCapture (Bentley Systems, Exton, PA, USA) was used to process aerial photographs and generate the orthophoto and digital surface model (DSM). The images include three bands of red, green, and blue (RGB), and the coordinate system and projection are the WGS84 coordinate system and UTM projection, respectively.
2.3. Method
We adopted an object-oriented classification method based on image enhancement to extract canopy gaps in the two study areas, as shown in the flowchart in Figure 2. Firstly, the Estimation of Scale Parameter (ESP) tool and the Ratio of Mean Difference to Neighbors to Standard Deviation (RMAS) index were employed to obtain the global optimal segmentation scale. The optimal shape parameters and compactness parameters were determined by trial and error method. Meanwhile, the Roberts operator was used to detect the edge information of different geo-objects in remote sensing images, and the detection results were used as an auxiliary layer to participate in image segmentation. Secondly, based on Multi-resolution Segmentation (MRS) and Spectral Difference Segmentation (SDS), the random forest (RF) classifier, support vector machine (SVM) classifier, and k-nearest neighbor (KNN) classifier were used for image classification with spectral features, texture features, and visible band difference vegetation index (VDVI). Then, the classification accuracy was evaluated by confusion matrices. In the end, according to the gap area and the height of boundary trees, the polygons were screened, and all the canopy gaps in the study areas were extracted.
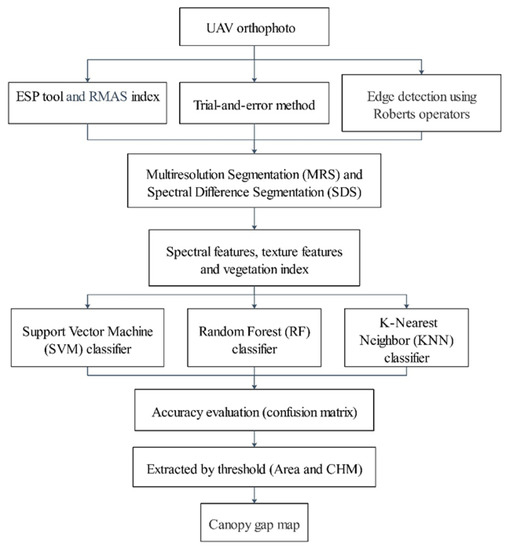
Figure 2.
Technical flowchart.
2.3.1. Image Edge Detection
Edge detection is an essential link between image analysis and recognition, and it is of great significance for the extraction of geo-objects [28,29,30,31]. There are many edge detection methods, such as differential operator, neural network, and wavelet detection. At present, edge detection based on differential operators is commonly used, mainly including Roberts, Sobel, Canny, Prewitt, and other detection operators [32,33,34]. Among them, the Prewitt operator and Sobel operator have a smoothing effect on noise. Although some false edges can be removed, the real edges will be smoothed, so the edge positioning is not as good as the Robert operator [35,36]. The Canny operator is an edge detection operator based on the idea of optimization. It uses large-scale filtering, which may lead to the smoothing of some high-frequency edges, and the detection results lose some edges [37]. The Roberts operator [38,39] is also known as the cross-differential algorithm. Its basic principle is to find the edge of an image using the local difference method, which is simple, intuitive, and computationally less extensive, and often used to detect low-noise images with obvious edges and large brightness differences [35]. In this paper, the edge information enhancement method based on the Roberts operator was used to detect edges in the images.
The Roberts edge operator is a 2 × 2 template, which adopts the difference between two diagonally adjacent pixels. Assuming that the input image g (x, y), the target image output after Roberts operator is h (x, y), then
The IDL language was used on the ENVI (Exelis Visual Information Solutions, Boulder, CO, USA) development platform in combination with Roberts’ basic algorithm to implement image edge detection. The global and local edge information of study area I is shown in Figure 3.
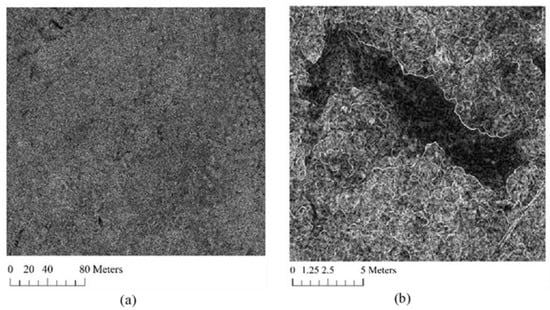
Figure 3.
The edge information detected by the Roberts operator of study area I: (a) global and (b) local.
2.3.2. Object-Oriented Classification
Based on the high-resolution aerial orthophoto and edge information, this study used Multi-resolution Segmentation (MRS) and Spectral Difference Segmentation (SDS) in eCognition Developer9.0 (Trimble, Sunnyvale, CA, USA) software for segmentation. The parameters involved in the segmentation process include segmentation scale, input layer weight, and heterogeneity factor.
Firstly, six scales (50–300, step size 50) were used to segment the study areas, while the other parameters were fixed as the default values to determine the initial range [40]. As shown in Figure 4, when the segmentation scale was 50, the segmentation results were more fragmented, and there was a phenomenon that a forest gap was divided into several parts. In contrast, when the scale was larger than 200, the segmentation was incomplete, and most canopy and canopy gaps were combined into one object. Therefore, 100–200 was proposed as a reasonable initial segmentation range, the step size was set to 1, and the ESP tool was applied to select the optimal segmentation scale of geo-objects. To optimize the extraction effect, this paper combined the RMAS index (Equation (3)) to obtain the optimal scale corresponding to the canopy gap and took it as the global optimal segmentation scale. The relevant study has proved that when the area of the segmented object is larger than the actual object, the internal standard deviation of the segmented object increases, but the absolute value of the mean spectral difference of the adjacent object decreases, and the corresponding RMAS index decreases [41]. It can be seen when the RMAS index reaches its peak, the corresponding segmentation scale is optimal.
where AM is the absolute value of the difference between the spectral mean values of adjacent objects; BM is the standard deviation of M-band obtained by N pixels statistics in the object; D is the perimeter of the geo-objects; DSJ is the length of the joint edge with J adjacent geo-objects; AM represents the average value of geo-objects in M-band layer; AMJ is the average of the actual geo-objects and J neighboring objects in the M-band layer; K is the number of adjacent objects around the geo-objects; AMI represents the gray value of the Ith pixel corresponding to the M-band of the actual object; N is the number of pixels inside the real object.
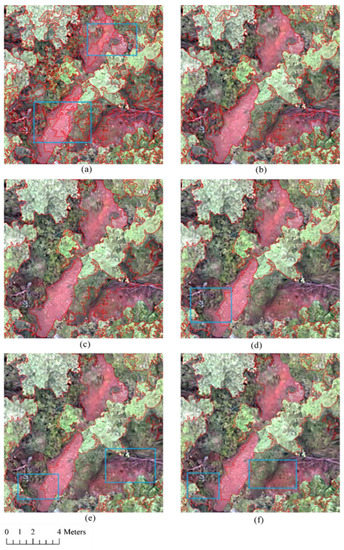
Figure 4.
Local segmentation results of different scales: (a) scale 50, (b) scale 100, (c) scale 150, (d) scale 200, (e) scale 250, (f) scale 300. The blue rectangles are used to highlight obvious “under-segmentation and over-segmentation”.
The weight of the input layer determines how much layer information can be used during segmentation. In this study, the weight of three RGB bands of orthophoto is set as 1, and the weight of the edge information layer is set as 2. Heterogeneity factors include shape factor and compactness. If the shape factor is larger, the segmented object is more regular, while the segmented edge is closer to the actual ground object. The change in compactness has little effect on segmented objects. When determining the heterogeneity factor, the segmentation scale was set at 100. According to the segmentation results, the shape of 0.3 and compactness of 0.5 were selected as the best combination through the trial and error method (Table 1).

Table 1.
All combinations of heterogeneous factors tested by trial and error method. Visual interpretation showed that the segmentation quality of the second group was the best.
A total of 19 initial feature indexes were selected, including the mean and standard deviation of the three bands of orthophoto, the mean, entropy, homogeneity, and contrast of the gray-level co-occurrence matrix (GLCM) in the three bands, and VDVI. Among them, the calculation method of VDVI is shown in Equation (5). The lowest separation degree of them was 2.84.
where G, R, and B represent the green, red, and blue bands, respectively.
Generally, the more features selected, the richer the information contained, but there may be information redundancy, which reduces the computing speed and affects the classifier’s prediction accuracy. Using the chosen samples to calculate the contribution of each feature in the feature optimization tool, it was found that the lowest separation degree was 3.59 and the best dimension was 8, the specific optimal features used in the classification process are shown in Table 2.

Table 2.
The specific and optimal object features used in the classification.
The object-oriented classification includes rule-based classification and sample-based classification. The latter was adopted in this study, and the three algorithms of KNN, RF, and SVM were used to complete the recognition of all geo-objects types in the same object layer. The accuracies of three classifiers were assessed using the same random sample points, and a confusion matrix was used to obtain five precision indexes: overall accuracy (OA), user’s accuracy (UA), producer’s accuracy (PA), F1-Score, and Kappa coefficient.
2.3.3. Canopy Gap Screening
According to the definition, canopy gaps are small openings within a continuous canopy, where no trees are present or much lower than their immediate neighbors, and the area and height are important indicators to define them [42,43]. Among them, the height was obtained from the canopy height model (CHM) [44], which is created by subtracting the digital elevation model (DEM) from the digital surface model (DSM). CHM is used to determine the ratio between the height of the wood at the gap boundary and the height of the adjacent canopy to ensure that the polygon is a canopy gap rather than a shadow. At present, there is no standard definition for canopy gaps. The threshold values differ in different studies due to different research goals. Usually, a discontinuous gap with an area of more than 5 m2 and a height of boundary trees lower than two-thirds of the height of the canopy is defined as a canopy gap [43,45].
3. Results
By calculating the RMAS values of canopy gaps at different scales, it was determined that the corresponding optimal segmentation scales of the two study areas were 119 and 107, respectively. Using the optimal scale to segment the image, it was found that the combination of MRS and SDS can reduce the effect of over-segmentation and under-segmentation, and produce better results than that of a single segmentation method. However, under-segmentation and over-segmentation still existed in the local area. The segmentation results were optimized in terms of the object information entropy and image edge [46], and some typical polygons are shown in Figure 5. The refinement of the under-segmented regions was to further segment different objects, which could avoid a polygon containing multiple categories and thus affecting classification. The refinement of the over-segmented regions can help merge the small objects, thereby reducing the number of objects used in the classifier.
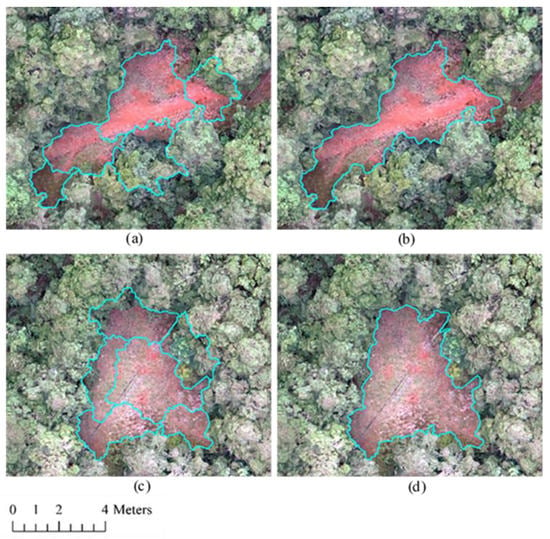
Figure 5.
Segmentation subset before (a,c) and after (b,d) refinement of ill-segmented objects.
More than 300 uniformly distributed sample points, including 167 canopy gaps, were randomly selected from the high-resolution map to evaluate the accuracy of different classifiers. As shown in Figure 6, there is little difference in the classification accuracy of each category. It can be seen that the accuracy of RF and SVM remains stable, above 95%, while the accuracy of KNN is slightly lower. It is worth noting that the accuracy of the canopy gaps of the three classifiers is more than 95%, which indicates that the three classifiers are suitable for canopy gap extraction in study area I. As shown in Table 3, the three classifiers produced satisfactory classification results with the overall accuracy (OA) above 90% in study area I. Among them, the RF achieved the highest OA and Kappa coefficient of 99.50% and 0.9872, respectively, which were both greater than the other two classifiers. As far as the canopy gap is concerned, the producer’s accuracy (PA) and user’s accuracy (UA) of the three classifiers were all above 95%, indicating that there were almost no pixel omission and commission errors.
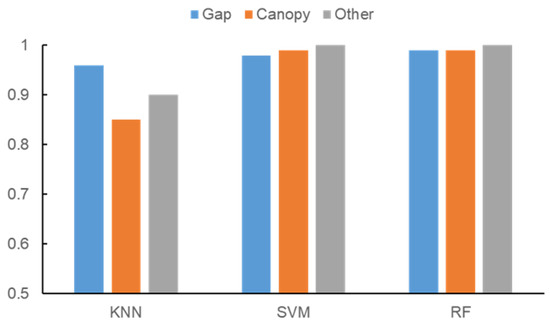
Figure 6.
F1-Score of different categories under different classifiers in study area I.

Table 3.
The classification accuracies using edge information of study area I. Including the producer’s accuracy (PA), user’s accuracy (UA), and overall accuracy (OA) as well as the Kappa coefficient.
In order to intuitively evaluate the recognition results of various geo-objects, the normalized confusion matrices of study area II are listed in Figure 7. As shown in the figure, using different classifiers, the change in forest recognition accuracy was the smallest, and the recognition accuracy of buildings reached 100%. Additionally, due to the complexity of geo-objects, the extraction accuracy of canopy gaps was lower than that of study area I, and the main error came from the farmlands. However, the RF classifier still achieved the highest classification accuracy. Compared with the traditional object-oriented classification method, the final accuracies were improved by adding edge information. In the RF classification, the accuracy of the canopy gap increased by 7.55%, which indicates that the proposed method can improve the segmentation quality and classification accuracy.
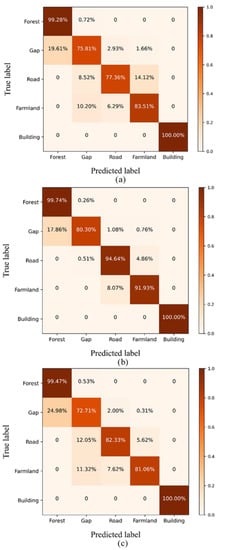
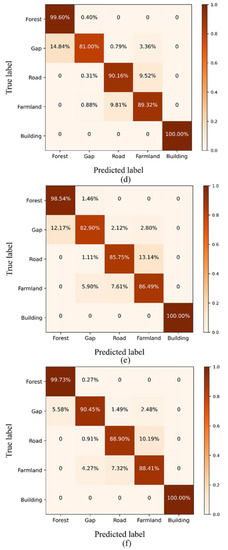
Figure 7.
Normalized confusion matrices of geo-object classification in study area II using KNN (a,b), SVM (c,d), and RF (e,f), in which (a,c,e) used edge information. In contrast, (b,d,f) did not use edge information.
The polygons with an area of less than 5 m2 were removed by attribute screening. Then CHM was used to determine the height of the boundary wood of the gaps to ensure that the polygon was a canopy gap rather than a canopy shadow. Finally, according to the ground truthing, 1 m buffers were generated, and the discontinuity of the canopy gaps were ensured for the crowns outside the polygon and inside the buffer. All the canopy gaps were extracted in the two study areas, as shown in Figure 8.
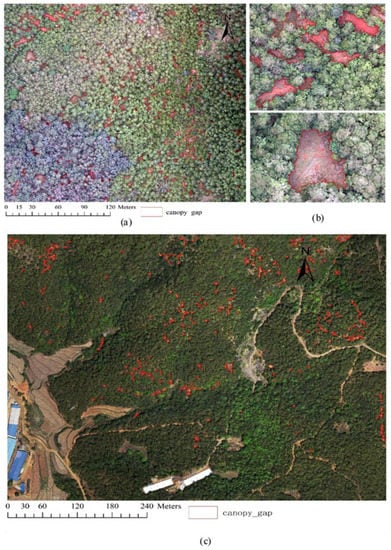
Figure 8.
Distribution of canopy gaps in study area I (a) and study area II (c), and local extraction results (b).
4. Discussion
Image segmentation divides the whole region into many non-overlapping image units [47], which is the crucial step, and the segmentation results directly affect the accuracy of the final canopy gap extraction. Among many factors that affect the quality of image segmentation, the segmentation scale is particularly important. The segmentation scale determines the size of the segmented object, and the ideal scale can make the boundary of the object nearly coincide with the edge of the actual geo-object. The ESP tool evaluates segmentation at different scales by calculating the rate of change of local changes in image object homogeneity (ROC-LV) [48]. Since the main objective of this study is to extract canopy gaps, the optimal segmentation scale was defined as the scale that could obtain the highest classification accuracy of the canopy gaps in our study. In complex multi-category classification problems, multi-level classification systems can be constructed according to the optimal segmentation scales of different ground objects to avoid the influence of a single scale on classification results.
Object features contain the relevant information of geo-objects, which is the main basis for distinguishing different objects. Among them, spectral features are related to the gray values of pixels, which are the basic elements of images [49]. Texture refers to the statistical characteristics of image gray values within a certain window size. One advantage of high-resolution images is that they can better present the texture information of geo-objects [49,50]. The relevant studies proved that the gray-level co-occurrence matrix (GLCM) is of great importance in vegetation classification [51]. Because the research goal of this paper is extracting canopy gaps, and the vegetation coverage of the two study areas is high, using the VDVI index to participate in the classification not only highlights the influence of vegetation information on the classification effect but also avoids the phenomenon of classification fragmentation [52,53,54]. Since the shape and compactness of canopy gaps vary widely in natural forests, geometric features were not selected for object-oriented classification in this study.
Our study shows that the classification results of RF are better than those of SVM and KNN, which is consistent with the results of many existing studies. The RF is a classifier that is trained and predicted on the basis of decision tree theory [55,56]. Many studies show that this classifier has better performance in stability and operation speed when it is used to classify forest types and tree species [57,58]. The SVM is good at solving the problem of small samples and can avoid the Hughes effect in traditional pattern recognition. However, it has some limitations compared with RF when applied to multi-category classification [59]. The KNN algorithm is a relatively mature classification method, but is also a simple, non-parametric, lazy classification algorithm [60].
Due to the shadows generated by sun illumination in the data, vegetation shadows and other geo-objects under shadows were misclassified as canopy gaps in the classification process. Moreover, different observation angles and the change in solar altitude angle led to the change in sunlight radiation and caused the spectral uncertainty of canopy gaps [61]. In addition, the main difference between gaps and canopy lay in height, while object-oriented classification only used spectral features, texture features, and vegetation index. There was obvious regenerated vegetation in some canopy gaps, which resulted in spectral features similar to those of the tree crown, thus causing misclassification. Multi-temporal observation from UAVs might help address these problems.
The confusion matrix, as an important index in machine learning, is often used to evaluate the performance of models. In many studies on land cover, forest classification, and remote sensing information extraction, confusion matrices have proved to be feasible in evaluating model performance [62,63,64]. Of course, in contrast, K-fold cross-validation can reduce the contingency of calculation results. In a follow-up study, we will continuously collect canopy gap samples in different mountain areas, make a canopy gap dataset, and use K-fold cross-validation to evaluate the model performance.
5. Conclusions
Mapping canopy gaps and quantifying their characteristics are fundamental for investigating forest regeneration and the diversity of undergrowth species in the forest ecosystem. In this study, we collected UAV images in two study areas in Yunnan, China, and employed an object-oriented classification approach based on edge enhancement for extracting canopy gaps in the study areas. Spectral information, texture features, and the vegetation index were used as input for three classifiers—random forest (RF), support vector machine (SVM), and k-nearest neighbor (KNN). The results showed that: (1) The RF classifier outperforms the other two machine learning algorithms (SVM and KNN). However, it appears that canopy shadows of taller trees over shorter trees pose a major problem for extracting canopy gaps from UAV images, and such shadows are often misclassified as canopy gaps. Canopy height models can effectively help reduce misclassification. It is also possible to reduce the misclassification of canopy gaps by using multi-temporal UAV images. (2) When edge information is added as input to the classifiers, the accuracy of the three classifiers is significantly improved. The edge of the image is usually the place where the color or gray level change significantly, and these changes are caused by the different reflections of different objects on the light. Therefore, the edge often reflects the outline of the geo-objects and represents their boundary in the image, which is the key to distinguishing the canopy gaps in this study.
This study can provide a reference for future research on large-scale monitoring of forest gaps using UAVs or other remote sensing methods. Of course, there were also limitations in this paper. The scale selected in this study was a single scale suitable for the canopy gaps, which may meet the need to obtain accurate edges of different types of geo-objects through segmentation. To some extent, it led to errors between the segmentation results. To improve the accuracy of canopy gap extraction, different scales need to be used to segment different types of geo-objects more accurately, and the influence of terrain factors on classification results needs to be studied further.
Author Contributions
Conceptualization, J.X. and F.Z.; methodology, J.X., F.Z. and Y.W.; software, G.L.; investigation, J.X., Y.W., S.H. and G.L.; data curation, J.X. and Y.W.; writing—original draft preparation, Y.W.; writing—review and editing, P.D.; visualization, Y.W. and S.H.; supervision, J.X. and F.Z. All authors have read and agreed to the published version of the manuscript.
Funding
This research was funded by the National Natural Science Foundation of China, grant number 42061038.
Conflicts of Interest
The authors declare that they have no known competing financial interests or personal relationships that could have appeared to influence the work reported in this paper.
References
- Watt, A.S. Pattern and process in the plant community. J. Ecol. 1947, 35, 1–22. [Google Scholar] [CrossRef]
- Kupfer, J.A.; Runkle, J.R. Early gap successional pathways in a Fagu“ Acer forest preserve: Pattern and determinants. J. Veg. Sci. 1996, 7, 247–256. [Google Scholar] [CrossRef]
- Suarez, A.V.; Pfennig, K.S.; Robinson, S.K. Nesting Success of a Disturbance Dependent Songbird on Different Kinds of Edges. Conserv. Biol. 1997, 11, 928–935. [Google Scholar] [CrossRef]
- Runkle, J.R. Gap regeneration in some old-growth forests of the Eastern United States. Ecology 1981, 62, 1041–1051. [Google Scholar] [CrossRef]
- Runkle, J.R. Patterns of disturbance in some old-growth mesic forests of Eastern North America. Ecology 1982, 63, 1533–1546. [Google Scholar] [CrossRef]
- Haber, L.T.; Fahey, R.T.; Wales, S.B.; Correa Pascuas, N.; Currie, W.S.; Hardiman, B.S.; Gough, C.M. Forest structure, diversity, and primary production in relation to disturbance severity. Ecol. Evol. 2020, 10, 4419–4430. [Google Scholar] [CrossRef]
- Orman, O.; Dobrowolska, D. Gap dynamics in the Western Carpathian mixed beech old-growth forests affected by spruce bark beetle outbreak. Eur. J. For. Res. 2017, 136, 571–581. [Google Scholar] [CrossRef]
- Liu, B.B.; Zhao, P.W.; Zhou, M.; Wang, Y.; Yang, L.; Shu, Y. Effects of forest gaps on the regeneration pattern of the undergrowth of secondary poplar-birch forests in southern greater Xingan Mountains. For. Resour. Manag. 2019, 8, 31–36+45. [Google Scholar] [CrossRef]
- Xu, B.Y. Tree gap and its impact on forest ecosystem. J. Hebei For. Sci. Technol. 2021, 1, 42–46. [Google Scholar] [CrossRef]
- Shen, H.; Cai, J.N.; Li, M.J.; Chen, Q.; Ye, W.H.; Wang, Z.F.; Lian, J.Y.; Song, L. On chinese forest canopy biodiversity monitoring. Biodivers. Sci. 2017, 25, 229–236. [Google Scholar] [CrossRef]
- Bonnet, S.; Gaulton, R.; Lehaire, F.; Lejeune, P. Canopy Gap Mapping from Airborne Laser Scanning: An Assessment of the Positional and Geometrical Accuracy. Remote Sens. 2015, 7, 11267–11294. [Google Scholar] [CrossRef]
- He, X.Y.; Ren, C.Y.; Chen, L.; Wang, C.M.; Zheng, H.F. The Progress of Forest Ecosystems Monitoring with Remote Sensing Techniques. Sci. Geogr. Sin. 2018, 38, 997–1011. [Google Scholar] [CrossRef]
- Yang, L.; Sun, Z.Y.; Tang, G.L.; Lin, Z.W.; Chen, Y.Q.; Li, Y.; Li, Y. Identifying canopy species of subtropical forest by lightweight unmanned aerial vehicle remote sensing. Trop. Geogr. 2016, 36, 833–839. [Google Scholar] [CrossRef]
- Xie, Q.Y.; Yu, K.Y.; Deng, Y.B.; Liu, J.; Fan, H.D.; Lin, T.Z. Height measurement of Cunninghamia lanceolata plantations based on UAV remote sensing. J. Zhejiang A F Univ. 2019, 36, 335–342. [Google Scholar]
- Bagaram, M.B.; Giuliarelli, D.; Chirici, G.; Giannetti, F.; Barbati, A. UAV Remote Sensing for Biodiversity Monitoring: Are Forest Canopy Gaps Good Covariates? Remote Sens. 2018, 10, 1397. [Google Scholar] [CrossRef]
- Wang, Y.; Lian, J.Y.; Zhang, Z.C.; Hu, J.B.; Yang, J.; Li, Y.; Ye, W.H. Forest plots gap and canopy structure analysis based on two UAV images. Trop. Geogr. 2019, 39, 553–561. [Google Scholar] [CrossRef]
- Chenari, A.; Erfanifard, Y.; Dehghani, M.; Pourghasemi, H.R. Woodland mapping at single-tree levels using object-oriented classification of unmanned aerial vehicle (UAV) images. ISPRS—Int. Arch. Photogramm. Remote Sens. Spat. Inf. Sci. 2017, XLII-4/W4, 43–49. [Google Scholar] [CrossRef]
- Franklin, S.E.; Ahmed, O.S. Deciduous tree species classification using object-based analysis and machine learning with unmanned aerial vehicle multispectral data. Int. J. Remote Sens. 2018, 39, 5236–5245. [Google Scholar] [CrossRef]
- Almquist, B.E.; Jack, S.B.; Messina, M.G. Variation of the treefall gap regime in a bottomland hardwood forest: Relationships with microtopography. For. Ecol. Manag. 2002, 157, 155–163. [Google Scholar] [CrossRef]
- Pilas, I.; Gaaparovj, M.; Novkinic, A.; Klobucar, D. Mapping of the canopy openings in mixed beech-fir forest at Sentinel-2 subpixel level using UAV and machine learning approach. Remote Sens. 2020, 12, 3925. [Google Scholar] [CrossRef]
- Johansen, K.; Arroyo, L.; Phinn, S.R.; Witte, C. Comparison of geo-object based and pixel-based change detection of riparian environments using high spatial resolution multi-spectral imagery. Photogramm. Eng. Remote Sens. 2010, 76, 123–136. [Google Scholar] [CrossRef]
- Bhaskaran, S.; Paramananda, S.; Ramnarayan, M. Per-pixel and object-oriented classification methods for mapping urban features using Ikonos satellite data. Appl. Geogr. 2010, 30, 650–665. [Google Scholar] [CrossRef]
- Wu, F.M.; Zhang, M.; Wu, B.F. Object-oriented rapid estimation of rice acreage from UAV imagery. J. Geo-Inf. Sci. 2019, 21, 789–798. [Google Scholar]
- Drössler, L.; Lüpke, B.v. Canopy gaps in two virgin beech forest reserves in Slovakia. J. For. Sci. 2018, 51, 446–457. [Google Scholar] [CrossRef]
- Forbes, A.; Norton, D.A.; Carswell, F.E. Artificial canopy gaps accelerate restoration within an exotic Pinus radiata plantation. Restor. Ecol. 2016, 24, 336–345. [Google Scholar] [CrossRef]
- Liu, F.; Yang, Z.; Zhang, G. Canopy gap characteristics and spatial patterns in a subtropical forest of South China after ice storm damage. J. Mt. Sci. 2020, 17, 1942–1958. [Google Scholar] [CrossRef]
- Vilhar, U.; Roženbergar, D.; Simončič, P.; Diaci, J. Variation in irradiance, soil features and regeneration patterns in experimental forest canopy gaps. Ann. For. Sci. 2014, 72, 253–266. [Google Scholar] [CrossRef]
- Chandrakar, N.; Bhonsle, D. Study and comparison of various image edge detection techniques. Int. J. Manag. IT Eng. 2012, 2, 499–509. [Google Scholar]
- Melin, P.; González, C.I.; Castro, J.R.; Mendoza, O.; Castillo, O. Edge-Detection Method for Image Processing Based on Generalized Type-2 Fuzzy Logic. IEEE Trans. Fuzzy Syst. 2014, 22, 1515–1525. [Google Scholar] [CrossRef]
- Versaci, M.; Morabito, F.C. Image Edge Detection: A New Approach Based on Fuzzy Entropy and Fuzzy Divergence. Int. J. Fuzzy Syst. 2021, 23, 918–936. [Google Scholar] [CrossRef]
- Qin, L.M. Research on object oriented high resolution image information extraction based on edge information enhancement. Master’s Thesis, Anhui University of Science and Technology, Anhui, China, 2016. [Google Scholar]
- Dharampal; Mutneja, V. Methods of Image Edge Detection: A Review. J. Electr. Electron. Syst. 2015, 4, 5. [Google Scholar]
- Hagara, M.; Kubinec, P. About Edge Detection in Digital Images. Radioengineering 2018, 27, 919–929. [Google Scholar] [CrossRef]
- Wanto, A.; Rizki, S.D.; Andini, S.; Surmayanti, S.; Ginantra, N.L.W.S.R.; Aspan, H. Combination of Sobel+Prewitt Edge Detection Method with Roberts+Canny on Passion Flower Image Identification. J. Phys. Conf. Ser. 2021, 1933, 12–13. [Google Scholar] [CrossRef]
- Qi, Y.L.; Wang, D.J. Comparison of image edge detection methods. China Stand. 2022, 141–144. [Google Scholar]
- Wang, Y.; Hu, Y.Q. Comparison and analysis of five algorithms for edge detection. Technol. Innov. Appl. 2015, 64. [Google Scholar]
- Chen, Y.Y. Comparison analysis of edge detection algorithm. Agric. Netw. Inf. 2012, 31–33. [Google Scholar]
- Russ, J.C. The Image Processing Handbook; CRC Press: Boca Raton, FL, USA, 1992. [Google Scholar]
- Ziou, D.; Tabbone, S. Edge Detection Techniques—An Overview. Pattern Recognit. Image Anal. C/C Raspoznavaniye Obraz. I Anal. Izobr. 1998, 8, 537–559. [Google Scholar]
- Lu, N. Dominant Tree Species Classification Using GF-2 Images Based on Seasonal Characteristics. Master’s Thesis, Beijing Forestry University, Beijing, China, 2019. [Google Scholar]
- Jia, Y.H.; Yang, L.M. Object-Oriented method of shrub swamp’s boundary extraction. J. Geomat. 2019, 44, 51–55. [Google Scholar] [CrossRef]
- Betts, H.D.; Brown, L.M.J.; Stewart, G.H. Forest canopy gap detection and characterisation by the use of high-resolution Digital Elevation Models. N. Z. J. Ecol. 2005, 29, 95–103. [Google Scholar]
- Yang, J.; Jones, T.A.; Caspersen, J.P.; He, Y. Object-Based Canopy Gap Segmentation and Classification: Quantifying the Pros and Cons of Integrating Optical and LiDAR Data. Remote Sens. 2015, 7, 15917–15932. [Google Scholar] [CrossRef]
- Lisein, J.; Pierrot-Deseilligny, M.; Bonnet, S.; Lejeune, P. A Photogrammetric Workflow for the Creation of a Forest Canopy Height Model from Small Unmanned Aerial System Imagery. Forests 2013, 4, 922–944. [Google Scholar] [CrossRef]
- Li, Q. Correlation between Spatial Distribution Forest Canopy Gap and Plant Diversity Indices in Xishuangbanna Tropical Forest. Master’s Thesis, Yunnan University, Kunming, China, 2019. [Google Scholar]
- Hong, L.; Chu, S.S.; Peng, S.Y.; Xu, Q.L. Multiscale segmentation-optimized algorithm for high-spatial remote sensing imagery considering global and local optimizations. Natl. Remote Sens. Bull. 2020, 24, 1464–1475. [Google Scholar]
- Zhang, Y.J. A survey on evaluation methods for image segmentation. Pattern Recognit. 1996, 29, 1335–1346. [Google Scholar] [CrossRef]
- Dra˘gut¸, L.; Tiede, D.; Levick, S.R. ESP: A tool to estimate scale parameter for multiresolution image segmentation of remotely sensed data. Int. J. Geogr. Inf. Sci. 2010, 24, 859–871. [Google Scholar] [CrossRef]
- Dian, Y.; Li, Z.-y.; Pang, Y. Spectral and Texture Features Combined for Forest Tree species Classification with Airborne Hyperspectral Imagery. J. Indian Soc. Remote Sens. 2014, 43, 101–107. [Google Scholar] [CrossRef]
- Su, W.; Li, J.; Chen, Y.; Liu, Z.; Zhang, J.; Low, T.M.; Suppiah, I.; Hashim, S.A.M. Textural and local spatial statistics for the objec” oriented classification of urban areas using high resolution imagery. Int. J. Remote Sens. 2008, 29, 3105–3117. [Google Scholar] [CrossRef]
- Han, N.; Du, H.; Zhou, G.; Xu, X.; Ge, H.; Liu, L.; Gao, G.-l.; Sun, S.-b. Exploring the synergistic use of multi-scale image object metrics for land-use/land-cover mapping using an object-based approach. Int. J. Remote Sens. 2015, 36, 3544–3562. [Google Scholar] [CrossRef]
- Ling, C.X.; Liu, H.; Ji, P.; Hu, H.; Wang, X.H.; Hou, R.X. Estimation of vegetation coverage based on VDVI index of UAV visible image. For. Eng. 2021, 37, 57–66. [Google Scholar] [CrossRef]
- Wang, X.Q.; Wang, M.M.; Wang, S.Q.; Wu, D.Y. Extraction of vegetation information from visible unmanned aerial vehicle images. Trans. Chin. Soc. Agric. Eng. 2015, 31, 152–159. [Google Scholar]
- Zhan, G.Q.; Yang, G.D.; Wang, F.Y.; Xin, X.W.; Guo, C.; Zhao, Q. The random forest classification of wetland from GF-2 imagery based on the optimized feature space. J. Geo-Inf. Sci. 2018, 20, 1520–1528. [Google Scholar]
- Rigatti, S.J. Random Forest. J. Insur. Med. 2017, 47, 31–39. [Google Scholar] [CrossRef] [PubMed]
- Breiman, L. Random Forests. Mach. Learn. 2004, 45, 5–32. [Google Scholar] [CrossRef]
- Guo, Q.; Zhang, J.; Guo, S.; Ye, Z.; Deng, H.; Hou, X.; Zhang, H. Urban Tree Classification Based on Object-Oriented Approach and Random Forest Algorithm Using Unmanned Aerial Vehicle (UAV) Multispectral Imagery. Remote Sens. 2022, 14, 3885. [Google Scholar] [CrossRef]
- Zhou, R.; Yang, C.; Li, E.; Cai, X.; Yang, J.; Xia, Y. Object-Based Wetland Vegetation Classification Using Multi-Feature Selection of Unoccupied Aerial Vehicle RGB Imagery. Remote Sens. 2021, 13, 4910. [Google Scholar] [CrossRef]
- Cristianini, N.; Shawe-Taylor, J. An Introduction to Support Vector Machines and Other Kernel-Based Learning Methods; Cambridge University Press: Cambridge, UK, 2000. [Google Scholar]
- Delany, S.J. k-Nearest Neighbour Classifiers. ACM Comput. Surv. (CSUR) 2007, 54, 1–25. [Google Scholar]
- Mao, X.G.; Xing, X.L.; Li, J.R.; Tan, L.Q.; Fan, W.Y. Object-Oriented recognition of forest gap based on aerial orthophoto. Sci. Silvae Sin. 2019, 55, 87–96. [Google Scholar]
- Oreti, L.; Giuliarelli, D.; Tomao, A.; Barbati, A. Object Oriented Classification for Mapping Mixed and Pure Forest Stands Using Very-High Resolution Imagery. Remote Sens. 2021, 13, 2508. [Google Scholar] [CrossRef]
- Ulloa-Torrealba, Y.; Stahlmann, R.; Wegmann, M.; Koellner, T. Over 150 Years of Change: Object-Oriented Analysis of Historical Land Cover in the Main River Catchment, Bavaria/Germany. Remote Sens. 2020, 12, 4048. [Google Scholar] [CrossRef]
- Wang, X.; Wang, L.; Tian, J.; Shi, C. Object-based spectral-phenological features for mapping invasive Spartina alterniflora. Int. J. Appl. Earth Obs. Geoinf. 2021, 101, 102349. [Google Scholar] [CrossRef]
Publisher’s Note: MDPI stays neutral with regard to jurisdictional claims in published maps and institutional affiliations. |
© 2022 by the authors. Licensee MDPI, Basel, Switzerland. This article is an open access article distributed under the terms and conditions of the Creative Commons Attribution (CC BY) license (https://creativecommons.org/licenses/by/4.0/).