
Remote Sensing of Forest Burnt Area, Burn Severity, and Post-Fire Recovery: A Review

 ,
,  , , ,
, , ,
Abstract
1. Introduction
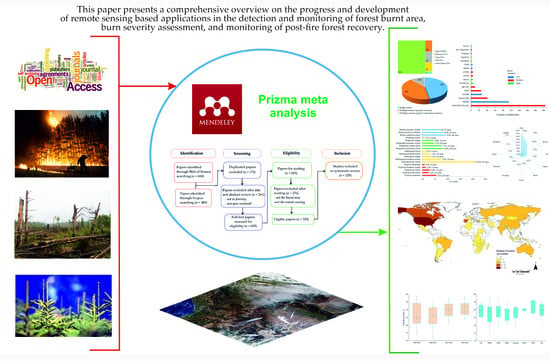
2. Materials and Methods
2.1. Search Methodology
- Remote sensing techniques are the main components of the study;
- Study should attempt temporally explicit estimation of the forest BA and BS using different datasets for the validation of mapping results;
- Paper appropriately describes the methods and/or results of the study so that they can be interpretable and replicated;
- Focus is made on the forest stands rather than other ecosystem attributes (soils, water, undergrowth);
- Study should report detailed accuracy assessment results.
2.2. Data Compilation
3. Descriptive Analysis
3.1. Publication Details
3.2. Spatial Extent and Geographical Distribution
3.3. Sensor Type
3.4. Referred FAO Ecozones and Tree Species
4. Results and Discussions
4.1. BA and BS Estimates
4.1.1. Spectral Indices and Mapping Techniques
4.1.2. Active RS Sensors
4.2. Monitoring of Post-Fire Forest Recovery
4.3. Classification Algorithms
4.3.1. Feature Extraction
4.3.2. Classification Methods
4.3.3. Classification Accuracy
5. Research Perspectives
- It is important to conduct more research in the forest ecosystems of South America, Africa, and Eurasia, because these regions have a great impact on the global balance of carbon and climate change.
- Further identified investigations are likely to include the use of higher resolution data, algorithms for multi-criteria analysis, empirical models, and data fusion from multiple sensors. The adoption of these methods and data can potentially address the misclassification and high variability in BA, BS, and post-fire recovery studies.
- Neural networks, classification and regression trees (CARTs), fuzzy modelling, and OBIA are also very promising in future studies with the application of big data algorithms and emerging processing platforms. The use of machine-learning algorithms and cloud computing techniques (e.g., GEE) provides a new opportunity for the field of study.
- The review suggests that more research needs to be done on finding methods for reducing RS image classification errors (omission and commission) and increasing global and regional BA map accuracy, particularly in data-poor regions.
- The combination of RS imagery from passive and active sensors can provide more insight in the field of study, including the possibility to overcome cloud cover issues in a forest BA.
- We expect to see an increase in the integration of LiDAR, radar, hyperspectral sensors, and emerging UAS technologies in future BA studies. There is also huge potential for research on the spatial and temporal pattern of post-fire recovery and approaches to forest BA monitoring with the aim of improving ecosystem sustainability.
6. Conclusions
Supplementary Materials
Author Contributions
Funding
Acknowledgments
Conflicts of Interest
References
- FAO; UNEP. The State of the World’s Forests 2020. In Forests, Biodiversity and People; FAO: Rome, Italy, 2020; p. 214. [Google Scholar]
- Artés, T.; Oom, D.; de Rigo, D.; Durrant, T.H.; Maianti, P.; Libertà, G.; San-Miguel-Ayanz, J. A global wildfire dataset for the analysis of fire regimes and fire behaviour. Scien. Data 2019, 6, 296. [Google Scholar] [CrossRef] [PubMed]
- FAO. Global Forest Resources Assessment 2020: Main Report; FAO: Rome, Italy, 2020; p. 184. [Google Scholar]
- Ciais, P.; Sabine, C.; Bala, G.; Bopp, L.; Brovkin, V.; Canadell, J.; Chhabra, A.; DeFries, R.; Galloway, J.; Heimann, M.; et al. Carbon and other biogeochemical cycles. In Climate Change 2013: The Physical Science Basis. Contribution of Working Group I to the Fifth Assessment Report of the Intergovernmental Panel on Climate Change; Stocker, T.F., Qin, D., Plattner, G.-K., Tignor, M., Allen, S.K., Boschung, J., Nauels, A., Xia, Y., Bex, V., Midgley, P.M., Eds.; Cambridge University Press: Cambridge, UK, 2014; pp. 465–570. [Google Scholar]
- Yue, C.; Ciais, P.; Cadule, P.; Thonicke, K.; van Leeuwen, T.T. Modelling the role of fires in the terrestrial carbon balance by incorporating SPITFIRE into the global vegetation model ORCHIDEE—Part 2: Carbon emissions and the role of fires in the global carbon balance. Geosci. Model Dev. 2015, 8, 1285–1297. [Google Scholar] [CrossRef]
- Gillett, N.P.; Weaver, A.J.; Zwiers, F.W.; Flannigan, M.D. Detecting the effect of climate change on Canadian forest fires. Geophys. Res. Lett. 2004, 31, L18211. [Google Scholar] [CrossRef]
- Crimmins, M.A. Interannual to decadal changes in extreme fire weather event frequencies across the southwestern United States. Int. J. Climatol. 2011, 31, 1573–1583. [Google Scholar] [CrossRef]
- Drobyshev, I.; Granstrom, A.; Linderholm, H.W.; Hellberg, E.; Bergeron, Y.; Niklasson, M. Multi-century reconstruction of fire activity in Northern European boreal forest suggests differences in regional fire regimes and their sensitivity to climate. J. Ecol. 2014, 102, 738–748. [Google Scholar] [CrossRef]
- Singleton, M.P.; Thode, A.E.; Meador, A.J.S.; Iniguez, J.M. Increasing trends in high-severity fire in the southwestern USA from 1984 to 2015. For. Ecol. Manag. 2019, 433, 709–719. [Google Scholar] [CrossRef]
- Molina-Terren, D.M.; Xanthopoulos, G.; Diakakis, M.; Ribeiro, L.; Caballero, D.; Delogu, G.M.; Viegas, D.X.; Silva, C.A.; Cardil, A. Analysis of forest fire fatalities in Southern Europe: Spain, Portugal, Greece and Sardinia (Italy). Int. J. Wildland Fire 2019, 28, 85–98. [Google Scholar] [CrossRef]
- Flannigan, M.D.; Stocks, B.J.; Wotton, B.M. Climate change and forest fires. Sci. Total Environ. 2000, 262, 221–229. [Google Scholar] [CrossRef]
- Stephens, S.L.; Agee, J.K.; Fulé, P.Z.; North, M.P.; Romme, W.H.; Swetnam, T.W.; Turner, M.G. Managing forests and fire in changing climates. Science 2013, 342, 41–42. [Google Scholar] [CrossRef]
- Etchellsa, H.; O’Donnella, A.J.; McCawb, W.L.; Griersona, P.F. Fire severity impacts on tree mortality and post-fire recruitment in tall eucalypt forests of southwest Australia. For. Ecol. Manag. 2020, 459, 117850. [Google Scholar] [CrossRef]
- Loboda, T.; Krankina, O.; Savin, I.; Kurbanov, E.; Joanne, H. Land management and the impact of the 2010 extreme drought event on the agricultural and ecological systems of European Russia. In Land-Cover and Land-Use Changes in Eastern Europe after the Collapse of the Soviet Union in 1991; Gutman, G., Volker, R., Eds.; Springer International Publishing: Cham, Switzerland, 2017; pp. 173–192. [Google Scholar]
- Seidl, R.; Schelhaas, M.J.; Rammer, W.; Verkerk, P.J. Increasing forest disturbance in Europe and their impacts on carbon storage. Nature Clim. Change 2014, 4, 806–810. [Google Scholar] [CrossRef] [PubMed]
- Thompson, M.P.; Rodríguez y Silva, F.; Calkin, D.E.; Hand, M.S. A review of challenges to determining and demonstrating efficiency of large fire management. Int. J. Wildland Fire 2017, 26, 562–573. [Google Scholar] [CrossRef]
- Brecka, A.F.J.; Boulanger, Y.; Searle, E.B.; Taylor, A.R.; Price, D.T.; Zhu, Y.; Shahia, C.; Chena, H.Y.H. Sustainability of Canada’s forestry sector may be compromised by impending climate change. For. Ecol. Manag. 2020, 474, 118352. [Google Scholar] [CrossRef]
- Staal, A.; van Nes, E.H.; Hantson, S.; Holmgren, M.; Dekker, S.C.; Pueyo, S.; Xu, C.; Scheffer, M. Resilience of tropical tree cover: The roles of climate, fire and herbivory. Glob. Change Biol. 2018, 24, 5096–5109. [Google Scholar] [CrossRef] [PubMed]
- Mosquera-Losada, M.R.; Santiago-Freijanes, J.J.; Rois-Díaz, M.; Moreno, G.; den Herder, M.; Aldrey-Vázquez, J.A.; Ferreiro-Domínguez, N.; Pantera, A.; Pisanelli, A.; Rigueiro-Rodríguez, A. Agroforestry in Europe: A land management policy tool to combat climate change. Land Use Policy 2018, 78, 603–613. [Google Scholar] [CrossRef]
- Sousa-Silva, R.; Verbist, B.; Lomba, Â.; Valent, P.; Suškevičs, M.; Picard, O.; Hoogstra-Klein, M.A.; Cosofret, V.-C.; Bouriaud, L.; Ponette, Q.; et al. Adapting forest management to climate change in Europe: Linking perceptions to adaptive responses. For. Pol. Econ. 2018, 90, 22–30. [Google Scholar] [CrossRef]
- Otón, G.; Ramo, R.; Lizundia-Loiola, J.; Chuvieco, E. Global detection of long-term (1982–2017) burned area with AVHRR-LTDR data. Remote Sens. 2019, 11, 2079. [Google Scholar] [CrossRef]
- Talukdar, S.; Singha, P.; Mahato, S.; Shahfahad; Pal, S.; Liou, Y.-A.; Rahman, A. Land-use land-cover classification by machine learning classifiers for satellite observations—A review. Remote Sens. 2020, 12, 1135. [Google Scholar] [CrossRef]
- French, N.H.F.; Kasischke, E.S.; Hall, R.J.; Murphy, K.A.; Verbyla, D.L.; Hoy, E.E.; Allen, J.L. Using Landsat data to assess fire and burn severity in the North American boreal forest region: An overview and summary of results. Int. J. Wildland Fire 2008, 17, 443–462. [Google Scholar] [CrossRef]
- Hua, L.; Shao, G. The progress of operational forest fire monitoring with infrared remote sensing. J. For. Res. 2017, 28, 215–229. [Google Scholar] [CrossRef]
- MacDonald, H.; McKenney, D. Envisioning a global forest transition: Status, role, and implications. Land Use Pol. 2020, 99, 104808. [Google Scholar] [CrossRef]
- Song, X.; Hansen, M.C.; Stehman, S.V.; Potapov, P.V.; Tyukavina, A.; Vermote, E.F.; Townshend, J.R. Global land change from 1982 to 2016. Nature 2018, 560, 639–643. [Google Scholar] [CrossRef]
- Verhegghen, A.; Eva, H.; Ceccherini, G.; Achard, F.; Gond, V.; Gourlet-Fleury, S.; Cerutti, P.O. The Potential of Sentinel Satellites for Burnt Area Mapping and Monitoring in the Congo Basin Forests. Remote Sens. 2016, 8, 986. [Google Scholar] [CrossRef]
- Santana, N.C.; De Carvalho Júnior, O.A.; Gomes, R.A.T.; Guimarães, R.F. Burned-area detection in Amazonian environments using standardized time series per pixel in MODIS data. Remote Sens. 2018, 10, 1904. [Google Scholar] [CrossRef]
- Gupta, S.; Roy, A.; Bhavsar, D.; Kala, R.; Singh, S.; Kumar, A.S. Forest fire burnt area assessment in the biodiversity rich regions using geospatial technology: Uttarakhand forest fire event 2016. J. Indian Soc. Remote Sens. 2018, 46, 945–955. [Google Scholar] [CrossRef]
- Campagnolo, M.L.; Oom, D.; Padilla, M.; Pereira, J.M.C. A patch-based algorithm for global and daily burned area mapping. Rem. Sens. Environ. 2019, 232, 111288. [Google Scholar] [CrossRef]
- Roy, D.P.; Boschetti, L.; Trigg, S.N. Remote sensing of fire severity: Assessing the performance of the normalized burn ratio. IEEE Geosci. Remote Sens. Lett. 2006, 3, 112–116. [Google Scholar] [CrossRef]
- Kurbanov, E.; Vorobyev, O.; Leznin, S.; Polevshikova, Y.; Demisheva, E. Assessment of burn severity in Middle Povozhje with Landsat multitemporal data. Int. J. Wildland Fire 2017, 26, 772–782. [Google Scholar] [CrossRef]
- Chen, X.; Vogelmann, J.; Rollins, M.; Ohlen, D.; Key, C.; Yang, Y.; Huang, C.; Shi, H. Detecting post-fire burn severity and vegetation recovery using multitemporal remote sensing spectral indices and field-collected composite burn index data in a ponderosa pine forest. Int. J. Remote Sens. 2011, 32, 7905–7927. [Google Scholar] [CrossRef]
- Saulino, L.; Rita, A.; Migliozzi, A.; Maffei, C.; Allevato, E.; Garonna, A.P.; Saracino, A. Detecting Burn Severity across Mediterranean Forest Types by Coupling Medium-Spatial Resolution Satellite Imagery and Field Data. Remote Sens. 2020, 12, 741. [Google Scholar] [CrossRef]
- Cuevas-González, M.; Gerard, F.; Balzter, H.; Riano, D. Analysing forest recovery after wildfire disturbance in boreal Siberia using remotely sensed vegetation indices. Glob. Change Biol. 2009, 15, 561–577. [Google Scholar] [CrossRef]
- Van Leeuwen, W.J.D.; Casady, G.M.; Neary, D.G.; Bautista, S.; Alloza, J.A.; Carmel, Y.; Wittenberg, L.; Malkinson, D.; Orr, B.J. Monitoring post-wildfire vegetation response with remotely sensed time-series data in Spain, USA, and Israel. Int. J. Wildland Fire 2010, 19, 75–93. [Google Scholar] [CrossRef]
- Kibler, C.L.; Parkinson, A.-M.L.; Peterson, S.H.; Roberts, D.A.; D’Antonio, C.M.; Meerdink, S.K.; Sweeney, S.H. Monitoring post-fire recovery of chaparral and conifer species using field surveys and Landsat time series. Remote Sens. 2019, 11, 2963. [Google Scholar] [CrossRef]
- Fernández-Guisuraga, J.M.; Suárez-Seoane, S.; Calvo, L. Transferability of vegetation recovery models based on remote sensing across different fire regimes. Appl. Veg. Sci. 2020, 23, 441–451. [Google Scholar] [CrossRef]
- Girardin, M.P.; Ali, A.A.; Hely, C. Wildfires in boreal ecosystems: Past, present and some emerging trends. Int. J. Wildland Fire 2010, 19, 913–926. [Google Scholar] [CrossRef]
- Gitas, I.; Mitri, G.; Veraverbeke, S.; Polychronaki, A. Advances in remote sensing of post-fire vegetation recovery monitoring—A review. In Remote Sensing of Biomass—Principles and Applications; Fatoyinbo, L., Ed.; InTech: London, UK, 2012; ISBN 978-953-51-0313-4. [Google Scholar]
- Miettinen, J.; Hyer, E.; Chia, A.S.; Kwoh, L.K.; Liew, S.C. Detection of vegetation fires and burnt areas by remote sensing in insular Southeast Asian conditions: Current status of knowledge and future challenges. Int. J. Remote Sens. 2013, 34, 4344–4366. [Google Scholar] [CrossRef]
- Chu, T.; Guo, X. Remote sensing techniques in monitoring post-fire effects and patterns of forest recovery in boreal forest regions: A review. Remote Sens. 2014, 6, 470–520. [Google Scholar] [CrossRef]
- Parisien, M.A.; Denyse, A.D.; Miller, C.; Stockdale, C.A.; Armitage, O.B. Applications of simulation-based burn probability modelling: A review. Int. J. Wildland Fire 2019, 28, 913–926. [Google Scholar] [CrossRef]
- Szpakowski, D.M.; Jensen, J.L.R. A Review of the applications of remote sensing in fire ecology. Remote Sens. 2019, 11, 2638. [Google Scholar] [CrossRef]
- Liberati, A.; Altman, D.G.; Tetzlaff, J.; Mulrow, C.; Gøtzsche, P.C.; Ioannidis, J.P.A.; Clarke, M.; Devereaux, P.J.; Kleijnen, J.; Moher, D. The PRiSMA statement for reporting systematic reviews and meta-analyses of studies that evaluate healthcare interventions: Explanation and elaboration. Res. Methods Rep. 2009, 62, e1–e34. [Google Scholar] [CrossRef]
- Chuvieco, E.; Mouillot, F.; van der Werf, G.R.; Miguel, J.S.; Tanase, M.; Koutsias, N.; García, M.; Yebra, M.; Padilla, M.; Gitas, I.; et al. Historical background and current developments for mapping burned area from satellite Earth observation. Remote Sens. Environ. 2019, 225, 45–64. [Google Scholar] [CrossRef]
- Mouillot, F.; Schultz, M.G.; Yue, C.; Cadule, P.; Tansey, K.; Ciais, P.; Chuvieco, E. Ten years of global burned area products from spaceborne remote sensing—A review: Analysis of user needs and recommendations for future developments. Int. J. Appl. Earth Obs. Geoinf. 2014, 26, 64–79. [Google Scholar] [CrossRef]
- Trigg, S.; Flasse, S. Characterising the spectral-temporal response of burned savanna using in situ spectroradiometry and infrared thermometry. Int. J. Remote Sens. 2000, 21, 3161–3168. [Google Scholar] [CrossRef]
- Fraser, R.H.; Li, Z.; Cihlar, J. Hotspot and NDVI differencing synergy (HANDS): A new technique for burned area mapping over boreal forest. Remote Sens. Environ. 2000, 74, 362–376. [Google Scholar] [CrossRef]
- Al-Rawi, K.R.; Casanova, J.L.; Romo, A.; Louakfaoui, E.M. Integrated fire evolution monitoring system (IFEMS) for monitoring spatial-temporal behaviour of multiple fire phenomena. Int. J. Remote Sens. 2002, 23, 1967–1983. [Google Scholar] [CrossRef]
- Justice, C.O.; Smith, R.; Gill, A.M.C.I. A review of current space-based fire monitoring in Australia and the GOFC/GOLD program for international coordination. Int. J. Wildland Fire 2003, 12, 247–258. [Google Scholar] [CrossRef]
- Li, Z.; Fraser, R.; Jin, J.; Abuelgasim, A.A.; Csiszar, I.; Gong, P.; Pu, R.; Hao, W. Evaluation of algorithms for fire detection and mapping across North America from satellite. J. Geophys. Res. Atmos. 2003, 108, 4076. [Google Scholar] [CrossRef]
- Zhang, Y.-H.; Wooster, M.J.; Tutubalina, O.; Perry, G.L.W. Monthly burned area and forest fire carbon emission estimates for the Russian Federation from SPOT VGT. Remote Sens. Environ. 2003, 87, 1–15. [Google Scholar] [CrossRef]
- Silva, J.M.N.; Cadima, J.F.C.L.; Pereira, J.M.C.; Grégoire, J.-M. Assessing the feasibility of a global model for multi-temporal burned area mapping using SPOT-VEGETATION data. Int. J. Remote Sens. 2004, 25, 4889–4913. [Google Scholar] [CrossRef]
- Sukhinin, A.I.; French, N.H.F.; Kasischke, E.S.; Hewson, J.H.; Soja, A.J.; Csiszar, I.A.; Hyer, E.J.; Loboda, T.; Conard, S.G.; Romasko, V.I.; et al. AVHRR-based mapping of fires in Russia: New products for fire management and carbon cycle studies. Remote Sens. Environ. 2004, 93, 546–564. [Google Scholar] [CrossRef]
- Kučera, J.; Yasuoka, Y.; Dye, D.G. Creating a forest fire database for the Far East of Asia using NOAA/AVHRR observation. Int. J. Remote Sens. 2005, 26, 2423–2439. [Google Scholar] [CrossRef]
- Urbanski, S.P.; Salmon, J.M.; Nordgren, B.L.; Hao, W.M. A MODIS direct broadcast algorithm for mapping wildfire burned area in the western United States. Remote Sens. Environ. 2009, 113, 2511–2526. [Google Scholar] [CrossRef]
- Somashekar, R.K.; Ravikumar, P.; Mohan Kumar, C.N.; Prakash, K.L.; Nagaraja, B.C. Burnt area mapping of Bandipur National Park, India using IRS 1C/1D LISS III Data. J. Indian Soc. Remote Sens. 2009, 37, 37–50. [Google Scholar] [CrossRef]
- Merino-de-Miguel, S.; Huesca, M.; González-Alonso, F. Modis reflectance and active fire data for burn mapping and assessment at regional level. Ecol. Model. 2010, 221, 67–74. [Google Scholar] [CrossRef]
- Libonati, R.; DaCamara, C.C.; Pereira, J.M.C.; Peres, L.F. Retrieving middle-infrared reflectance for burned area mapping in tropical environments using MODIS. Remote Sens. Environ. 2010, 114, 831–843. [Google Scholar] [CrossRef]
- Badarinath, K.V.S.; Sharma, A.R.; Kharol, S.K. Forest fire monitoring and burnt area mapping using satellite data: A study over the forest region of Kerala state, India. Int. J. Remote Sens. 2011, 32, 85–102. [Google Scholar] [CrossRef]
- Stroppiana, D.; Bordogna, G.; Carrara, P.; Boschetti, M.; Boschetti, L.; Brivio, P. A method for extracting burned areas from Landsat TM/ETM+ images by soft aggregation of multiple Spectral Indices and a region growing algorithm. ISPRS J. Photogramm. Remote Sens. 2012, 69, 88–102. [Google Scholar] [CrossRef]
- Briones-Herrera, C.I.; Vega-Nieva, D.J.; Monjarás-Vega, N.A.; Briseño-Reyes, J.; López-Serrano, P.M.; Corral-Rivas, J.J.; Alvarado-Celestino, E.; Arellano-Pérez, S.; Álvarez-González, J.G.; Ruiz-González, A.D.; et al. Near real-time automated early mapping of the perimeter of large forest fires from the aggregation of VIIRS and MODIS active fires in Mexico. Remote Sens. 2020, 12, 2061. [Google Scholar] [CrossRef]
- Santos, F.L.M.; Libonati, R.; Peres, L.F.; Pereira, A.A.; Narcizo, L.C.; Rodrigues, J.A.; Oom, D.; Pereira, J.M.C.; Schroeder, W.; Setzer, A.W. Assessing VIIRS capabilities to improve burned area mapping over the Brazilian Cerrado. Int. J. Remote Sens. 2020, 41, 8300–8327. [Google Scholar] [CrossRef]
- Li, Z.; Cihlar, J.; Nadon, S.; Stocks, B. Satellite-based mapping of Canadian Boreal forest fires: Evaluation and comparison of algorithms. Int. J. Remote Sens. 2000, 21, 3071–3082. [Google Scholar] [CrossRef]
- Cochrane, M.A.; Laurance, W.F. Fire as a large-scale edge effect in Amazonian forests. J. Trop. Ecol. 2002, 18, 311–325. [Google Scholar] [CrossRef]
- Gerard, F.; Plummer, S.; Wadsworth, R.; Ferreruela, A.; Iliffe, L.; Balzter, H.; Wyatt, B. Forest fire scar detection in the boreal forest with multitemporal SPOT-VEGETATION Data. IEEE Trans. Geosci. Remote Sens. 2003, 41, 2575–2585. [Google Scholar] [CrossRef]
- Koutsias, N.; Pleniou, M. Comparing the spectral signal of burned surfaces between Landsat 7 ETM+ and Landsat 8 OLI sensors. Int. J. Remote Sens. 2015, 36, 3714–3732. [Google Scholar] [CrossRef]
- Vázquez, A.; Cuevas, J.M.; González-Alonso, F. Comparison of the use of WiFS and LISS images to estimate the area burned in a large forest fire. Int. J. Remote Sens. 2001, 22, 901–907. [Google Scholar] [CrossRef]
- Salvador, R.; Valeriano, J.; Pons, X.; Diaz-Delgado, R. A semi-automatic methodology to detect fire scars in shrubs and evergreen forests with Landsat MSS time series. Int. J. Remote Sens. 2000, 21, 655–671. [Google Scholar] [CrossRef]
- Rogan, J.; Franklin, J. Mapping wildfire burn severity in Southern California forests and shrublands using enhanced thematic mapper imagery. Geocarto Int. 2001, 16, 91–106. [Google Scholar] [CrossRef]
- Domenikiotis, C.; Dalezios, N.R.; Loukas, A.; Karteris, M. Agreement assessment of NOAA/AVHRR NDVI with Landsat TM NDVI for mapping burned forested areas. Int. J. Remote Sens. 2002, 23, 4235–4246. [Google Scholar] [CrossRef]
- Bucini, G.; Lambin, E.F. Fire impacts on vegetation in Central Africa: A remote-sensing-based statistical analysis. Appl. Geogr. 2002, 22, 27–48. [Google Scholar] [CrossRef]
- Isaev, A.S.; Korovin, G.N.; Bartalev, S.A.; Ershov, D.V.; Janetos, A.; Kasischke, E.S.; Shugart, H.H.; French, N.H.F.; Orlick, B.E.; Murphy, T.L. Using remote sensing to assess Russian forest fire carbon emissions. Clim. Change 2002, 55, 235–249. [Google Scholar] [CrossRef]
- Phulpin, T.; Lavenu, F.; Bellan, M.F.; Mougenot, B.; Blasco, F. Using SPOT-4 HRVIR and VEGETATION sensors to assess impact of tropical forest fires in Roraima, Brazil. Int. J. Remote Sens. 2002, 23, 1943–1966. [Google Scholar] [CrossRef]
- Lloret, F.; Calvo, E.; Pons, X.; Díaz-Delgado, R. Wildfires and landscape patterns in the Eastern Iberian Peninsula. Landsc. Ecol. 2002, 17, 745–759. [Google Scholar] [CrossRef]
- Silva, J.M.N.; José, M.C.; Pereira, J.M.C.; Cabral, A.I.; Sá, A.C.L.; Vasconcelos, M.J.P.; Mota, B.; Grégoire, J.M. An estimate of the area burned in southern Africa during the 2000 dry season using SPOT-VEGETATION satellite data. J. Geophys. Res. Atmos. 2003, 108, 8498. [Google Scholar] [CrossRef]
- Sa, A.C.L.; Pereira, J.M.C.; Vasconcelos, M.J.P.; Silva, J.M.N.; Ribeiro, N.; Awasse, A. Assessing the feasibility of sub-pixel burned area mapping in miombo woodlands of northern Mozambique using MODIS imagery. Int. J. Remote Sens. 2003, 24, 1783–1796. [Google Scholar] [CrossRef]
- Alcaraz-Segura, D.; Chuvieco, E.; Epstein, H.E.; Kasischke, E.S.; Trishchenko, A. Debating the greening vs. browning of the North American boreal forest: Differences between satellite datasets. Glob. Change Biol. 2010, 16, 760–770. [Google Scholar] [CrossRef]
- Ardakani, A.S.; Valadan Zoej, M.J.; Mohammadzadeh, A.; Mansourian, A. Spatial and temporal analysis of fires detected by MODIS data in Northern Iran from 2001 to 2008. IEEE J. Sel. Top. Appl. Earth Obs. Remote Sens. 2011, 4, 216–225. [Google Scholar] [CrossRef]
- Vilar, L.; Camia, A.; San-Miguel-Ayanz, J. A comparison of remote sensing products and forest fire statistics for improving fire information in Mediterranean Europe. Eur. J. Remote Sens. 2015, 48, 345–364. [Google Scholar] [CrossRef]
- Belhadj-Khedher, C.; Koutsias, N.; Karamitsou, A.; EI-Melki, T.; Ouelhazi, B.; Hamdi, A.; Nouri, H.; Mouillot, F. A revised historical fire regime analysis in Tunisia (1985–2010) from a critical analysis of the National fire database and remote sensing. Forests 2018, 9, 59. [Google Scholar] [CrossRef]
- Bentekhici, N.; Bellal, S.A.; Zegrar, A. Contribution of remote sensing and GIS to mapping the fire risk of Mediterranean forest case of the forest massif of Tlemcen (North-West Algeria). Nat. Hazards 2020, 104, 811–831. [Google Scholar] [CrossRef]
- Pinty, B.; Verstraete, M.M. GEMI: A non-linear index to monitor global vegetation from satellites. Vegetatio 1992, 101, 15–20. [Google Scholar] [CrossRef]
- Chuvieco, E.; Englefield, P.; Trishchenko, A.P.; Luo, Y. Generation of long time series of burn area maps of the boreal forest from NOAA—AVHRR composite data. Remote Sens. Environ. 2008, 112, 2381–2396. [Google Scholar] [CrossRef]
- Matricardi, E.A.T.; Skole, D.L.; Pedlowski, M.A.; Chomentowski, W. Assessment of forest disturbances by selective logging and forest fires in the Brazilian Amazon using Landsat data. Int. J. Remote Sens. 2013, 34, 1057–1086. [Google Scholar] [CrossRef]
- Guindos-Rojas, F.; Arbelo, M.; García-Lázaro, J.R.; Moreno-Ruiz, J.A.; Hernández-Leal, P.A. Evaluation of a Bayesian algorithm to detect burned areas in the Canary Islands’ dry woodlands and forests ecoregion using MODIS data. Remote Sens. 2018, 10, 789. [Google Scholar] [CrossRef]
- Chuvieco, E.; Martín, M.P.; Palacios, A. Assessment of different spectral indexes in the red-near-infrared spectral domain for burned land discrimination. Int. J. Remote Sens. 2002, 23, 5103–5110. [Google Scholar] [CrossRef]
- Martín, M.P.; Gómez, I.; Chuvieco, E. Burnt Area Index (BAIM) for burned area discrimination at regional scale using MODIS data. For. Ecol. Manag. 2006, 234, S221. [Google Scholar] [CrossRef]
- Gonzalez-Alonso, F.; Merino-De-Miguel, S. Integration of AWiFS and MODIS active fire data for burn mapping at regional level using the Burned Area Synergic Algorithm (BASA). Int. J. Wildland Fire 2009, 18, 404–414. [Google Scholar] [CrossRef]
- Quintano, C.; Fernández-Manso, A.; Stein, A.; Bijker, W. Estimation of area burned by forest fires in Mediterranean countries: A remote sensing data mining perspective. For. Ecol. Manag. 2011, 262, 1597–1607. [Google Scholar] [CrossRef]
- Trigg, S.; Flasse, S. An evaluation of different bi-spectral spaces for discriminating burned shrub-savannah. Int. J. Remote Sens. 2001, 22, 2641–2647. [Google Scholar] [CrossRef]
- Barboza Castillo, E.; Turpo Cayo, E.Y.; de Almeida, C.M.; Salas López, R.; Rojas Briceño, N.B.; Silva López, J.O.; Barrena Gurbillón, M.Á.; Oliva, M.; Espinoza-Villar, R. Monitoring Wildfires in the Northeastern Peruvian Amazon Using Landsat-8 and Sentinel-2 Imagery in the GEE Platform. ISPRS Int. J. Geo-Inf. 2020, 9, 564. [Google Scholar] [CrossRef]
- Hawbaker, T.J.; Vanderhoof, M.K.; Schmidt, G.L.; Beal, Y.-J.; Picotte, J.J.; Takacs, J.D.; Falgout, J.T.; Dwyer, J.L. The Landsat burned area algorithm and products for the conterminous United States. Remote Sens. Environ. 2020, 244, 111801. [Google Scholar] [CrossRef]
- Bastarrika, A.; Chuvieco, E.; Martín, M.P. Mapping burned areas from Landsat TM/ETM+ data with a two-phase algorithm: Balancing omission and commission errors. Remote Sens. Environ. 2011, 115, 1003–1012. [Google Scholar] [CrossRef]
- Tansey, K.; Grégoire, J.-M.; Binaghi, E.; Boschetti, L.; Brivio, P.; Ershov, D.; Flasse, S.; Frazer, R.; Graetz, D.; Maggi, M.; et al. A global inventory of burned areas at 1 km resolution for the year 2000 derived from SPOT vegetation data. Clim. Change 2004, 67, 345–377. [Google Scholar] [CrossRef]
- Tansey, K.; Grégoire, J.-M.; Defourny, P.; Leigh, R.; Pekel, J.-F.; van Bogaert, E.; Bartholomé, E. A new, global, multi-annual (2000–2007) burnt area product at 1 km resolution. Geophys. Res. Lett. 2008, 35, L01401. [Google Scholar] [CrossRef]
- Fraser, R.H.; Li, Z. Estimating fire-related parameters in boreal forest using SPOT VEGETATION. Remote Sens. Environ. 2002, 82, 95–110. [Google Scholar] [CrossRef]
- Simon, M.; Plummer, S.; Fierens, F.; Hoelzemann, J.J.; Arino, O. Burnt area detection at global scale using ATSR-2: The GLOBSCAR products and their qualification. J. Geophys. Res. 2004, 109, D14S02. [Google Scholar] [CrossRef]
- Plummer, S.; Olivier, A.; Muriel, S.; Will, S. Establishing a Earth observation product service for the terrestrial carbon community: The globcarbon initiative. Mitig. Adap. Strat. Glob. Change 2006, 11, 97–111. [Google Scholar] [CrossRef]
- Roy, D.P.; Jin, Y.; Lewis, P.E.; Justice, C.O. Prototyping a global algorithm for systematic fire-affected area mapping using MODIS time series data. Remote Sens. Environ. 2005, 97, 137–162. [Google Scholar] [CrossRef]
- Giglio, L.; Loboda, T.; Roy, D.P.; Quayle, B.; Justice, C.O. An active-fire based burned area mapping algorithm for the MODIS sensor. Remote Sens. Environ. 2009, 113, 408–420. [Google Scholar] [CrossRef]
- Roy, D.P.; Boschetti, L.; Justice, C.O.; Ju, J. The collection 5 MODIS burned area product—Global evaluation by comparison with the MODIS active fire product. Remote Sens. Environ. 2008, 112, 3690–3707. [Google Scholar] [CrossRef]
- Boschetti, L.; Roy, D.; Barbosa, P.; Boca, R.; Justice, C. A MODIS assessment of the summer 2007 extent burned in Greece. Int. J. Remote Sens. 2008, 29, 2433–2436. [Google Scholar] [CrossRef]
- Loboda, T.V.; Hoy, E.E.; Giglio, L.; Kasischke, E.S. Mapping burned area in Alaska using MODIS data: A data limitations-driven modification to the regional burned area algorithm. Int. J. Wildland Fire 2011, 20, 487–496. [Google Scholar] [CrossRef]
- Ruiz, J.A.M.; Lázaro, J.R.G.; Cano, I.D.A.; Leal, P.H. Burned area mapping in the North American boreal forest using terra-MODIS LTDR (2001–2011): A comparison with the MCD45A1, MCD64A1 and BA GEOLAND-2 products. Remote Sens. 2013, 6, 815–840. [Google Scholar] [CrossRef]
- Libonati, R.; DaCamara, C.C.; Setzer, A.W.; Morelli, F.; Melchiori, A.E. An algorithm for burned area detection in the Brazilian Cerrado using 4 μm MODIS imagery. Remote Sens. 2015, 7, 15782–15803. [Google Scholar] [CrossRef]
- Chen, J.; Sheng, S.; Liu, Z. Detection of annual burned forest area using change metrics constructed from MODIS data in Manitoba, Canada. Int. J. Remote Sens. 2015, 36, 3913–3931. [Google Scholar] [CrossRef]
- Chen, D.; Pereira, J.M.C.; Masiero, A.; Pirotti, F. Mapping fire regimes in China using MODIS active fire and burned area data. Appl. Geogr. 2017, 85, 14–26. [Google Scholar] [CrossRef]
- Giglio, L.; Boschetti, L.; Roy, D.P.; Humber, M.L.; Justice, C.O. The collection 6 MODIS burned area mapping algorithm and product. Remote Sens. Environ. 2018, 217, 72–85. [Google Scholar] [CrossRef]
- Moreno-Ruiz, J.A.; García-Lázaro, J.R.; Arbelo, M.; Riaño, D. A comparison of burned area time series in the Alaskan boreal forests from different remote sensing products. Forests 2019, 10, 363. [Google Scholar] [CrossRef]
- García-Lázaro, J.R.; Ruiz, J.A.M.; Riaño, D.; Arbelo, M. Estimation of burned area in the northeastern Siberian boreal forest from a long-term data record (LTDR) 1982–2015 time series. Remote Sens. 2018, 10, 940. [Google Scholar] [CrossRef]
- Davies, D.K.; Ilavajhala, S.; Wong, M.M.; Justice, C.O. Fire information for resource management system: Archiving and distributing MODIS active fire data. IEEE Trans. Geosci. Remote. 2009, 47, 72–79. [Google Scholar] [CrossRef]
- Reddy, C.S.; Bird, N.G.; Sreelakshmi, S.; Manikandan, T.M.; Asra, M.; Krishna, P.H.; Jha, C.S.; Rao, P.V.N.; Diwakar, P.G. Identification and characterization of spatio-temporal hotspots of forest fires in South Asia. Environ. Monit. Assess. 2019, 191, 791. [Google Scholar] [CrossRef]
- Chuvieco, E.; Lizundia-Loiola, J.; Pettinari, M.L.; Ramo, R.; Padilla, M.; Tansey, K.; Mouillot, F.; Laurent, P.; Storm, T.; Heil, A.; et al. Generation and analysis of a new global burned area product based on Modis 250 m reflectance bands and thermal anomalies. Earth Syst. Sci. Data. 2018, 10, 2015–2031. [Google Scholar] [CrossRef]
- Long, T.; Zhang, Z.; He, G.; Jiao, W.; Tang, C.; Wu, B.; Zhang, X.; Wang, G.; Yin, R. 30 m resolution Global Annual Burned Area Mapping Based on Landsat images and Google Earth Engine. Remote Sens. 2019, 11, 489. [Google Scholar] [CrossRef]
- Zhang, Z.; Long, T.; He, G.; Wei, M.; Tang, C.; Wang, W.; Wang, G.; She, W.; Zhang, X. Study on Global burned forest areas based on Landsat data. Photogramm. Eng. Remote Sens. 2020, 86, 503–508. [Google Scholar] [CrossRef]
- Roteta, E.; Bastarrika, A.; Ibisate, A.; Chuvieco, E. A Preliminary Global Automatic Burned-Area Algorithm at Medium Resolution in Google Earth Engine. Remote Sens. 2021, 13, 4298. [Google Scholar] [CrossRef]
- Chuvieco, E.; Opazo, S.; Sione, W.; Valle, H.D.; Anaya, J.; Di Bella, C.; Cruz, I.; Manzo, L.; Lopez, G.; Mari, N.; et al. Global burned-land estimation in Latin America using MODIS composite data. Ecol. Appl. 2008, 18, 64–79. [Google Scholar] [CrossRef] [PubMed]
- Boschetti, L.; Roy, D.P.; Giglio, L.; Huang, H.; Zubkova, M.; Humber, M.L. Global validation of the collection 6 MODIS burned area product. Remote Sens. Environ. 2019, 235, 111490. [Google Scholar] [CrossRef]
- Oliva, P.; Schroeder, W. Assessment of VIIRS 375 m active fire detection product for direct burned area mapping. Remote Sens. Environ. 2015, 160, 144–155. [Google Scholar] [CrossRef]
- Olofsson, P.; Foody, G.M.; Herold, M.; Stehman, S.V.; Woodcock, C.E.; Wulder, M.A. Good practices for estimating area and assessing accuracy of land change. Remote Sens. Environ. 2014, 148, 42–57. [Google Scholar] [CrossRef]
- Boschetti, L.; Stehman, S.V.; Roy, D.P. A stratified random sampling design in space and time for regional to global scale burned area product validation. Remote Sens. Environ. 2016, 186, 465–478. [Google Scholar] [CrossRef]
- Padilla, M.; Olofsson, P.; Stehman, S.V.; Tansey, K.; Chuvieco, E. Stratification and sample allocation for reference burned area data. Remote Sens. Environ. 2017, 203, 240–255. [Google Scholar] [CrossRef]
- Bourgeau-Chavez, L.L.; Kasischke, E.S.; Brunzell, S.; Mudd, J.P.; Tukman, M. Mapping fire scars in global boreal forests using imaging radar data. Int. J. Remote Sens. 2002, 23, 4211–4234. [Google Scholar] [CrossRef]
- Tansey, K.; Gre´goire, J.-M.; Stroppiana, D.; Sousa, A.; Silva, J.; Pereira, J.M.C.; Boschetti, L.; Maggi, M.; Brivio, P.A.; Fraser, R.; et al. Vegetation burning in the year 2000: Global burned area estimates from SPOT VEGETATION data. J. Geophys. Res. D Atmos. 2004, 109, D14S03. [Google Scholar] [CrossRef]
- Ruiz, J.A.M.; Riaño, D.; Arbelo, M.; French, N.H.F.; Ustin, S.L.; Whiting, M.L. Burned area mapping time series in Canada (1984–1999) from NOAA-AVHRR LTDR: A comparison with other remote sensing products and fire perimeters. Remote Sens. Environ. 2012, 117, 407–414. [Google Scholar] [CrossRef]
- Fornacca, D.; Ren, G.; Xiao, W. Performance of three MODIS Fire products (MCD45A1, MCD64A1, MCD14ML), and ESA Fire_CCI in a mountainous area of Northwest Yunnan, China, characterized by frequent small fires. Remote Sens. 2017, 9, 1131. [Google Scholar] [CrossRef]
- Humber, M.L.; Boschetti, L.; Giglio, L.; Justice, C.O. Spatial and temporal intercomparison of four global burned area products. Int. J. Digit. Earth 2018, 12, 460–484. [Google Scholar] [CrossRef] [PubMed]
- Lizundia-Loiola, J.; Pettinari, M.L.; Chuvieco, E. Temporal anomalies in burned area trends: Satellite estimations of the Amazonian 2019 fire crisis. Remote Sens. 2020, 12, 151. [Google Scholar] [CrossRef]
- Tanase, M.A.; Belenguer-Plomer, M.A.; Roteta, E.; Bastarrika, A.; Wheeler, J.; Fernández-Carrillo, Á.; Tansey, K.; Wiedemann, W.; Navratil, P.; Lohberger, S.; et al. Burned area detection and mapping: Intercomparison of Sentinel-1 and Sentinel-2 based algorithms over tropical Africa. Remote Sens. 2020, 12, 334. [Google Scholar] [CrossRef]
- Padilla, M.; Stehman, S.V.; Ramo, R.; Corti, D.; Hantson, S.; Oliva, P.; Alonso-Canas, I.; Bradley, A.V.; Tansey, K.; Mota, B.; et al. Comparing the accuracies of remote sensing global burned area products using stratified random sampling and estimation. Remote Sens. Environ. 2015, 160, 114–121. [Google Scholar] [CrossRef]
- Pessôa, A.C.M.; Anderson, L.O.; Carvalho, N.S.; Campanharo, W.A.; Junior, C.H.L.S.; Rosan, T.M.; Reis, J.B.C.; Pereira, F.R.S.; Assis, M.; Jacon, A.D.; et al. Intercomparison of burned area products and its implication for carbon emission estimations in the Amazon. Remote Sens. 2020, 12, 3864. [Google Scholar] [CrossRef]
- Key, C.H.; Benson, N.C. Landscape Assessment (LA). In FIREMON Fire Effects Monitoring and Inventory System; Gen Tech Rep RMRS-GTR-164-CD; Lutes, D.C., Keane, R.E., Caratti, J.F., Key, C.H., Benson, N.C., Sutherl, S., Gangi, L.J., Eds.; Department of Agriculture, Forest Service, Rocky Mountain Research Station: Fort Collins, CO, USA, 2006; Volume 164, p. LA-1-55. [Google Scholar]
- Lentile, L.B.; Holden, Z.A.; Smith, A.M.S.; Falkowski, M.J.; Hudak, A.T.; Morgan, P.; Lewis, S.A.; Gessler, P.E.; Benson, N.C. Remote sensing techniques to assess active fire characteristics and post-fire effects. Int. J. Wildland Fire 2006, 15, 319–345. [Google Scholar] [CrossRef]
- Barrett, K.; Kasischke, E.S.; McGuire, A.D.; Turetsky, M.R.; Kane, E.S. Modeling fire severity in black spruce stands in the Alaskan boreal forest using spectral and non-spectral geospatial data. Remote Sens. Environ. 2010, 114, 1494–1503. [Google Scholar] [CrossRef]
- Robichaud, P.R.; Lewis, S.A.; Laes, D.Y.M.; Hudad, A.T.; Kokaly, R.F.; Zamudio, J.A. Post-fire soil burn severity mapping with hyperspectral image unmixing. Remote Sens. Environ. 2007, 108, 467–480. [Google Scholar] [CrossRef]
- Sobrino, J.; Llorens, R.; Fernández, C.; Fernández-Alonso, J.; Vega, J. Relationship between soil burn severity in forest fires measured in situ and through spectral indices of remote detection. Forests 2019, 10, 457. [Google Scholar] [CrossRef]
- Kasischke, E.S.; Turetsky, M.R.; Ottmar, R.D.; French, N.H.F.; Hoy, E.E.; Kane, E.S. Evaluation of the composite burn index for assessing fire severity in Alaskan black spruce forests. Int. J. Wildland Fire 2008, 17, 515–526. [Google Scholar] [CrossRef]
- Holden, Z.A.; Morgan, P.; Crimmins, M.A.; Steinhorst, R.K.; Smith, A.M.S. Fire season precipitation variability influences fire extent and severity in a large southwestern wilderness area, United States. Geophys. Res. Lett. 2007, 34, L16708. [Google Scholar] [CrossRef]
- Wylie, B.K.; Zhang, L.; Bliss, N.; Ji, L.; Tieszen, L.L.; Jolly, W.M. Integrating modelling and remote sensing to identify ecosystem performance anomalies in the boreal forest, Yukon river basin, Alaska. Int. J. Digit. Earth 2008, 1, 196–220. [Google Scholar] [CrossRef]
- Picotte, J.J.; Robertson, K.M. Validation of remote sensing of burn severity in south-eastern US ecosystems. Int. J. Wildland Fire 2011, 20, 453–464. [Google Scholar] [CrossRef]
- Tanase, M.A.; Kennedy, R.; Aponte, C. Fire severity estimation from space: A comparison of active and passive sensors and their synergy for different forest types. Int. J. Wildland Fire 2015, 24, 1062–1075. [Google Scholar] [CrossRef]
- Quintano, C.; Fernández-Manso, A.; Calvo, L.; Marcos, E.; Valbuena, L. Land surface temperature as potential indicator of burn severity in forest Mediterranean ecosystems. Int. J. Appl. Earth Obs. Geoinf. 2015, 36, 1–12. [Google Scholar] [CrossRef]
- Chang, Y.; Zhu, Z.; Feng, Y.; Li, Y.; Bu, R.; Hu, Y. The spatial variation in forest burn severity in Heilongjiang Province, China. Nat. Hazards 2016, 81, 981–1001. [Google Scholar] [CrossRef]
- Zheng, Z.; Zeng, Y.; Li, S.; Huang, W. A new burn severity index based on land surface temperature and enhanced vegetation index. Int. J. Appl. Earth Obs. Geoinf. 2016, 45, 84–94. [Google Scholar] [CrossRef]
- Dragozi, E.; Gitas, I.Z.; Bajocco, S.; Stavrakoudis, D.G. Exploring the relationship between burn severity field data and very high resolution GeoEye images: The Case of the 2011 Evros wildfire in Greece. Remote Sens. 2016, 8, 566. [Google Scholar] [CrossRef]
- Warner, T.A.; Skowronski, N.S.; Gallagher, M.R. High spatial resolution burn severity mapping of the New Jersey Pine Barrens with WorldView-3 near-infrared and shortwave infrared imagery. Int. J. Remote Sens. 2017, 38, 598–616. [Google Scholar] [CrossRef]
- Addison, P.; Oommen, T. Utilizing satellite radar remote sensing for burn severity estimation. Int. J. Appl. Earth Obs. Geoinf. 2018, 73, 292–299. [Google Scholar] [CrossRef]
- Michael, Y.; Lensky, I.M.; Brenner, S.; Tchetchik, A.; Tessler, N.; Helman, D. Economic assessment of fire damage to urban forest in the wildland–urban interface using Planet Satellites constellation images. Remote Sens. 2018, 10, 1479. [Google Scholar] [CrossRef]
- Nigro, K.; Molinari, N. Status and trends of fire activity in southern California yellow pine and mixed conifer forests. For. Ecol. Manag. 2019, 441, 20–31. [Google Scholar] [CrossRef]
- Quintano, C.; Fernandez-Manso, A.; Marcos, E.; Calvo, L. Burn severity and post-fire land surface albedo relationship in Mediterranean forest ecosystems. Remote Sens. 2019, 11, 2309. [Google Scholar] [CrossRef]
- Xu, W.; He, H.S.; Hawbaker, T.J.; Zhu, Z.; Henne, P.D. Estimating burn severity and carbon emissions from a historic megafire in boreal forests of China. Sci. Total Environ. 2020, 716, 136534. [Google Scholar] [CrossRef]
- Fernández-Guisuraga, J.M.; Calvo, L.; Suárez-Seoane, S. Comparison of pixel unmixing models in the evaluation of post-fire forest resilience based on temporal series of satellite imagery at moderate and very high spatial resolution. ISPRS J. Photogramm. Remote Sens. 2020, 164, 217–228. [Google Scholar] [CrossRef]
- De Santis, A.; Chuvieco, E. Burn severity estimation from remotely sensed data: Performance of simulation versus empirical models. Remote Sens. Environ. 2007, 108, 422–435. [Google Scholar] [CrossRef]
- De Santis, A.; Chuvieco, E. GeoCBI: A modified version of the Composite Burn Index for the initial assessment of the short-term burn severity from remotely sensed data. Remote Sens. Environ. 2009, 113, 554–562. [Google Scholar] [CrossRef]
- De Santis, A.; Asner, G.P.; Vaughan, P.J.; Knapp, D.E. Mapping burn severity and burning efficiency in California using simulation models and Landsat imagery. Remote Sens. Environ. 2010, 114, 1535–1545. [Google Scholar] [CrossRef]
- Veraverbeke, S.; Lhermitte, S.; Verstraeten, W.; Goossens, R. A time-integrated MODIS burn severity assessment using the multi-temporal differenced normalized burn ratio (dNBRMT). Int. J. Appl. Earth Obs. Geoinf. 2011, 13, 52–58. [Google Scholar] [CrossRef]
- de la Barrera, F.; Barraza, F.; Favier, P.; Ruiz, V.; Quense, J. Megafires in Chile 2017: Monitoring multiscale environmental impacts of burned ecosystems. Sci. Total Environ. 2018, 637, 1526–1536. [Google Scholar] [CrossRef] [PubMed]
- He, Y.; Chen, G.; De Santis, A.; Roberts, D.A.; Zhou, Y.; Meentemeyer, R.K. A disturbance weighting analysis model (DWAM) for mapping wildfire burn severity in the presence of forest disease. Remote Sens. Environ. 2019, 221, 108–121. [Google Scholar] [CrossRef]
- Boer, M.M.; Macfarlane, C.; Norris, J.; Sadler, R.J.; Wallace, J.; Grierson, P.F. Mapping burned areas and burn severity patterns in SW Australian eucalypt forest using remotely-sensed changes in leaf area index. Remote Sens. Environ. 2008, 112, 4358–4369. [Google Scholar] [CrossRef]
- Franks, S.; Masek, J.G.; Turner, M.G. Monitoring forest regrowth following large scale fire using satellite data: A case study of Yellowstone National Park, USA. Eur. J. Remote Sens. 2013, 46, 561–569. [Google Scholar] [CrossRef]
- de Almeida, D.R.A.; Nelson, B.W.; Schietti, J.; Gorgens, E.B.; Resende, A.F.; Stark, S.C.; Valbuena, R. Contrasting fire damage and fire susceptibility between seasonally flooded forest and upland forest in the Central Amazon using portable profiling LiDAR. Remote Sens. Environ. 2016, 184, 153–160. [Google Scholar] [CrossRef]
- Filipponi, F. Exploitation of Sentinel-2 time series to map burned areas at the national level: A case study on the 2017 Italy wildfires. Remote Sens. 2019, 11, 622. [Google Scholar] [CrossRef]
- French, N.H.F.; Graham, J.; Whitman, E.; Bourgeau-Chavez, L.L. Quantifying surface severity of the 2014 and 2015 fires in the Great Slave Lake area of Canada. Int. J. Wildland Fire 2020, 29, 892–906. [Google Scholar] [CrossRef]
- Zheng, Z.; Wang, J.; Shan, B.; He, Y.; Liao, C.; Gao, Y.; Yang, S. A new model for transfer learning-based mapping of burn severity. Remote Sens. 2020, 12, 708. [Google Scholar] [CrossRef]
- Soverel, N.O.; Perrakis, D.D.B.; Coops, N.C. Estimating burn severity from Landsat dNBR and RdNBR indices across western Canada. Remote Sens. Environ. 2010, 114, 1896–1909. [Google Scholar] [CrossRef]
- Hall, R.J.; Freeburn, J.T.; de Groot, W.J.; Pritchard, J.M.; Lynham, T.J.; Landry, R. Remote sensing of burn severity: Experience from western Canada boreal fires. Int. J. Wildland Fire 2008, 17, 476–489. [Google Scholar] [CrossRef]
- Ireland, G.; Petropoulos, G.P. Exploring the relationships between post-fire vegetation regeneration dynamics, topography and burn severity: A case study from the Montane Cordillera Ecozones of Western Canada. Appl. Geogr. 2015, 56, 232–248. [Google Scholar] [CrossRef]
- Tran, B.N.; Tanase, M.A.; Bennett, L.T.; Aponte, C. Evaluation of spectral indices for assessing fire severity in Australian temperate forests. Remote Sens. 2018, 10, 1680. [Google Scholar] [CrossRef]
- Ressl, R.; Lopez, G.; Cruz, I.; Colditz, R.R.; Schmidt, M.; Ressl, S.; Jiménez, R. Operational active fire mapping and burnt area identification applicable to Mexican Nature Protection Areas using MODIS and NOAA-AVHRR direct readout data. Remote Sens. Environ. 2009, 113, 1113–1126. [Google Scholar] [CrossRef]
- Cocke, A.E.; Fulé, P.Z.; Crouse, J.E. Comparison of burn severity assessments using Differenced Normalized Burn Ratio and ground data. Int. J. Wildland Fire 2005, 14, 189–198. [Google Scholar] [CrossRef]
- Kokaly, R.F.; Rockwell, B.W.; Haire, S.L.; King, T.V.V. Characterization of post-fire surface cover, soils, and burn severity at the Cerro Grande Fire, New Mexico, using hyperspectral and multispectral remote sensing. Remote Sens. Environ. 2007, 106, 305–325. [Google Scholar] [CrossRef]
- Loboda, T.; O’Neal, K.J.; Csiszar, I. Regionally adaptable dNBR-based algorithm for burned area mapping from MODIS data. Remote Sens. Environ. 2007, 109, 429–442. [Google Scholar] [CrossRef]
- Allen, J.L.; Sorbel, B. Assessing the differenced Normalized Burn Ratio’s ability to map burn severity in the boreal forest and tundra ecosystems of Alaska’s national parks. Int. J. Wildland Fire 2008, 17, 463–475. [Google Scholar] [CrossRef]
- van Wagtendonk, J.W.; Root, R.R.; Key, C.H. Comparison of AVIRIS and Landsat ETM+ detection capabilities for burn severity. Remote Sens. Environ. 2004, 92, 397–408. [Google Scholar] [CrossRef]
- Burton, P.J.; Parisien, M.A.; Hicke, J.A.; Hall, R.J.; Freeburn, J.T. Large fires as agents of ecological diversity in the North American boreal forest. Int. J. Wildland Fire 2008, 17, 754–767. [Google Scholar] [CrossRef]
- García-Martín, A.; Pérez-Cabello, F.; de la Riva Fernández, J.; Llovería, R.M. Estimation of crown biomass of Pinus spp. from Landsat TM and its effect on burn severity in a Spanish fire scar. IEEE J. Sel. Top. Appl. Earth Obs. Remote Sens. 2008, 1, 254–265. [Google Scholar] [CrossRef]
- Godwin, D.R.; Kobziar, L.N. Comparison of burn severities of consecutive large-scale fires in Florida sand pine scrubusing satellite imagery analysis. Fire Ecol. 2011, 7, 99–113. [Google Scholar] [CrossRef]
- Picotte, J.J.; Robertson, K. Timing constraints on remote sensing of wildland fire burned area in the southeastern US. Remote Sens. 2011, 3, 1680–1690. [Google Scholar] [CrossRef]
- Eidenshink, J.C.; Schwind, B.; Brewer, K.; Zhu, Z.L.; Quayle, B.; Howard, S.M. A project for monitoring trends in burn severity. Fire Ecol. 2007, 3, 3–21. [Google Scholar] [CrossRef]
- Tian, L.; Wang, J.; Zhou, H.; Wang, J. Automatic detection of forest fire disturbance based on dynamic modelling from MODIS time-series observations. Int. J. Remote Sens. 2018, 39, 3801–3815. [Google Scholar] [CrossRef]
- Salguero, J.; Li, J.; Farahmand, A.; Reager, J.T. Wildfire trend analysis over the contiguous United States using remote sensing observations. Remote Sens. 2020, 12, 2565. [Google Scholar] [CrossRef]
- Franco, M.G.; Mundo, I.A.; Veblen, T.T. Field-validated burn-severity napping in north Patagonian forests. Remote Sens. 2020, 12, 214. [Google Scholar] [CrossRef]
- Epting, J.; Verbyla, D.; Sorbel, B. Evaluation of remotely sensed indices for assessing burn severity in interior Alaska using Landsat TM and ETM+. Remote Sens. Environ. 2005, 96, 328–339. [Google Scholar] [CrossRef]
- Miller, J.D.; Thode, A.E. Quantifying burn severity in a heterogeneous landscape with a relative version of the delta Normalized Burn Ratio (dNBR). Remote Sens. Environ. 2007, 109, 66–80. [Google Scholar] [CrossRef]
- Potter, C. Ten years of forest cover change in the Sierra Nevada detected using Landsat satellite image analysis. Int. J. Remote Sens. 2014, 35, 7136–7153. [Google Scholar] [CrossRef]
- Miller, J.D.; Quayle, B. Calibration and validation of immediate post-fire satellite-derived data to three severity metrics. Fire Ecol. 2015, 11, 12–30. [Google Scholar] [CrossRef]
- Cansler, C.A.; McKenzie, D. How robust are burn severity indices when applied in a new region? Evaluation of alternate field-based and remote-sensing methods. Remote Sens. 2012, 4, 456–483. [Google Scholar] [CrossRef]
- Norton, J.; Glenn, N.; Germino, M.; Weber, K.; Seefeldt, S. Relative suitability of indices derived from Landsat ETM+ and SPOT 5 for detecting fire severity in sagebrush steppe. Int. J. Appl. Earth Obs. Geoinf. 2009, 11, 360–367. [Google Scholar] [CrossRef]
- Hoy, E.E.; French, N.H.F.; Turetsky, M.R.; Trigg, S.N.; Kasischke, E.S. Evaluating the potential of Landsat TM/ETM+ imagery for assessing fire severity in Alaskan black spruce forests. Int. J. Wildland Fire 2008, 17, 500–514. [Google Scholar] [CrossRef]
- Miller, J.D.; Knapp, E.E.; Key, C.H.; Skinner, C.N.; Isbell, C.J.; Creasy, R.M.; Sherlock, J.W. Calibration and validation of the relative differenced Normalized Burn Ratio (RdNBR) to three measures of fire severity in the Sierra Nevada and Klamath Mountains, California, USA. Remote Sens. Environ. 2009, 113, 645–656. [Google Scholar] [CrossRef]
- Murphy, K.A.; Reynolds, J.H.; Koltun, J.M. Evaluating the ability of the differenced Normalized Burn Ratio (dNBR) to predict ecologically significant burn severity in Alaskan boreal forests. Int. J. Wildland Fire 2008, 17, 490–499. [Google Scholar] [CrossRef]
- Verbyla, D.L.; Kasischke, E.S.; Hoy, E.E. Seasonal and topographic effects on estimating fire severity from Landsat TM/ETM+ data. Int. J. Wildland Fire 2008, 17, 527–534. [Google Scholar] [CrossRef]
- Cai, L.; Wang, M. Is the RdNBR a better estimator of wildfire burn severity than the dNBR? A discussion and case study in southeast China. Geocarto Int. 2022, 37, 758–772. [Google Scholar] [CrossRef]
- Parks, S.A.; Dillon, G.K.; Miller, C. A new metric for quantifying burn severity: The relativized burn ratio. Remote Sens. 2014, 6, 1827–1844. [Google Scholar] [CrossRef]
- Viedma, O.; Chico, F.; Fernández, J.J.; Madrigal, C.; Safford, H.D.; Moreno, J.M. Disentangling the role of prefire vegetation vs. burning conditions on fire severity in a large forest fire in SE Spain. Remote Sens. Environ. 2020, 247, 111891. [Google Scholar] [CrossRef]
- Harvey, B.J.; Andrus, R.A.; Anderson, S.C. Incorporating biophysical gradients and uncertainty into burn severity maps in a temperate fire-prone forested region. Ecosphere 2019, 10, e02600. [Google Scholar] [CrossRef]
- Gallagher, M.R.; Skowronski, N.S.; Lathrop, R.G.; McWilliams, T.; Green, E.J. An improved approach for selecting and validating burn severity indices in forested landscapes. Can. J. Remote Sens. 2020, 46, 100–111. [Google Scholar] [CrossRef]
- Loboda, T.V.; French, N.H.F.; Hight-Harf, C.; Jenkins, L.; Miller, M.E. Mapping fire extent and burn severity in Alaskan tussock tundra: An analysis of the spectral response of tundra vegetation to wildland fire. Remote Sens. Environ. 2013, 134, 194–209. [Google Scholar] [CrossRef]
- Mallinis, G.; Mitsopoulos, I.; Chrysafi, I. Evaluating and comparing Sentinel 2A and Landsat-8 operational land imager (OLI) spectral indices for estimating fire severity in a Mediterranean pine ecosystem of Greece. GIScience Remote Sens. 2018, 55, 1–18. [Google Scholar] [CrossRef]
- Fernández-García, V.; Santamarta, M.; Fernández-Manso, A.; Quintano, C.; Marcos, E.; Calvo, L. Burn severity metrics in fire-prone pine ecosystems along a climatic gradient using Landsat imagery. Remote Sens. Environ. 2018, 206, 205–217. [Google Scholar] [CrossRef]
- Lambin, E.F.; Goyvaerts, K.; Petit, C. Remotely-sensed indicators of burning efficiency of savannah and forest fires. Int. J. Remote Sens. 2003, 24, 3105–3118. [Google Scholar] [CrossRef]
- Lyons, E.; Jin, Y.; Randerson, J. Changes in surface albedo after fire in boreal forest ecosystems of interior Alaska assessed using MODIS satellite observations. J. Geophys. Res. Biogeosci. 2008, 113, G02012. [Google Scholar] [CrossRef]
- Veraverbeke, S.; Verstraeten, W.W.; Lhermitte, S.; Van De Kerchove, R.; Goossens, R. Assessment of post-fire changes in land surface temperature and surface albedo, and their relation with fire—Burn severity using multitemporal MODIS imagery. Int. J. Wildland Fire 2012, 21, 243–256. [Google Scholar] [CrossRef]
- Vlassova, L.; Pérez-Cabello, F.; Mimbrero, M.R.; Llovería, R.M.; García-Martín, A. Analysis of the relationship between land surface temperature and wildfire severity in a series of Landsat images. Remote Sens. 2014, 6, 6136–6162. [Google Scholar] [CrossRef]
- Chen, D.; Loboda, T.V. Surface forcing of non-stand-replacing fires in Siberian larch forests. Environ. Res. Lett. 2018, 13, 045008. [Google Scholar] [CrossRef]
- Mota, B.; Gobron, N.; Cappucci, F.; Morgan, O. Burned area and surface albedo products: Assessment of change consistency at global scale. Remote Sens. Environ. 2019, 225, 249–266. [Google Scholar] [CrossRef]
- Shvetsov, E.G.; Ponomarev, E.I. Postfire effects in Siberian larch stands on multispectral satellite data. Contemp. Probl. Ecol. 2020, 13, 104–112. [Google Scholar] [CrossRef]
- Harris, S.; Veraverbeke, S.; Hook, S. Evaluating spectral indices for assessing fire severity in chaparral ecosystems (Southern California) using MODIS/ASTER (MASTER) airborne simulator data. Remote Sens. 2011, 3, 2403–2419. [Google Scholar] [CrossRef]
- Maffei, C.; Alfieri, S.M.; Menenti, M. Relating spatiotemporal patterns of forest fires burned area and duration to diurnal land surface temperature anomalies. Remote Sens. 2018, 10, 1777. [Google Scholar] [CrossRef]
- Couturier, S.; Taylor, D.; Siegert, F.; Hoffmann, A.; Bao, M.Q. ERS SAR backscatter: A potential real-time indicator of the proneness of modified rainforests to fire. Remote Sens. Environ. 2001, 76, 410–417. [Google Scholar] [CrossRef]
- Gimeno, M.; San-Miguel-Ayanz, J.; Schmuck, G. Identification of burnt areas in Mediterranean forest environments from ERS-2 SAR time series. Int. J. Remote Sens. 2004, 25, 4873–4888. [Google Scholar] [CrossRef]
- Minchella, A.; Del Frate, F.; Capogna, F.; Anselmi, S.; Manes, F. Use of multitemporal SAR data for monitoring vegetation recovery of Mediterranean burned areas. Remote Sens. Environ. 2009, 113, 588–597. [Google Scholar] [CrossRef]
- Polychronaki, A.; Gitas, I.Z.; Veraverbeke, S.; Debien, A. Evaluation of ALOS PALSAR Imagery for Burned Area Mapping in Greece Using Object-Based Classification. Remote Sens. 2013, 5, 5680–5701. [Google Scholar] [CrossRef]
- Tanase, M.A.; Santoro, M.; Wegmüller, U.; de la Riva, J.; Pérez-Cabello, F. Properties of X-, C-and L-band repeat-pass interferometric SAR coherence in Mediterranean pine forests affected by fires. Remote Sens. Environ. 2010, 114, 2182–2194. [Google Scholar] [CrossRef]
- Mari, N.; Laneve, G.; Cadau, E.; Porcasi, X. Fire damage assessment in Sardinia: The use of ALOS/PALSAR data for post fire effects management. Eur. J. Remote Sens. 2012, 45, 233–241. [Google Scholar] [CrossRef]
- Gimeno, M.; San-Miguel-Ayanz, J. Evaluation of RADARSAT-1 data for identification of burnt areas in Southern Europe. Remote Sens. Environ. 2004, 92, 370–375. [Google Scholar] [CrossRef]
- Malenovský, Z.; Rott, H.; Cihlar, J.; Schaepman, M.E.; García-Santos, G.; Fernandes, R.; Berger, M. Sentinels for science: Potential of Sentinel-1, -2, and -3 missions for scientific observations of ocean, cryosphere, and land. Remote Sens. Environ. 2012, 120, 91–101. [Google Scholar] [CrossRef]
- Belenguer-Plomer, M.A.; Tanase, M.A.; Fernandez-Carrillo, A.; Chuvieco, E. Burned area detection and mapping using Sentinel-1 backscatter coefficient and thermal anomalies. Remote Sens. Environ. 2019, 233, 111345. [Google Scholar] [CrossRef]
- Engelbrecht, J.; Theron, A.; Vhengani, L.; Kemp, J. A simple normalized difference approach to burnt area mapping using multi-polarisation C-Band SAR. Remote Sens. 2017, 9, 764. [Google Scholar] [CrossRef]
- Goetz, S.J.; Sunt, M.; Baccini, A.; Beck, P.S.A. Synergistic use of spaceborne lidar and optical imagery for assessing forest disturbance: An Alaska case study. J. Geophys. Res. Biogeosci. 2010, 115, G00E07. [Google Scholar] [CrossRef]
- Beck, P.S.A.; Goetz, S.J.; Mack, M.C.; Alexander, H.D.; Jin, Y.; Randerson, J.T.; Loranty, M.M. The impacts and implications of an intensifying fire regime on Alaskan boreal forest composition and albedo. Glob. Change Biol. 2011, 17, 2853–2866. [Google Scholar] [CrossRef]
- Martín-Alcón, S.; Coll, L.; De Cáceres, M.; Guitart, L.; Cabré, M.; Just, A.; González-Olabarría, J.R. Combining aerial LiDAR and multispectral imagery to assess postfire regeneration types in a Mediterranean forest. Can. J. For. Res. 2015, 45, 856–866. [Google Scholar] [CrossRef]
- Bolton, D.K.; Coops, N.C.; Wulder, M.A. Characterizing residual structure and forest recovery following high-severity fire in the western boreal of Canada using Landsat time-series and airborne LiDAR data. Remote Sens. Environ. 2015, 163, 48–60. [Google Scholar] [CrossRef]
- Wulder, M.A.; White, J.C.; Alvarez, F.; Han, T.; Rogan, J.; Hawkes, B. Characterizing boreal forest wildfire with multi-temporal Landsat and LIDAR data. Remote Sens. Environ. 2009, 113, 1540–1555. [Google Scholar] [CrossRef]
- Kane, V.R.; North, M.P.; Lutz, J.A.; Churchill, D.J.; Roberts, S.L.; Smith, D.F.; McGaughey, R.J.; Kane, J.T.; Brooks, M.L. Assessing fire effects on forest spatial structure using a fusion of Landsat and airborne LiDAR data in Yosemite National Park. Remote Sens. Environ. 2014, 151, 89–101. [Google Scholar] [CrossRef]
- Fernandez-Manso, A.; Quintano, C.; Roberts, D.A. Burn severity analysis in Mediterranean forests using maximum entropy model trained with EO-1 Hyperion and LiDAR data. ISPRS J. Photogramm. Remote Sens. 2019, 155, 102–118. [Google Scholar] [CrossRef]
- García-Llamas, P.; Suárez-Seoane, S.; Taboada, A.; Marcos, E.; Fernández-Manso, A.; Quintano, C.; Fernández-García, V.; Fernández-Guisuraga, J.M.; Calvo, L. Environmental drivers of fire severity in extreme fire events that affect Mediterranean pine forest ecosystems. For. Ecol. Manag. 2019, 433, 24–32. [Google Scholar] [CrossRef]
- McCarley, T.R.; Kolden, C.A.; Vaillant, N.M.; Hudak, A.T.; Smith, A.M.S.; Wing, B.M.; Kellogg, B.S.; Kreitler, J. Multi-temporal LiDAR and Landsat quantification of fire-induced changes to forest structure. Remote Sens. Environ. 2017, 191, 419–432. [Google Scholar] [CrossRef]
- Meng, R.; Wu, J.; Schwager, K.L.; Zhao, F.; Dennison, P.E.; Cook, B.D.; Brewster, K.; Green, T.M.; Serbin, S.P. Using high spatial resolution satellite imagery to map forest burn severity across spatial scales in a Pine Barrens ecosystem. Remote Sens. Environ. 2017, 191, 95–109. [Google Scholar] [CrossRef]
- Bishop, B.D.; Dietterick, B.C.; White, R.A.; Mastin, T.B. Classification of plot-level fire-caused tree mortality in a redwood forest using digital orthophotography and LiDAR. Remote Sens. 2014, 6, 1954–1972. [Google Scholar] [CrossRef]
- Montealegre, A.L.; Lamelas, M.T.; Tanase, M.A.; De la Riva, J. Forest fire severity assessment using ALS data in a Mediterranean environment. Remote Sens. 2014, 6, 4240–4265. [Google Scholar] [CrossRef]
- Liu, M.; Popescu, S.; Malambo, L. Feasibility of burned area mapping based on ICESAT-2 photon counting data. Remote Sens. 2020, 12, 24. [Google Scholar] [CrossRef]
- Brewer, C.K.; Winne, J.C.; Redmond, R.L.; Opitz, D.W.; Mangrich, M.V. Classifying and mapping wildfire severity: A comparison of methods. Photogramm. Eng. Remote Sens. 2005, 71, 1311–1320. [Google Scholar] [CrossRef]
- Bryukhanov, A.V.; Panov, A.V.; Ponomarev, E.I.; Sidenko, N.V. Wildfire impact on the main tree species of the Near-Yenisei Siberia. Izv. Atmos. Ocean. Phys. 2018, 54, 1525–1533. [Google Scholar] [CrossRef]
- Malak, D.A.; Pausas, J.G. Fire regime and post-fire Normalized Difference Vegetation Index changes in the eastern Iberian peninsula (Mediterranean basin). Int. J. Wildland Fire 2006, 15, 407–413. [Google Scholar] [CrossRef]
- Veraverbeke, S.; Gitas, I.; Katagis, T.; Polychronaki, A.; Somers, B.; Goossens, R. Assessing post-fire vegetation recovery using red-near infrared vegetation indices: Accounting for background and vegetation variability. ISPRS J. Photogramm. Remote Sens. 2012, 68, 28–39. [Google Scholar] [CrossRef]
- Fernandez-Manso, A.; Quintano, C.; Roberts, D.A. Burn severity influence on post-fire vegetation cover resilience from Landsat MESMA fraction images time series in Mediterranean forest ecosystems. Remote Sens. Environ. 2016, 184, 112–123. [Google Scholar] [CrossRef]
- Fernández-Guisuraga, J.M.; Suárez-Seoane, S.; Calvo, L. Modeling Pinus pinaster forest structure after a large wildfire using remote sensing data at high spatial resolution. For. Ecol. Manag. 2019, 446, 257–271. [Google Scholar] [CrossRef]
- Kotel’nikov, R.V.; Lupyan, E.A.; Bartalev, S.A.; Ershov, D.V. Space monitoring of forest fires: History of the creation and development of ISDM-Rosleskhoz. Contemp. Probl. Ecol. 2020, 13, 795–802. [Google Scholar] [CrossRef]
- Crist, E.P.; Cicone, R.C. A physically-based transformation of thematic mapper data—The TM tasseled cap. IEEE Trans. Geosci. Remote Sens. 1984, GE-22, 256–263. [Google Scholar] [CrossRef]
- Collins, J.B.; Woodcock, C.E. An assessment of several linear change detection techniques for mapping forest mortality using multitemporal Landsat TM data. Remote Sens. Environ. 1996, 56, 66–77. [Google Scholar] [CrossRef]
- Healey, S.P.; Cohen, W.B.; Zhiqiang, Y.; Krankina, O.N. Comparison of tasseled cap-based Landsat data structures for use in forest disturbance detection. Remote Sens. Environ. 2005, 97, 301–310. [Google Scholar] [CrossRef]
- Song, C.; Schroeder, T.A.; Cohen, W.B. Predicting temperate conifer forest successional stage distributions with multitemporal Landsat Thematic Mapper imagery. Remote Sens. Environ. 2007, 106, 228–237. [Google Scholar] [CrossRef]
- Masek, J.G.; Huang, C.; Wolfe, R.; Cohen, W.; Hall, F.; Kutler, J.; Nelson, P. North American forest disturbance mapped from a decadal Landsat record. Remote Sens. Environ. 2008, 112, 2914–2926. [Google Scholar] [CrossRef]
- Liu, W.; Song, C.; Schroeder, T.A.; Cohen, W.B. Predicting forest successional stages using multitemporal Landsat imagery with forest inventory and analysis data. Int. J. Remote Sens. 2008, 29, 3855–3872. [Google Scholar] [CrossRef]
- Petrakis, R.E.; Villarreal, M.L.; Wu, Z.; Hetzler, R.; Middleton, B.R.; Norman, L.M. Evaluating and monitoring forest fuel treatments using remote sensing applications in Arizona, U.S.A. For. Ecol. Manag. 2018, 413, 48–61. [Google Scholar] [CrossRef]
- Dunn, C.J.; O’Connor, C.D.; Reilly, M.J.; Calkin, D.E.; Thompson, M.P. Spatial and temporal assessment of responder exposure to snag hazards in post-fire environments. For. Ecol. Manag. 2019, 441, 202–214. [Google Scholar] [CrossRef]
- Storey, E.A. Postfire evaluation of fuelwood loss and restoration priority in a mixed, community-managed conifer forest of central New Mexico, United States. Appl. Geogr. 2020, 117, 102182. [Google Scholar] [CrossRef]
- Hicke, J.A.; Asner, G.P.; Kasischke, E.S.; French, N.H.F.; Randerson, J.T.; Collatz, G.J.; Stocks, B.J.; Compton, J.T.; Tucker, C.J.; Los, S.O.; et al. Postfire response of North American boreal forest net primary productivity analyzed with satellite observations. Glob. Change Biol. 2003, 9, 1145–1157. [Google Scholar] [CrossRef]
- Goetz, S.J.; Fiske, G.J.; Bunn, A.G. Using satellite time-series data sets to analyze fire disturbance and forest recovery across Canada. Remote Sens. Environ. 2006, 101, 352–365. [Google Scholar] [CrossRef]
- Cuevas-Gonzalez, M.; Gerard, F.; Balzter, H.; Riano, D. Studying the change in fAPAR after forest fires in Siberia using MODIS. Int. J. Remote Sens. 2008, 29, 6873–6892. [Google Scholar] [CrossRef]
- Epting, J.; Verbyla, D. Landscape-level interactions of prefire vegetation, burn severity, and postfire vegetation over a 16-year period in interior Alaska. Can. J. For. Res. 2005, 35, 1367–1377. [Google Scholar] [CrossRef]
- Frazier, R.J.; Coops, N.C.; Wulder, M.A.; Hermosilla, T.; White, J.C. Analyzing spatial and temporal variability in short-term rates of post-fire vegetation return from Landsat time series. Remote Sens. Environ. 2018, 205, 32–45. [Google Scholar] [CrossRef]
- Mitchell, M.; Yuan, F. Assessing forest fire and vegetation recovery in the black hills, South Dakota. GIScience Remote Sens. 2010, 47, 276–299. [Google Scholar] [CrossRef]
- Bastos, A.; Gouveia, C.M.; Dacamara, C.C.; Trigo, R.M. Modelling post-fire vegetation recovery in Portugal. Biogeosciences 2011, 8, 3593–3607. [Google Scholar] [CrossRef]
- Hayes, J.J.; Robeson, S.M. Relationships between fire severity and post-fire landscape pattern following a large mixed-severity fire in the Valle Vidal, New Mexico, USA. For. Ecol. Manag. 2011, 261, 1392–1400. [Google Scholar] [CrossRef]
- Polychronaki, A.; Gitas, I.Z.; Minchella, A. Monitoring post-fire vegetation recovery in the Mediterranean using SPOT and ERS imagery. Int. J. Wildland Fire 2014, 23, 631–642. [Google Scholar] [CrossRef]
- Krylov, A.; McCarty, J.C.; Potapov, P.; Loboda, T.; Tyukavina, A.; Turubanova, S.; Hansen, M.C. Remote sensing estimates of stand-replacement fires in Russia, 2002–2011. Environ. Res. Lett. 2014, 9, 105007. [Google Scholar] [CrossRef]
- Di Mauro, B.; Fava, F.; Busetto, L.; Crosta, G.F.; Colombo, R. Post-fire resilience in the Alpine region estimated from MODIS satellite multispectral data. Int. J. Appl. Earth Obs. Geoinf. 2014, 32, 163–172. [Google Scholar] [CrossRef]
- Vlassova, L.; Pérez-Cabello, F. Effects of post-fire wood management strategies on vegetation recovery and land surface temperature (LST) estimated from Landsat images. Int. J. Appl. Earth Obs. Geoinf. 2016, 44, 171–183. [Google Scholar] [CrossRef]
- Chu, T.; Guo, X.; Takeda, K. Remote sensing approach to detect post-fire vegetation regrowth in Siberian boreal larch forest. Ecol. Indic. 2016, 62, 32–46. [Google Scholar] [CrossRef]
- Fava, F.; Colombo, R. Remote sensing-based assessment of the 2005–2011 bamboo reproductive event in the Arakan mountain range and its relation with wildfires. Remote Sens. 2017, 9, 85. [Google Scholar] [CrossRef]
- Chu, T.; Guo, X.; Takeda, K. Effects of burn severity and environmental conditions on post-fire regeneration in Siberian Larch forest. Forests 2017, 8, 76. [Google Scholar] [CrossRef]
- Li, X.; Zhang, H.; Yang, G.; Ding, Y.; Zhao, J. Post-fire vegetation succession and surface energy fluxes derived from remote sensing. Remote Sens. 2018, 10, 1000. [Google Scholar] [CrossRef]
- Bondur, V.G.; Tsidilina, M.N.; Cherepanova, E.V. Satellite monitoring of wildfire impacts on the conditions of various types of vegetation cover in the federal districts of the Russian Federation. Izv. Atmos. Ocean. Phys. 2019, 55, 1238–1253. [Google Scholar] [CrossRef]
- Yi, K.; Tani, H.; Zhang, J.; Guo, M.; Wang, X.; Zhong, G. Long-term satellite detection of post-fire vegetation trends in boreal forests of China. Remote Sens. 2013, 5, 6938–6957. [Google Scholar] [CrossRef]
- Hope, A.; Albers, N.; Bart, R. Characterizing post-fire recovery of fynbos vegetation in the Western Cape Region of South Africa using MODIS data. Int. J. Remote Sens. 2012, 33, 979–999. [Google Scholar] [CrossRef]
- Caccamo, G.; Bradstock, R.; Collins, L.; Penman, T.; Watson, P. Using MODIS data to analyse post-fire vegetation recovery in Australian eucalypt forests. J. Spat. Sci. 2015, 60, 341–352. [Google Scholar] [CrossRef]
- Yang, J.; Pan, S.; Dangal, S.; Zhang, B.; Wang, S.; Tian, H. Continental-scale quantification of post-fire vegetation greenness recovery in temperate and boreal North America. Remote Sens. Environ. 2017, 199, 277–290. [Google Scholar] [CrossRef]
- Santana, N.C.; Júnior, O.A.d.C.; Gomes, R.A.T.; Fontes Guimarães, R. Comparison of post-fire patterns in Brazilian savanna and tropical forest from remote sensing time series. ISPRS Int. J. Geo-Inf. 2020, 9, 659. [Google Scholar] [CrossRef]
- Ryu, J.-H.; Han, K.-S.; Hong, S.; Park, N.-W.; Lee, Y.-W.; Cho, J. Satellite-Based Evaluation of the Post-Fire Recovery Process from the Worst Forest Fire Case in South Korea. Remote Sens. 2018, 10, 918. [Google Scholar] [CrossRef]
- Meng, R.; Dennison, P.E.; Huang, C.; Moritz, M.A.; D’Antonio, C. Effects of fire severity and post-fire climate on short-term vegetation recovery of mixed-conifer and red fir forests in the Sierra Nevada Mountains of California. Remote Sens. Environ. 2015, 171, 311–325. [Google Scholar] [CrossRef]
- Lee, R.J.; Chow, T.E. Post-wildfire assessment of vegetation regeneration in Bastrop, Texas, using Landsat imagery. GIScience Remote Sens. 2015, 52, 609–626. [Google Scholar] [CrossRef]
- Viana-Soto, A.; Aguado, I.; Salas, J.; García, M. Identifying post-fire recovery trajectories and driving factors using Landsat time series in fire-prone Mediterranean pine forests. Remote Sens. 2020, 12, 1499. [Google Scholar] [CrossRef]
- Sever, L.; Leach, J.; Bren, L. Remote sensing of post-fire vegetation recovery; a study using Landsat 5 TM imagery and NDVI in North-East Victoria. J. Spat. Sci. 2012, 57, 175–191. [Google Scholar] [CrossRef]
- Christopoulou, A.; Mallinis, G.; Vassilakis, E.; Farangitakis, G.-P.; Fyllas, N.M.; Kokkoris, G.D.; Arianoutsou, M. Assessing the impact of different landscape features on post-fire forest recovery with multitemporal remote sensing data: The case of Mount Taygetos (southern Greece). Int. J. Wildland Fire 2019, 28, 521–532. [Google Scholar] [CrossRef]
- Bisson, M.; Fornaciai, A.; Coli, A.; Mazzarini, F.; Pareschi, M.T. The Vegetation Resilience After Fire (VRAF) index: Development, implementation and an illustration from central Italy. Int. J. Appl. Earth Obs. Geoinf. 2008, 10, 312–329. [Google Scholar] [CrossRef]
- Zhao, F.R.; Meng, R.; Huang, C.; Zhao, M.; Zhao, F.A.; Gong, P.; Yu, L.; Zhu, Z. Long-term post-disturbance forest recovery in the greater yellowstone ecosystem analyzed using Landsat time series stack. Remote Sens. 2016, 8, 898. [Google Scholar] [CrossRef]
- Malak, D.A.; Pausas, J.G.; Pardo-Pascual, J.E.; Ruiz, L.A. Fire recurrence and the dynamics of the Enhanced Vegetation Index in a Mediterranean ecosystem. Int. J. Appl. Geospatial. Res. 2015, 6, 18–35. [Google Scholar] [CrossRef]
- Kuplich, T.M. Classifying regenerating forest stages in Amazonia using remotely sensed images and a neural network. For. Ecol. Manag. 2006, 234, 1–9. [Google Scholar] [CrossRef]
- Huesca, M.; Merino-de-Miguel, S.; González-Alonso, F.; Martínez, S.; Cuevas, J.M.; Calle, A. Using AHS hyper-spectral images to study forest vegetation recovery after a fire. Int. J. Remote Sens. 2013, 34, 4025–4048. [Google Scholar] [CrossRef]
- Domingo, D.; de la Riva, J.; Lamelas, M.T.; García-Martín, A.; Ibarra, P.; Echeverría, M.; Hoffrén, R. Fuel type classification using airborne laser scanning and Sentinel 2 data in Mediterranean forest affected by wildfires. Remote Sens. 2020, 12, 3660. [Google Scholar] [CrossRef]
- Hoffman, K.M.; Trant, A.J.; Nijland, W.; Starzomski, B.M. Ecological legacies of fire detected using plot-level measurements and LiDAR in an old growth coastal temperate rainforest. For. Ecol. Manag. 2018, 424, 11–20. [Google Scholar] [CrossRef]
- Pádua, L.; Guimarães, N.; Adão, T.; Sousa, A.; Peres, E.; Sousa, J.J. Effectiveness of Sentinel-2 in multi-temporal post-fire monitoring when compared with UAV Imagery. ISPRS Int. J. Geo-Inf. 2020, 9, 225. [Google Scholar] [CrossRef]
- Carreiras, J.M.B.; Jones, J.; Lucas, R.M.; Shimabukuro, Y.E. Mapping major land cover types and retrieving the age of secondary forests in the Brazilian Amazon by combining single-date optical and radar remote sensing data. Remote Sens. Environ. 2017, 194, 16–32. [Google Scholar] [CrossRef]
- Attarchi, S.; Gloaguen, R. Classifying complex mountainous forests with L-Band SAR and Landsat data integration: A comparison among different machine learning methods in the Hyrcanian forest. Remote Sens. 2014, 6, 3624–3647. [Google Scholar] [CrossRef]
- Sato, L.Y.; Gomes, V.C.F.; Shimabukuro, Y.E.; Keller, M.; Arai, E.; Dos-Santos, M.N.; Brown, I.F.; Aragão, L.E.O.e.C.d. Post-fire changes in forest biomass retrieved by airborne LiDAR in Amazonia. Remote Sens. 2016, 8, 839. [Google Scholar] [CrossRef]
- Gordon, C.E.; Price, O.F.; Tasker, E.M. Mapping and exploring variation in post-fire vegetation recovery following mixed severity wildfire using airborne LiDAR. Ecol. Appl. 2017, 27, 1618–1632. [Google Scholar] [CrossRef]
- Vogeler, J.C.; Yang, Z.; Cohen, W.B. Mapping post-fire habitat characteristics through the fusion of remote sensing tools. Remote Sens. Environ. 2016, 173, 294–303. [Google Scholar] [CrossRef]
- Meng, R.; Wu, J.; Zhao, F.; Cook, B.D.; Hanavan, R.P.; Serbin, S.P. Measuring short-term post-fire forest recovery across a burn severity gradient in a mixed pine-oak forest using multi-sensor remote sensing techniques. Remote Sens. Environ. 2018, 210, 282–296. [Google Scholar] [CrossRef]
- Bolton, D.K.; Coops, N.C.; Hermosilla, T.; Wulder, M.A.; White, J.C. Assessing variability in post-fire forest structure along gradients of productivity in the Canadian boreal using multi-source remote sensing. J. Biogeogr. 2017, 44, 1294–1305. [Google Scholar] [CrossRef]
- Lu, D.; Weng, Q. A survey of image classification methods and techniques for improving classification performance. Int. J. Remote Sens. 2007, 28, 823–870. [Google Scholar] [CrossRef]
- García-Haro, F.J.; Gilabert, M.A.; Meliá, J. Monitoring fire-affected areas using Thematic Mapper data. Int. J. Remote Sens. 2001, 22, 533–549. [Google Scholar] [CrossRef]
- Henry, M.C.; Yool, S.R. Assessing relationships between forest spatial patterns and fire history with fusion of optical and microwave remote sensing. Geocarto Int. 2004, 19, 25–37. [Google Scholar] [CrossRef]
- Henry, M.C. Comparison of single-and multi-date Landsat data for mapping wildfire scars in Ocala National Forest, Florida. Photogramm. Engin. Remote Sens. 2008, 74, 881–891. [Google Scholar] [CrossRef]
- Phua, M.-H.; Tsuyuki, S.; Soo Lee, J.; Ghani, M.A.A. Simultaneous detection of burned areas of multiple fires in the tropics using multisensor remote-sensing data. Int. J. Remote Sens. 2012, 33, 4312–4333. [Google Scholar] [CrossRef]
- Dragozi, E.; Gitas, I.Z.; Stavrakoudis, D.G.; Theocharis, J.B. Burned area mapping using support vector machines and the FuzCoC feature selection method on VHR IKONOS imagery. Remote Sens. 2014, 6, 12005–12036. [Google Scholar] [CrossRef]
- Siljander, M. Predictive fire occurrence modelling to improve burned area estimation at a regional scale: A case study in East Caprivi, Namibia. Int. J. Appl. Earth Obs. Geoinf. 2009, 11, 380–393. [Google Scholar] [CrossRef]
- Potter, C.; Li, S.; Huang, S.; Crabtree, R.L. Analysis of sapling density regeneration in Yellowstone National Park with hyperspectral remote sensing data. Remote Sens. Environ. 2012, 121, 61–68. [Google Scholar] [CrossRef]
- Arnett, J.T.T.R.; Coops, N.C.; Daniels, L.D.; Falls, R.W. Detecting forest damage after a low-severity fire using remote sensing at multiple scales. Int. J. Appl. Earth Obs. Geoinf. 2015, 35, 239–246. [Google Scholar] [CrossRef]
- Brown, D.R.N.; Jorgenson, M.T.; Kielland, K.; Verbyla, D.L.; Prakash, A.; Koch, J.C. Landscape effects of wildfire on permafrost distribution in interior Alaska derived from remote sensing. Remote Sens. 2016, 8, 654. [Google Scholar] [CrossRef]
- Rozario, P.F.; Madurapperuma, B.D.; Wang, Y. Remote sensing approach to detect burn severity risk zones in Palo Verde National Park, Costa Rica. Remote Sens. 2018, 10, 1427. [Google Scholar] [CrossRef]
- Román-Cuesta, R.M.; Retana, J.; Gracia, M.; Rodríguez, R. A quantitative comparison of methods for classifying burned areas with LISS-III imagery. Int. J. Remote Sens. 2005, 26, 1979–2003. [Google Scholar] [CrossRef]
- Lima, A.; Silva, T.S.F.; de Aragão, L.E.O.C.; de Feitas, R.M.; Adami, M.; Formaggio, A.R.; Shimabukuro, Y.E. Land use and land cover changes determine the spatial relationship between fire and deforestation in the Brazilian Amazon. Appl. Geogr. 2012, 34, 239–246. [Google Scholar] [CrossRef]
- Sofan, P.; Vetrita, Y.; Yulianto, F.; Khomarudin, M.R. Multi-temporal remote sensing data and spectral indices analysis for detection tropical rainforest degradation: Case study in Kapuas Hulu and Sintang districts, West Kalimantan, Indonesia. Nat. Hazards 2016, 80, 1279–1301. [Google Scholar] [CrossRef]
- Quintano, C.; Shimabukuro, Y.E.; Fernández, A.; Delgado, J.A. A spectral unmixing approach for mapping burned areas in Mediterranean countries. Int. J. Remote Sens. 2005, 26, 1493–1498. [Google Scholar] [CrossRef]
- Quintano, C.; Fernández-Manso, A.; Fernández-Manso, O.; Shimabukuro, Y.E. Mapping burned areas in Mediterranean countries using spectral mixture analysis from a uni-temporal perspective. Int. J. Remote Sens. 2006, 27, 645–662. [Google Scholar] [CrossRef]
- Roldán-Zamarrón, A.; Merino-de-Miguel, S.; González-Alonso, F.; García-Gigorro, S.; Cuevas, J.M. Minas de Riotinto (south Spain) forest fire: Burned area assessment and fire severity mapping using Landsat 5-TM, Envisat-MERIS, and Terra-MODIS postfire images. J. Geophys. Res. Biogeosci. 2006, 111, G04S11. [Google Scholar] [CrossRef]
- Montorio, R.; Pérez-Cabello, F.; Borini Alves, D.; García-Martín, A. Unitemporal approach to fire severity mapping using multispectral synthetic databases and Random Forests. Remote Sens. Environ. 2020, 249, 112025. [Google Scholar] [CrossRef]
- Quintano, C.; Fernández-manso, A.; Roberts, D.A. Enhanced burn severity estimation using fine resolution ET and MESMA fraction images with machine learning algorithm. Remote Sens. Environ. 2020, 244, 111815. [Google Scholar] [CrossRef]
- Solans Vila, J.P.; Barbosa, P. Post-fire vegetation regrowth detection in the Deiva Marina region (Liguria-Italy) using Landsat TM and ETM+ data. Ecol. Model. 2010, 221, 75–84. [Google Scholar] [CrossRef]
- Sunar, F.; Özkan, C. Forest fire analysis with remote sensing data. Int. J. Remote Sens. 2001, 22, 2265–2277. [Google Scholar] [CrossRef]
- Malone, S.L.; Kobziar, L.N.; Staudhammer, C.L.; Abd-Elrahman, A. Modeling relationships among 217 fires using remote sensing of burn severity in southern pine forests. Remote Sens. 2011, 3, 2005–2028. [Google Scholar] [CrossRef]
- Pleniou, M.; Koutsias, N. Sensitivity of spectral reflectance values to different burn and vegetation ratios: A multi-scale approach applied in a fire affected area. ISPRS J. Photogramm. Remote Sens. 2013, 79, 199–210. [Google Scholar] [CrossRef]
- Shin, J.-I.; Seo, W.-W.; Kim, T.; Park, J.; Woo, C.-S. Using UAV multispectral images for classification of forest burn severity-A case study of the 2019 Gangneung forest fire. Forests 2019, 10, 1025. [Google Scholar] [CrossRef]
- Picos, J.; Alonso, L.; Bastos, G.; Armesto, J. Event-based integrated assessment of environmental variables and wildfire severity through Sentinel-2 Data. Forests 2019, 10, 1021. [Google Scholar] [CrossRef]
- De Oliveira, L.N.; Lazzarini, G.M.J.; Batista, A.C.; De Lima Fonseca Alves, K.C.C.; Giongo, M. Use of multispectral imaging in the evaluation of burnings and forest fires in Krahôlandia indigenous land (2003–2014). Floresta 2015, 45, 853–864. [Google Scholar] [CrossRef]
- Roy, D.P.; Kumar, S.S. Multi-year MODIS active fire type classification over the Brazilian tropical moist forest biome. Int. J. Digit. Earth. 2017, 10, 54–84. [Google Scholar] [CrossRef]
- Ramo, R.; García, M.; Rodríguez, D.; Chuvieco, E. A data mining approach for global burned area mapping. Int. J. Appl. Earth Obs. Geoinf. 2018, 73, 39–51. [Google Scholar] [CrossRef]
- Janssen, T.A.J.; Ametsitsi, G.K.; Collins, M.; Adu-Bredu, S.; Oliveras, I.; Mitchard, E.T.; Veenendaal, E.M. Extending the baseline of tropical dry forest loss in Ghana (1984–2015) reveals drivers of major deforestation inside a protected area. Biol. Conserv. 2018, 218, 163–172. [Google Scholar] [CrossRef]
- Klauberg, C.; Hudak, A.T.; Silva, C.A.; Lewis, S.A.; Robichaud, P.R.; Jain, T.B. Characterizing fire effects on conifers at tree level from airborne laser scanning and high-resolution, multispectral satellite data. Ecol. Model. 2019, 412, 108820. [Google Scholar] [CrossRef]
- Keyser, A.R.; Westerling, A.L.R. Predicting increasing high severity area burned for three forested regions in the western United States using extreme value theory. For. Ecol. Manag. 2019, 432, 694–706. [Google Scholar] [CrossRef]
- Shang, C.; Wulder, M.A.; Coops, N.C.; White, J.C.; Hermosilla, T. Spatially-explicit prediction of wildfire burn probability using remotely-sensed and ancillary data. Can. J. Remote Sens. 2020, 46, 313–329. [Google Scholar] [CrossRef]
- Gibson, R.; Danaher, T.; Hehir, W.; Collins, L. A remote sensing approach to mapping fire severity in south-eastern Australia using Sentinel 2 and random forest. Remote Sens. Environ. 2020, 240, 111702. [Google Scholar] [CrossRef]
- Collins, L.; McCarthy, G.; Mellor, A.; Newell, G.; Smith, L. Training data requirements for fire severity mapping using Landsat imagery and random forest. Remote Sens. Environ. 2020, 245, 111839. [Google Scholar] [CrossRef]
- Gómez, I.; Martin, M.P. Prototyping an artificial neural network for burned area mapping on a regional scale in Mediterranean areas using MODIS images. Int. J. Appl. Earth Obs. Geoinf. 2011, 13, 741–752. [Google Scholar] [CrossRef]
- Sedano, F.; Kempeneers, P.; Strobl, P.; McInerney, D.; San Miguel, J. Increasing spatial detail of burned scar maps using IRS-AWiFS data for Mediterranean Europe. Remote Sens. 2012, 4, 726–744. [Google Scholar] [CrossRef]
- Pereira-Pires, J.E.; Aubard, V.; Ribeiro, R.A.; Fonseca, J.M.; Silva, J.M.N.; Mora, A. Semi-automatic methodology for fire break maintenance operations detection with sentinel-2 imagery and artificial neural network. Remote Sens. 2020, 12, 909. [Google Scholar] [CrossRef]
- Gutiérrez-Velez, V.H.; Uriarte, M.; DeFries, R.; Pinedo-Vásquez, M.; Fernandes, K.; Ceccato, P.; Baethgen, W.; Padoch, C. Land cover change interacts with drought severity to change fire regimes in Western Amazonia. Ecol. Appl. 2014, 24, 1323–1340. [Google Scholar] [CrossRef]
- Zhan, X.; Sohlberg, R.A.; Townshend, J.R.G.; DiMiceli, C.; Carroll, M.L.; Eastman, J.C.; Hansen, M.C.; DeFries, R.S. Detection of land cover changes using MODIS 250 m data. Remote Sens. Environ. 2002, 83, 336–350. [Google Scholar] [CrossRef]
- Maeda, E.E.; Arcoverde, G.F.B.; Pellikka, P.K.E.; Shimabukuro, Y.E. Fire risk assessment in the Brazilian Amazon using MODIS imagery and change vector analysis. Appl. Geogr. 2011, 31, 76–84. [Google Scholar] [CrossRef]
- Guindon, L.; Bernier, P.Y.; Beaudoin, A.; Pouliot, D.; Villemaire, P.; Hall, R.J.; Latifovic, R.; St-Amant, R. Annual mapping of large forest disturbances across Canada’s forests using 250 m MODIS imagery from 2000 to 2011. Can. J. For. Res. 2014, 44, 1545–1554. [Google Scholar] [CrossRef]
- Cardille, J.A.; Fortin, J.A. Bayesian updating of land-cover estimates in a data-rich environment. Remote Sens. Environ. 2016, 186, 234–249. [Google Scholar] [CrossRef]
- Crowley, M.A.; Cardille, J.A.; White, J.C.; Wulder, M.A. Generating intra-year metrics of wildfire progression using multiple open-access satellite data streams. Remote Sens. Environ. 2019, 232, 111295. [Google Scholar] [CrossRef]
- Fernández-Guisuraga, J.M.; Calvo, L.; Fernández-García, V.; Marcos-Porras, E.; Taboada, Á.; Suárez-Seoane, S. Efficiency of remote sensing tools for post-fire management along a climatic gradient. For. Ecol. Manag. 2019, 433, 553–562. [Google Scholar] [CrossRef]
- Petropoulos, G.P.; Kontoes, C.; Keramitsoglou, I. Burnt area delineation from a uni-temporal perspective based on Landsat TM imagery classification using Support Vector Machines. Int. J. Appl. Earth Obs. Geoinf. 2011, 13, 70–80. [Google Scholar] [CrossRef]
- Corbane, C.; Carrion, D.; Broglia, M. Development and implementation of a validation protocol for crisis maps: Reliability and consistency assessment of burnt area maps. Int. J. Digit. Earth. 2011, 4, 8–24. [Google Scholar] [CrossRef]
- Viedma, O. The influence of topography and fire in controlling landscape composition and structure in Sierra de Gredos (Central Spain). Landsc. Ecol. 2008, 23, 657–672. [Google Scholar] [CrossRef]
- Leon, J.R.R.; van Leeuwen, W.J.D.; Casady, G.M. Using MODIS-NDVI for the modeling of post-wildfire vegetation response as a function of environmental conditions and pre-fire restoration treatments. Remote Sens. 2012, 4, 598–621. [Google Scholar] [CrossRef]
- Morgan, P.; Hudak, A.T.; Wells, A.; Parks, S.A.; Baggett, L.S.; Bright, B.C.; Green, P. Multidecadal trends in area burned with high severity in the Selway-Bitterroot Wilderness Area 1880–2012. Int. J. Wildland Fire 2017, 26, 930–943. [Google Scholar] [CrossRef]
- Hawbaker, T.J.; Vanderhoof, M.K.; Beal, Y.-J.; Takacs, J.D.; Schmidt, G.L.; Falgout, J.T.; Williams, B.; Fairaux, N.M.; Caldwell, M.K.; Picotte, J.J.; et al. Mapping burned areas using dense time-series of Landsat data. Remote Sens. Environ. 2017, 198, 504–522. [Google Scholar] [CrossRef]
- Viedma, O.; Torres, I.; Pérez, B.; Moreno, J.M. Modeling plant species richness using reflectance and texture data derived from QuickBird in a recently burned area of Central Spain. Remote Sens. Environ. 2012, 119, 208–221. [Google Scholar] [CrossRef]
- Alencar, A.; Asner, G.P.; Knapp, D.; Zarin, D. Temporal variability of forest fires in eastern Amazonia. Ecol. Appl. 2011, 21, 2397–2412. [Google Scholar] [CrossRef]
- Huang, S.; Liu, H.; Dahal, D.; Jin, S.; Welp, L.R.; Liu, J.; Liu, S. Modeling spatially explicit fire impact on gross primary production in interior Alaska using satellite images coupled with eddy covariance. Remote Sens. Environ. 2013, 135, 178–188. [Google Scholar] [CrossRef]
- Unnikrishnan, A.; Reddy, C.S. Characterizing distribution of forest fires in Myanmar using Earth observations and spatial statistics tool. J. Indian Soc. Remote Sens. 2020, 48, 227–234. [Google Scholar] [CrossRef]
- Pulvirenti, L.; Squicciarino, G.; Fiori, E.; Fiorucci, P.; Ferraris, L.; Negro, D.; Gollini, A.; Severino, M.; Puca, S. An automatic processing chain for near real-time mapping of burned forest areas using Sentinel-2 data. Remote Sens. 2020, 12, 674. [Google Scholar] [CrossRef]
- Satish, K.V.; Reddy, C.S. Long term monitoring of forest fires in Silent Valley National Park, Western Ghats, India using remote sensing data. J. Indian Soc. Remote Sens. 2016, 44, 207–215. [Google Scholar] [CrossRef]
- Bowman, D.M.J.S.; Walsh, A.; Prior, L.D. Landscape analysis of Aboriginal fire management in Central Arnhem Land, north Australia. J. Biogeogr. 2004, 31, 207–223. [Google Scholar] [CrossRef]
- Harcombe, P.A.; Greene, S.E.; Kramer, M.G.; Acker, S.A.; Spies, T.A.; Valentine, T. The influence of fire and windthrow dynamics on a coastal spruce-hemlock forest in Oregon, USA, based on aerial photographs spanning 40 years. For. Ecol. Manag. 2004, 194, 71–82. [Google Scholar] [CrossRef]
- Chuvieco, E.; Ventura, G.; Martín, M.P.; Gómez, I. Assessment of multitemporal compositing techniques of MODIS and AVHRR images for burned land mapping. Remote Sens. Environ. 2005, 94, 450–462. [Google Scholar] [CrossRef]
- Silva, J.M.N.; Sá, A.C.L.; Pereira, J.M.C. Comparison of burned area estimates derived from SPOT-VEGETATION and Landsat ETM+ data in Africa: Influence of spatial pattern and vegetation type. Remote Sens. Environ. 2005, 96, 188–201. [Google Scholar] [CrossRef]
- Holden, Z.A.; Smith, A.M.S.; Morgan, P.; Rollins, M.G.; Gessler, P.E. Evaluation of novel thermally enhanced spectral indices for mapping fire perimeters and comparisons with fire atlas data. Int. J. Remote Sens. 2005, 26, 4801–4808. [Google Scholar] [CrossRef]
- Gong, P.; Pu, R.; Li, Z.; Scarborough, J.; Clinton, N.; Levien, L.M. An integrated approach to wildland fire mapping of California, USA using NOAA/AVHRR data. Photogramm. Eng. Remote Sens. 2006, 72, 139–150. [Google Scholar] [CrossRef]
- Vega-García, C.; Chuvieco, E. Applying local measures of spatial heterogeneity to Landsat-TM images for predicting wildfire occurrence in Mediterranean landscapes. Landsc. Ecol. 2006, 21, 595–605. [Google Scholar] [CrossRef]
- Hammill, K.A.; Bradstock, R.A. Remote sensing of fire severity in the Blue Mountains: Influence of vegetation type and inferring fire intensity. Int. J. Wildland Fire 2006, 15, 213–226. [Google Scholar] [CrossRef]
- González-Alonso, F.; Merino-De-Miguel, S.; Roldán-Zamarrón, A.; García-Gigorro, S.; Cuevas, J.M. MERIS full resolution data for mapping level-of-damage caused by forest fires: The Valencia de Alcántara event in August 2003. Int. J. Remote Sens. 2007, 28, 797–809. [Google Scholar] [CrossRef]
- Loboda, T.V.; Csiszar, I.A. Reconstruction of fire spread within wildland fire events in Northern Eurasia from the MODIS active fire product. Glob. Planet. Change 2007, 56, 258–273. [Google Scholar] [CrossRef]
- Pocewicz, A.; Vierling, L.A.; Lentile, L.B.; Smith, R. View angle effects on relationships between MISR vegetation indices and leaf area index in a recently burned ponderosa pine forest. Remote Sens. Environ. 2007, 107, 322–333. [Google Scholar] [CrossRef]
- Kodandapani, N.; Cochrane, M.A.; Sukumar, R. A comparative analysis of spatial, temporal, and ecological characteristics of forest fires in seasonally dry tropical ecosystems in the Western Ghats, India. For. Ecol. Manag. 2008, 256, 607–617. [Google Scholar] [CrossRef]
- Fox, D.M.; Maselli, F.; Carrega, P. Using SPOT images and field sampling to map burn severity and vegetation factors affecting post forest fire erosion risk. Catena 2008, 75, 326–335. [Google Scholar] [CrossRef]
- Koutsias, N.; Pleniou, M.; Mallinis, G.; Nioti, F.; Sifakis, N.I. A rule-based semi-automatic method to map burned areas: Exploring the USGS historical Landsat archives to reconstruct recent fire history. Int. J. Remote Sens. 2013, 34, 7049–7068. [Google Scholar] [CrossRef]
- Tian, X.; Zhao, F.; Shu, L.; Wang, M. Distribution characteristics and the influence factors of forest fires in China. For. Ecol. Manag. 2013, 310, 460–467. [Google Scholar] [CrossRef]
- Fernández-Manso, A.; Quintano, C. A synergetic approach to burned area mapping using maximum entropy modeling trained with hyperspectral data and VIIRS hotspots. Remote Sens. 2020, 12, 858. [Google Scholar] [CrossRef]
- Liu, S.; Zheng, Y.; Dalponte, M.; Tong, X. A novel fire index-based burned area change detection approach using Landsat-8 OLI data. Eur. J. Remote Sens. 2020, 53, 104–112. [Google Scholar] [CrossRef]
- Liu, Z.; Yang, J.; Dwomoh, F. Mapping recent burned patches in Siberian larch forest using Landsat and MODIS data. Eur. J. Remote Sens. 2016, 49, 861–887. [Google Scholar] [CrossRef]
- Mithal, V.; Nayak, G.; Khandelwal, A.; Kumar, V.; Nemani, R.; Oza, N.C. Mapping burned areas in tropical forests using a novel machine learning framework. Remote Sens. 2018, 10, 69. [Google Scholar] [CrossRef]
- Blaschke, T. Object-based image analysis for remote sensing. ISPRS J. Photogramm. Remote Sens. 2010, 65, 2–16. [Google Scholar] [CrossRef]
- Phua, M.-H.; Tsuyuki, S.; Lee, J.S.; Sasakawa, H. Detection of burned peat swamp forest in a heterogeneous tropical landscape: A case study of the Klias Peninsula, Sabah, Malaysia. Landsc. Urban Plan. 2007, 82, 103–116. [Google Scholar] [CrossRef]
- Gitas, I.Z.; Mitri, G.H.; Ventura, G. Object-based image classification for burned area mapping of Creus Cape, Spain, using NOAA-AVHRR imagery. Remote Sens. Environ. 2004, 92, 409–413. [Google Scholar] [CrossRef]
- Mitri, G.H.; Gitas, I.Z. A performance evaluation of a burned area object-based classification model when applied to topographically and non-topographically corrected TM imagery. Int. J. Remote Sens. 2004, 25, 2863–2870. [Google Scholar] [CrossRef]
- Mitri, G.H.; Gitas, I.Z. Fire type mapping using object-based classification of Ikonos imagery. Int. J. Wildland Fire 2006, 15, 457–462. [Google Scholar] [CrossRef]
- Gitas, I.Z.; Polychronaki, A.; Katagis, T.; Mallinis, G. Contribution of remote sensing to disaster management activities: A case study of the large fires in the Peloponnese, Greece. Int. J. Remote Sens. 2008, 29, 1847–1853. [Google Scholar] [CrossRef]


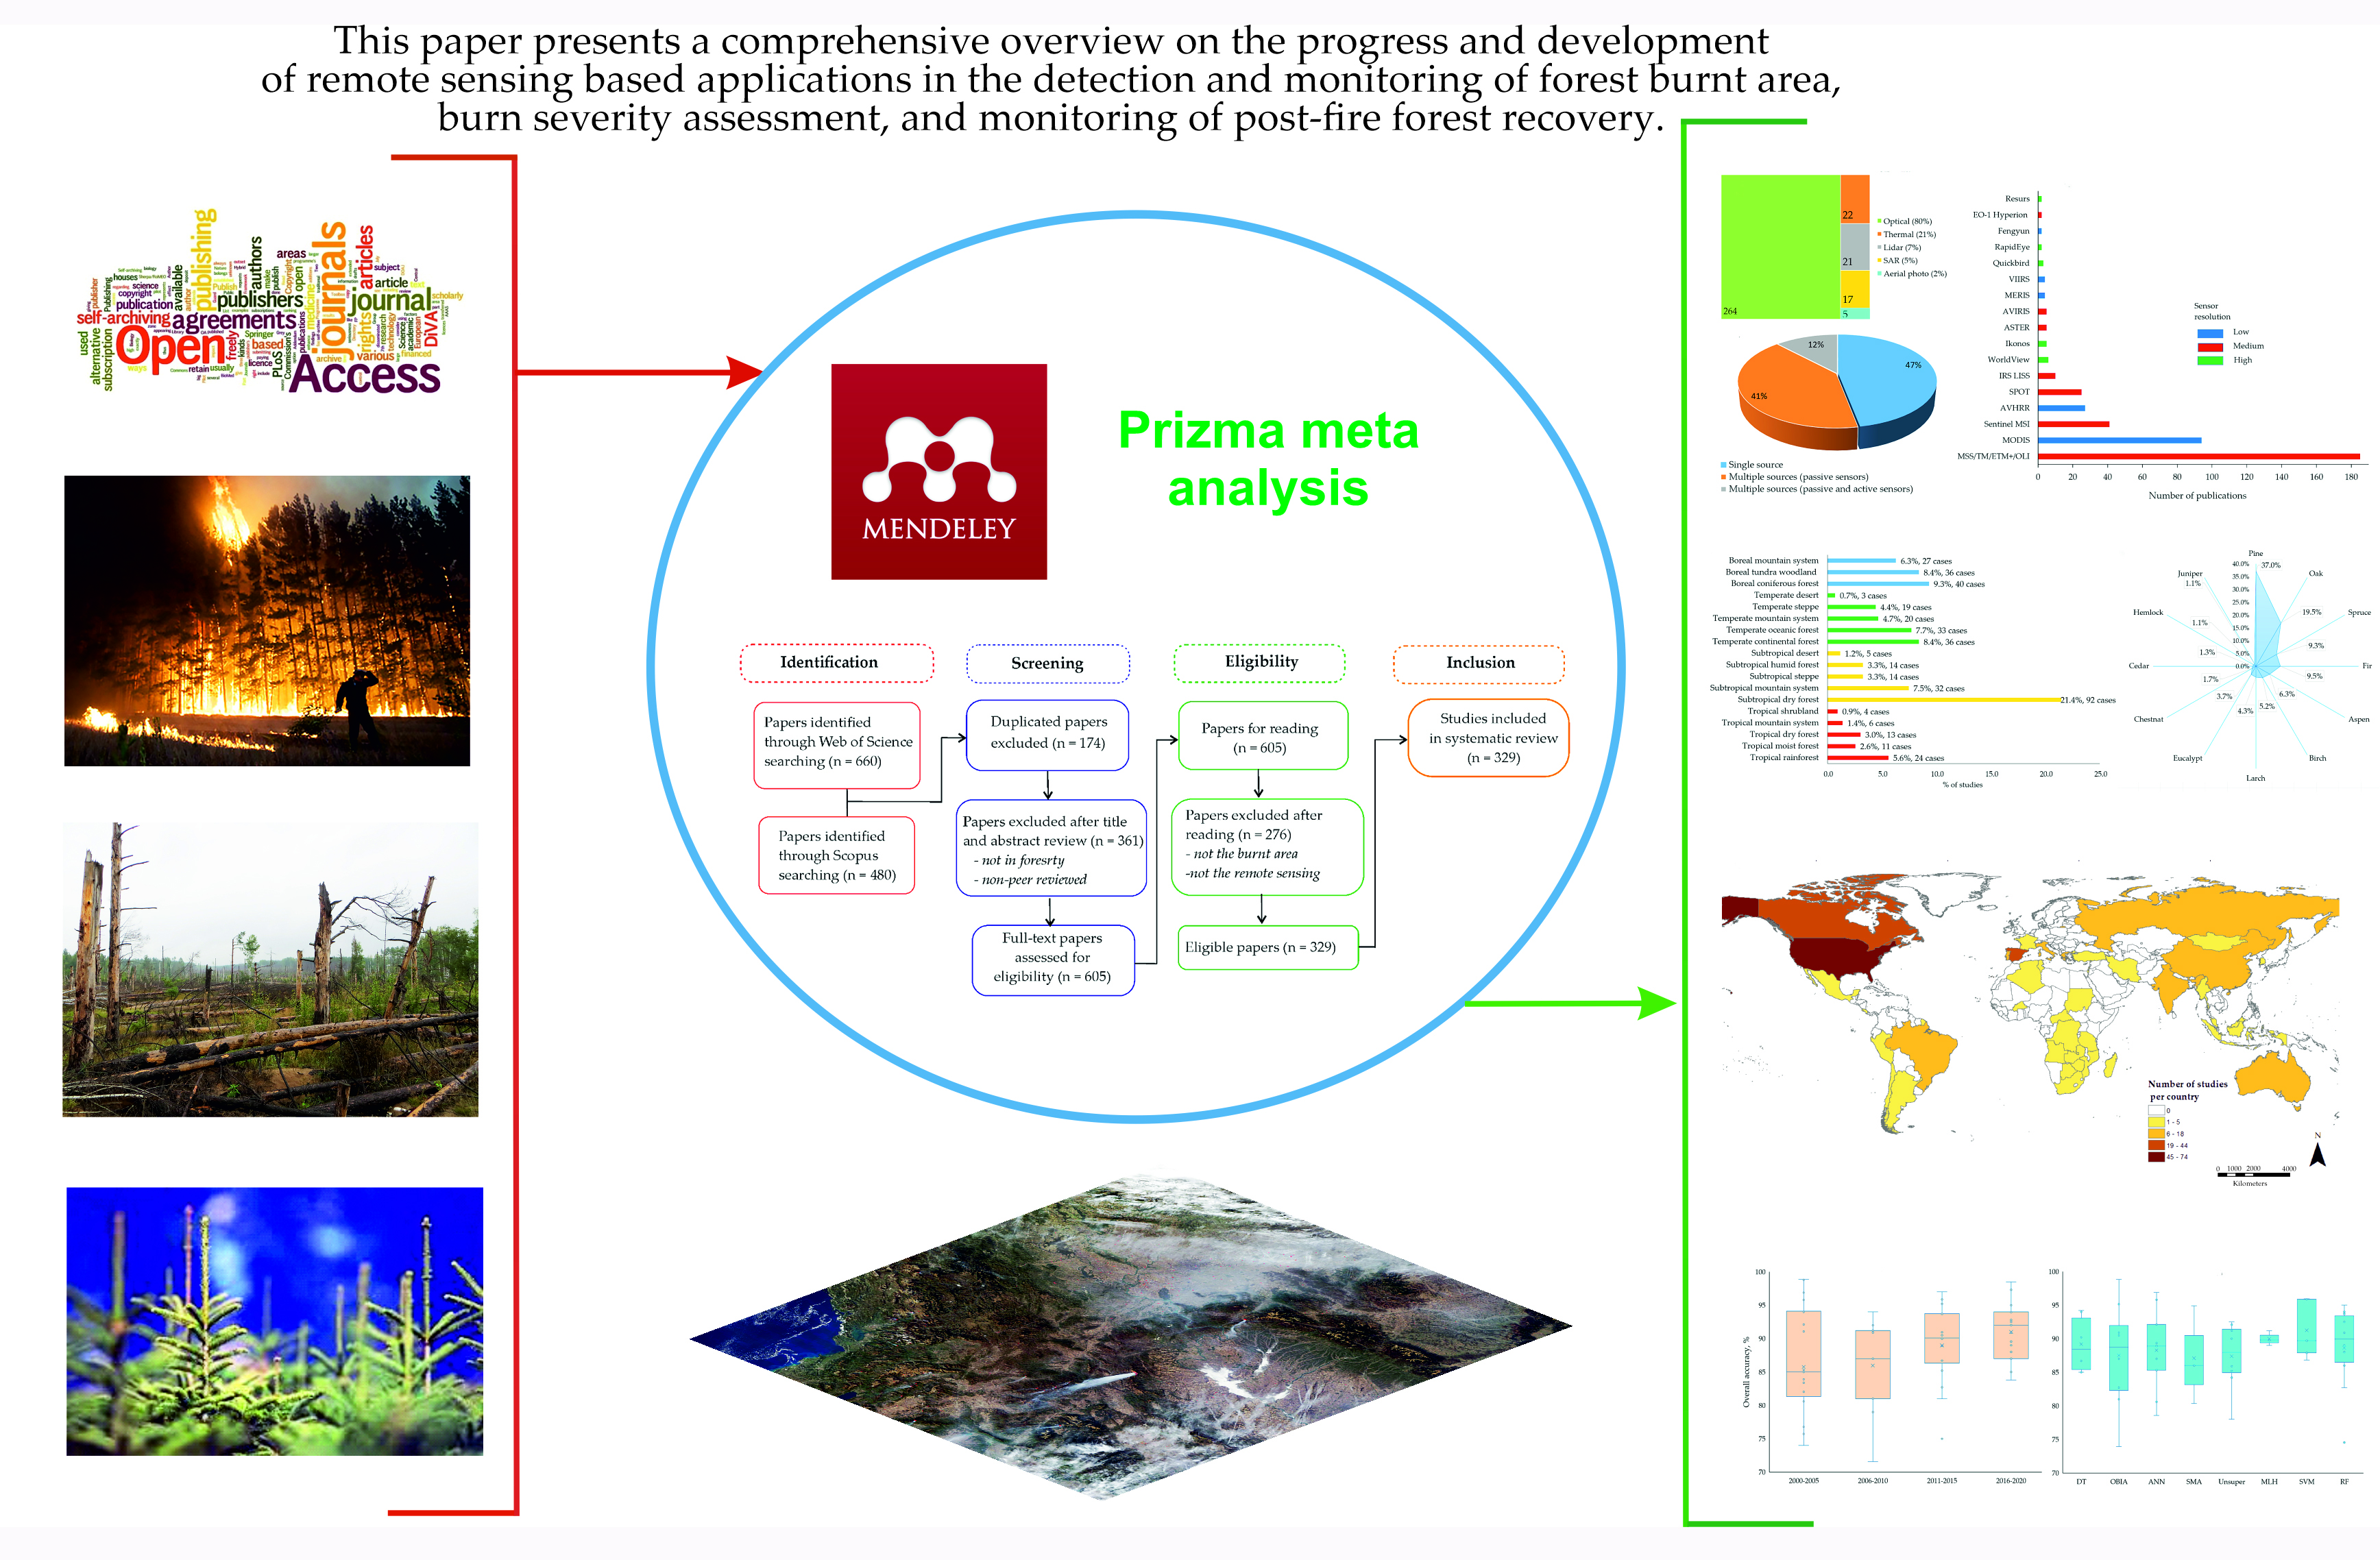
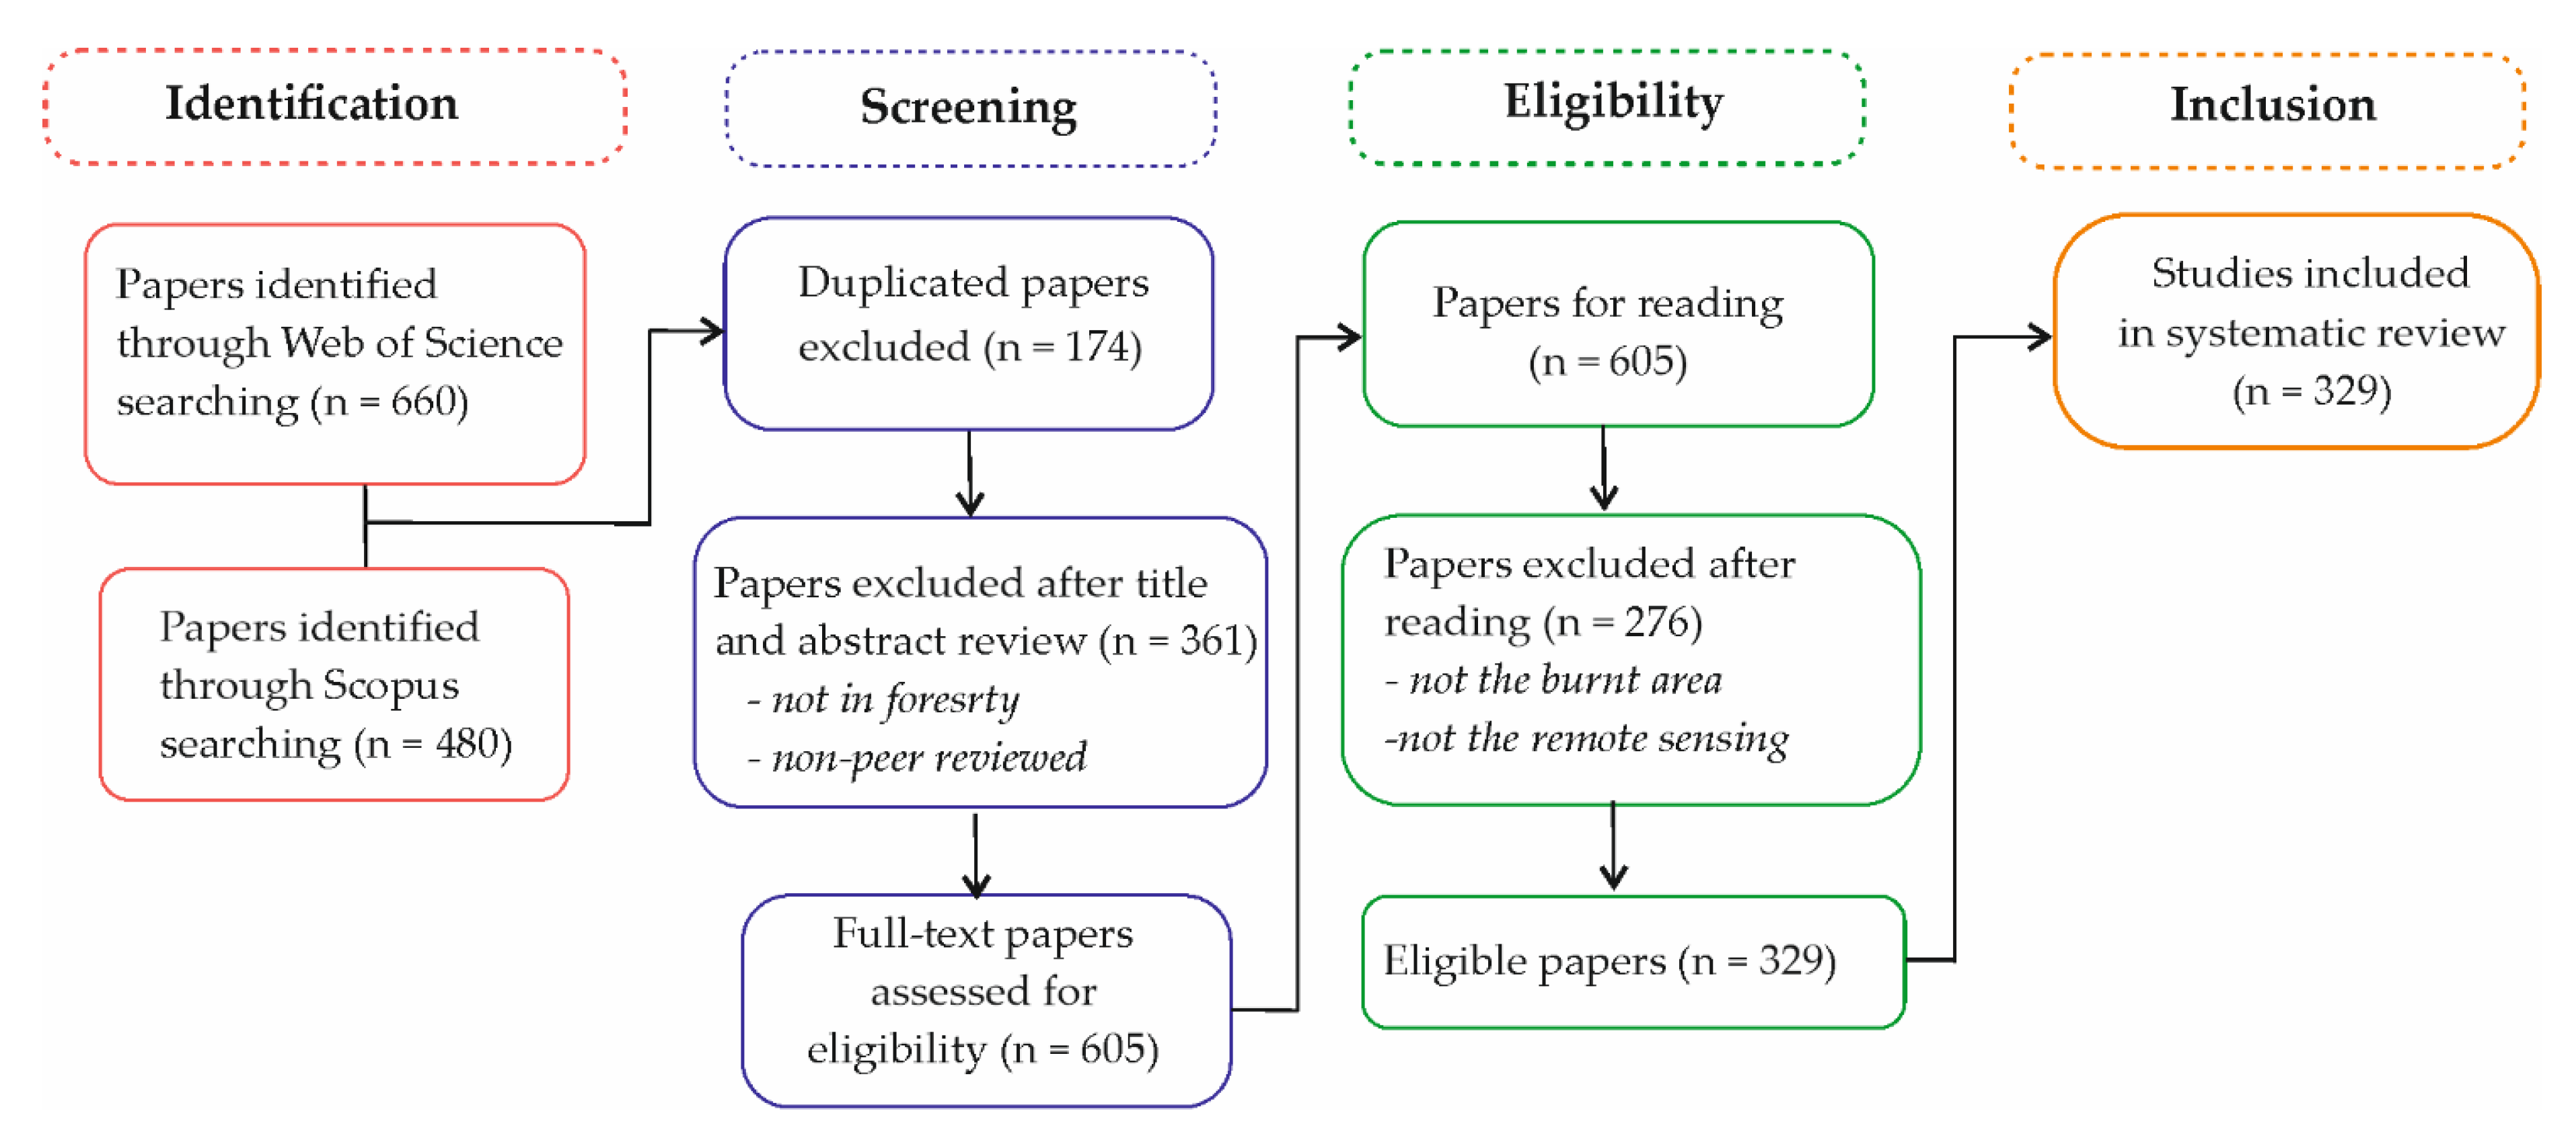
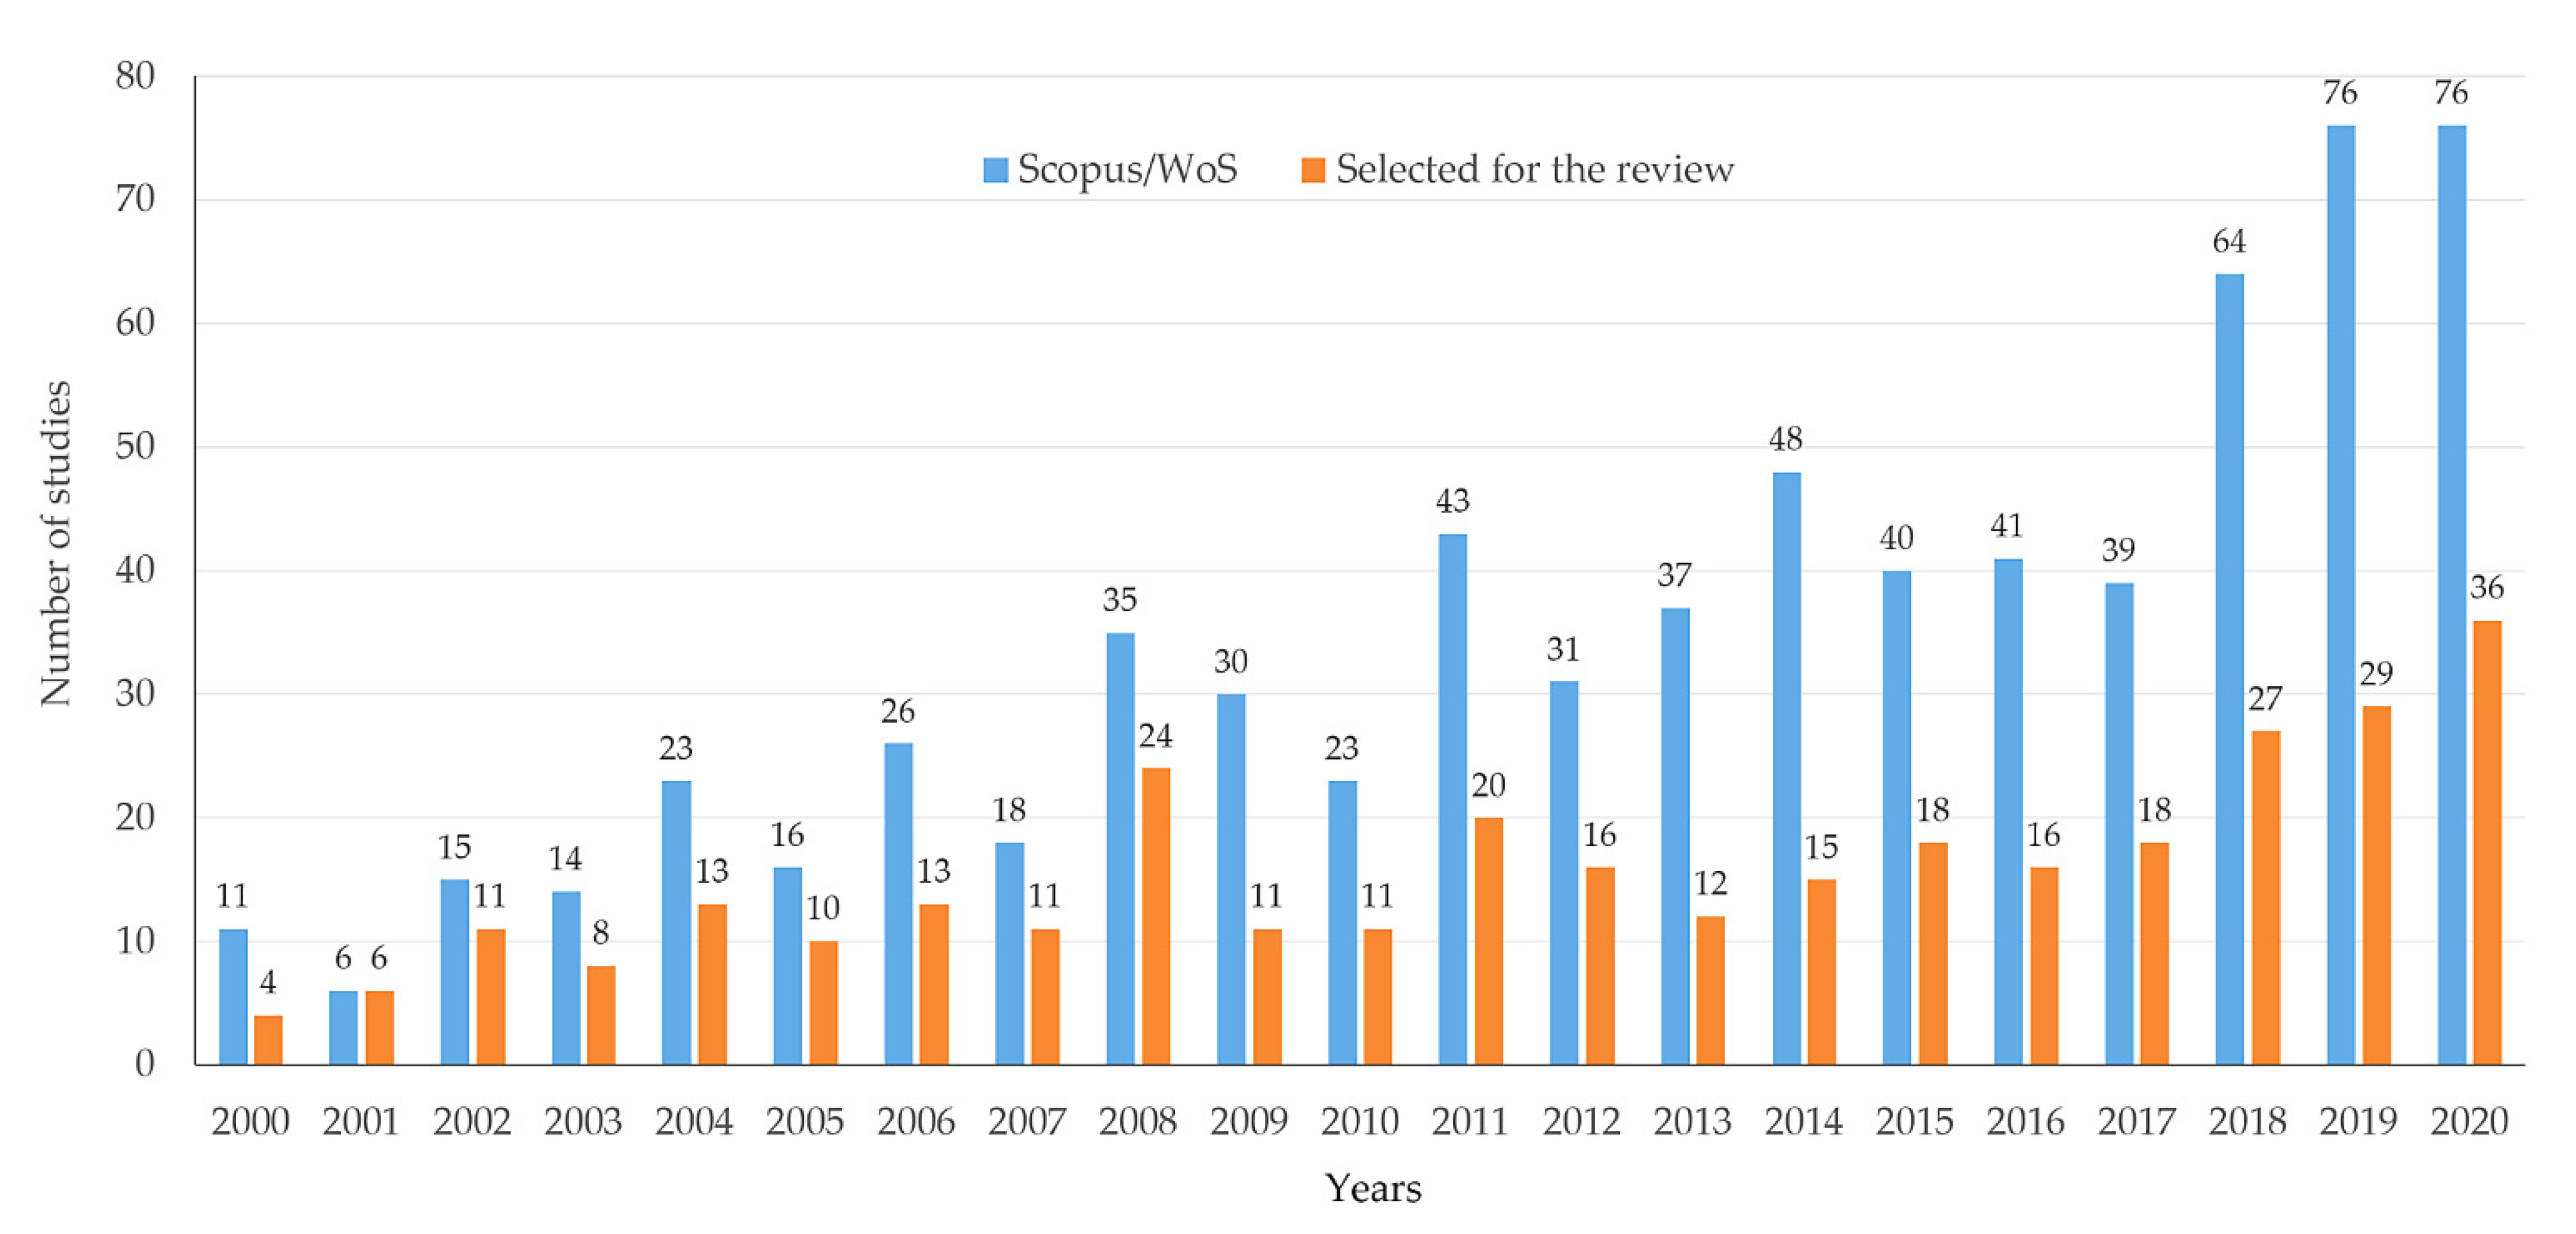
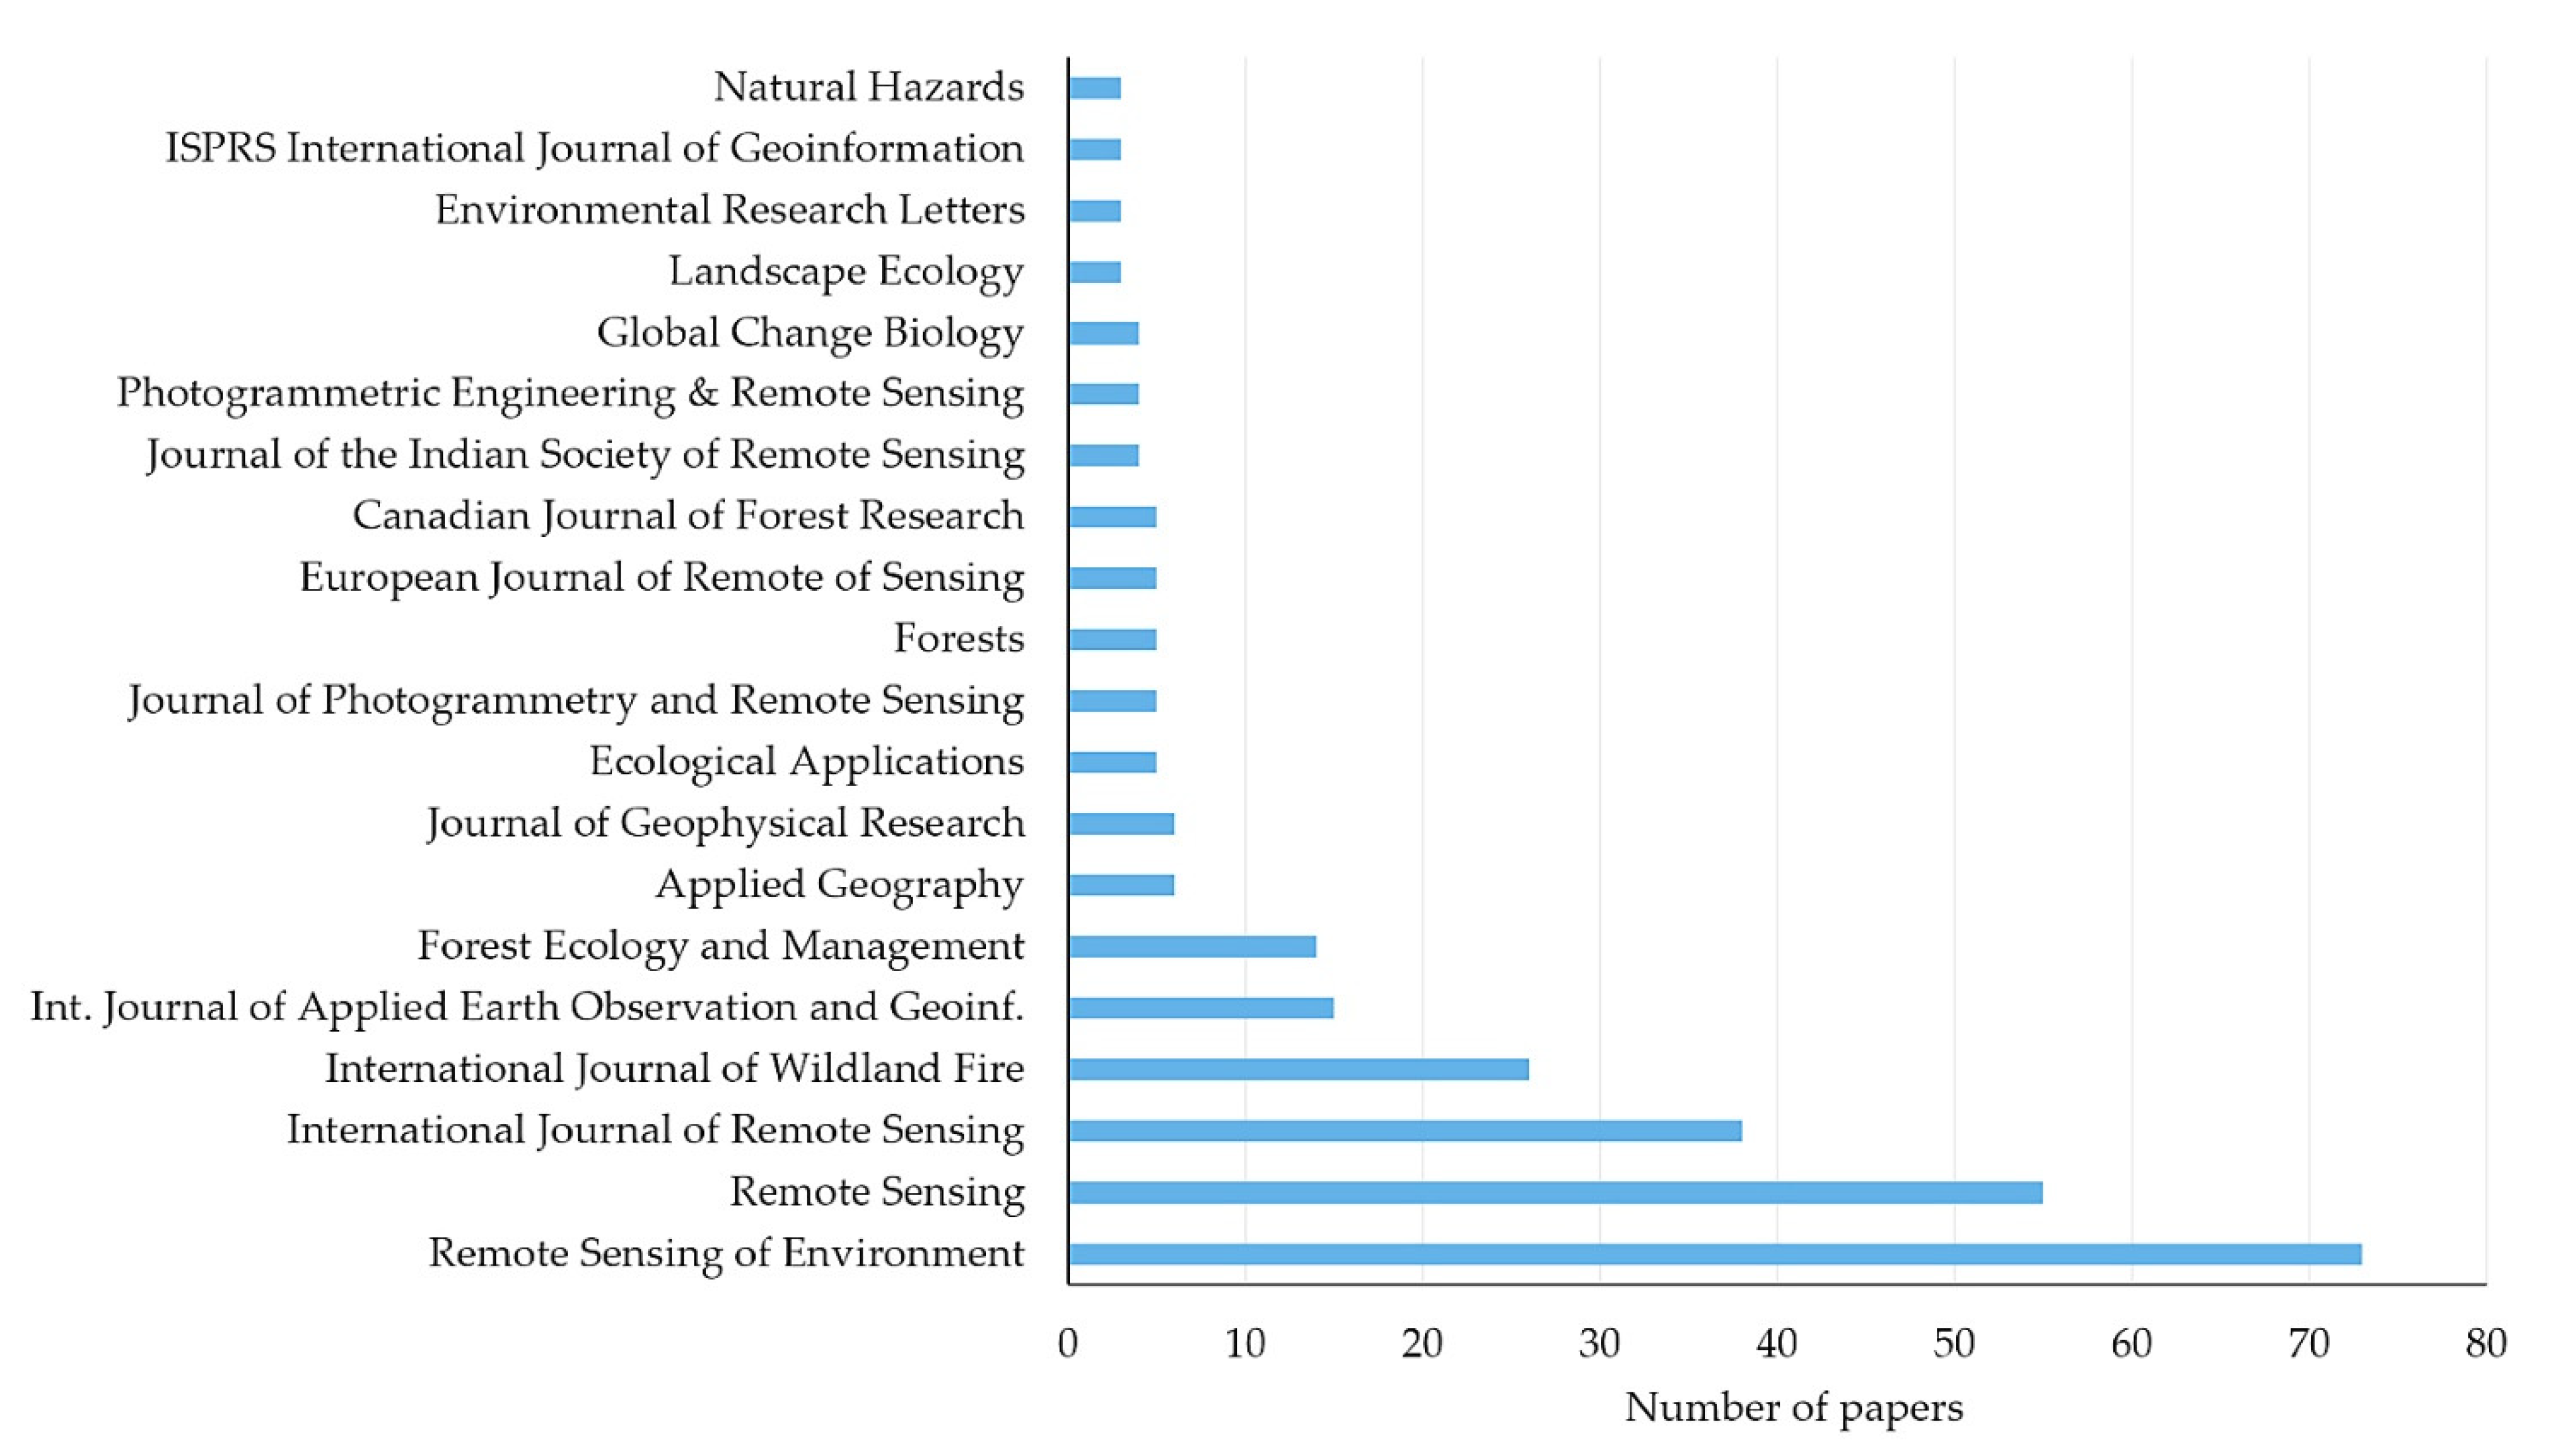
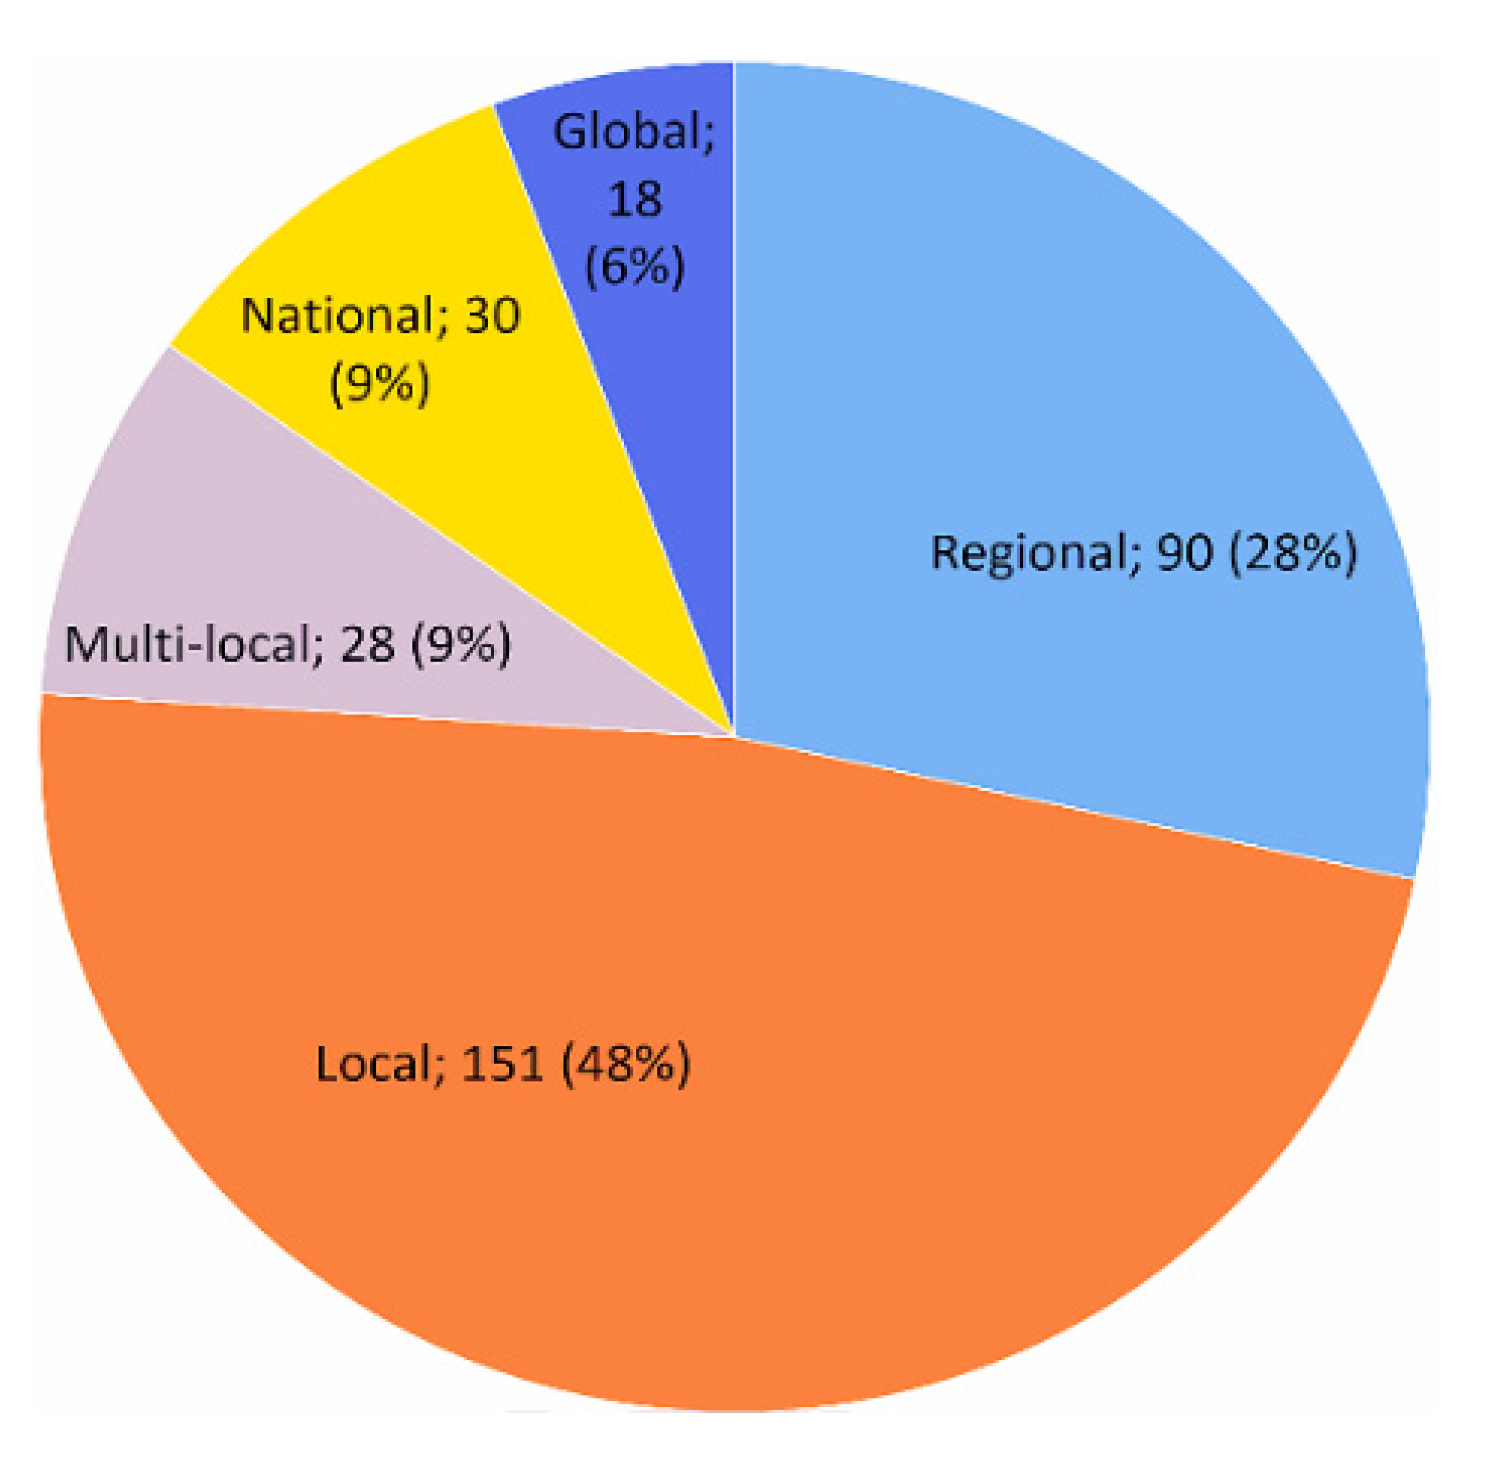
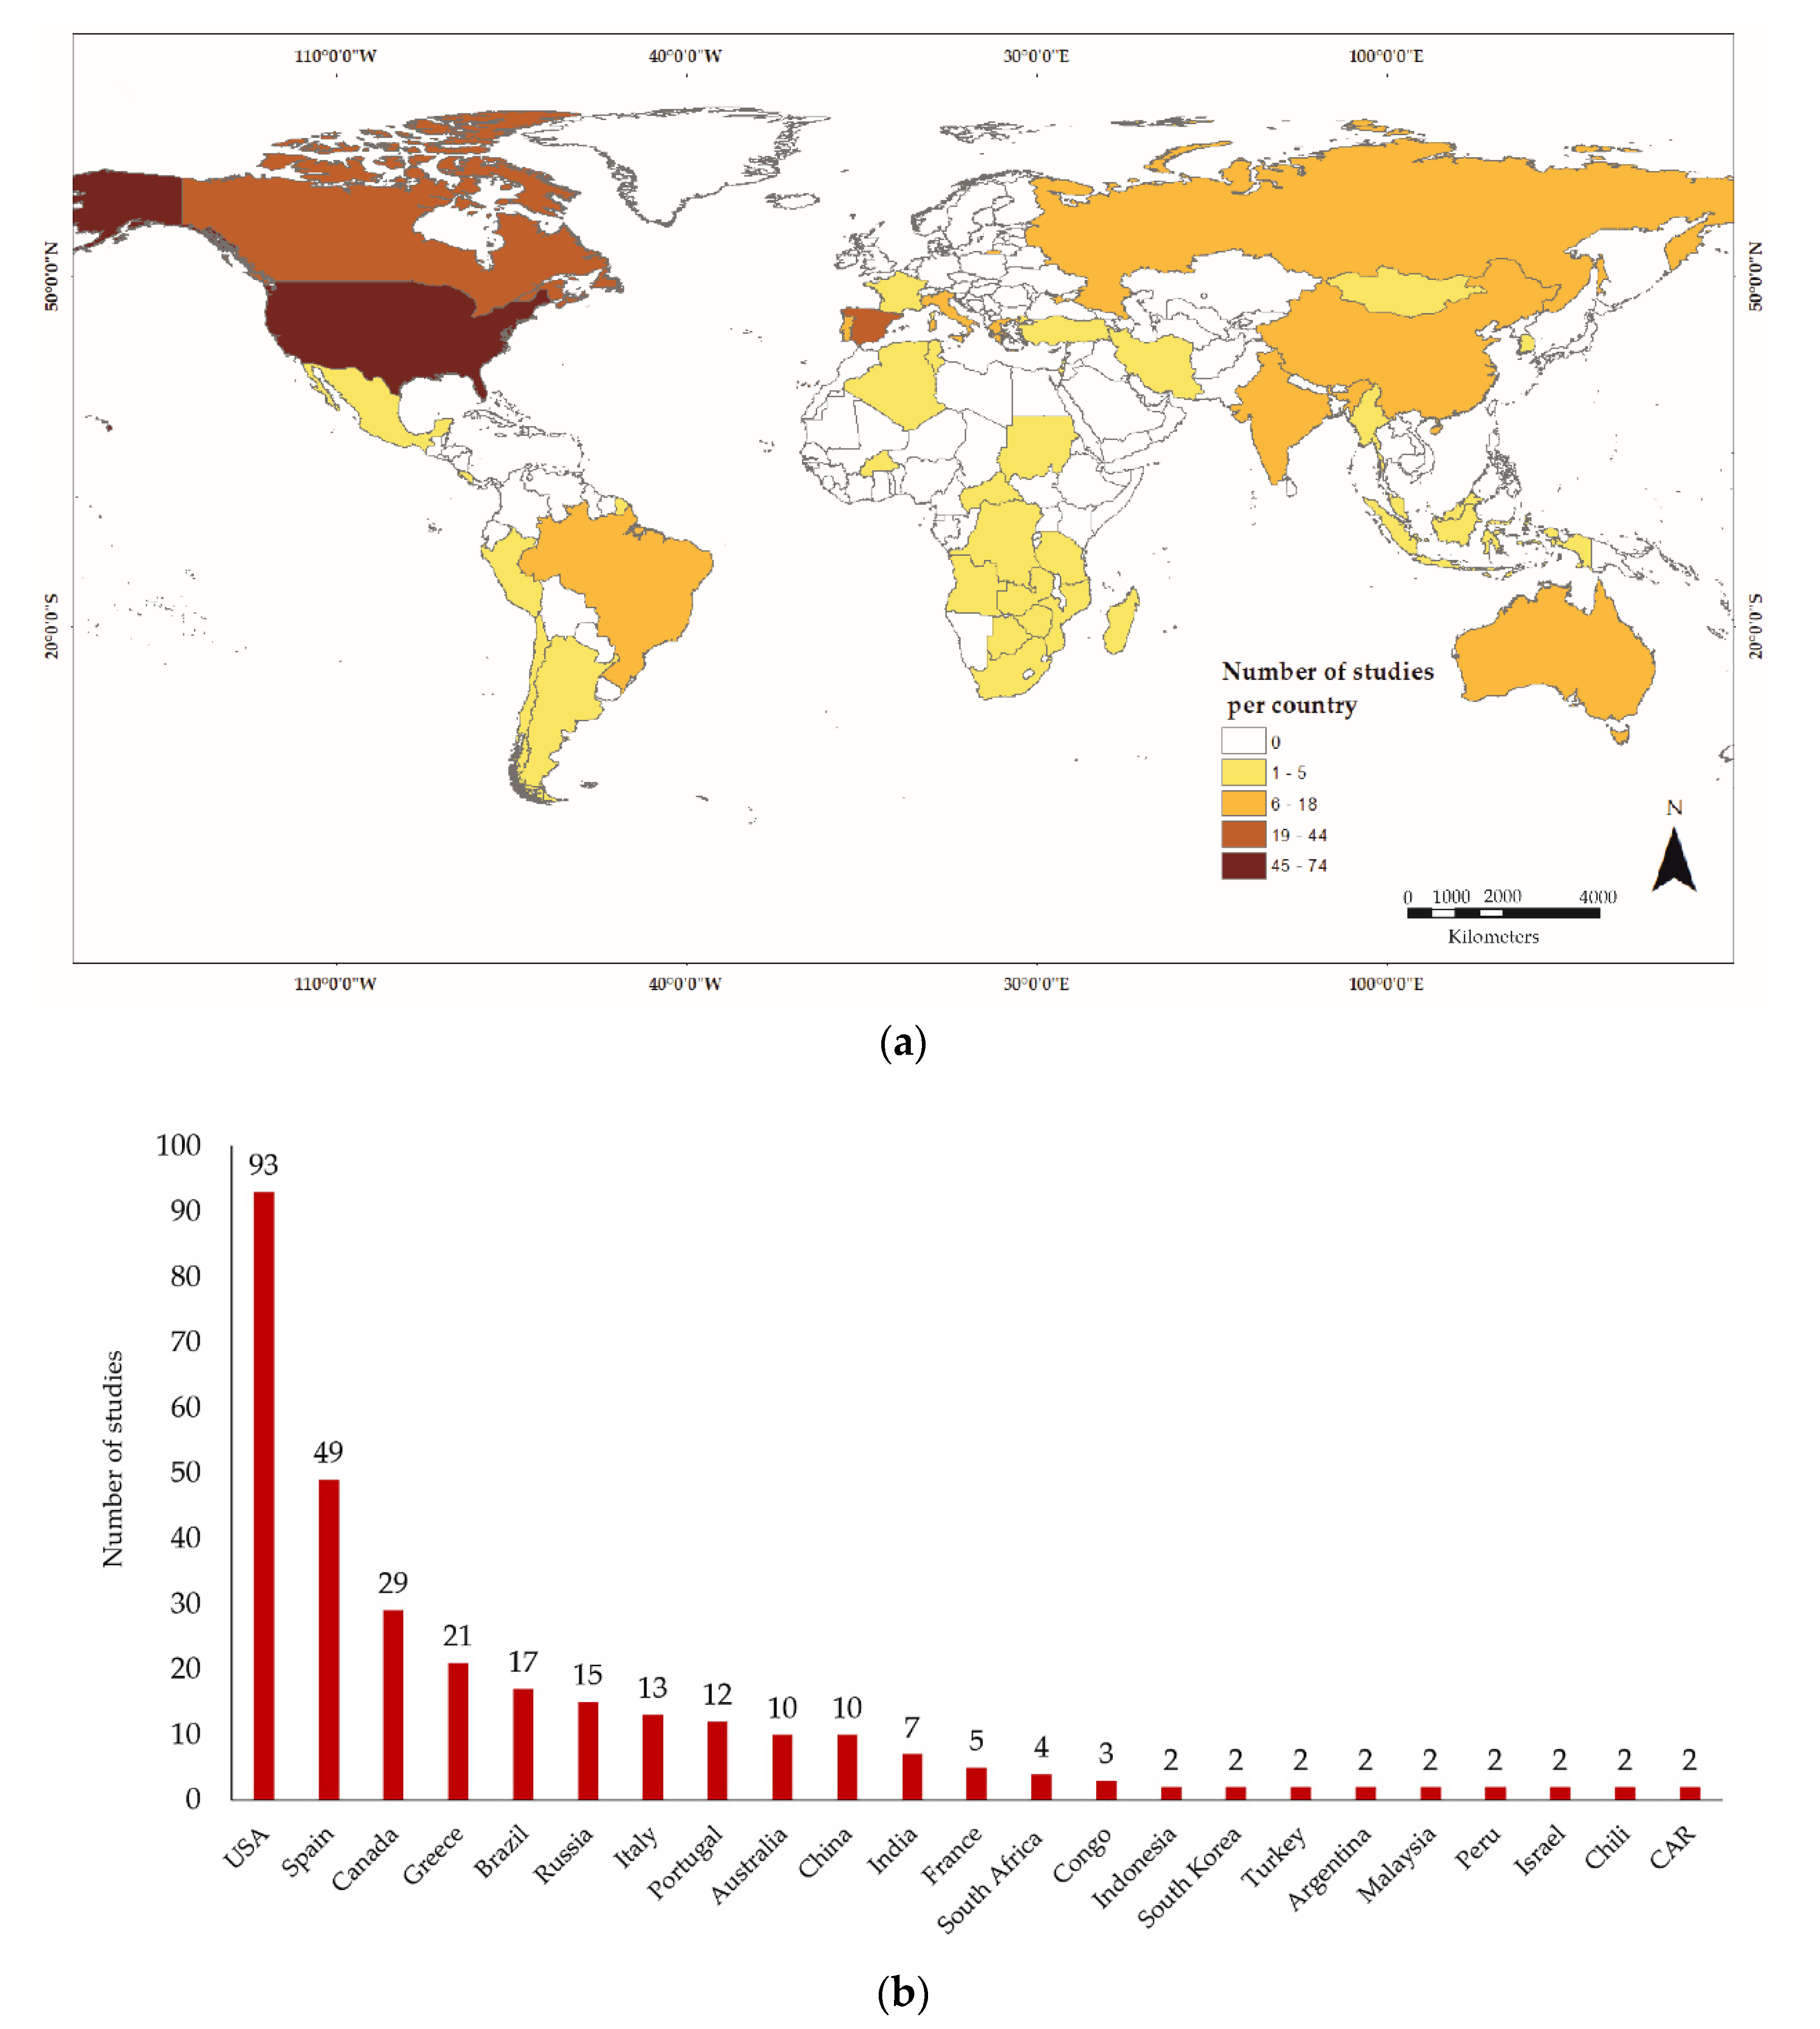
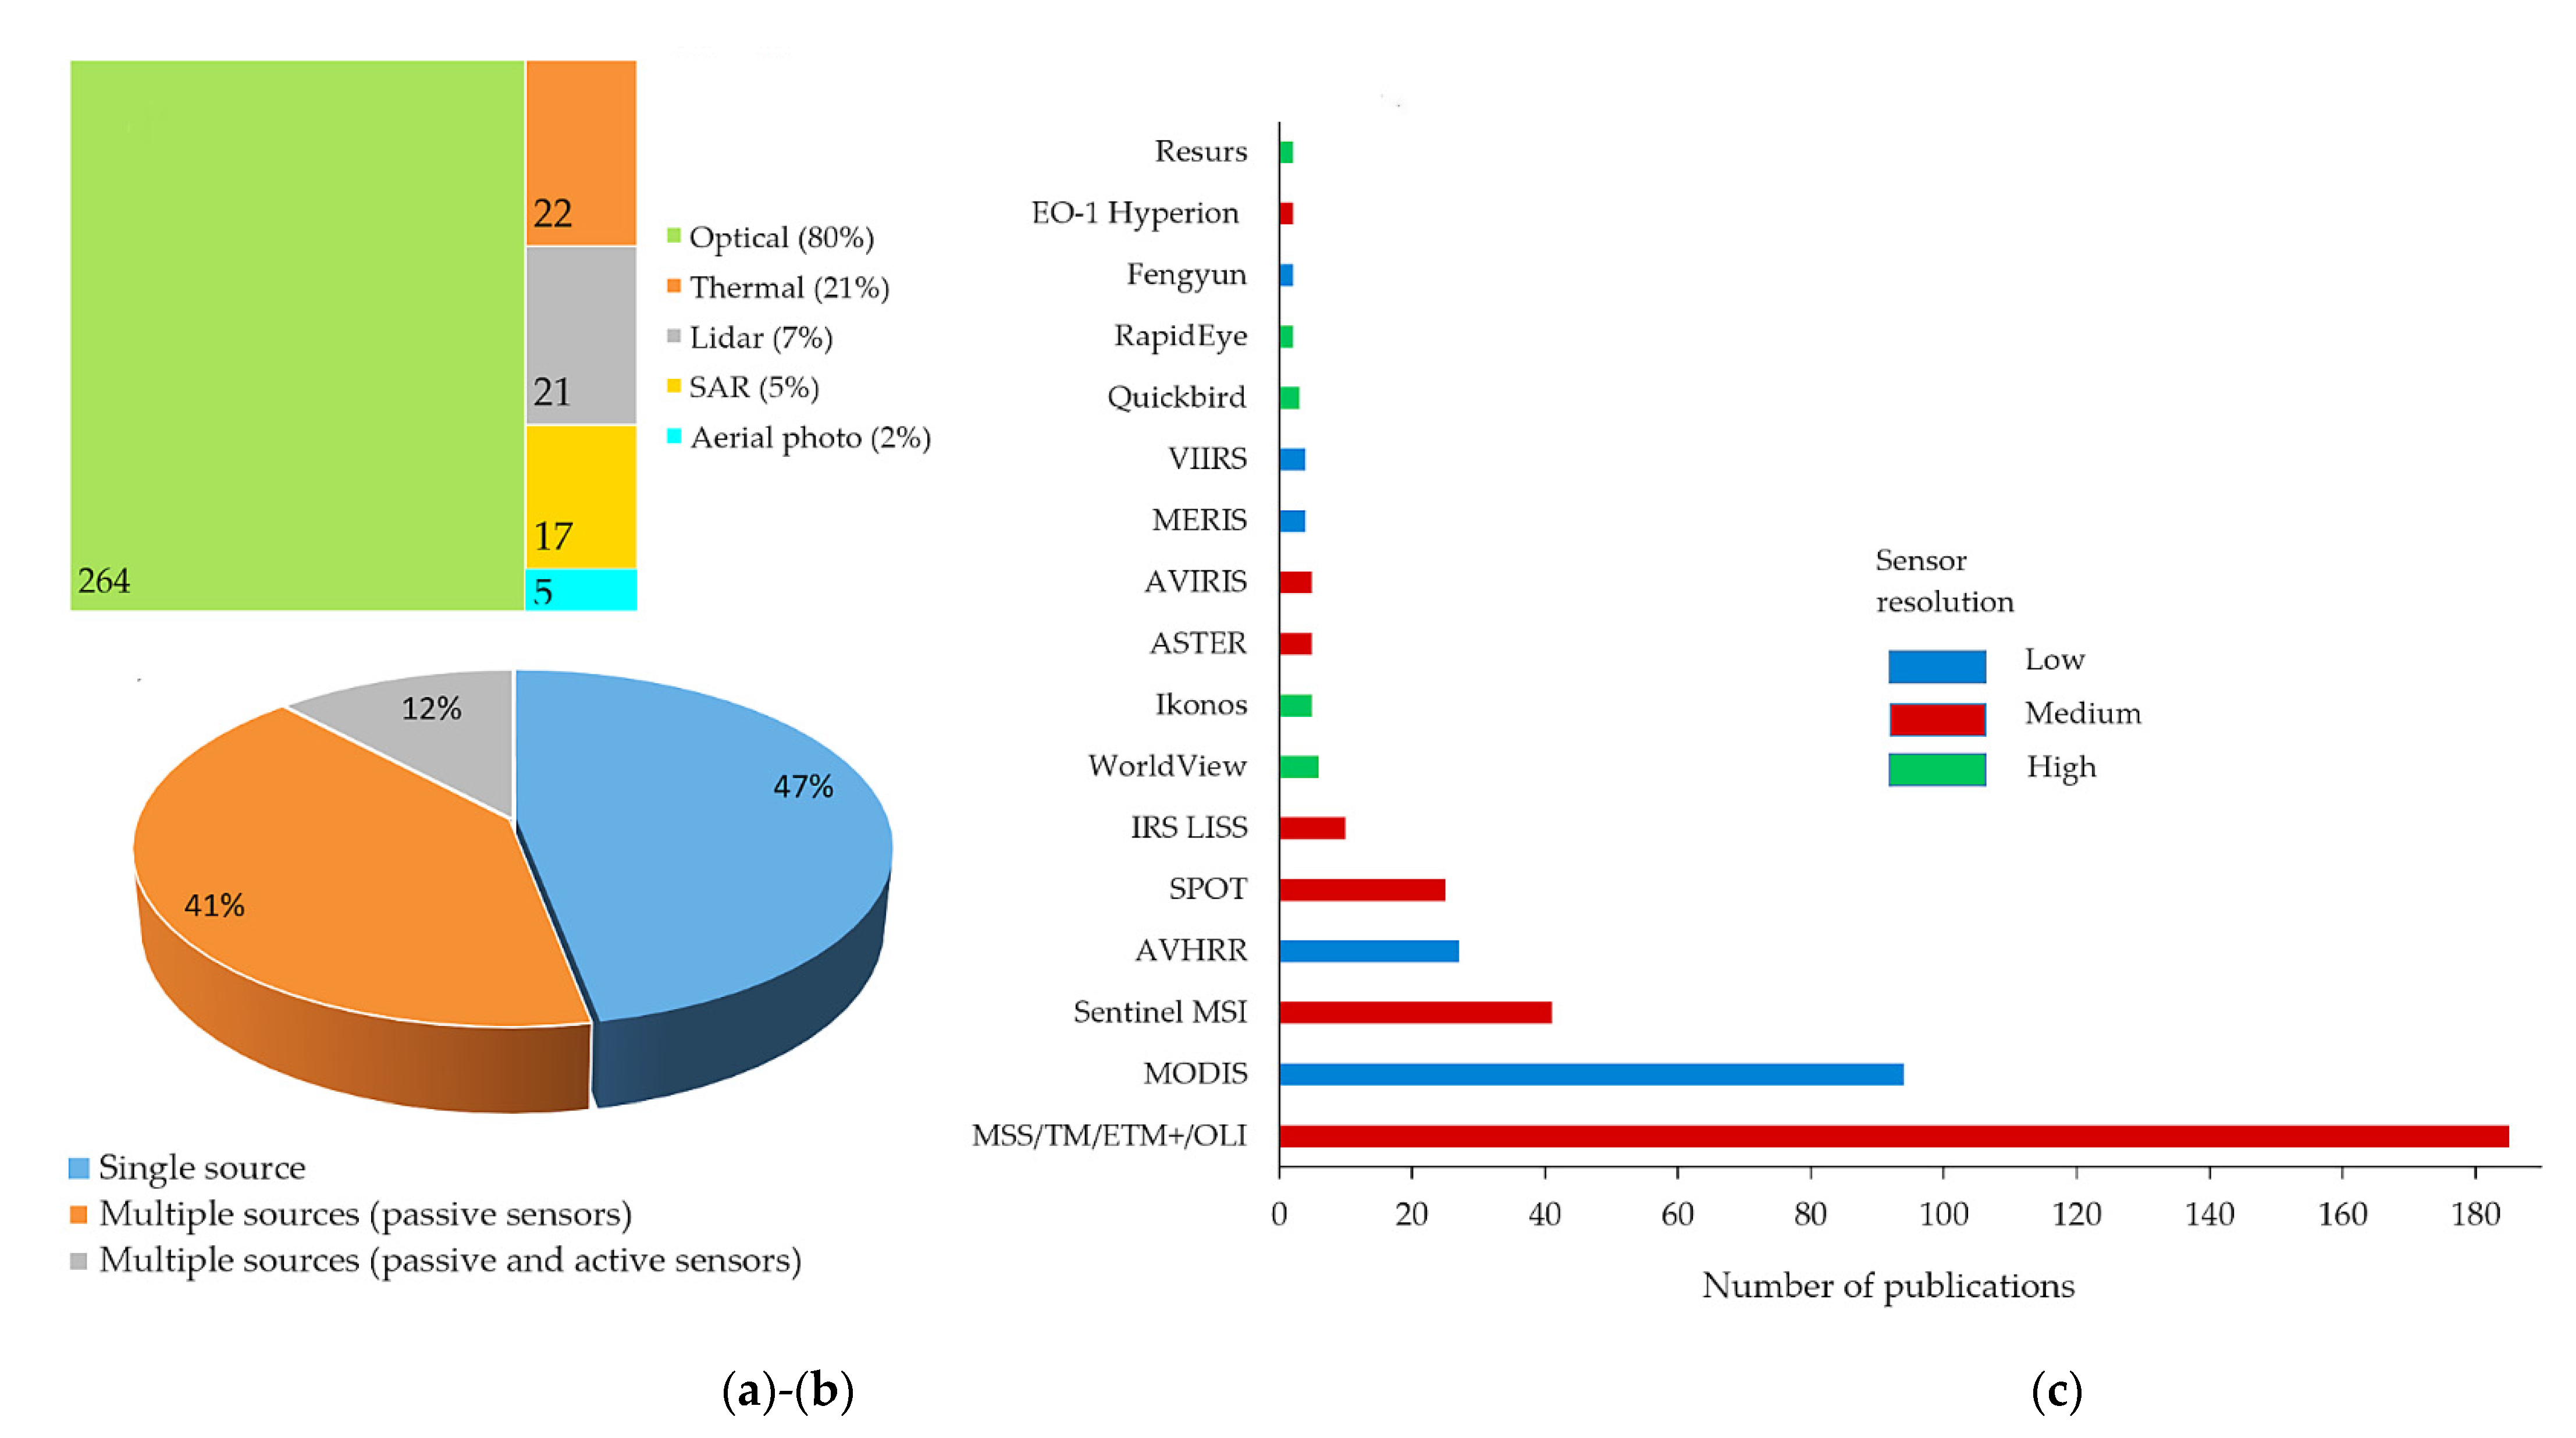
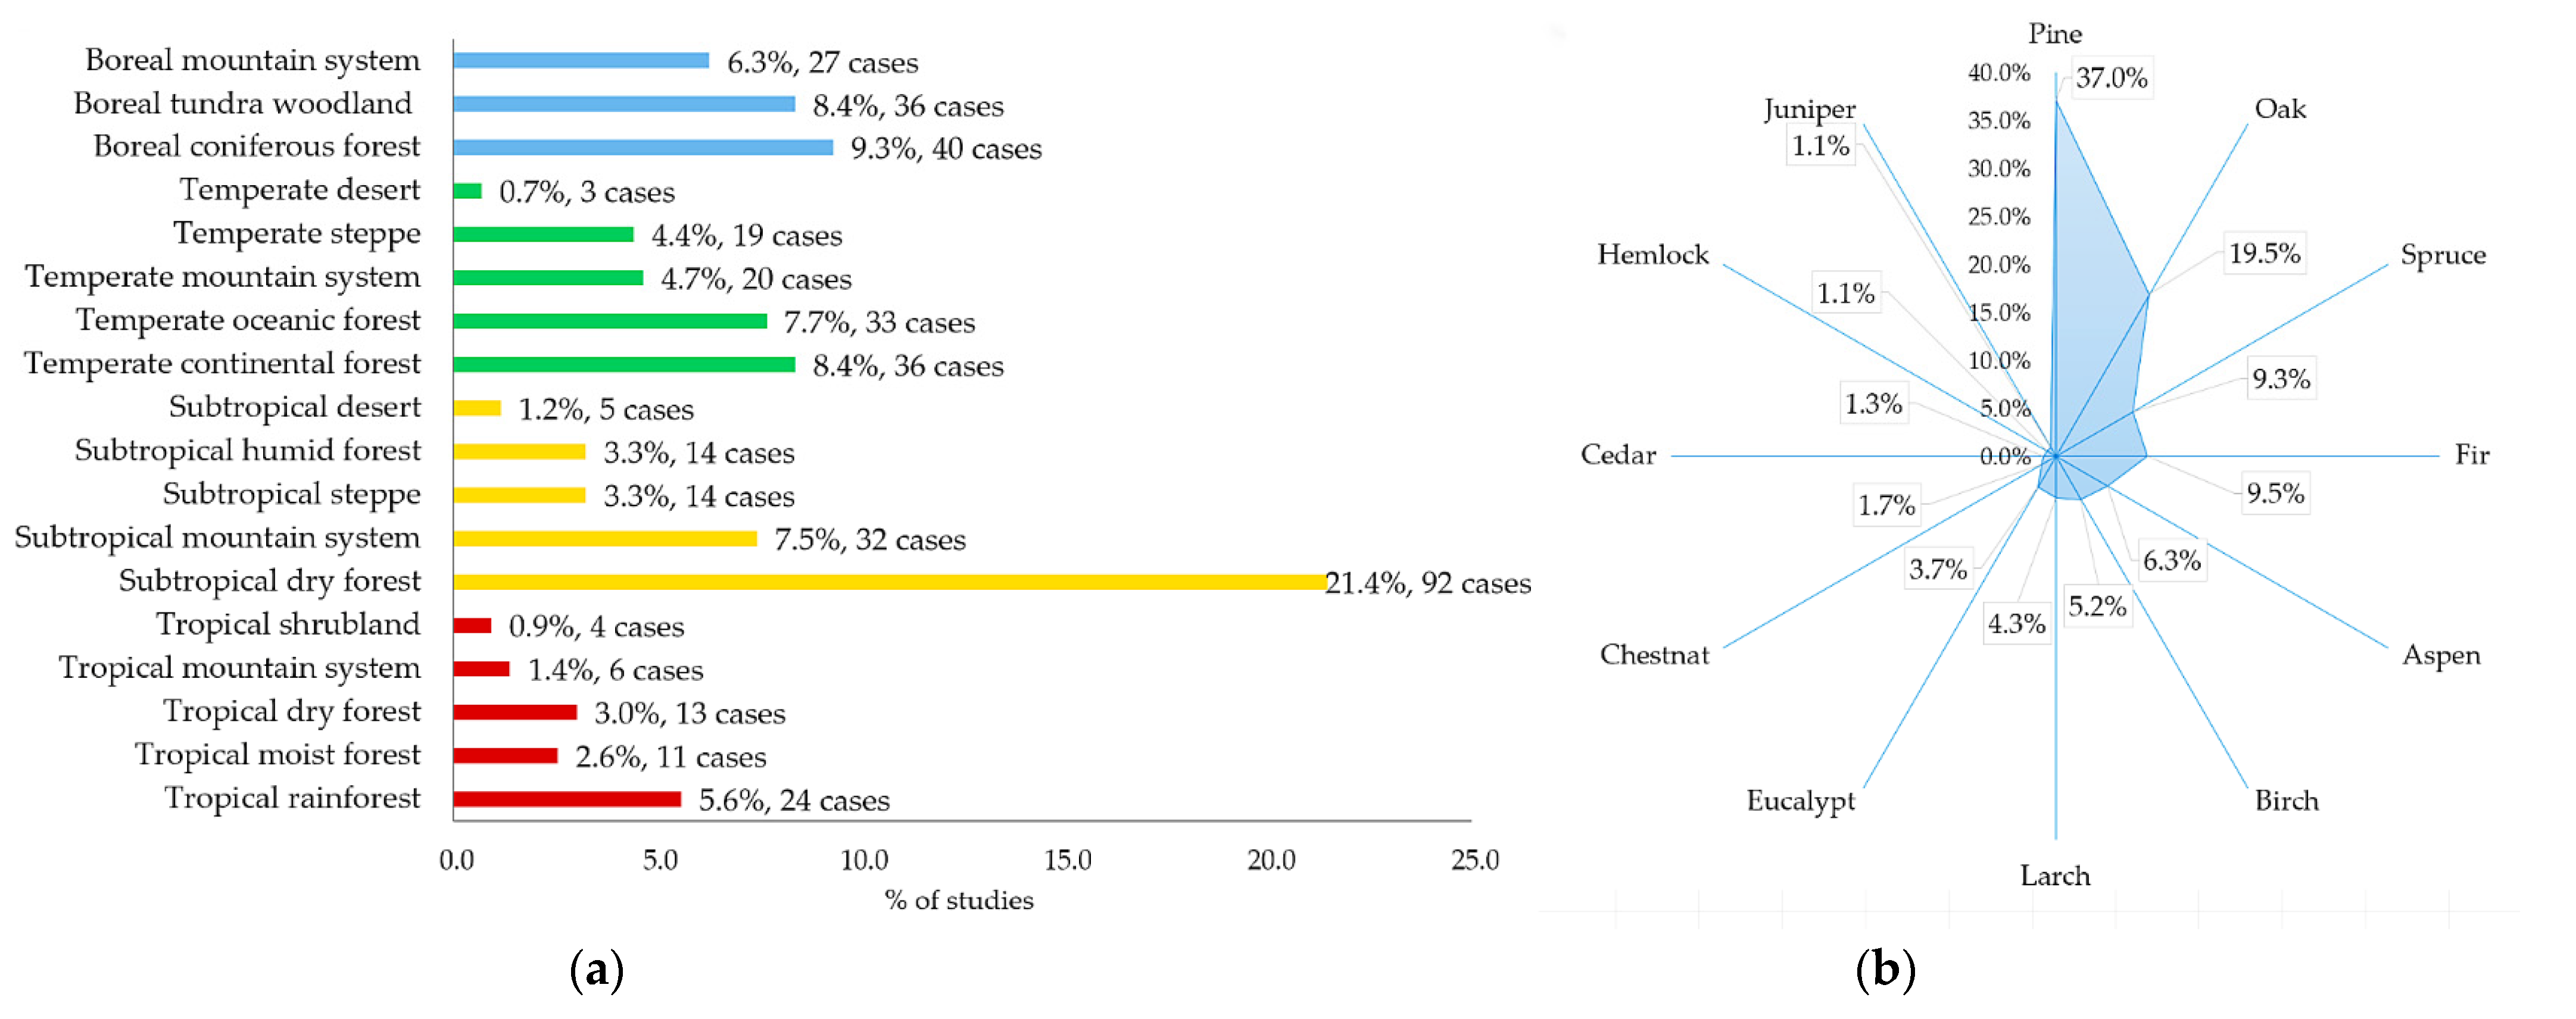
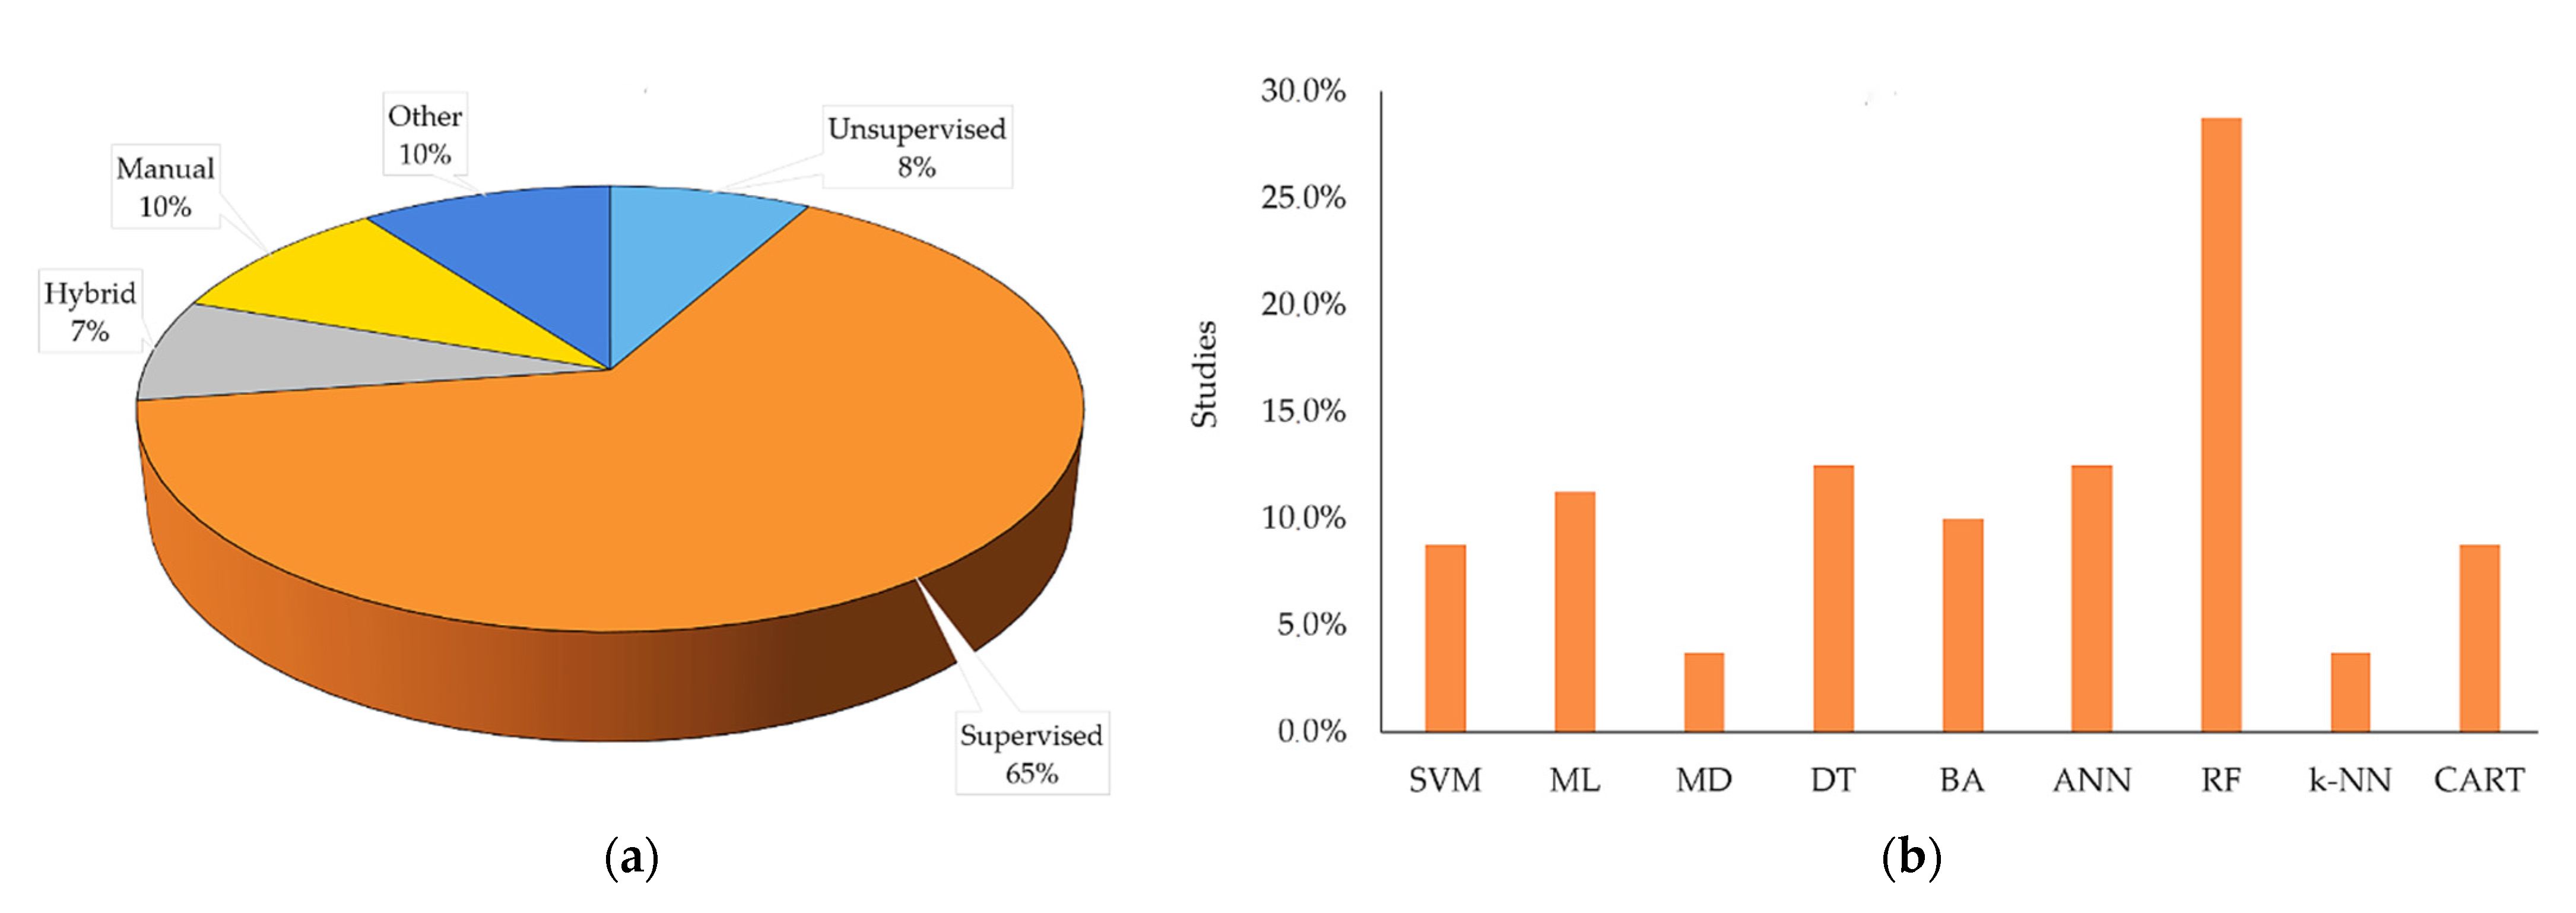
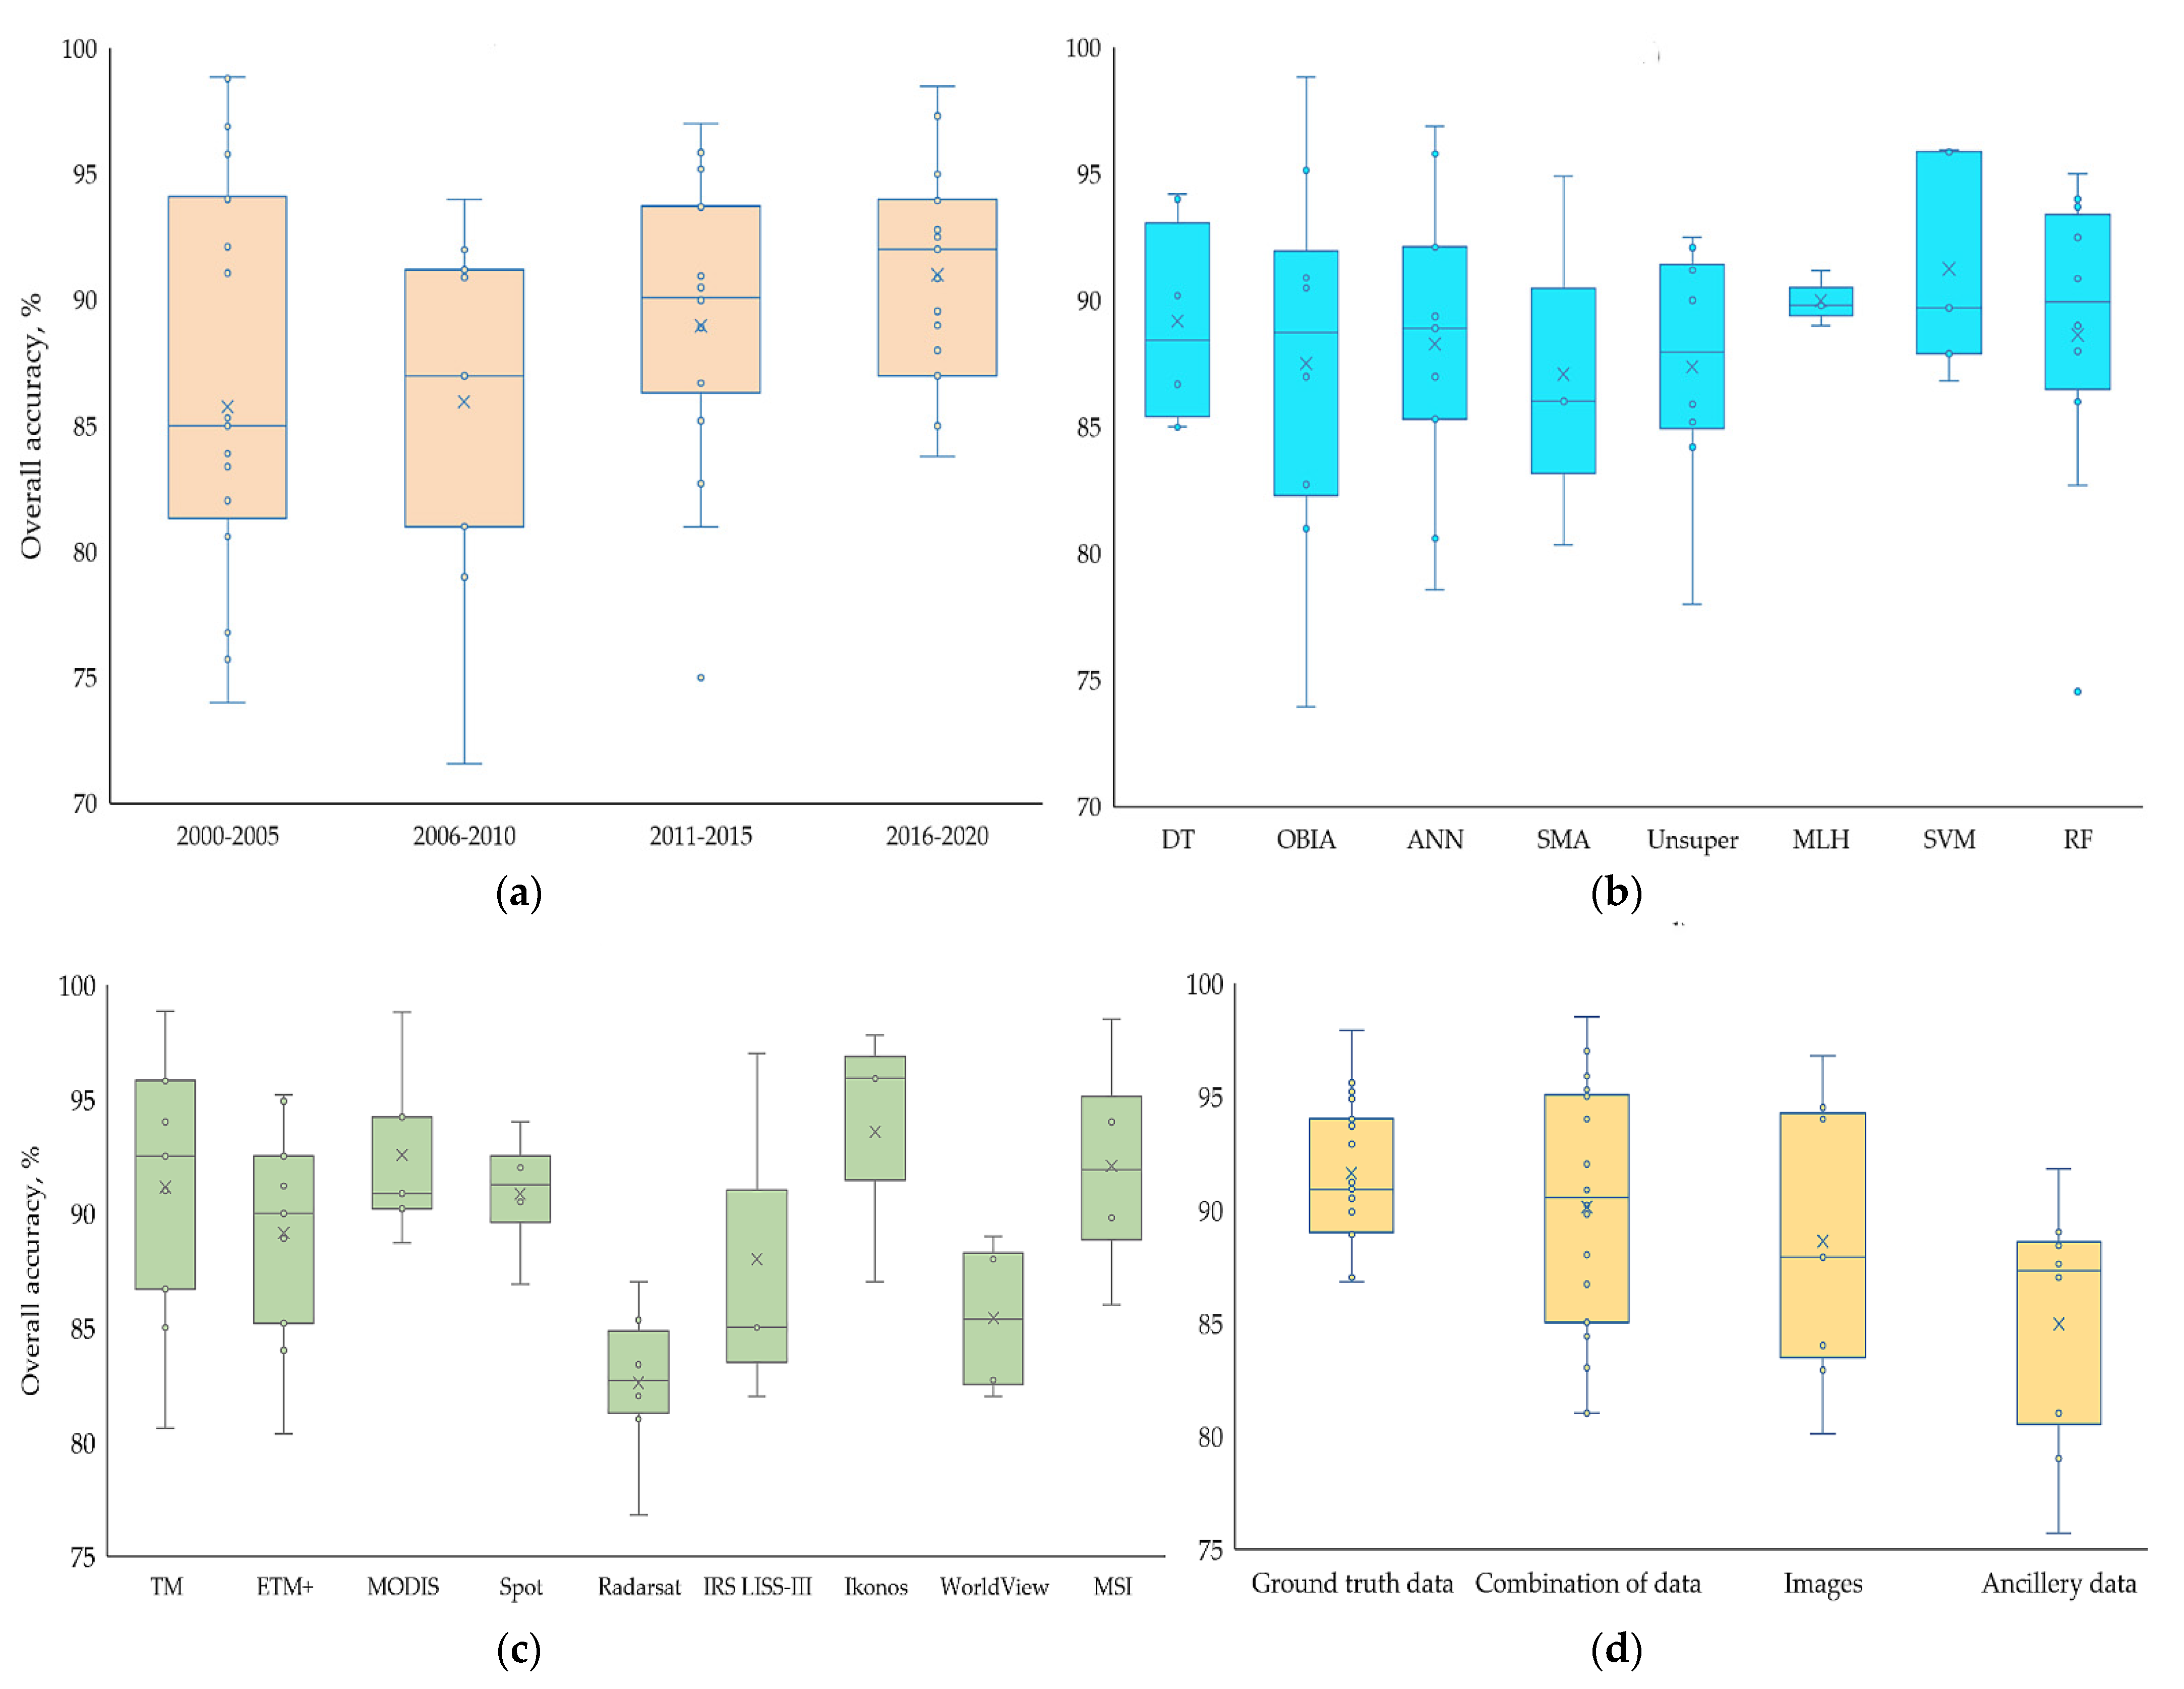
| Tree Species | Number of Studies | Tree Species | Number of Studies |
|---|---|---|---|
| Ponderosa pine (Pinus ponderosa) | 26 | Siberian larch (Larix sibirica) | 9 |
| Maritime pine (Pinus pinaster) | 24 | Dahurian Larch (Larix gmelini) | 7 |
| Black pine (Pinus nigra) | 19 | Evergreen oak (Quercus ilex) | 18 |
| Scots pine (Pinus sylvestris) | 15 | Cork oak (Quercus suber) | 10 |
| Aleppo Pine (Pinus halepensis) | 14 | Kermes oak (Quercus coccifera) | 8 |
| Lodgepole pine (Pinus contorta) | 11 | Pyrenean oak (Quercus pyrenaica) | 8 |
| Turkish pine (Pinus brutia) | 5 | Downy oak (Quercus pubescens) | 5 |
| Jack pine (Pinus banksiana) | 5 | Portuguese oak (Quercus faginea) | 4 |
| Jeffrey pine (Pinus jeffreyi) | 5 | Douglas fir (Pseudotsuga menziesii) | 19 |
| Siberian pine (Pinus sibirica) | 4 | Subalpine fir (Abies lasiocarpa) | 6 |
| Pitch pine (Pinus rigida) | 4 | White fir (Abies concolor) | 5 |
| Stone pine (Pinus pinea) | 4 | Trembling aspen (Populus tremuloides) | 17 |
| Sugar pine (Pinus Lambertiana) | 4 | Common aspen (Populus tremula) | 6 |
| Longleaf pine (Pinus palustris) | 4 | Siberian silver birch (Betula Platyphylla) | 6 |
| Black spruce (Picea Mariana) | 16 | European white birch (Betula pendula) | 5 |
| White spruce (Picea glauca) | 12 | American white birch (Betula papyrifera) | 5 |
| Siberian spruce (Picea obovata) | 4 | Blue gum (Eucalyptus globulus) | 4 |
| Engelmann spruce (Picea engelmannii) | 5 | Darwin stringybark (Eucalyptus tetrodonta) | 4 |
| Sensor | Index | Description | Temporal Period | Number of Studies | % of Total Studies |
|---|---|---|---|---|---|
| MSS, TM, ETM+, OLI, AVHRR, MODIS, MISR, IRS WiFS, QuickBird, Ikonos OSA, Sentinel-2 MSI, SPOT VGT, RapidEye REIS, GeoEye GIS, WorldView-2,3 | NDVI | Normalised Differenced Vegetation Index | 2000–2020 | 128 | 23.4 |
| TM, ETM+, OLI, MODIS, QuickBird, MSI, VGT, REIS, WorldView-2/3 | dNBR | Delta Normalized Burn Ratio | 2005–2020 | 81 | 14.8 |
| TM, ETM+, OLI, MODIS, QuickBird, MSI, VGT, REIS, WorldView-2/3 | NBR | Normalized Burn Ratio 1 (ND4/7) | 2005–2020 | 77 | 14.1 |
| TM, ETM+, MSI, AVHRR, MODIS | CBI | Composite Burn Index | 2005–2020 | 34 | 6.2 |
| TM, ETM+, OLI, MSI | RdNBR | Relative Differenced Normalized Burn Ratio | 2007–2020 | 32 | 5.8 |
| ETM+, SPOT VGT, MODIS, QuickBird | dNDVI | Delta Normalised Differenced Vegetation Index | 2006–2020 | 22 | 4.0 |
| TM, ETM+, MODIS, WorldView-2/3 | EVI | Enhanced Vegetation Index | 2010–2020 | 21 | 3.8 |
| TM, ETM+, MODIS, WorldView-2/3, IRS AWiFS, QuickBird | BAI | Burn Area Index | 2002–2020 | 18 | 3.3 |
| TM, ETM+, MSI, MODIS | NDWI | Normalized Difference Water Index | 2003–2020 | 17 | 3.1 |
| TM, ETM+, WorldView-2/3, QuickBird | SAVI | Soil Adjusted Vegetation Index | 2002–2020 | 13 | 2.4 |
| TM, ETM+, MODIS | GEMI | Global Environmental Monitoring Index | 2002–2020 | 12 | 2.2 |
| TM, ETM+, MODIS | MIRBI | Mid-Infrared Burnt Index | 2006–2020 | 12 | 2.2 |
| TM, ETM+, WorldView-2/3, QuickBird | MSAVI | Modified Soil Adjusted Vegetation Index | 2012–2020 | 12 | 2.2 |
| TM, ETM+, OLI | NBR2 | Normalized Burn Ratio 2 (ND4/5) | 2005–2020 | 9 | 1.6 |
| TM, ETM+, MODIS | LST | Land Surface Temperature | 2014–2020 | 8 | 1.5 |
| TM, MODIS, WorldView-2/3 | GeoCBI | Geometrically structured Composite Burn Index | 2010–2020 | 7 | 1.3 |
| TM, ETM+, MODIS, WorldView-2/3, MSI | LAI | Leaf Area Index | 2008–2020 | 6 | 1.1 |
| TM, ETM+ | CSI | Char Soil Index | 2012–2020 | 6 | 1.1 |
| MODIS | BAIM | MODIS Burned Area Index | 2009–2020 | 5 | 0.9 |
| MSI, OLI | RBR | Relative Burn Ratio | 2018–2020 | 5 | 0.9 |
| ETM, SPOT VGT | SWVI | Normalized short-wave-based vegetation index | 2002–2020 | 4 | 0.7 |
| TM, ETM+ | NBRT | Normalised Burn Ratio Thermal | 2018–2020 | 4 | 0.7 |
| AVHRR, MODIS | BBFI | Burned Boreal Forest Index | 2012–2020 | 3 | 0.5 |
| TM, ETM+, WorldView-2 | RVI | Ratio Vegetation Index | 2012–2020 | 3 | 0.5 |
| TM, ETM+, OLI | DI | Disturbance index | 2014–2020 | 3 | 0.5 |
| TM, ETM+ | BSI | Burn Scar Index | 2011–2020 | 3 | 0.5 |
| TM, ETM+ | NDII | Normalized Difference Infrared Index | 2014–2020 | 3 | 0.5 |
| Reference Data | Kappa Coefficient | Omission Error | Commission Error | Overall Accuracy | R2/RMSE | Number of Studies |
|---|---|---|---|---|---|---|
| Ground truth data (field survey, CBI, GPS point) | 20 | 17 | 17 | 20 | 10 | 49 |
| Images (Google Earth, high resolution, aerial photo) | 9 | 8 | 8 | 10 | 17 | 31 |
| Ancillary data (forest inventory, forest BA maps, Land use land cover) | 10 | 9 | 8 | 9 | 16 | 37 |
| Combination of above data | 10 | 8 | 8 | 9 | 18 | 34 |
| Total number of studies | 49 | 41 | 49 | 48 | 61 | 151 |
Publisher’s Note: MDPI stays neutral with regard to jurisdictional claims in published maps and institutional affiliations. |
© 2022 by the authors. Licensee MDPI, Basel, Switzerland. This article is an open access article distributed under the terms and conditions of the Creative Commons Attribution (CC BY) license (https://creativecommons.org/licenses/by/4.0/).
Share and Cite
Kurbanov, E.; Vorobev, O.; Lezhnin, S.; Sha, J.; Wang, J.; Li, X.; Cole, J.; Dergunov, D.; Wang, Y. Remote Sensing of Forest Burnt Area, Burn Severity, and Post-Fire Recovery: A Review. Remote Sens. 2022, 14, 4714. https://doi.org/10.3390/rs14194714
Kurbanov E, Vorobev O, Lezhnin S, Sha J, Wang J, Li X, Cole J, Dergunov D, Wang Y. Remote Sensing of Forest Burnt Area, Burn Severity, and Post-Fire Recovery: A Review. Remote Sensing. 2022; 14(19):4714. https://doi.org/10.3390/rs14194714
Chicago/Turabian StyleKurbanov, Eldar, Oleg Vorobev, Sergey Lezhnin, Jinming Sha, Jinliang Wang, Xiaomei Li, Janine Cole, Denis Dergunov, and Yibo Wang. 2022. "Remote Sensing of Forest Burnt Area, Burn Severity, and Post-Fire Recovery: A Review" Remote Sensing 14, no. 19: 4714. https://doi.org/10.3390/rs14194714
APA StyleKurbanov, E., Vorobev, O., Lezhnin, S., Sha, J., Wang, J., Li, X., Cole, J., Dergunov, D., & Wang, Y. (2022). Remote Sensing of Forest Burnt Area, Burn Severity, and Post-Fire Recovery: A Review. Remote Sensing, 14(19), 4714. https://doi.org/10.3390/rs14194714