Article

Cooling by Cyprus Lows of Surface and Epilimnion Water in Subtropical Lake Kinneret in Rainy Seasons

1
Department of Geophysics, Tel Aviv University, Tel Aviv 69978, Israel
2
Kinneret Limnological Laboratory, Israel Oceanographic and Limnological Research, Migdal 1495000, Israel
*
Author to whom correspondence should be addressed.
Remote Sens. 2022, 14(19), 4709; https://doi.org/10.3390/rs14194709
Submission received: 7 August 2022 / Revised: 14 September 2022 / Accepted: 16 September 2022 / Published: 21 September 2022

Abstract

:
Comparison between high-precipitation (HP) years and low-precipitation (LP) years led to our main findings which are as follows: Cyprus lows are instrumental in the cooling of surface and epilimnion water in subtropical Lake Kinneret and in the cooling of eastern Mediterranean surface water. Cyprus lows are responsible for cold weather, rainfall, and for an increase in cloudiness causing a decrease in solar radiation over the eastern Mediterranean and north Israel (including Lake Kinneret). In the daytime, comparison between HP and LP years of Kinneret surface water temperature (SWT) and epilimnion water temperature (WT) showed water cooling of up to 2 °C in HP years. This study was carried out using the 21-year period of satellite and in-situ data: (1) MODIS 1 km × 1 km resolution records of SWT, in (2) shipboard measurements of WT vertical profiles down to a depth of ~40 m (2000–2020). We found that a decrease in solar radiation caused by Cyprus lows (due to an increase in cloudiness) was the main factor contributing to Kinneret water cooling. In winter (December–January) when solar radiation (SR) was minimal, no water cooling was observed: the WT difference between HP and LP years was insignificant. However, in spring (March–April) when SR increased and became the main factor contributing to water heating, water cooling was observed: SWT and epilimnion WT, averaged over the HP years, was lower by ~2 °C and ~1.4 °C, respectively, than SWT and epilimnion WT, averaged over the LP years. Not only was water cooling observed in Lake Kinneret, but also in eastern Mediterranean surface water. Comparison of SWT over the eastern Mediterranean between the same HP and LP years in spring showed SWT cooling by ~1.2 °C. This is evidence of the regional character of the daytime water-cooling phenomenon caused by Cyprus lows.

1. Introduction

Over the last several decades, increasing trends in lake surface and epilimnion water temperature (WT) have been observed in subtropical lakes in the presence of atmospheric warming accompanied by significant variations in precipitation [1,2,3].
Lake Kinneret (aka Sea of Galilee) is a subtropical lake located in the northern section of the Jordan Rift valley. Lake Kinneret is isothermal in winter and stratified in spring, summer, and fall, in accordance with Hambright et al. [4]. This indicates that solar radiation is responsible for the appearance and formation of lake thermal stratification. Using satellite Moderate Resolution Imaging Spectroradiometer (MODIS) data, earlier research by Kishcha et al. [5] on surface water temperature (SWT) (measured in the skin layer of 10–20 microns) revealed the absence of SWT trends in the summer months despite the presence of increasing atmospheric warming during the period (2003–2019). Their findings were explained by the influence of increasing evaporation on SWT trends. The increasing water cooling, due to increasing evaporation, compensated for increased heating of surface water by regional atmospheric warming, resulting in the absence of SWT trends. In contrast to satellite measurements, in situ shipboard measurements of near-surface water temperature in Lake Kinneret in summer showed an increasing trend of 0.7 °C decade−1 [5].
Climate models were used to evaluate the likely impact of climate change on Lake Kinneret, in accordance with Gal et al. [6], by Rimmer et al. [7] and La Fuente et al. [8]. Using a combination of high-resolution regional climate models together with a lake evaporation model, Rimmer et al. [7] predicted an increase of 0.10–0.25% in Kinneret evaporation annually: this corresponds to an increase of up to 11% by the year 2060. The predicted increase in evaporation was accompanied by a decrease of 0.8% in annual precipitation corresponding to a decrease of up to 36% by the year 2060 [7]. Similar model predictions were obtained by La Fuente et al. [8]. Using ensemble model predictions, they showed an increase of 25% in evaporation and a decrease of 33% in precipitation, resulting in a 58% decline in the water availability of Lake Kinneret by the end of the 21st century [8].
Yearly variations in Kinneret water levels from 1990 to 2020 revealed significant interannual fluctuations: from the maximal water level of ~209 m below sea level (b.s.l.) in 1995 (when the Degania dam in the south Kinneret was fully opened) to the minimal water level of 214 m b.s.l. in 2002 (significantly reducing water supply for domestic use) [5,9]. Such significant fluctuations of Kinneret water levels were caused by considerable changes in precipitation. Cyprus lows are the main reason for precipitation over Lake Kinneret during the rainy season (December–May): these lows are centered over the Mediterranean Island of Cyprus, according to Saaroni et al. [10], Alpert et al. [11], Shay-El and Alpert [12], and Ziv et al. [13]. Cyprus lows are responsible for cold weather conditions when westerly winds transport cold moist air from the eastern Mediterranean into north Israel (including Lake Kinneret) [13]. This suggests that cold weather conditions accompanied by rainfall and a decrease in solar radiation (due to an increase in cloudiness over the lake) could influence Kinneret WT during rainy seasons. Such effects of Cyprus lows on Kinneret SWT and on WT at various depths have not been investigated in previous studies.
The aim of our study was to investigate the influence of Cyprus lows on surface and epilimnion water temperature in subtropical Lake Kinneret in rainy seasons. This was carried out using the 21-year period of satellite-based MODIS 1 km × 1 km resolution records of SWT in addition to in situ shipboard measurements of WT vertical profiles (2000–2020).

2. Materials and Method
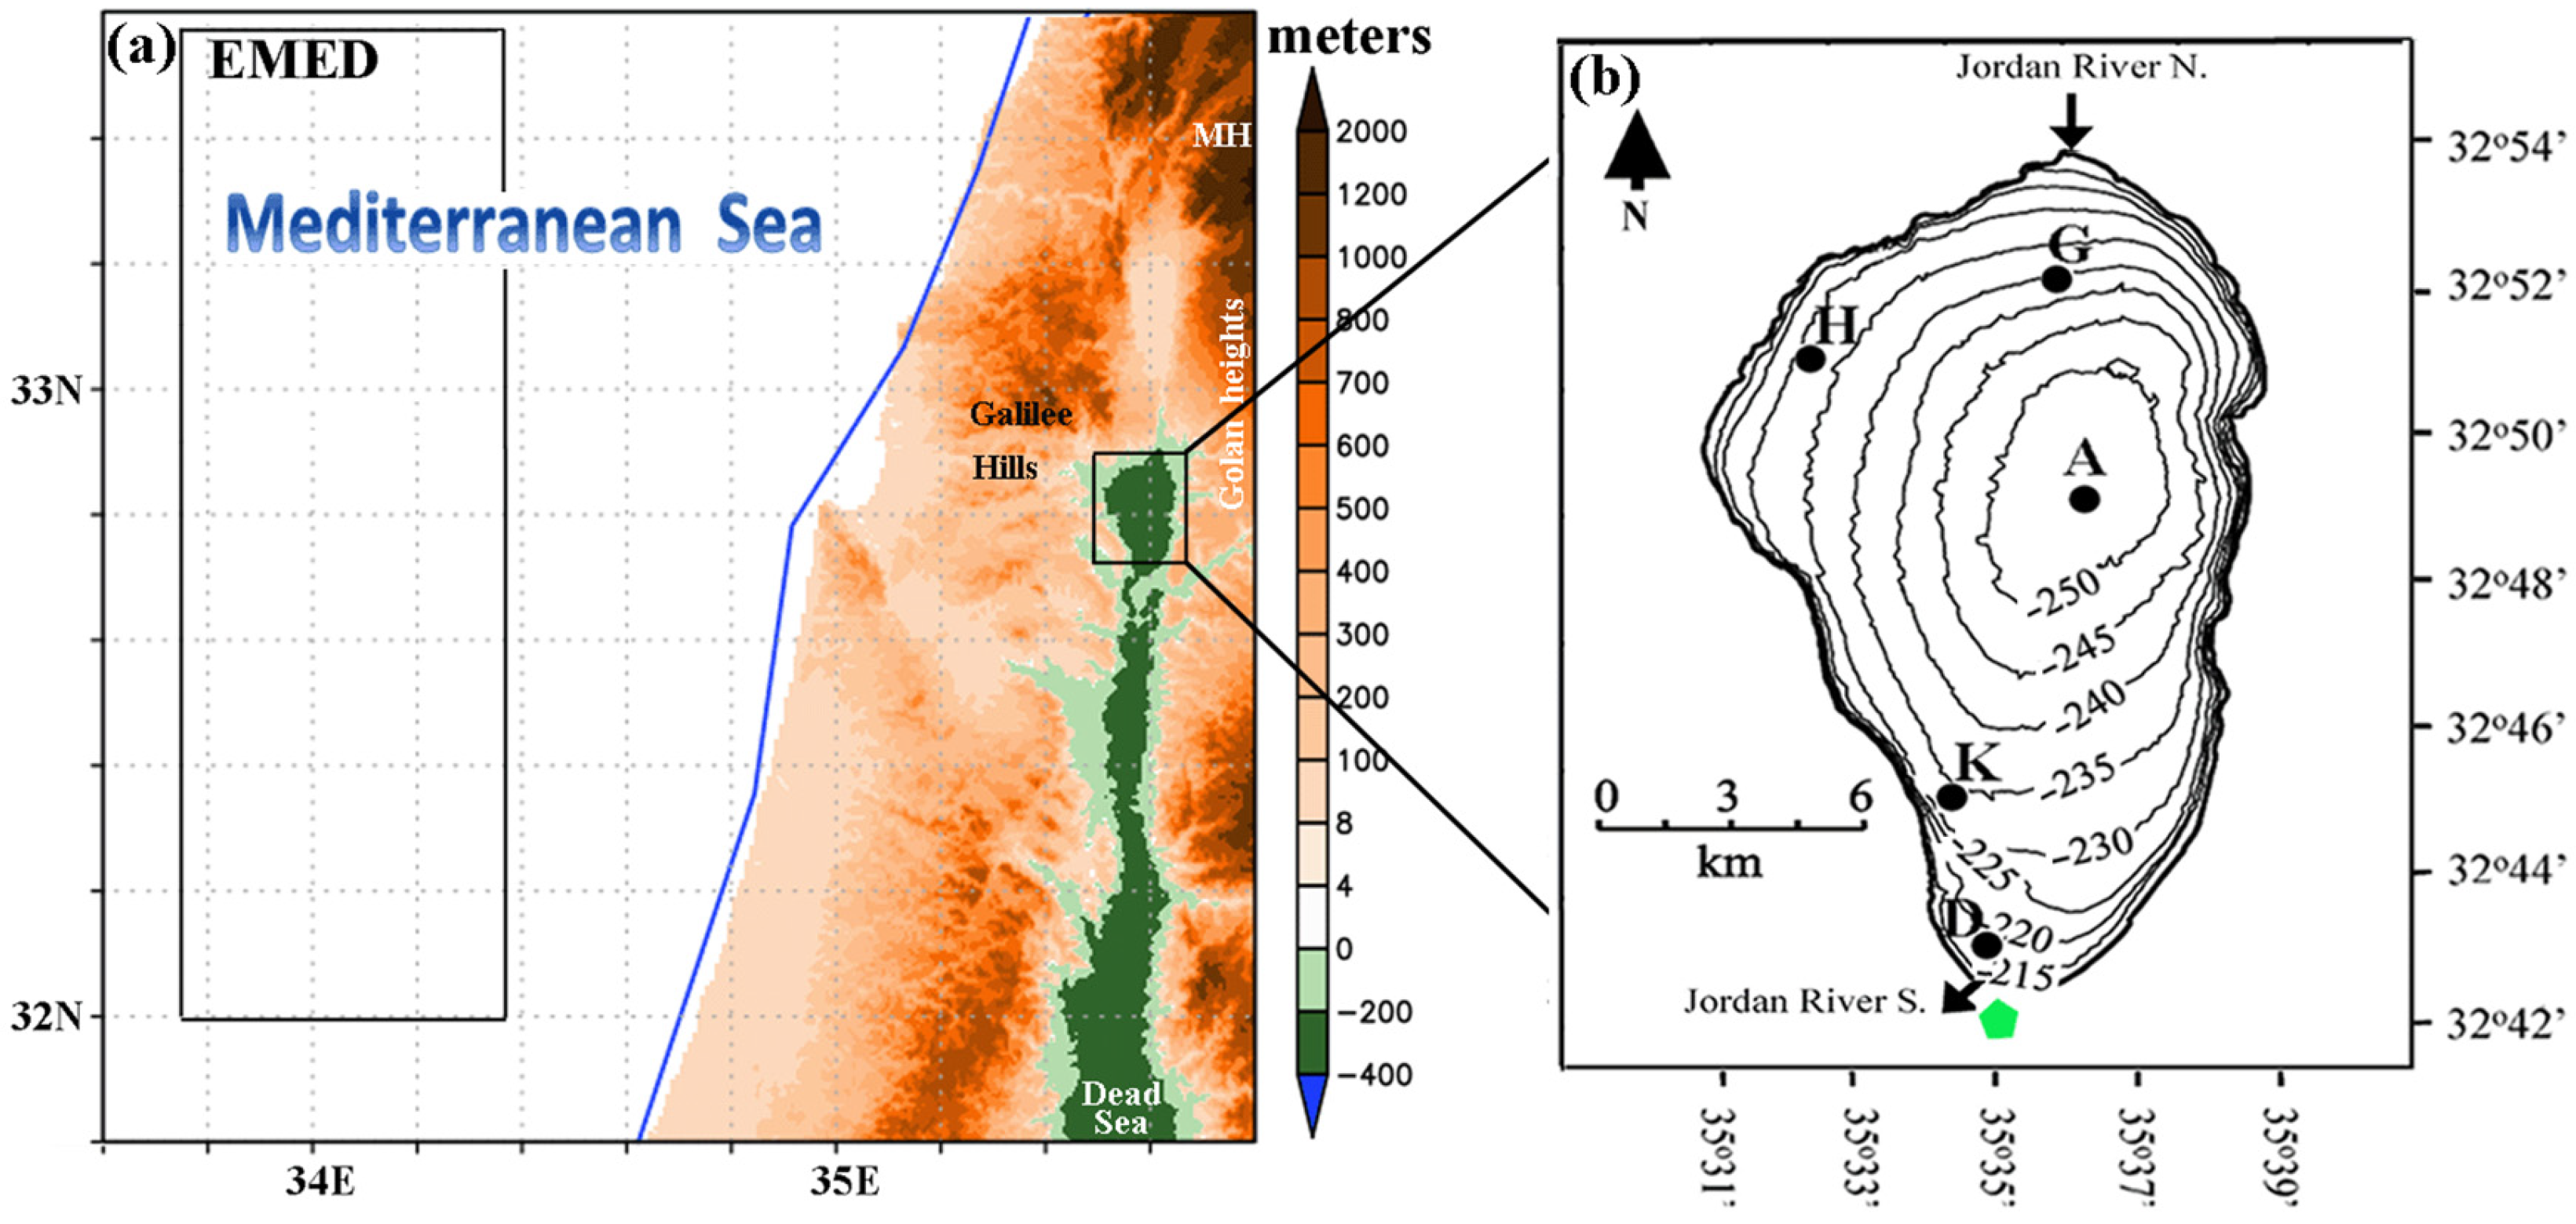
2.1. Study Area

We focused on the region (32°42′N–32°54′N, 35°29′E–35°39′E) covering Lake Kinneret and surrounding areas (Figure 1). North of Kinneret Lake is Mount Hermon of 2800 m height; the Galilee Hills are to the west of the lake, while the Golan Heights are to the east. South of Kinneret Lake is the Dead Sea (Figure 1a). The lake is located at approximately 210 m b.s.l.
Its surface area is 166 km2, and the maximal depth is ~40 m, with the west side being shallower than the east side (Figure 1b). The Kinneret watershed area measures ~2730 km2 (Figure 2). The lake is mainly fed by the north Jordan River, draining up to 1700 km2 of the watershed, by runoff from the Golan Heights, and to a minor extent by underground springs [14]. According to the policy of the Israeli Water Authority, water outflow through the Degania dam was not permitted in previous years when the lake level remained low. Only in exceptionally high rainfall years, such as 1995, was the Degania dam opened and water released to the southern Jordan River [15]. Since 1995, the dam has not been opened. Lake Kinneret supplies ~ 500 106 m3 year−1 for domestic purposes in Israel and Jordan, in accordance with Doron [16].
The Lake Kinneret area is characterized by a high annual averaged air temperature equal to 21 °C and by a maximal summer air temperature exceeding 36 °C [13]. The long-term mean minimum air temperature for January is around 10 °C [13].
In the hot season (June–September), there is no precipitation in the Kinneret region. However, in the rainy season (December–May), rainfall of ~400 mm per year takes place over the lake itself and ~700 mm per year over the surrounding areas, according to Ziv et al. [13]. They found that the main cause of rainfall over north Israel, including Lake Kinneret, is Cyprus lows. Cyclone studies of the northern hemisphere have shown that the Mediterranean Sea is a highly cyclogenetic region, particularly in winter, according to Petterssen [18]. Mediterranean cyclones, which pass, intensify, or even develop over the Mediterranean Island of Cyprus, are named Cyprus lows [10,11,12]. In accordance with Saaroni et al. [10] and Alpert et al. [11], most of the Cyprus lows occur during the rainy season (December–May).
As an illustration, such a Cyprus low was created over the eastern Mediterranean on 12 December 2010 (Figure 3). The spatial distribution of sea level pressure showed a depression centered over the Mediterranean Island of Cyprus (Figure 3b). This Cyprus low passed along the north of Israel and produced westerly winds transporting cold moist air and significant cloudiness from the eastern Mediterranean into north Israel (Figure 3a,c). As a result, on that day at 10:30 LT when MODIS crossed the lake, cold weather influenced the Kinneret watershed area: this was accompanied by rainfall of ~50 mm/day and by a decrease in solar radiation (SR) by ~100 W/m2 compared to the 21-year average in December.

2.2. Method

Cyprus lows could produce water cooling by establishing cold weather conditions accompanied by rainfall as well as by a decrease in solar radiation due to an increase in cloudiness over the lake. Such a decrease in solar radiation influenced not only SWT but also epilimnion WT. Therefore, cooling by Cyprus lows of Kinneret water was not just a surface phenomenon but could also be observed below the water surface.
In high-precipitation years, cooling by Cyprus lows of SWT and epilimnion WT should be more pronounced than in low-precipitation years. Therefore, our method was based on comparison: on comparing Kinneret SWT and epilimnion WT in high-precipitation and in low-precipitation years. Such a comparison allowed us to find out if Cyprus lows are instrumental in producing cooling of surface and epilimnion water in Lake Kinneret. We investigated the influence of Cyprus lows on Kinneret water on a monthly basis: we focused on the winter, spring, and summer months, when solar radiation varies from its minimum to its maximum.

2.3. Materials

Our study was carried out using the 21-year period of satellite records of SWT in addition to in situ shipboard measurements of WT vertical profiles (2000–2020). For monthly SWT, we used Collection-6 (C6) of the MODIS MOD11A1 product of land surface temperature (LST) during the period from 2000 to 2020. MOD11A1 provides daily LST Level-3 data from the Terra satellite at 1 km × 1 km spatial resolution at ~10:30 LT (local time), when Terra crosses Lake Kinneret. In addition, we used Collection-6 of the MODIS MYD11A1 LST product during the period from 2002 to 2020. MYD11A1 provides daily LST Level-3 data from the Aqua satellite at 1 km × 1 km spatial resolution at ~13:30 LT, when Aqua crosses Lake Kinneret. Wan [19] conducted validation of the MODIS C6 LST product at 42 sites around the globe (including the Mediterranean region) in different seasons and years. He showed that the mean MODIS Collection-6 LST product error was within ±0.6 °C. To exclude land contamination from MODIS LST data over Lake Kinneret, we used the water body identifier dataset by Carrea et al. [20].
Over the eastern Mediterranean Sea, in order to analyze the effects of Cyprus lows on sea surface temperature (SST), we used the MODISA_L3m_SST (version R2019.0) product during the period from 2002 to 2020. MODISA_L3m_SST provides daily SST Level-3 data from the Aqua satellite at 4 km × 4 km spatial resolution at ~13:30 LT, when Aqua crosses the eastern Mediterranean.
To analyze WT at various depths, we used a 21-year record of weekly shipboard measurements of WT profiles at five monitoring sites at different locations in the lake (Figure 1b). These measurements were taken in the morning between 7 and 11 local time (2000–2020) [21]. To measure WT profiles, AML MINOS X probe was used [22].
The following three datasets of monthly precipitation were used in our study: (1) GPM_3IMERGM V6 data at 0.1° × 0.1° spatial resolution [23]; (2) TRMM_3B43 satellite data at 0.25° × 0.25° spatial resolution [24]; and (3) M2TMNXFLX MERRA-2 V5.12.4 reanalysis data at 0.5° × 0.625° special resolution [25]. These satellite-based GPM and TRMM data as well as MERRA-2 data have been validated against ground-based measurements, in accordance with Hou et al. [26], Vallejo-Bernal et al. [27], and Hamal et al. [28]. GPM is considered as a new standard for global precipitation estimation from space, in accordance with [26].
To characterize atmospheric conditions associated with Cyprus lows, we used available 10 min measurements of near-surface wind speed (WS), surface solar radiation (SR), and 2 m air temperature (Tair) [29]. These measurements were taken at the Zemah meteorological station (32.70°N, 35.58°E) (Figure 1b) at the same time as the in situ shipboard water temperature measurements were taken.

3. Results

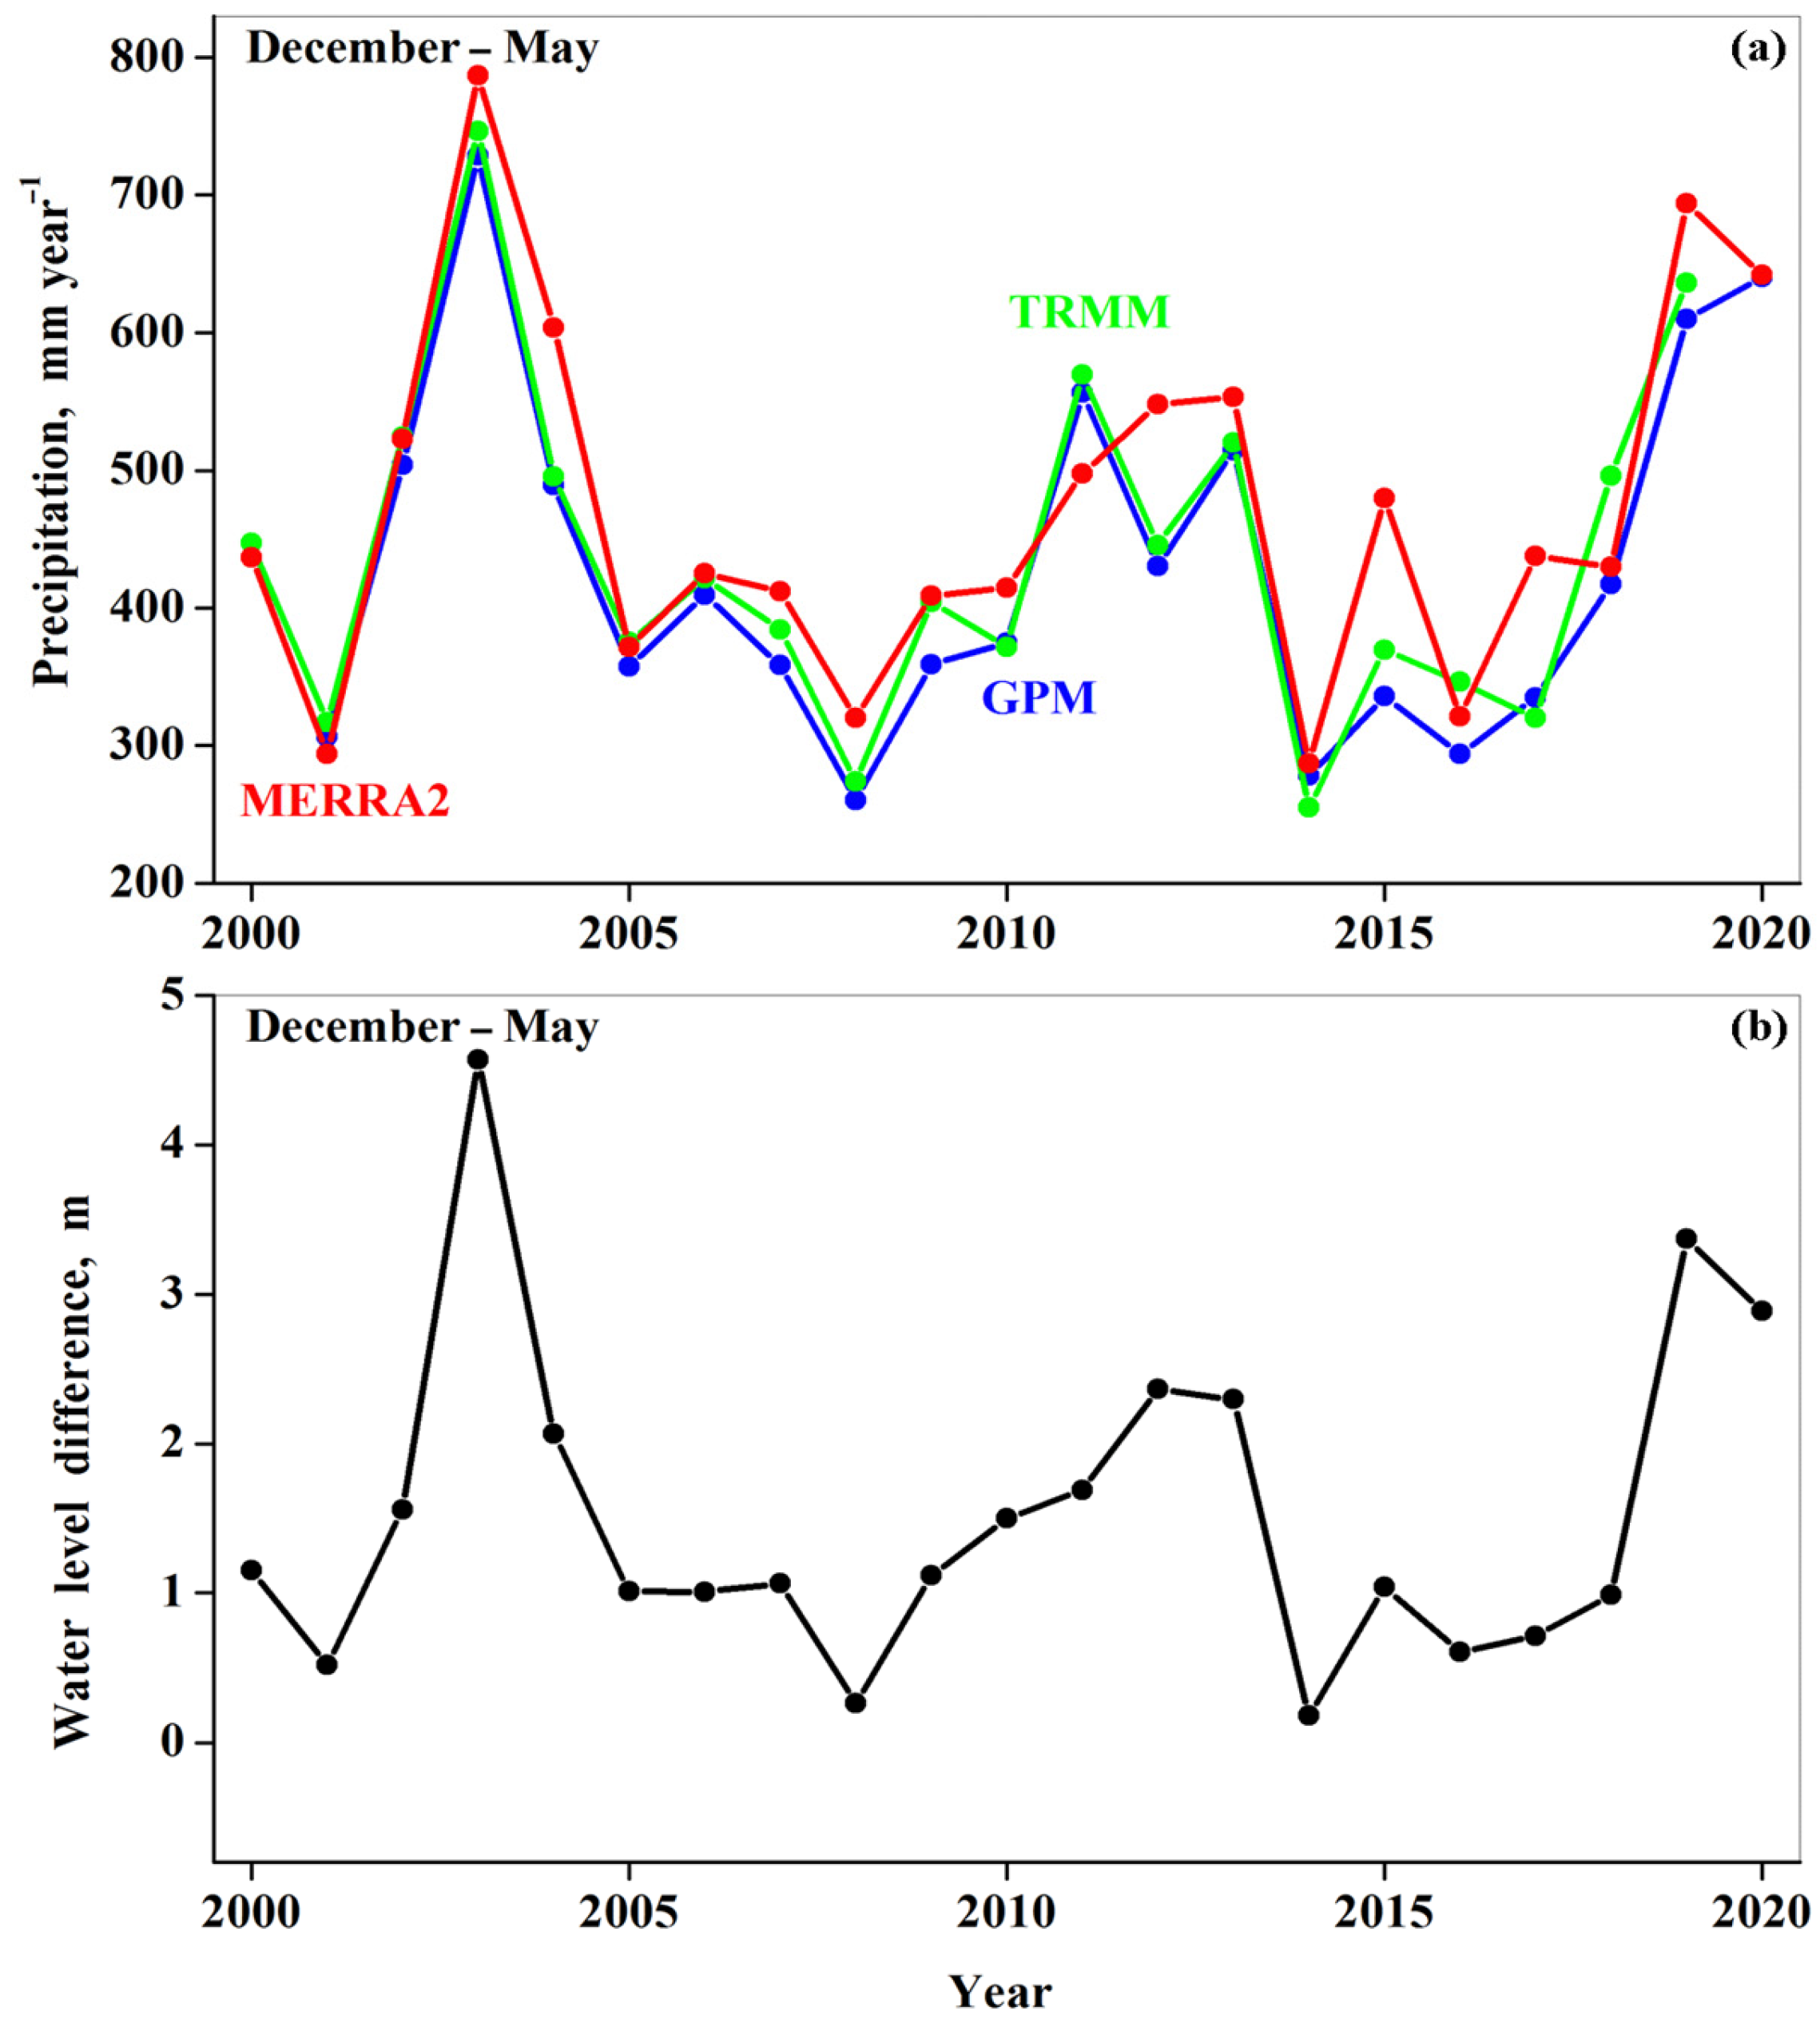
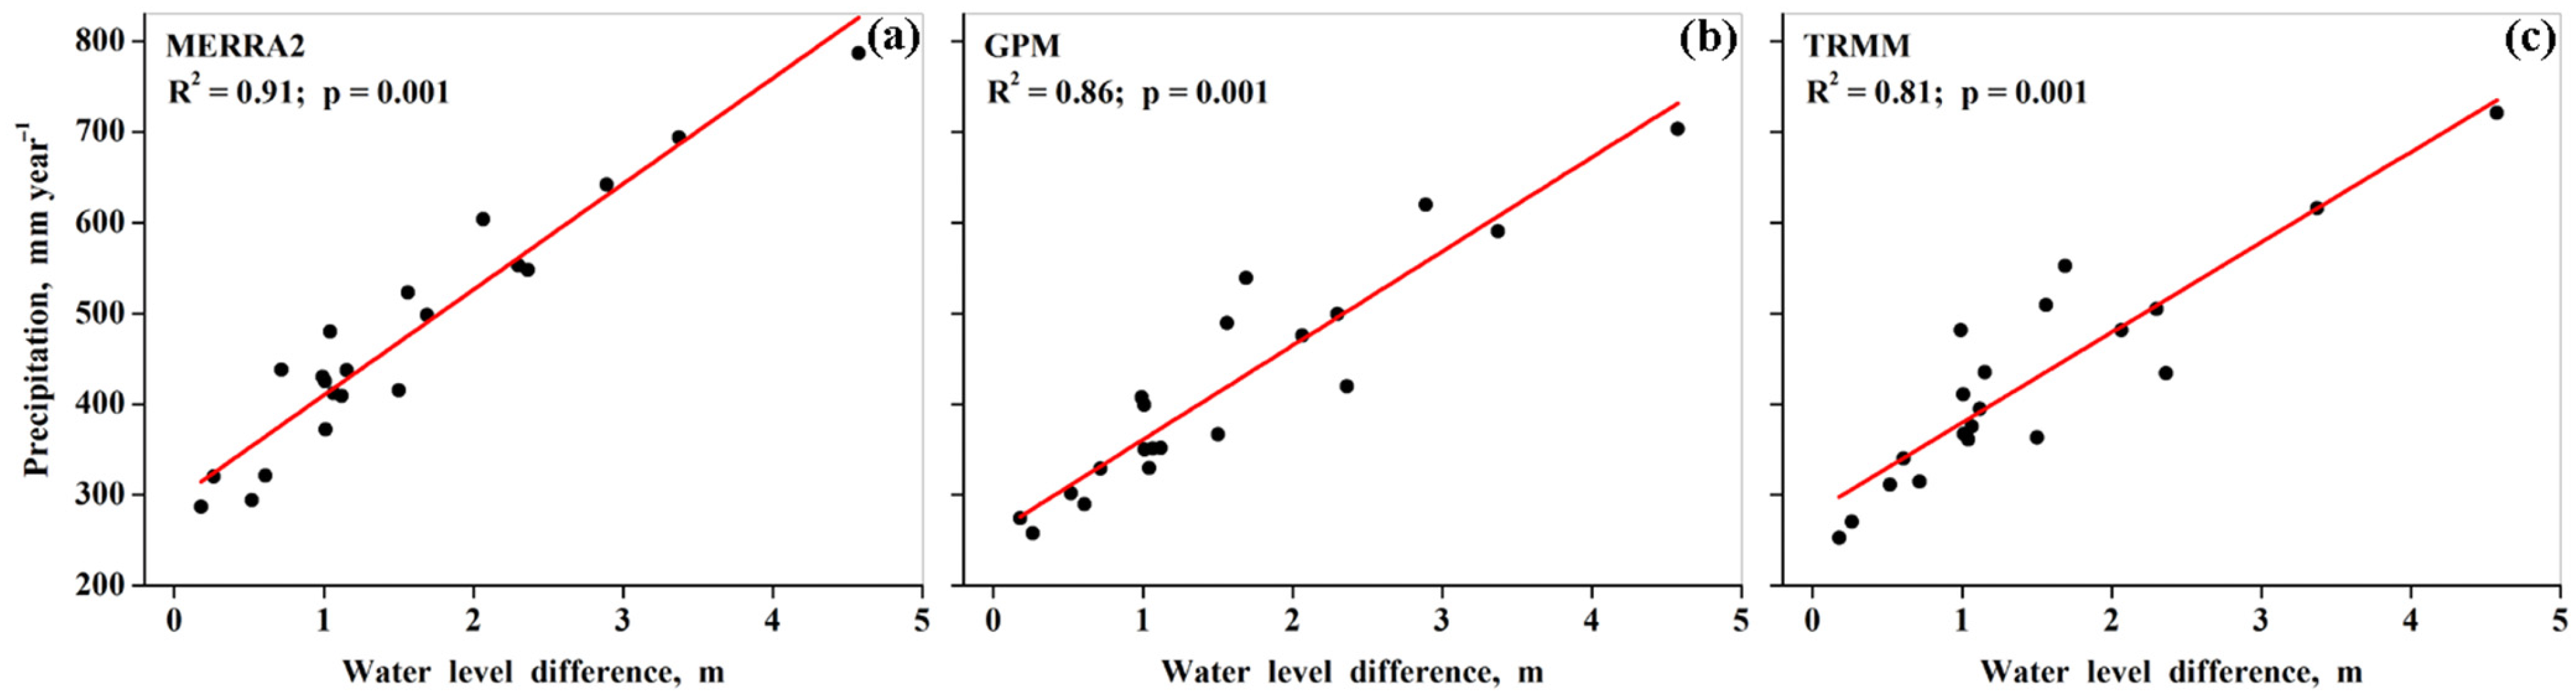
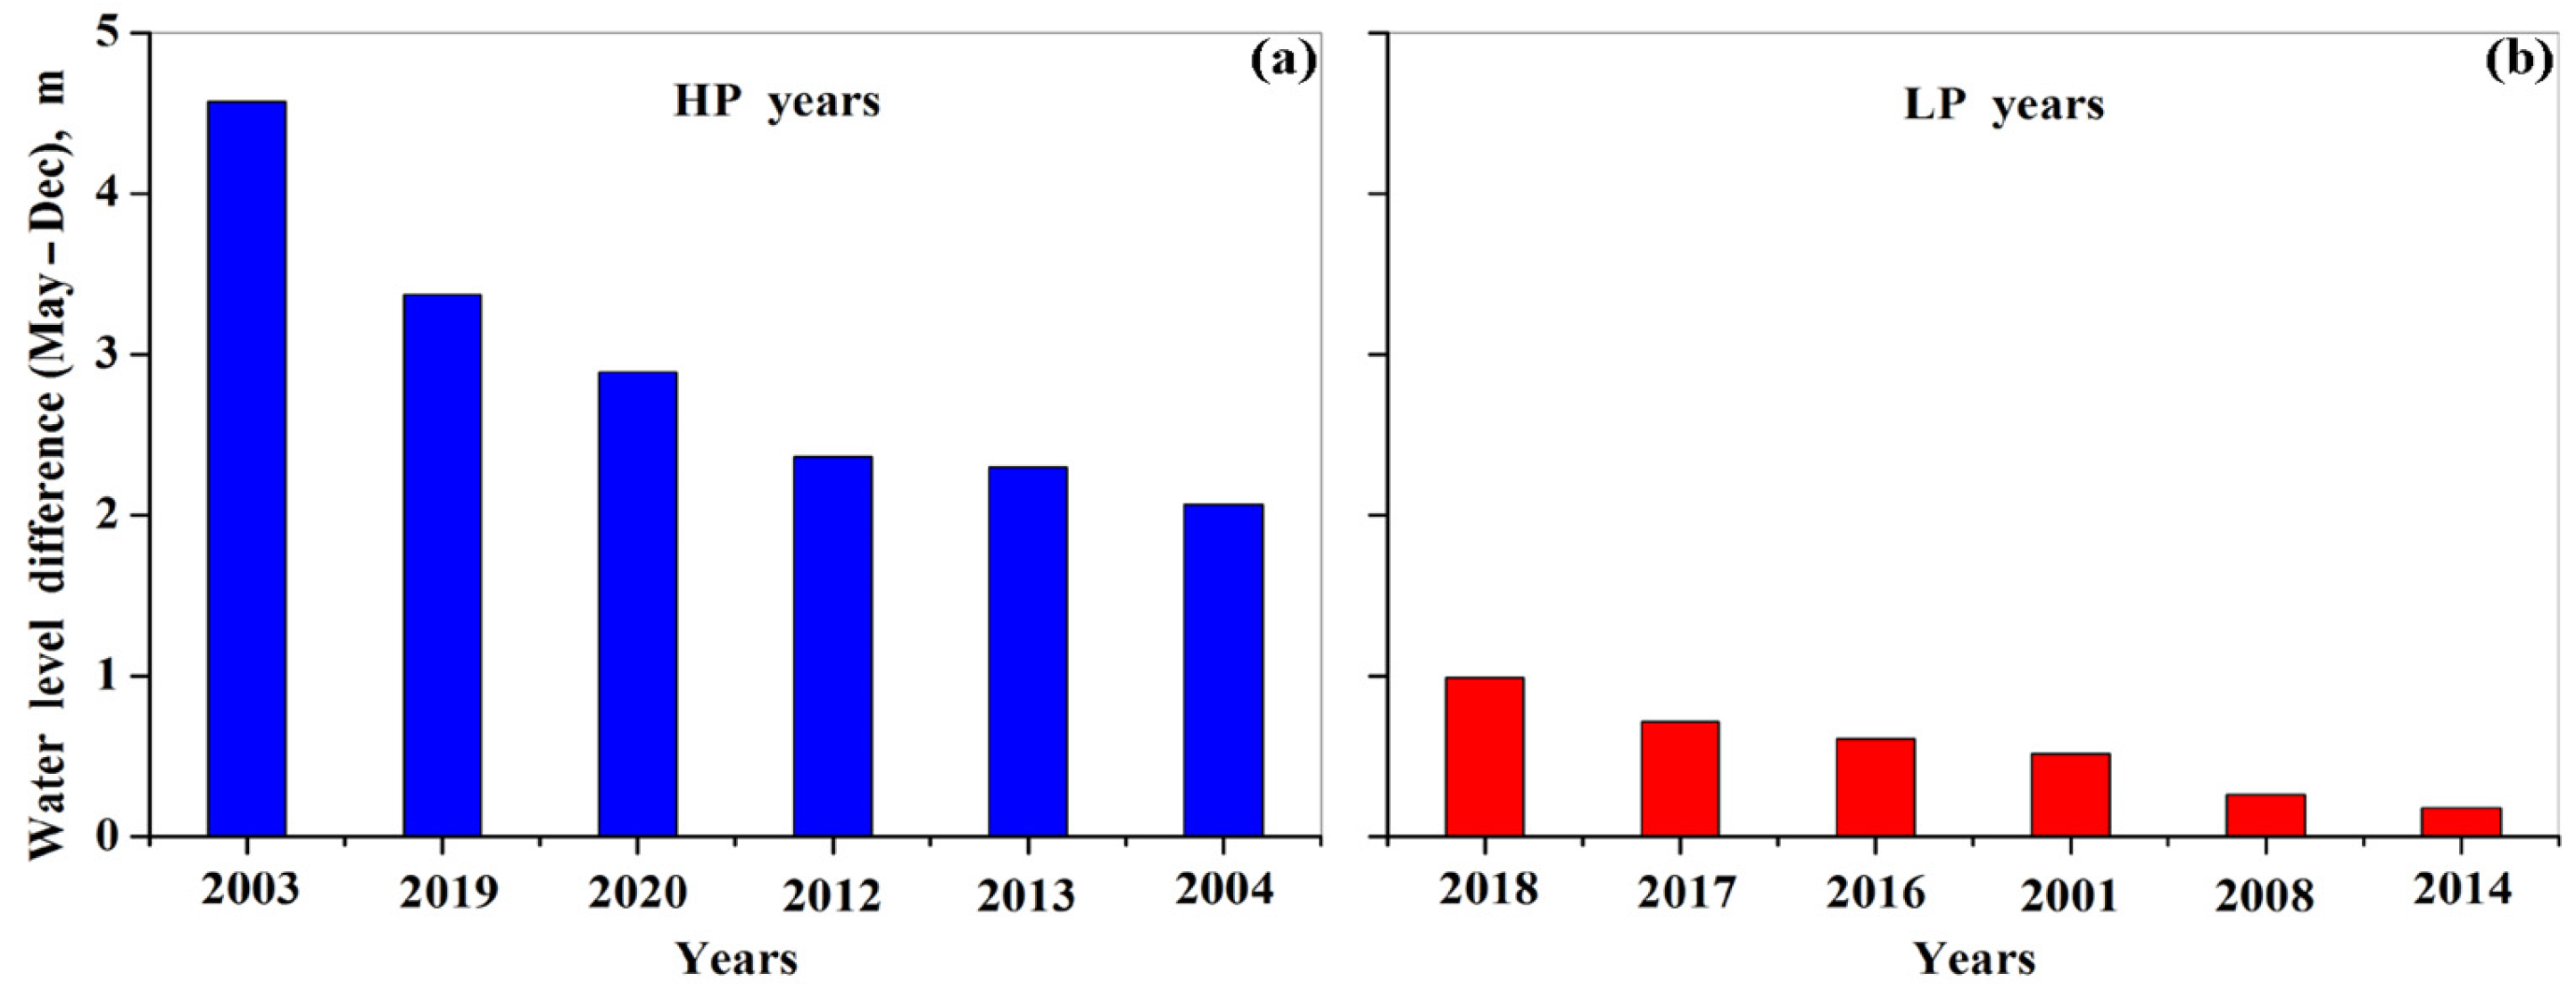
3.1. Definition of High and Low-Precipitation Years over Lake Kinneret

In the rainy season (December–May), precipitation events contribute to the inflow of rain water into Lake Kinneret, and consequently, to an increase in Kinneret water levels. This rain water includes rainfall water, as well as meltwater derived from snow at Mount Hermon. For each year during the study period, we estimated precipitation over the Kinneret watershed area during the rainy season. This was carried out using the three datasets of precipitation: GPM, TRMM, and MERRA2 (Figure 4a). The obtained year-to-year variations in precipitation during the rainy season (December–May) were highly correlated with each other during the first half of the study period (2000–2009); however, some discrepancies were observed during the second half of the period (2009–2020). These discrepancies indicate some inaccuracy in GPM, TRMM, and MERRA2 datasets. Because of that, the lake water-level difference (WLD) between the end (May) and the beginning of the rainy season (December) was used as a proxy of precipitation during the rainy season.
We compared year-to-year variations in precipitation during the rainy season (December–May) with those of WLD during the 21-year study period (Figure 4b). It was found that maxima (in 2003, 2014 and 2019) and minima (in 2001, 2008 and 2014) of precipitation values (based separately on MERRA2, GMP, or TRMM datasets) coincided with those of WLD. Moreover, the plotted scatterplots between precipitation values and WLD showed a statistically-significant linear fit between the two parameters (Figure 5a–c). In particular, the obtained p values less than 0.05 (shown in Figure 5a–c) correspond to a statistically significant linear fit at the 95% confidence level. A high coefficient of determination R2 of 0.91, 0.86, and 0.81 was found between WLD and precipitation. In addition, for each scatterplot, our analysis of the residuals of a linear fit showed that they were normally distributed. In the current study, the coefficient of determination R2 and significance level (p) of the linear fit were obtained using OriginLab software from OriginLab Corporation, Northampton, MA, USA.
The above information implies a strong connection between precipitation during the rainy season (December–May) and WLD. Therefore, in our study, we used WLD as a selection criterion of the years with high and low precipitation.
To quantitatively investigate cooling by Cyprus lows of Kinneret water in rainy seasons, we focused on the two groups of years: (a) six years 2003, 2019, 2020, 2012, 2013, and 2004 with the highest WLD of 4.57, 3.37, 2.88, 2.36, 2.29, and 2.06 m respectively; and (b) six years 2014, 2008, 2001, 2016, 2017, and 2018 characterized by the lowest WLD of 0.18, 0.26, 0.52, 0.61, 0.71, and 0.99 m respectively (Figure 6).
In accordance with the obtained linear fits (Figure 5a–c), the years with the highest WLD were characterized by higher precipitation during the rainy season (December–May) (~600 mm/year on average) than in the years with the lowest WLD (~300 mm/year on average) (Figure 5). Hereafter the years with the highest WLD will be called high-precipitation (HP) years, while the years with the lowest WLD will be called low-precipitation (LP) years.

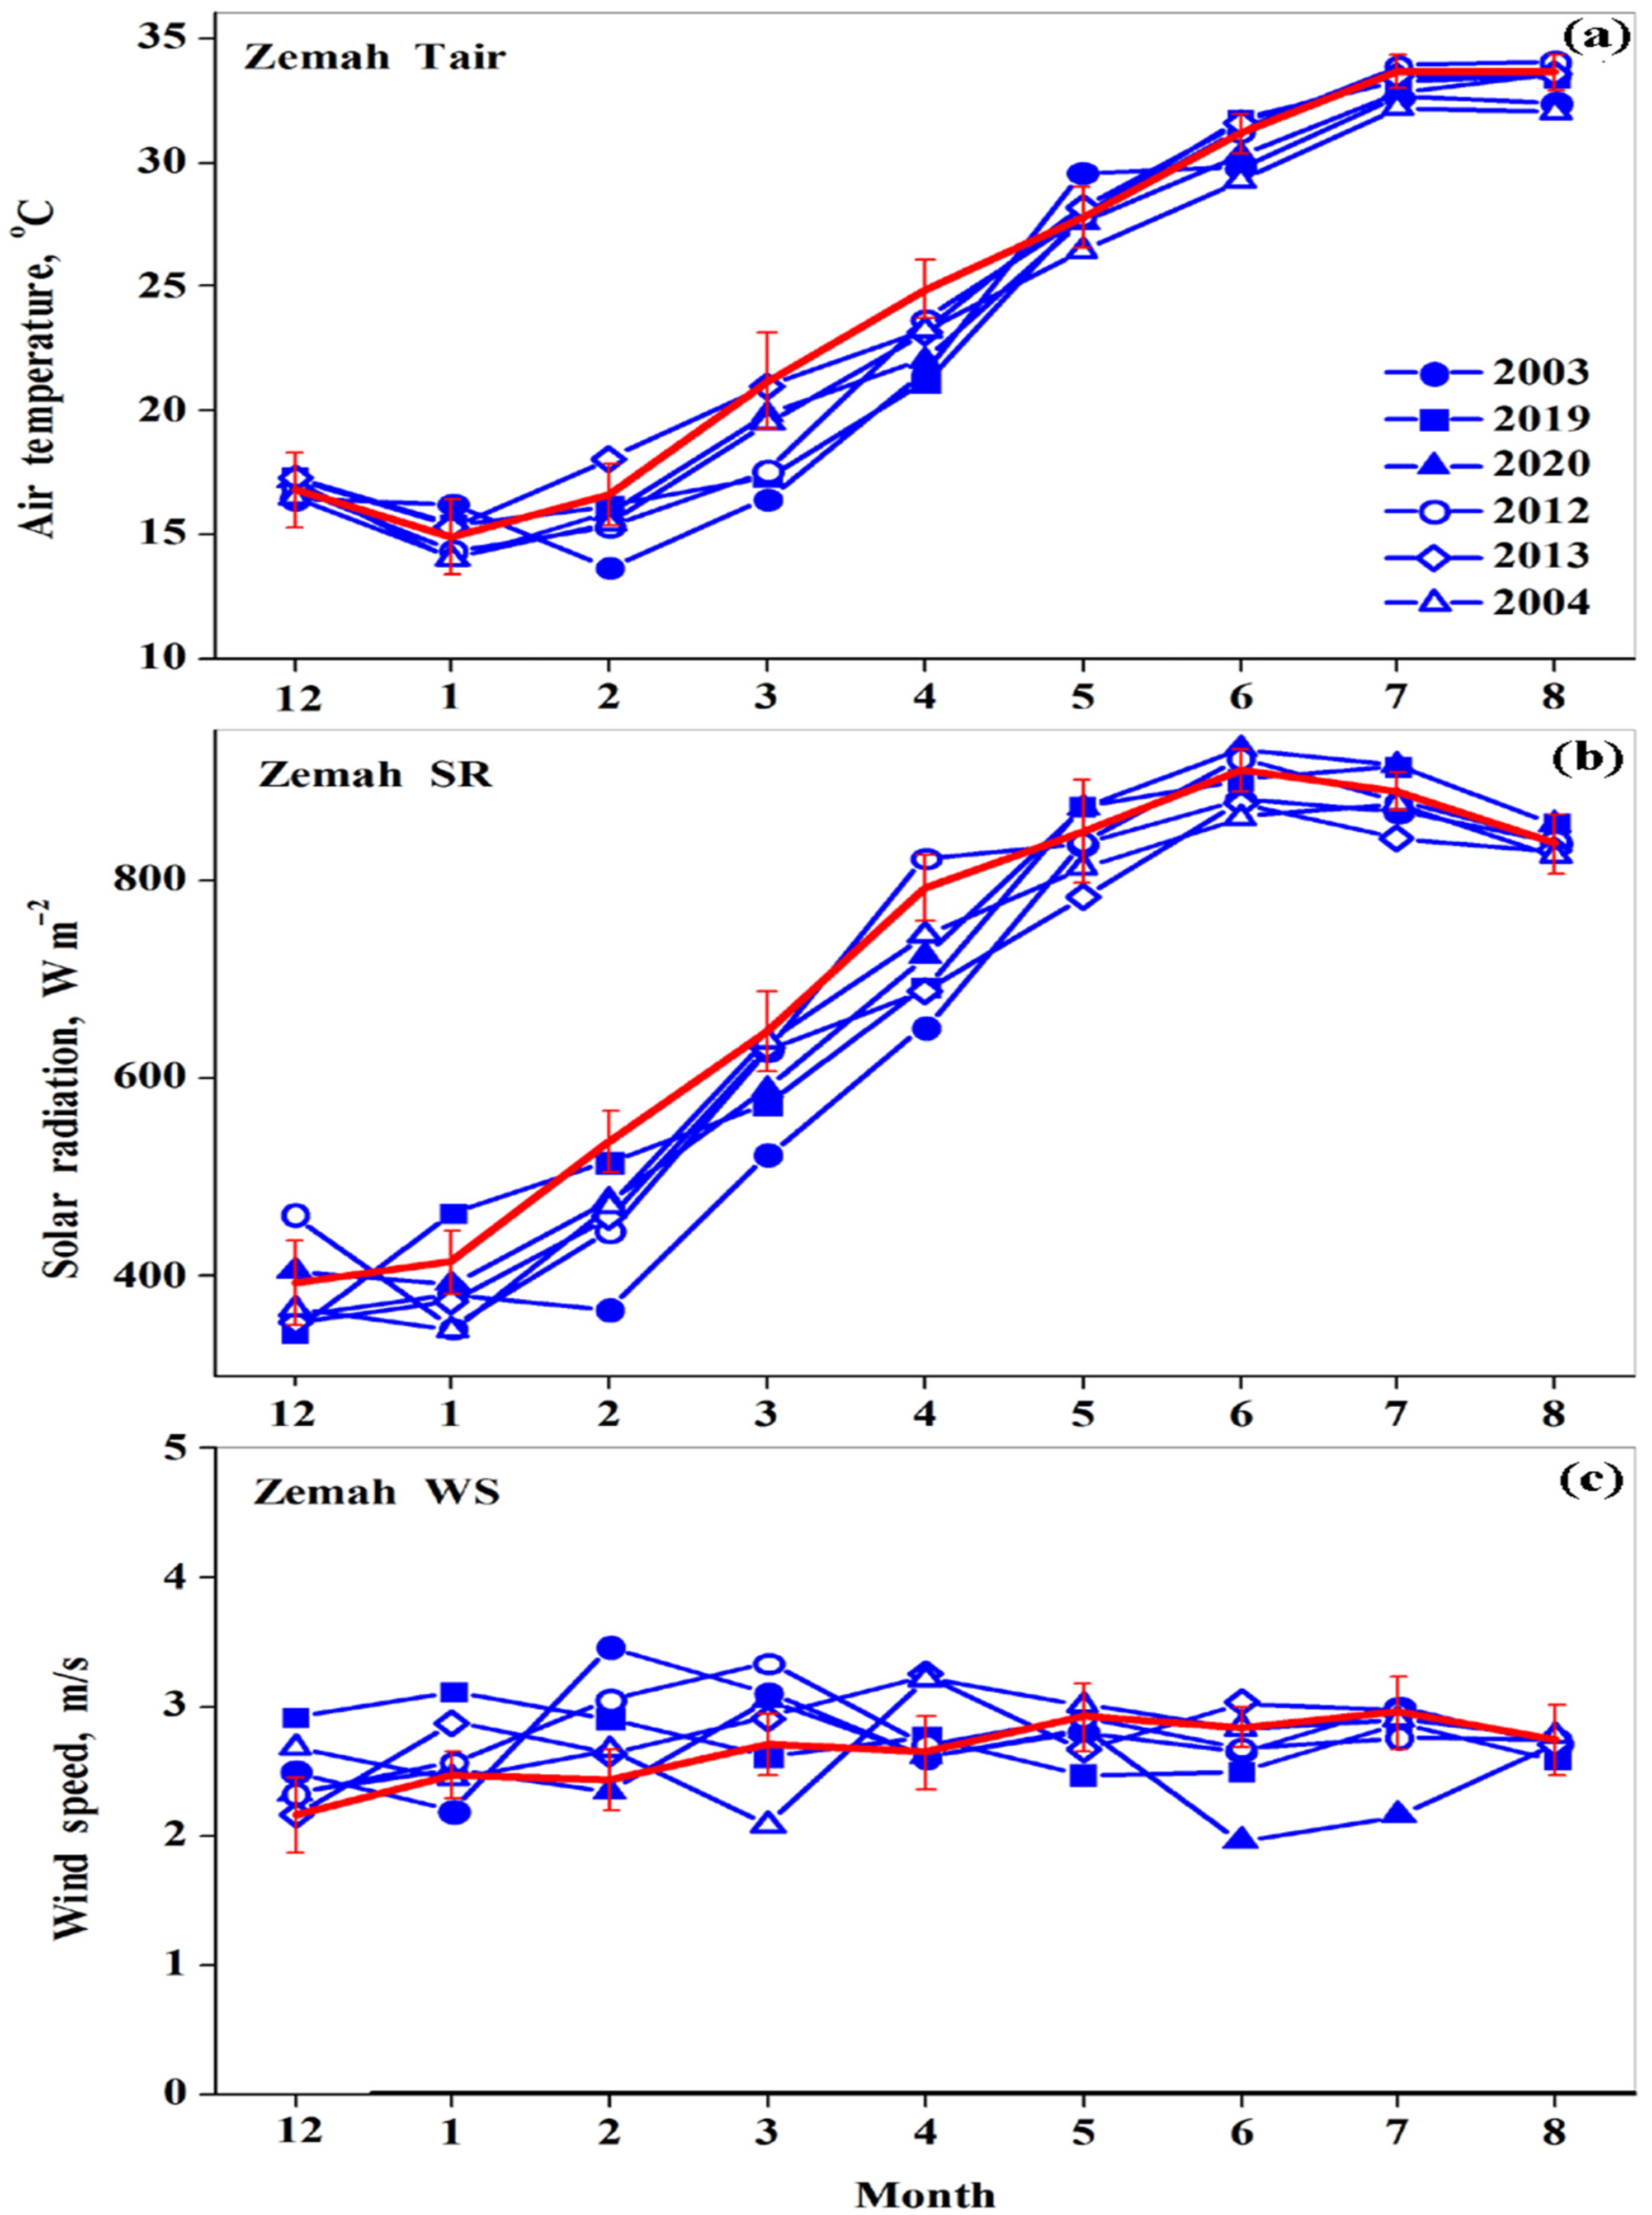
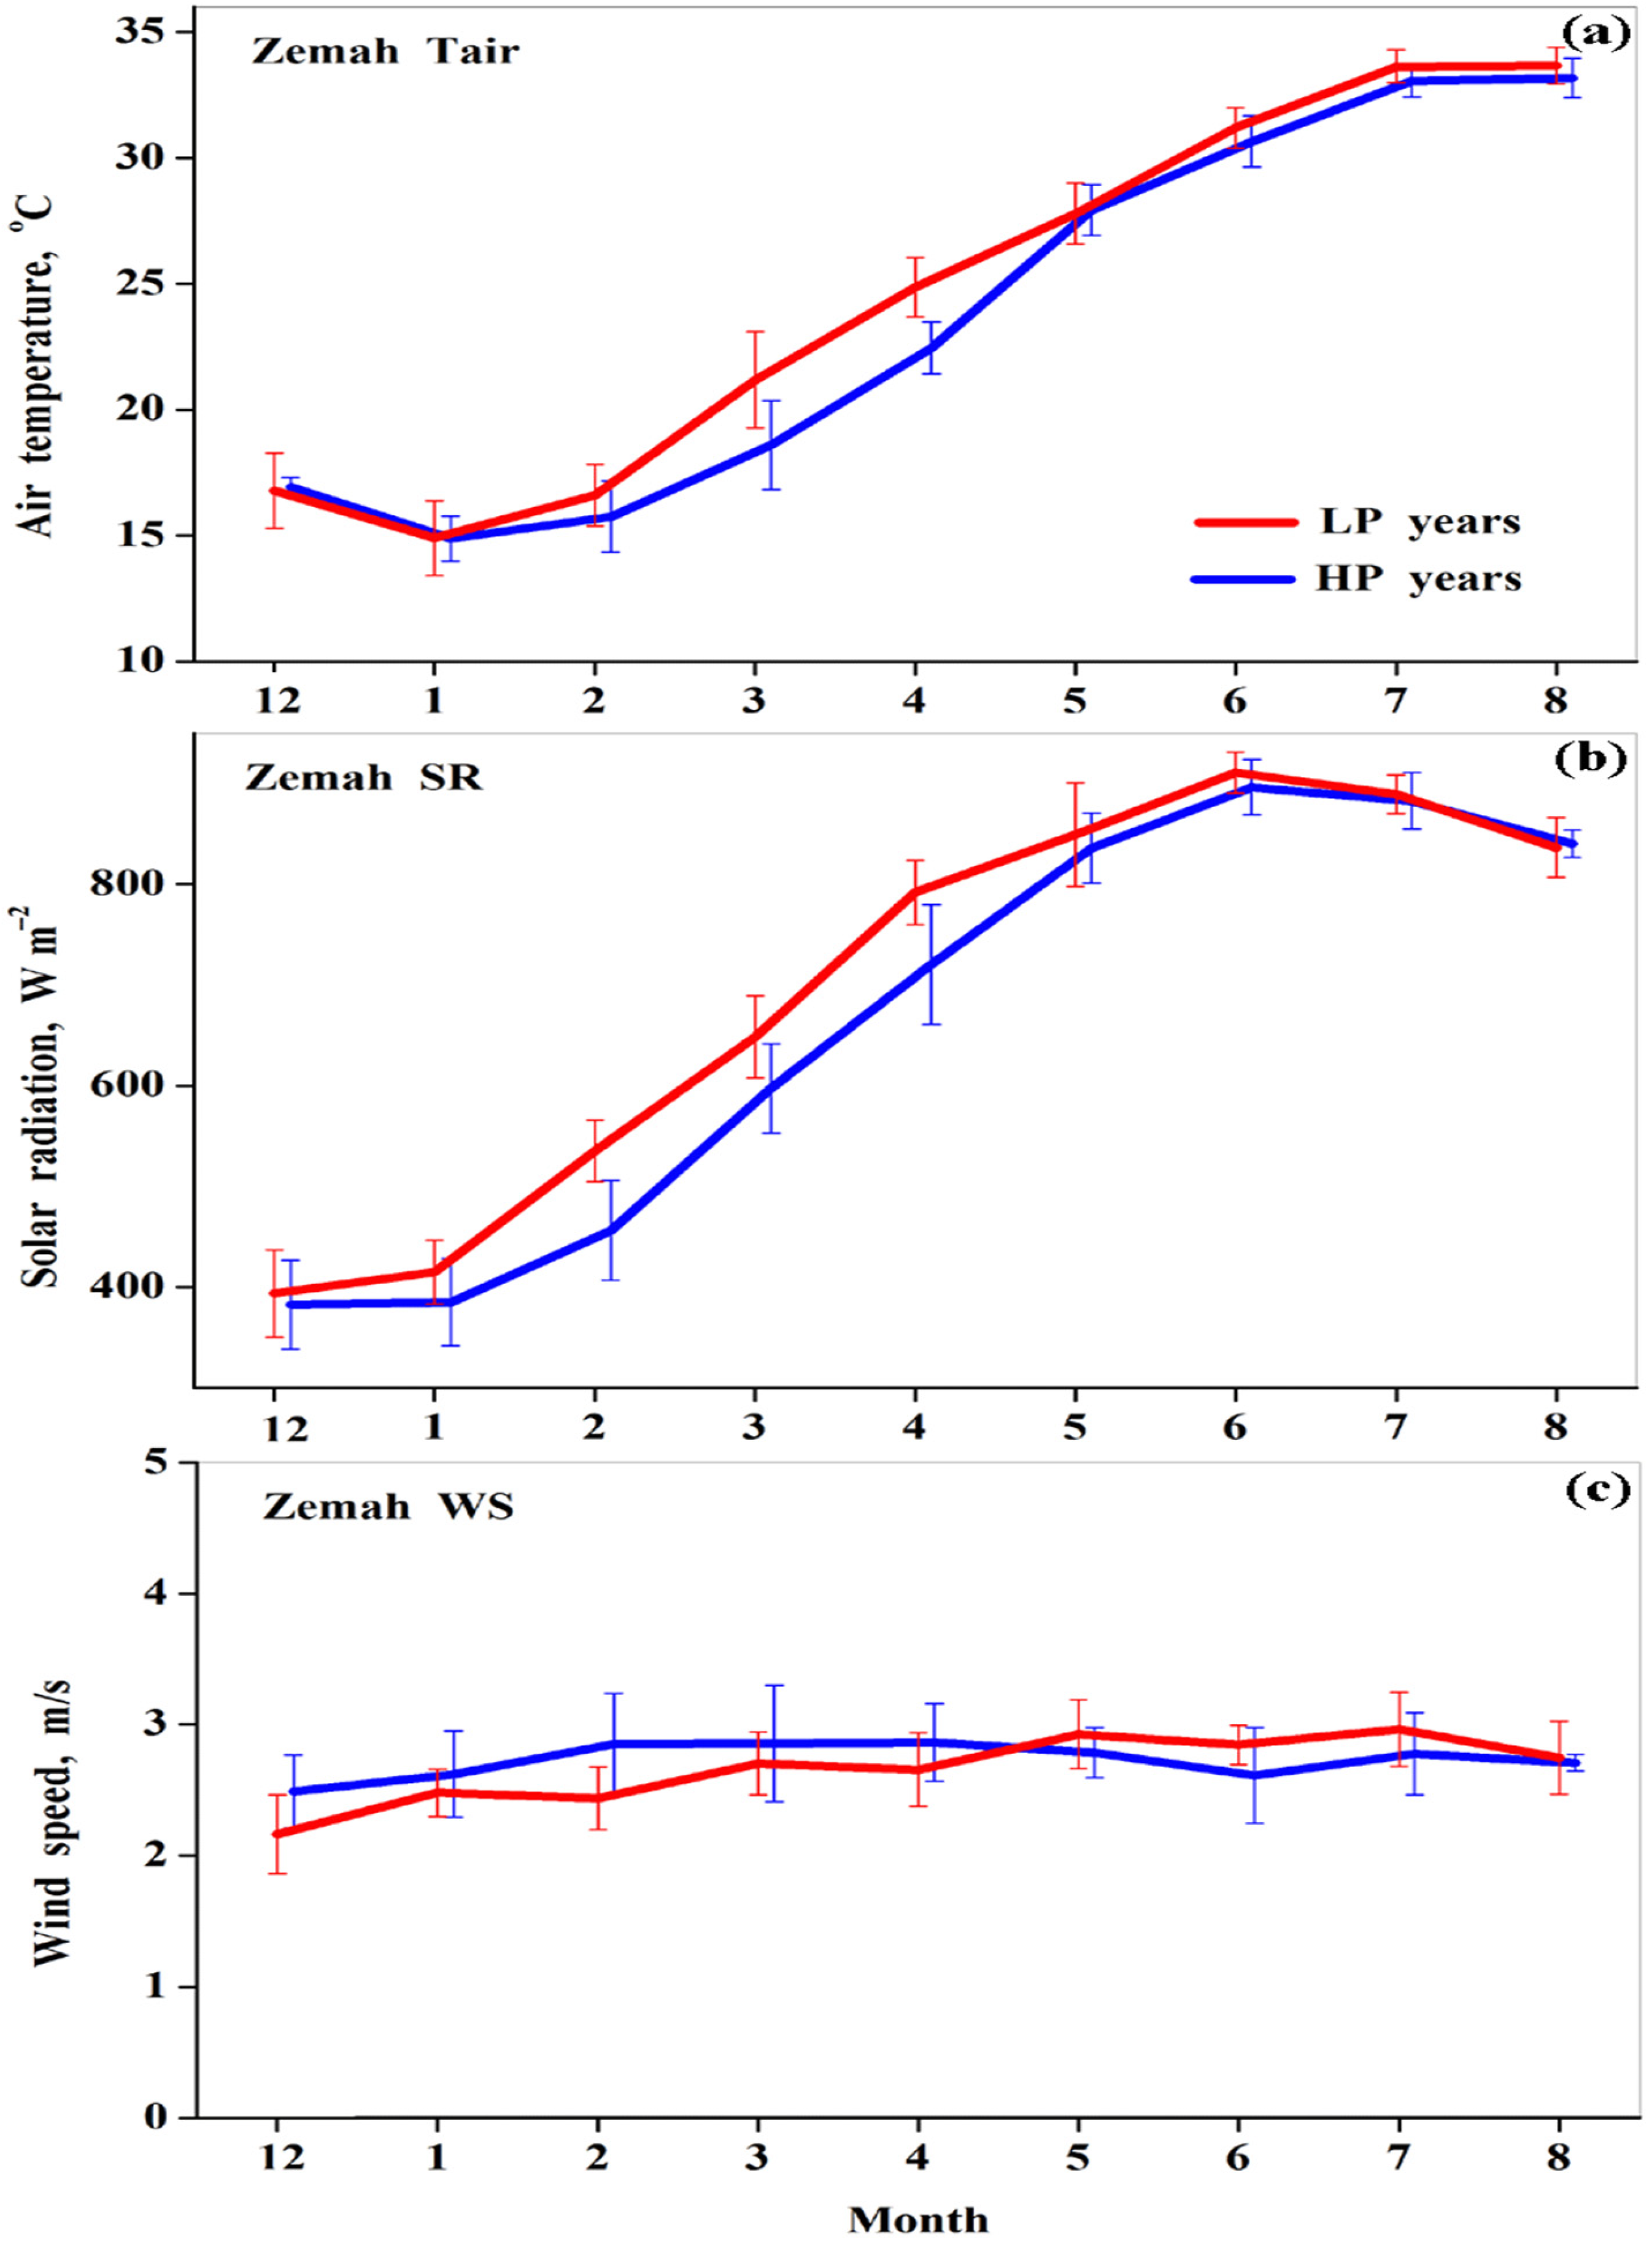
3.2. Month-to-Month Variations in Meteorological Parameters in the HP and LP Years

We investigated atmospheric conditions associated with the HP and LP years by comparing month-to-month variations in Tair, SR, and WS: these were based on meteorological measurements taken at the Zemah station between 10LT and 11LT (Figure 7). From December to January, Tair decreased, although there was no noticeable difference between Tair averaged over the HP years and that averaged over the LP years (Figure 7a). From January to February, however, Tair started increasing: on average, this increase was less intensive in the HP years than in the LP years. From February to April, Tair in the HP years was lower by up to 2.5 °C than Tair in the LP years (Figure 7a). From May to August, the difference in Tair was insignificant between HP and LP years.
As for solar radiation, from December to January, there was no noticeable difference in SR between HP years and LP years (Figure 7b). Starting from January, SR increased: this contributed to lake water heating. From February to April, SR averaged over the HP years was lower by ~70 W/m2 than SR averaged over the LP years (Figure 7b). This was due to more significant cloudiness associated with Cyprus lows in the HP years. As a result of the lower SR in the HP years, from February to April, MODIS-Terra and in situ shipboard measurements showed lower Kinneret SWT and epilimnion WT in HP years than in LP years (see Section 3.3). From May to August, SR was approximately the same in HP and LP years. This measured SR indicated similar limited cloud cover in both HP and LP years in summer.
Note that in spring, in some individual HP years, the effect of Cyprus lows on Tair and SR was stronger than that averaged over the HP years: for example, in April 2003, Tair was lower by up to 3.3 °C and SR was lower by up to 140 W/m2 than Tair and SR averaged over the LP years, respectively (Figure A1).
As for wind speed, available measurements showed no noticeable difference in WS between HP and LP years (Figure 7c).

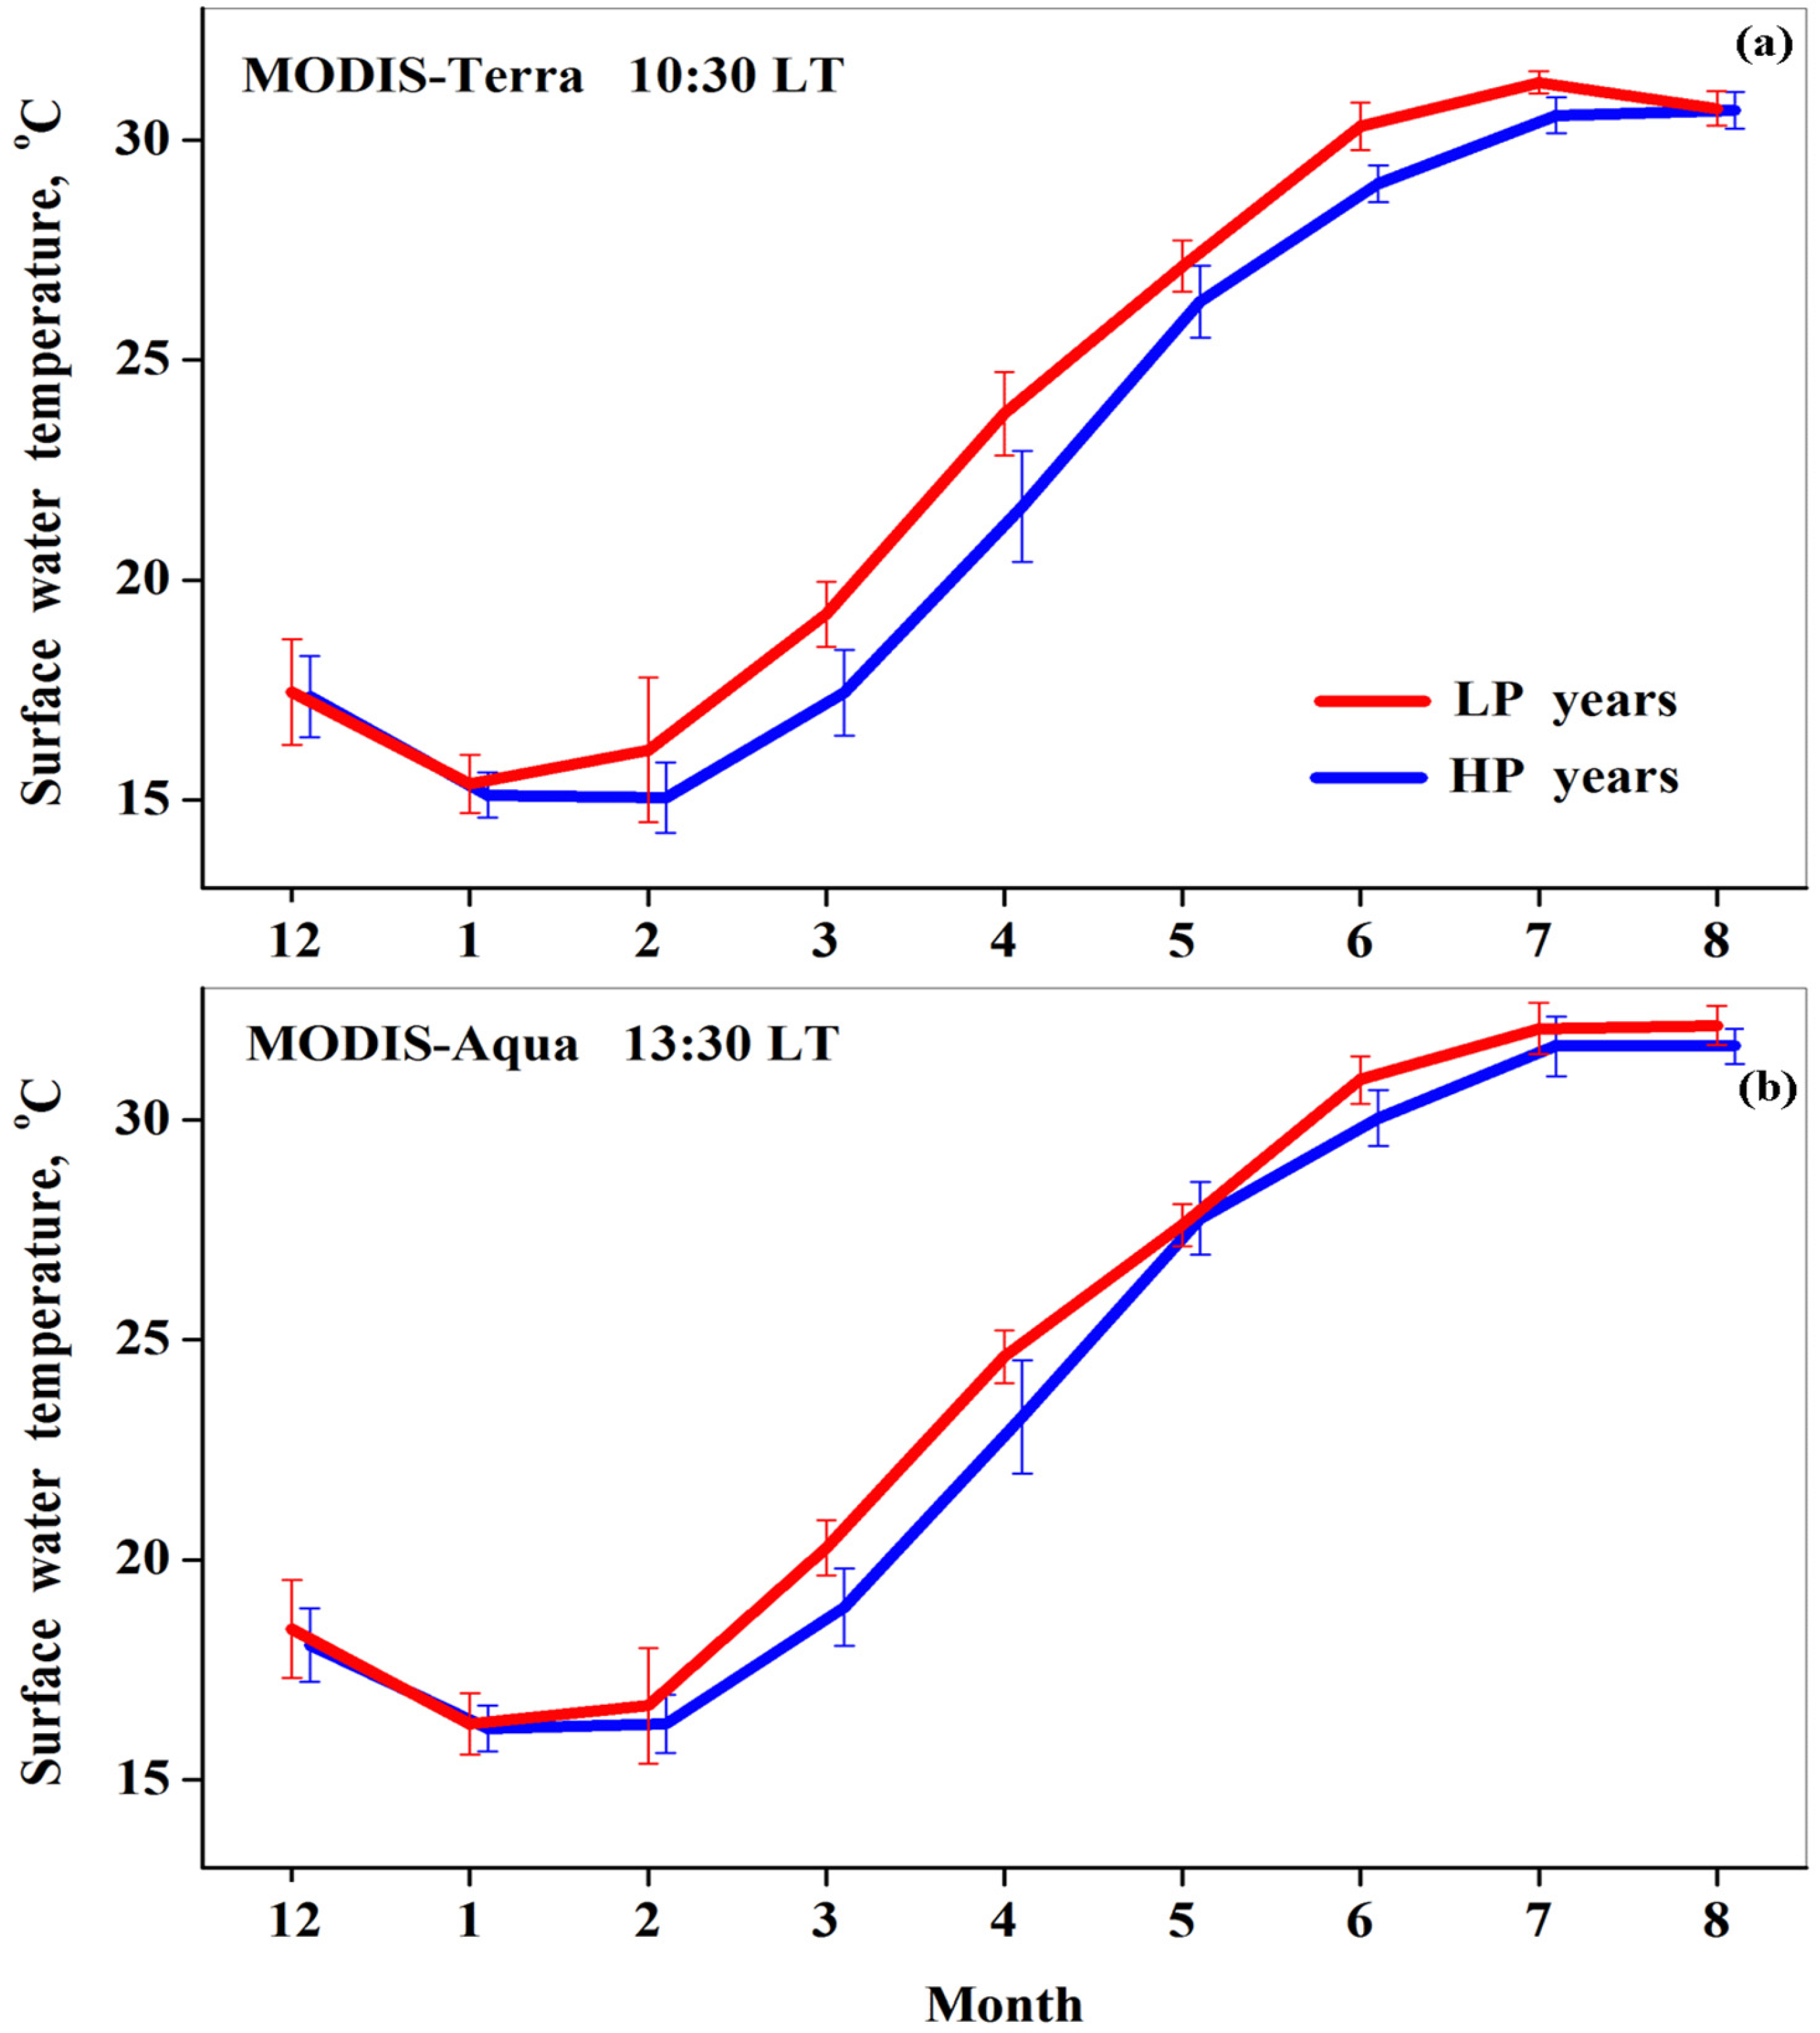
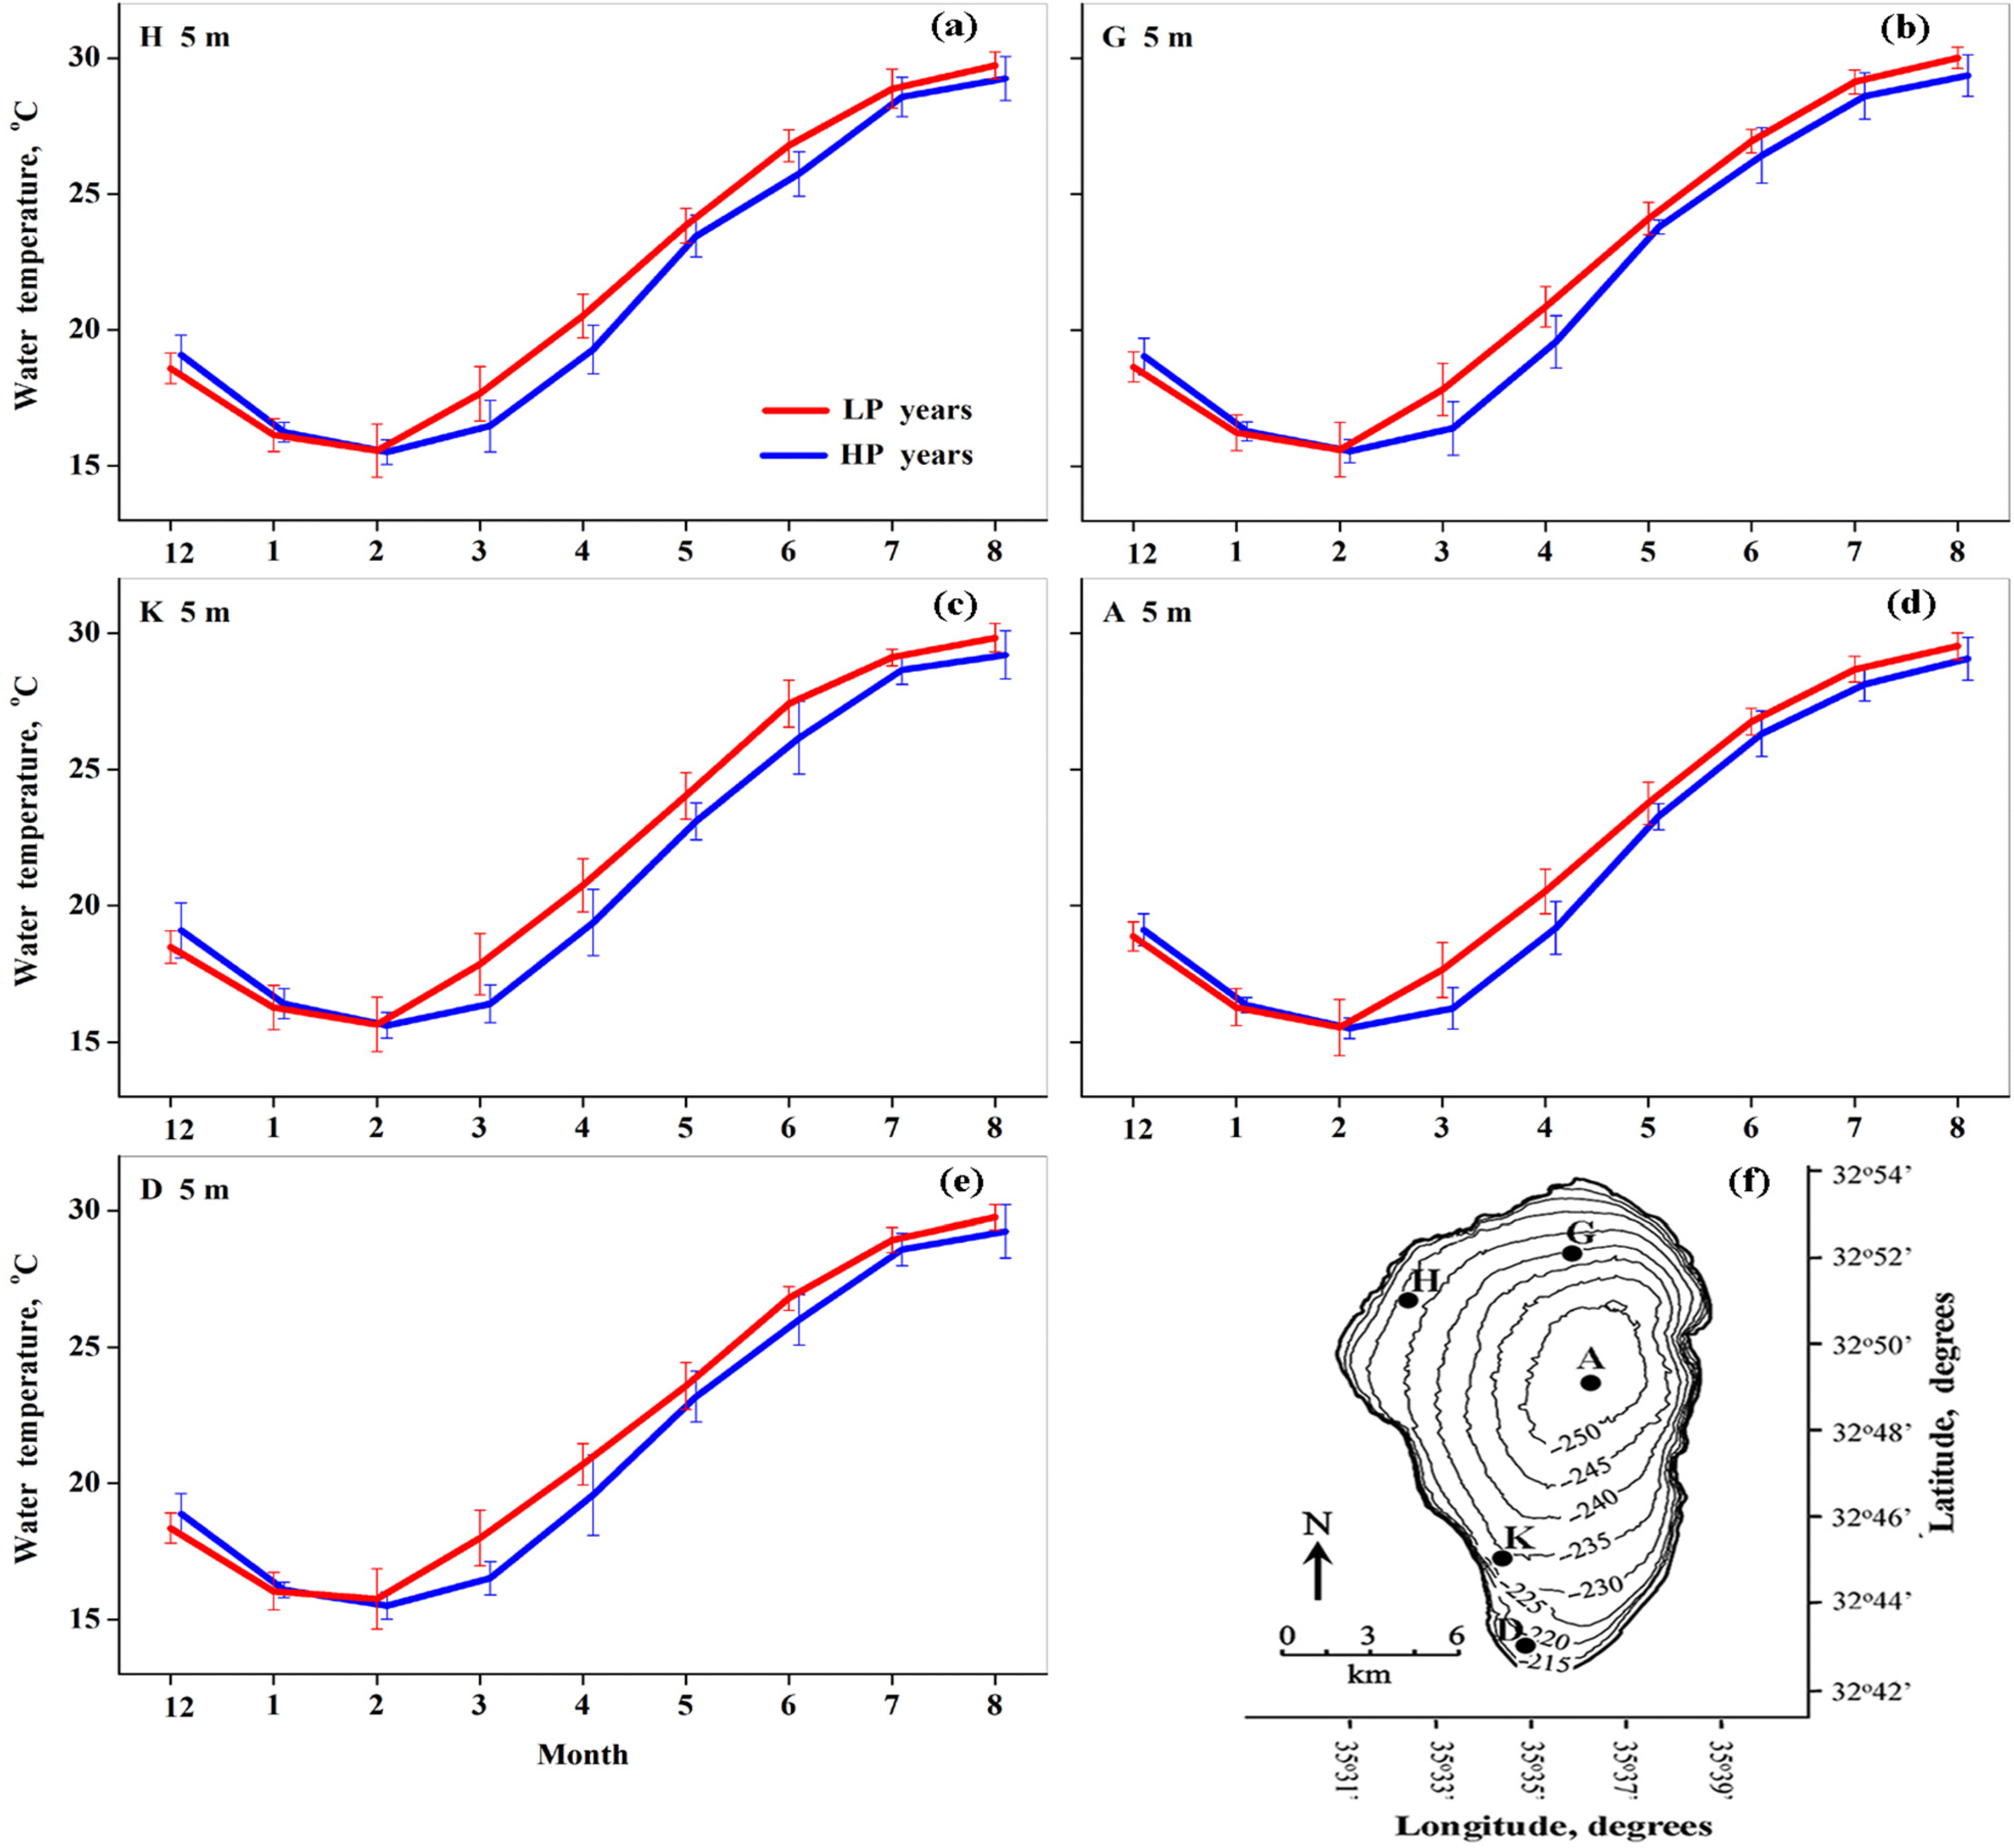
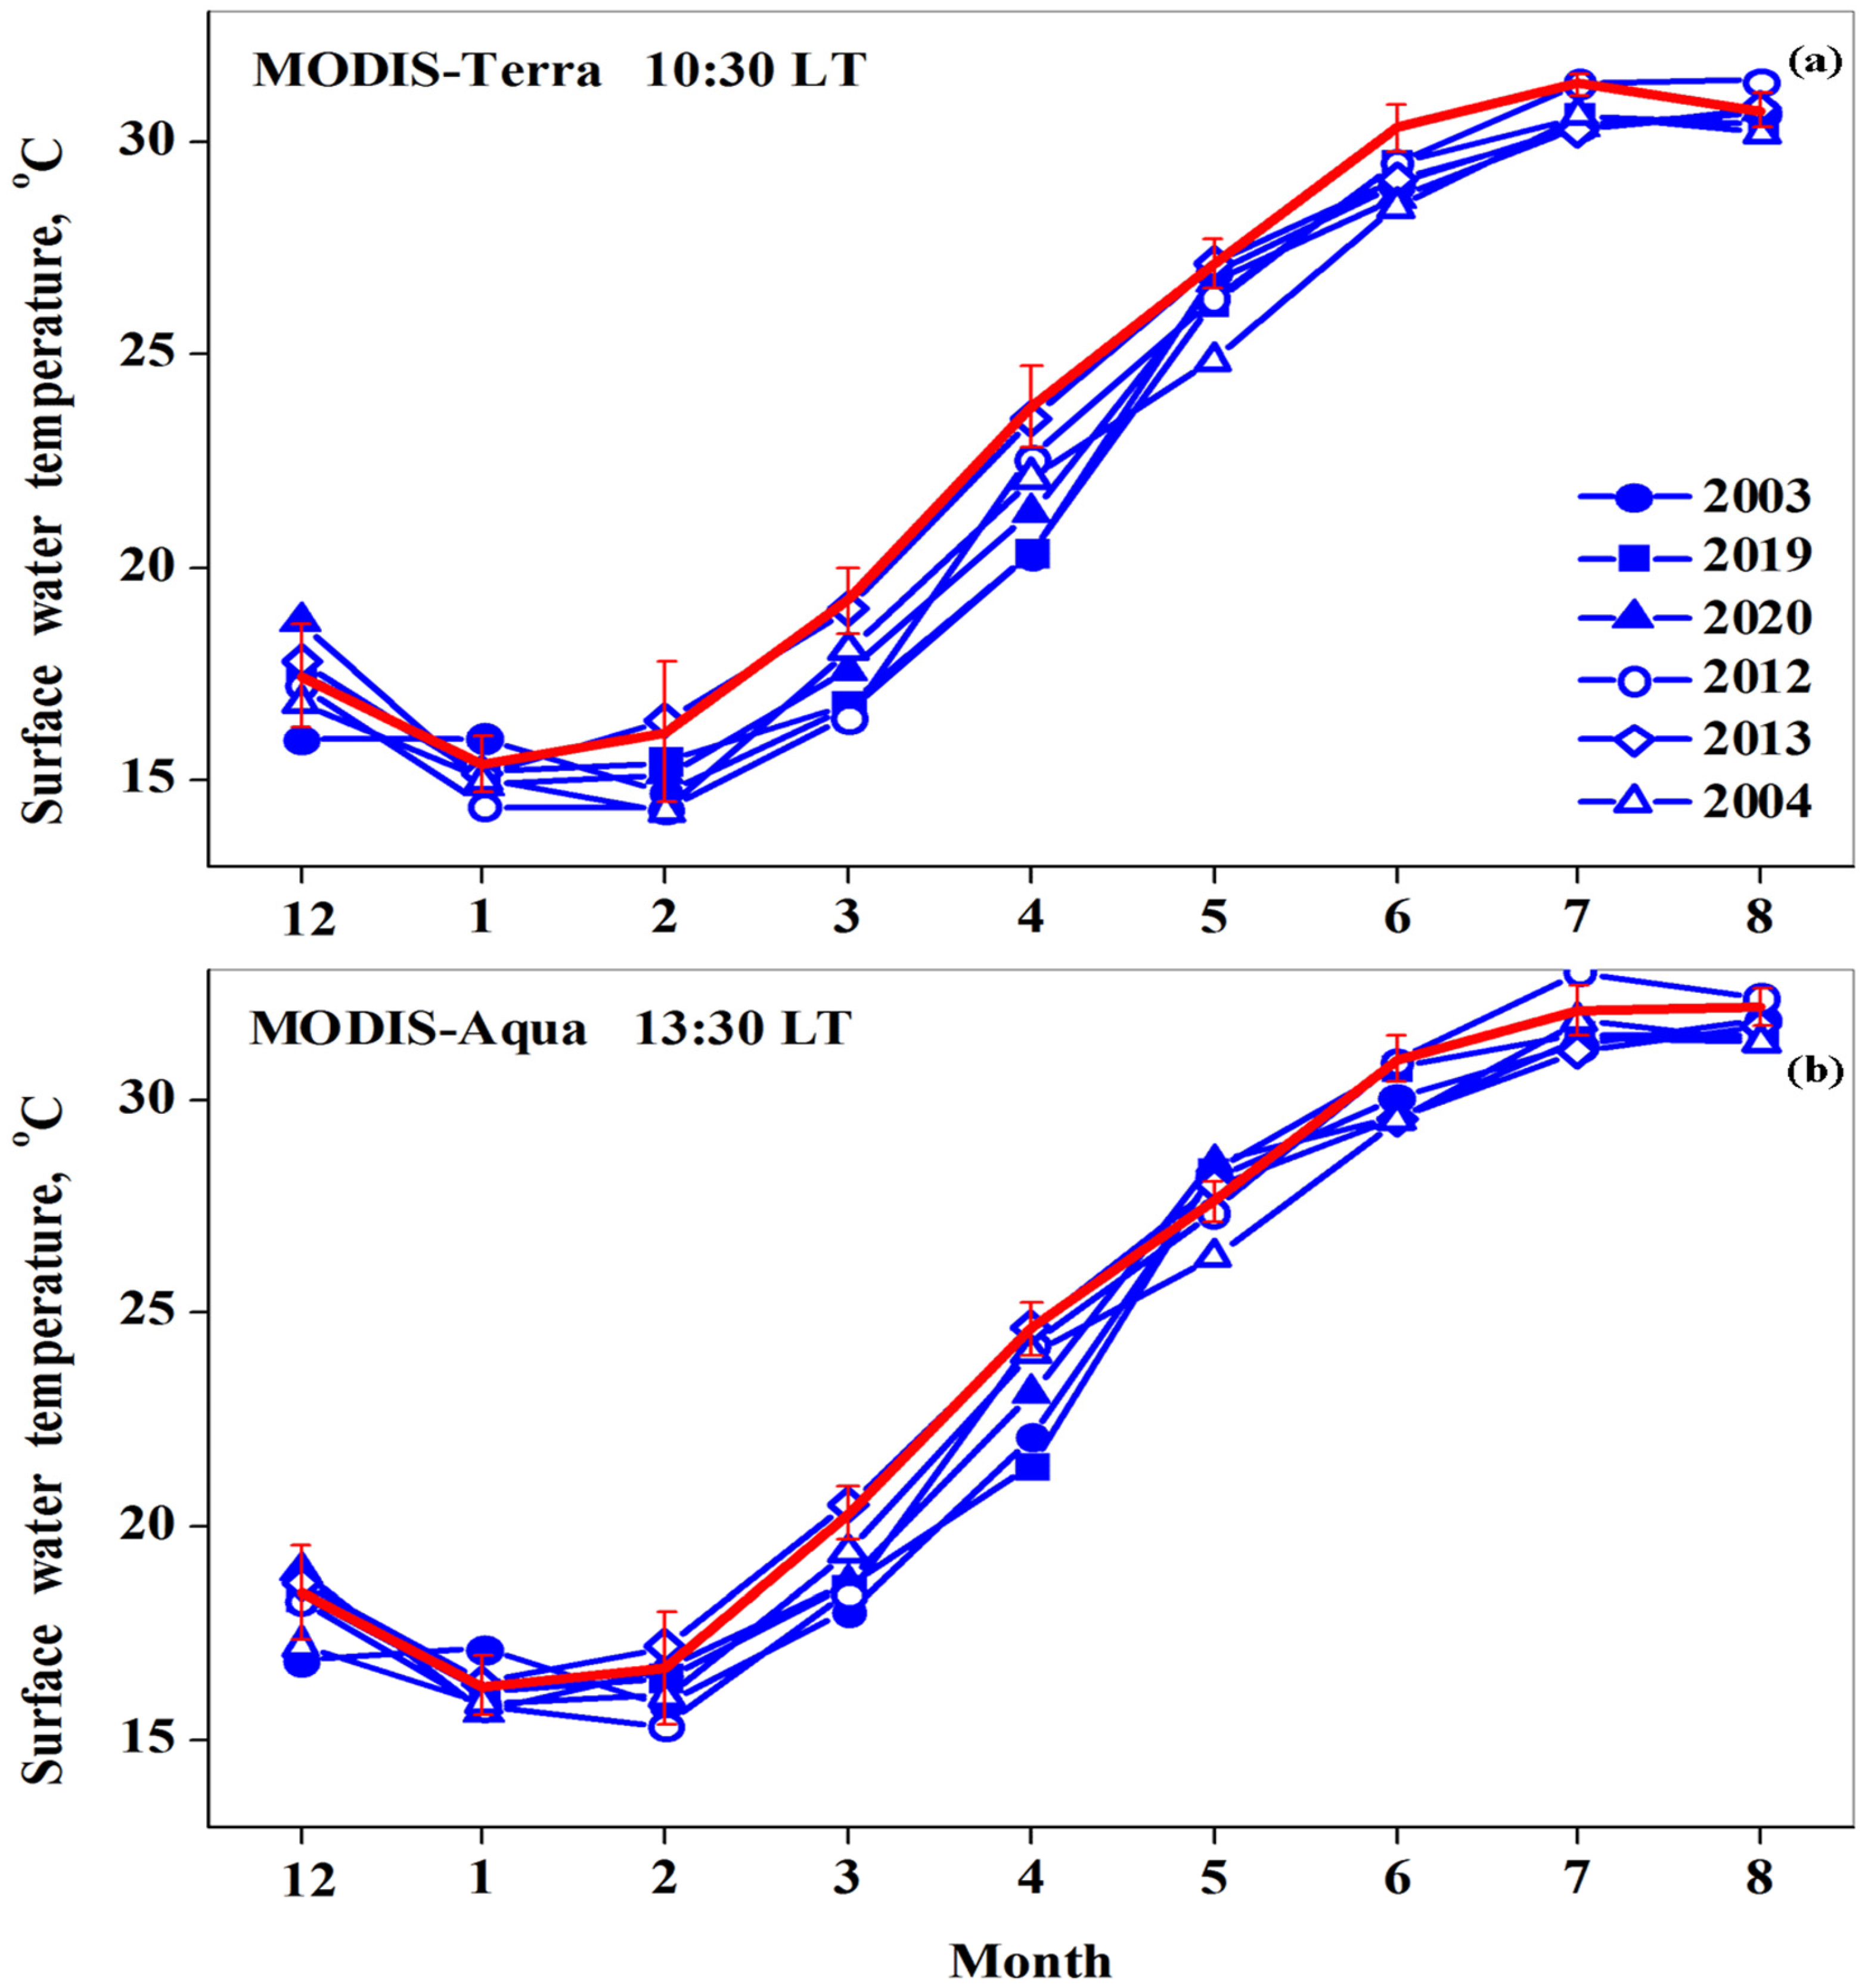
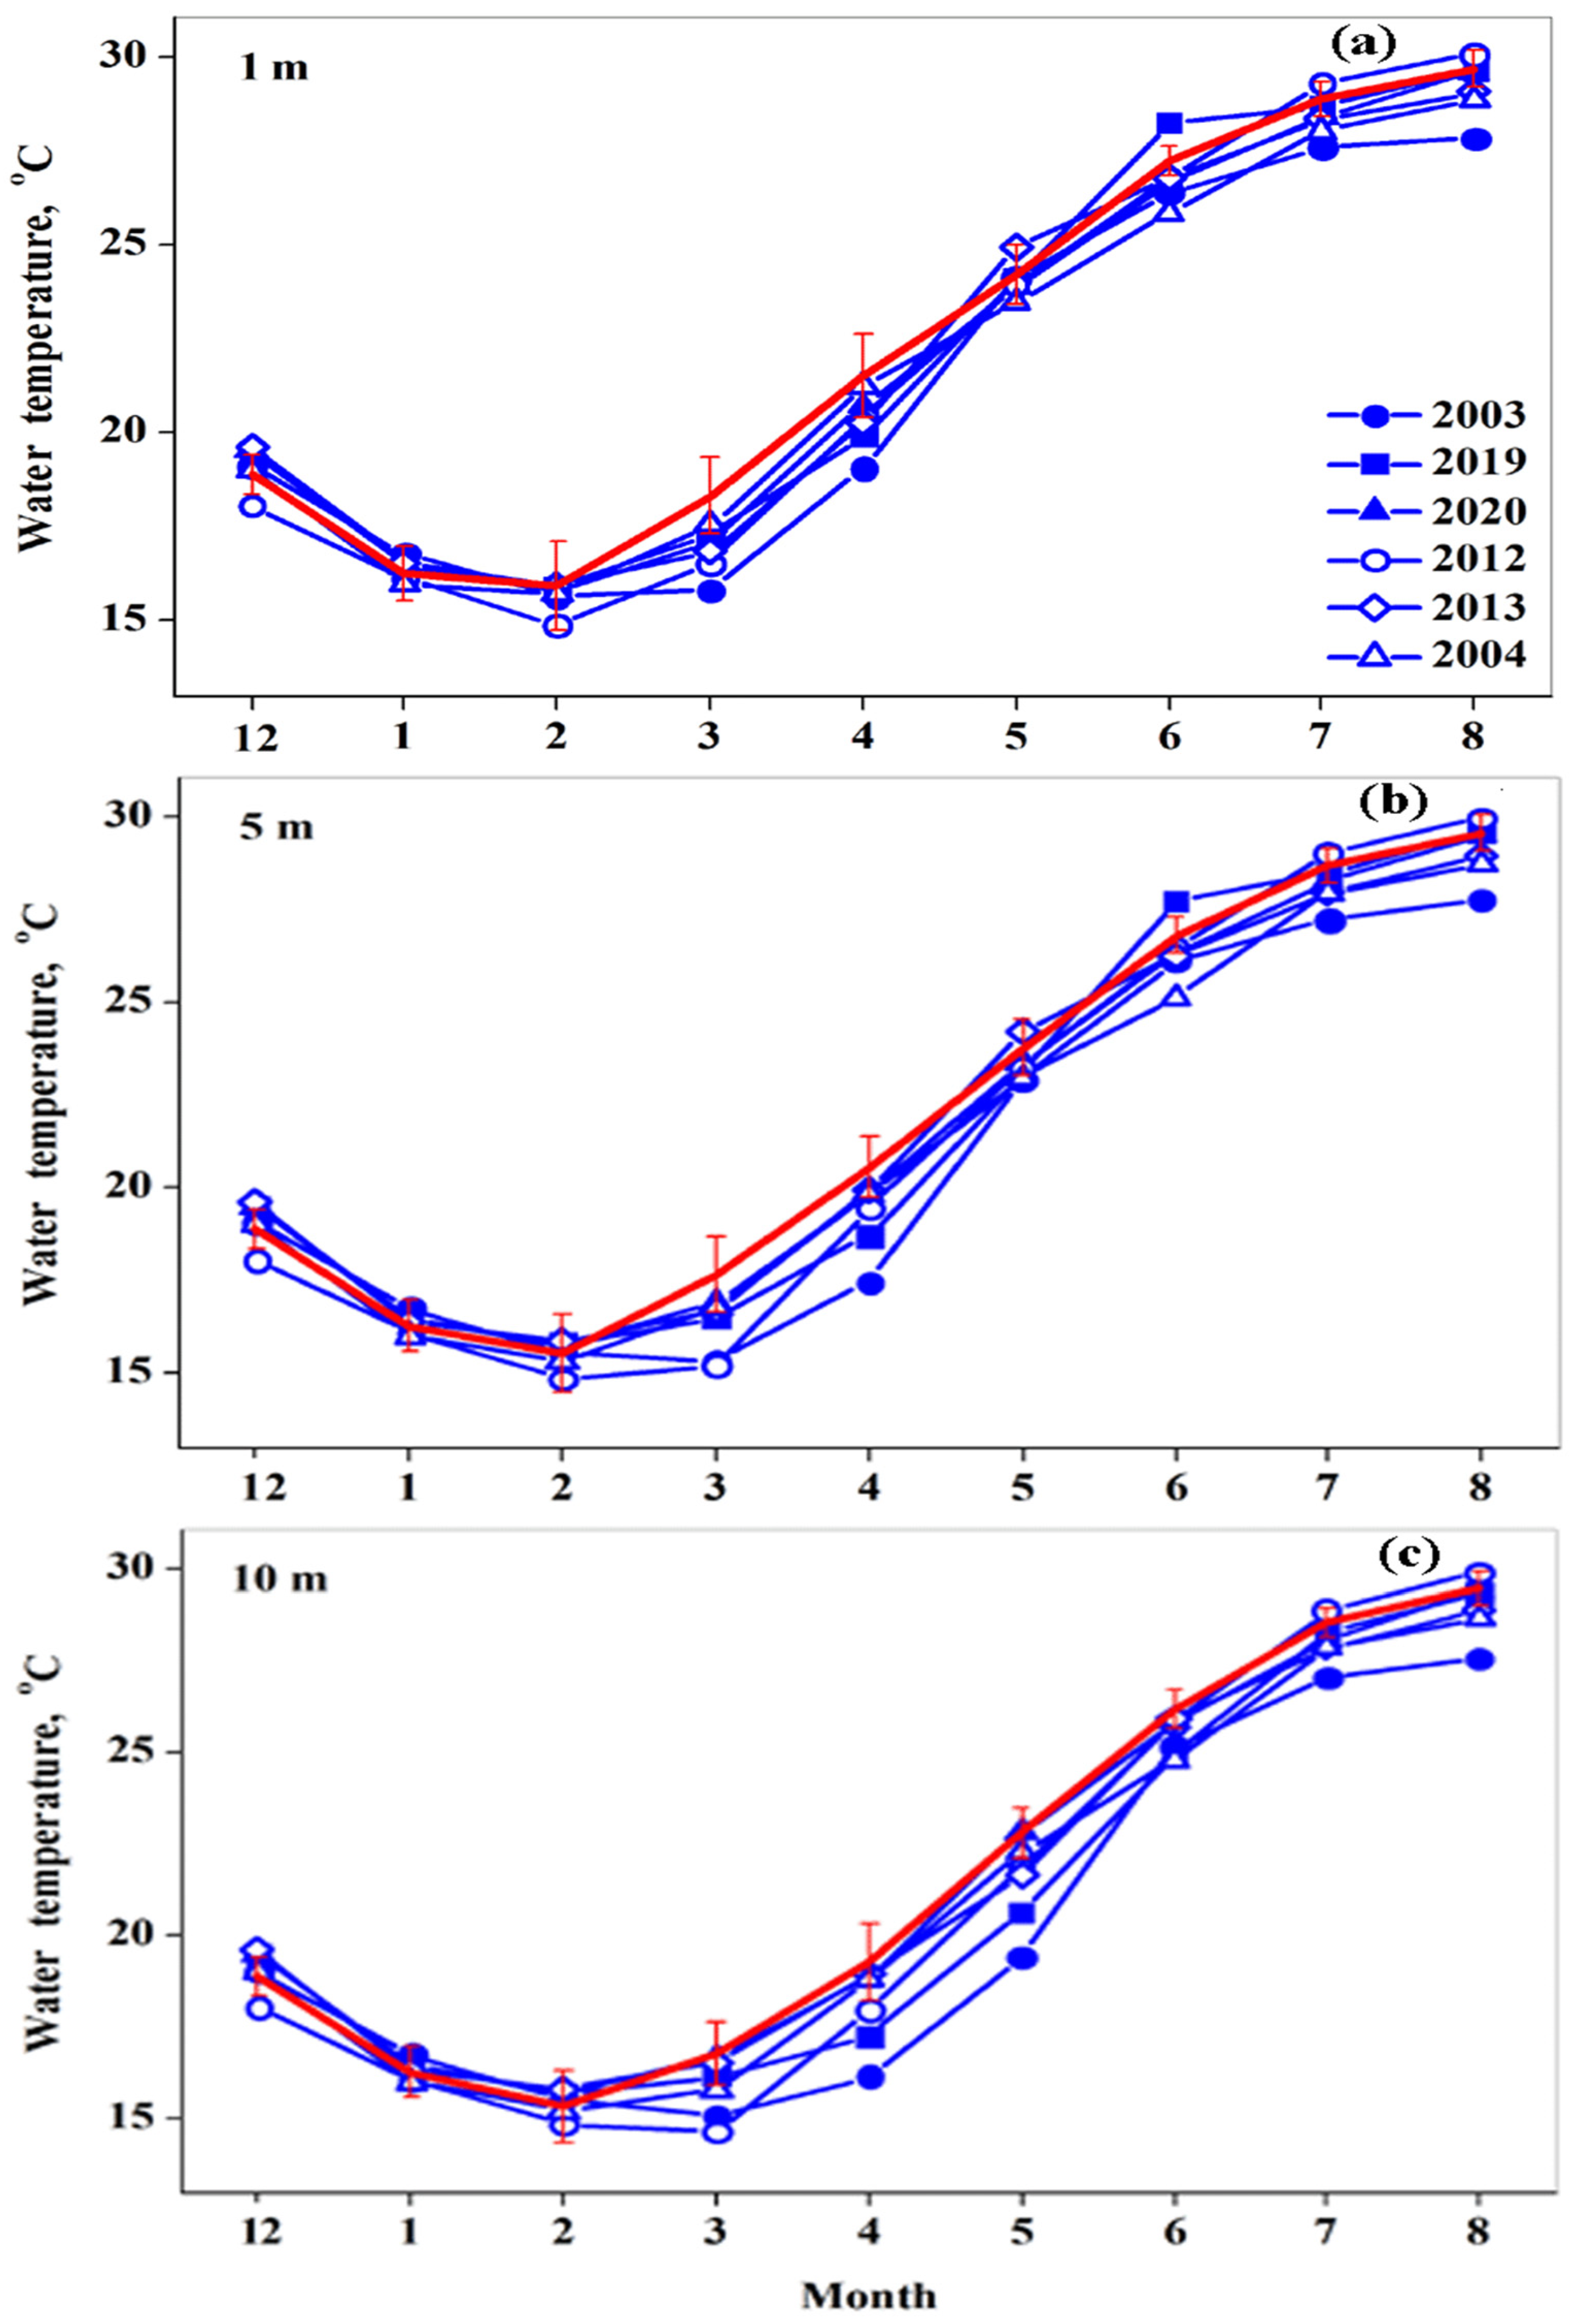
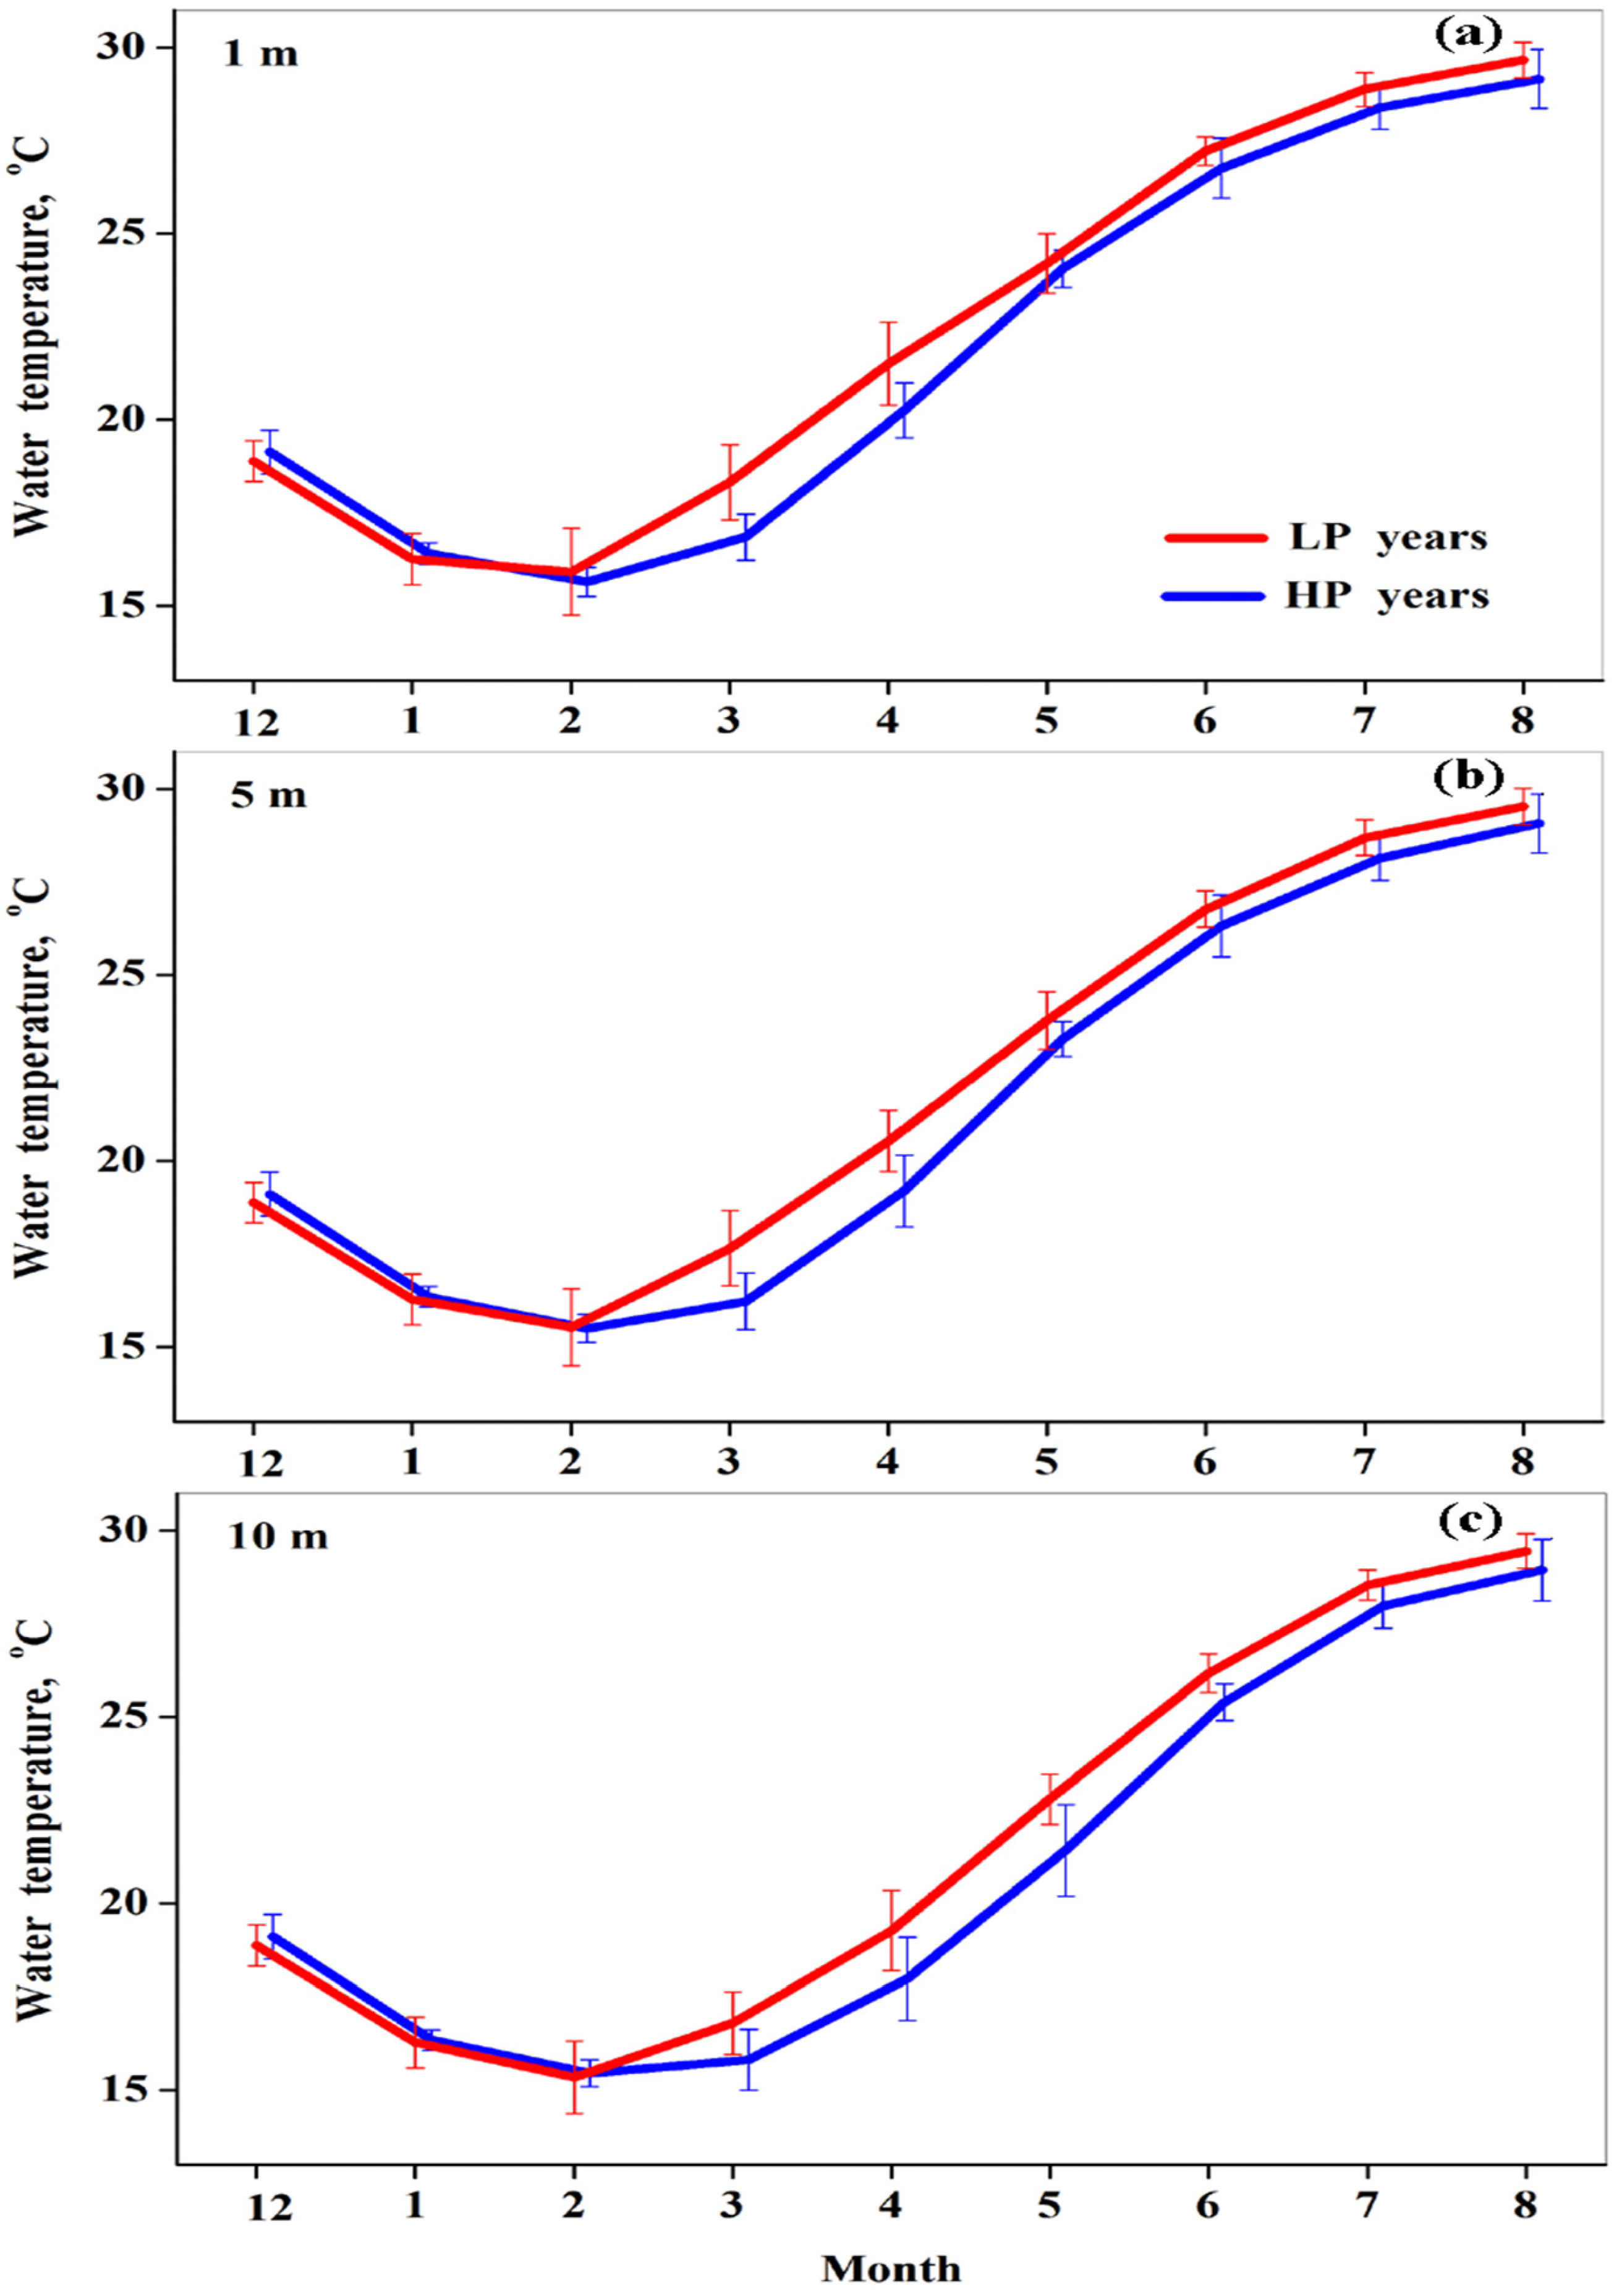
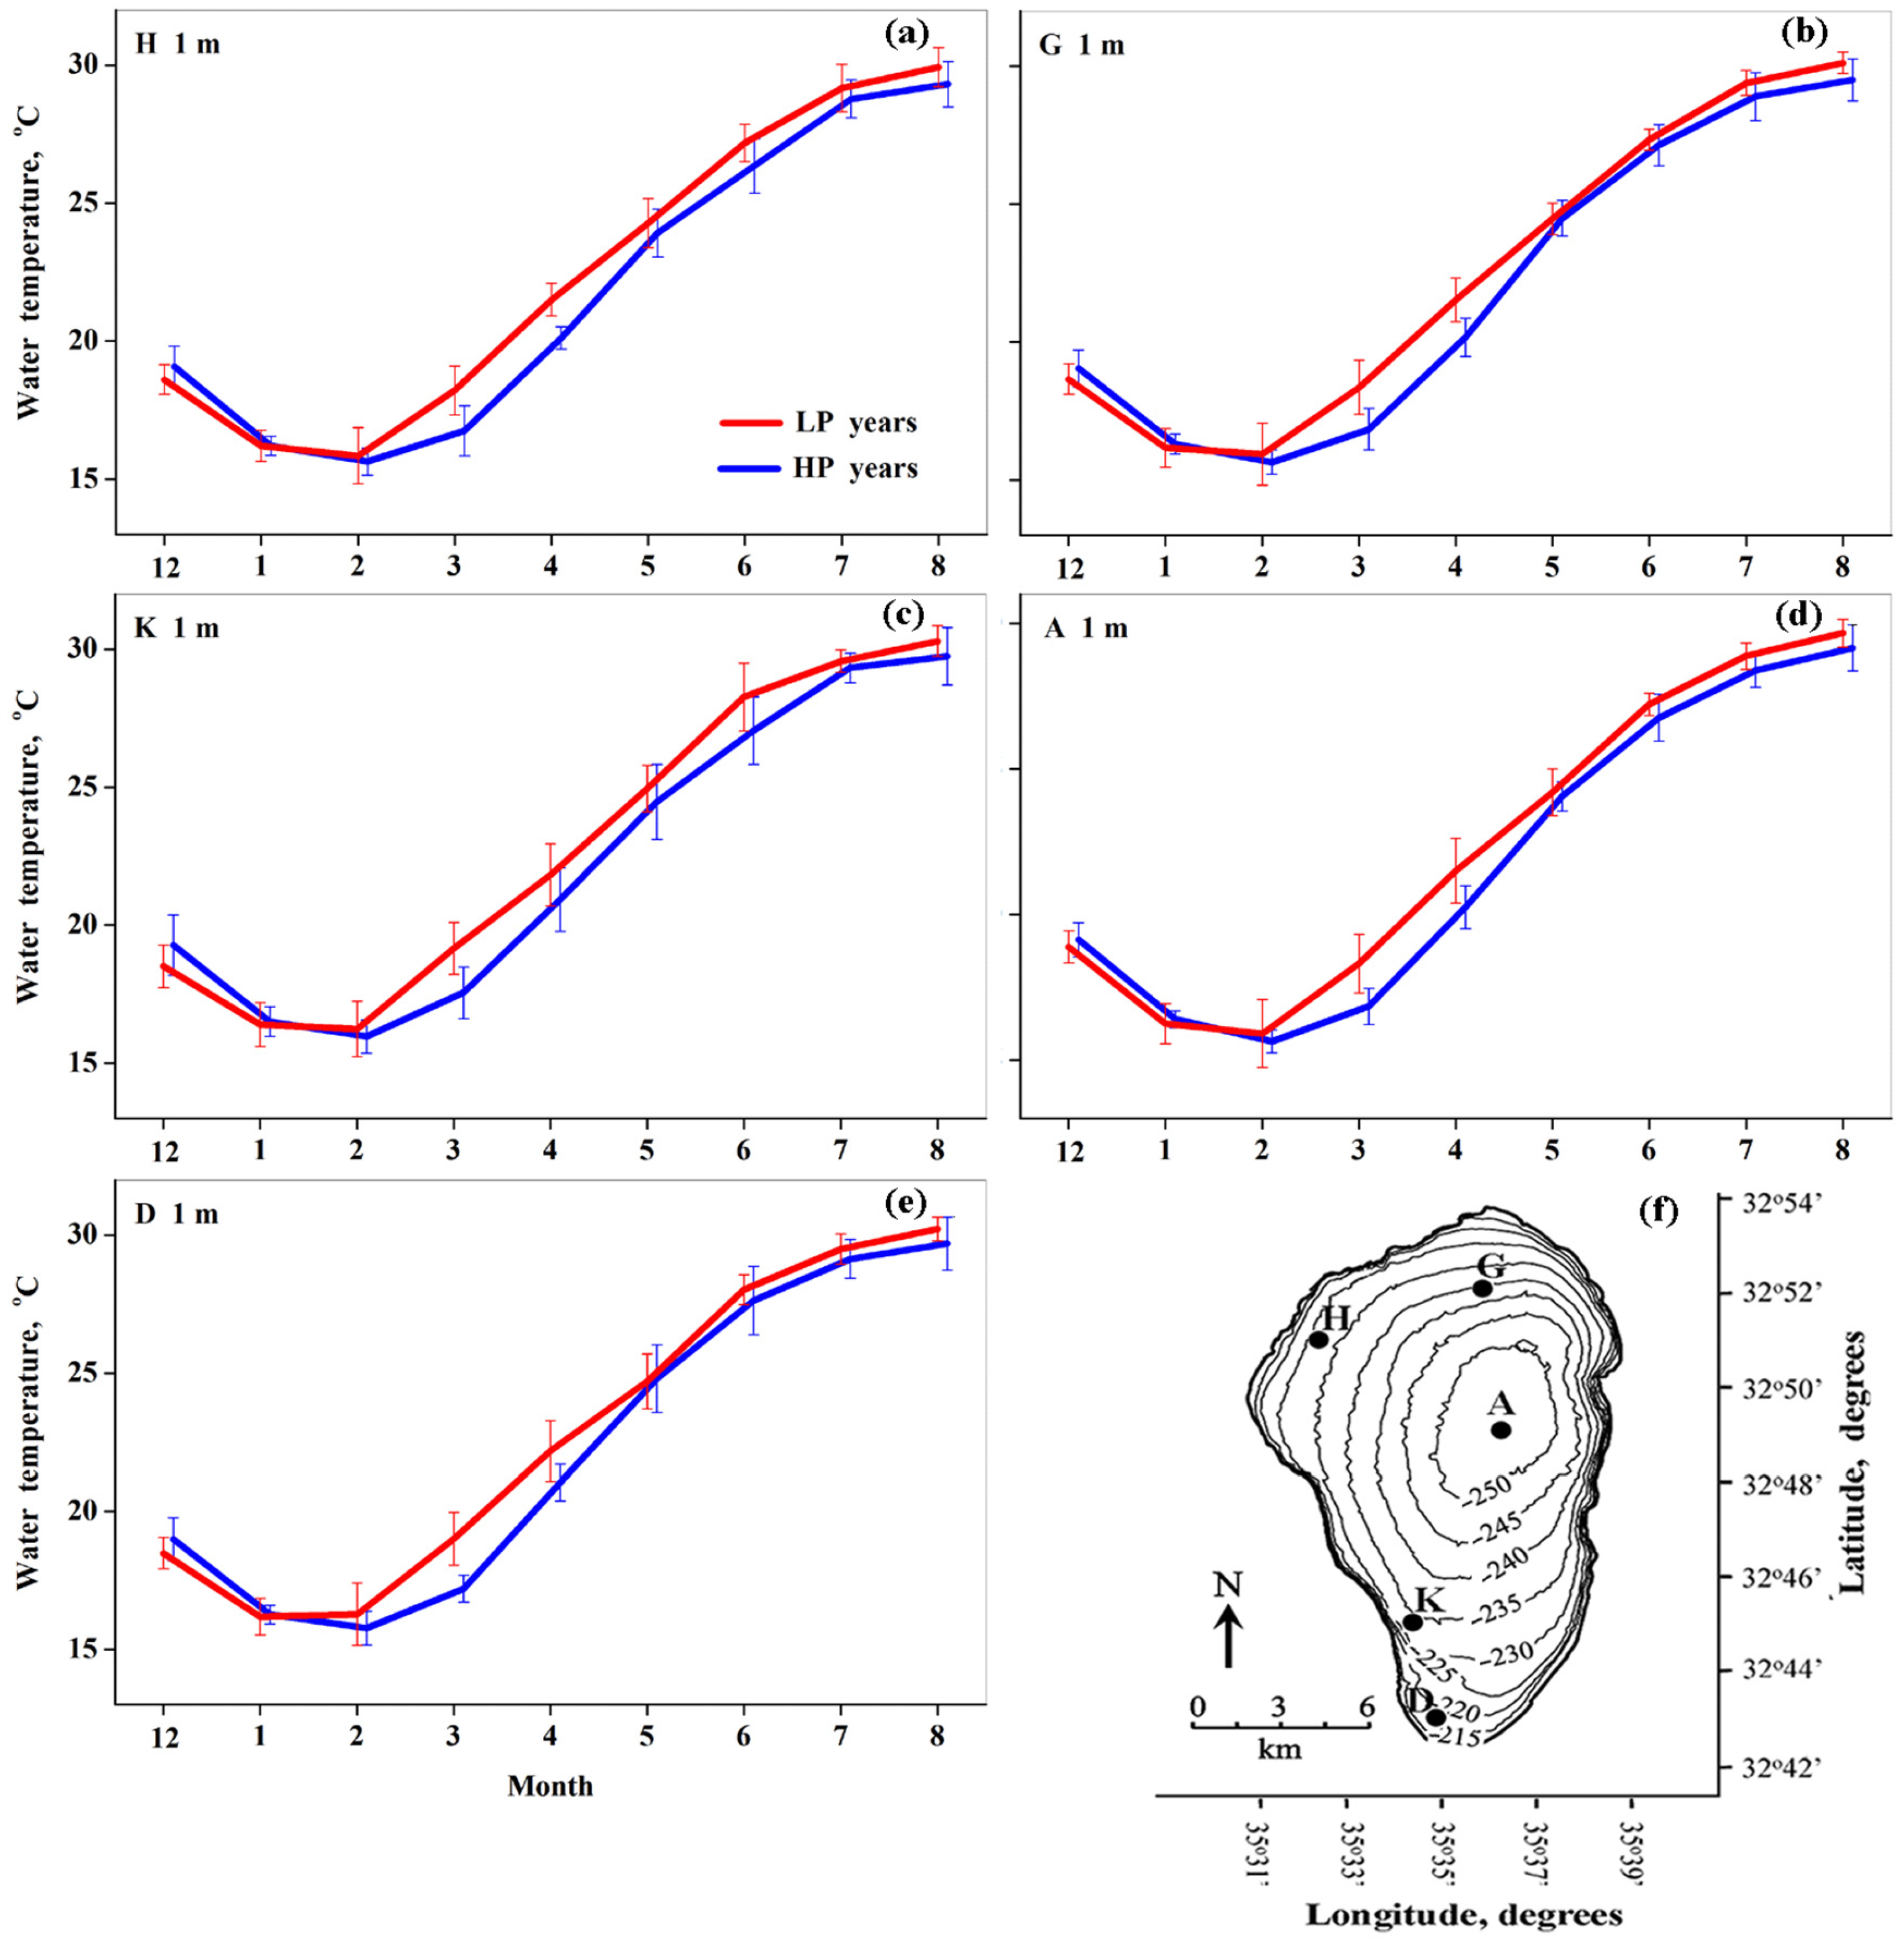
3.3. Kinneret SWT and WT at Various Depths in HP and LP Years

To investigate cooling of Kinneret water by Cyprus lows, we compared SWT, averaged over HP and over LP years, in every month from December to August (Figure 8). In the winter months, water heating by solar radiation was minimal, and the lake was isothermal from the surface to the bottom. This is due to the salient effect of winter cold air temperature [4]. From December to February, MODIS-Terra data showed an insignificant difference in SWT between HP and LP years (Figure 8a). This was in line with the behavior of Tair from December to February, which also demonstrated an insignificant difference between HP and LP years (Figure 7a).
In spring (March–April) when SR increased and became one of the main factors influencing SWT and epilimnion WT, MODIS-Terra data showed lower SWT by ~2 °C in the HP years compared to the LP years (Figure 8a). This was because, in the HP years, SR was lower by ~70 W/m2 than in the LP years (Figure 7b). In summer from May to August, the difference in SWT between HP and LP years gradually decreased due to a decrease in the SR difference.
It is worth mentioning that in some individual HP years in spring, the effect of Cyprus lows on SWT was stronger than that averaged over the HP years (Figure A2). For example, in April 2003, MODIS-Terra SWT was lower by up to 3.4 °C than MODIS-Terra SWT averaged over the LP years (Figure A2). This was caused by an increase in cloudiness, which led to a sharp decrease in SR by 140 W/m2.
The above-mentioned SWT differences between HP and LP years, observed by MODIS-Terra data at 10:30 LT, were similar to those observed by MODIS-Aqua data at 13:30 LT (Figure 8a,b). In the spring months (March–April), MODIS-Aqua data showed lower SWT by ~1.3 °C (compared to ~2 °C measured by MODIS-Terra) in the HP years compared to SWT in the LP years (Figure 8b).
In addition, we investigated cooling by Cyprus lows of Kinneret water at various depths by comparing in situ shipboard WT measurements in HP and LP years. At site A with the maximal depth of 40 m (Figure 1b), such a comparison was conducted for WT at various depths from the surface down to the bottom of the lake.
At a depth of 1 m to 10 m, we found similar patterns of month-to-month variations in WT difference between HP and LP years (Figure 9a–c). Namely, in the winter months when solar radiation was minimal and the lake was isothermal from the surface to the bottom, the difference in WT was insignificant between HP and LP years. In the spring months of March and April, measurements showed that WT in the HP years was lower by up to 1.4 °C than WT in the LP years (Figure 9a–c). The above-mentioned similar patterns of month-to-month variations in WT difference between HP and LP years at various depths, from the surface down to a depth of 10 m, were the result of vertical water mixing.
The effect of Cyprus lows on epilimnion WT in some individual HP years in spring is illustrated in Figure A3. One can see that in April 2003, at a depth from 1 m to 10 m, WT was lower by ~2.4 °C than WT averaged over the LP years (Figure A3).
From May to August, at various depths from the surface down to a depth of 10 m, the difference in WT between HP and LP years gradually decreased, together with a decrease in the difference in SR.
Shipboard measurements showed that from December to August, there was no noticeable difference in WT between the HP and LP years at a depth of 20 m, 30 m, and 35 m (Figure 10a–c). At those depths, SR was considerably attenuated, and the annual solar cycle was not observed. Our finding that water cooling of WT by Cyprus lows was observed only at a depth down to 10 m and disappeared in deeper layers indicates that a decrease in SR in HP years compared to SR in the LP years was the main contributor to the observed water-cooling phenomenon.
It is noteworthy that in situ shipboard measurements of WT at a depth of 1 m at five monitoring sites within Lake Kinneret (Figure 1b) showed similar patterns of the WT difference between HP and LP years (Figure 11a–e). Specifically, at all five sites, in the winter months (December, January, and February) no water cooling was observed: there was no significant difference in WT between HP and LP years. However, in the spring months of March and April, measurements showed that WT in the HP years was lower by up to ~1.4 °C than WT in the LP years at all five sites (Figure 11a–c). This is evidence that cooling by Cyprus lows of Kinneret water was evenly distributed within the lake. From May to August, the WT difference between the HP and LP years gradually decreased and became insignificant.
Moreover, similar patterns of WT differences between HP and LP years at the same five in situ monitoring sites were obtained at a depth of 5 m (Figure 12a–e). We found that a decrease in solar radiation (due to an increase in cloudiness) was the main factor contributing to the Kinneret water cooling by Cyprus lows. Therefore, the obtained similar patterns of the WT difference between HP and LP years at various depths at five in situ monitoring sites (Figure 11 and Figure 12) are evidence that the cooling by a decrease in solar radiation was evenly distributed within the lake.

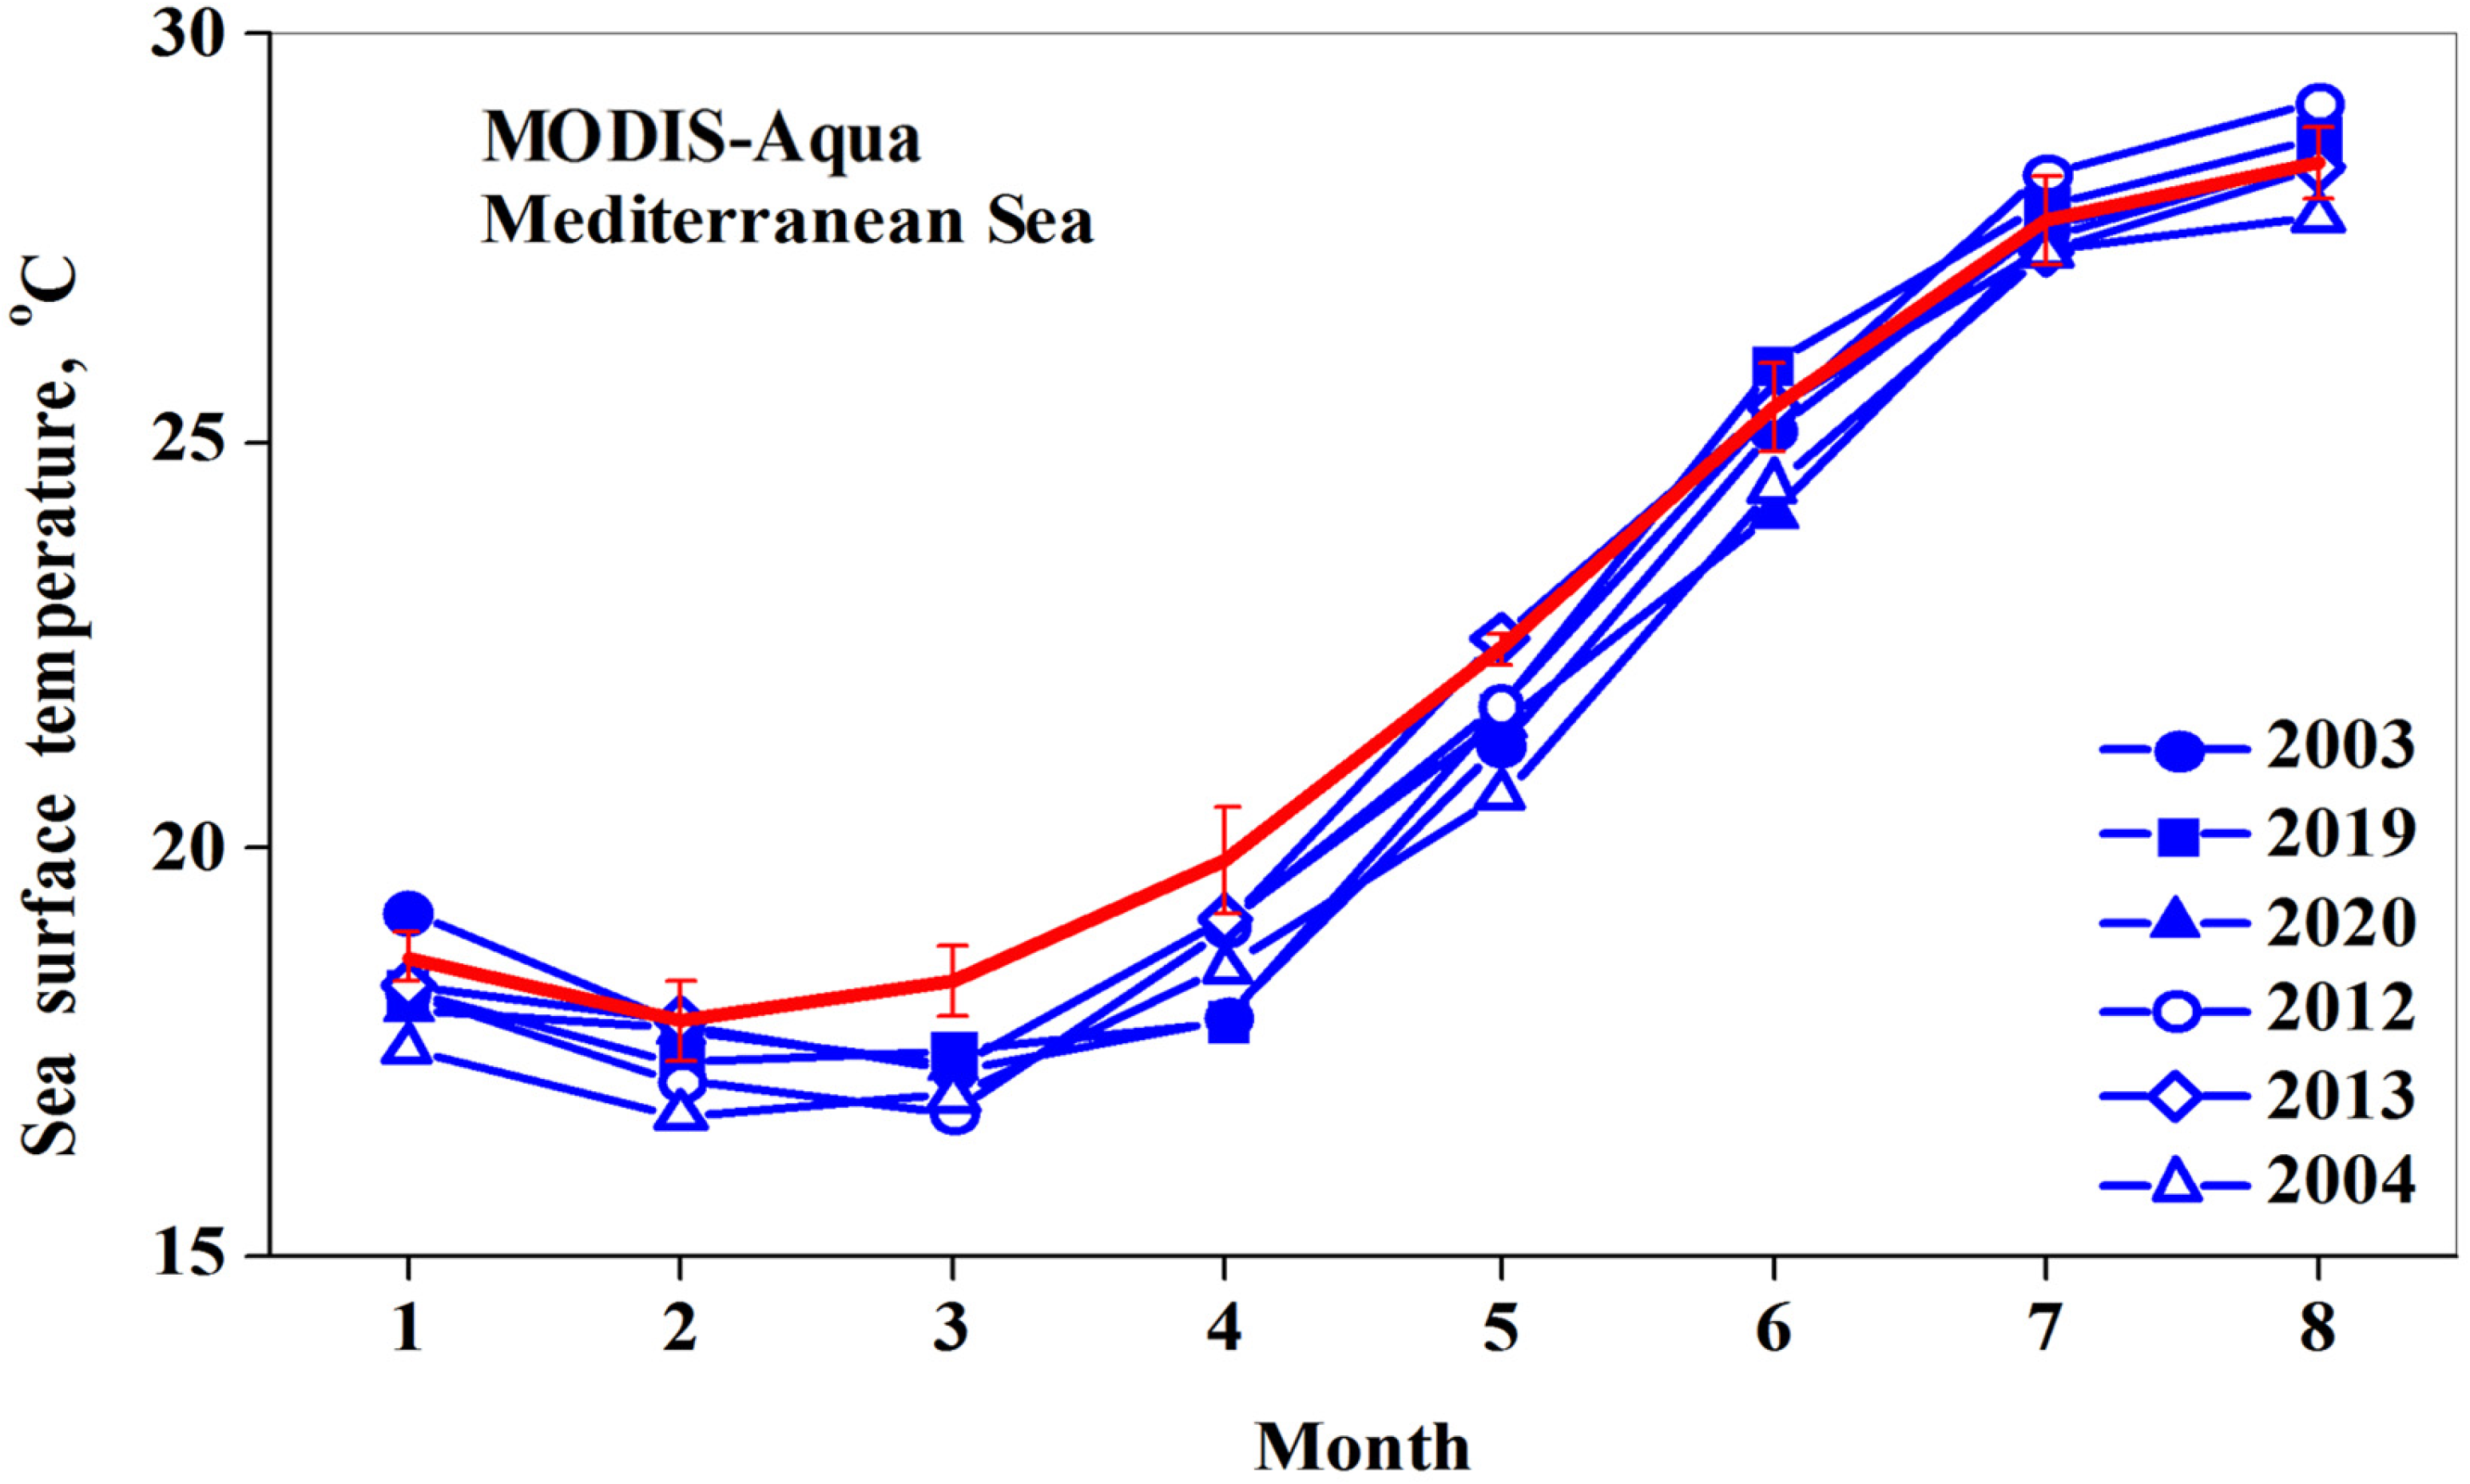
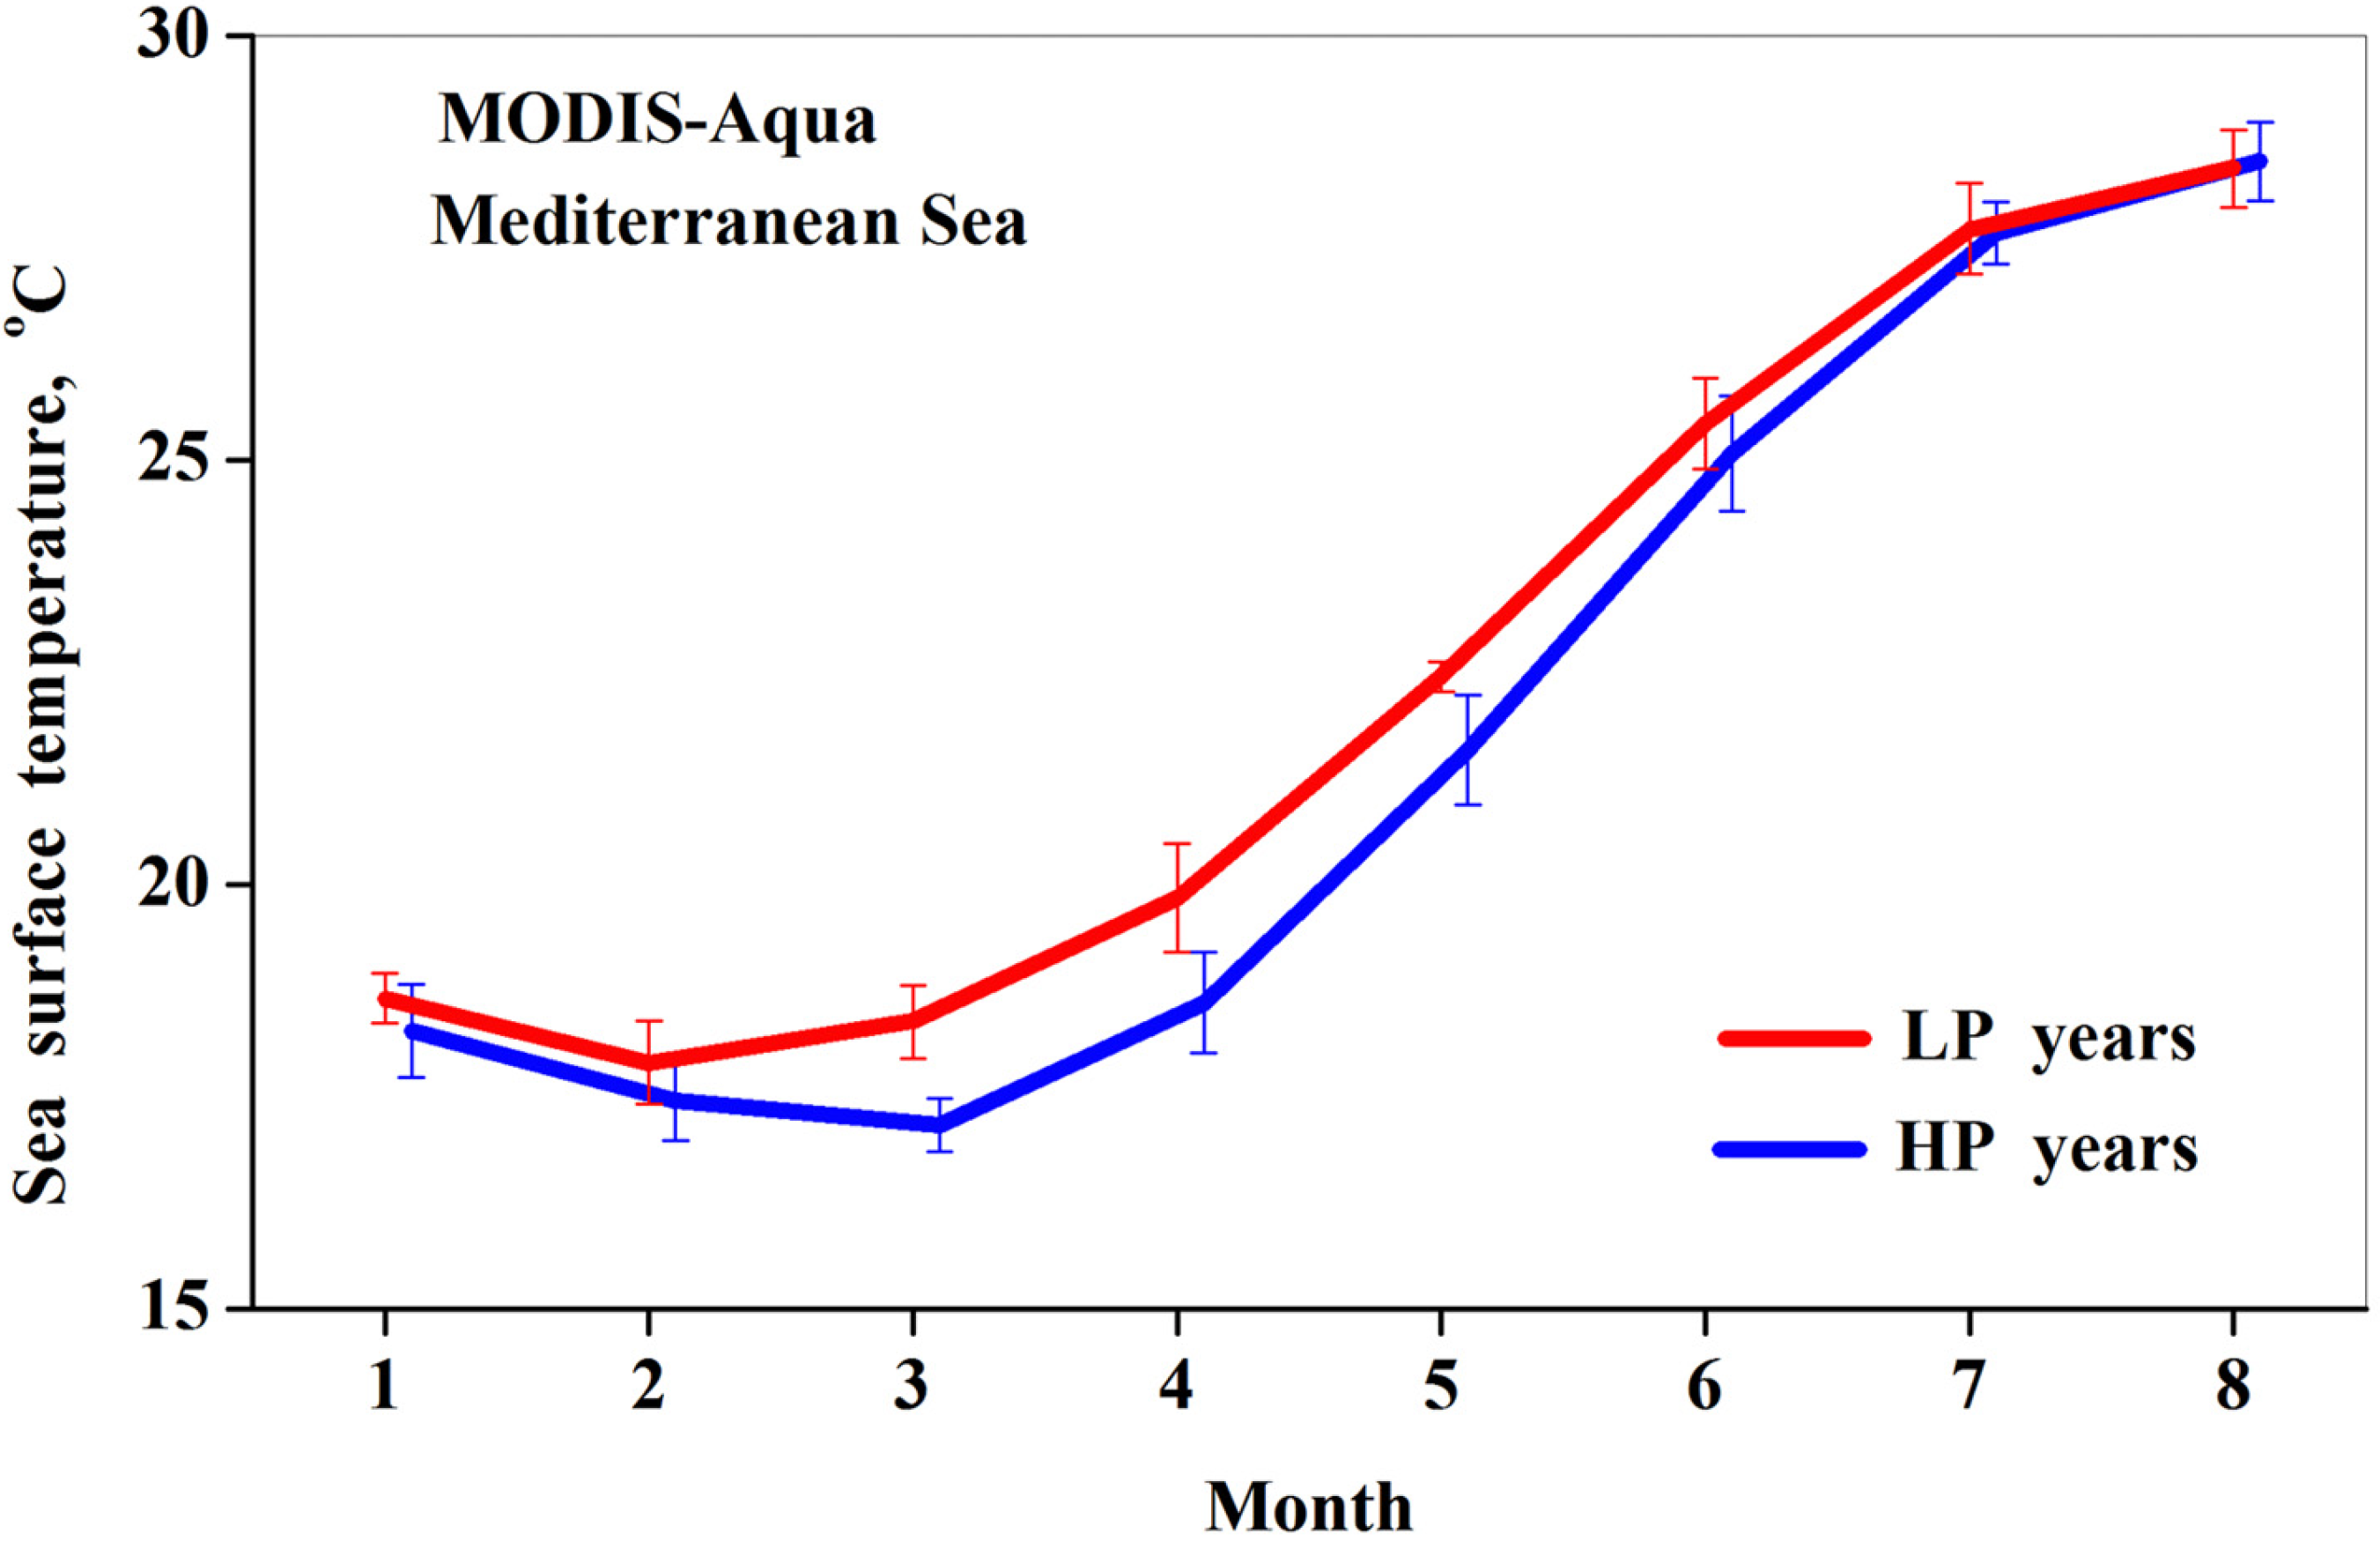
3.4. Comparison of Mediterranean Sea Surface Temperature (SST) in HP and LP Years

Ninety percent of the rainfall over Lake Kinneret results from Cyprus lows, which are low-pressure systems that develop over the eastern Mediterranean during the rainy season (December–May) [13]. Cyprus lows create cold weather conditions (accompanied by rainfall and by a decrease in SR due to an increase in cloudiness) over the whole eastern Mediterranean. Consequently, in the specified HP years, one could observe cooling of Mediterranean Sea surface water. This sea surface water cooling should be similar to water cooling in Lake Kinneret because both are produced by the same Cyprus lows. We investigated such a phenomenon over the EMED sea area near Israel (32°N–33.5°N; 33.750°E–34.375°E) (Figure 1a). This was carried out using satellite-based MODIS-Aqua SST data during the study period (2002–2020).
We found sea surface water cooling in the eastern Mediterranean in the specified HP years. In particular, in the spring months of March and April, SST averaged over the HP years was lower by ~1.2 °C than SST averaged over the LP years (Figure 13). This is evidence of the regional characteristic of the water-cooling phenomenon caused by Cyprus lows responsible for cold weather conditions and for a decrease in SR.
Note that in spring in some individual HP years, the effect of Cyprus lows on eastern Mediterranean SST was stronger than for SST averaged over the LP years: in March 2003, SST was lower by up to 1.9 °C than SST averaged over the LP years (Figure A4).

4. Discussion

Hambright et al. [4] discussed the issue of cold weather in winter as a cause of the formation of isothermal stratification in Lake Kinneret. However, a decrease in SWT due to winter cold weather caused by Cyprus lows has not been analyzed. Moreover, the cooling effect by Cyprus lows on Kinneret SWT and epilimnion WT in other seasons has not been discussed in previous publications. In our study, we investigated cooling by Cyprus lows of Kinneret SWT and epilimnion WT on a monthly basis during the study period (2000–2020).
We found that a decrease in solar radiation caused by Cyprus lows (due to an increase in cloudiness) was the main factor contributing to Kinneret water cooling. In winter, when solar radiation was minimal, we found that the SWT difference (as well as the epilimnion WT difference) between HP and LP years was insignificant (Figure 8 and Figure 9). This was despite the fact that precipitation during the rainy season (December–May) changed from ~600 mm/year in HP years to ~300 mm/years in LP years. Our findings, based on satellite and in-situ data, indicate that, on a monthly basis in winter, significant amounts of rain water did not produce noticeable cooling of SWT and of epilimnion WT in the subtropical Lake Kinneret. However, in spring (March–April), SR increased and became the main factor influencing SWT and epilimnion WT. In the HP years in spring, average SR was lower by ~70 W/m2 than that in the LP years (Figure 7b). This was due to more significant cloudiness associated with Cyprus lows in the HP years. As a result of the lower SR in the HP years in spring, MODIS and in situ shipboard measurements showed lower Kinneret SWT and epilimnion WT in HP years than in LP years. In particular, SWT averaged over the HP years was lower by ~2 °C (based on MODIS-Terra data) and by ~1.4 °C (MODIS-Aqua data) than that averaged over the LP years. Moreover, in situ shipboard measurements of WT at various depths, from the depth of 1 m down to 10 m, showed that WT in HP years was lower by ~1.4 °C than in LP years.
We would like to highlight the fact that water cooling by Cyprus lows was observed not only in Lake Kinneret but also in eastern Mediterranean surface water. In particular, in winter, we found no significant difference in SST between the same HP and LP years. However, in the spring months (March–April), Mediterranean SST averaged over the same HP years was lower by ~1.2 °C than that averaged over LP years. This is evidence of the regional characteristic of the daytime water-cooling phenomenon caused by Cyprus lows.
From May to August, the difference in Kinneret SWT and epilimnion WT between HP and LP years gradually decreased, together with a decrease in the SR difference. The same phenomenon was observed in summer in eastern Mediterranean SST.
Based on available satellite and in situ shipboard measurements, our approach allowed us to find out for the first time that, on a monthly basis, Cyprus lows are instrumental in the cooling of surface and epilimnion water in subtropical Lake Kinneret and also in the cooling of eastern Mediterranean surface water. Further research of the above-mentioned phenomenon of water cooling by Cyprus lows in the eastern Mediterranean Sea and in Lake Kinneret based on long-term measurements can support our findings.

5. Conclusions

Cyprus lows are the main factor responsible for cold weather conditions in rainy seasons, accompanied by rainfall and by an increase in cloudiness causing a decrease in solar radiation over the eastern Mediterranean and north Israel (including Lake Kinneret). These lows are centered over the Mediterranean Island of Cyprus.
Comparison, conducted on a monthly basis, between high-precipitation (HP) years and low-precipitation (LP) years led to our main findings, which are as follows: Cyprus lows are instrumental in the cooling of surface and epilimnion water in subtropical Lake Kinneret and in the cooling of eastern Mediterranean surface water. Such cooling effects of Cyprus lows on Kinneret surface and epilimnion water and on Eastern Mediterranean surface water have not been discussed in previous studies. In the daytime, comparison between HP and LP years of Kinneret surface water temperature (SWT) and epilimnion water temperature (WT) showed water cooling of up to 2 °C in HP years. This study was carried out using the 21-year period of satellite and in-situ data: (1) MODIS 1 km × 1 km resolution records of SWT, and (2) shipboard measurements of WT vertical profiles down to a depth of ~40 m (2000–2020). We found that a decrease in solar radiation caused by Cyprus lows (due to an increase in cloudiness) was the main factor contributing to Kinneret water cooling. In winter (December–January) when solar radiation (SR) was minimal, no water cooling was observed: the WT difference between HP and LP years was insignificant. Our findings, based on satellite and in-situ data, indicate that, on a monthly basis in winter, significant amounts of rain water did not produce noticeable cooling of SWT and of epilimnion WT in the subtropical Lake Kinneret. However, in spring (March–April) when SR increased and became the main factor contributing to water heating, water cooling was observed: SWT and epilimnion WT, averaged over the HP years, was lower by ~2 °C and ~1.4 °C, respectively, than SWT and epilimnion WT averaged over the LP years. From May to August, the difference between HP and LP years in Kinneret SWT and epilimnion WT gradually decreased, together with a decrease in the SR difference.
It is noteworthy that in situ shipboard measurements of WT at a depth of 1 m and 5 m at five monitoring sites within Lake Kinneret showed similar patterns of the WT difference between HP and LP years. This is evidence that cooling by Cyprus lows of Kinneret water was evenly distributed within the lake.
Furthermore, water cooling by Cyprus lows was observed not only in Lake Kinneret but also in eastern Mediterranean surface water. In particular, in the spring months (March–April), Mediterranean SST averaged over the same HP years was lower by ~1.2 oC than that averaged over LP years. This is evidence of the regional character of the water-cooling phenomenon caused by Cyprus lows.
Using eight CMI5 models for climate predictions, Hochman et al. [30] predicted approximately a 35% reduction in the appearance of Cyprus lows by the end of the 21st century. Based on their findings, one could expect a reduction in the appearance of the water-cooling phenomenon caused by Cyprus lows, and, consequently, a reduction in cloudiness and a gradual increase in Kinneret WT and evaporation. This is supported by several other climate model predictions estimating a considerable increase in evaporation and a decrease in precipitation, resulting in a decline in the water availability of Lake Kinneret, by the end of the 21st century [6,7,8].

Author Contributions

All co-authors equally contributed to the writing of the current research article: P.K., Y.L. and B.S.; shipboard measurements of water temperature profiles: Y.L. All authors have read and agreed to the published version of the manuscript.

Funding

This research received no external funding.

Data Availability Statement

Satellite MODIS/Terra MOD11A1 product and MODIS/Aqua MYD11A1 product of land surface temperature (LST) are available at https://e4ftl01.cr.usgs.gov/MOLT/ and https://e4ftl01.cr.usgs.gov/MOLA/, respectively (accessed on 5 September 2022). The MODISA_L3m_SST (version R2019.0) product of sea surface temperature (SST) is available at https://oceandata.sci.gsfc.nasa.gov/opendap/hyrax/MODISA/L3SMI/contents.html (accessed on 5 September 2022). Data of water temperature profiles and lake water levels are available in the Zenodo repository [21]. Precipitation datasets GPM, TRMM, and MERRA2 are available online [23,24,25]. Ten-minute measurements of Tair, SR, and WS taken at the Zemah meteorological station are available online [29].

Acknowledgments

We thank the MODIS teams that produced the MOD11A1, MYD11A1, and MODISA_L3m_SST (version R2019.0) datasets used in this study. Data of water temperature profiles are associated with the Kinneret Limnological Laboratory, Israel Oceanographic and Limnological Research (http://kinneret.ocean.org.il/ar_3d_vb.aspx (accessed on 5 September 2022)). Data of Lake Kinneret water levels are associated with the Israel Water and Sewage Authority (https://www.gov.il/en/departments/water_authority/govil-landing-page (accessed on 5 September 2022)). We acknowledge the use of imagery from the NASA Worldview application ((https://worldview.earthdata.nasa.gov (accessed on 5 September 2022)), part of the NASA Earth Observing System Data and Information System (EOSDIS)) for preparing the graphical abstract.

Conflicts of Interest

The authors declare no conflict of interest.

Appendix A

Figure A1. Month-to-month variations in (a) Tair, (b) SR, and (c) WS in (blue lines) every separate HP year. The red lines designate month-to-month variations in Tair, SR, and WS averaged over the LP years.
Remotesensing 14 04709 g0a1
Figure A2. Month-to-month variations in (a) MODIS/Terra SWT data at 10:30 LT and (b) MODIS/Aqua SWT data at 13:30 LT in (blue lines) every separate HP year. The red lines designate month-to-month variations in SWT averaged over the LP years.
Remotesensing 14 04709 g0a2
Figure A3. Month-to-month variations in WT at the depth of (a) 1 m, (b) 5 m, and (c) 10 m in (blue lines) every separate HP year. The red lines designate month-to-month variations in WT averaged over the LP years.
Remotesensing 14 04709 g0a3
Figure A4. Month-to-month variations in MODIS-Aqua Mediterranean SST averaged over the EMED area in the eastern Mediterranean (Figure 1a) in (blue lines) every separate HP year. The red line designates month-to-month variations in SST averaged over the LP years.
Remotesensing 14 04709 g0a4

References

  1. O’Reilly, C.M.; Sharma, S.; Gray, D.K.; Hampton, S.E.; Read, J.S.; Rowley, R.J.; Schneider, P.; Lenters, J.D.; McIntyre, P.B.; Kraemer, B.M.; et al. Rapid and highly variable warming of lake surface waters around the globe. Geophys. Res. Lett. 2015, 42, 10773–10781. [Google Scholar] [CrossRef]
  2. He, J.; Soden, B. A re-examination of the projected subtropical precipitation decline. Nat. Clim. Chang. 2017, 7, 53–57. [Google Scholar] [CrossRef]
  3. Feng, X.; Liu, C.; Xie, F.; Lu, J.; Chiu, L.S.; Tintera, G.; Chen, B. Precipitation characteristic changes due to global warming in a high-resolution (16 km) ECMWF simulation. Q. J. R. Meteorol. Soc. 2019, 145, 303–317. [Google Scholar] [CrossRef] [PubMed]
  4. Hambright, K.D.; Gofen, M.; Serruya, S. Influence of long-term climatic changes on the stratification of a subtropical, warm monomictic lake. Limnol. Oceanogr. 1994, 39, 1233–1242. [Google Scholar] [CrossRef]
  5. Kishcha, P.; Starobinets, B.; Lechinsky, Y.; Alpert, P. Absence of Surface Water Temperature Trends in Lake Kinneret despite Present Atmospheric Warming: Comparisons with Dead Sea Trends. Remote Sens. 2021, 13, 3461. [Google Scholar] [CrossRef]
  6. Gal, G.; Yael, G.; Noam, S.; Moshe, E.; Schlabing, D. Ensemble modeling of the impact of climate warming and increased frequency of extreme climatic events on the thermal characteristics of a sub-tropical Lake. Water 2020, 12, 1982. [Google Scholar] [CrossRef]
  7. Rimmer, A.; Givati, A.; Samuels, R.; Alpert, P. Using ensemble of climate models to evaluate future water and solutes budgets in Lake Kinneret, Israel. J. Hydrol. 2011, 410, 248–259. [Google Scholar] [CrossRef]
  8. La Fuente, S.; Woolway, I.; Jennings, E.; Gal, G.; Kirillin, G.; Shatwell, T.; Ladwig, R.; Moore, T.; Couture, R.-M.; Côté, M.; et al. Multi-model projections of evaporation in a sub-tropical lake. In Proceedings of the Online EGU General Assembly 2021, Online, 19–30 April 2021. Including display materials, EGU21-10186. [Google Scholar]
  9. Gophen, M. Climate and water balance changes in the Kinneret watershed: A review. Open J. Mod. Hydrol. 2020, 10, 21–29. [Google Scholar] [CrossRef]
  10. Saaroni, H.; Halfon, N.; Ziv, B.; Alpert, P.; Kutiel, H. Links between the rainfall regime in Israel and location and intensity of Cyprus Lows. Int. J. Climatol. 2010, 30, 1014–1025. [Google Scholar] [CrossRef]
  11. Alpert, P.; Osetinsky, I.; Ziv, B.; Shafir, H. A new seasons’ definition based on the classified daily synoptic systems, an example for the Eastern Mediterranean. Int. J. Climatol. 2004, 24, 1013–1021. [Google Scholar] [CrossRef]
  12. Shay-El, Y.; Alpert, P. A diagnostic study of winter diabatic heating in the Mediterranean in relation to cyclones. Q. J. R. Meteorol. Soc. 1991, 117, 715–747. [Google Scholar] [CrossRef]
  13. Ziv, B.; Shilo, E.; Lechinsky, Y.; Rimmer, A. Meteorology. In Lake Kinneret—Ecology and Management; Zohary, T., Sukenik, A., Berman, T., Nishri, A., Eds.; Springer: Dordrecht, The Netherlands, 2014; pp. 81–96. [Google Scholar]
  14. Ostrovsky, I.; Rimmer, A.; Yacobi, Y.Z.; Nishri, A.; Sukenik, A.; Hadas, O.; Zohary, T. Long-term changes in the Lake Kinneret ecosystem: The effects of climate change and anthropogenic Factors. In Climatic Change and Global Warming of Inland Water: Impacts and Mitigation for Ecosystems and Societies, 1st ed.; Goldman, C.R., Kumagai, M., Robats, R.D., Eds.; John Willey & Sons, Ltd.: New York, NY, USA, 2013; Chapter 13; pp. 271–293. [Google Scholar]
  15. Rimer, A.; Givati, A. Hydrology. In Lake Kinneret—Ecology and Management; Zohary, T., Sukenik, A., Berman, T., Nishri, A., Eds.; Springer: Dordrecht, The Netherlands, 2014; pp. 97–111. [Google Scholar]
  16. Doron, M. Monitoring and Management Lake Kinneret (Sea of Galilee)—Preserving Israel’s Major Surface Water Resource. EnviroGeoChimica Acta 2014, 1, 411–420. Available online: https://www.gov.il/BlobFolder/generalpage/kinneret-monitoring/he/Monitoring_and_management_Lake_Kinneret-markel-20.10.14.pdf (accessed on 30 July 2022).
  17. Sade, R.; Rimmer, A.; Samuels, R.; Salingar, Y.; Denisyuk, M.; Alpert, P. Water management in a complex hydrological basin—Application of Water Evaluation and Planning tool (WEAP) to the Lake Kinneret watershed, Israel. In Integrated Water Resources Management: Concept, Research and Implementation; Borchardt, D., Bogardi, J., Ibisch, R., Eds.; Springer: Cham, Switzerland, 2016; pp. 35–37. [Google Scholar]
  18. Petterssen, S. Weather Analysis and Forecasting, Volume 1, Motion and Motion Systems, 2nd ed.; McGraw-Hill: New York, NY, USA, 1956; 428p. [Google Scholar]
  19. Wan, Z. New refinements and validation of the Collection-6 MODIS land-surface temperature/emissivity products. Remote Sens. Environ. 2014, 140, 36–45. [Google Scholar] [CrossRef]
  20. Carrea, L.; Embury, O.; Merchant, C.J. Dataset related to in-land water for limnology and remote sensing applications: Distance-to-land, distance-to-water, water-body identifier and lake-center coordinates. Geosci. Data J. 2015, 2, 83–97. [Google Scholar] [CrossRef] [PubMed]
  21. Kishcha, P.; Lechinsky, Y.; Starobinets, B. Measurements of Water Levels and Water Temperature Profiles in Lake Kinneret (2000–2020). Zenodo Repository 2022. Available online: https://zenodo.org/record/6207765#.YhPLuDhByiS (accessed on 5 August 2022).
  22. Specifications of the AML MINOS X Probe. Available online: http://www.mdsys.co.kr/down/AML/Minos%20X.pdf (accessed on 5 September 2022).
  23. Global Precipitation Measurements GPM_3IMERGM V6 Data at 0.1° × 0.1° Spatial Resolution. Available online: https://disc.gsfc.nasa.gov/datasets/GPM_3IMERGM_06/summary (accessed on 5 September 2022).
  24. TRMM_3B43 Satellite Data at 0.25° × 0.25° Spatial Resolution. Available online: https://disc.gsfc.nasa.gov/datasets/TRMM_3B43_7/summary (accessed on 5 September 2022).
  25. MERRA-2 Reanalysis Data M2TMNXFLX V5.12.4 at 0.5° × 0.625° Special Resolution. Available online: https://disc.gsfc.nasa.gov/datasets/M2TMNXFLX_5.12.4/summary (accessed on 5 September 2022).
  26. Hou, A.Y.; Kakar, R.K.; Neeck, S.; Azarbarzin, A.A.; Kummerow, C.D.; Kojima, M.; Oki, R.; Nakamura, K.; Iguchi, T. The global precipitation measurement mission. Bull. Am. Meteorol. Soc. 2014, 95, 701–722. [Google Scholar] [CrossRef]
  27. Vallejo-Bernal, S.M.; Urrea, V.; Bedoya-Soto, J.M.; Posada, D.; Olarte, A.; Cárdenas-Posso, Y.; Ruiz-Murcia, F.; Martínez, M.T.; Petersen, W.A.; Huffman, G.J.; et al. Ground validation of TRMM 3B43 V7 precipitation estimates over Colombia. Part I: Monthly and seasonal timescales. Int. J. Climatol. 2021, 41, 601–624. [Google Scholar] [CrossRef]
  28. Hamal, K.; Sharma, S.; Khadka, N.; Baniya, B.; Ali, M.; Shrestha, M.S.; Xu, T.; Shrestha, D.; Dawadi, B. Evaluation of MERRA-2 Precipitation Products Using Gauge Observation in Nepal. Hydrology 2020, 7, 40. [Google Scholar] [CrossRef]
  29. IMS—Israel Meteorological Service. Measurements of 2-m Air Temperature, Wind Speed, and Pyranometer Measurements of Surface Solar Radiation at the Zemah Meteorological Stations Located in the Vicinity of Lake Kinneret. Available online: https://ims.data.gov.il/ims/7 (accessed on 5 September 2022).
  30. Hochman, A.; Harpaz, T.; Saaroni, H.; Alpert, P. Synoptic classification in 21st century CMIP5 predictions over the Eastern Mediterranean with focus on cyclones. Int. J. Climatol. 2018, 38, 1476–1483. [Google Scholar] [CrossRef]
Figure 1. (a) Topographic map of the south-east Mediterranean region including (EMED) a sea area in the Mediterranean Sea (32°N–33.5°N; 33.750°E–34.375°E), (b) a bathymetric map of Lake Kinneret (−215 to −250 m a.s.l.). The green pentagon shows the location of the Zemah meteorological station (32.70°N, 35.58°E). MH designates Mount Hermon, while A (32.82°N, 35.60°E, 40 m depth), G (32.86°N, 35.59°E, 22 m depth), K (32.75°N, 35.57°E, 21 m depth), H (32.86°N, 35.54°E, 12 m depth), and D (32.71°N, 35.59°E, 10 m depth) designate the locations of five monitoring sites with ship measurements of WT profiles.
Remotesensing 14 04709 g001
Figure 2. Kinneret watershed (the green area) (adapted with permission from Sade et al. [17]. 2016, Springer Nature.).
Remotesensing 14 04709 g002
Figure 3. The spatial distribution of (a) cloudiness observed by the NASA Terra satellite on 12 December 2010 at 10:30 LT; (b) sea level pressure (SLP); and (c) 10 m winds associated with the Cyprus low event. The black circle designates the location of Lake Kinneret. SLP and 10 m winds are based on ERA-5 reanalysis.
Remotesensing 14 04709 g003
Figure 4. Year-to-year variations in (a) precipitation over the Kinneret watershed from December to May, based on (blue) GPM, (green) TRMM, and (red) MERRA2 datasets, and (b) water level difference between May and December, during the study period (2000–2020).
Remotesensing 14 04709 g004
Figure 5. Scatterplots between water level differences and precipitation during the rainy season (December–May) over the Kinneret watershed area based on (a) MERRA2, (b) GPM, and (c) TRMM data. The red straight lines represent a linear fit. The obtained coefficients of determination (R2) and p-values are also shown.
Remotesensing 14 04709 g005
Figure 6. Water level differences between May and December in the specified (a) HP years and (b) LP years.
Remotesensing 14 04709 g006
Figure 7. Month-to-month variations in (a) Tair, (b) SR, and (c) WS averaged over the (blue lines) HP years and over the (red lines) LP years. The vertical lines designate standard deviation.
Remotesensing 14 04709 g007
Figure 8. Month-to-month variations in Kinneret SWT based on (a) MODIS-Terra data at 10:30 LT and (b) MODIS-Aqua data SWT in 13:30 LT. The blue lines represent SWT averaged over the HP years, while the red lines represent SWT averaged over the LP years. The vertical lines designate standard deviation.
Remotesensing 14 04709 g008
Figure 9. Month-to-month variations in WT at the depth of (a) 1 m, (b) 5 m, and (c) 10 m, based on shipboard WT measurements at site A. The blue lines represent WT averaged over the HP years, while the red lines represent WT averaged over the LP years. The vertical lines designate standard deviation. Month-to-month variations in WT in every separate HP year can be seen in Figure A3.
Remotesensing 14 04709 g009
Figure 10. Month-to-month variations in WT at the depths of (a) 20 m, (b) 30 m, and (c) 35 m, based on shipboard WT measurements at site A. The blue lines represent WT averaged over the HP years, while the red lines represent WT averaged over the LP years. The vertical lines designate standard deviation.
Remotesensing 14 04709 g010
Figure 11. Month-to-month variations in WT at a depth of 1 m based on shipboard WT measurements at the following five monitoring sites in Lake Kinneret: (a) H, (b) G, (c) K, (d) A, and (e) D. The blue lines represent WT averaged over the HP years, while the red lines represent WT averaged over the LP years. The vertical lines designate standard deviation. (f) a bathymetric map of Lake Kinneret with the location of the monitoring sites.
Remotesensing 14 04709 g011
Figure 12. Month-to-month variations in WT at a depth of 5 m based on shipboard WT measurements at the following five monitoring sites in Lake Kinneret: (a) H, (b) G, (c) K, (d) A, and (e) D. (f) a bathymetric map of Lake Kinneret with the location of the monitoring sites. The designations are the same as in Figure 11.
Remotesensing 14 04709 g012
Figure 13. Month-to-month variations in MODIS-Aqua Mediterranean SST averaged over the EMED area in the eastern Mediterranean (Figure 1a). The blue lines represent SST averaged over the HP years, while the red lines represent SST averaged over the LP years. The vertical lines designate standard deviation. Month-to-month variations in SST in every separate HP year can be seen in Figure A4.
Remotesensing 14 04709 g013
Publisher’s Note: MDPI stays neutral with regard to jurisdictional claims in published maps and institutional affiliations.

