1. Introduction
As an area for aircraft taking off and landing, the airport runway is the most fundamental infrastructure to guarantee the safety of aircraft operation [
1]. Due to the environmental factors and repetitive landing, the runway structure inevitably deteriorates over time which results in many various subsurface defects, such as voids, subsidences, and cracks. With the continuous development of subsurface defects, it changes the stress state of the airport runway pavement, which seriously threatens the safety of aircraft operations. To ensure aircraft safety and reduce maintenance cost [
2], airport runway defect inspection at their early stage is necessary.
GPR is one of the important tools in nondestructive testing (NDT) [
3]. It has been widely used in runway inspection tasks to minimize the risk of disrupting aircraft normal operations [
4]. While the GPR moves along a linear trajectory, it produces two-dimensional data referred to as B-scan. A Top-scan image is formed by imaging the data points at the same horizontal depth in multiple B-scans. Due to the interference of hardware modules, the inhomogeneity of underground media and the interaction of echoes, GPR data usually contain a high level of clutter interference. In addition, various subsurface defects produce similar patterns in B-scan images, such as voids, cracks, and subsidences. In the subsequent maintenance work, different defects acquire different restoration measures. Thus, to provide more reliable forecasts, fine-grained detection [
5] of subsurface defects is required. The interpretation of GPR data mostly still relies on experienced human experts. Manual interpreting, however, is subjective, time-consuming, and cost-prohibitive, so it is not appropriate for large amounts of GPR data. Therefore, it is necessary to develop automatic subsurface object detection methods for GPR data analysis. In recent years, several studies have been conducted on the automatic detection of subsurface defects with GPR via traditional machine learning techniques [
6,
7], and deep learning methods [
8,
9]. However, all of the proposed algorithms for detection are mostly based on B-scan images only and primarily designed to detect subsurface regular targets with hyperbolic properties [
10,
11]. There are few studies on complicated fine-grained defects detection which is hard to realize based on B-scan data only.
Our novel airport runway inspection robot is shown in
Figure 1, which performs automatic data collection along a pre-defined route. With the data obtained, we propose a hybrid convolutional neural network (CNN) architecture, named MV-GPRNet, which combines multi-view GPR data to predict the location and classification of the subsurface defects automatically. The MV-GPRNet consists of three main modules: The B-scan-based 3D CNN module, the Top-scan-based 2D CNN module, and the multi-view fusion module. By applying the 3D CNN module to C-scan data composed of multiple adjacent B-scan data, the characteristic relationship between radar channels can be obtained. To better supplement the texture features of subsurface defects, we extract the ROI-focused (Region of Interest) features from Top-scan data. The different representations of GPR data cannot be easily merged by adding or concatenating their feature maps. In the multi-view fusion module, a fusion strategy is designed to enable the interaction of 3D features and 2D region-wise features. We have evaluated our approach on a GPR data set that is collected from three international airports. Comparative results show that our proposed MV-GPRNet significantly outperforms four recent object detection methods. For voids, cracks, subsidences, and pipes, our method achieves F1-measures of 91%, 69%, 90%, and 100%, respectively. Furthermore, we have applied the proposed algorithm to raw GPR data collected from the entire airport runway. The experimental results demonstrated that our algorithm can satisfy the requirements of field applications.
The main contributions of this research are as follows.
(1) The MV-GPRNet is proposed to detect the subsurface defect which is hard to distinguish in GPR B-scan data. To the best of our knowledge, this is the first hybrid deep learning algorithm that employs multiple view GPR data via combing 3D CNNs and 2D CNN for airport runway inspection.
(2) The designed MV-GPRNet was successfully applied to detect various fine-grained defects pre-buried in the artificial airport runway. The experimental results validated that the proposed method could provide reliable results on real data.
(3) The MV-GPRNet has been deployed on the robot platform and applied in practice. The proposed method was tested on GPR data set collected from three airports in comparison to four existing methods. These comparative results demonstrate the superior performance of our proposed method.
2. Related Work
Our work relates to subsurface transportation infrastructure inspection and GPR data analysis. A Falling Weight Deflectometer (FWD) is considered to be a commonly-used solution to monitor the health situation of the airport runway. However, it can only measure pre-defined sampling positions and cannot quantitatively detect minor defects. Other NDT technologies, such as impact-echo (IE) [
12], electrical resistivity (ER) [
13], and GPR, are often used in the applications of subsurface transportation infrastructure inspection. Among these technologies, GPR is currently the best choice for airport runway inspection since it can achieve fast and full coverage detection with high resolution and good coverage in range and depth.
Researchers have invested much effort in GPR-based subsurface inspection. A GPR can not provide 3D shape information, but a convoluted reflection image with cluttered signals, making it difficult to recognize subsurface defects automatically [
14]. It is possible to detect subsurface objects using spatially informative GPR data, but interpreting GPR data automatically remains a challenge.
Standard signal processing methods have been used in GPR data interpretation for subsurface object detection [
15]. The template-matching algorithm has been used in [
16] to locate and detect pipe signatures. Zhang et al. [
17] use the short-time Fourier transform to process the GPR signals of cavern filling with different properties. Lu et al. [
18] propose a multi-frequency and multi-attribute GPR data fusion algorithm based on wavelet transform. Szymczyk [
19] develops 3D S-transform to detect sinkholes in geological structures. However, these approaches are susceptible to clutter interference, resulting in unreliable results, especially for field GPR data.
Deep learning methods have been widely applied in GPR data analysis in recent years. To address the difficulties of mapping the GPR B-scan data to intricate permittivity maps of subsurface structures, Liu et al. [
8] propose a DNN architecture called GPRInvNet. Xu et al. [
20] propose an adaptive 1D convolution neural network algorithm for concrete pavement detection. Hou et al. [
21] develop an end-to-end framework to simultaneously detect and segment object signatures in GPR scans. Kang et al. [
22] propose an underground cavity detection network (UcNet) based on CNN incorporated with phase analysis of super-resolution (SR) GPR images. Feng [
23] proposes MigrationNet, a learning-based method for locating and visualizing subsurface objects. Ling et al. [
24] propose a 3D object detection framework for urban transportation scenes based on the fusion of Lidar remote sensing technology and optical image sensing technology. To extract the hyperbolic features from GPR B-scan images, Faster R-CNN [
25,
26], a classic 2D object detection algorithm, is employed. It is important to note that most existing methods employ only 2D B-scan images without considering the correlated information from multiple B-scans for 3D defect detection. Despite the fast decay of the GPR’s electromagnetic waves, the majority of the usable signals produced by a defect will be recorded in multiple adjacent GPR traces [
8]. Making full use of the data collected from adjacent GPR channels as opposed to each channel individually would therefore be more practical.
Research on 3D object detection has obtained great progress in the field of autonomous driving, aiming to obtain geometric data in 3D space, such as target location, size, and posture. Wu [
27] proposes using a powerful deep model called MotionNet to conduct motion prediction and perception from 3D point clouds. A 3D object detector called KDA3D [
28] achieves robust detection by utilizing key-point densification and multi-attention guidance. To turn a 3D point cloud into a 2D image, PIXOR [
29] employs different point cloud projection techniques. MV3D [
30] and AVOD [
31] methods combine laser point cloud and visual information to achieve multi-modal three-dimensional target detection. Li [
32] proposes a novel one-stage and keypoints-based framework for monocular 3D object detection using only RGB images. However, it is not an optimal choice to directly utilize the existing 3D CNN methods designed for autonomous driving. First, the characteristics of 3D GPR data are quite different from the 3D point clouds which are generally used as input in these methods. Second, most subsurface defects are irregular, so it is difficult to use the position dimension regression method to reestablish the geometric dimensions of the object in 3D space. Thus, the 3D object detection method specially designed for GPR data interpretation is needed.
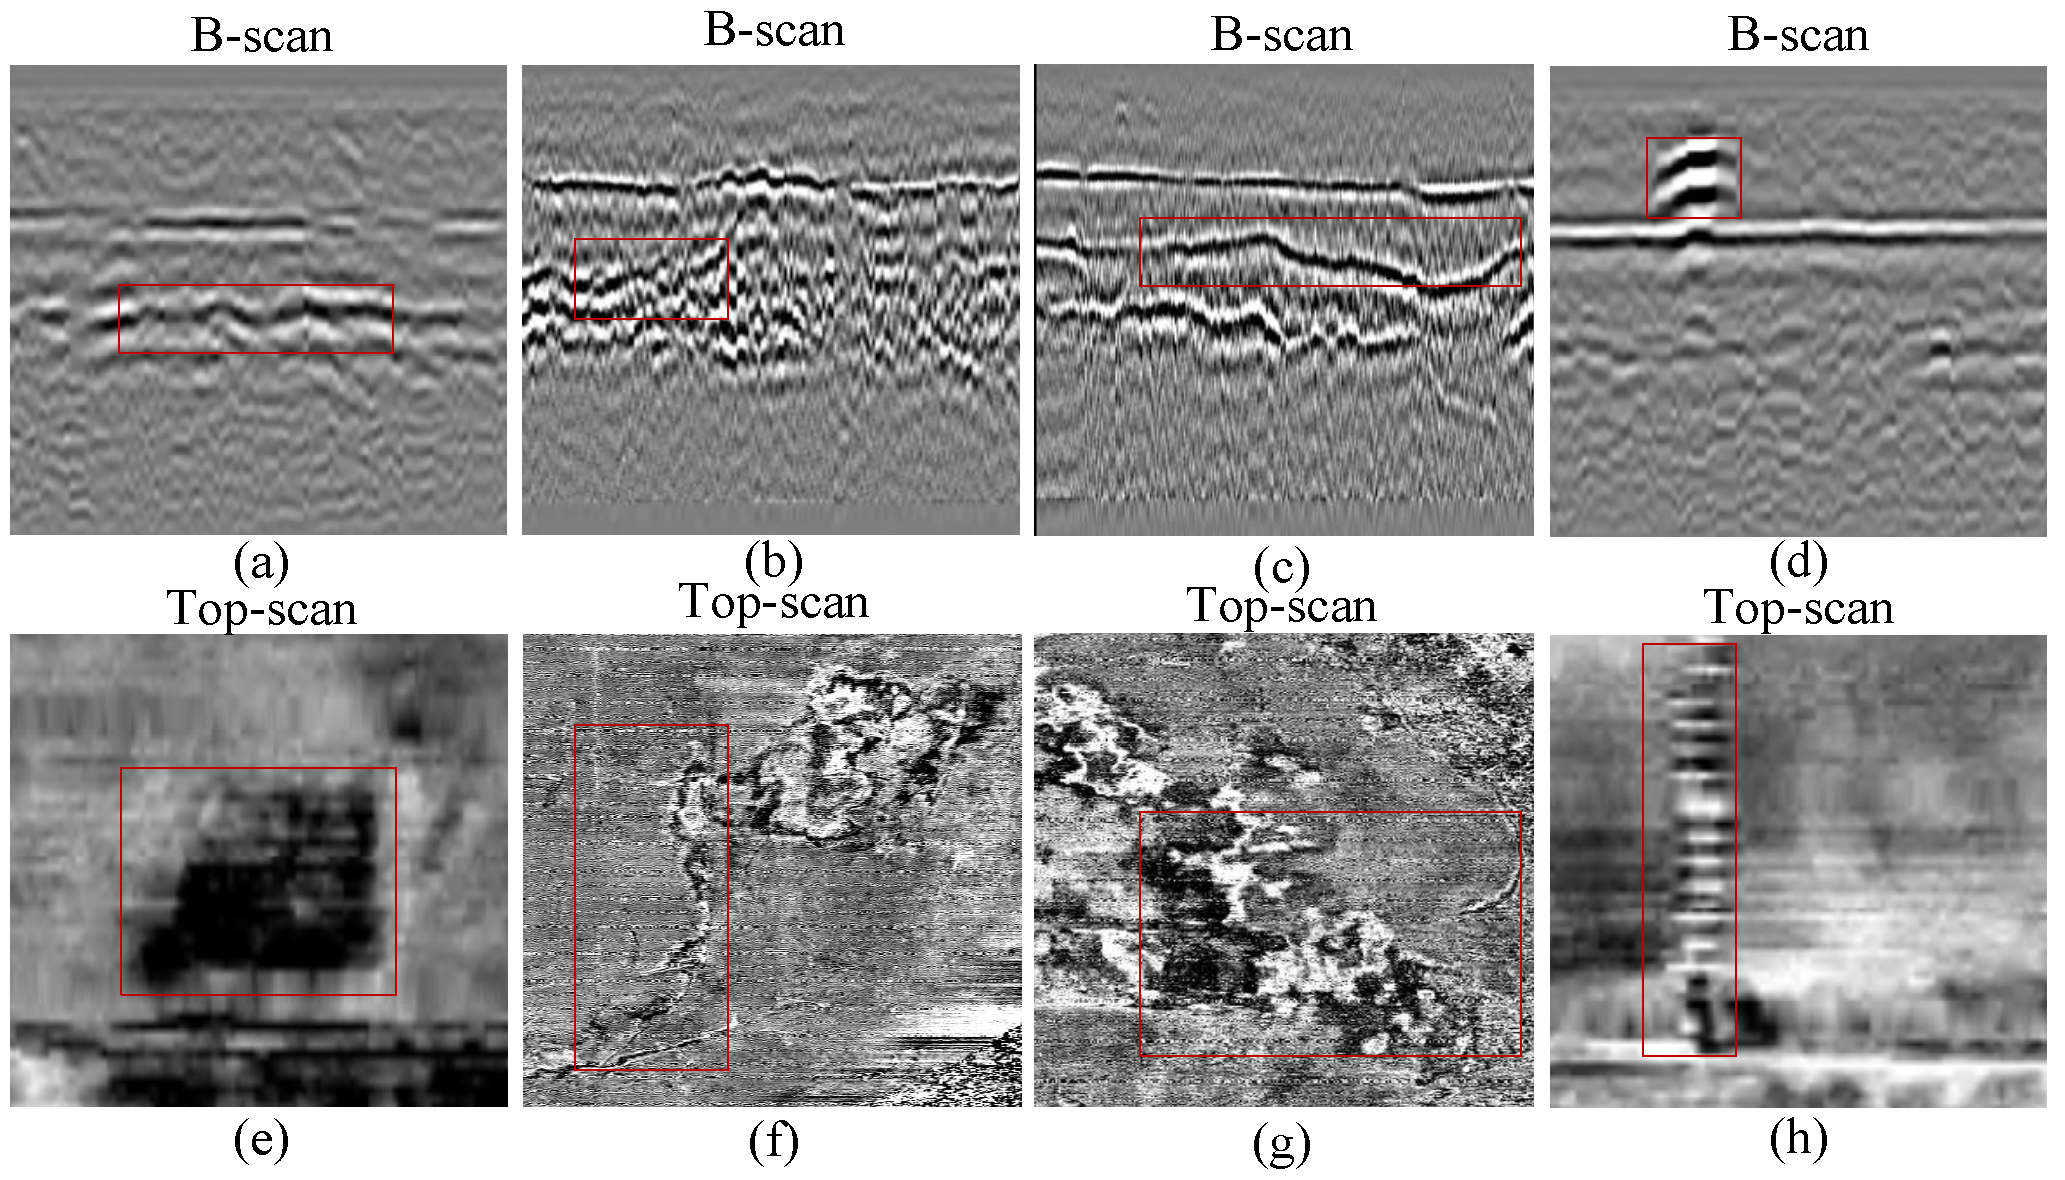
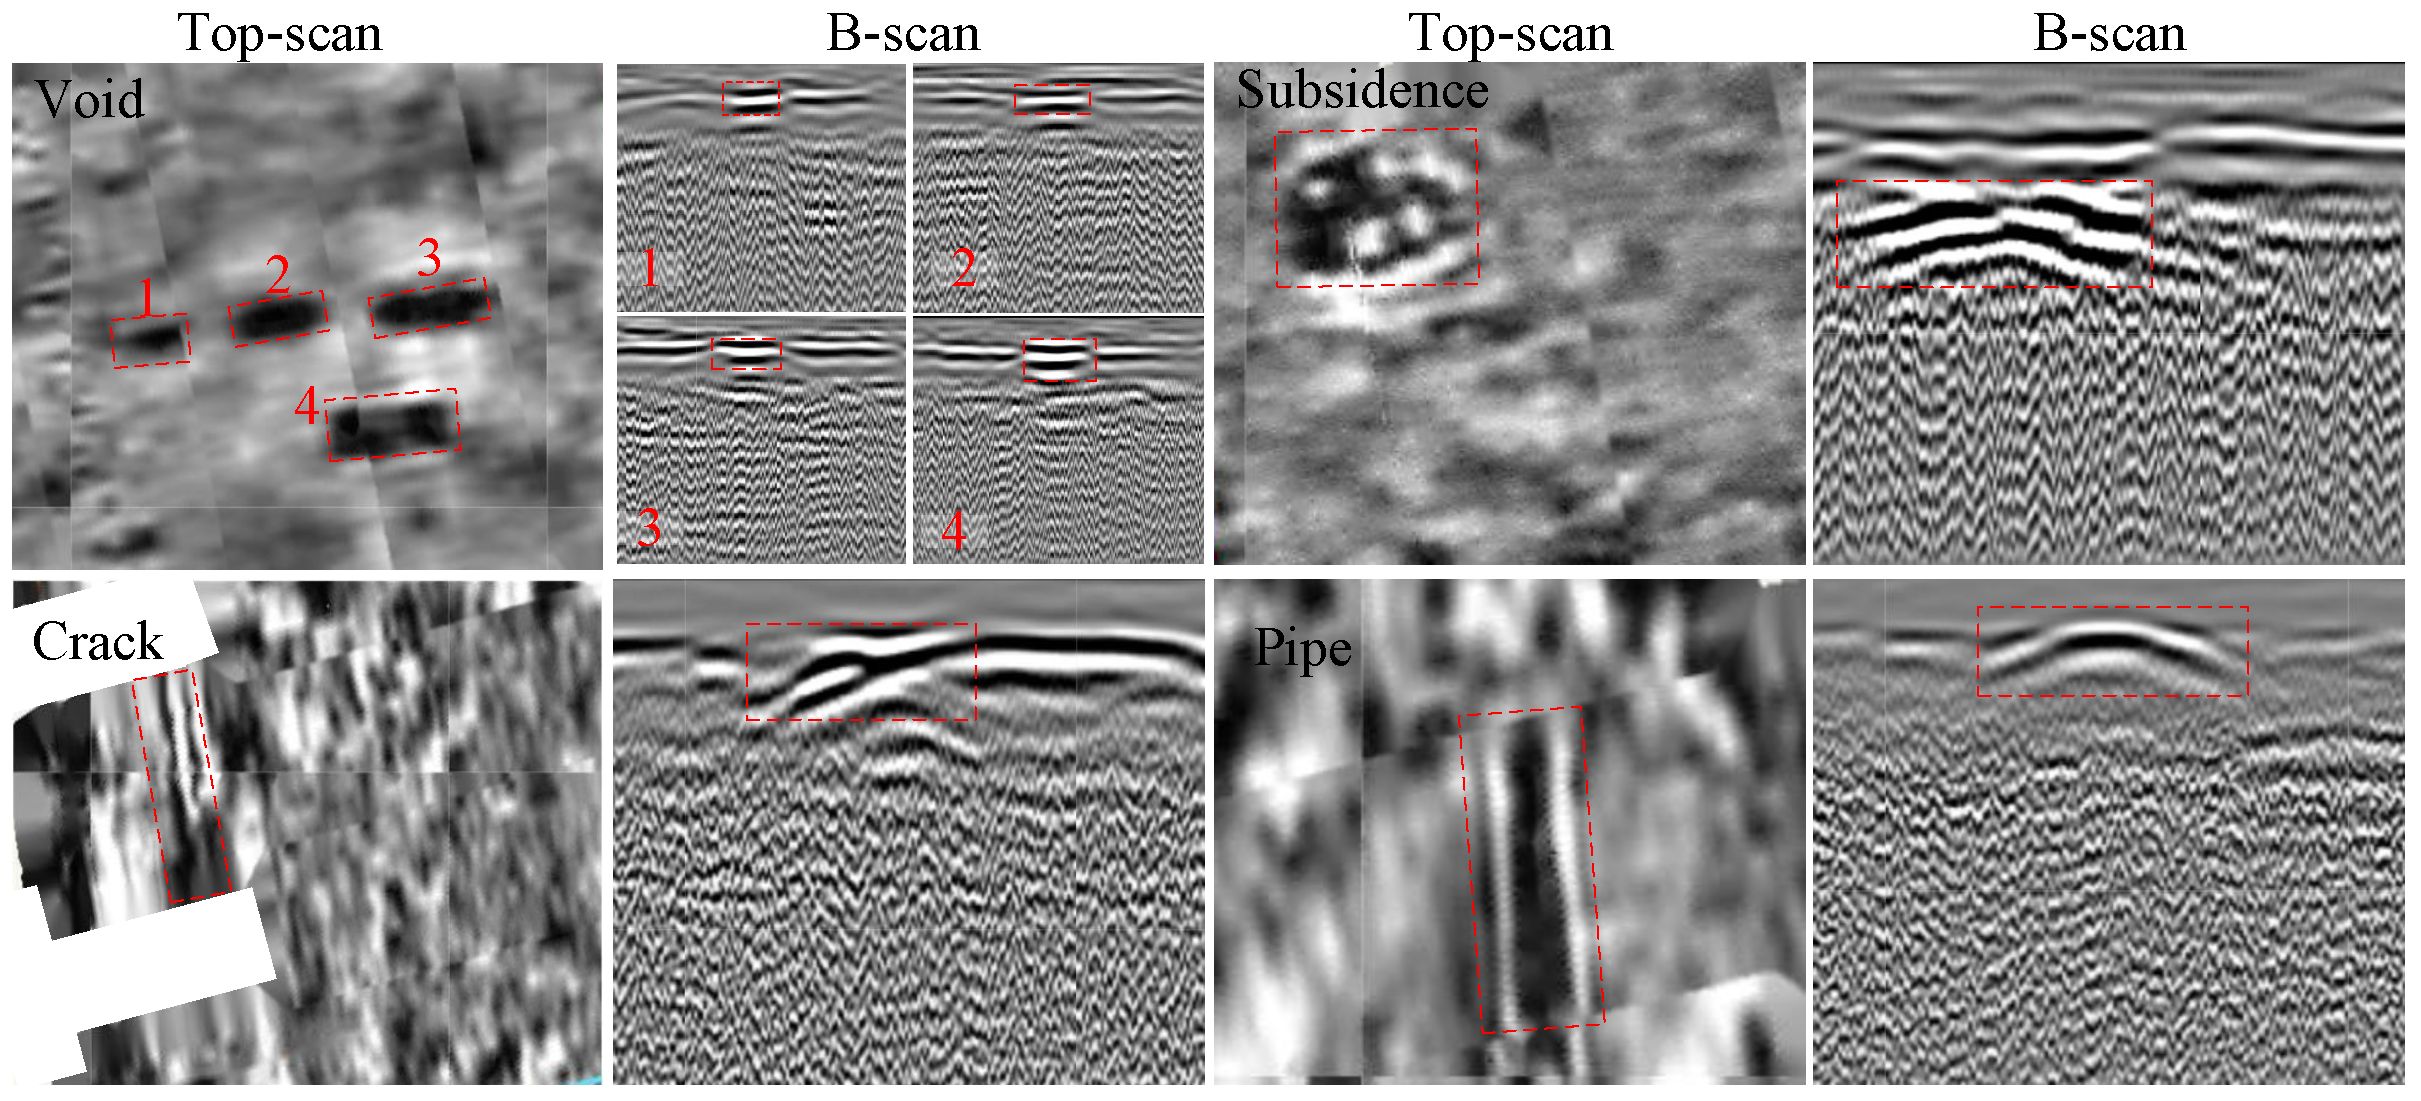
The use of Top-scan images is also beneficial for subsurface object detection, as it overcomes the limitations associated with the sole use of B-scan images. For example, as shown in
Figure 2, subsidence, crack and void exhibit similar reflection patterns in B-scan images. Thus, it is challenging to identify them using simply B-scan images. However, they can be distinguished by comparing their Top-scan images. Recently, some studies have been conducted using different views of GPR data simultaneously to detect various types of subsurface objects [
33]. Kim et al. [
34] propose a deep-learning-based underground object classification technique that uses triplanar GPR images. Kang et al. [
35] present CNN-based autonomous underground cavity detection using 3D GPR data. However, the performances of these methods was focused mainly on detecting objects that show hyperbolic patterns in B-scan images, such as pipes, cavities, and rebars. Although these proposed techniques have been validated with field GPR data, they are all implemented based on the 2D network AlexNet and can only achieve object classification but not localization. Hence, there is still no published research using GPR B-scan and Top-scan images simultaneously for subsurface object classification and localization via combing 3D CNNs and 2D CNNs.
For several years, our group has been using a robotic platform to inspect both surface and subsurface infrastructure. [
36,
37,
38]. For GPR-based subsurface inspection, we have made progress in subsurface pipeline mapping [
37] and B-scan-based subsurface defect detection [
38]. Specifically, the proposed GPR-RCNN algorithm [
38] aims to detect subsurface defects from GPR data containing a lot of clutter, but it is not effective for fine-grained defects identification. By contrast, the MV-GPRNet enables to detect the defects with indistinguishable features via combining different views, providing more reliable forecasts for subsequent runway maintenance.
3. Problem Formulation
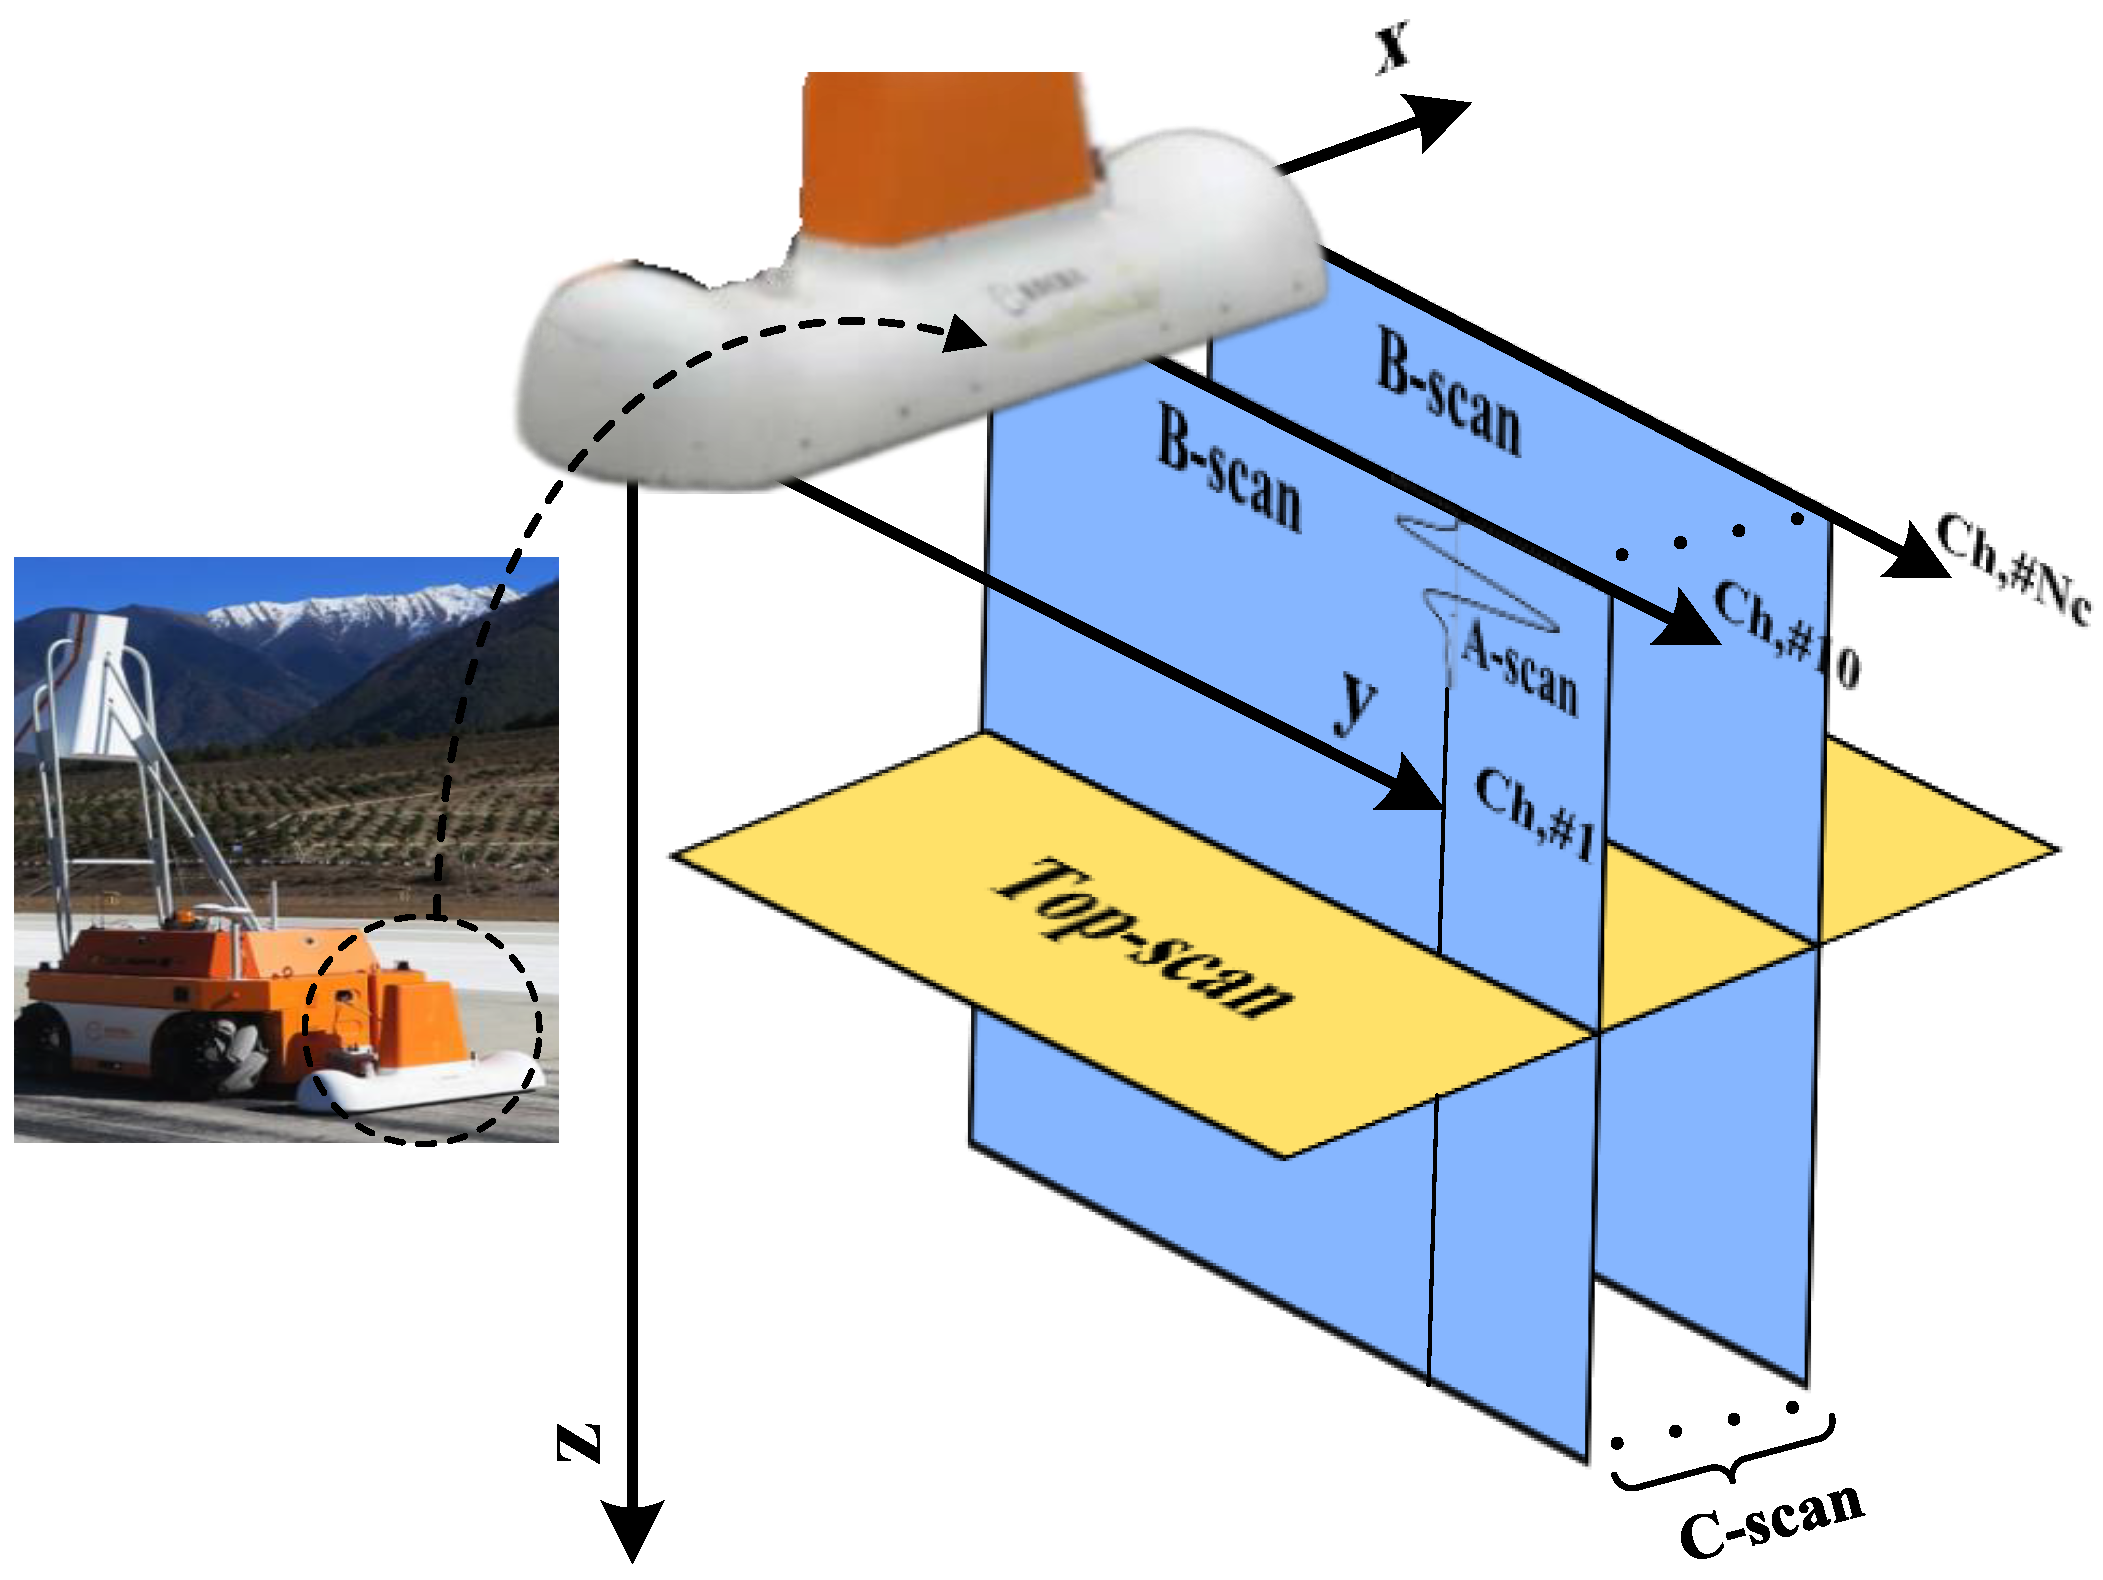
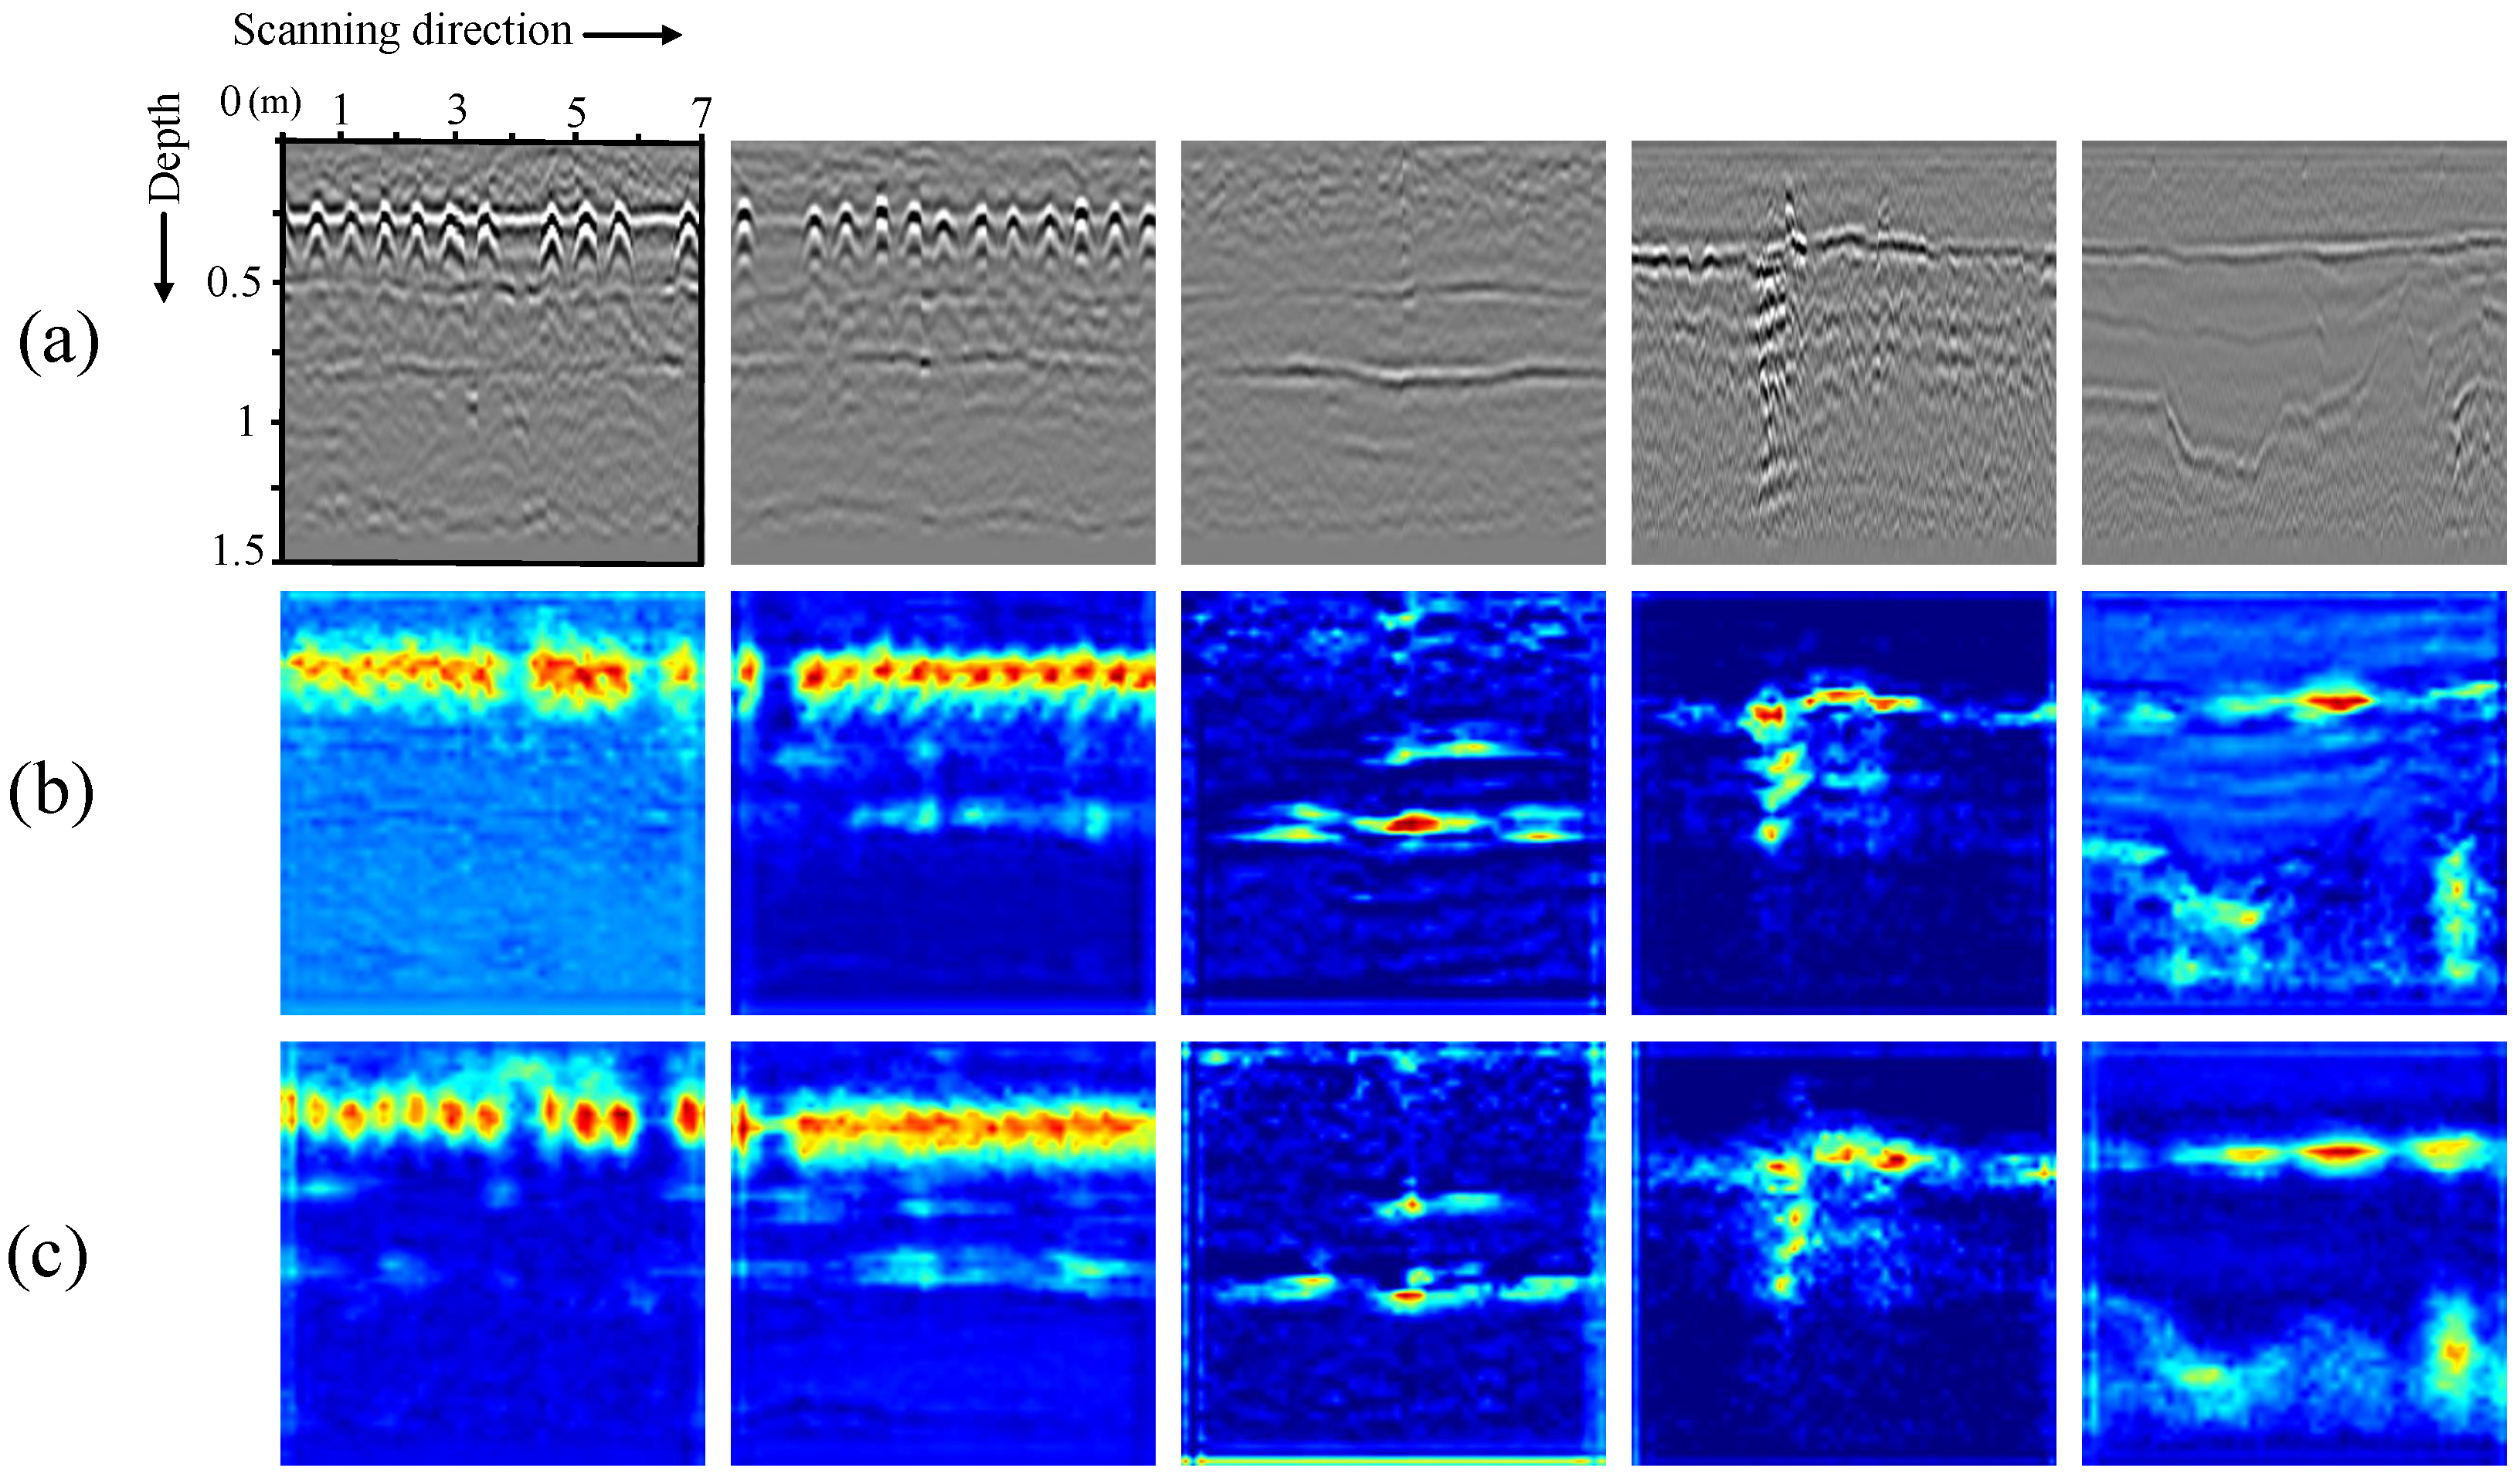
We perform the subsurface data collection with an airport runway inspection robot equipped with a multi-channel GPR, as shown in
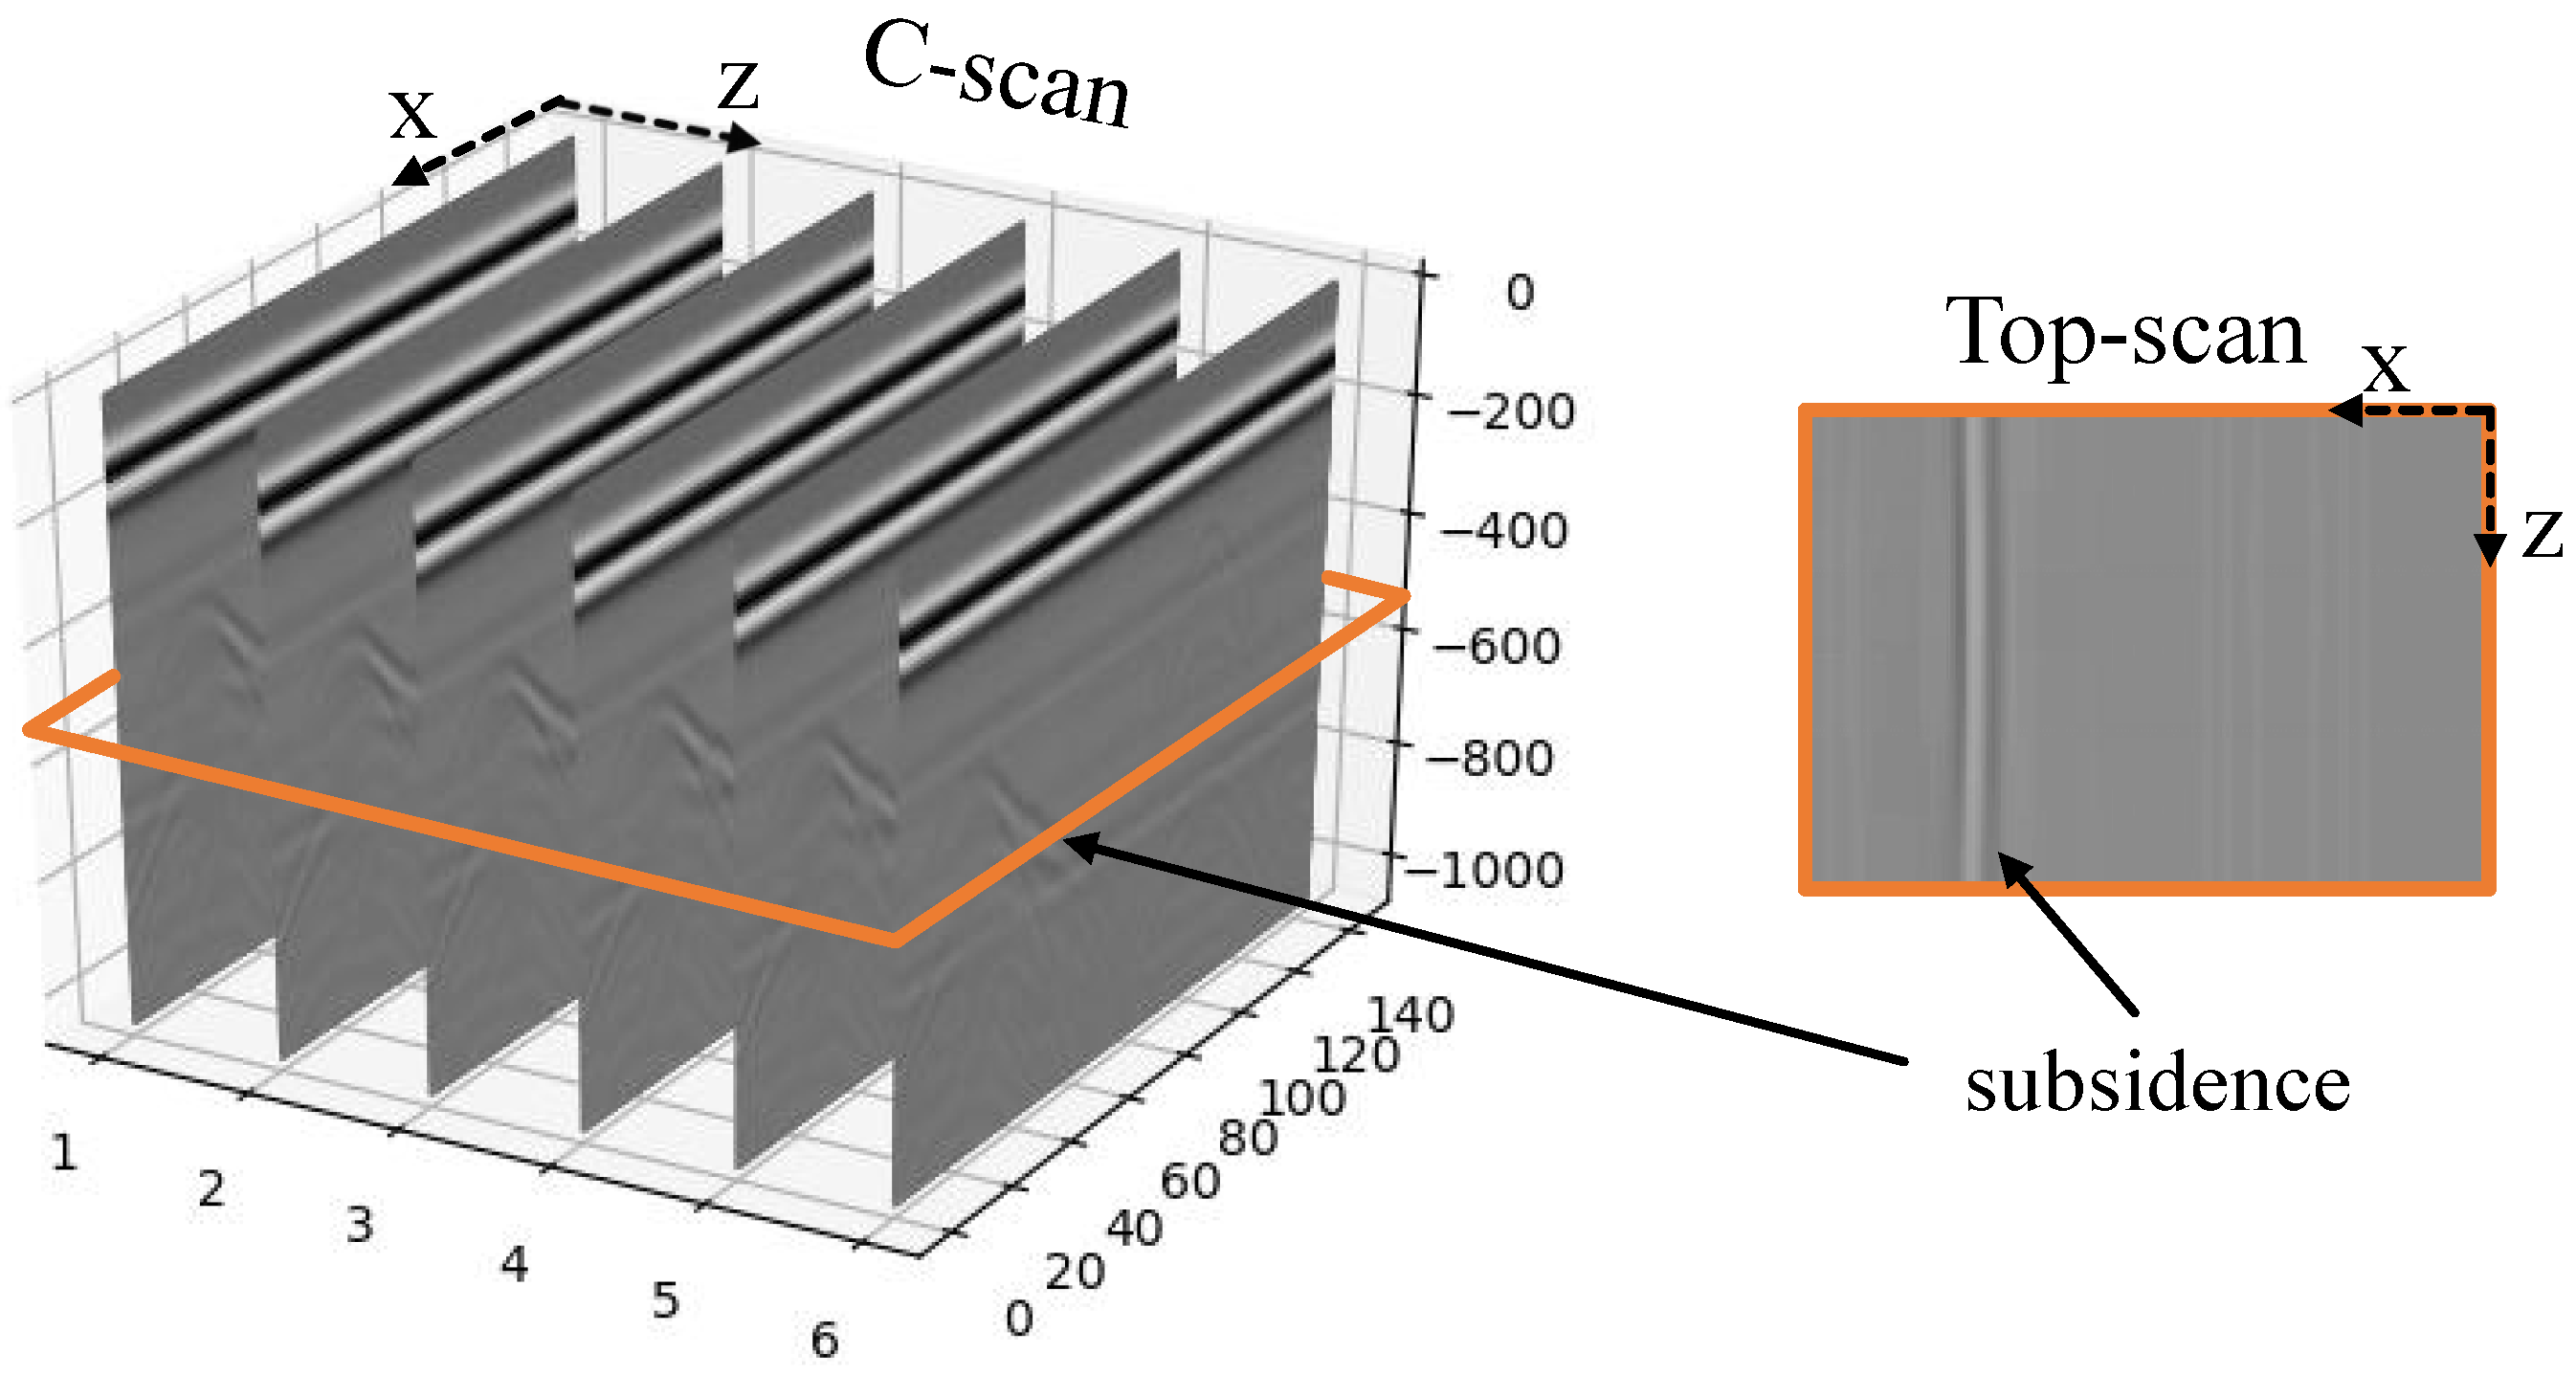
Figure 3, the GPR antenna array is fixed perpendicular to the robot’s travel direction, and the antennae are equally spaced along the array. The transmitter radiates the electromagnetic wave into the ground while performing inspection tasks. In turn, the receiver gathers the signal reflected off underground objects or ground layer interfaces and generates a one-dimensional waveform called GPR A-scan [
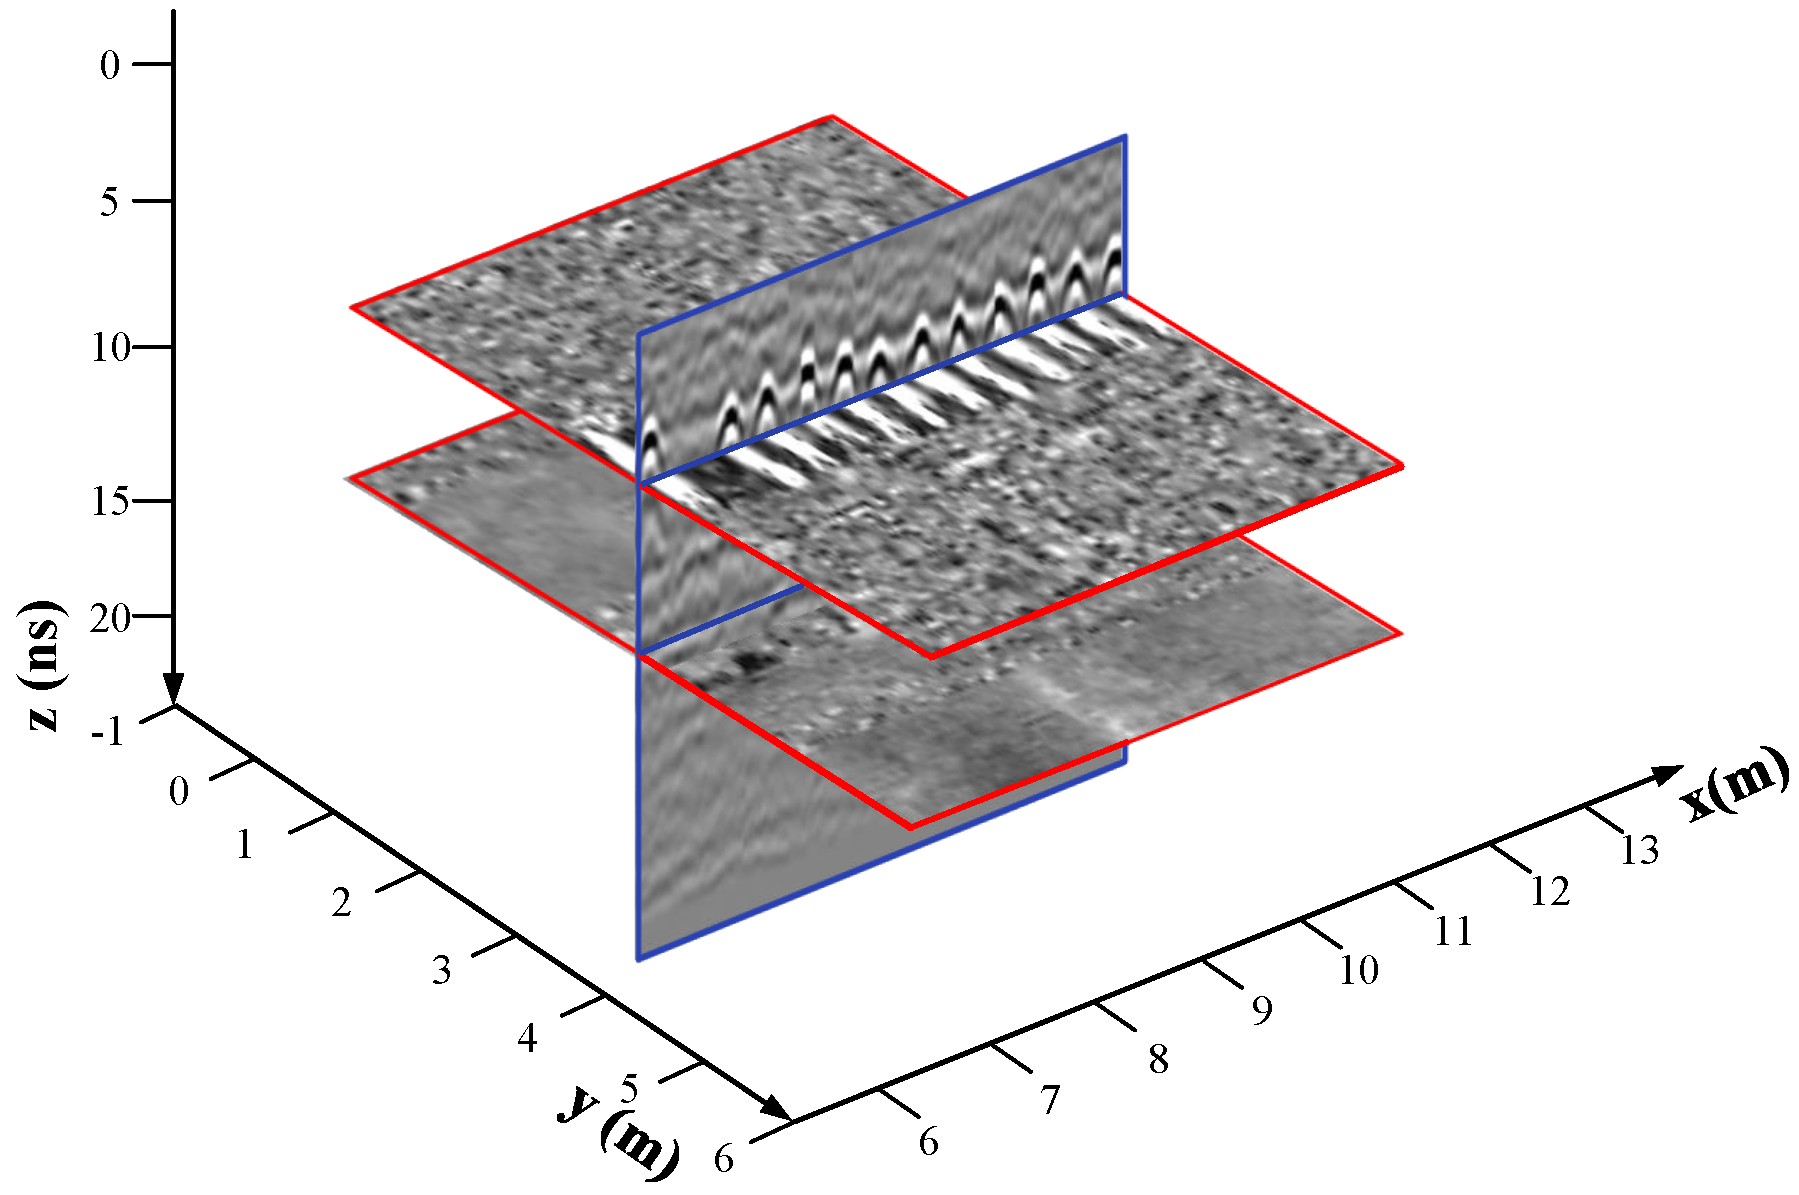
39]. With the robot moving, each GPR antenna generates a set of A-scans at regular spatial intervals. This forms a two-dimensional data known as the B-scan which represents a vertical slice of the ground. When the GPR is moved over a regular grid on the ground to gather several parallel B-scans, a three-dimensional data set known as a C-scan can be recorded. The recording across all antennae at a certain depth forms another 2D data representation, named Top-scan, which represents a horizontal slice of a plane at a specific depth. Coloring amplitude of the received signal in the grayscale, a set of 2D B-scan images and Top-scan images can be produced and visualized. Here, only one vertical B-scan image and two horizontal Top-scan images are selectively shown among them as shown in
Figure 4.
A collection of B-scan images combined with Top-scan images from multiple depths serve as inputs. To describe them, we define the following notations.
, the right handed 3D world coordinate system, with
y-axis pointing to the robot’s forward direction in motion, and
z-axis pointing to the downward (see
Figure 3).
, a GPR C-scan consisting of all B-scan images, with denoting the i-th B-scan image.
, the set of all Top-scan images, with representing the j-th Top-scan image.
, the set of bounding box of the subsurface defect detected from C, with . denoting the left top corner coordinate, l, w and h being the length, width and height, respectively.
Our subsurface defect detection problem is defined as follows.
Definition 1. Given GPR C-scan C and Top-scan set T, obtain Ω.
4. Methodology
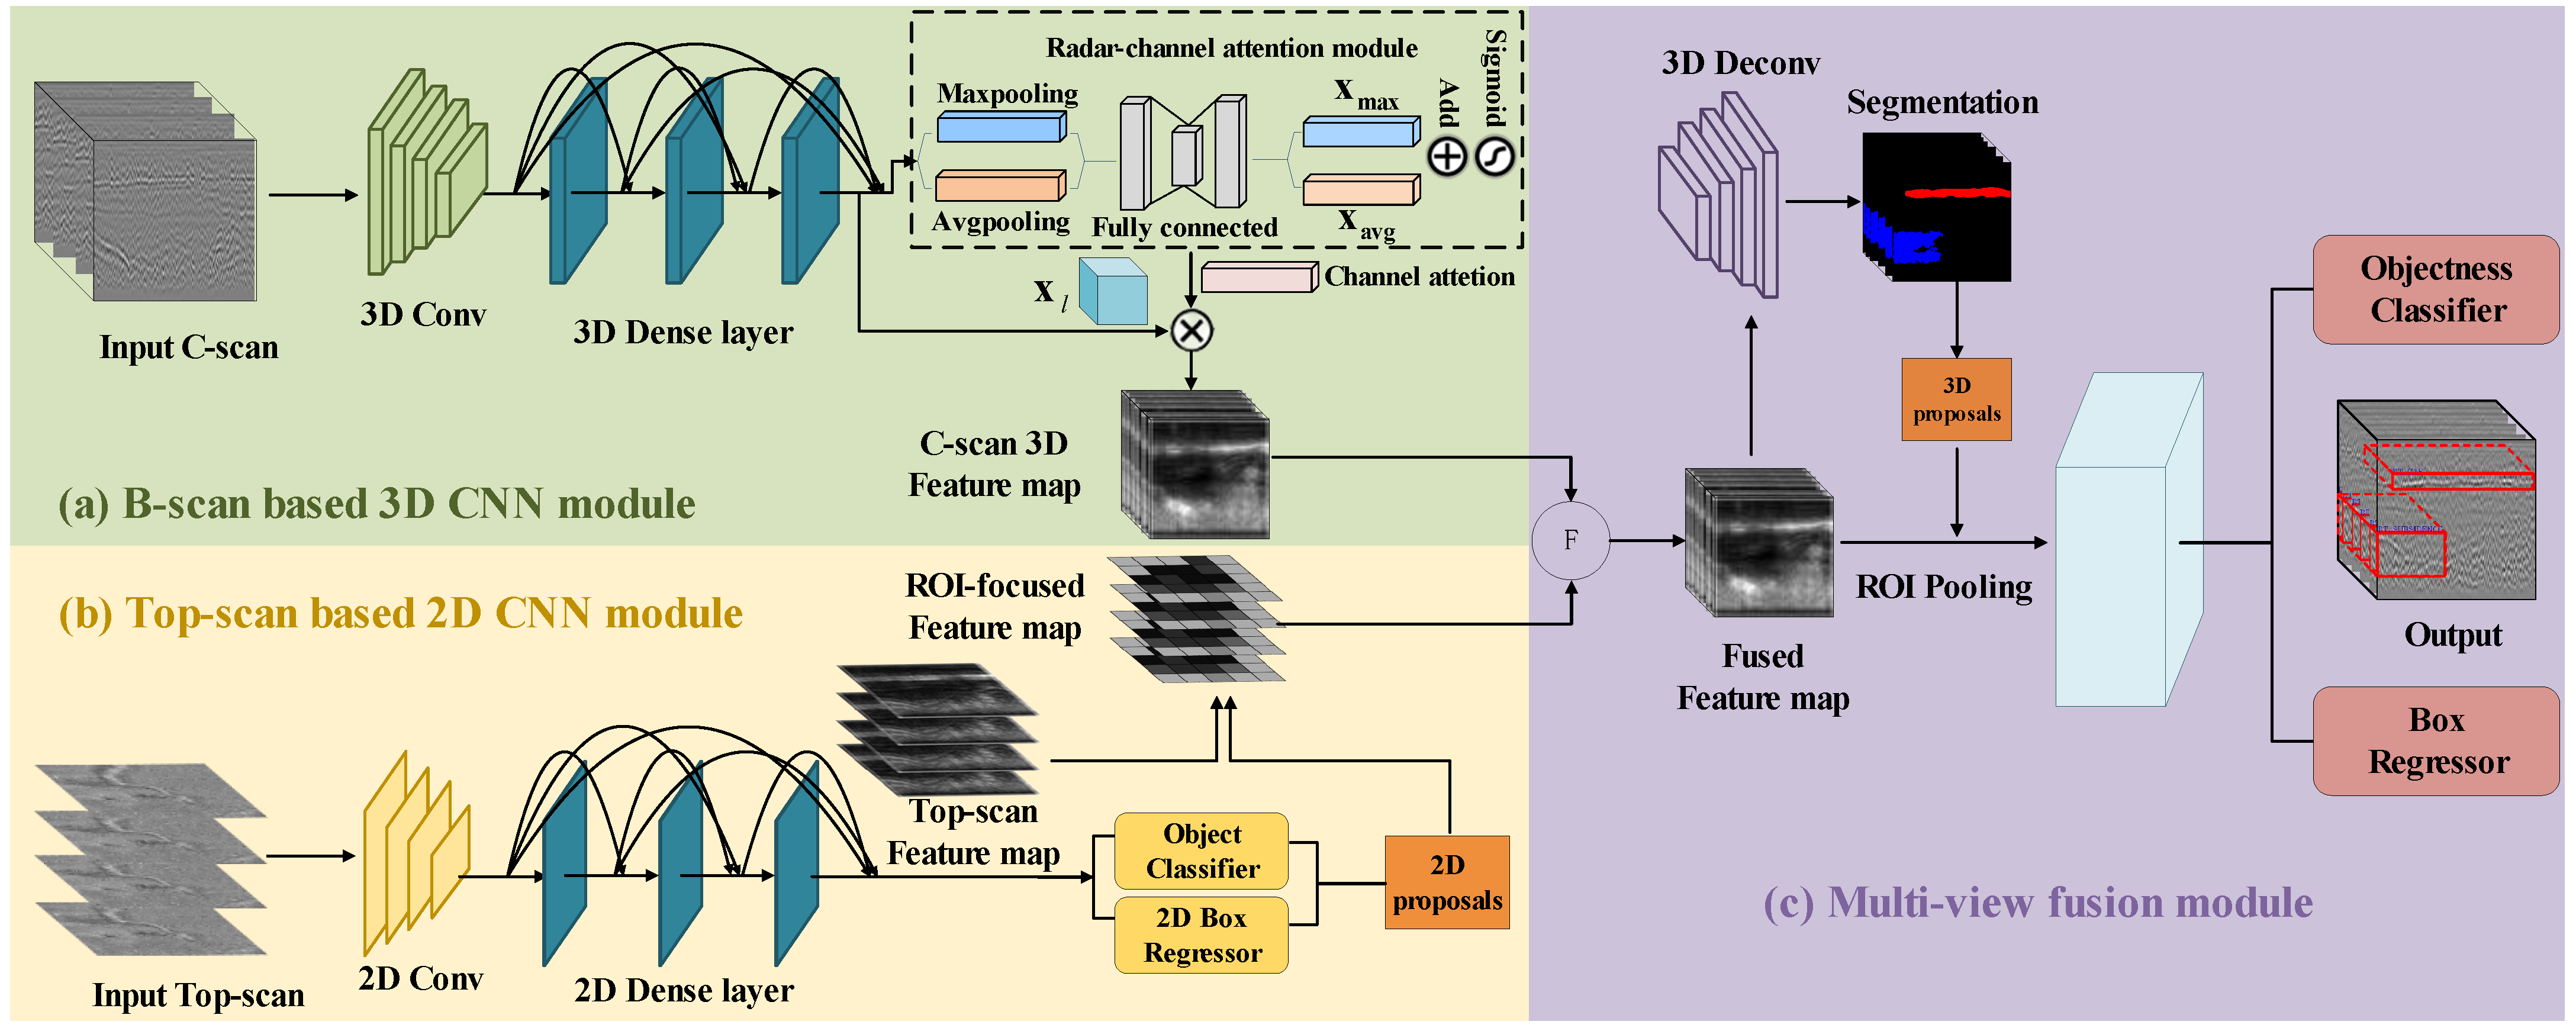
To process GPR data, we propose a deep CNN-based algorithm referred to as the MV-GPRNet. The overall framework is presented in
Figure 5. This network consists of three modules: (a) B-scan based 3D CNN module: a 3D CNN is designed to extract the 3D feature map from C-scan data. (b) Top-scan based 2D CNN module: It generates ROI-focused (Region of Interest) features via projecting 2D proposals to the 2D feature map extracted from Top-scan data. (c) Multi-view fusion network: a fusion network is used to combine multi-view features via region alignment, and to jointly predict object classification and 3D bounding box regression.
4.1. B-Scan Based 3D CNN Module
We design a 3D network to generate a 3D feature map. Considering 3D defects usually occur across multiple scans, C-scan data which are composed of adjacent multiple B-scans are input to this module. Given a C-scan C, we first subdivide C into equally spaced voxels v with spatial resolution of , where , , and indicate the length, height and width of one voxel, respectively. Generally, we set to be the total number of GPR array channels, since it is preferred to avoid the data alignment error across multiple scans by keeping the data inside one voxel only from one scanning. This module utilizes a series of 3D convolutions to gradually transform the divided C-scan voxel into feature volumes of 1, 2, 4, and 8 downsampled sizes using a sequence of 3D convolutions. A set of voxel-wise feature vectors could be represented by such feature volumes.
To strengthen the use of the voxel-wise feature, we introduce a three-layer dense network in the 3D feature extraction process, each of which implements a non-linear transformation
. DenseNet [
40] increases the number of channels while maintaining the value of the feature maps [
41]. The input for the
dense layer is the voxel-wise feature maps of all
previous dense layers:
where
refers to the concatenation of the voxel-wise feature maps generated in layers
.
Then, we design a radar-channel attention module to enhance the feature analysis of effective domains from certain radar channels. Inspired by the channel attention module in CBAM [
42], both average-pooled and m max-pooled features are used simultaneously. The radar-channel attention module takes the last dense layer feature map
as input. Feature tensor
is acquired by the average pooling operation, and
is obtained with the max pooling operation. Based on an element-wise addition strategy, the radar-channel attention map
, whose size is set to
, is generated after a dynamic activation function, which constrains the weights in the range of
. Both descriptors are then forwarded to a shared network. The shared network consists of a fully connected layer
and one hidden layer. For reducing parameter overhead, the hidden activation size is set to
, where r represents the reduction ratio. This module generates radar-channel attention feature cube by pixel-wise product between
and
, where function is defined as
. The process can be formulated as follows:
where
is a sigmoid activate function, ⊗ denotes element-wise multiplication.
Given C-scan as input, two sub-modules, dense layer and radar-channel attention, focus on ‘where’ and ‘what’, respectively. Due to this, it is possible to arrange two sub-modules in either a parallel or sequential manner. It is found that both the submodules play a significant role in the extraction of 3D feature maps, with a sequential arrangement achieving better results than a parallel arrangement. We will discuss experimental results in discussion section.
With the 3D feature map from C-scan obtained, we designed a 2D network to capture the feature in Top-scan which serves as the supplement for the 3D feature.
4.2. Top-Scan Based 2D CNN Module
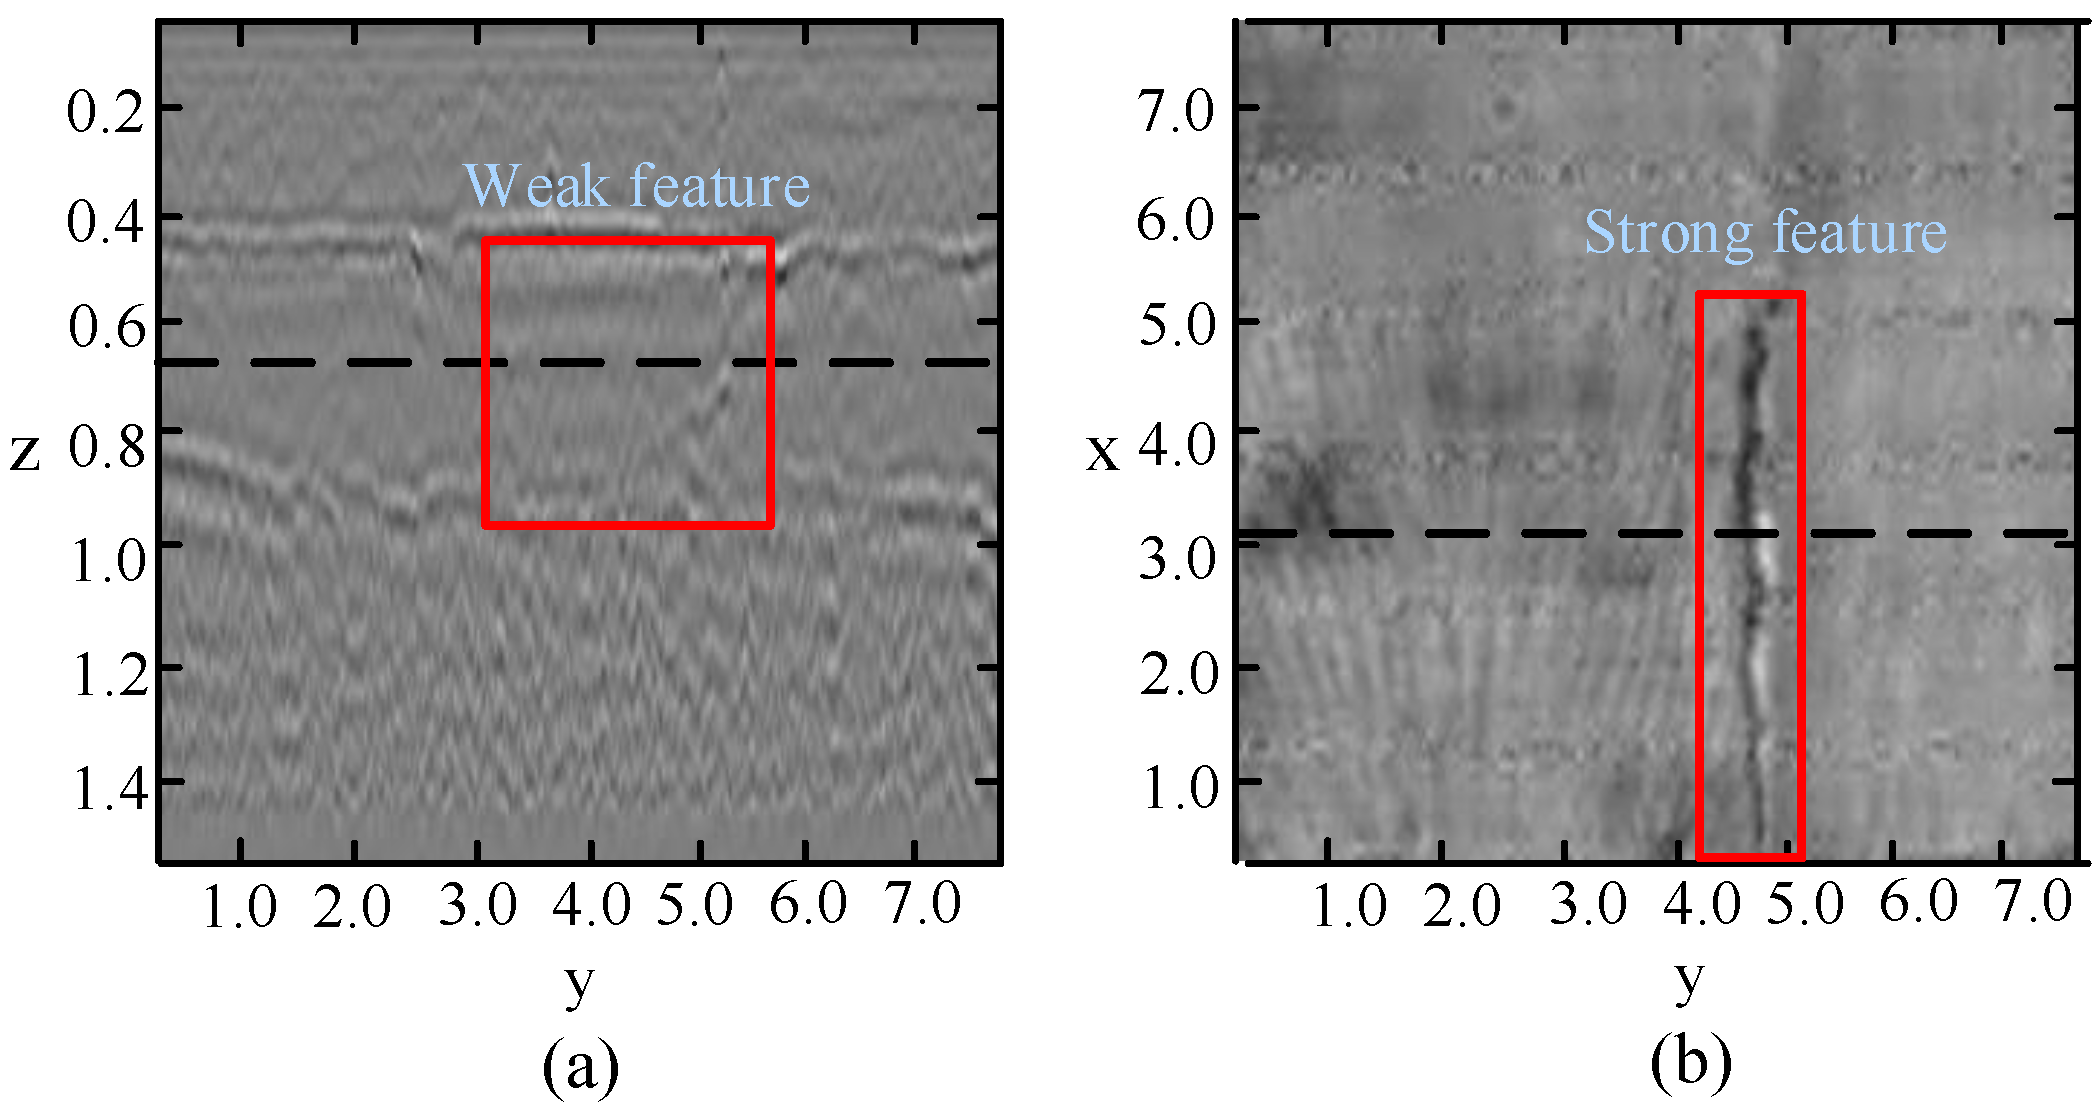
The 3D CNNs utilized in the previous module focused on extracting correlation features between adjacent B-scans. To supplement some more effective information for distinguishing subsurface defects, the 2D CNNs utilized in this module are used to extract the spatial features in Top-scan images. We notice that some defects have strong signatures in the Top-scan but weak features in the B-scan.
Figure 6 shows an example defect with a strong feature in the Top-scan image but a weak feature in the B-scan image. Thus, we process the multi-view data independently and then fuse their feature maps. To utilize the strong signature accurately, we first obtain the proposals via extracting the features from Top-scan. Then, we propose a strategy to obtain the ROI-focused feature, which is more useful for the fusion module than ROI-pooling operation.
We first design a network to generate 2D object proposals, inspired by the Region Proposal Network (RPN) of the SOTA 2D object detector. Since the continuity of the adjacent Top-scan is not as obvious as the adjacent B-scan, we design a 2D CNN to extract the panel-wise feature map from Top-scan. As same as the 3D feature map extraction network, we add the dense layer in the process of the 2D feature extraction process. Given a top view image, the network generates 2D box proposals from a set of 2D prior boxes. Each 2D box is parameterized by
, which
and
denote the center and size of the 2D box, respectively. We adopt smooth
loss for 2D proposal regression, as
where
is a vector representing a labeled 2D bounding box,
indicates the predicted bounding box.
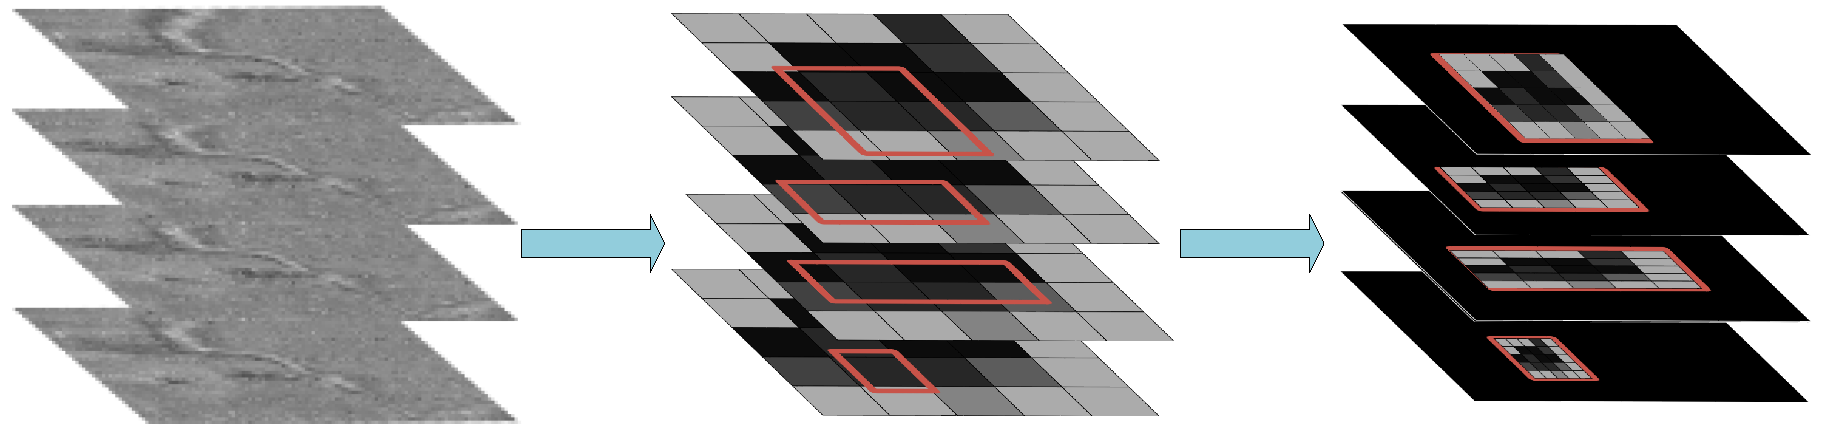
With the 2D proposal boxes obtained, we project these boxes to the corresponding position of the 2D feature, and set the feature value of the non-suggested region position in the feature map to zero. Thus, the ROI-focused feature map is generated in which only the value of the corresponding proposal area is reserved as shown in
Figure 7. Therefore, the ROI-focused feature map is easy to be integrated into C-scan feature map according to the depth of the Top-scan without calculating the spatial position corresponding to the C-scan according to the ROI position.
With the 2D and 3D feature maps obtained, the two kinds of features are sent to the following fusion network as input.
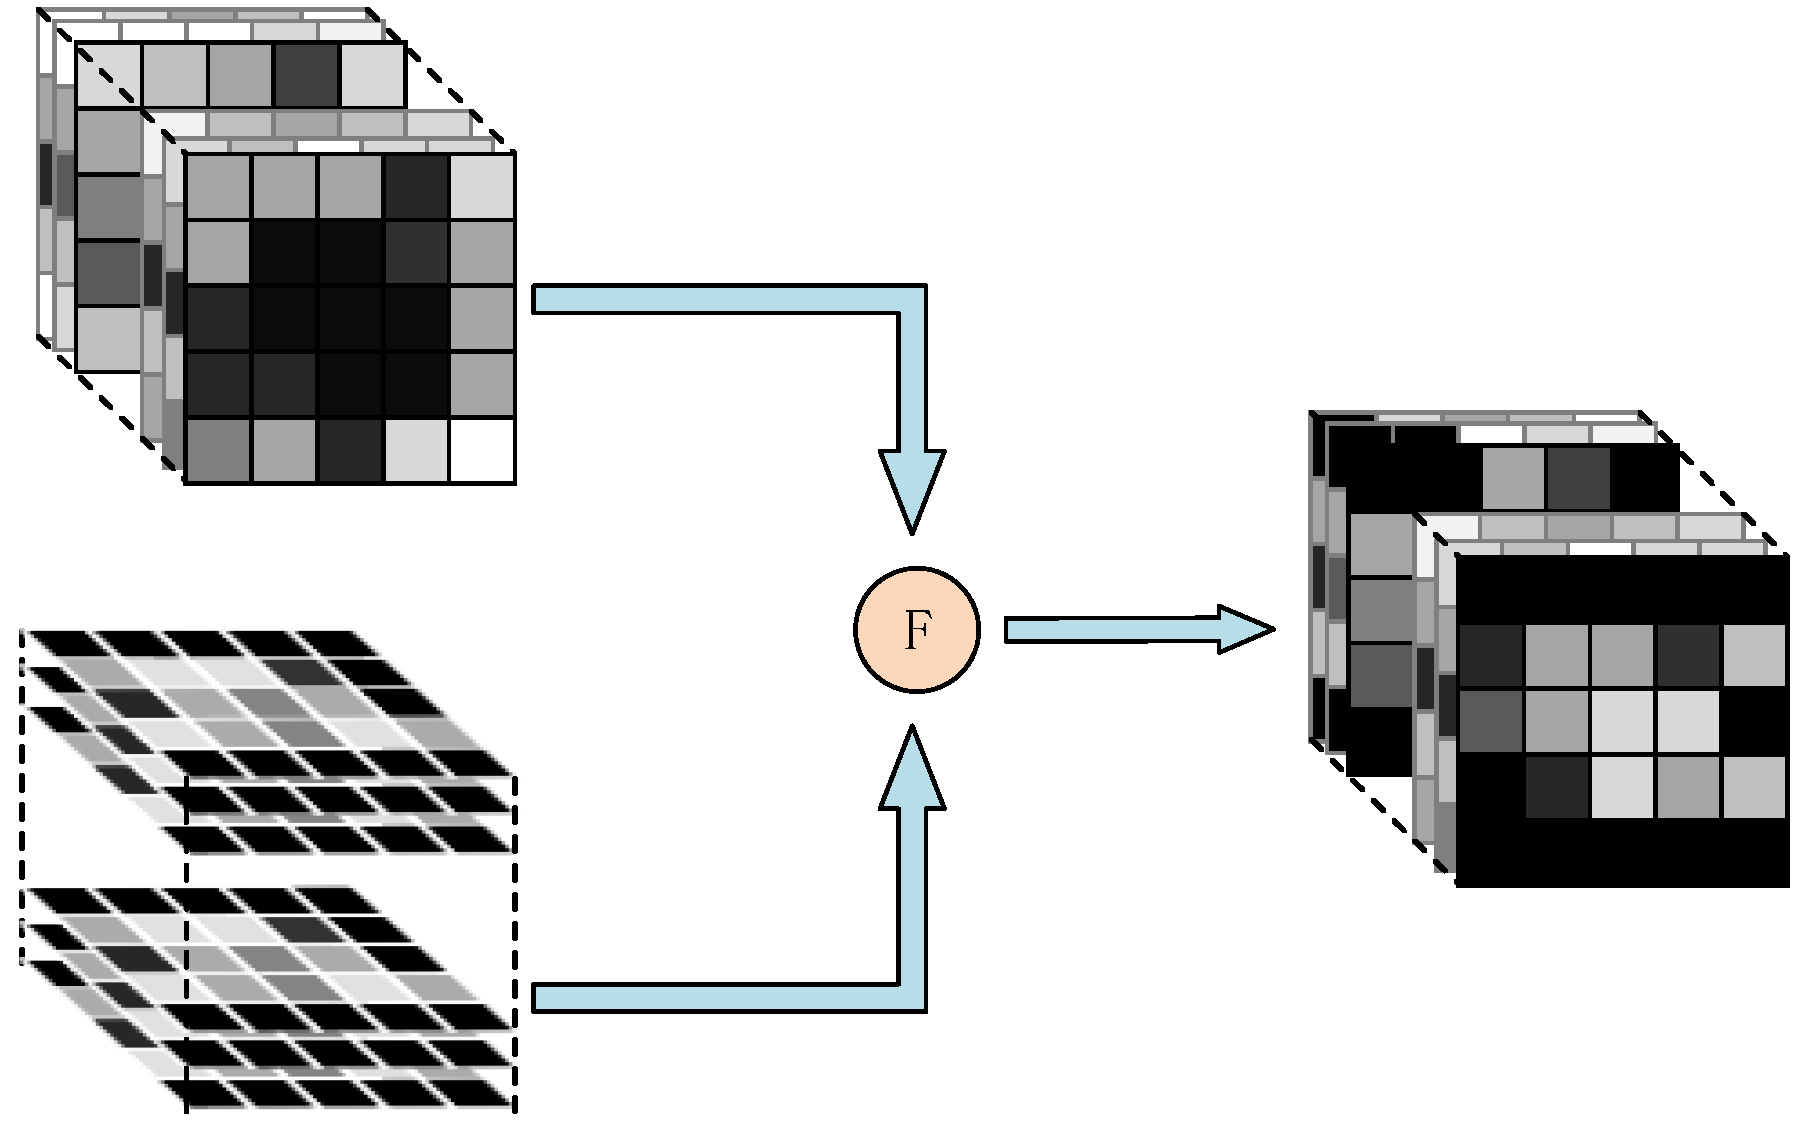
4.3. Multi-View Fusion Module
We designed a region-based fusion strategy to effectively combine features from multiple views. We use element-wise add operation for fusing the ROI-focused feature maps and the 3D feature maps obtained in the previous modules. Specifically, the fusion method is to add these ROI-focused feature maps at different depths according to the actual depth and the corresponding position in the 3D voxel-wise feature as shown in
Figure 8. The fused feature map can focus on the diseased areas which are not distinguished in the C-scan but have strong features in the Top-scan. In addition, we observe that subsurface defect is usually reflected in the top view but there is no fixed shape. Thus, fusing the ROI-focused feature from Top-scan and the voxel-wise feature from C-scan will cover up those interference features caused by clutter extracted in C-scan, which is helpful to distinguish the subsurface defects accurately.
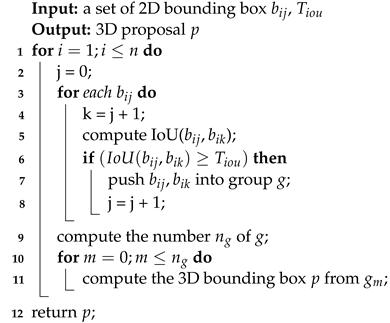
As the subsurface defects are naturally separated without overlapping each other, we employ a bottom-up manner to generate 3D proposals. We summarize the proposed 3D proposal generation method in Algorithm 1. The pixels inside 3D boxes are considered foreground pixels. Thus, we send the fused feature to the deconvolution sub-network to segment the foreground pixels in each voxel, and then the 3D bounding box is generated from these foreground pixels as the initial 3D proposal. To fulfill the dense prediction, the 3D deconvolution network is designed to continue up-sampling the fused feature. Ground-truth segmentation masks are naturally generated by 3D ground-truth boxes. Considering the number of foreground pixels is generally much smaller than that of the background pixels for a large-scale airport runway, we use the focal loss [
43]
to handle the class imbalance problem as follows,
with
where
denotes the weighting factor, and
is the focusing parameter.
Finally, the 3D proposal box is projected to the corresponding position in the fused feature map, and the “ROI pooling” operation is performed to obtain a fixed-size feature map. These fixed-size feature maps are used to regress the 3D bounding box. We combine cross-entropy loss and Huber loss for classification and regression, as
with
where
indicates the total number of classes, for each point belonging to class
i,
and
represents the label value and predicted value,
is a vector representing a labeled 3D bounding box,
indicates the predicted bounding box,
is a parameter, and
,
is a balancing weighting factor.
| Algorithm 1: 3D Proposal Generation |
![Remotesensing 14 04472 i001]() |
5. Experiments
We have conducted three sets of experiments, based on simulation data, artificial and real airport runway data, respectively. Based on a representative dataset that our inspection robot collected from three civil aviation airports, we assess the performance of the proposed MV-GPRNet and compare it with the SOTA approaches quantitatively. To validate the performance of MV-GPRNet more intuitively, the simulation experiments were designed to obtain the synthetic data of subsurface defects that are pre-set. The ground truth of defects in real airport runway GPR data is labeled by human experts, whose judgments are inevitably subjective. Considering this, we established an artificial airport runway with various kinds of prior-designed defects pre-buried. To verify the superiority of the proposed method in defect detection, a further comparative study was performed on the artificial model data where manufactured defects can be observed directly. Moreover, the selection of dielectric constant in this paper is based on calibration in the artificial model and back calculation to determine the approximate depth of the disease. Specifically, according to the thickness of each layer of material, the depth of the pre-buried defect, and the travel time for receiving the electromagnetic wave, the propagation speed of the electromagnetic wave can be inversely calculated, thereby obtaining the dielectric constant. Through such multiple calibrations, we take the average value of the dielectric constant as the standard for subsequent target depth calculations.
5.1. Implementation
TensorFlow [
44] framework is used for the implementation of our algorithm. The modules of MV-GPRNet are trained together. The entire network is trained for 60 epochs using a batch size of 1. Too high learning rates lead to unstable learning, while too low rates result in long training times. In the beginning, the learning rate is set to 0.01, but it is not fixed. As training times increase, it changes. Initially, the learning rate is relatively high, but as the training progresses, the learning rate continues to decrease until the model converges. For avoiding gradient explosions, we use gradient clipping algorithms. Gradient descent is accelerated with a momentum equal to
by using momentum optimization. To prevent loss of information and reduce calculations, we reformat each GPR B-scan into an image with a resolution of
pixels, which corresponded to a 7 m × 1.5 m concrete segment. For Equation (
5), we set
,
, and
. In learning box refinement, a ground-truth box is assigned to a box proposal if its IoU exceeds a specific threshold
. Given that the number of candidate boxes obtained by segmentation is often small, we set the IoU threshold to
.
5.2. Evalution Metrics
Precision (Prec), Recall (Rec), and F1-measure (F1), which are common metrics of object detection, are used to quantitatively evaluate the performance of different methods. The ratio of overlap between the candidate box and the original label box, known as Intersection over Union (IoU) [
45], is the threshold to determine the three metrics. A true positive (TP) box is one with an IoU value exceeding the pre-set threshold
, otherwise a false positive (FP) is considered. We set
in our experiments. According to TP, FP, and false negative (FN), the three metrics can be computed as follows:
5.3. Experiments on Real Airport Runway
5.3.1. Airport Data Collection
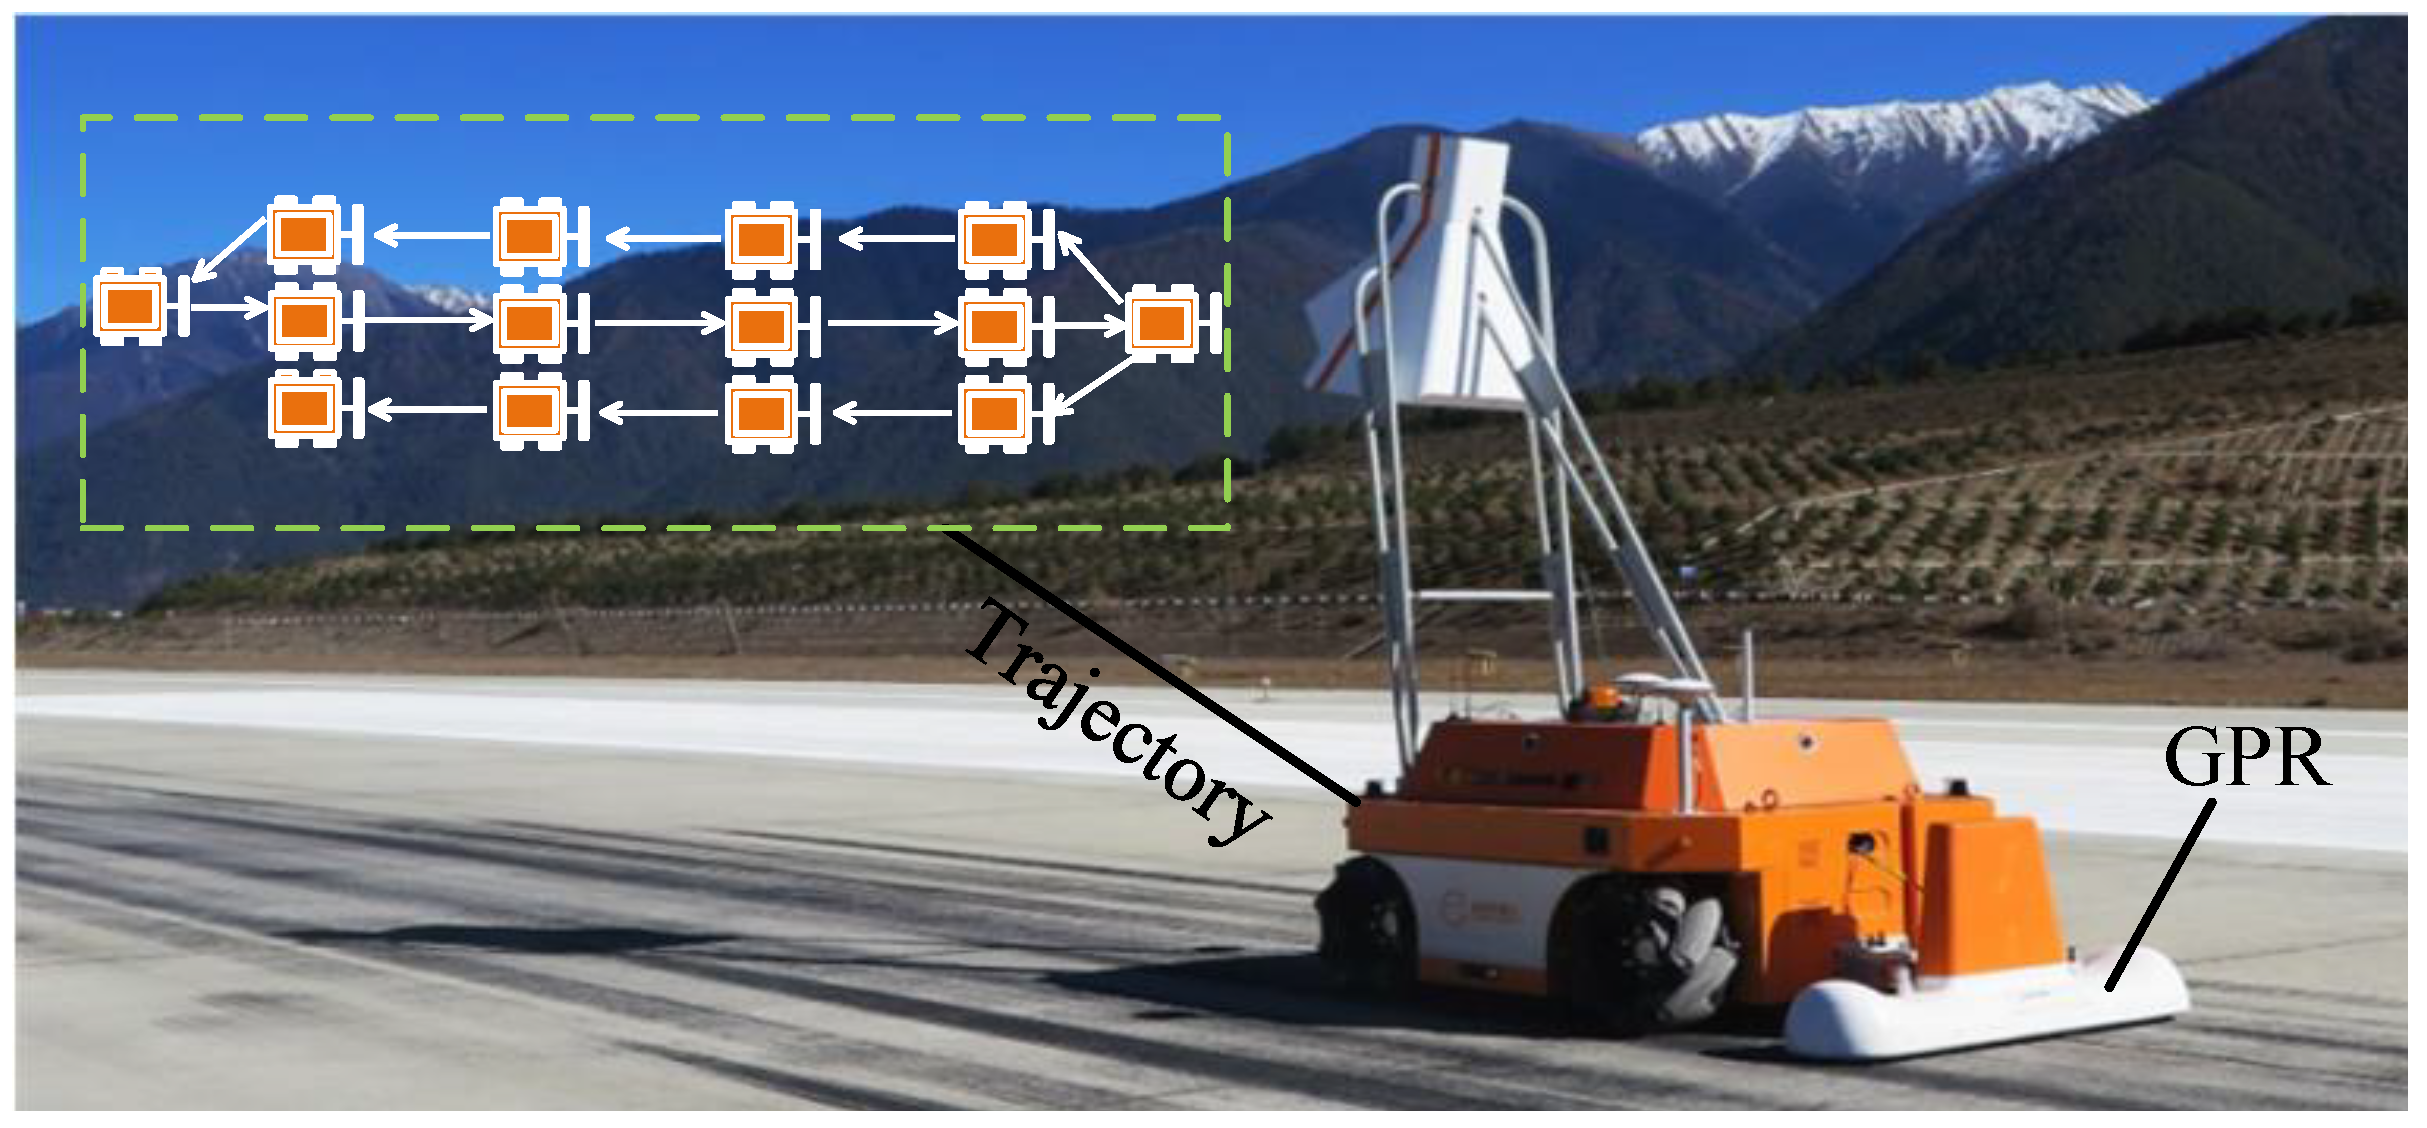
The data set used for our experiments on real airport GPR data was collected using a robot-mounted GPR system. A Raptor™ GPR with isometric fourteen-channel is mounted on the robot equipped with 900 MHZ antennas. The GPR is configured for distance trigger mode. The coverage width of the multi-channel GPR is 1.2 m, and the channel spacing is 87.5 mm. When performing defect detection, at a guaranteed travel speed of 5 km per hour and within a depth range of 1m, the device can detect defects that are no less than 15 cm × 15 cm in the concrete pavement, base, and subbase. As illustrated in
Figure 9, the robot conducts defect inspection by moving along a predefined trajectory on the airport runway to collect GPR data. The robot goes from a starting position and then follows a linear path through each scan. Once the current scan is completed, the robot continues on to the next scan until the whole surveyed region is thoroughly covered. We calibrate sensors using a mirror-assisted method [
46]. By combining an onboard GPS-RTK receiver and an IMU, the robot performs self-localize. The robot simultaneously transfers image and GPR data using 4G/5G connections to the nearby data analysis center while scanning. The offline analysis will then be performed on the collected data.
We have collected real GPR data from three Chinese international airports. To obtain the B-scan and Top-scan data, we establish two datasets extracted from the GPR data by different views named AUD-B and AUD-T, respectively. The AUD-B dataset contains 5300 B-scan images, while 4526 Top-scan images are contained in the AUD-T dataset. There are 21,083 m
of inspection area at three airports, and 1.53 m of subsurface depth are surveyed. The horizontal sampling rate of the GPR is 390 A-scans per meter, and the vertical sampling rate is 1024 sample/A-scan. There are four types of subsurface defects/objects that have been labeled by two human experts individually, namely voids, subsidences, cracks, and pipes. In the training process, we extract features from different views of the same defect, that is, C-scan data composed of multiple parallel B-scan and top scan data from different depths at the same time for feature fusion. The number of different defect samples in B-scan and Top-scan datasets are listed in
Table 1. With a set ratio of 7:3, each configuration of defects was randomly assigned to the training data and the testing data in this study.
5.3.2. Comparison with Object Detection Network
To evaluate the benefits of learning using the 3D data and multi-view data of GPR, we have conducted a comparison with four existing object detection networks, including:
Faster R-CNN [
47]. Faster R-CNN is a two-stage object detection network utilizing RPN to extract candidate boxes.
YOLO v5 [
48]. You only look once (YOLO) is a real-time one-stage object detection method.
PIXOR [
29]. In the field of autonomous driving, PIXOR (ORiented 3D object detection from PIXel-wise neural network predictions) is a SOTA, real-time 3D object detection method.
GPR-RCNN [
38]. A GPR B-scan-based deep learning method for subsurface defect detection.
A major problem that is common to all existing methods which apply CNNs to subsurface object detection in GPR data is that they rely on the detection of 2D B-scan profiles extracted from 3D GPR volumes. This may be sufficient to detect underground defects with a cylindrical shape. However, they cannot detect irregular targets such as subsurface defects, which have to be observed simultaneously from multiple slices through 3D convolution. To further verify the performance of the MV-GPRNet, an additional comparative experiment is conducted based on our previous work on a 3D convolutional network named as GPR-RCNN algorithm which is developed to detect the subsurface defect detection. These four methods can only use single view data as input, so we have implemented, trained, and tested these models on AUD-B dataset.
As shown in
Table 2, for each defect class, MV-GPRNet achieves the highest Precision and F1-measure values. It is clear that our algorithm successfully outperforms its four counterparts. We believe the reason for the performance difference is that both Faster R-CNN and YOLO v5 only capture 2D features from B-scans. PIXOR also just extracts 2D features through a single view, and then estimates the 3D position of the object. Although GPR RCNN combines the 2D and 3D features, they are obtained from one single view. It indicates that adopting hybrid 2D and 3D CNN and extracting features from different views of GPR data is more suitable for airport runway subsurface defect detection problems. It can be noticed that the recall for cracks is relatively low, and we discovered that the missed cracks are all of the particular small shapes. On one hand, the spatial resolution based on the channel spacing is 87.5 mm, which means that cracks of less than 40 mm wide between the channels are difficult to be detected well. On the other hand, in B-scan images, the feature of the minor crack is not obvious and easily interfered with by clutter, which results in the performance of our proposed method being decreased.
5.4. Simulation Experiments
To validate the feasibility of the MV-GPRNet in known specific cases, we conduct a set of simulation experiments. Through gprMax [
49], various synthetic GPR data of airport runway subsurface defects have been generated for different pre-designed cases. GprMax simulates a given environment using mathematical formulas and material physical properties. According to the different materials used in construction, the real airport runway structure is divided into the following layers: surface layer, base layer, under layer, and soil layer. The dielectric constants for each layer are determined in accordance with the underground structure of the real airport runway [
50]. Different subsurface defects have different dielectric constants due to their different materials. In particular, the dielectric constant of voids and cracks is set to 1 since they contain mostly air. A 3D model is created for generating simulation data of complex underground scenarios.
Table 3 lists the main parameters for the simulation. Simulating the GPR antenna, we set a ricker waveform source with an amplitude of 10 and a center frequency of 400 MHz.
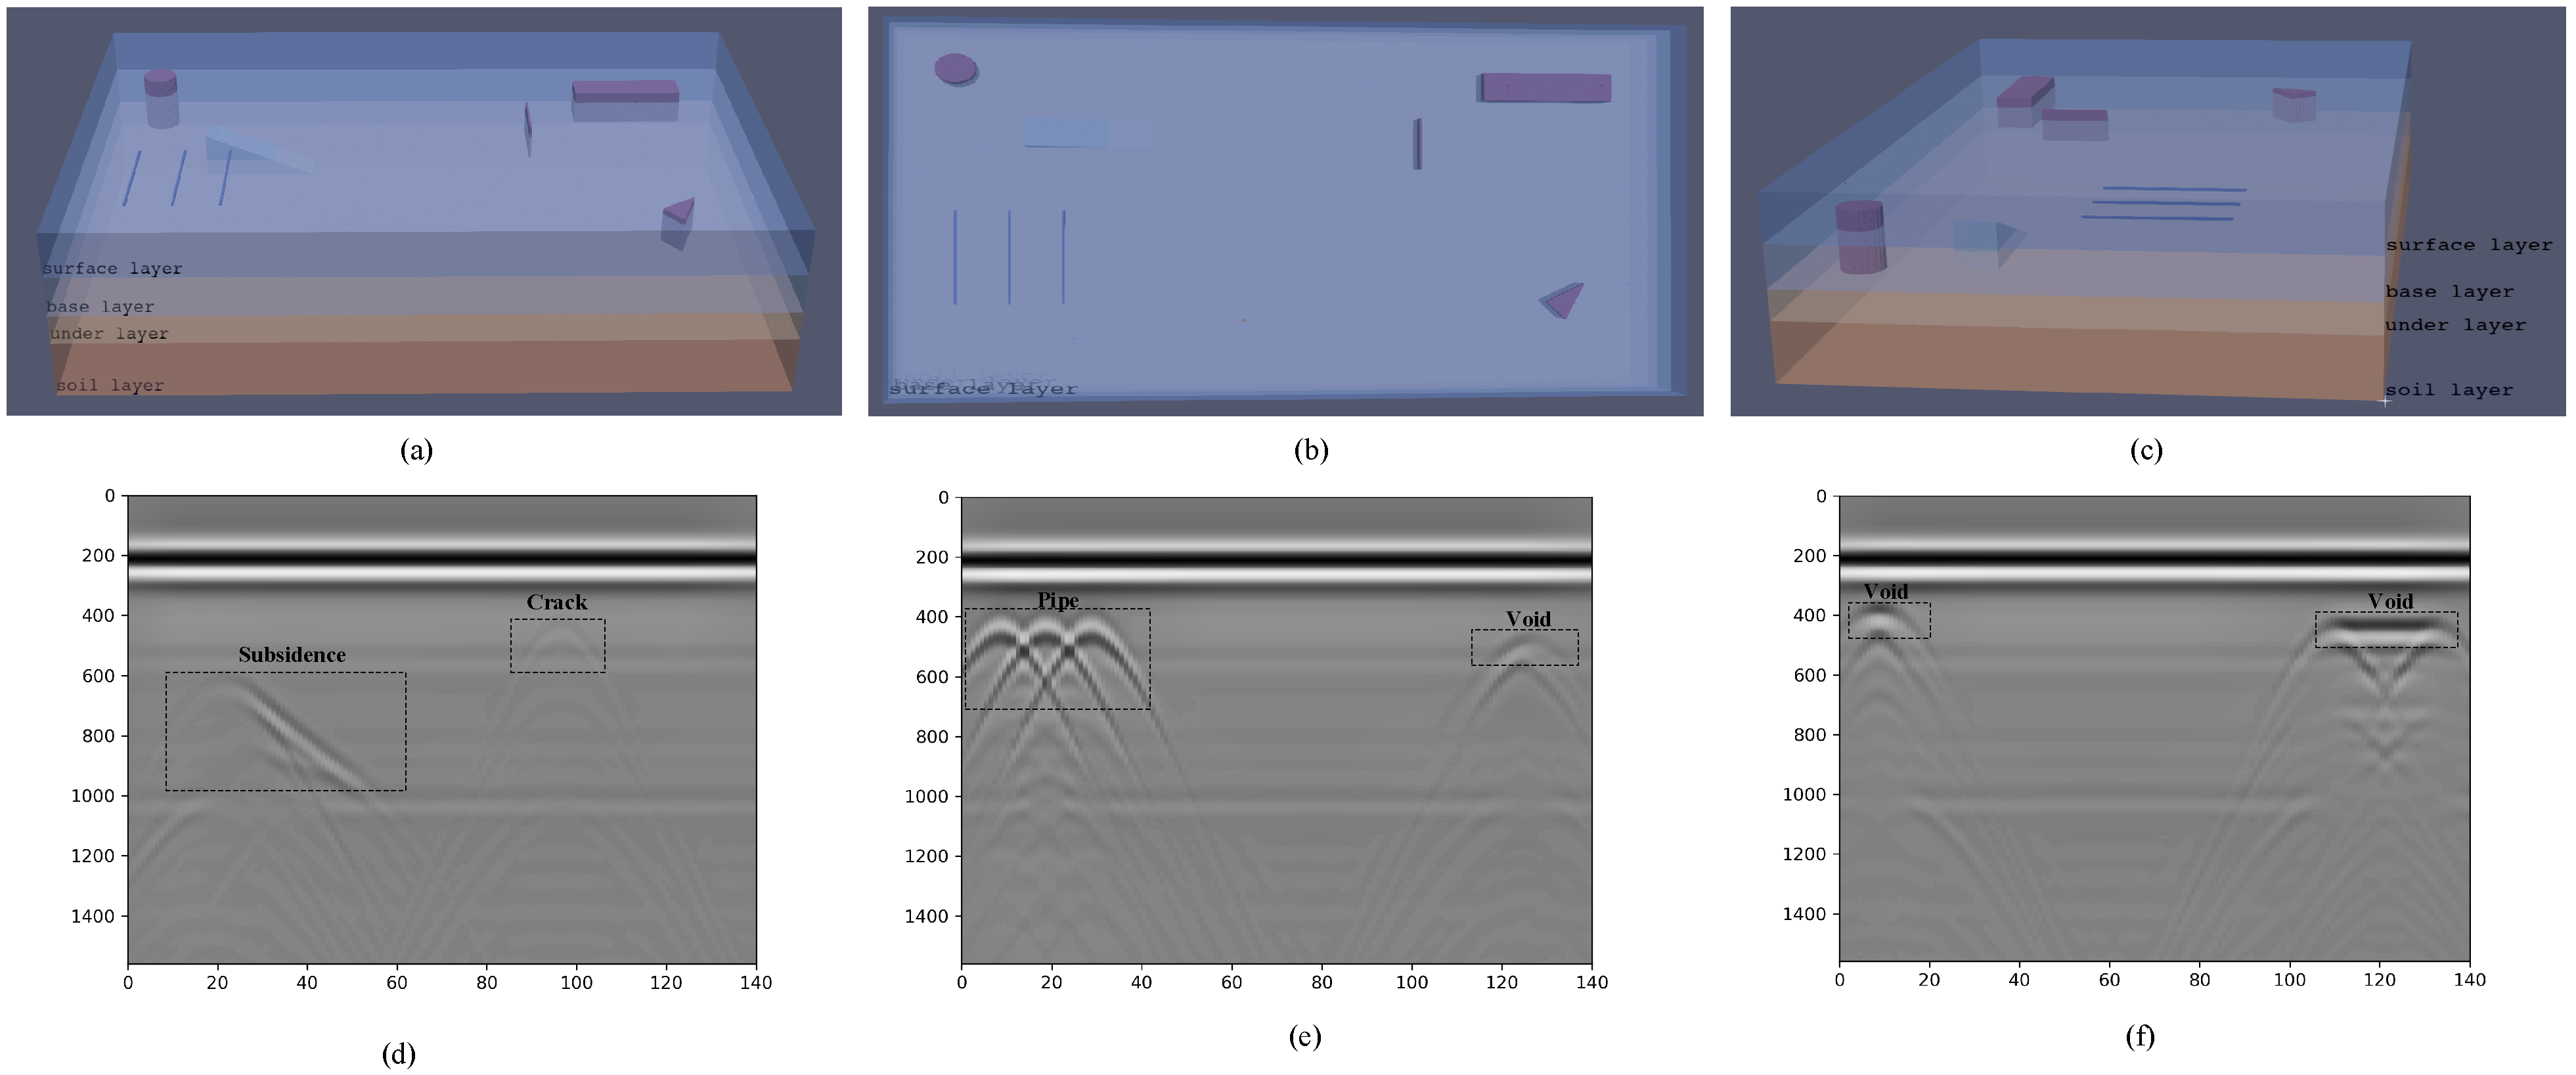
As shown in
Figure 10a–c, an airport runway structure model has been constructed with different types and sizes of subsurface defects. Specifically, we have designed three voids with different shapes, three pipes of the same length, one crack, and one subsidence, all of which are at different locations. As shown in
Figure 10d–f, all buried objects are displayed in B-scan images as hyperbola. This proves that our experimental setup is effective, and the simulation data of different shapes of subsurface diseases are successfully collected. Then, we generate the C-scan data and Top-scan images by combining simultaneous B-scan images. For example, the Top-scan image of a subsidence defect is produced as shown in
Figure 11. The simulated GPR data are fed into the trained MV-GPRNet model, and all test cases are successfully detected as expected.
5.5. Field Test on Artificial Airport Runway
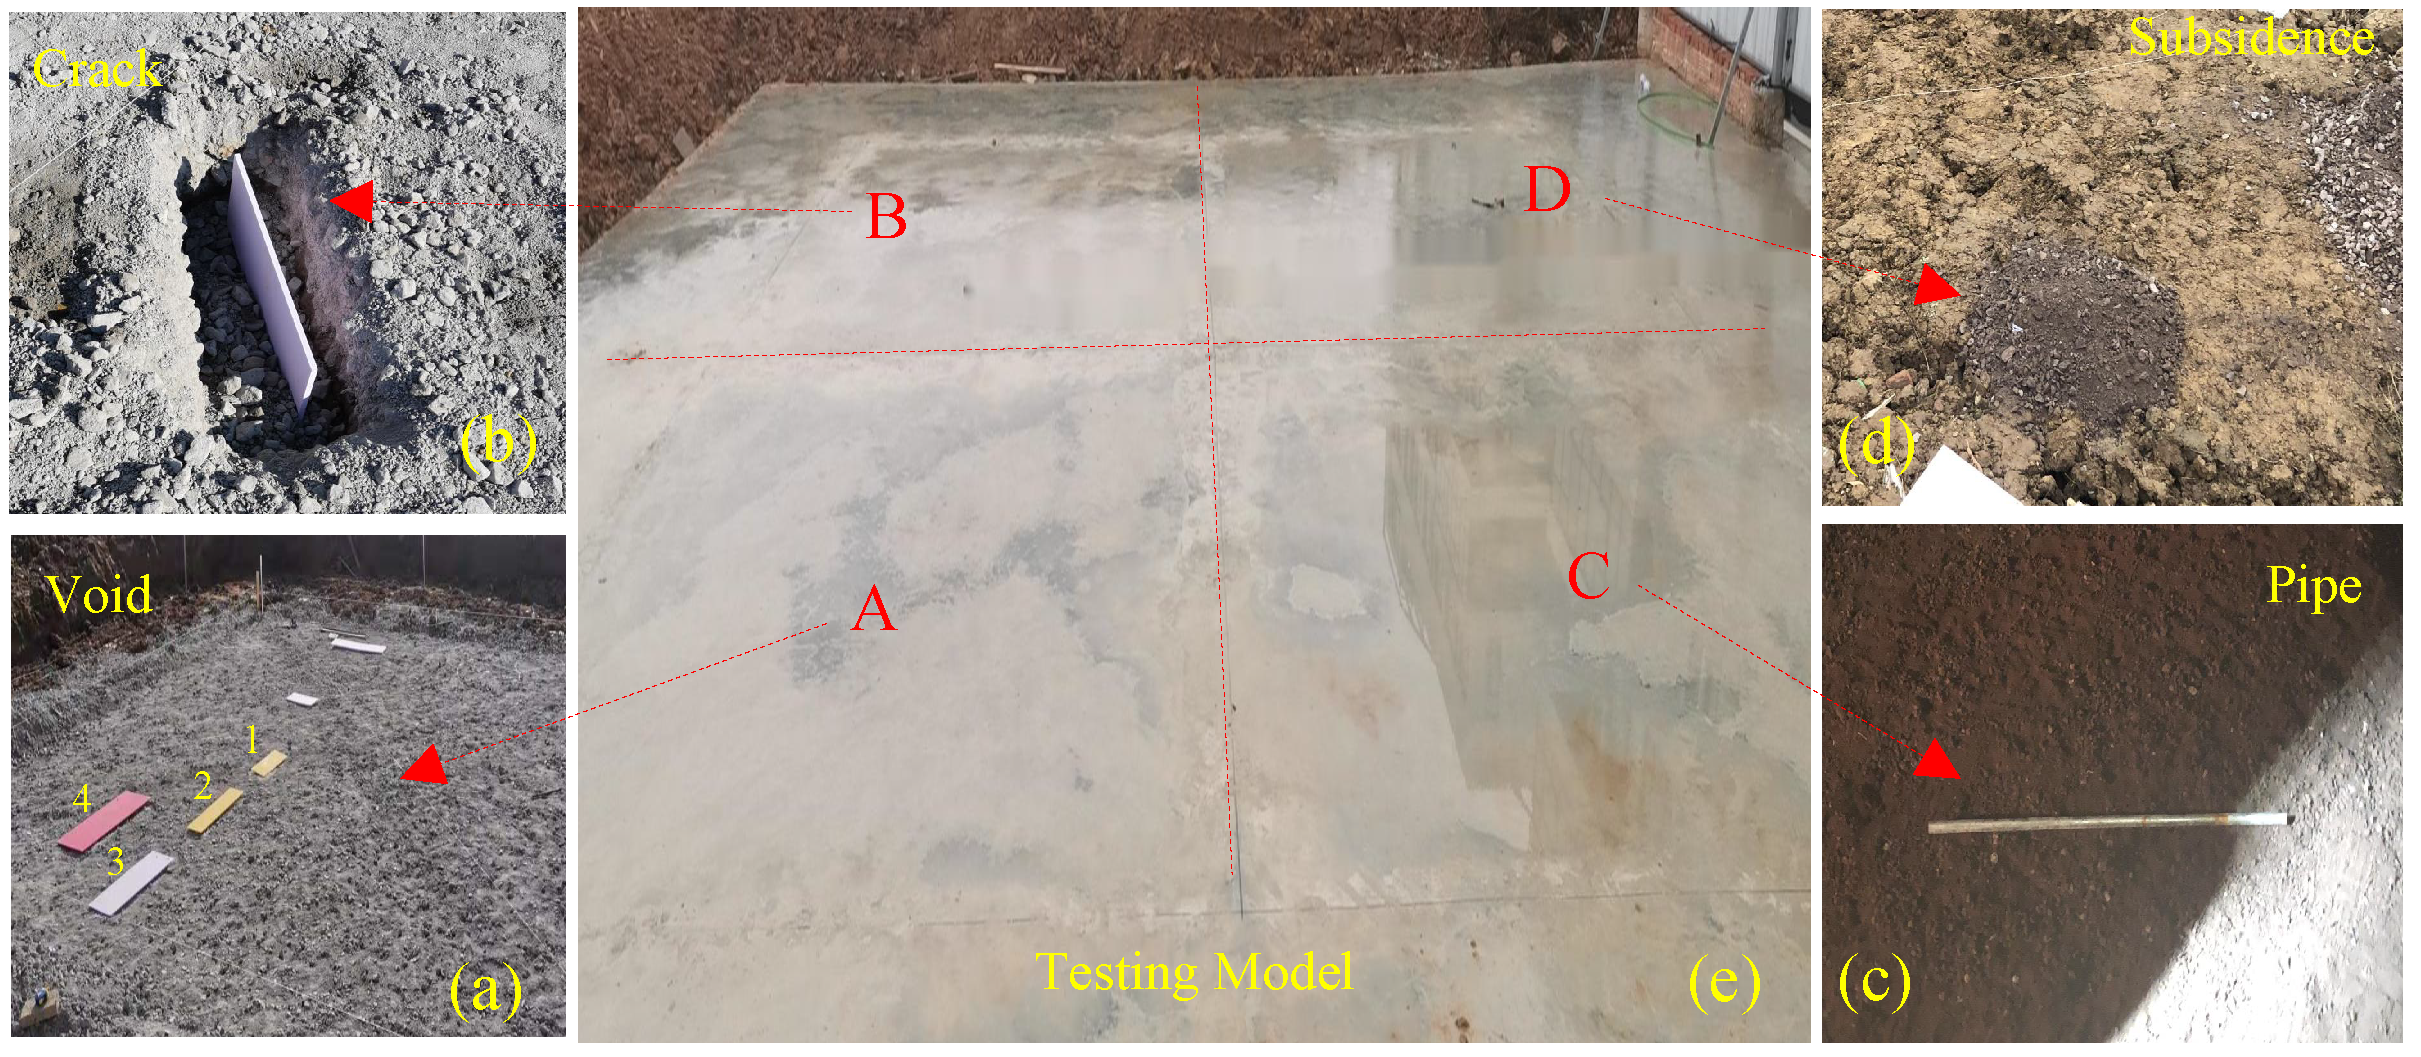
The ground truth of defects in airport runways can only be labeled by human experts, who are inevitably biased or prone to error. To avoid the ambiguity of manual labeling, we have established an experimental model imitating the real airport runway structure with various defects embedded. The experimental model is approximately 8 m × 8 m × 1.5 m (length × width × height). During the construction of the experimental model, the same materials in each layer were used as in the real airport. The model is divided into four zones with approximate dimensions of 2 m × 2 m × 1.5 m for different experimental processes, as shown in
Figure 12e. Pipes, cracks, subsidences and voids are deployed in different zones of the concrete model. As shown in
Figure 12a, four plastic plates of different sizes and thicknesses were placed flat at a depth of approximately 0.5 m to simulate interlayer voids. A plastic board with dimensions of 200 × 500 × 10 mm and an angle of 45 degrees was used in the experiment to represent the cracks, as shown in
Figure 12b. There was a steel pipe with a length of 2 m and a radius of 4.2 cm in the concrete model, as shown in
Figure 12c. A small round pit was dug at about 0.7 m, which was filled with structural material of the upper layer to simulate the subsidence as shown in
Figure 12d. It was important to maintain a large distance between each of the defects in order to avoid interference from two signals and to mitigate the impacts of any movement during concrete pouring. Experiments were conducted 30 days after the experimental model was formed.
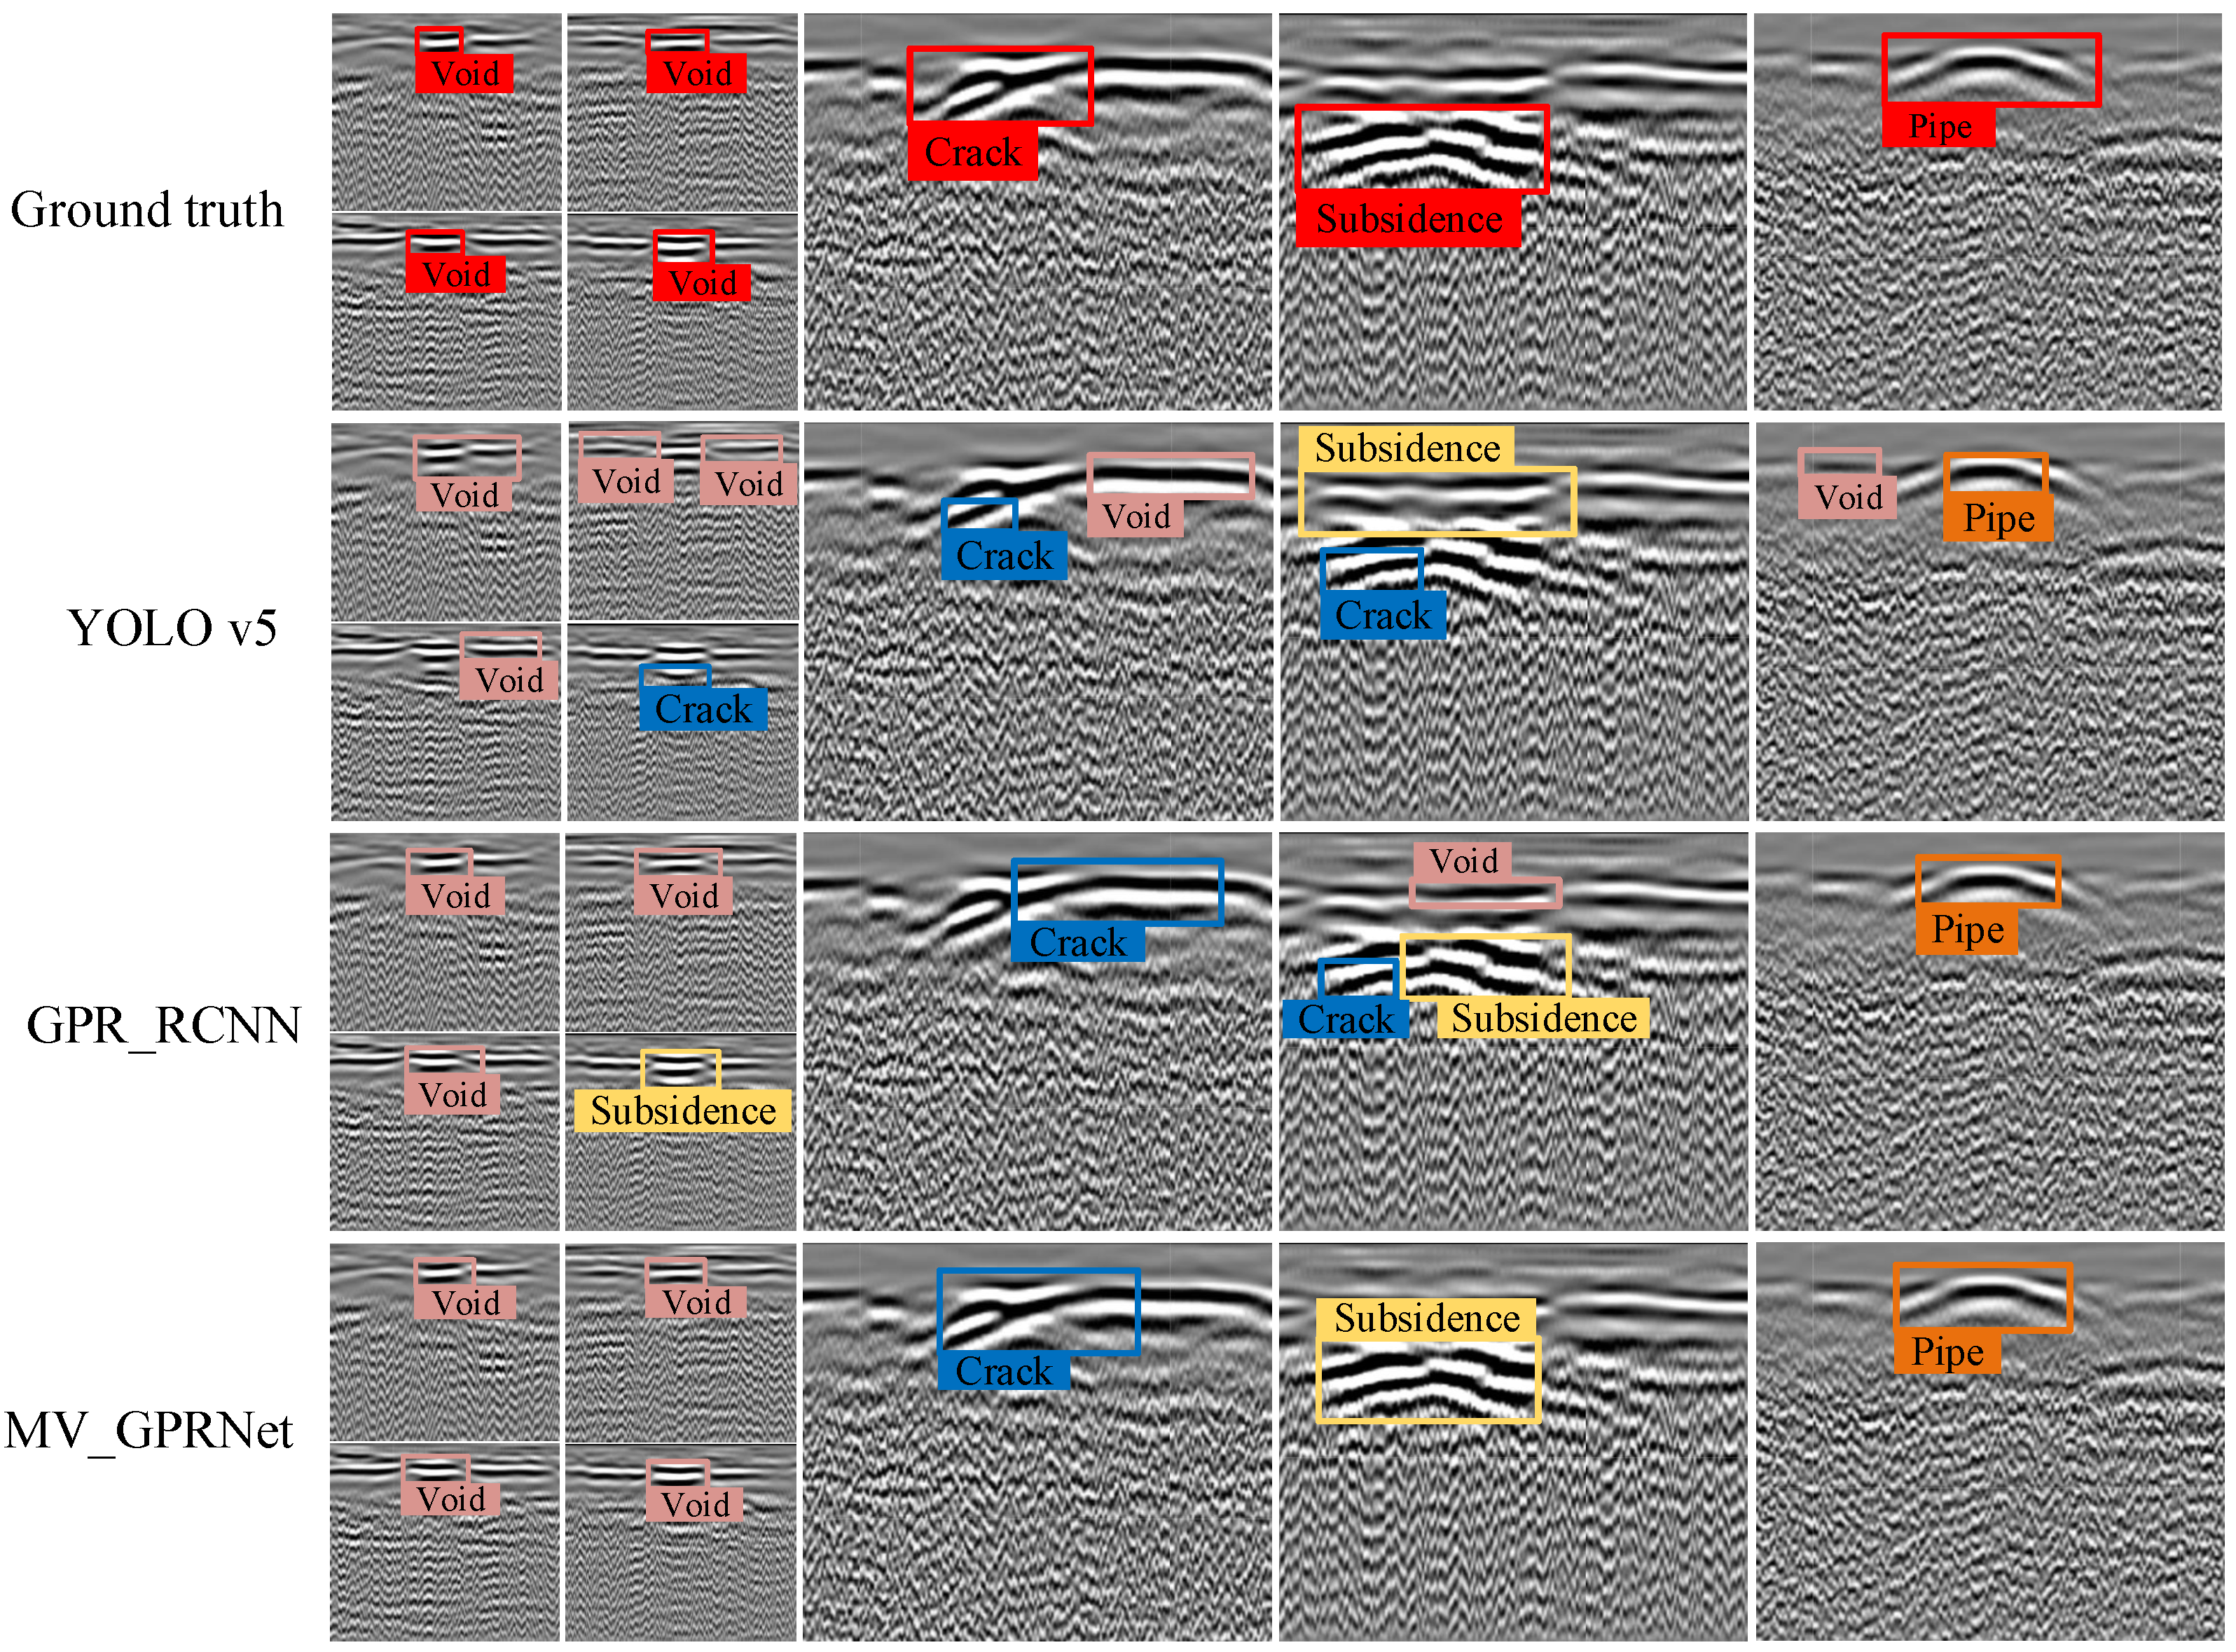
It is more complicated to analyze collected GPR data than synthetic data due to the inhomogeneity of real structures and clutter under real environmental conditions. To prove the superiority of our proposed method in test sites with known and established features, we conducted further comparative experiments based on the artificial model. With
Table 1 and
Table 2, it can be seen that YOLO v5, GPR RCNN and MV-GPRNet have the highest detection rates of diseases, so we only compare these three algorithms. As shown in
Figure 13, each artificially constructed underground defect has been collected by the GPR utilized in this study. These B-scan and Top-scan images containing pre-buried defects are fed into the trained comparative models for testing. As shown in
Figure 14, we can easily observe that MV-GPRNet improves the accuracy of subsurface defect detection, especially for cracks and subsidences. It indicates that adopting 3D CNN and extracting features from different views of GPR data is more suitable for the detection of subsurface defects on airport runways. Furthermore, the testing results demonstrate that the transferability and robustness of MV-GPRNet are optimal.
7. Conclusions and Future Work
We proposed an MV-GPRNet model for automatic subsurface defect detection for the robotic inspection of airport runways. Our MV-GPRNet originally fused the multi-view feature maps extracted from 3D C-scan data and 2D Top-scan data, which was able to take great advantage of the GPR information. Therefore, it was determined that the MV-GPRNet had the potential to improve fine-grained defect identification accuracy. The MV-GPRNet was first validated by using synthetic GPR data and artificial runway data. Then, the NV-GPRNet was successfully applied to detect the pre-buried irregular defects with similar features. Furthermore, a large number of real runway data sets from three international airports have been used to extensively test our method. The comparative results demonstrated that the MV-GPRNet can effectively detect the airport runway subsurface defects and had outperformed the SOTA techniques. Specifically, our method achieved F1-measures at 91%, 69%, 90%, and 100% for a void, crack, subsidence and pipe, respectively.
However, for minor defects, due to their insignificance feature in the real GPR data, they are easily neglected. In the future, we will consider adding the prior knowledge in the CNN model to further improve the performance of defect detection.


