
Coastal Vulnerability Assessment of Bali Province, Indonesia Using Remote Sensing and GIS Approaches


Abstract
1. Introduction
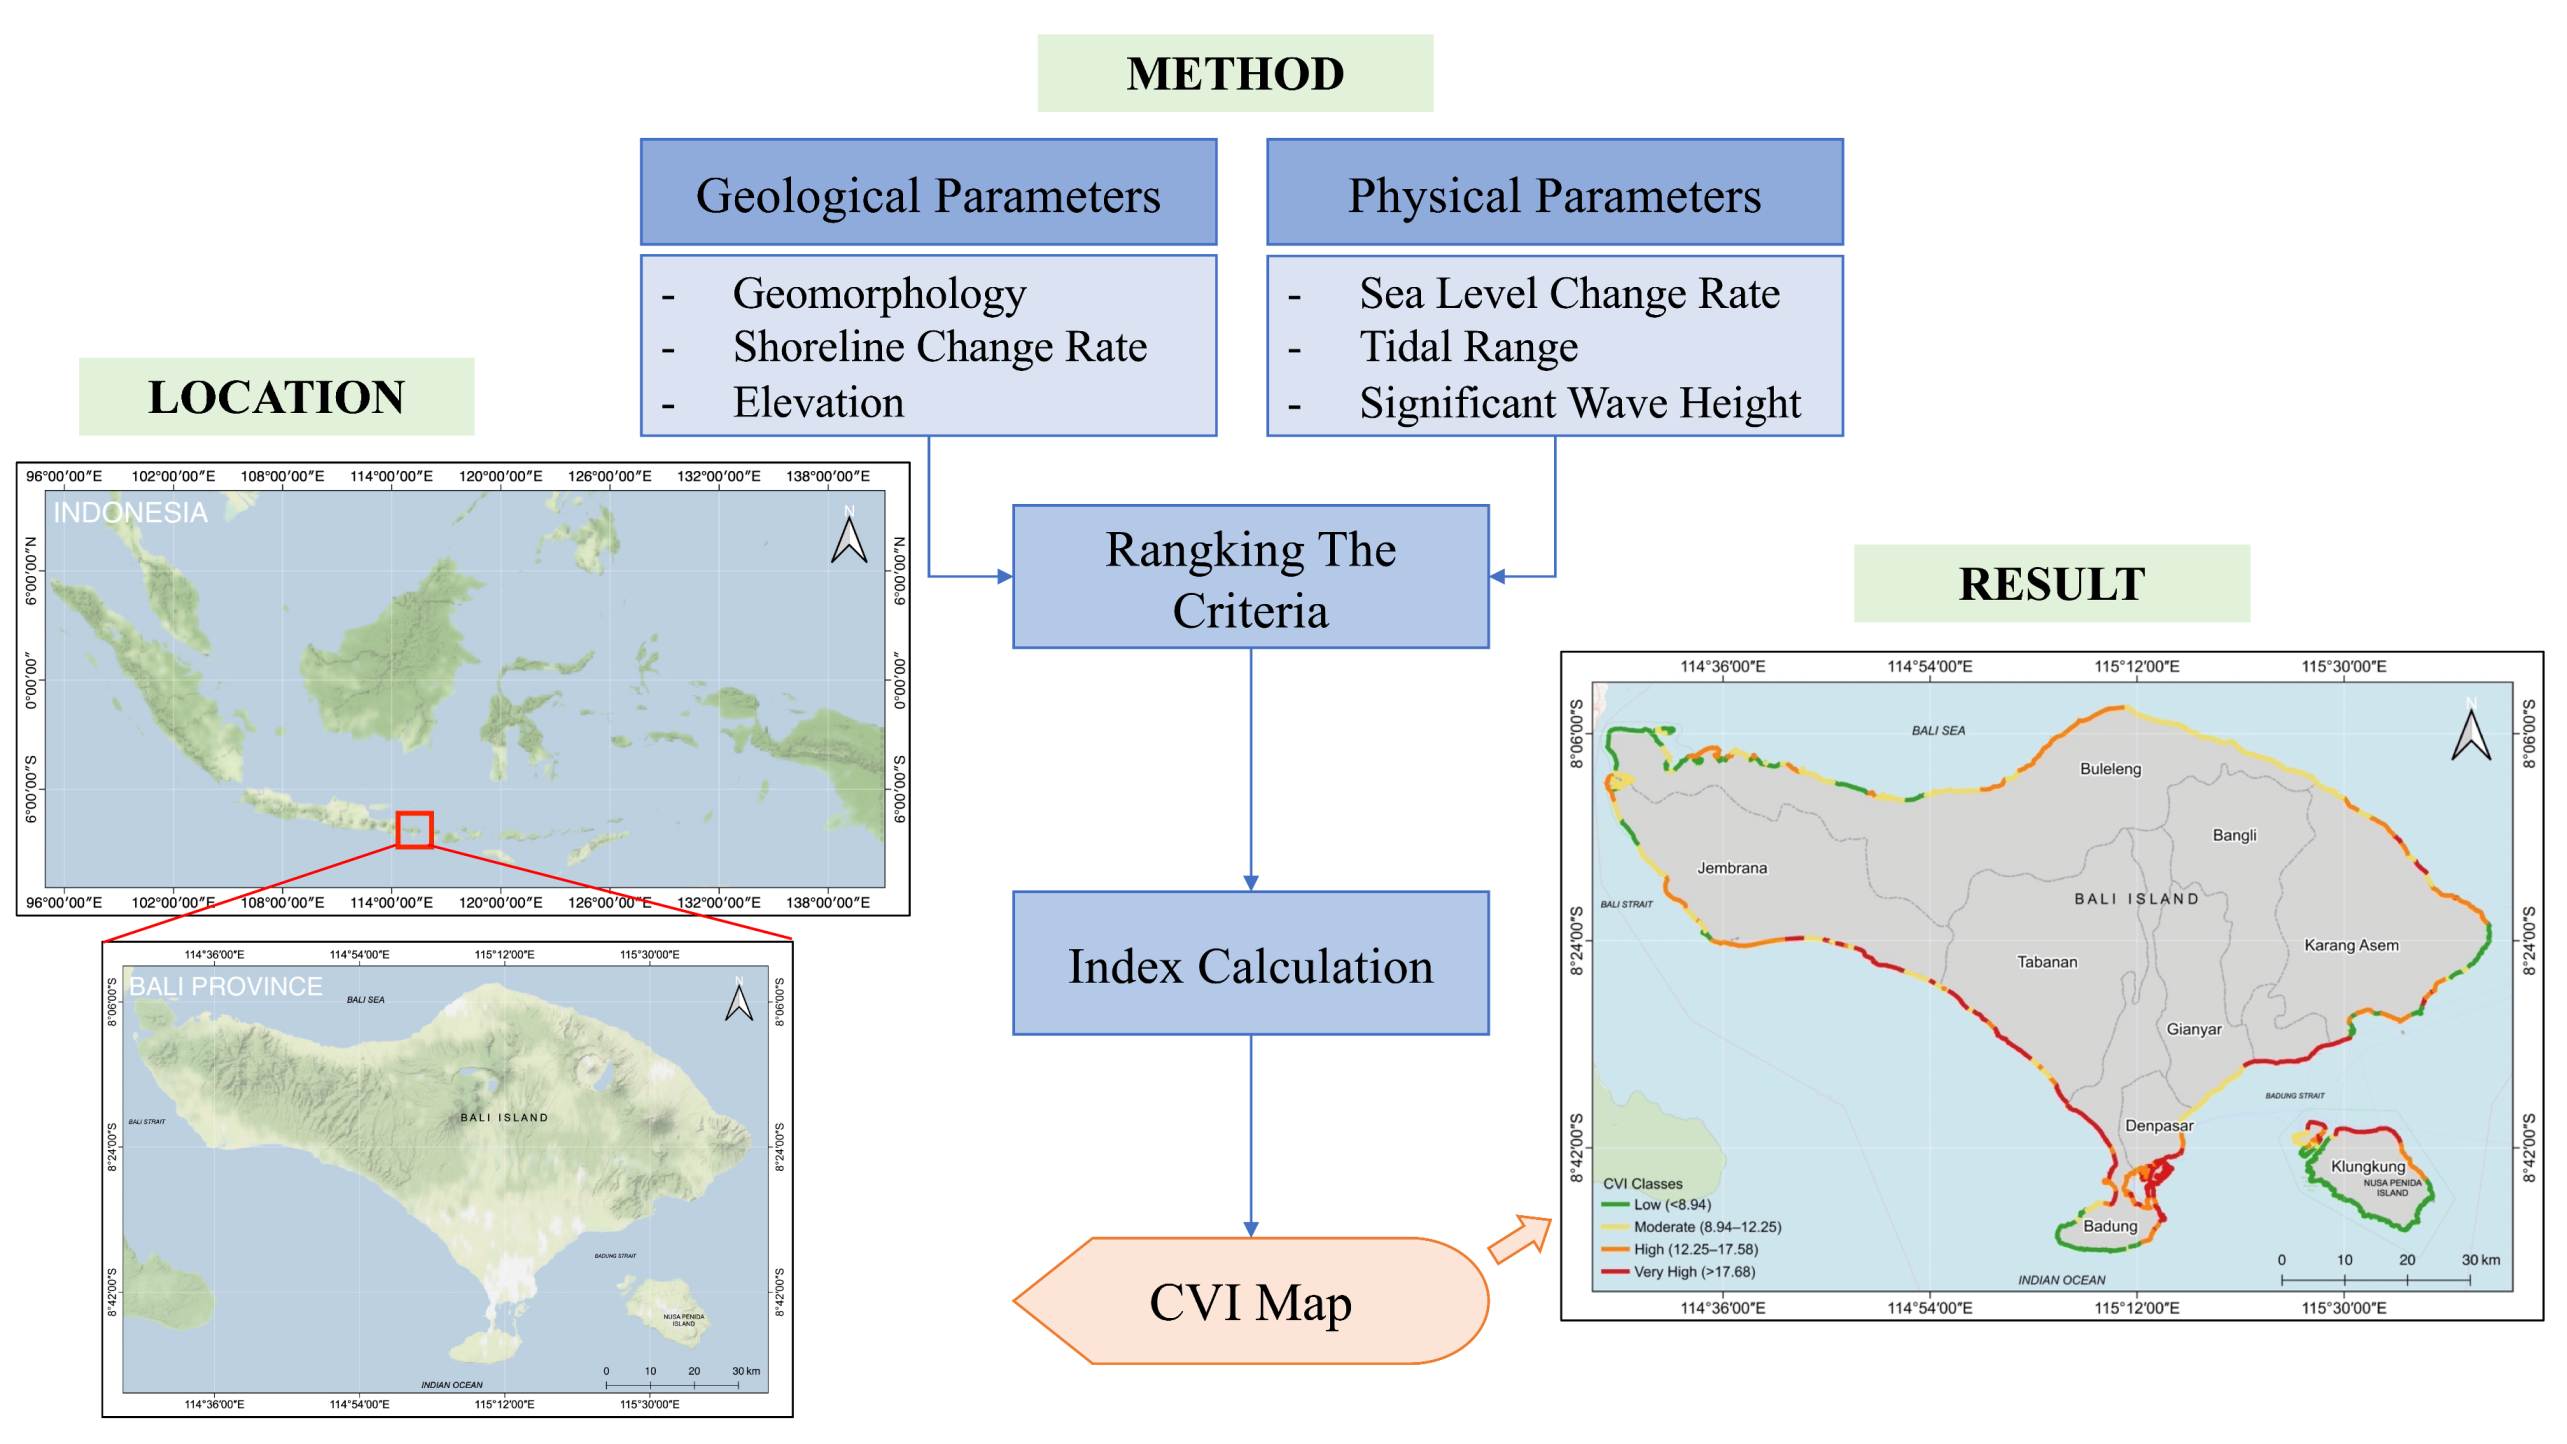
2. Study Area
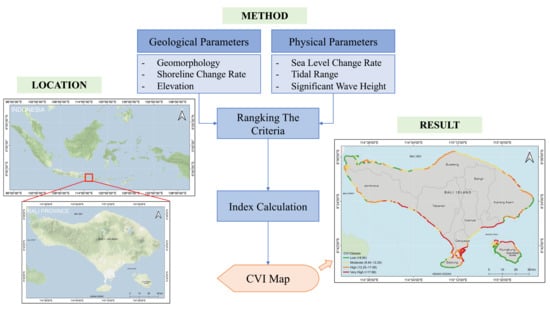
3. Methodology
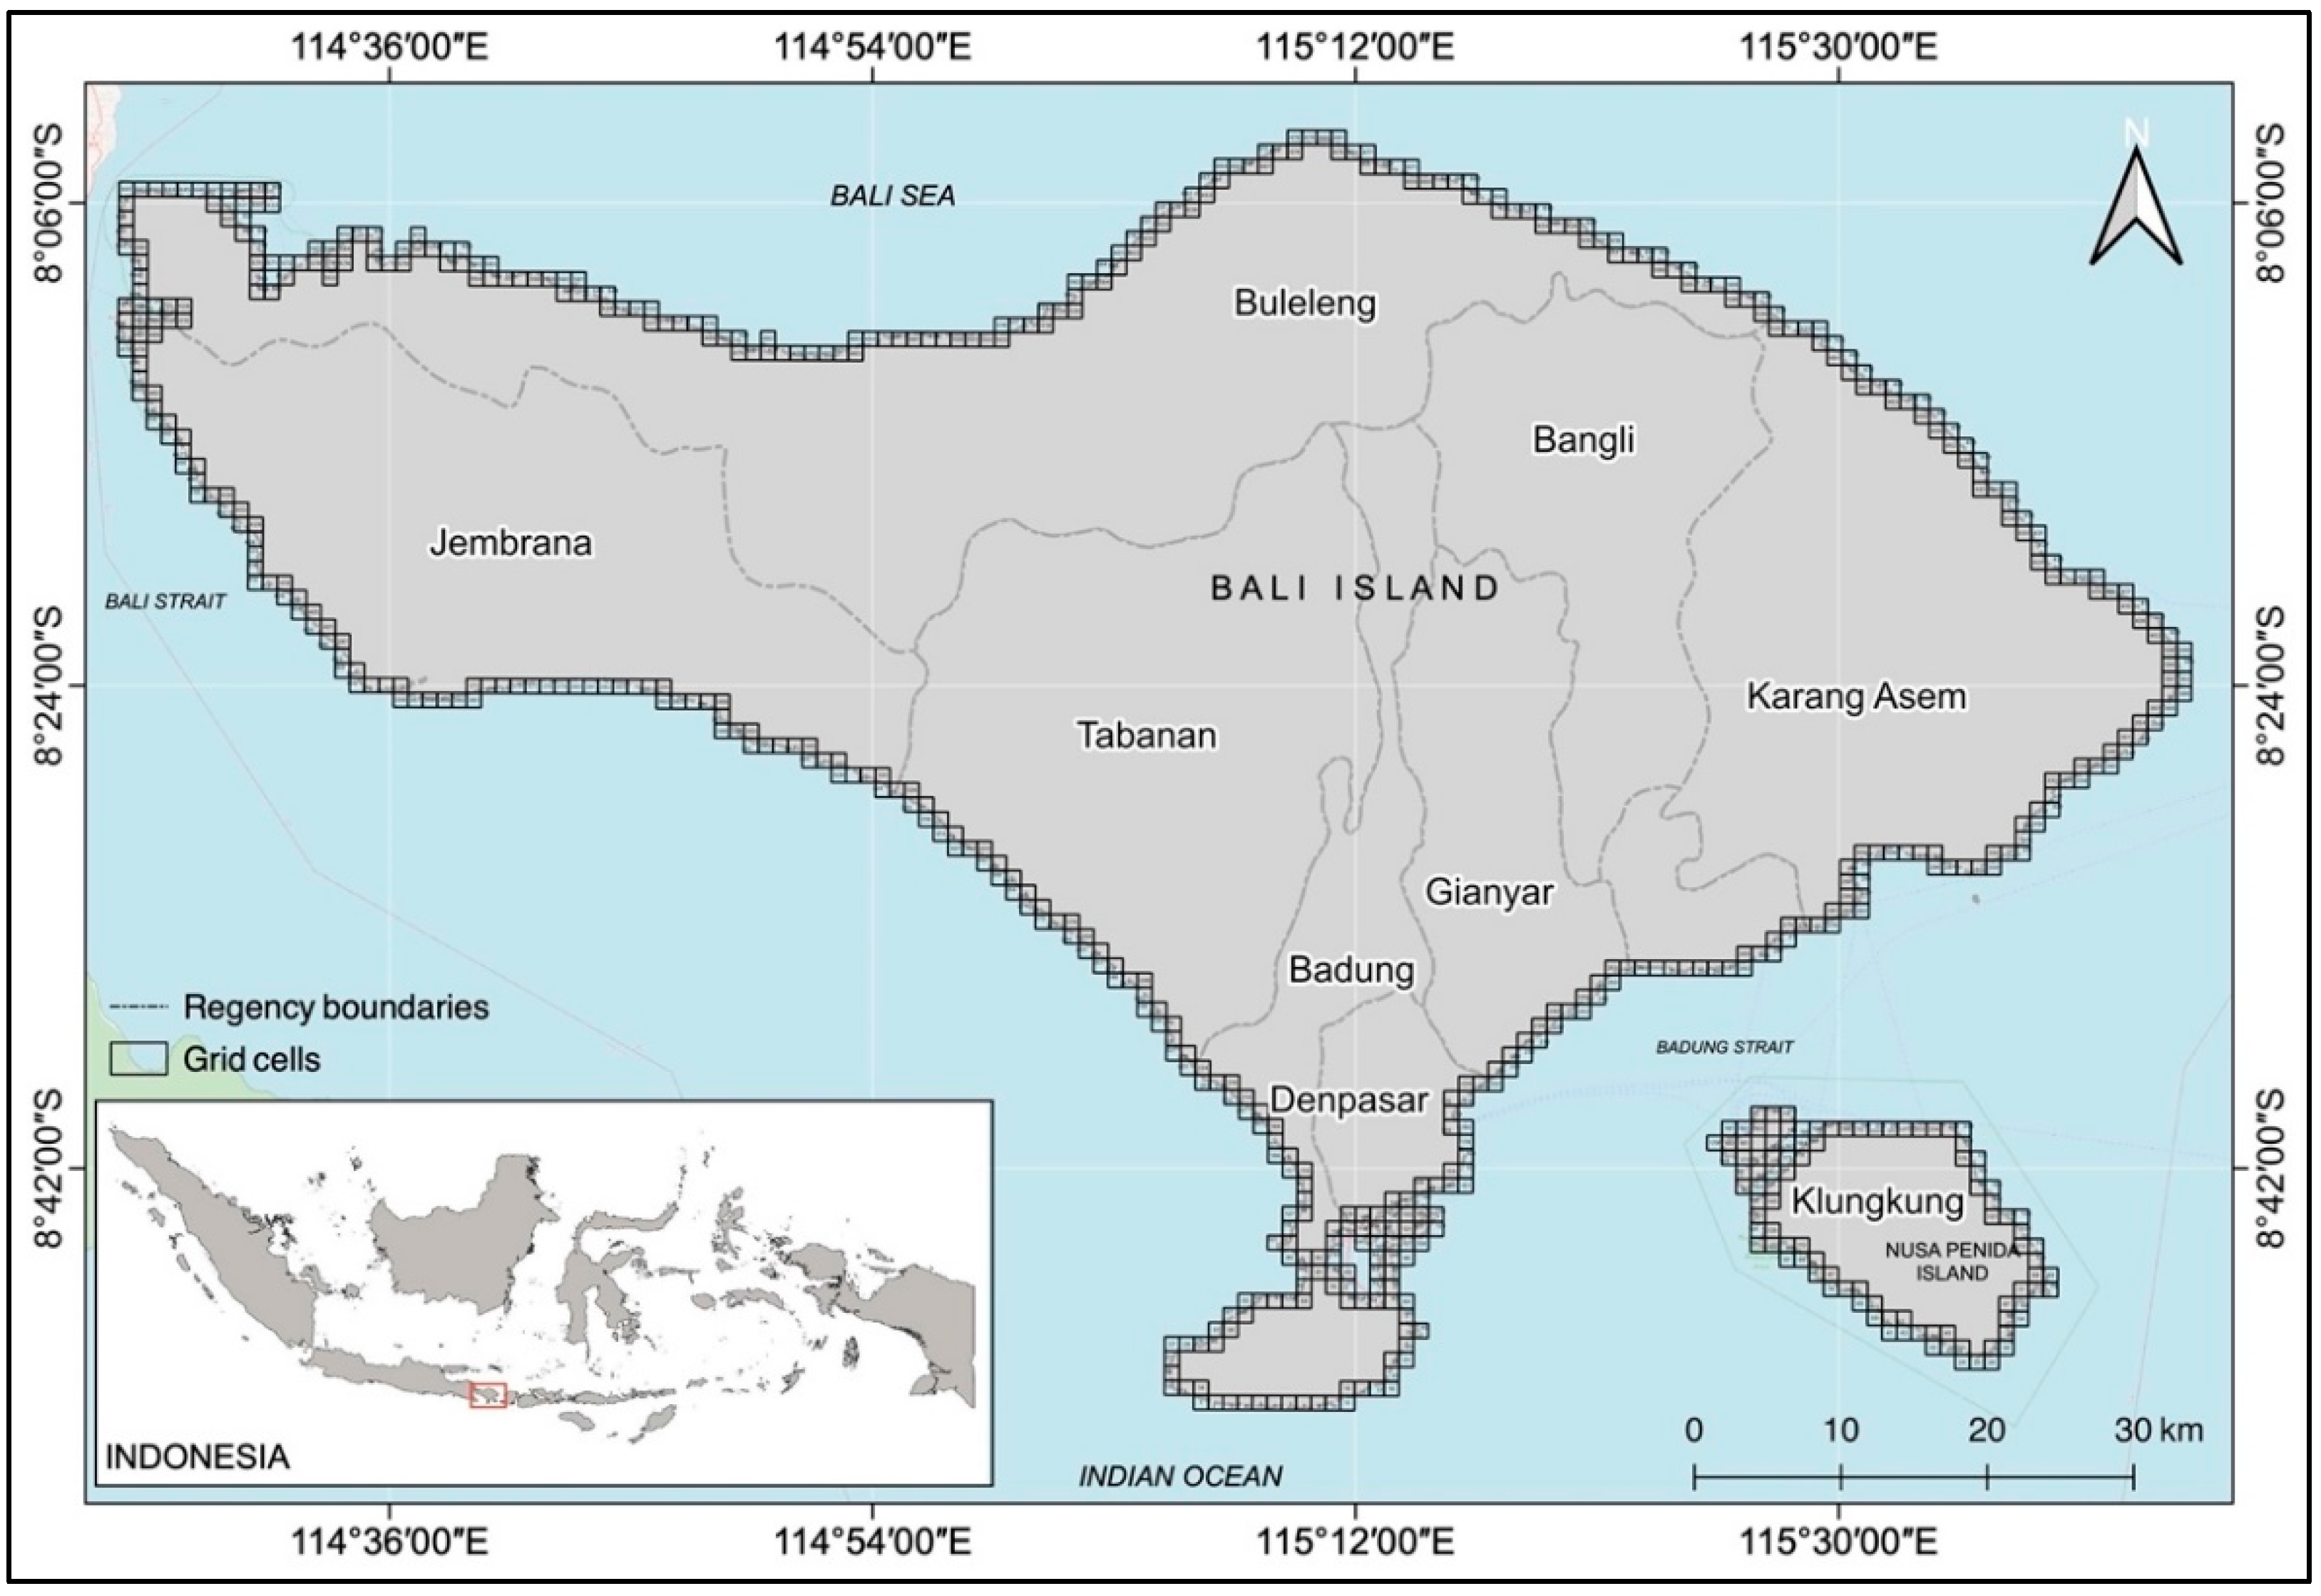
3.1. Geomorphology
3.2. Shoreline Change Rate
3.3. Elevation
3.4. Sea Level Change Rate
3.5. Tidal Range
3.6. Significant Wave Height
3.7. Coastal Vulnerability Index (CVI) Analysis
3.8. Model Validation
4. Results and Discussion
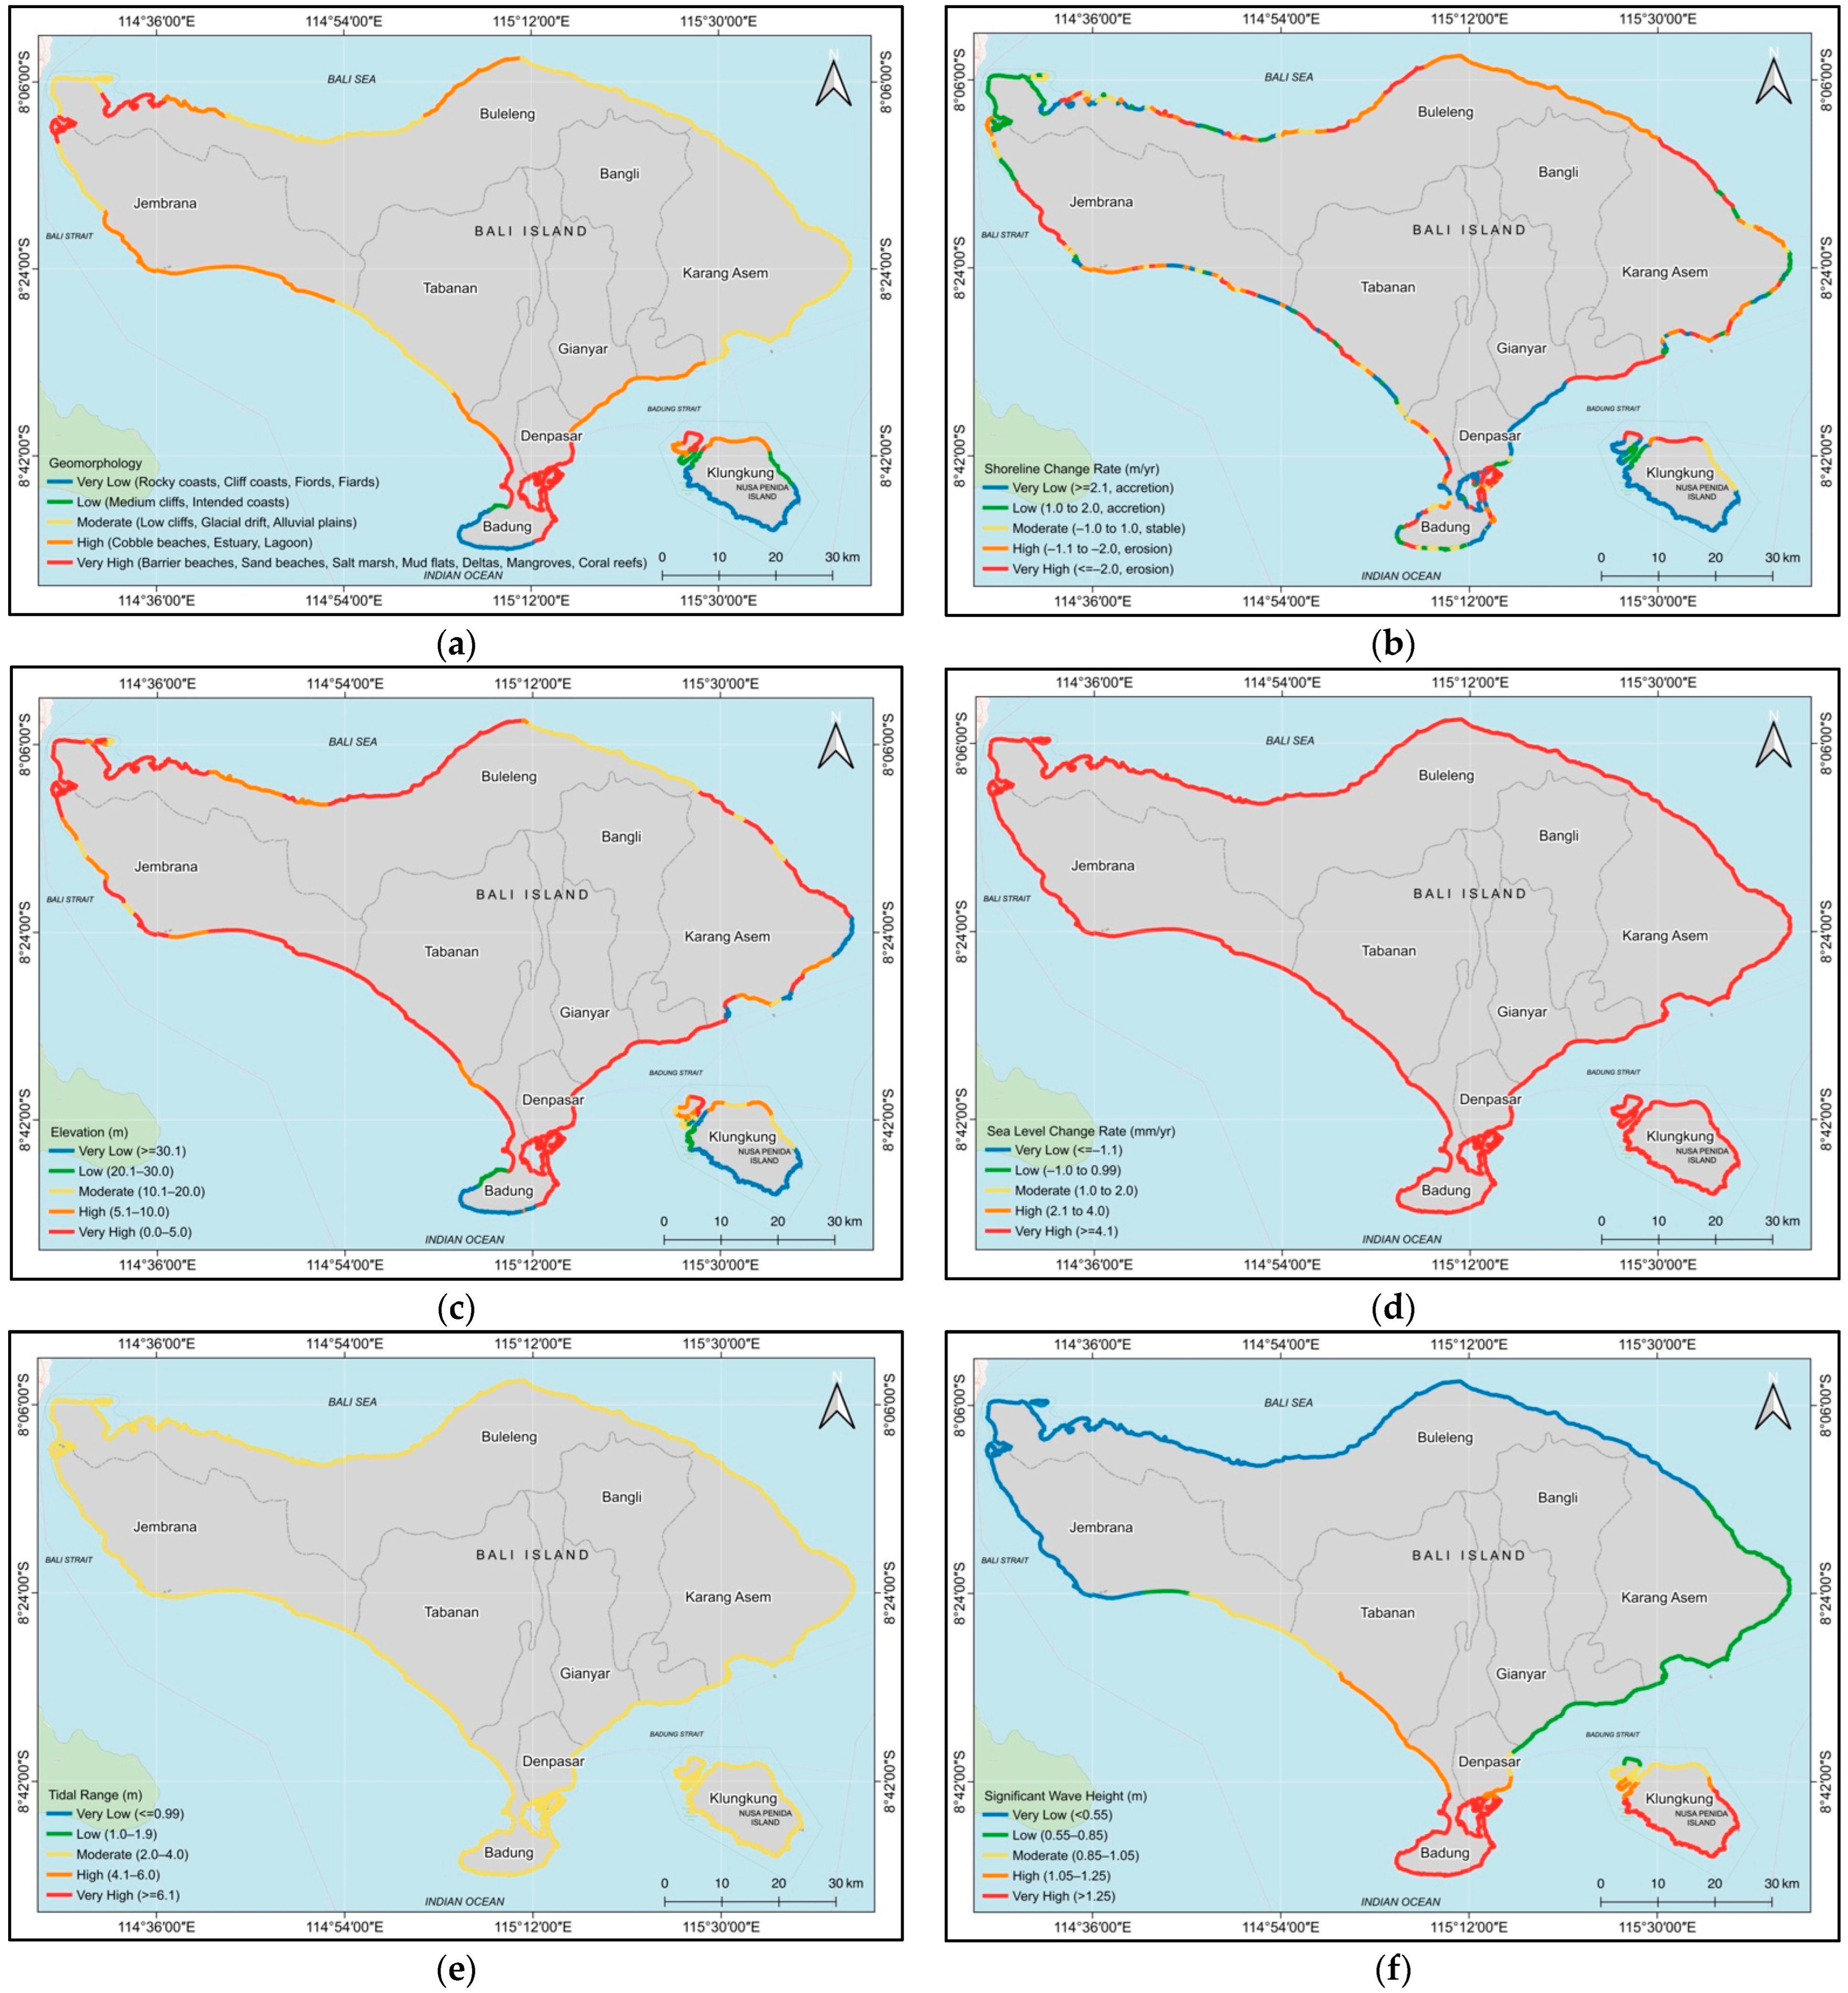
4.1. Geomorphology
4.2. Shoreline Change
4.3. Elevation
4.4. Sea Level
4.5. Tidal Range
4.6. Significant Wave Height
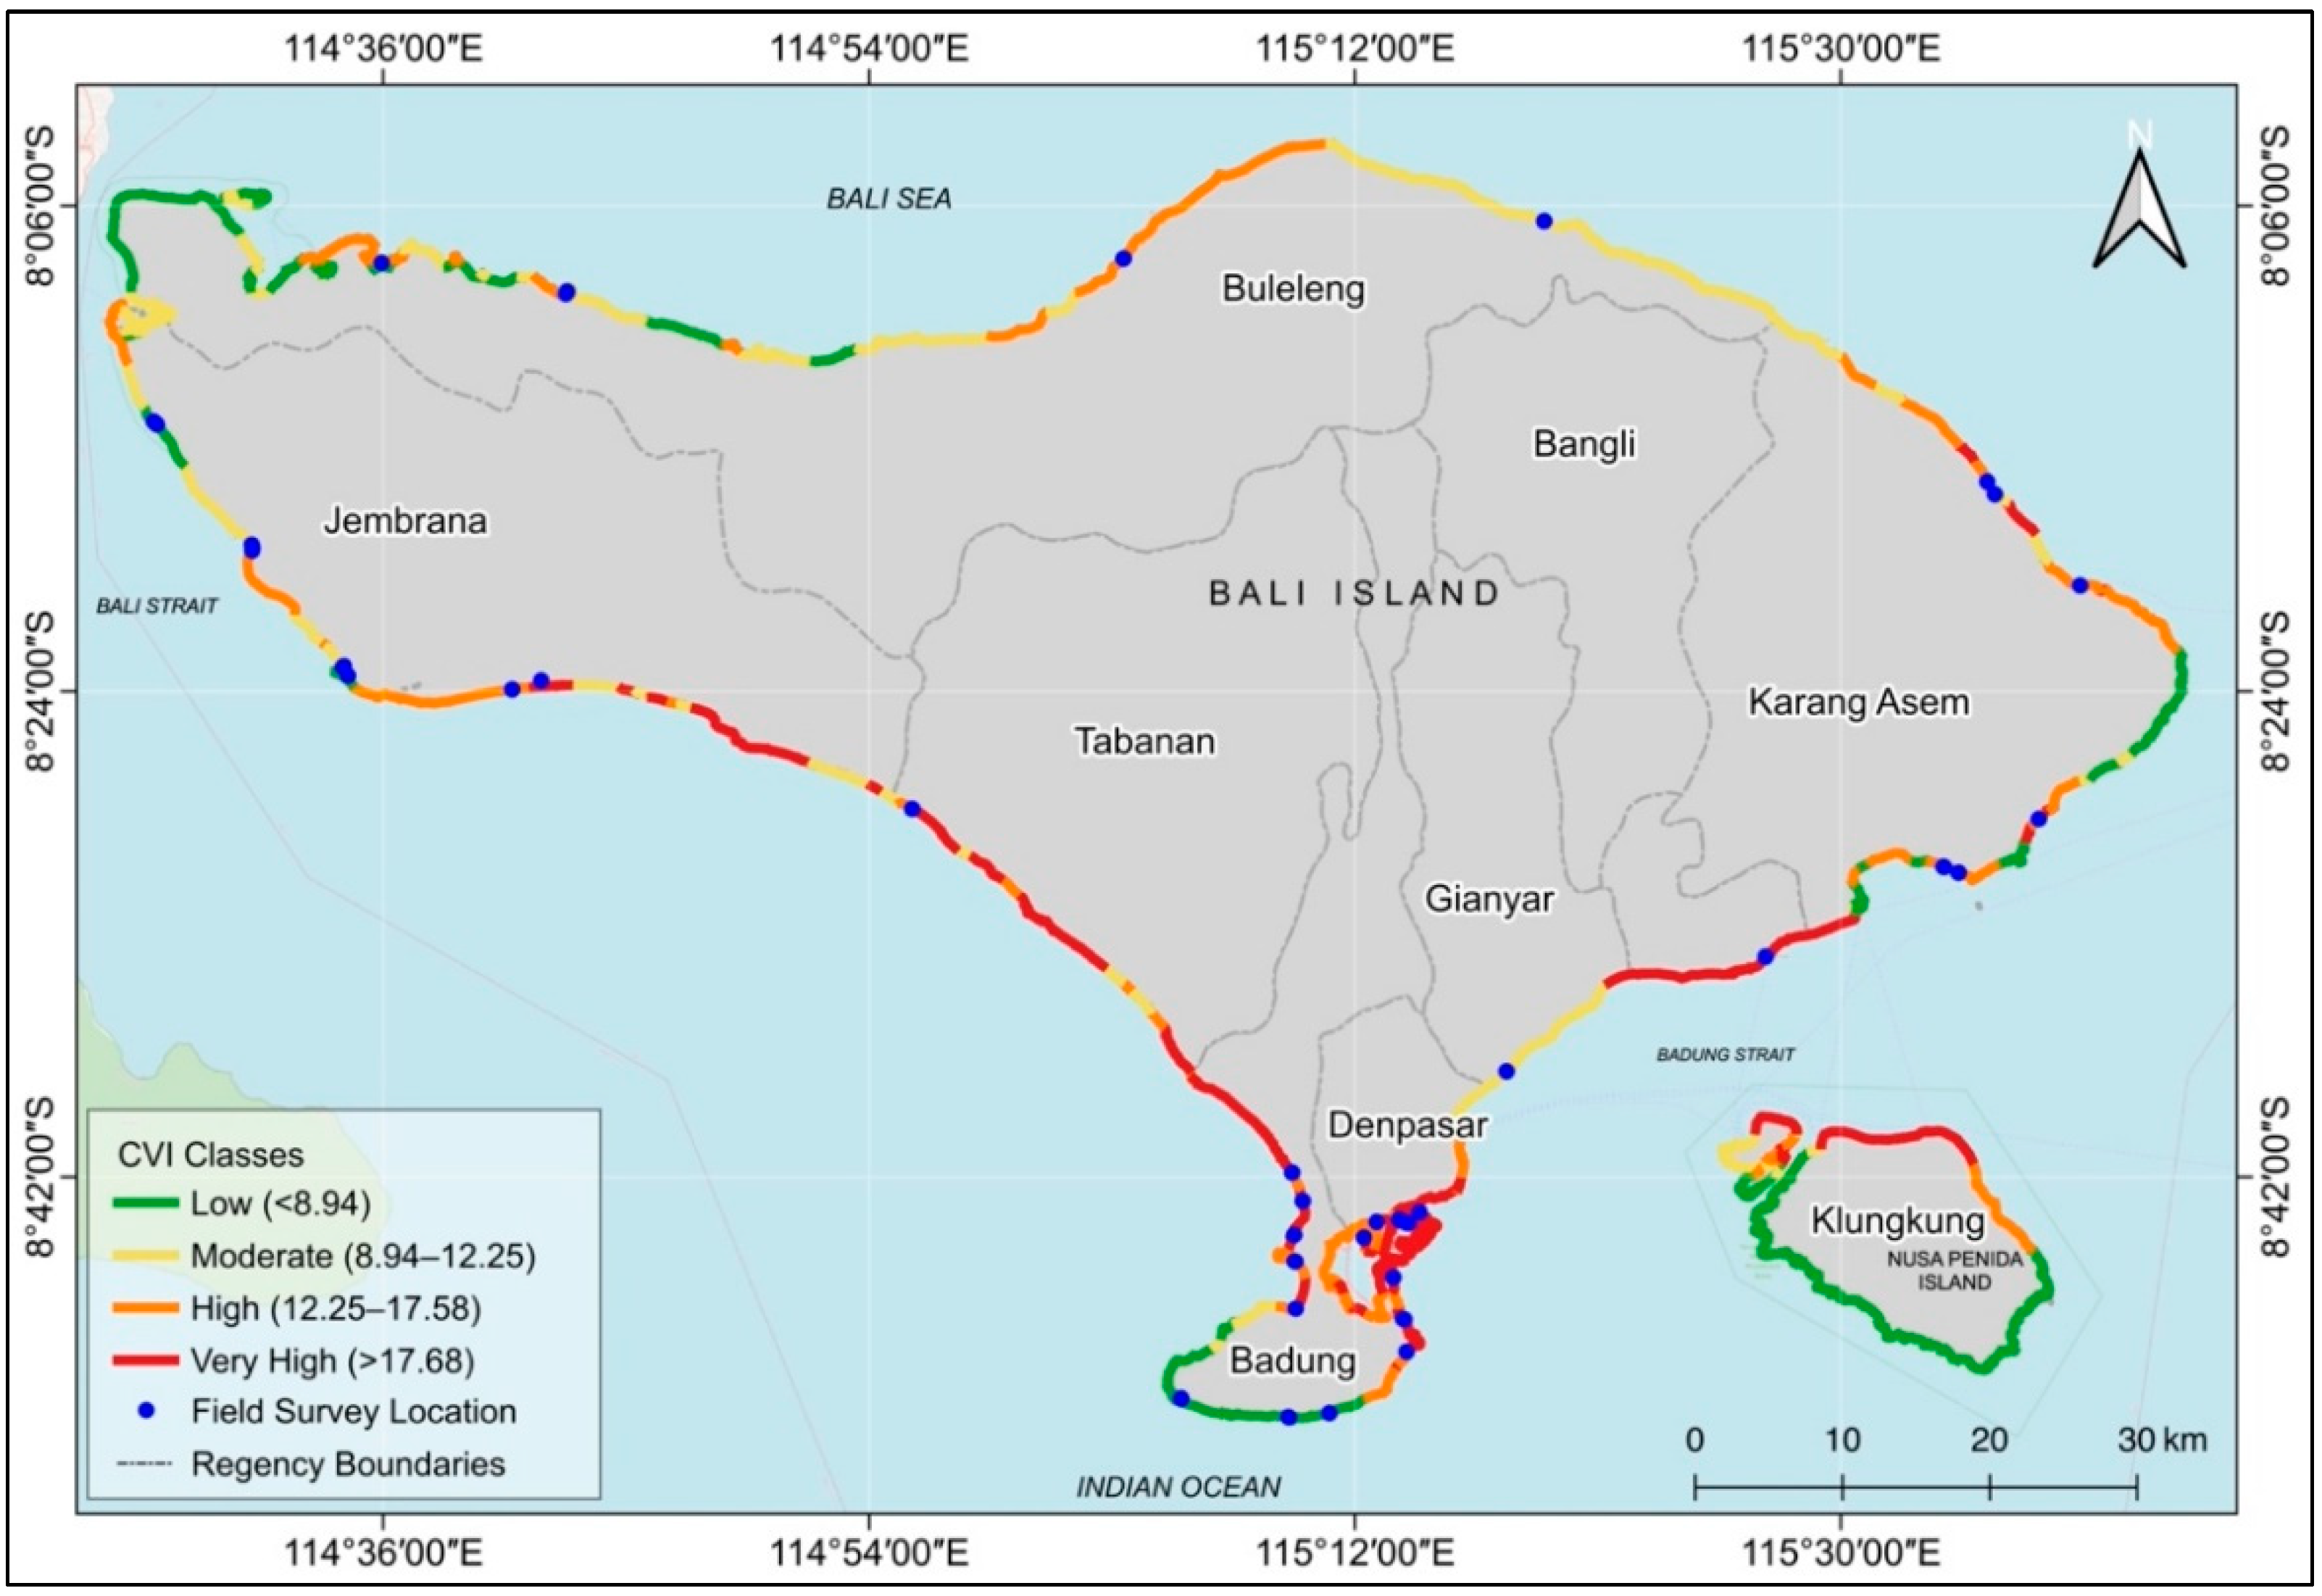
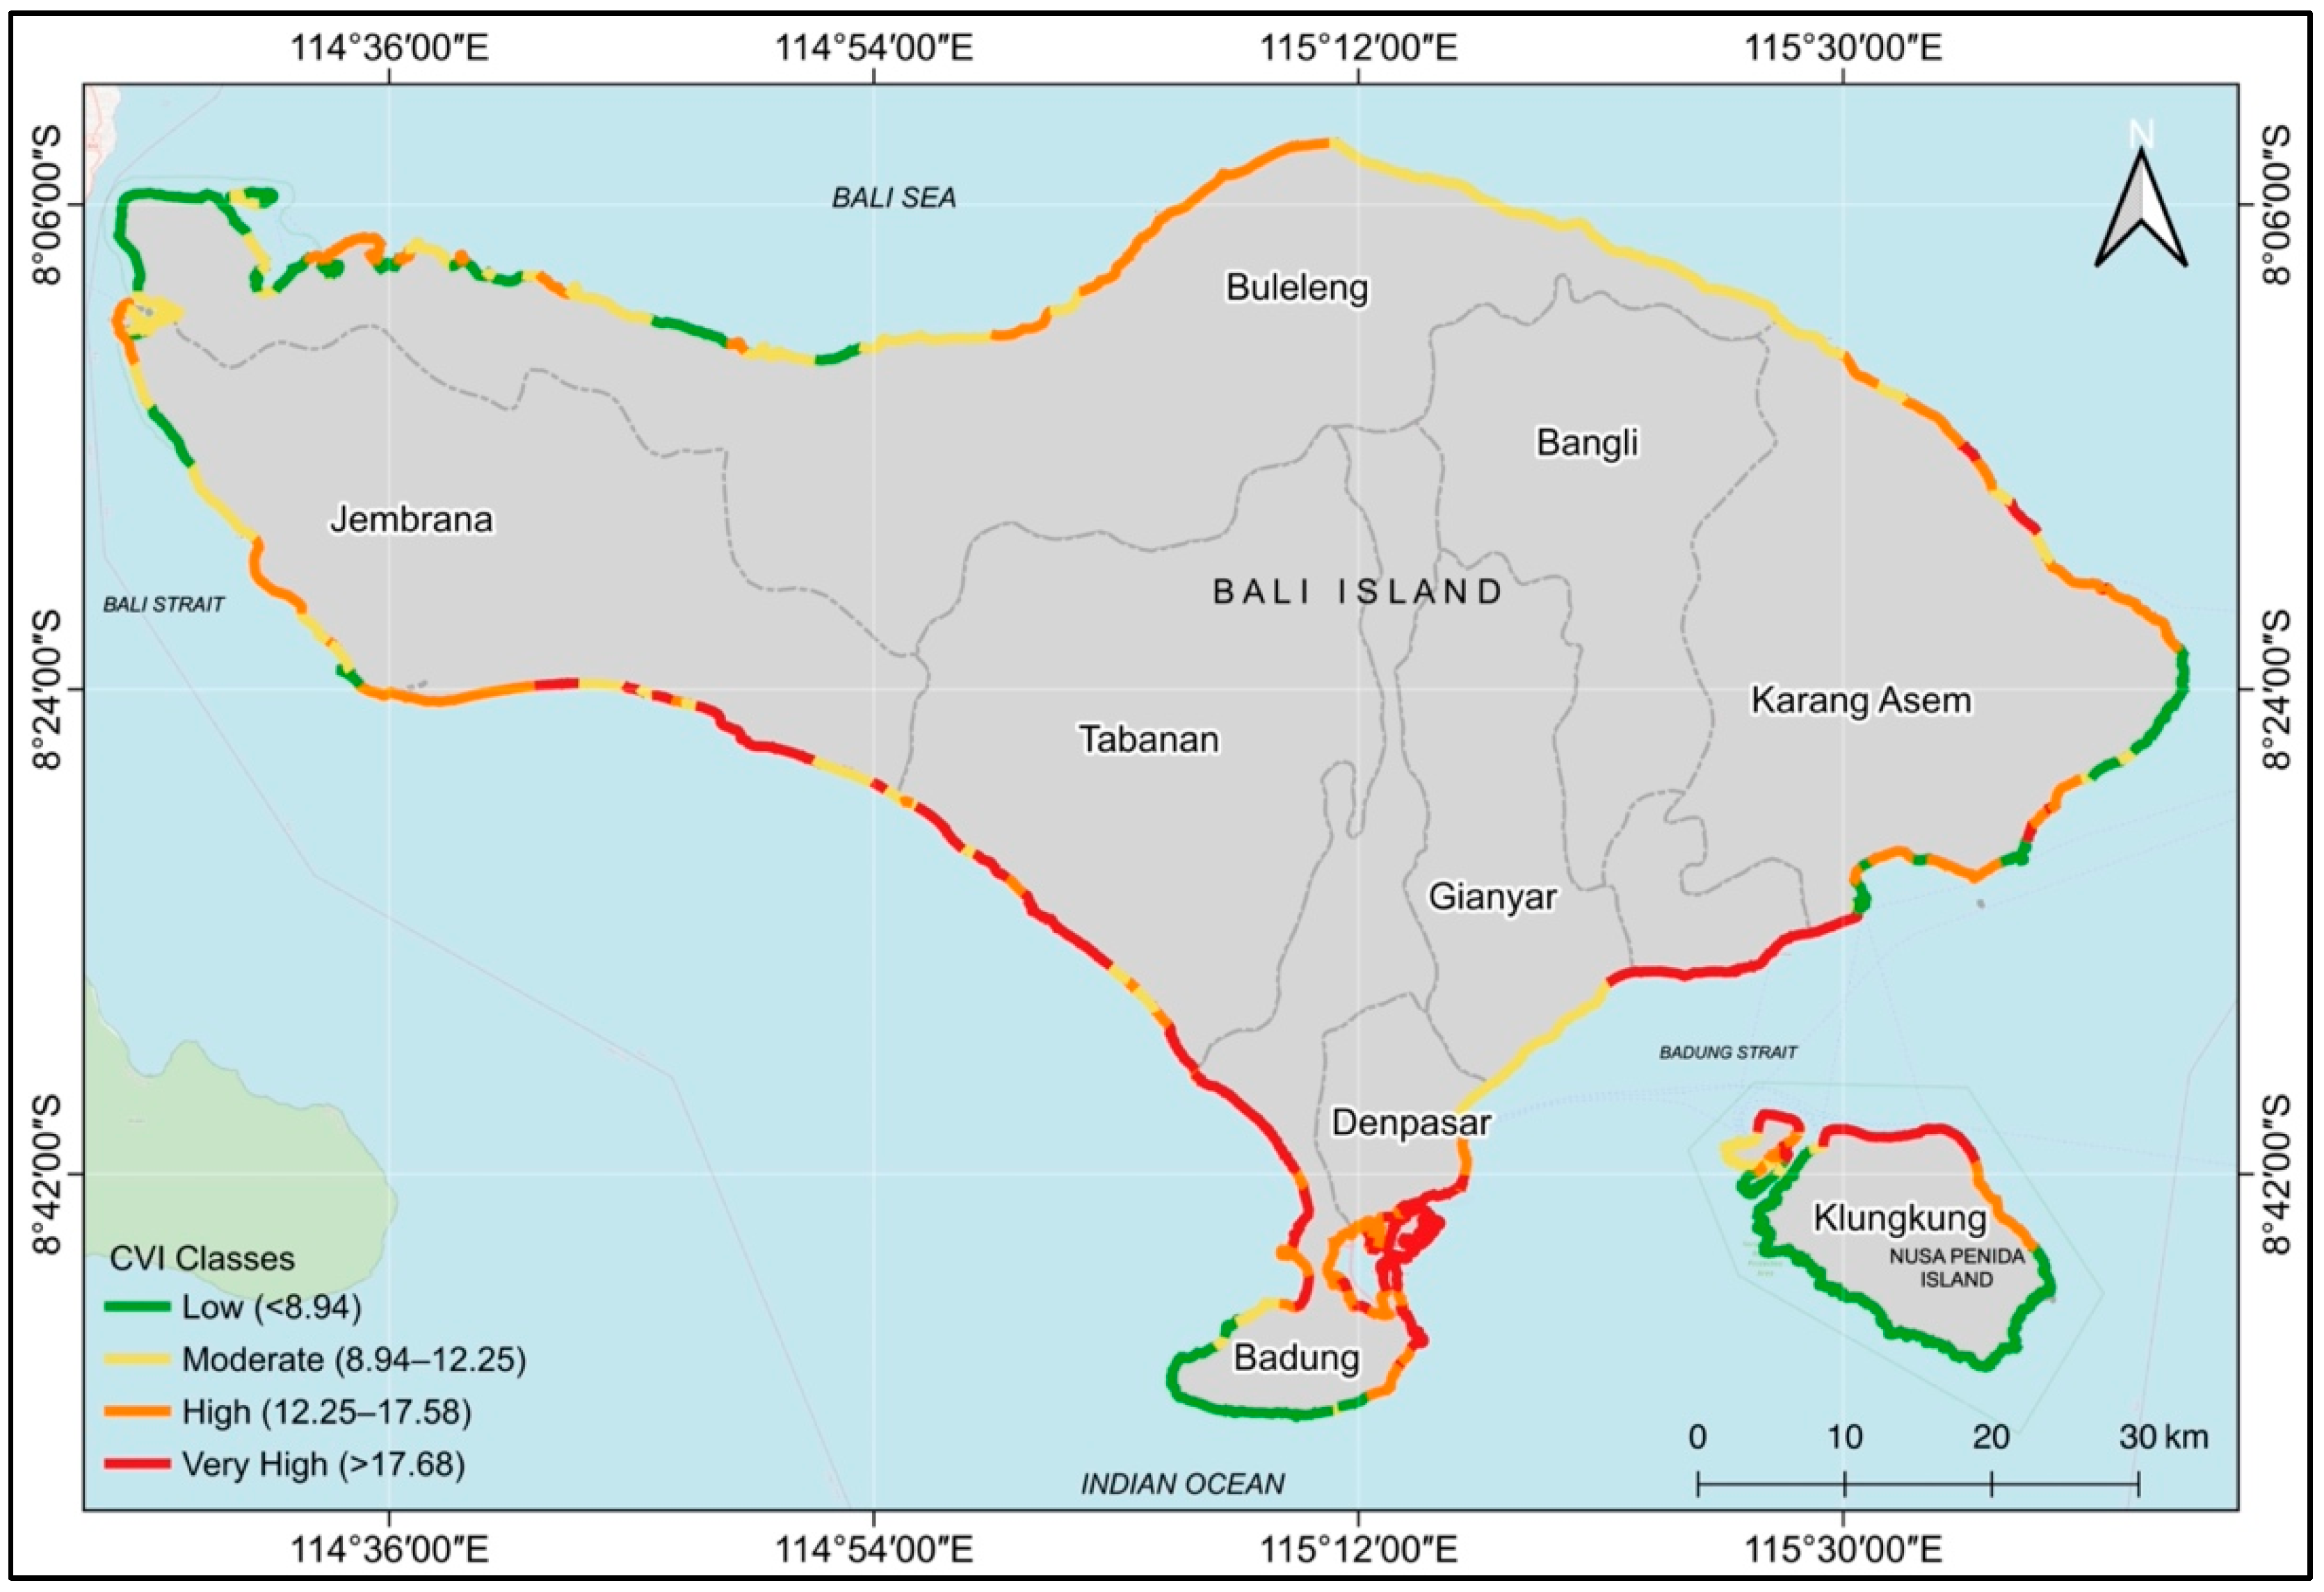
4.7. Coastal Vulnerability Index of Bali Province
5. Conclusions
Author Contributions
Funding
Data Availability Statement
Acknowledgments
Conflicts of Interest
References
- Rizzo, A.; Anfuso, G. Coastal Dynamic and Evolution: Case Studies from Different Sites around the World. Water 2020, 12, 2829. [Google Scholar] [CrossRef]
- Sui, L.; Wang, J.; Yang, X.; Wang, Z. Spatial-Temporal Characteristics of Coastline Changes in Indonesia from 1990 to 2018. Sustainability 2020, 12, 3242. [Google Scholar] [CrossRef]
- McGranahan, G.; Balk, D.; Anderson, B. The Rising Tide: Assessing the Risks of Climate Change and Human Settlements in Low Elevation Coastal Zones. Environ. Urban. 2007, 19, 17–37. [Google Scholar] [CrossRef]
- Pendleton, E.A.; Theiler, E.R.; Williams, S.J. Coastal Vulnerability Assessment of Gateway National Recreation Area (GATE) to Sea-Level Rise; Open-File Report 2004-1257; U.S. Geological Survey: USGS: Reston, VA, USA, 2005. [Google Scholar]
- Gracia, A.; Rangel-Buitrago, N.; Oakley, J.A.; Williams, A.T. Use of Ecosystems in Coastal Erosion Management. Ocean Coast Manag. 2018, 156, 277–289. [Google Scholar] [CrossRef]
- Grases, A.; Gracia, V.; García-León, M.; Lin-Ye, J.; Sierra, J.P. Coastal Flooding and Erosion under a Changing Climate: Implications at a Low-Lying Coast (Ebro Delta). Water 2020, 12, 346. [Google Scholar] [CrossRef]
- Nicholls, R.J. Coastal Flooding and Wetland Loss in the 21st Century: Changes under the SRES Climate and Socio-Economic Scenarios. Glob. Environ. Chang. 2004, 14, 69–86. [Google Scholar] [CrossRef]
- Torresan, S.; Critto, A.; Rizzi, J.; Marcomini, A. Assessment of Coastal Vulnerability to Climate Change Hazards at the Regional Scale: The Case Study of the North Adriatic Sea. Nat. Hazards Earth Syst. Sci. 2012, 12, 2347–2368. [Google Scholar] [CrossRef]
- Bhatia, K.; Vecchi, G.; Murakami, H.; Underwood, S.; Kossin, J. Projected Response of Tropical Cyclone Intensity and Intensification in a Global Climate Model. J. Clim. 2018, 31, 8281–8303. [Google Scholar] [CrossRef]
- Knutson, T.R.; McBride, J.L.; Chan, J.; Emanuel, K.; Holland, G.; Landsea, C.; Held, I.; Kossin, J.P.; Srivastava, A.K.; Sugi, M. Tropical Cyclones and Climate Change. Nat. Geosci. 2010, 3, 157–163. [Google Scholar] [CrossRef]
- Addo, K.A. Assessing Coastal Vulnerability Index to Climate Change: The Case of Accra—Ghana. J. Coast. Res. 2013, 165, 1892–1897. [Google Scholar] [CrossRef]
- Monbaliu, J.; Chen, Z.; Felts, D.; Ge, J.; Hissel, F.; Kappenberg, J.; Narayan, S.; Nicholls, R.J.; Ohle, N.; Schuster, D.; et al. Risk Assessment of Estuaries under Climate Change: Lessons from Western Europe. Coast. Eng. 2014, 87, 32–49. [Google Scholar] [CrossRef]
- Enríquez, A.; Marcos, M.; Álvarez-Ellacuría, A.; Orfila, A.; Gomis, D. Changes in Beach Shoreline Due to Sea Level Rise and Waves under Climate Change Scenarios: Application to the Balearic Islands (Western Mediterranean). Nat. Hazards Earth Syst. Sci. Discuss. 2016, 17, 1075–1089. [Google Scholar] [CrossRef]
- Nicholls, R.J. Impacts of and Responses to Sea-Level Rise. In Understanding Sea-Level Rise and Variability; Church, J.A., Woodworth, P.L., Aarup, T., Wilson, W.S., Eds.; Wiley Online Books; Blackwell Publishing Ltd.: Hoboken, NJ, USA, 2010; pp. 17–51. ISBN 9781444323276. [Google Scholar]
- Kulp, S.A.; Strauss, B.H. New Elevation Data Triple Estimates of Global Vulnerability to Sea-Level Rise and Coastal Flooding. Nat. Commun. 2019, 10, 4484. [Google Scholar]
- Hauer, M.E.; Hardy, D.; Kulp, S.A.; Mueller, V.; Wrathall, D.J.; Clark, P.U. Assessing Population Exposure to Coastal Flooding Due to Sea Level Rise. Nat. Commun. 2021, 12, 6900. [Google Scholar] [CrossRef] [PubMed]
- Neumann, B.; Vafeidis, A.T.; Zimmermann, J.; Nicholls, R.J. Future Coastal Population Growth and Exposure to Sea-Level Rise and Coastal Flooding—A Global Assessment. PLoS ONE 2015, 10, e0118571. [Google Scholar] [CrossRef] [PubMed]
- Mondal, P.; Tatem, A.J. Uncertainties in Measuring Populations Potentially Impacted by Sea Level Rise and Coastal Flooding. PLoS ONE 2012, 7, e48191. [Google Scholar]
- Pirazzoli, P.A. Sea Level Changes: The Last 20000 Years; Wiley: Chichester, UK, 1996; ISBN1 0471969133. ISBN2 9780471969136. [Google Scholar]
- Pye, K.; Blott, S.J. Coastal Processes and Morphological Change in the Dunwich-Sizewell Area, Suffolk, UK. J. Coast. Res. 2006, 22, 453–473. [Google Scholar] [CrossRef]
- Allen, T.R.; Crawford, T.; Montz, B.; Whitehead, J.; Lovelace, S.; Hanks, A.D.; Christensen, A.R.; Kearney, G.D. Linking Water Infrastructure, Public Health, and Sea Level Rise: Integrated Assessment of Flood Resilience in Coastal Cities. Public Works Manag. Policy 2019, 24, 110–139. [Google Scholar] [CrossRef]
- Monioudi, I.N.; Velegrakis, A.F.; Chatzipavlis, A.E.; Rigos, A.; Karambas, T.; Vousdoukas, M.I.; Hasiotis, T.; Koukourouvli, N.; Peduzzi, P.; Manoutsoglou, E.; et al. Assessment of Island Beach Erosion Due to Sea Level Rise: The Case of the Aegean Archipelago (Eastern Mediterranean). Nat. Hazards Earth Syst. Sci. 2017, 17, 449–466. [Google Scholar] [CrossRef]
- Dismukes, D.E.; Narra, S. Sea-Level Rise and Coastal Inundation: A Case Study of the Gulf Coast Energy Infrastructure. Nat. Resour. 2018, 9, 150–174. [Google Scholar] [CrossRef][Green Version]
- Gutierrez, B.T.; Williams, S.J.; Thieler, E.R. Ocean Coast. In Coastal Sensitivity to Sea-Level Rise: A Focus on the Mid-Atlantic Region; Titus, J.G., Anderson, K.E., Cahoon, D.R., Gesch, D.B., Gill, S.K., Gutierrez, B.T., Thieler, E.R., Williams, S.J., Eds.; U.S. Environmental Protection Agency: Washington, DC, USA, 2009; pp. 43–56. [Google Scholar]
- Hinkel, J.; Nicholls, R.J.; Tol, R.S.J.; Wang, Z.B.; Hamilton, J.M.; Boot, G.; Vafeidis, A.T.; McFadden, L.; Ganopolski, A.; Klein, R.J.T. A Global Analysis of Erosion of Sandy Beaches and Sea-Level Rise: An Application of DIVA. Glob. Planet. Chang. 2013, 111, 150–158. [Google Scholar] [CrossRef]
- NASA Satellite Sea Level Observation. Available online: https://climate.nasa.gov/vital-signs/sea-level/ (accessed on 22 December 2020).
- Church, J.A.; White, N.J. Sea-Level Rise from the Late 19th to the Early 21st Century. Surv. Geophys. 2011, 32, 585–602. [Google Scholar] [CrossRef]
- Brown, L.R. Rising Sea Level Forcing Evacuation of Island Country. Available online: http://www.earth-policy.org/plan_b_updates/2001/update2 (accessed on 22 December 2020).
- Nicholls, R.J. Planning for the impacts of sea level rise. Oceanography 2011, 24, 144–157. [Google Scholar] [CrossRef]
- Gornitz, V. Global Coastal Hazards from Future Sea Level Rise. Palaeogeogr. Palaeoclimatol. Palaeoecol. 1991, 89, 379–398. [Google Scholar] [CrossRef]
- Shaw, J.; Taylor, R.B.; Forbes, D.L. Sensitivity of the Coasts of Canada to Sea-Level Rise; Geological Survey of Canada: Ottawa, ON, Canada, 1998. [Google Scholar]
- Thieler, E.R.; Hammar-Klose, E.S. National Assessment of Coastal Vulnerability to Sea-Level Rise; U.S. Atlantic Coast; Open-File Report 99-593; USGS: Woods Hole, MA, USA, 1999. [Google Scholar]
- Thieler, E.R.; Hammar-Klose, E.S. National Assessment of Coastal Vulnerability to Sea-Level Rise; Preliminary Results for the U.S. Gulf of Mexico Coast; Open-File Report 2000-179; USGS: Woods Hole, MA, USA, 2000. [Google Scholar]
- Thieler, E.R.; Hammar-Klose, E.S. National Assessment of Coastal Vulnerability to Sea-Level Rise; Preliminary Results for the U.S. Pacific Coast; Open-File Report 2000-178; USGS: Woods Hole, MA, USA, 2000. [Google Scholar]
- Hammar-Klose, E.S.; Thieler, E.R. Coastal Vulnerability to Sea-Level Rise: A Preliminary Database for the U.S. Atlantic, Pacific, and Gulf of Mexico Coasts; Data Series 68; USGS: Woods Hole, MA, USA, 2001. [Google Scholar]
- Pendleton, E.A.; Theiler, E.R.; Williams, S.J. Coastal Vulnerability Assessment of Cape Hatteras National Seashore (CAHA) to Sea-Level Rise; Open-File Report 2004-1064; USGS: Reston, VA, USA, 2004. [Google Scholar]
- Pendleton, E.A.; Hammar-Klose, E.S.; Thieler, E.R.; Williams, S.J. Coastal Vulnerability Assessment of Gulf Islands National Seashore (GUIS) to Sea-Level Rise; Open-File Report 03-108; USGS: Reston, VA, USA, 2004; Volume 3. [Google Scholar]
- Pendleton, E.A.; Theiler, E.R.; Williams, S.J. Coastal Vulnerability Assessment of National Park of American Samoa (NPSA) to Sea-Level Rise; Open-File Report 2005-1055; USGS: Reston, VA, USA, 2005. [Google Scholar]
- Pendleton, E.A.; Theiler, E.R.; Williams, S.J. Coastal Vulnerability Assessment of Kaloko-Honokohau National Historical Park to Sea-Level Rise; Open-File Report 2005-1248; USGS: Reston, VA, USA, 2005. [Google Scholar]
- Hammar-Klose, E.S.; Pendleton, E.A.; Thieler, E.R.; Williams, S.J.; Norton, G.A. Coastal Vulnerability Assessment of Cape Cod National Seashore (CACO) to Sea-Level Rise; Open-File Report 02-233; USGS: Reston, VA, USA, 2003. [Google Scholar]
- Boruff, B.J.; Emrich, C.; Cutter, S.L. Erosion Hazard Vulnerability of US Coastal Counties. J. Coast. Res. 2005, 21, 932–942. [Google Scholar] [CrossRef]
- Doukakis, E. Coastal Vulnerability and Risk Parameters. Eur. Water 2005, 11, 3–7. [Google Scholar]
- Diez, P.G.; Perillo, G.M.E.; Piccolo, M.C. Vulnerability to Sea-Level Rise on the Coast of the Buenos Aires Province. J. Coast. Res. 2007, 2007, 119–126. [Google Scholar] [CrossRef]
- Rao, K.N.; Subraelu, P.; Rao, T.V.; Malini, B.H.; Ratheesh, R.; Bhattacharya, S.; Rajawat, A.S. Ajai Sea-Level Rise and Coastal Vulnerability: An Assessment of Andhra Pradesh Coast, India through Remote Sensing and GIS. J. Coast. Conserv. 2009, 12, 195–207. [Google Scholar]
- Özyurt, G.; Ergin, A. Improving Coastal Vulnerability Assessments to Sea-Level Rise: A New Indicator-Based Methodology for Decision Makers. J. Coast. Res. 2010, 26, 265–273. [Google Scholar] [CrossRef]
- Abuodha, P.A.; Woodroffe, C.D. Assessing Vulnerability of Coasts to Climate Change: A Review of Approaches and Their Application to the Australian Coast. In Proceedings of the GIS for the Coastal Zone: A Selection of Papers from CoastGIS 2006; Woodroffe, C., Bruce, E., Poutinen, M., Furness, R., Eds.; University of Wollongong: Wollongong, Australia, 2006; p. 458. [Google Scholar]
- Kumar, A.A.; Kunte, P. Coastal Vulnerability Assessment for Chennai, East Coast of India Using Geospatial Techniques. Nat. Hazards J. Int. Soc. Prev. Mitig. Nat. Hazards 2012, 64, 853–872. [Google Scholar]
- Bahinipati, C.S. Assessment of Vulnerability to Cyclones and Floods in Odisha, India: A District-Level Analysis. Curr. Sci. 2014, 107, 1997–2007. [Google Scholar]
- Bagdanavičiute, I.; Kelpšaite, L.; Soomere, T. Multi-Criteria Evaluation Approach to Coastal Vulnerability Index Development in Micro-Tidal Low-Lying Areas. Ocean Coast. Manag. 2015, 104, 124–135. [Google Scholar] [CrossRef]
- Royo, M.L.; Ranasinghe, R.; Jiménez, J.A. A Rapid, Low-Cost Approach to Coastal Vulnerability Assessment at a National Level. J. Coast. Res. 2016, 32, 932–945. [Google Scholar] [CrossRef]
- Sahoo, B.; Bhaskaran, P.K. Multi-Hazard Risk Assessment of Coastal Vulnerability from Tropical Cyclones—A GIS Based Approach for the Odisha Coast. J. Environ. Manag. 2018, 206, 1166–1178. [Google Scholar] [CrossRef]
- Zhu, Z.T.; Cai, F.; Chen, S.L.; Gu, D.Q.; Feng, A.P.; Cao, C.; Qi, H.S.; Lei, G. Coastal Vulnerability to Erosion Using a Multi-Criteria Index: A Case Study of the Xiamen Coast. Sustainability 2018, 11, 93. [Google Scholar] [CrossRef]
- Lien, M.K. Vulnerability Assessment of Climate Change on Sea Level Rise Impacts on Some Economic Sectors in Binh Dinh Province, Vietnam. Am. J. Clim. Chang. 2019, 08, 302–324. [Google Scholar] [CrossRef]
- Jana, A.B.; Hegde, A.V. GIS Based Approach for Vulnerability Assessment of the Karnataka Coast, India. Adv. Civ. Eng. 2016, 2016, 5642523. [Google Scholar]
- Lawal, D.U.; Matori, A.N.; Hashim, A.M.; Chandio, I.A.; Sabri, S.; Balogun, A.L.; Abba, H.A. Geographic Information System and Remote Sensing Applications in Flood Hazards Management: A Review. Res. J. Appl. Sci. Eng. Technol. 2011, 3, 933–947. [Google Scholar]
- Res, C.; Wu, S.; Yarnal, B.; Fisher, A. Vulnerability of Coastal Communities to Sea-Level Rise: A Case Study of Cape May County, New Jersey, USA. Clim. Res. 2002, 22, 255–270. [Google Scholar]
- Kantamaneni, K.; Du, X.; Aher, S.; Singh, R.M. Building Blocks: A Quantitative Approach for Evaluating Coastal Vulnerability. Water 2017, 9, 905. [Google Scholar] [CrossRef]
- Kantamaneni, K.; Phillips, M.; Thomas, T.; Jenkins, R. Assessing Coastal Vulnerability: Development of a Combined Physical and Economic Index. Ocean Coast. Manag. 2018, 158, 164–175. [Google Scholar] [CrossRef]
- Ojeda, J.; Álvarez, J.I.; Martín, D.; Fraile, P. El Uso de Las TIG Para El Cálculo Del Indice de Vulnerabilidad Costera (CVI) Ante Una Potencial Subida Del Nivel Del Mar En La Costa Andaluza (España). GeoFocus. Revista Internacional De Ciencia Y Tecnología De La Información Geográfica 2009, 9, 83–100. [Google Scholar]
- Garcia-Ayllon, S. Long-Term GIS Analysis of Seaside Impacts Associated to Infrastructures and Urbanization and Spatial Correlation with Coastal Vulnerability in a Mediterranean Area. Water 2018, 10, 1642. [Google Scholar] [CrossRef]
- Koroglu, A.; Ranasinghe, R.; Jiménez, J.A.; Dastgheib, A. Comparison of Coastal Vulnerability Index Applications for Barcelona Province. Ocean Coast. Manag. 2019, 178, 104799. [Google Scholar] [CrossRef]
- Narra, P.; Coelho, C.; Sancho, F. Multicriteria GIS-Based Estimation of Coastal Erosion Risk: Implementation to Aveiro Sandy Coast, Portugal. Ocean Coast. Manag. 2019, 178, 104845. [Google Scholar] [CrossRef]
- Rocha, C.; Antunes, C.; Catita, C. Coastal Vulnerability Assessment Due to Sea Level Rise: The Case Study of the Atlantic Coast of Mainland Portugal. Water 2020, 12, 360. [Google Scholar] [CrossRef]
- Boski, T.; Goy, J.L.; Zazo, C.; Dabrio, C.J.; Martínez-gra, A.M. Coastal-Flood Risk Management in Central Algarve: Vulnerability and Flood Risk Indices (South Portugal). Ecol. Indic. 2016, 71, 302–316. [Google Scholar]
- Pantusa, D.; D’Alessandro, F.; Riefolo, L.; Principato, F.; Tomasicchio, G.R. Application of a Coastal Vulnerability Index. A Case Study along the Apulian Coastline, Italy. Water 2018, 10, 1218. [Google Scholar] [CrossRef]
- Ružić, I.; Jovančević, S.D.; Benac, Č.; Krvavica, N. Assessment of the Coastal Vulnerability Index in an Area of Complex Geological Conditions on the Krk Island, Northeast Adriatic Sea. Geosciences 2019, 9, 219. [Google Scholar] [CrossRef]
- Tragaki, A.; Gallousi, C.; Karymbalis, E. Coastal Hazard Vulnerability Assessment Based on Geomorphic, Oceanographic and Demographic Parameters: The Case of the Peloponnese (Southern Greece). Land 2018, 7, 56. [Google Scholar] [CrossRef]
- Ghoussein, Y.; Mhawej, M.; Jaffal, A.; Fadel, A.; el Hourany, R.; Faour, G. Vulnerability Assessment of the South-Lebanese Coast: A GIS-Based Approach. Ocean Coast. Manag. 2018, 158, 56–63. [Google Scholar] [CrossRef]
- El Hage, M.; Faour, G.; Polidori, L. L’Impact De L’Elevation Du Niveau De La Mer (2000–2100) Sur Le Littoral Libanais Une Approche Par Teledetection et Cartographie Diachronique. Rev. Fr. De Photogramm. De Teledetect. 2011, 194, 36. [Google Scholar]
- Oloyede, M.O.; Williams, A.B.; Ode, G.O.; Benson, N.U. Coastal Vulnerability Assessment: A Case Study of the Nigerian Coastline. Sustainability 2022, 14, 2097. [Google Scholar] [CrossRef]
- Osman, A.; Nyarko, B.K.; Mariwah, S. Vulnerability and Risk Levels of Communities within Ankobra Estuary of Ghana. Int. J. Disaster Risk Reduct. 2016, 19, 133–144. [Google Scholar] [CrossRef]
- Palmer, B.J.; van der Elst, R.; Mackay, F.; Mather, A.A.; Smith, A.M.; Bundy, S.C.; Thackeray, Z.; Leuci, R.; Parak, O. Preliminary Coastal Vulnerability Assessment for KwaZulu-Natal, South Africa. J. Coast. Res. 2011, 64, 1390–1395. [Google Scholar]
- Dwarakish, G.S.; Vinay, S.A.; Natesan, U.; Asano, T.; Kakinuma, T.; Venkataramana, K.; Pai, B.J.; Babita, M.K. Coastal Vulnerability Assessment of the Future Sea Level Rise in Udupi Coastal Zone of Karnataka State, West Coast of India. Ocean Coast. Manag. 2009, 52, 467–478. [Google Scholar] [CrossRef]
- Kumar, T.S.; Mahendra, R.S.; Nayak, S.; Radhakrishnan, K.; Sahu, K.C. Coastal Vulnerability Assessment for Orissa State, East Coast of India. J. Coast. Res. 2010, 26, 523–534. [Google Scholar] [CrossRef]
- Rani, M.; Rehman, S.; Sajjad, H.; Chaudhary, B.S.; Sharma, J.; Bhardwaj, S.; Kumar, P. Assessing Coastal Landscape Vulnerability Using Geospatial Techniques along Vizianagaram–Srikakulam Coast of Andhra Pradesh, India. Nat. Hazards 2018, 94, 711–725. [Google Scholar] [CrossRef]
- Joevivek, V.; Saravan, S.; Chandrasekar, N. Coastal Vulnerability and Shoreline Changes for Southern Tip of India-Remote Sensing and GIS Approach. J. Earth Sci. Clim. Chang. 2013, 4, 2. [Google Scholar]
- Kunte, P.D.; Jauhari, N.; Mehrotra, U.; Kotha, M.; Hursthouse, A.S.; Gagnon, A.S. Multi-Hazards Coastal Vulnerability Assessment of Goa, India, Using Geospatial Techniques. Ocean Coast. Manag. 2014, 95, 264–281. [Google Scholar] [CrossRef]
- Sankari, T.S.; Chandramouli, A.R.; Gokul, K.; Surya, S.S.M.; Saravanavel, J. Coastal Vulnerability Mapping Using Geospatial Technologies in Cuddalore-Pichavaram Coastal Tract, Tamil Nadu, India. Aquat. Procedia 2015, 4, 412–418. [Google Scholar] [CrossRef]
- Islam, M.A.; Hossain, M.S.; Murshed, S. Assessment of Coastal Vulnerability Due to Sea Level Change at Bhola Island, Bangladesh: Using Geospatial Techniques. J. Indian Soc. Remote Sens. 2015, 43, 625–637. [Google Scholar] [CrossRef]
- Islam, M.A.; Mitra, D.; Dewan, A.; Akhter, S.H. Coastal Multi-Hazard Vulnerability Assessment along the Ganges Deltaic Coast of Bangladesh-A Geospatial Approach. Ocean Coast. Manag. 2016, 127, 1–15. [Google Scholar] [CrossRef]
- Islam, S.M.S.; Tanim, A.H.; Mullick, M.R.A. Vulnerability Assessment of Bangladesh Coastline Using Gornitz Method. In Water, Flood Management and Water Security Under a Changing Climate; Haque, A., Chowdhury, A.I.A., Eds.; Springer International Publishing: Cham, Switzerland, 2020; pp. 301–313. [Google Scholar]
- Lee, Y. Coastal Planning Strategies for Adaptation to Sea Level Rise: A Case Study of Mokpo, Korea. J. Build. Const. Plan. Res. 2014, 2, 74–81. [Google Scholar] [CrossRef]
- Yin, J.; Yin, Z.; Wang, J.; Xu, S. National Assessment of Coastal Vulnerability to Sea-Level Rise for the Chinese Coast. J. Coast. Conserv. 2012, 16, 123–133. [Google Scholar] [CrossRef]
- Gill, J.A.; Anwar, A.M.; Omar, K.S. Towards the Implementation of Continuous Coastal Vulnerability Index in Malaysia: A Review. Jurnal Teknologi 2014, 71, 1–10. [Google Scholar]
- Mohd, F.A.; Maulud, K.N.A.; Karim, O.A.; Begum, R.A.; Khan, M.F.; Jaafar, W.S.W.M.; Abdullah, S.M.S.; Toriman, M.E.; Kamarudin, M.K.A.; Gasim, M.B.; et al. An Assessment of Coastal Vulnerability of Pahang’s Coast Due to Sea Level Rise. Int. J. Eng. Technol. 2018, 7, 176–180. [Google Scholar] [CrossRef][Green Version]
- Husnayaen; Rimba, A.B.; Osawa, T.; Parwata, I.N.S.; As-syakur, A.R.; Kasim, F.; Astarini, I.A. Physical Assessment of Coastal Vulnerability under Enhanced Land Subsidence in Semarang, Indonesia, Using Multi-Sensor Satellite Data. Adv. Space Res. 2018, 61, 2159–2179. [Google Scholar] [CrossRef]
- Imran, Z.; Sugiarto, S.W.; Muhammad, A.N. Coastal Vulnerability Index Aftermath Tsunami in Palu Bay, Indonesia. IOP Conf. Ser. Earth Environ. Sci. 2020, 420, 012014. [Google Scholar] [CrossRef]
- Irham, M.; Rusydi, I.; Haridhi, H.A.; Setiawan, I.; Ilhamsyah, Y.; Deli, A.; Rusdi, M.; Annisa, M.S. Marine Science and Engineering Coastal Vulnerability of the West Coast of Aceh Besar: A Coastal Morphology Assessment. J. Mar. Sci. Eng. 2021, 9, 815. [Google Scholar] [CrossRef]
- Government of Bali Province. Laporan Status Lingkungan Hidup Daerah Provinsi Bali 2015; Government of Bali Province: Denpasar, Indonesia, 2015; pp. 39–46. [Google Scholar]
- Sutawa, G.K. Issues on Bali Tourism Development and Community Empowerment to Support Sustainable Tourism Development. Procedia Econ. Financ. 2012, 4, 413–422. [Google Scholar] [CrossRef]
- Valdemoro, H.I.; Jiménez, J.A. The Influence of Shoreline Dynamics on the Use and Exploitation of Mediterranean Tourist Beaches. Coast. Manag. 2006, 34, 405–423. [Google Scholar] [CrossRef]
- Jiménez, J.A.; Osorio, A.; Marino-Tapia, I.; Davidson, M.; Medina, R.; Kroon, A.; Archetti, R.; Ciavola, P.; Aarnikhof, S.G.J. Beach Recreation Planning Using Video-Derived Coastal State Indicators. Coast. Eng. 2007, 54, 507–521. [Google Scholar] [CrossRef]
- Anfuso, G.; Williams, A.T.; Cabrera Hernández, J.A.; Pranzini, E. Coastal Scenic Assessment and Tourism Management in Western Cuba. Tour. Manag. 2014, 42, 307–320. [Google Scholar] [CrossRef]
- Birkman, J. (Ed.) Measuring Vulnerability to Promote Disaster-Resilient Societies: Conceptual Frameworks and Definitions; United Nations University Press: Tokyo, Japan, 2013; pp. 9–54. [Google Scholar]
- Badan Pusat Statistik—Statistics of Bali Province. Provinsi Bali Dalam Angka 2020; BPS-Statistic of Bali Province: Denpasar, Indonesia, 2020; pp. 1–98. [Google Scholar]
- Pendleton, E.A.; Thieler, E.R.; Williams, S.J. Importance of Coastal Change Variables in Determining Vulnerability to Sea- and Lake-Level Change. J. Coast. Res. 2010, 26, 176–183. [Google Scholar] [CrossRef]
- Gornitz, V.M.; White, T.W.; Daniels, D.C. A Coastal Hazards Data Base for the U.S. West Coast; Oak Ridge National Laboratory: Oak Ridge, TN, USA, 1997; pp. 1–40. [Google Scholar]
- Gornitz, V.M.; Kanciruk, P. Assessment of Global Coastal Hazards from Sea Level Rise; Oak Ridge National Laboratory: Oak Ridge, TN, USA, 1989; pp. 1–15. [Google Scholar]
- Van Zomeren, C.; Acevedo-Mackey, D. A Review of Coastal Vulnerability Assessments: Definitions, Components, and Variables. In Ecosystem Management and Restoration Research Program; U.S. Army Engineer Research and Development Center: Vicksburg, MS, USA, 2019; pp. 1–36. [Google Scholar]
- Domínguez, L.; Anfuso, G.; Gracia, F.J. Vulnerability Assessment of a Retreating Coast in SW Spain. Environ. Geol. 2005, 47, 1037–1044. [Google Scholar] [CrossRef]
- Gandhi, S.M.; Sarkar, B.C. Reconnaissance and Prospecting; Gandhi, S., Sarkar, B., Eds.; Elsevier: Amsterdam, The Netherlands, 2016; pp. 53–79. [Google Scholar]
- Geospatial Information Agency DEMNAS. Available online: https://tanahair.indonesia.go.id/demnas/#/ (accessed on 23 July 2020).
- McLaughlin, S.; Cooper, J.A.G. A Multi-Scale Coastal Vulnerability Index: A Tool for Coastal Managers? Environ. Hazard 2010, 9, 233–248. [Google Scholar] [CrossRef]
- Chaib, W.; Guerfi, M.; Hemdane, Y. Evaluation of Coastal Vulnerability and Exposure to Erosion and Submersion Risks in Bou Ismail Bay (Algeria) Using the Coastal Risk Index (CRI). Arab. J. Geosci. 2020, 13, 420. [Google Scholar] [CrossRef]
- Haigh, I.D. Tides and Water Levels. In Encyclopedia of Maritime and Offshore Engineering; Carlton, J., Jukes, P., Choo, Y.S., Eds.; John Wiley & Sons, Ltd.: Hoboken, NJ, USA, 2017; pp. 1–13. [Google Scholar]
- FitzGerald, D.M.; Fenster, M.S.; Argow, B.A.; Buynevich, I.V. Coastal Impacts Due to Sea-Level Rise. Annu. Rev. Earth Planet. Sci. 2008, 36, 601–647. [Google Scholar] [CrossRef]
- Zhang, K.; Douglas, B.C.; Leatherman, S.P. Global Warming and Coastal Erosion. Clim. Chang. 2004, 64, 41–58. [Google Scholar] [CrossRef]
- Nicholls, R.J.; Cazenave, A. Sea-Level Rise and Its Impact on Coastal Zones. Science 2010, 328, 1517–1520. [Google Scholar] [CrossRef] [PubMed]
- Rani, N.N.V.S.; Satyanarayana, A.N.V.; Bhaskaran, P.K. Coastal Vulnerability Assessment Studies over India: A Review. Nat. Hazards 2015, 77, 405–428. [Google Scholar] [CrossRef]
- Gornitz, V.M.; Daniels, R.C.; White, T.W.; Birdwell, K.R. The Development of a Coastal Risk Assessment Database: Vulnerability to Sea-Level Rise in the U.S. Southeast. J. Coast. Res. 1994, 12, 327–338. [Google Scholar]
- Tano, R.A.; Aman, A.; Toualy, E.; Kouadio, Y.K.; François-Xavier, B.B.D.; Addo, K.A. Development of an Integrated Coastal Vulnerability Index for the Ivorian Coast in West Africa. J. Environ. Prot. Sci. 2018, 9, 1171–1184. [Google Scholar] [CrossRef]
- Fok, H.S. Theory of Ocean Tides and Tidal Analysis. In Ocean Tides Modeling using Satellite Altimetry; Ohio State University: Mansfield, OH, USA, 2012; pp. 8–21. [Google Scholar]
- Gornitz, V.; White, T.W.; Cushman, R.M. Vulnerability of the U.S. to Future Sea-Level Rise; Oak Ridge National Laboratory: Oak Ridge, TN, USA, 1991; pp. 1–15. [Google Scholar]
- Thieler, E.R. National Assessment of Coastal Vulnerability to Future Sea-Level Rise; Fact Sheet 076-00; USGS: Woods Hole, MA, USA, 2000. [Google Scholar]
- Fitzpatrick-Lins, K. Comparison of Sampling Procedures and Data Analysis for a Land- Use and Land-Cover Map. Photogramm. Eng. Remote Sens. 1981, 47, 343–351. [Google Scholar]
- Congalton, R.G.; Oderwald, R.G.; Mead, R.A. Assessing Landsat Classification Accuracy Using Discrete Multivariate Analysis Statistical Techniques. Photogramm. Eng. Remote Sens. 1983, 49, 1671–1678. [Google Scholar]
- Rosenfield, G.H.; Fitzpatrick-Lins, K. A Coefficient of Agreement as a Measure of Thematic Classification Accuracy. Photogramm. Eng. Remote Sens. 1986, 52, 223–227. [Google Scholar]
- Lillesand, T.M.; Kiefer, R.W.; Chipman, J.W. Digital Image Processing. In Remote Sensing and Image Interpretation; Flahive, R., Powell, D., Eds.; John Wiley & Sons, Inc.: Hoboken, NJ, USA, 2004; pp. 491–637. ISBN 0471152277. [Google Scholar]
- Cohen, J. A Coefficient of Agreement for Nominal Scales. Educ. Psychol. Meas. 1960, 20, 37–46. [Google Scholar] [CrossRef]
- Sim, J.; Wright, C.C. The Kappa Statistic in Reliability Studies: Use, Interpretation, and Sample Size Requirements. Phys. Ther. 2005, 85, 257–268. [Google Scholar] [CrossRef]
- Short, A.D. Cliffed Coast. In Beaches and Coastal Geology; Schwartz, M., Ed.; Springer: New York, NY, USA, 1984; pp. 223–224. ISBN 978-0-387-30843-2. [Google Scholar]
- Putra, I.K.S.W.; Yujana, C.A.; Surayasa, N. Perencanaan Bangunan Pengaman Pantai (Revetment) Dengan Bahan Geobag Di Pantai Masceti, Kabupaten Gianyar. Paduraksa 2017, 6, 178–189. [Google Scholar]
- Wang, X.; Chen, W.; Zhang, L.; Jin, D.; Lu, C. Estimating the Ecosystem Service Losses from Proposed Land Reclamation Projects: A Case Study in Xiamen. Ecol. Econ. 2010, 69, 2549–2556. [Google Scholar] [CrossRef]
- Wang, G.; Liu, Y.; Wang, H.; Wang, X. A Comprehensive Risk Analysis of Coastal Zones in China. Estuar. Coast. Shelf Sci. 2014, 140, 22–31. [Google Scholar] [CrossRef]
- Muñoz-Pérez, J.J.; Medina, R.; Tejedor, B. Evolution of Longshore Beach Contour Lines Determined by the E.O.F. Method. Sci. Mar. 2001, 65, 393–402. [Google Scholar] [CrossRef]
- Rogers, K.; Woodroffe, C.D. Geomorphology as an Indicator of the Biophysical Vulnerability of Estuaries to Coastal and Flood Hazards in a Changing Climate. J. Coast. Conserv. 2016, 20, 127–144. [Google Scholar] [CrossRef]
- Unnikrishnan, A.S.; Shankar, D. Are Sea-Level-Rise Trends along the Coasts of the North Indian Ocean Consistent with Global Estimates? Glob. Planet. Change 2007, 57, 301–307. [Google Scholar] [CrossRef]
- Cooper, M.J.P.; Beevers, M.D.; Oppenheimer, M. The Potential Impacts of Sea Level Rise on the Coastal Region of New Jersey, USA. Clim. Chang. 2008, 90, 475–492. [Google Scholar] [CrossRef]
- Bird, E.C.F. Coastal Erosion and Rising Sea-Level. In Sea-Level Rise and Coastal Subsidence; Milliman, J., Haq, B., Eds.; Kluwer Academic Publisher: Dordrecht, The Netherlands, 1996; pp. 87–103. [Google Scholar]
- Feagin, R.A.; Sherman, D.J.; Grant, W.E. Coastal Erosion, Global Sea-Level Rise, and The Loss of Sand Dune Plant Habitats. Front. Ecol. Environ. 2005, 3, 359–364. [Google Scholar]
- Wyrtki, K. Tides and Tidal Currents. In Physical Oceanography of The Southeast Asian Waters; The University of California: La Jolla, CA, USA, 1961; pp. 155–163. [Google Scholar]
- Ubong, G.; Edak, E.; Odudu, E. Effects of Wind Speed and Direction on Ocean Waves along Ibeno Atlantic Ocean. Int. J. Adv. Sci. Res. 2017, 2, 113–118. [Google Scholar]
- Chen, S.; Qiao, F.; Jiang, W.; Guo, J.; Dai, D. Impact of Surface Waves on Wind Stress under Low to Moderate Wind Conditions. J. Phys. Oceanogr. 2019, 49, 2017–2028. [Google Scholar] [CrossRef]
- Leonardi, N.; Ganju, N.K.; Fagherazzi, S. A Linear Relationship between Wave Power and Erosion Determines Salt-Marsh Resilience to Violent Storms and Hurricanes. Proc. Natl. Acad. Sci. USA 2016, 113, 64–68. [Google Scholar] [CrossRef]
- Sallenger, A.H., Jr.; Krabill, W.; Brock, J.; Swift, R.; Manizade, S.; Stockdon, H. Sea-Cliff Erosion as a Function of Beach Changes and Extreme Wave Runup during the 1997-1998 El Nino. Mar. Geol. 2002, 187, 279–297. [Google Scholar] [CrossRef]
- Murray, A.B.; Ashton, A.D. Self-Organization of Large-Scale Coastline Shapes. Philos. Trans. R. Soc. A 2013, 371, 1–15. [Google Scholar] [CrossRef] [PubMed]
- Kasim, F.; Siregar, V.P. Coastal Vulnerability Assessment Using Integrated-Method of CVI-MCA: A Case Study on the Coastline of Indramayu. Forum Geogr. 2012, 26, 65–74. [Google Scholar] [CrossRef]


| Parameter | Data Source | Resolution | Time Period |
|---|---|---|---|
| Geomorphology | Land use data and geology map by BIG https://portal.ina-sdi.or.id/downloadaoi/ (accessed on 20 December 2020) | Scale 1:25 k | 2005 |
| Shoreline change rate (m/year) | Sentinel—2A imagery https://earthexplorer.usgs.gov/ (accessed on 15 July 2020) | 10 m | 2015 and 2019 |
| Elevation (m) | DEM imagery by BIG tides.big.go.id/DEMNAS/ (accessed 23 July 2020) | 0.27 arcsecond ~8.1 m | - |
| Sea level change rate (mm/year) | Tide gauge and satellite data https://ccar.colorado.edu/altimetry/index.html (accessed on 13 June 2020) | 1/6th deg | 1992–2019 |
| Tidal range (m) | Tide gauge data https://ccar.colorado.edu/altimetry/index.html (accessed on 2 August 2019) | - | 1998–2019 |
| Significant wave height (m) | Marine Copernicus data https://marine.copernicus.eu (accessed on 29 September 2020) | 0.2 deg ~22.2 km | 1993–2019 |
| Parameters | Very Low 1 | Low 2 | Moderate 3 | High 4 | Very High 5 |
|---|---|---|---|---|---|
| Geomorphology [44,96] | Rocky, Cliff coast, Fjords | Medium cliffs, Intended coasts | Low cliffs, Glacial drift, Alluvial plains | Cobble beaches, Estuary, Lagoon | Barrier beaches, Sand beaches, Saltmarsh, Mudflats, Deltas, Mangroves, Coral reefs |
| Shoreline change rate (m/year) [30] | ≥2.1 Accretion | 1.0 to 2.0 Accretion | −1.0 to 1.0 Stable | −1.1 to −2.0 Erosion | ≤−2.0 Erosion |
| Elevation (m) [30] | ≥30.1 | 20.1–30.0 | 10.1–20.0 | 5.1–10.0 | 0.0–5.0 |
| Sea level change rate (mm/year) [30] | ≤−1.1 Land rising | −1.0 to 0.99 Land rising | 1.0 to 2.0 within range of eustatic rise | 2.1 to 4.0 Land sinking | ≥4.1 Land sinking |
| Tidal range (m) [30,44] | ≤0.99 | 1.0–1.9 | 2.0–4.0 | 4.1–6.0 | ≥6.1 |
| Significant wave height (m) [44,96] | <0.55 | 0.55–0.85 | 0.85–1.05 | 1.05–1.25 | >1.25 |
Publisher’s Note: MDPI stays neutral with regard to jurisdictional claims in published maps and institutional affiliations. |
© 2022 by the authors. Licensee MDPI, Basel, Switzerland. This article is an open access article distributed under the terms and conditions of the Creative Commons Attribution (CC BY) license (https://creativecommons.org/licenses/by/4.0/).
Share and Cite
Hastuti, A.W.; Nagai, M.; Suniada, K.I. Coastal Vulnerability Assessment of Bali Province, Indonesia Using Remote Sensing and GIS Approaches. Remote Sens. 2022, 14, 4409. https://doi.org/10.3390/rs14174409
Hastuti AW, Nagai M, Suniada KI. Coastal Vulnerability Assessment of Bali Province, Indonesia Using Remote Sensing and GIS Approaches. Remote Sensing. 2022; 14(17):4409. https://doi.org/10.3390/rs14174409
Chicago/Turabian StyleHastuti, Amandangi Wahyuning, Masahiko Nagai, and Komang Iwan Suniada. 2022. "Coastal Vulnerability Assessment of Bali Province, Indonesia Using Remote Sensing and GIS Approaches" Remote Sensing 14, no. 17: 4409. https://doi.org/10.3390/rs14174409
APA StyleHastuti, A. W., Nagai, M., & Suniada, K. I. (2022). Coastal Vulnerability Assessment of Bali Province, Indonesia Using Remote Sensing and GIS Approaches. Remote Sensing, 14(17), 4409. https://doi.org/10.3390/rs14174409