Article

Assessment of Ecological Cumulative Effect due to Mining Disturbance Using Google Earth Engine

1
School of Land Science and Technology, China University of Geosciences, Beijing 100083, China
2
Key Laboratory of Monitoring and Protection of Natural Resources in Mining Cities, Ministry of Natural Resources, Coal Geological Geophysical Exploration Surveying & Mapping Institute of Shanxi Province, Jinzhong 030600, China
3
Shanxi Coal Geology Geophysical Surveying Exploration Institute, Shanxi Provincial Key Lab of Resources, Environment and Disaster Monitoring, Coal Geological Geophysical Exploration Surveying & Mapping Institute of Shanxi Province, Jinzhong 030600, China
4
Institute of Aerospace Information, Space Engineering University, Beijing 101416, China
5
Shanxi Geological Environment Monitoring and Ecological Restoration Center, Taiyuan 030024, China
6
Department of Land Management, Zhejiang University, Hangzhou 310058, China
*
Author to whom correspondence should be addressed.
Remote Sens. 2022, 14(17), 4381; https://doi.org/10.3390/rs14174381
Submission received: 27 June 2022 / Revised: 23 August 2022 / Accepted: 29 August 2022 / Published: 3 September 2022
(This article belongs to the Special Issue Remote Sensing Solutions for Mapping Mining Environments)

Abstract

:
Open-pit mining and reclamation damage the land, resulting in unknown and significant changes to the regional ecology and ecosystem services. Surface mining restoration procedures necessitate a significant amount of money, typically at an unclear cost. Due to temporal and regional variability, few studies have focused on the cumulative impacts of mining activities. To investigate the ecological cumulative effects (ECE) of past mining and reclamation activities, this study continuously tracked land cover changes spatially and temporally based on phenological indices and focuses on the spatial and temporal evolution of past mining and reclamation areas using the LandTrendr algorithm. The cumulative trends of ecosystem services in the Pingshuo mining area from 1986 to 2021 were revealed using a uniform standard value equivalent coefficient. Meanwhile, the cumulative ecological effects due to essential ecosystem service functions were analyzed, including soil formation and protection, water containment, biodiversity maintenance, climate regulation, and food production. The synergistic effects and trade-offs among the functions were also explored using Spearman’s correlation coefficient. The results showed that (1) open-pit mining resulted in 93.51 km2 of natural land, 39.60 km2 of disturbed land, and 44.58 km2 of reclaimed land in the Pingshuo mine; (2) open-pit mining in the mine mainly resulted in the loss of 122.18 km2 (80.91%) of native grassland, but, through reclamation into grassland (31.30 km2), cropland (72.95 km2), and forest land (10.62 km2), the damaged area caused by mining only slightly increased; (3) the cumulative ecological value of the mining area declined by 128.78 million RMB; however, the real cumulative value per unit area was lower in the disturbance area (1483.47 million RMB) and the reclamation area (1297.00 million RMB) than in the natural area (2120.98 million RMB); (4) the cumulative value of the food production function in the study area increased, although the values of all individual functions in the study area decreased. Most of the cumulative values of services had a strong synergistic relationship. However, in the natural area, food production (FP) showed a trade-off relationship with the cumulative value of biodiversity maintenance (BM), soil formation and protection (SP), and water conservation (WC) service functions, respectively. This study constructed a methodology for analyzing mining-impacted ecosystem services using time-series processes, reproducing historically complete information for policymakers and environmental regulators.

Graphical Abstract

1. Introduction

Coal resources have long been an essential fossil fuel for the global market, accounting for 64% of all extractable fossil resources and being one of the few commercial resource options available to many businesses (World Coal Association, https://www.worldcoal.org/coal-facts/) (accessed on 27 April 2021). As the world’s top importer and producer, China’s annual need for coal resources is as high as 3 billion tons, resulting in the exhaustion of a huge number of local open-pit coal mines [1]. This situation is expected to continue because of China’s high dependence on coal for energy consumption (World Energy Outlook 2020, https://www.iea.org/reports/world-energy-outlook-2020/outlook-for-energy-demand) (accessed on 24 April 2021). Such resource extraction activities cause severe damage to the land and ecological balance, such as air pollution, vegetation degradation, soil erosion, and biodiversity loss [2,3]. The impact of open-pit mining on ecosystems is the most severe and direct [4]. Therefore, it is necessary to monitor the effects of mining on the ecosystem and the responses of related ecosystem services to ensure the sustainable use of the mine and its surrounding ecosystems [5].
Open-pit coal mining, which entails the removal of vegetation, topsoil, and overlaying rock strata, is widely seen as having an enormous negative environmental impact [6]. Due to its long duration, large spatial range, and complex disturbance mechanism, this highly destructive type of disturbance makes it difficult to adequately identify changes in the natural environment in surface coal mining [7]. As a result, the coal business and ecologists have struggled to avoid discussing the evaluation of the ecological effects of mining sites [8,9]. Different forms of environmental impact assessment approaches for mining sites have arisen since the increase in the awareness of the vital link between mining activities and the natural ecology. These methods widely span both qualitative statistical analysis and quantitative spatial modeling. Literature reviews [10], expert consultation [11], fuzzy multilevel integrated evaluation [12], explanatory structural modeling [13], and the pressure–state–response model [14] are the main methods used in portraying the extensive and complex impacts of mining areas, and researchers then construct an index evaluation system and analyze the influence process. However, because qualitative analysis is frequently combined with human subjective thinking and the absence of precise geographical data, it might be difficult for different researchers to obtain uniform evaluation conclusions [15]. Land use change [16], the landscape pattern index [17], the remote sensing ecological index [18], and ecosystem service evaluation are some of the theoretical methodologies utilized in geospatial modeling [19]. The development of land ecological data, algorithms, and cloud computing technology represented by Google Earth Engine (GEE) has gradually resolved the issues of the mining cycle and disturbance borders that inhibited the environmental evaluation of mining zones in the past.
Due to the close relationship between land cover change and ecology, ecosystem services, as an essential concept for evaluating changes in human–land connections, are frequently featured in evaluations of ecological effects in mining regions [7,20]. They depict the spatial and temporal succession of land use as a result of human activity and the survival of natural capital that can be used by humans [21]. As a result, some researchers have utilized an economic value method to measure changes in ecosystem services in mining sites, exposing the extent to which complex ecosystems are harmed and the true linkages between multiple ecosystem services [19] The market value approach [22], the equivalent factor approach [23], and the cumulative ecological effects approach [24] are all widely used methods that link ecological value gains and losses in mining areas to socioeconomics, reflecting the significant value and undersupply of ecosystem services to human beings. These methods link the loss and gain of ecological value in mining sites to socioeconomics, emphasizing the importance of ecosystem services to humans and their undersupply. Furthermore, the actual synergies and trade-offs across ecosystem services better reflect the patterns and mechanisms underpinning benefit maximization [25]. As a result, various studies using map analysis [26], multi-temporal comparisons [27], and simulation forecasts have assessed the synergies and trade-offs between ecosystem services in mining sites [27]. Quantifying and analyzing ecosystem services’ spatial and temporal features continues to provide more detailed and specific recommendations for decision-making and management. However, there is no long-term study on ecosystem services in mining areas. Those that do exist focus simply on trend changes, neglecting the synergistic benefits and trade-offs between cumulative ecosystem service losses and cumulative value increases and losses of individual services.
Over time, several studies have been conducted to add to the grounded theory and evaluation methodology used in cumulative impact assessments, allowing for a systematic examination of cumulative environmental changes [28]. The main goal is to reconstruct the time-series process of ecosystem service changes and to assess cumulative environmental effect changes in the research region and its adjacent ecosystems, reflecting the diversity and dispersion of ecosystem service functions. This study will explore the changes in cumulative ecological effects due to mining disturbance and reclamation in mining areas, as well as the synergistic effects and trade-offs between the cumulative values of various services, using long time-series land cover classification maps and identifying mining disturbance areas and reclamation areas. As a result, the objectives of this study are to (1) build a long time-series model of ecological services value (ESV) based on the pixel scale to dynamically assess the ecological cumulative effects (ECE) of the mining area, and (2) map and assess the cumulative response of long-term coal mining disturbance and gradual reclamation on the ecosystem of ecological services such as soil formation and protection (SP), water conservation (WC), biodiversity maintenance (BM), climate regulation (CR), and food production (FP).

2. Materials and Methodology

2.1. Study Area

The Pingshuo mining area is located in the eastern part of the Loess Plateau and the northern part of Shanxi Province (Figure 1), spanning three districts and counties of Shuozhou City, which is under the jurisdiction of Shuozhou City, Shanxi Province, with geographical coordinates of 112°16′20″–112°30′32″E and 39°26′10″–39°35′30″N [29]. The research region is a loess hilly environment in the eastern section of the Loess Plateau, on the border between the Loess Plateau and the northern Tusk Mountains, and is an ecologically fragile area. The research region is 1200–1600 m above sea level, with a temperate semi-arid continental environment. The average annual temperature is 4.8–7.5 °C, with extreme minimum and maximum temperatures of −32.4 °C and 37.9 °C, respectively. The average annual precipitation is 428–449 mm, with total precipitation accounting for 75% of the year in July, August, and September, and the average annual evaporation is 1787–2598 mm. The environment in the research region is weak, and the zonal vegetation type is dry grassland vegetation. The region is rich in land resources and diverse land use types, but with the development of cities and mining of mineral resources, arable land is decreasing and the area occupied by land excavation and loss is increasing, and the pressure on land resources and ecological security in the region is increasing; thus, the maintenance of regional land and ecological security is of great significance to the sustainable development of the region.

2.2. Data Acquisition and Preprocessing

This study used the Google Earth Engine (GEE) platform to collect and process Landsat-TM/OLI/TIRS imagery (USGS, https://www.usgs.gov/landsat-missions) (accessed on 10 April 2021), with three image sets, namely Landsat 5 Thematic Mapper (TM), Landsat 7 Enhanced Thematic Mapper (ETM+), and Landsat 8 Operational Land Imager (OLI), and surface reflection (SR) datasets. In terms of time series, this study encompasses all photographs in the study area from 1986 to 2021. To calibrate the sensor radiance of Landsat 5 and Landsat 8 images for surface reflectance, the Landsat Ecosystem Disturbance Adaptive Processing System (LEDAPS) [30] and Landsat Surface Reflectance Code (LaSRC) [31] were used. In addition, the C implementation of Function of Mask (CFMASK) determines important pixel data quality flag information suggestive of clouds, shadows, water, and snow [32]. Surface reflectance from Landsat 5 TM, Landsat 7 ETM+, and Landsat 8 OLI satellites was also considered. The NDVI and phenological index were calculated using sensor pictures (Landsat/LT05/C01/T1 SR, Landsat/LT07/C01/T1 SR, and Landsat/LC08/C01/T1 SR). Section 2.3, Section 2.4, Section 2.5 and Section 2.6 correspond to the technical route of the entire study (Figure 2), namely steps 2, 3, and 4, and trade-off and synergy analysis (Section 2.3, Section 2.4, Section 2.5 and Section 2.6).

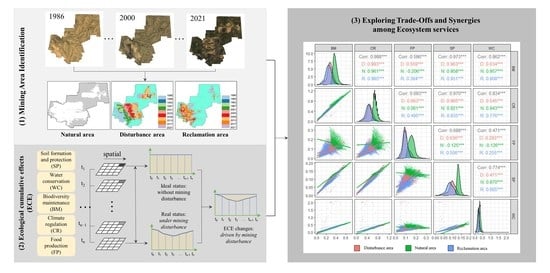
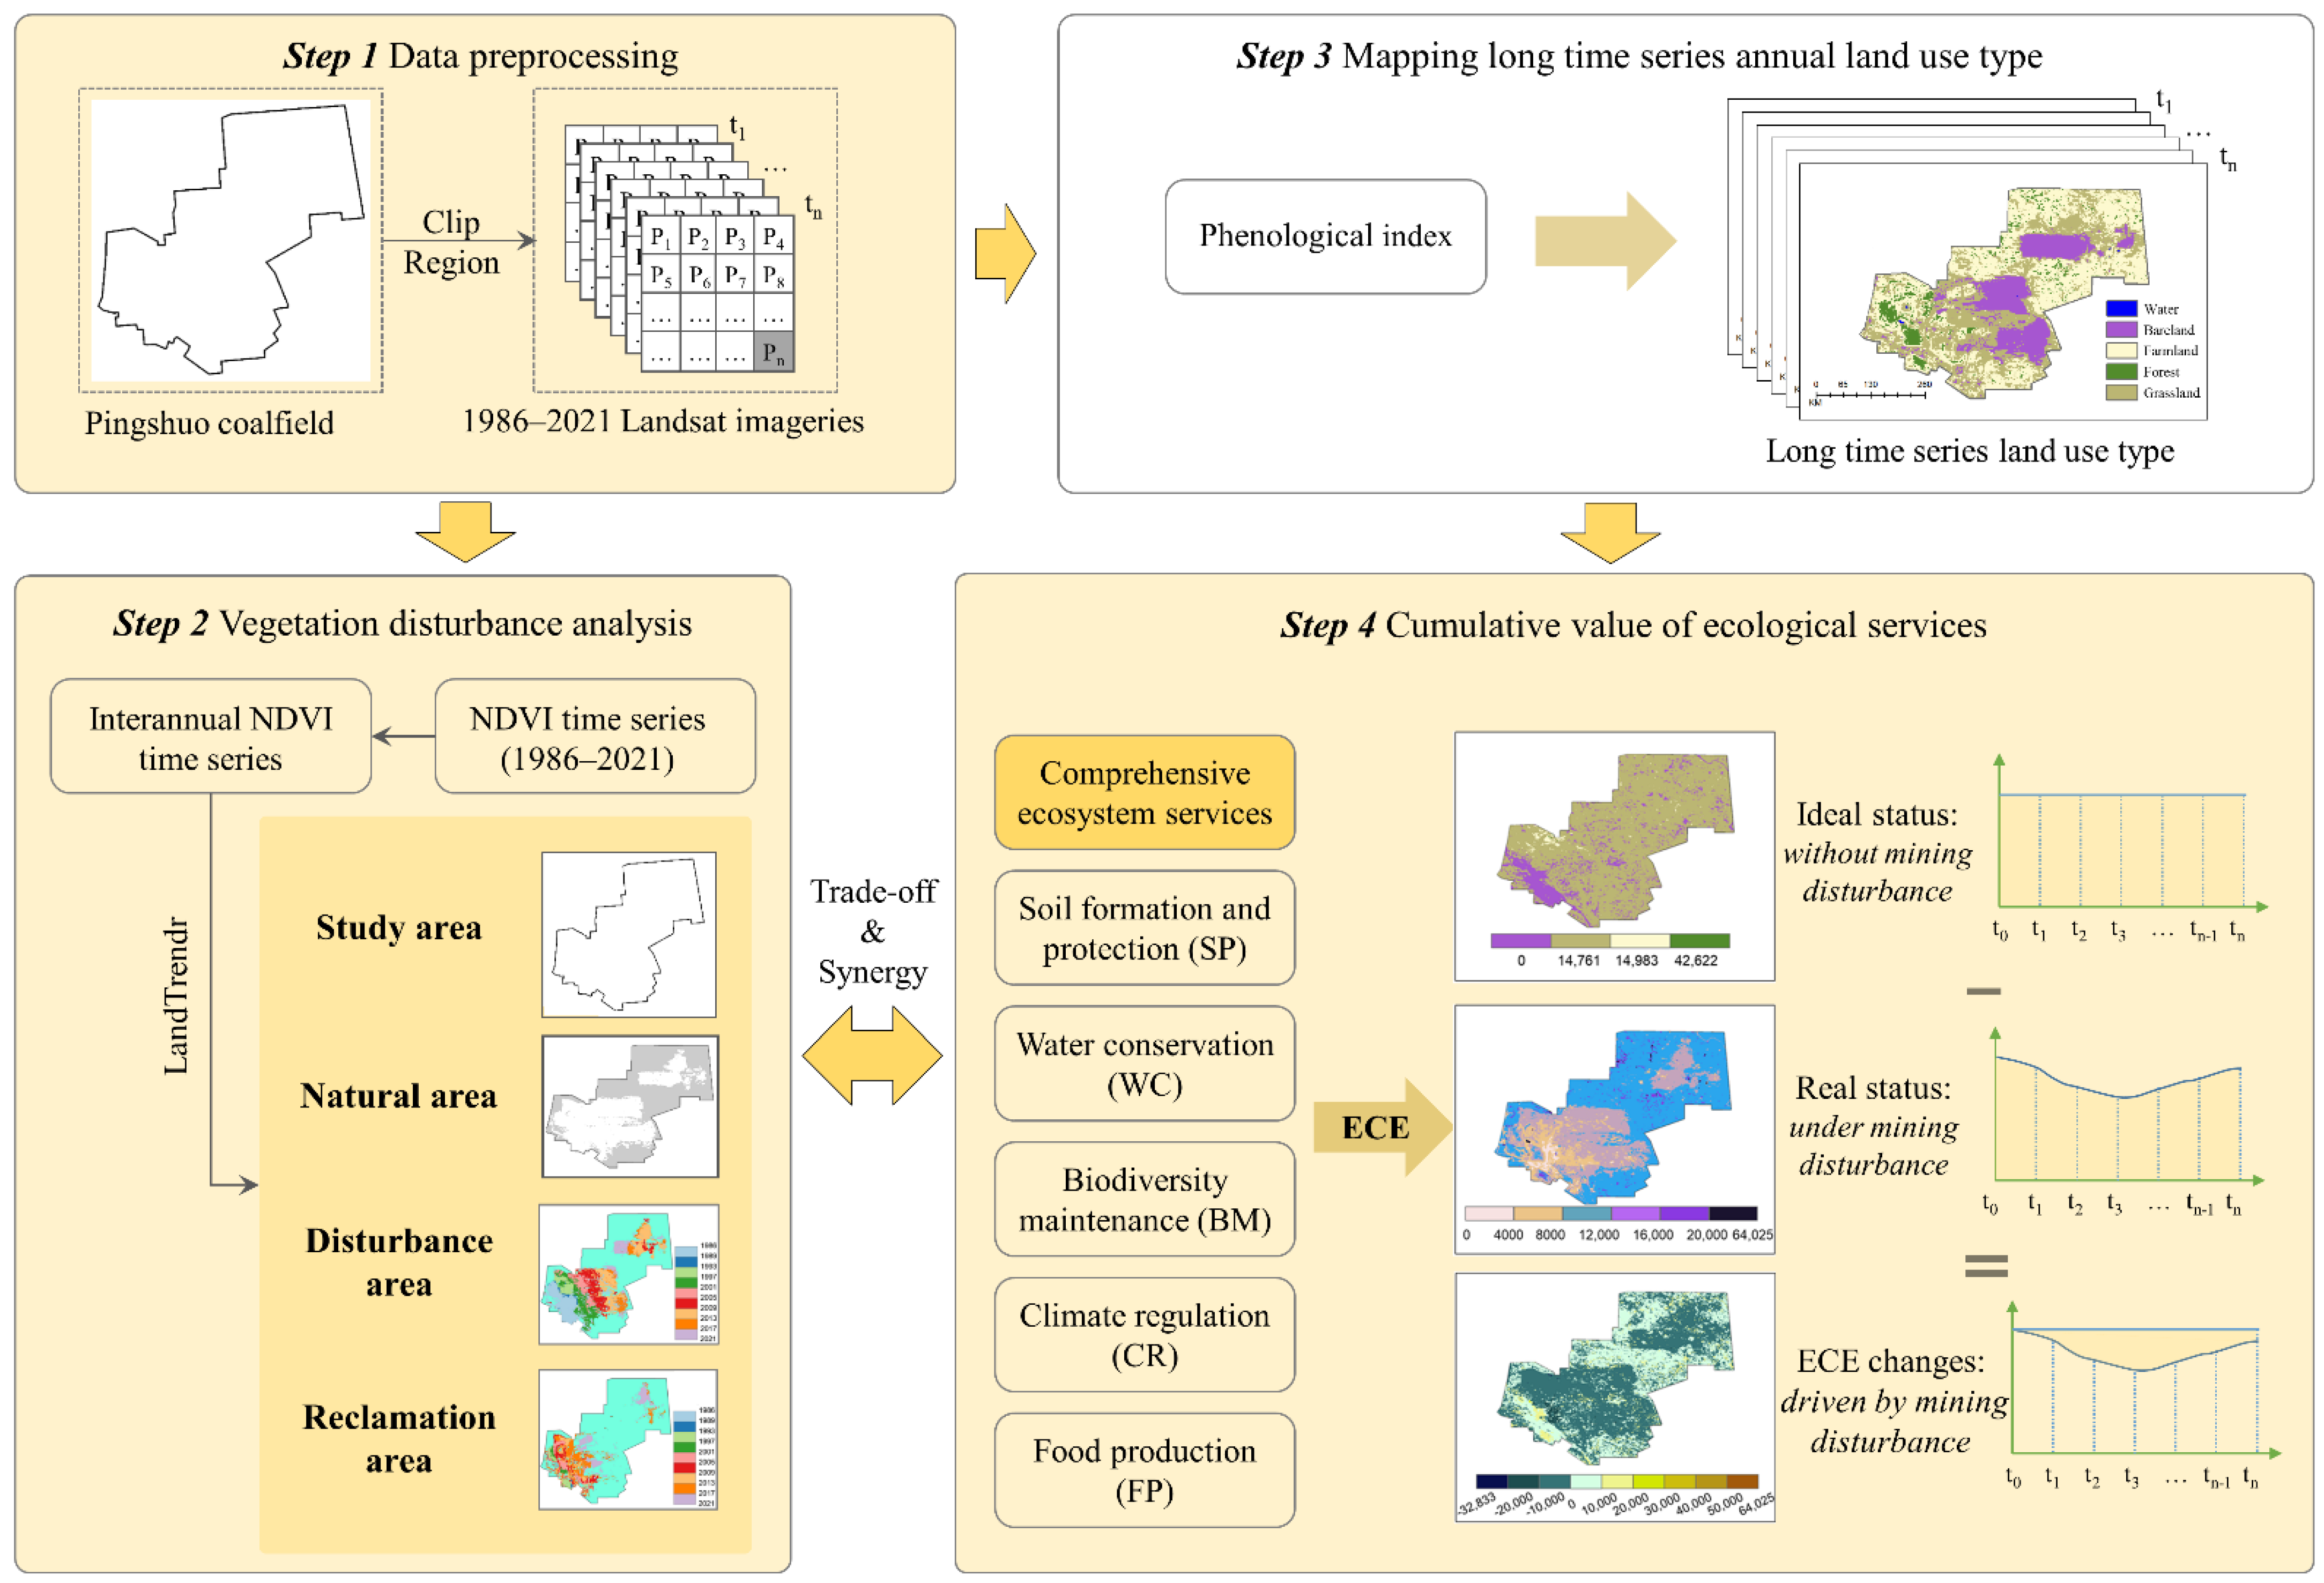
2.3. Mining Area Identification Based on LandTrendr

Mining and reclamation events in open-pit coal mines are the most visible land use cover changes in remote sensing data, and characterizing the temporal processes of mining and reclamation in mining sites is critical for assessing the impacts that result. The LandTrendr method was utilized in this investigation, as well as in Xiao et al. [7], to identify historical mining disturbance regions and reclamation areas in the Pingshuo mining area using Landsat imagery. This approach focuses on image element time-series data and employs a temporal segmentation method to extract the altered years and border characteristics [33]. To limit the effects of climatic variability, flooding, or changes in solar geometry, this study selected abrupt changes in vegetation metrics for all Landsat images (path/row 092/076) over the vegetation growing season between 1986 and 2021 [34]. The Normalized Difference Vegetation Index (NDVI) was derived using the spectral bands of Landsat images for all accessible imagery. The LandTrendr algorithm was combined at the image element level to identify information on its temporal sequence of mining disturbances and abrupt changes due to reclamation, resulting in the temporal and boundary characteristics of the occurrence of large-scale patch disturbances by aggregating image elements with the same characteristics. The NDVI of normal reference areas ranges from 0.242 to 0.505, and the vegetation index is below 0.116 after mining disturbance, whereas the increase in the recovered vegetation index ranges from roughly 0.145 to 0.494 after mining disturbance, according to collected experience [35]. As a result, the mining disturbance and reclamation regions of the Pingshuo mine in Pinshuo may be more easily extracted, as well as the course and temporal trajectory of mining expansion.

2.4. Quantifying ESV in Mining Area

The land use classification and mining-specific cover types for the Pingshuo coal mine were determined comprehensively based on ecosystem differences, and the land use types of the Pingshuo coal mine were classified into four categories: arable land (including in situ landform arable land and reclaimed arable land), grassland (including in situ landform grassland and reclaimed grassland), forest land (including in situ landform forest land and reclaimed forest land), watershed, and other. Land use categories such as mining, settlements, and bare land are examples of other land uses, and the ecosystem service values of these land use types were treated as 0 values in the measurement method [36]. The study used the ability of this indicator to distinguish the spectral characteristics of agricultural land from grassland during the vegetation growing season to classify the full range of land use types classified, because NDVI has been shown to be one of the indices with superior effectiveness in distinguishing different types of vegetation, built-up land, and water bodies (Figure 3) [37]. The image element samples of remote sensing photos were labeled to distinguish all land cover types for the period 1986–2021 using the CART classification approach in machine learning [38].
A quick and straightforward approach to ecosystem service value evaluation was utilized to quantify the impacts of mining modifications in the Antabuse mining area and to understand the future prospects of the human exploitation of natural capital in this area. The ESV changes in the Pingshuo mining area were assessed using ecosystem service values per unit area for various land use categories (Table 1) [36]. Soil formation and protection, water containment, biodiversity maintenance, temperature regulation, and food production were chosen as the study’s five ecosystem services. The Pingshuo open-pit coal mine’s economic value per unit of the food production area was increased, and the mine’s land was quickly recovered.
E S V = A k × V C k
where E S V is the total value of ecosystem services in the study area (RMB); A k is the area of the k th land use type in the study area (hm2); V C k is the value of ecosystem services per unit area of the k th land use type in the study area (RMB/hm2); k is the land use type in the study area.

2.5. Evaluation Procession of ECE in Mining Area

Open-pit coal mining, which includes mining, processing, usage, and waste disposal, is at various stages of development and continues to expand in time and space [22,24]. Mining activities have a complex geographical and temporal distribution, resulting in increased land use intensity and frequent changes in land cover types. Changes in ecosystem structure in mining sites are thought to worsen the process of changes in ecosystem service functions and provisioning services [39]. As a result, the loss and gain of ecosystem services as a result of open-pit mining are complicated, and a simple analysis of single-period remote sensing photos fails to highlight the subtle links between mining and ecosystems. Cumulative effects assessment (CEA) is used to assess the cumulative changes in ecosystem services in mining areas, and the concept of mine eco-efficiency has been developed to show how surface coal mining triggers the transformation process of ecosystem service function by changing the land use landscape.
The assessment of a mine site’s ecological cumulative effects is conducted in two ways: the first is the actual computation of the real ecosystem cumulative value (RECV) of ecosystem services resulting from a surface coal mine’s real land use type shift from pre-mining to current mining condition; the second is the real ecosystem cumulative loss (RECL) due to complex human activities in the coal mine, which is calculated by estimating the ideal ecosystem cumulative value (IECV) without coal mining up to the present. The research was performed for a variety of ecosystem services and mine sites. The researchers also devised three total values for five services: soil creation and protection (SP), water conservation (WC), biodiversity maintenance (BM), climate control (CR), and food production (FP) [40]. Furthermore, the genuine cumulative ecological advantages of reclamation events were thoroughly investigated by (1) using Landsat images and the phenological index to identify the land use of the mining area in consecutive years (1986–2021), and (2) computing the value of ecosystem services as well as the cumulative ecosystem service value in consecutive years.

2.6. Exploring Trade-Offs and Synergies among Ecosystem Services

The in-depth investigation of cumulative ecological benefits exposes the true state of affairs in the mining area before and after the complex land use change, as well as the cumulative loss and gain of ecosystem services as a result of the transition. This study conducted a synergistic effect and trade-off analysis on the cumulative value of open-pit coal mine ecosystems integrating service functions in order to expose the complex ecological gains and losses that occur during open-pit mining. To determine the potential consequences due to surface mining, the cumulative benefits of natural areas (NA), surface mining disturbance areas (DA), and reclamation areas (RA) indicated by the LandTrendr algorithm were systematically tested against the various assessed ecosystem service functions.
The minimum–maximum normalization approach was primarily used to normalize cumulative values in order to eliminate the impacts of the dimensions between distinct cumulative values [41]. At the pixel level, Pearson correlation analysis and significance tests were utilized to find trade-offs and synergies between cumulative value pairings across functions [42]. The pixel-scale correlations between two pairs of services were estimated using Spearman’s rank correlation coefficient, expressing the correlation in terms of the correlation coefficient r (|r| ≤ 1) and significance level (p < 0.01; p < 0.05) [43]. The stronger the relationship, the higher the absolute value of r. The correlation coefficient’s absolute value is related to the degree of interaction between pairs of service functions. The Pearson correlation matrices of the cumulative value sets were constructed using the pairs() function in r. The principal diagonal of these matrices represents the histogram of each cumulative value, which can indicate the distribution properties of the cumulative value sets. Above the main diagonal, the correlation coefficients and significance test results between pairs of service functions are displayed. Below the main diagonal are scatter plots and fitted curves between pairs of service functions.

3. Results

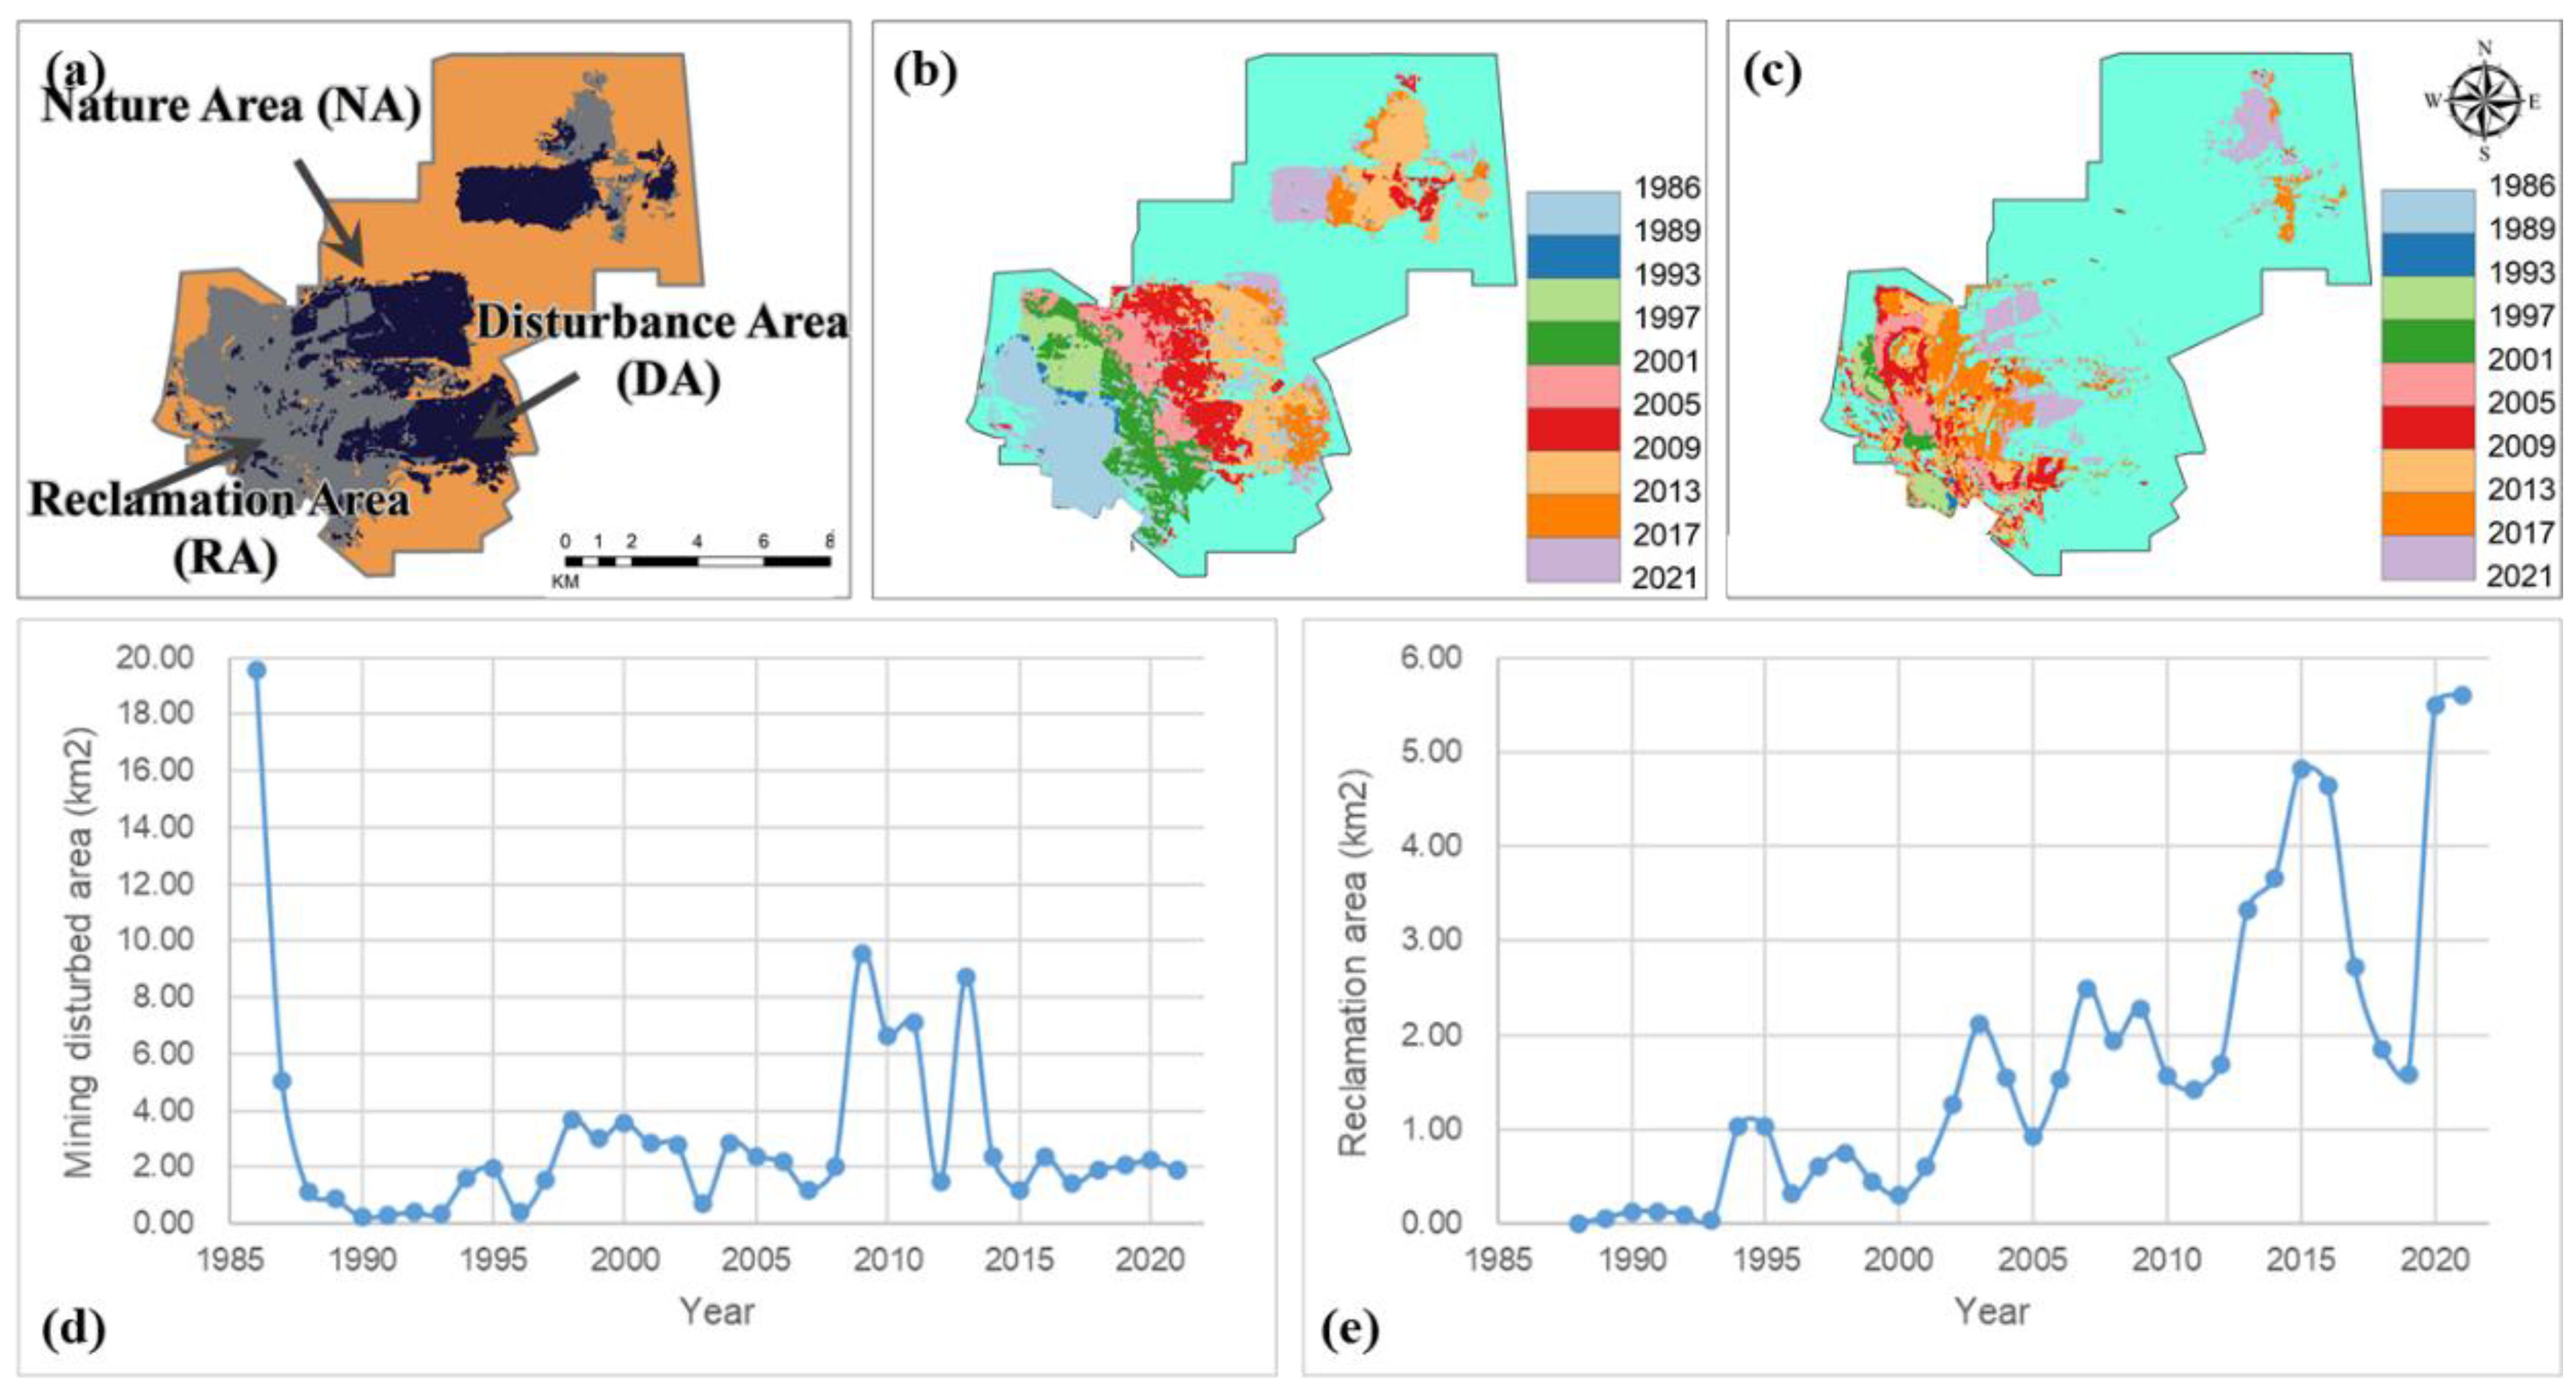
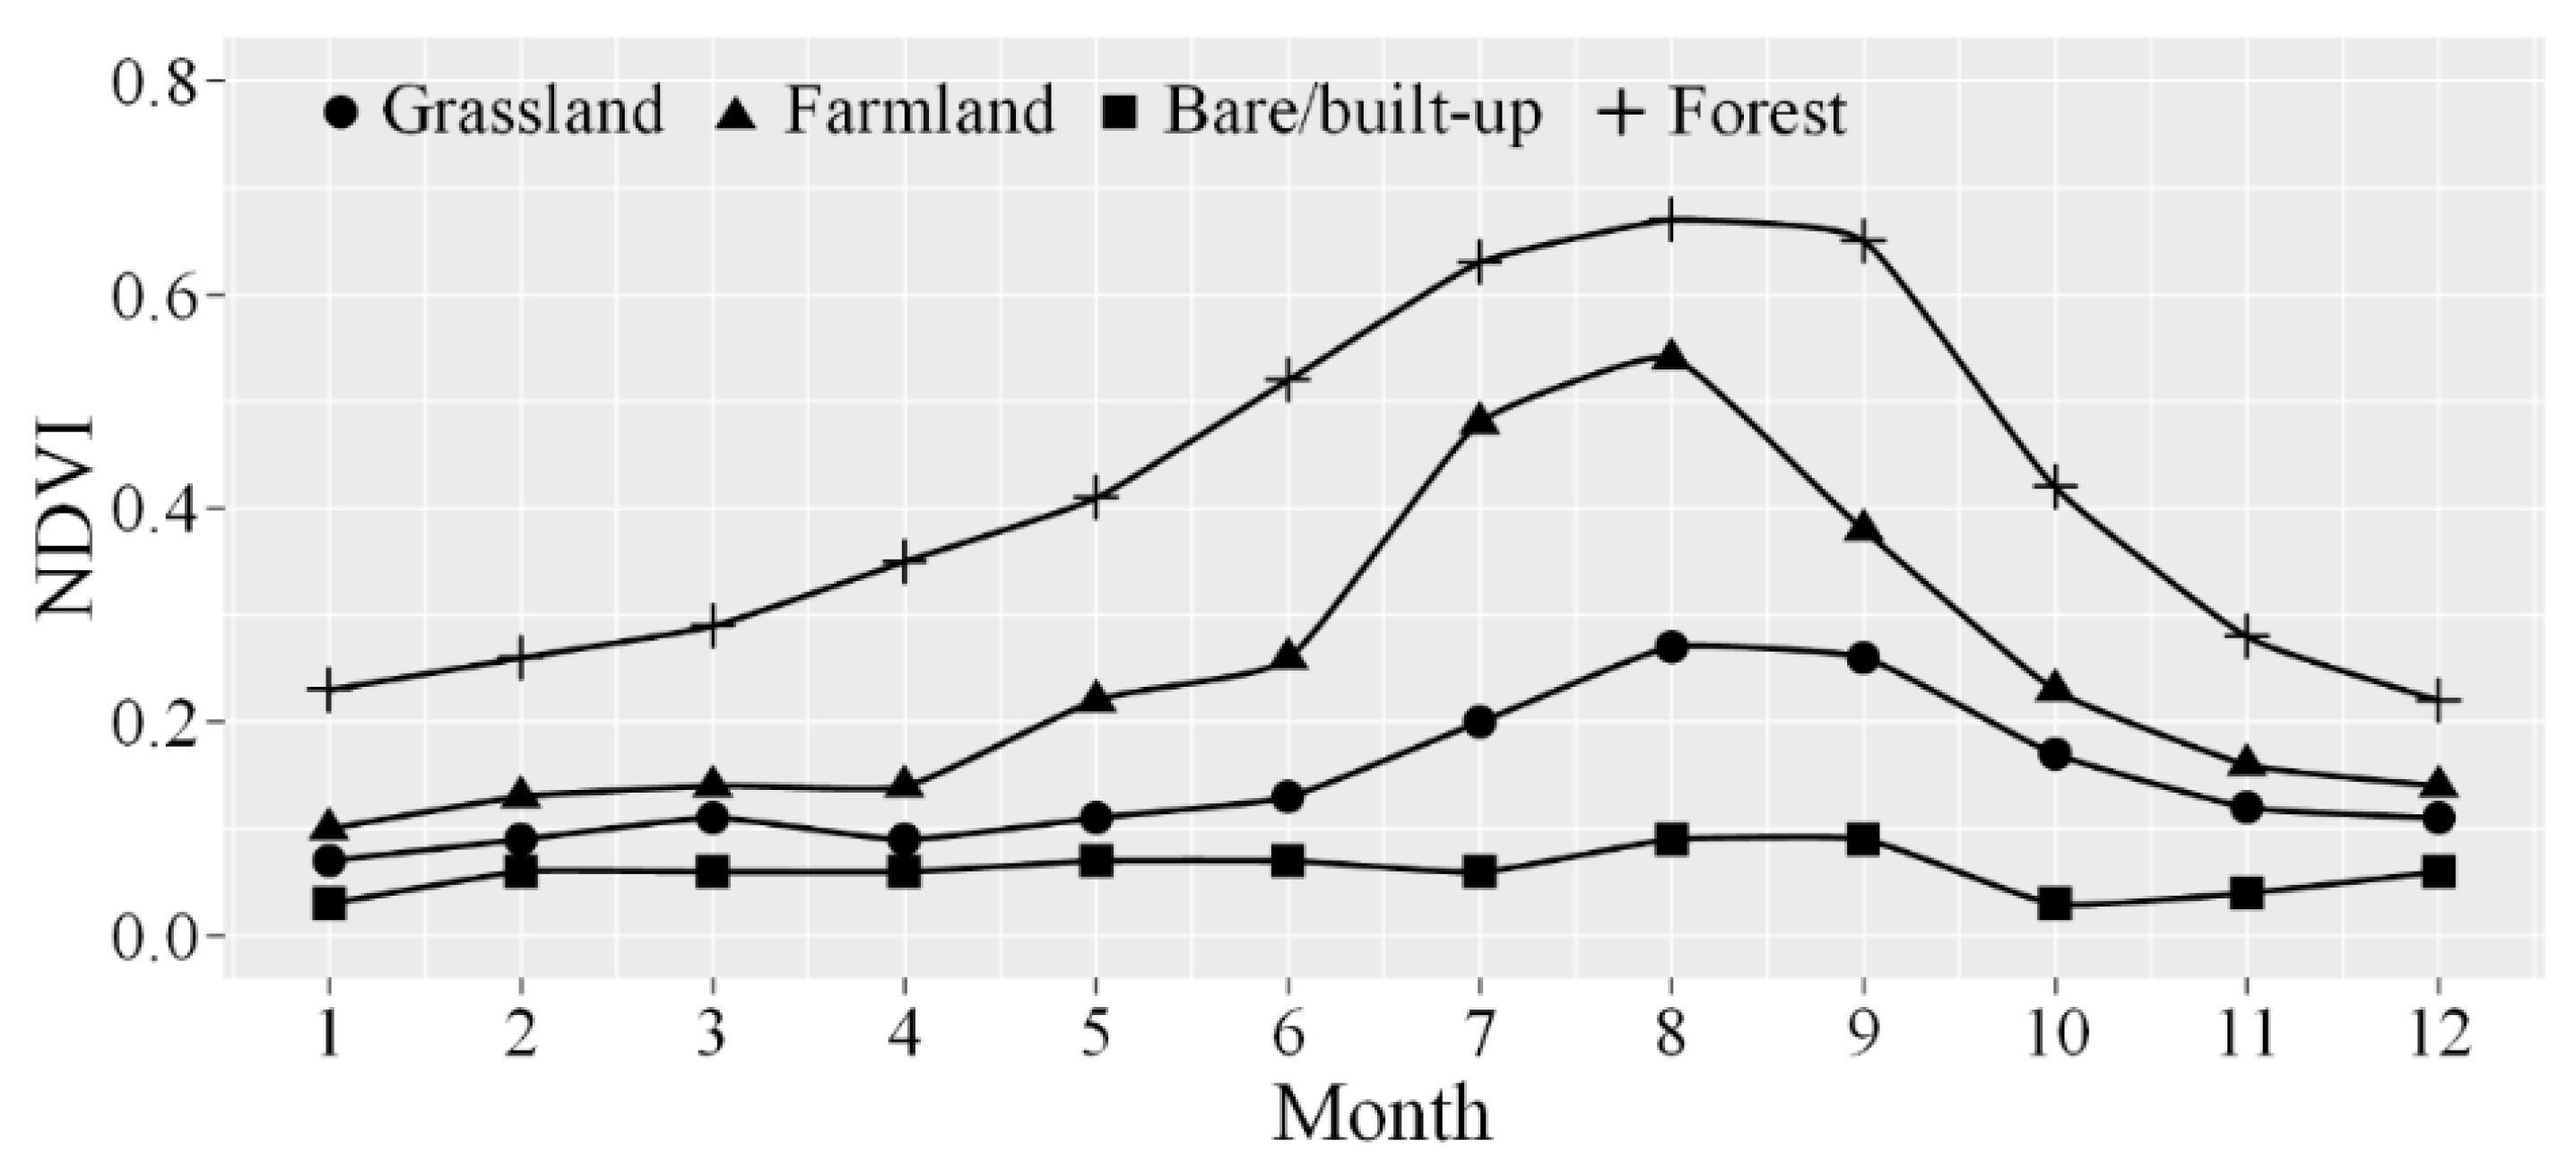
3.1. Mining Area Identification Based on LandTrendr

In the Pingshuo mining area, the LandTrendr algorithm was used to reconstruct the geographical and temporal processes of mining disturbance and reclamation, and Figure 4 shows the extent of mining disturbance and reclamation occurring in the mining area at different stages during the period 1986–2021. In addition, the regional scope of mining and reclamation occurrence is given at four-year intervals to facilitate the understanding of the study’s findings (except for the period 1986–1999, which is given at three-year intervals). The natural area was 93.51 km2 in size, the disturbed area was 39.60 km2 in size, and the reclaimed land was 44.58 km2 in size as of 2021. The mining operations are ongoing. To date, mining activities have continued in new locations. The largest mining disturbances occurred in 1986–1989 and 2010–2013, with 26.56 km2 and 23.92 km2, respectively, while the smallest mining disturbances happened in 1990–1993 and 2002–2005, both with 1.33 km2. Over the course of the mining history, 109.54 km2 of open-pit coal mines were affected, with an average yearly mining disturbance of 3.13 km2. Reclamation events took longer than mining activities, and the total reclamation area was only 58.07 km2, or 53.01% of the mining disturbance area. The amount of reclamation changes similarly followed the mining disturbance in 1988, moving from the southwest corner of the mine area to the northeast. This shows that the mining rule of “mining during reclamation” was strictly maintained throughout the mine, and that the mining parties were well aware of the mine’s severe environmental implications. This attention grew over time, as seen by the strong rising trend in the mine’s recovered area, which peaked at 15.86 km2 in 2014–2017 and 14.55 km2 in 2018–2021, respectively, accounting for 52.37% of the total historical reclaimed area. In contrast, only 11.39 km2 of the mining-affected area was reclaimed in the 19 years preceding 2005, accounting for 19.61% of the entire historical reclamation area.

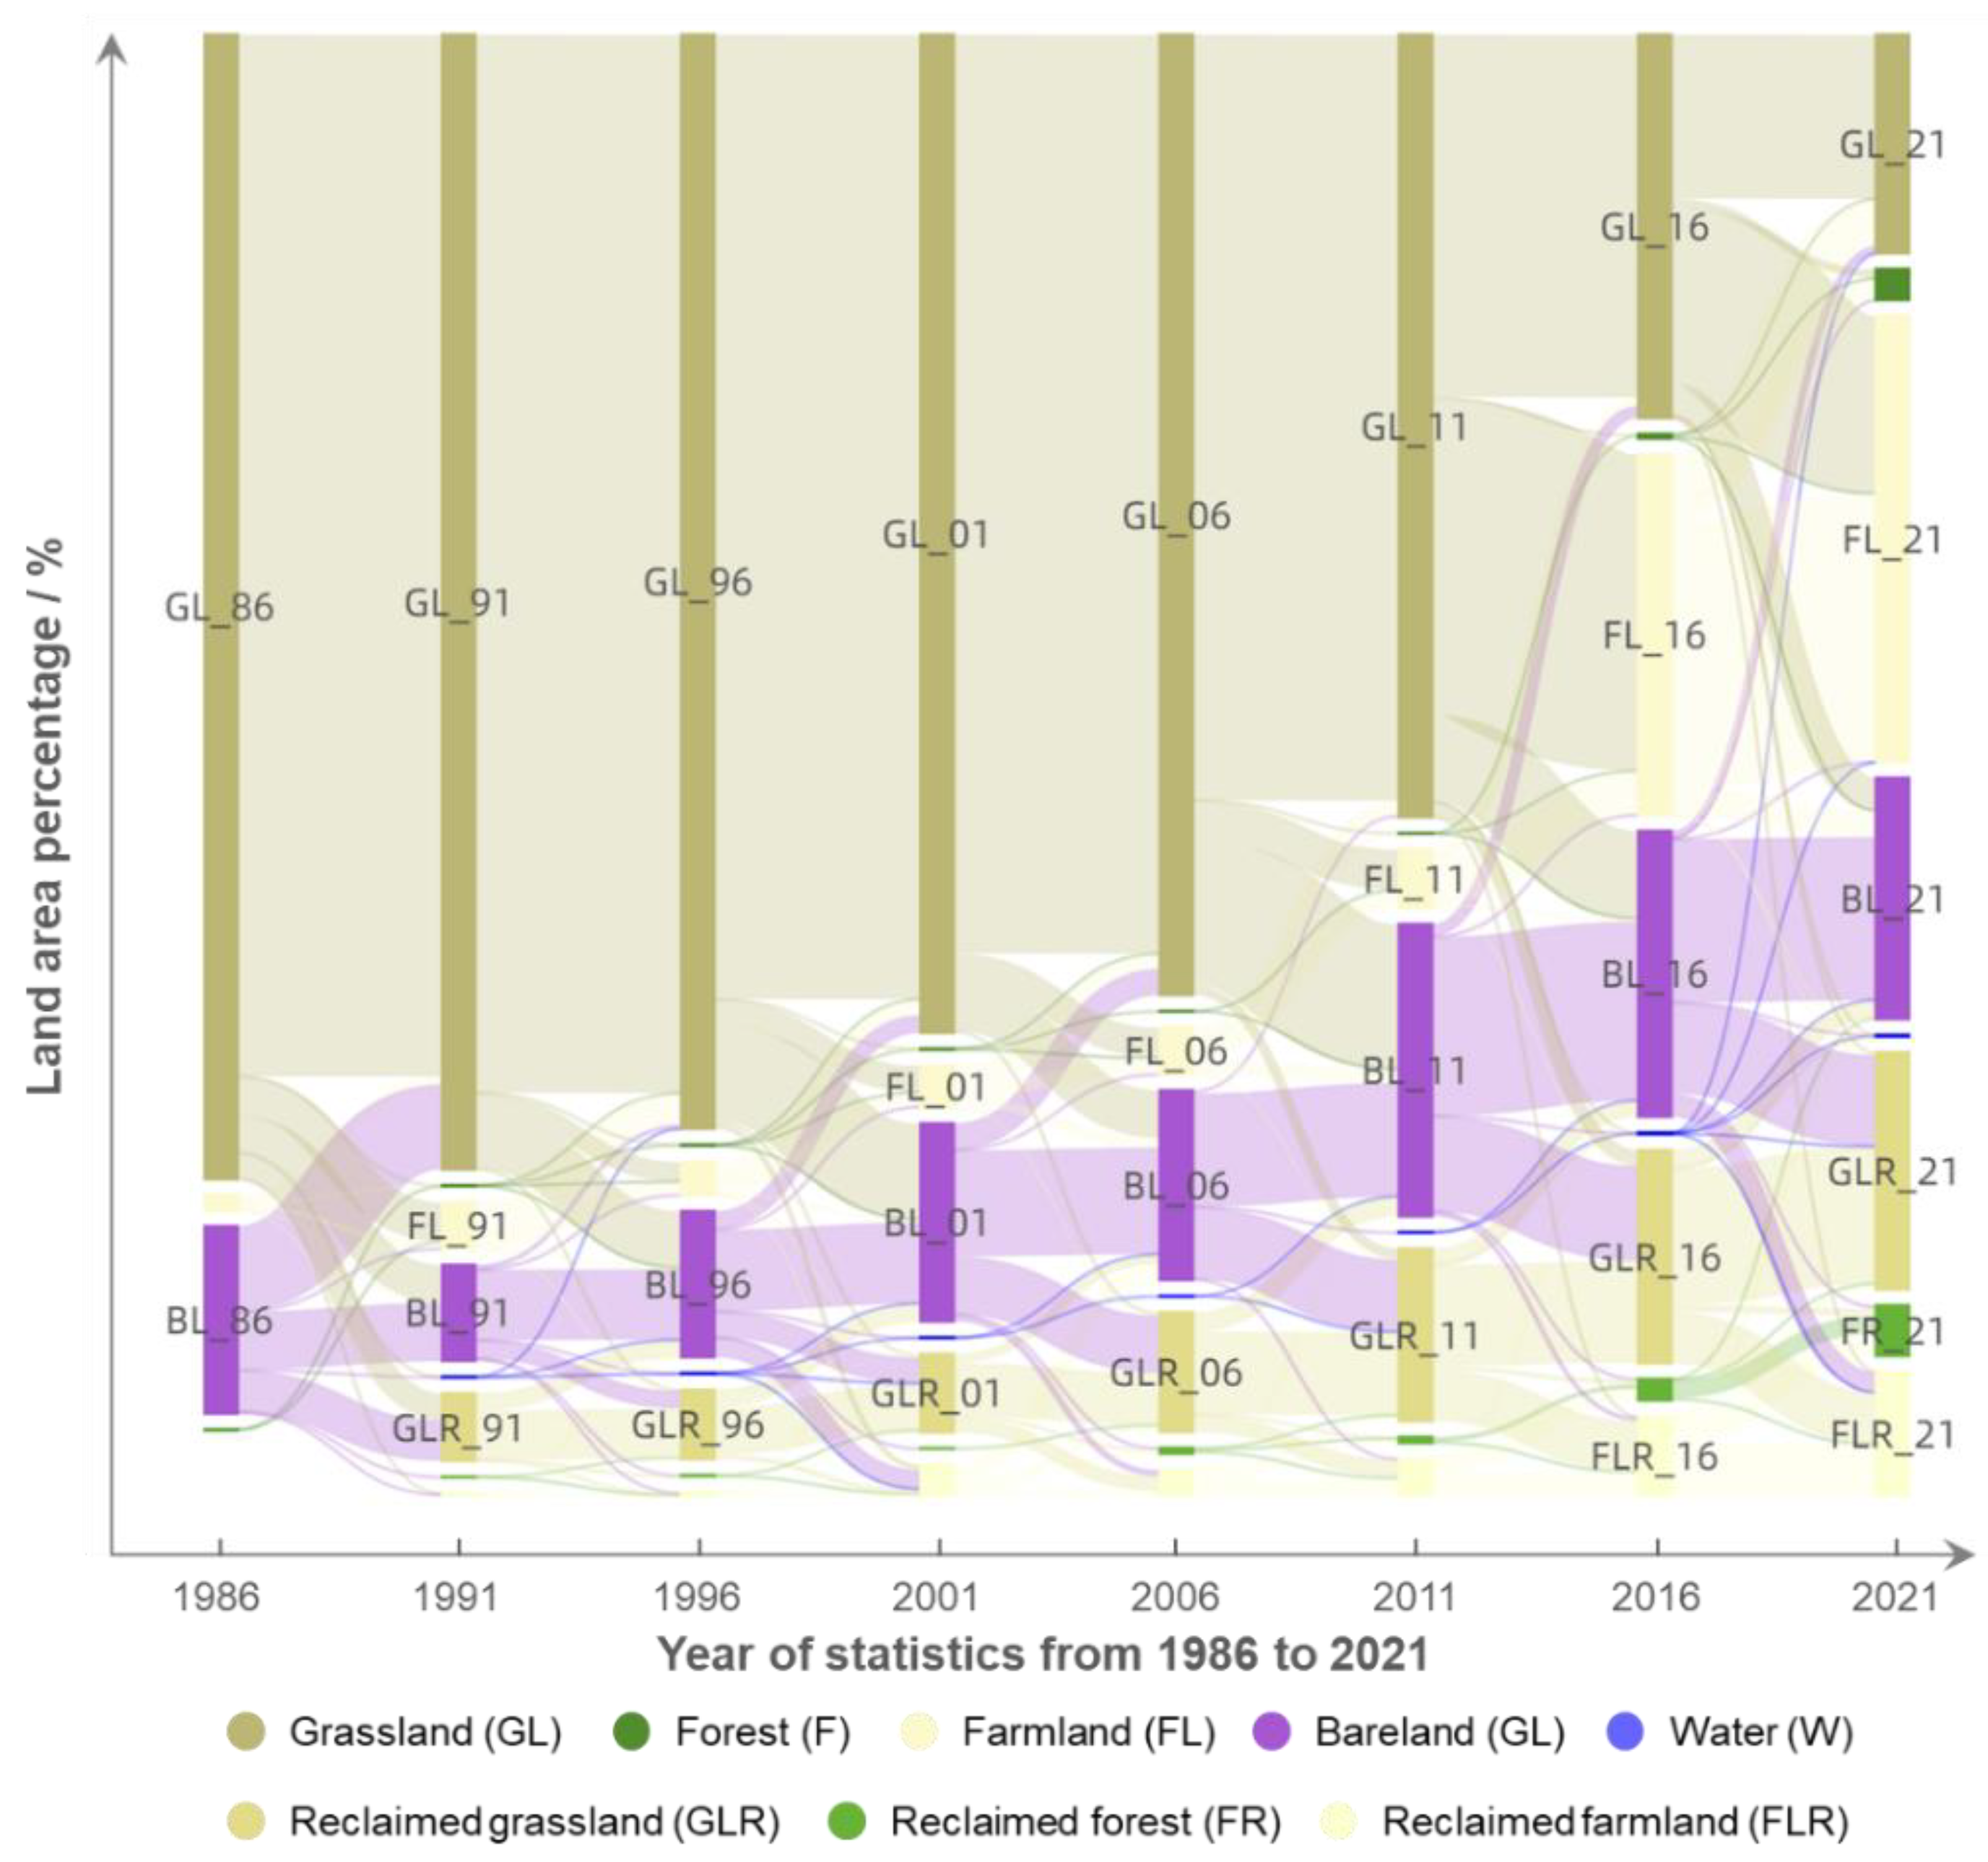
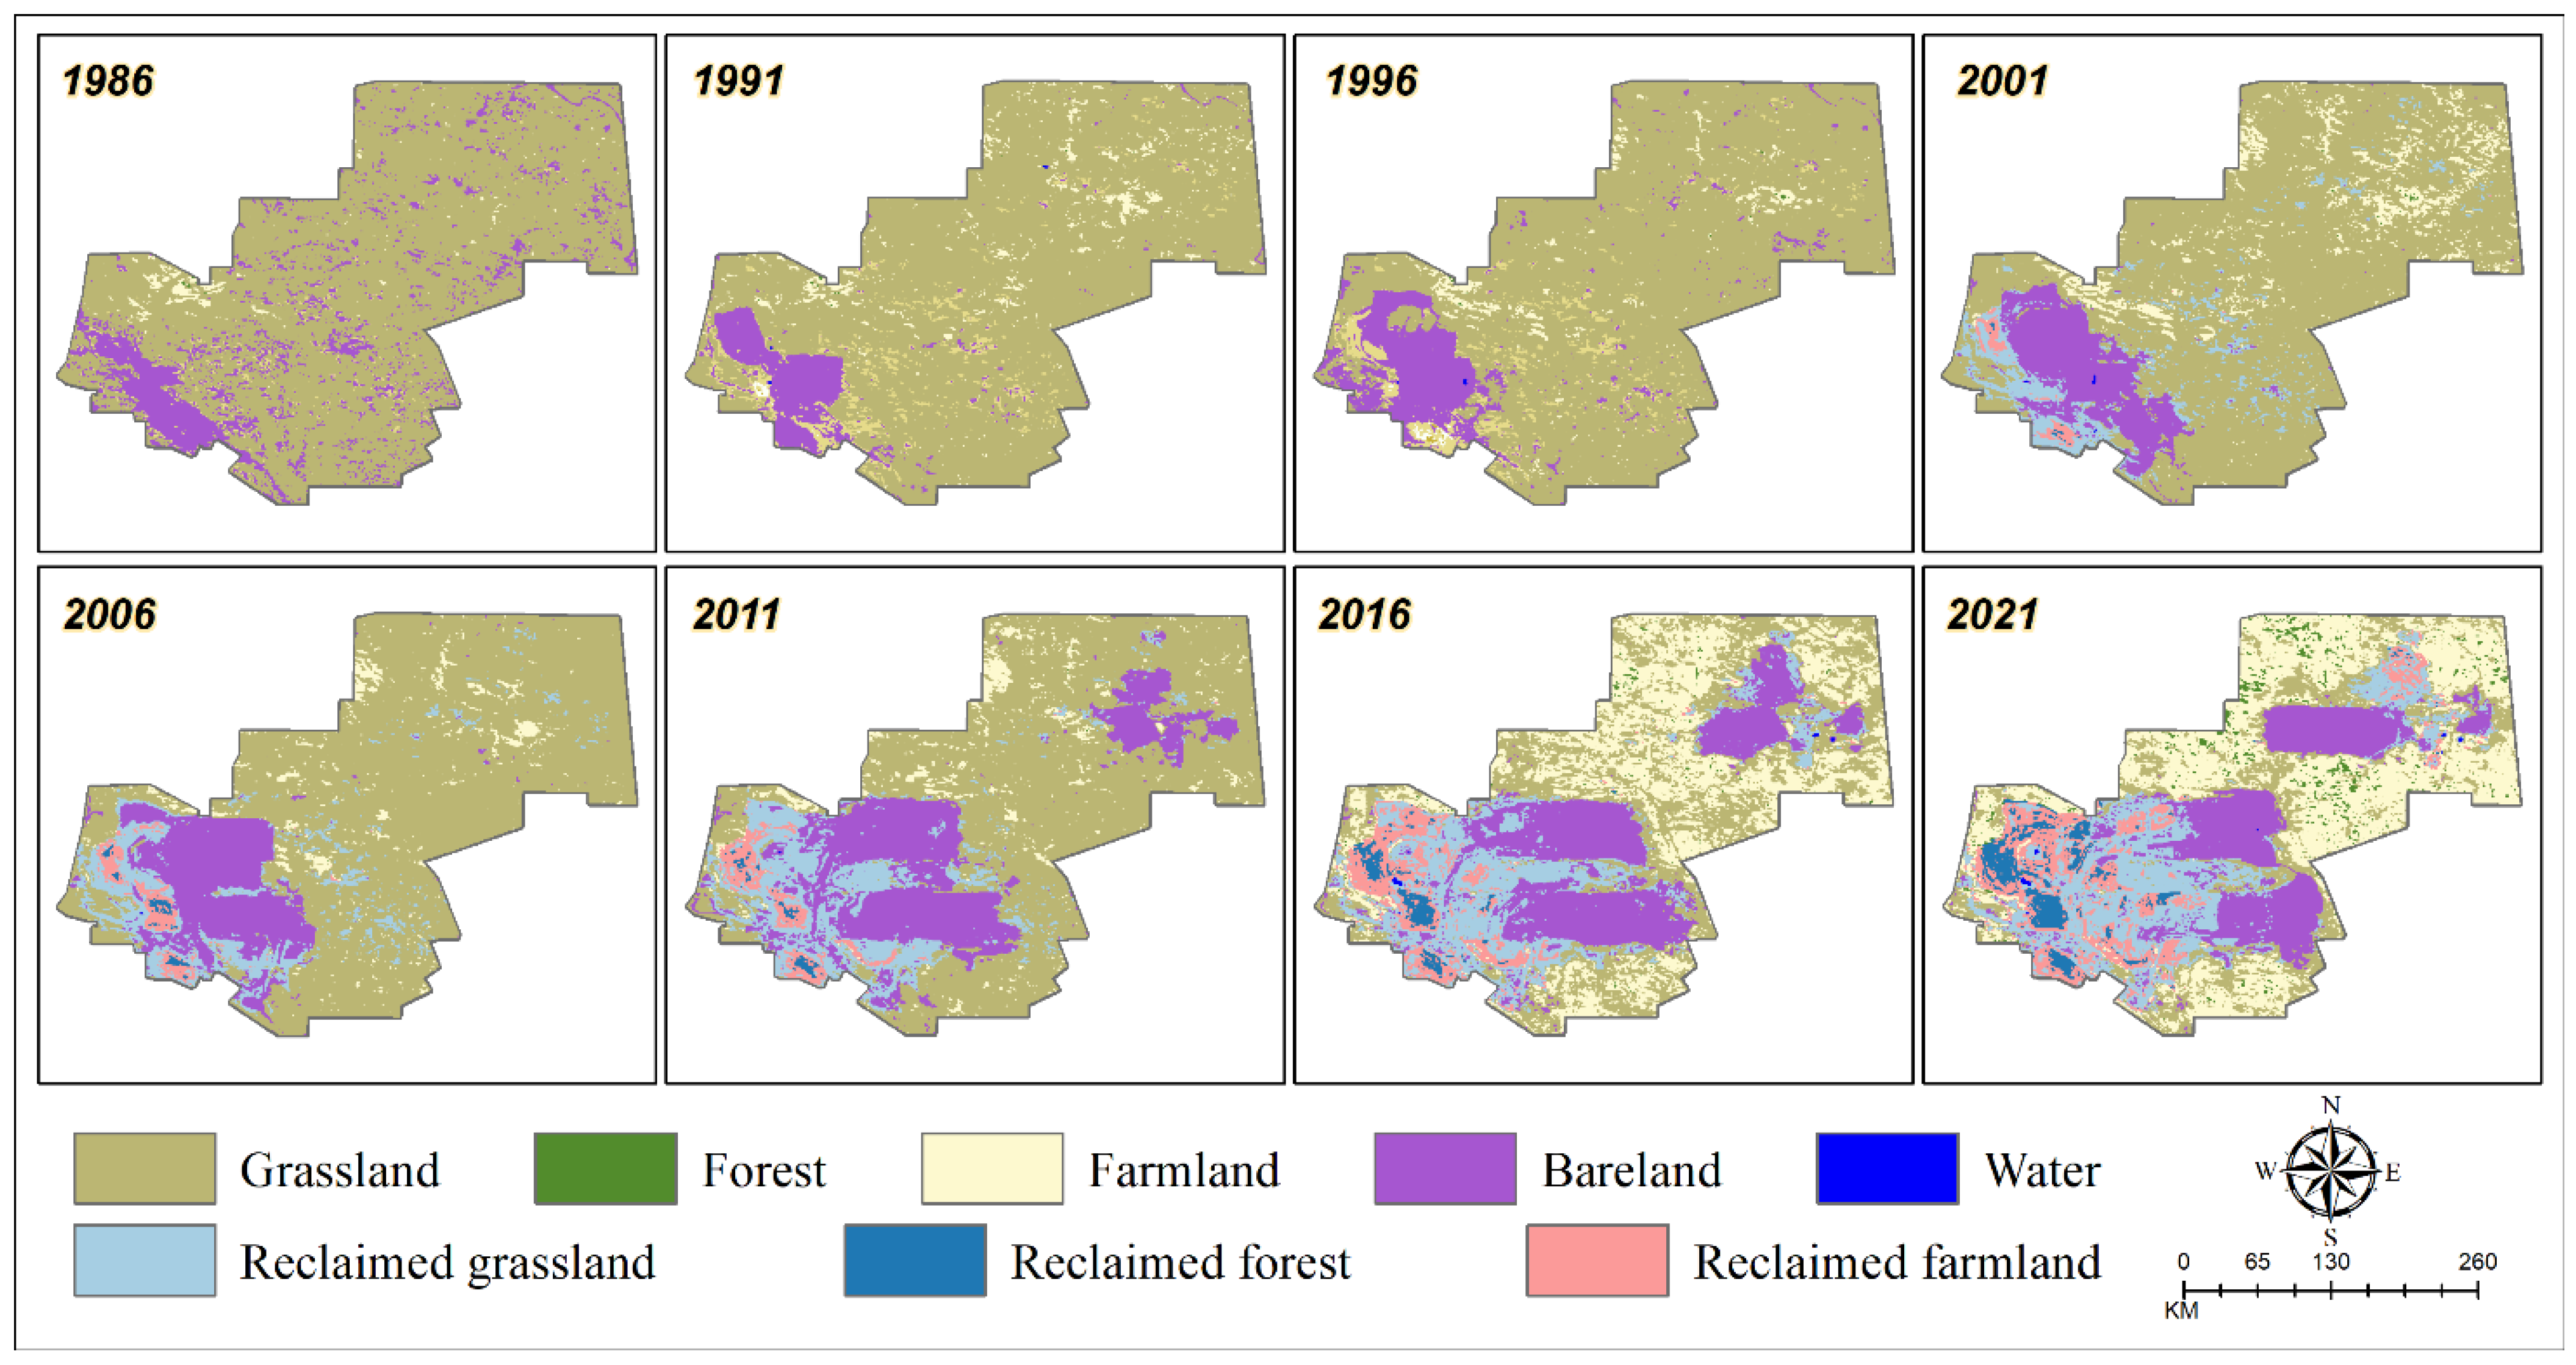
3.2. Temporal and Spatial Characteristics of Land Use Types

All the land use findings for the period 1986–2021 were identified using NDVI and phenological features (Figure 5). The classification results were chosen at 5-year intervals to highlight the essential elements of change. The grassland, bare land, cropland, forest land, water bodies, reclaimed grassland, reclaimed forest land, and reclaimed cropland land use classification focuses on the distribution characteristics of grassland, bare land, cropland, forest land, water bodies, reclaimed grassland, reclaimed forest land, and reclaimed cropland, as well as the spatial changes that occur over time. The findings of the mining disturbance and reclamation event identification demonstrate that mining disturbance and reclamation events were responsible for the changes in bare land. Before 2009, bare land expansion was most noticeable in the mine area’s southwest corner; after 2009, the focus of bare land changes shifted, with a rapid reduction in the southwest corner and a considerable expansion in the northeast corner. It can be seen that mining disturbance and reclamation events drive the shift of bare land in the mine region, and that, with different reclamation procedures, the land use status after reclamation includes three types, namely farmland, woodland, and grassland. Farmland growth has altered the environment, where grassland was the most important type of land use cover prior to 2009, resulting in a pattern where cropland surrounded bare land, and this continues to occur. Woodland, on the other hand, is primarily concentrated in the mine area’s southwest corner, and, as we can see from the mining disturbance data, the woodland here is primarily the product of the reclamation program of 1988, which was primarily woodland. This area evolved into a woodland-covered reclamation area over time, which, along with other areas dominated by cultivated land reclamation, formed an important reclamation strategy for this mine site. The presence of water bodies is, in fact, quite rare, and it can be seen that they are primarily owing to the accumulation of water in open-pit mine pits. Increased water bodies indirectly improve the mining area’s water retention capacity, which is actually favorable to the region’s natural environment.
Figure 6 shows the changes in land use structure between the selected years. The disturbance and reclamation activities of mining have resulted in significant changes in the quantitative structure of diverse land types, according to the findings. Grassland and reclaimed grassland decreased by 122.18 km2 and increased by 31.30 km2, respectively, from 1986 to 2021; cropland and reclaimed cropland increased by 56.71 km2 and 16.24 km2, respectively; woodland and reclaimed woodland increased by 3.99 km2 and 6.63 km2, respectively; bare land showed large fluctuations due to its long-term association with mining activities. Although bare land rose by only 7.15 km2, it had been as low as 12.63 km2 in 1991 and as high as 38.55 km2 in 2011. Since their inception in 1991, water bodies have been slowly shifting and maintained an overall growing tendency, owing to changes in water collection in pits created by open-pit mining. Furthermore, we verified the correctness of the land use classification based on the phenological index. The categorization results of this investigation accurately mirrored the variations in classes within the site scale, according to the findings. The overall classification accuracy could reach more than 82%, and the kappa coefficient could reach more than 0.78, according to the validation results based on the confusion matrix (Table 2).

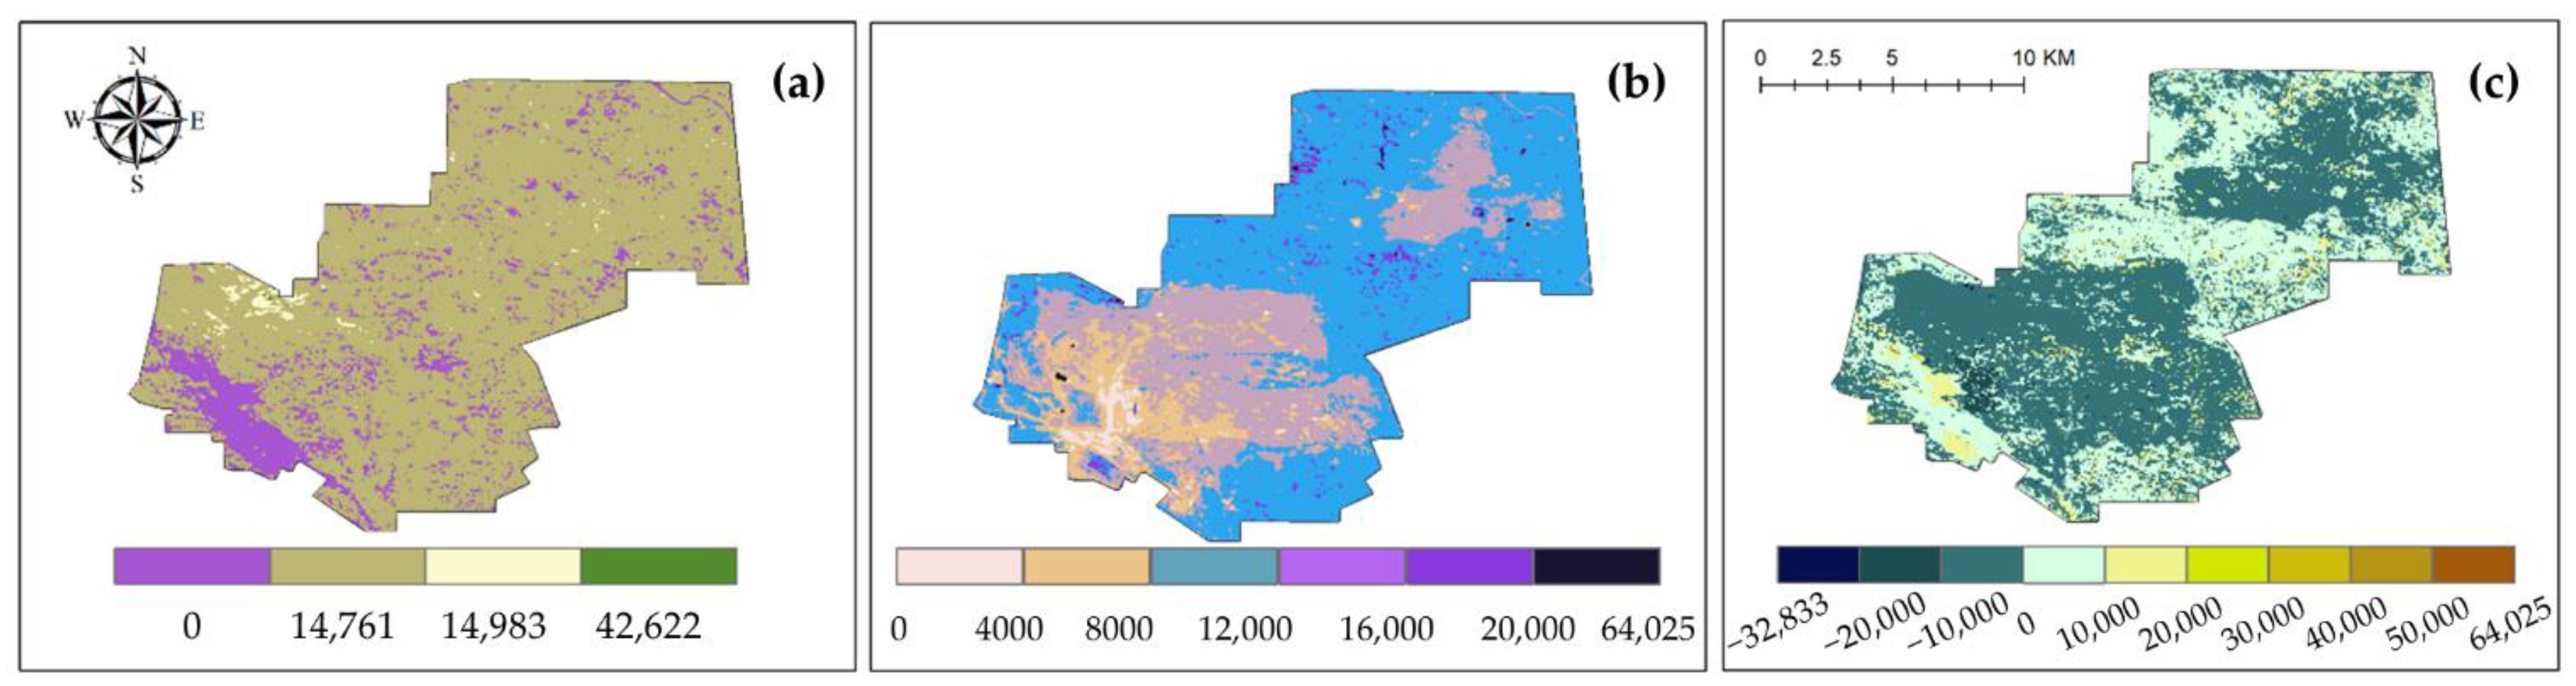
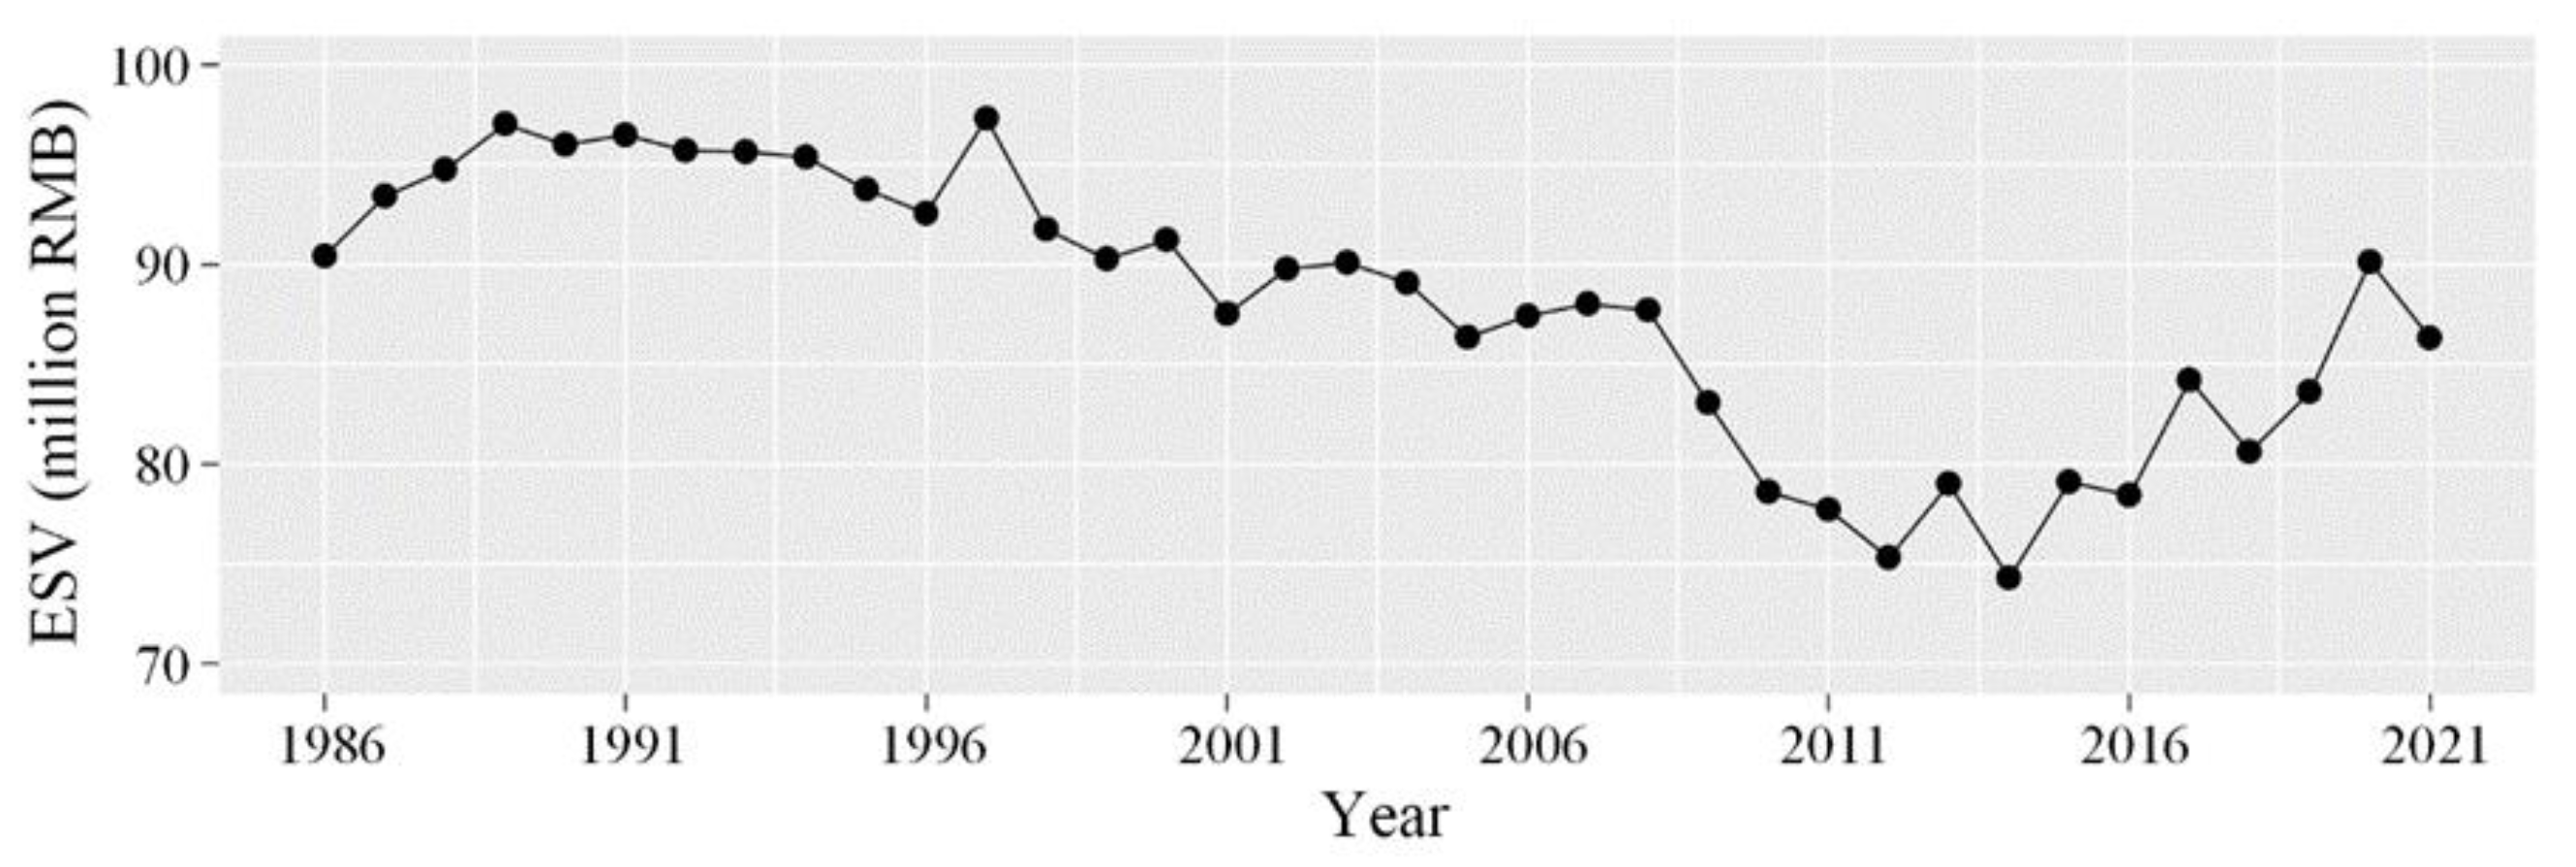
3.3. The Overall Spatial–Temporal Variations in ECE

The land change processes that have occurred in the mine site under anthropogenic impacts over the past 35 years were determined using the above land use classification. To better understand the ecosystem service gains and losses caused by mining, this study used the equivalent factor approach to identify particular ecosystem services and overall service values under real and ideal conditions. Based on the derived cumulative values, changes in the cumulative ecological benefits of mining sites due to mining and reclamation events were also determined. The ESV in the study region fluctuated significantly, declining in 1990 and then rising again in 2012 (Figure 7). The distribution and quantitative structure of the overall cumulative value of the mine area from 1986 to 2021 are shown in Figure 8 and Table 3. Without accounting for natural climatic condition changes, the RECV of the research region is 3149.03 million RMB, the IECV is 3277.82 million RMB, and the RECL is 128.78 million RMB. Moreover, 19.76, 18.94, and 15.25 million RMB, respectively, are the IECV per km2. It is clear that reclamation of the mine region is still insufficient to return to the pre-mining level, and that returning to the undisturbed level is extremely challenging. Due to the minimal level of mining in 1986 and the comparatively small area of bare land, the differences in the IECV between the NA, DA, and RA sectors are not substantial. To gain further insight into the Antabuse mine’s cumulative value trend, spatial mapping was used to convert image elements’ cumulative values (Figure 8c). The cumulative value of 22.49% in the mine area was increasing based on the overall distribution pattern. This was, however, a slight increase, with 71.71% of growing regions increasing by 0–10,000 RMB/km2 and 28.18% increasing by 10,000–20,000 RMB/km2. As a result, only 0.10% of the locations have experienced a significant gain in cumulative value. The total value of 77.51% of the regions decreased, but the decrease was not as significant as the increase in the rising regions. In particular, −10,000–0 RMB/km2 dominated 98.29% of the falling regions, 1.68% of the declining regions were dominated by −20,000–10,000 RMB/km2, and 0.03% of the declining regions were controlled by less than 20,000 RMB/km2.

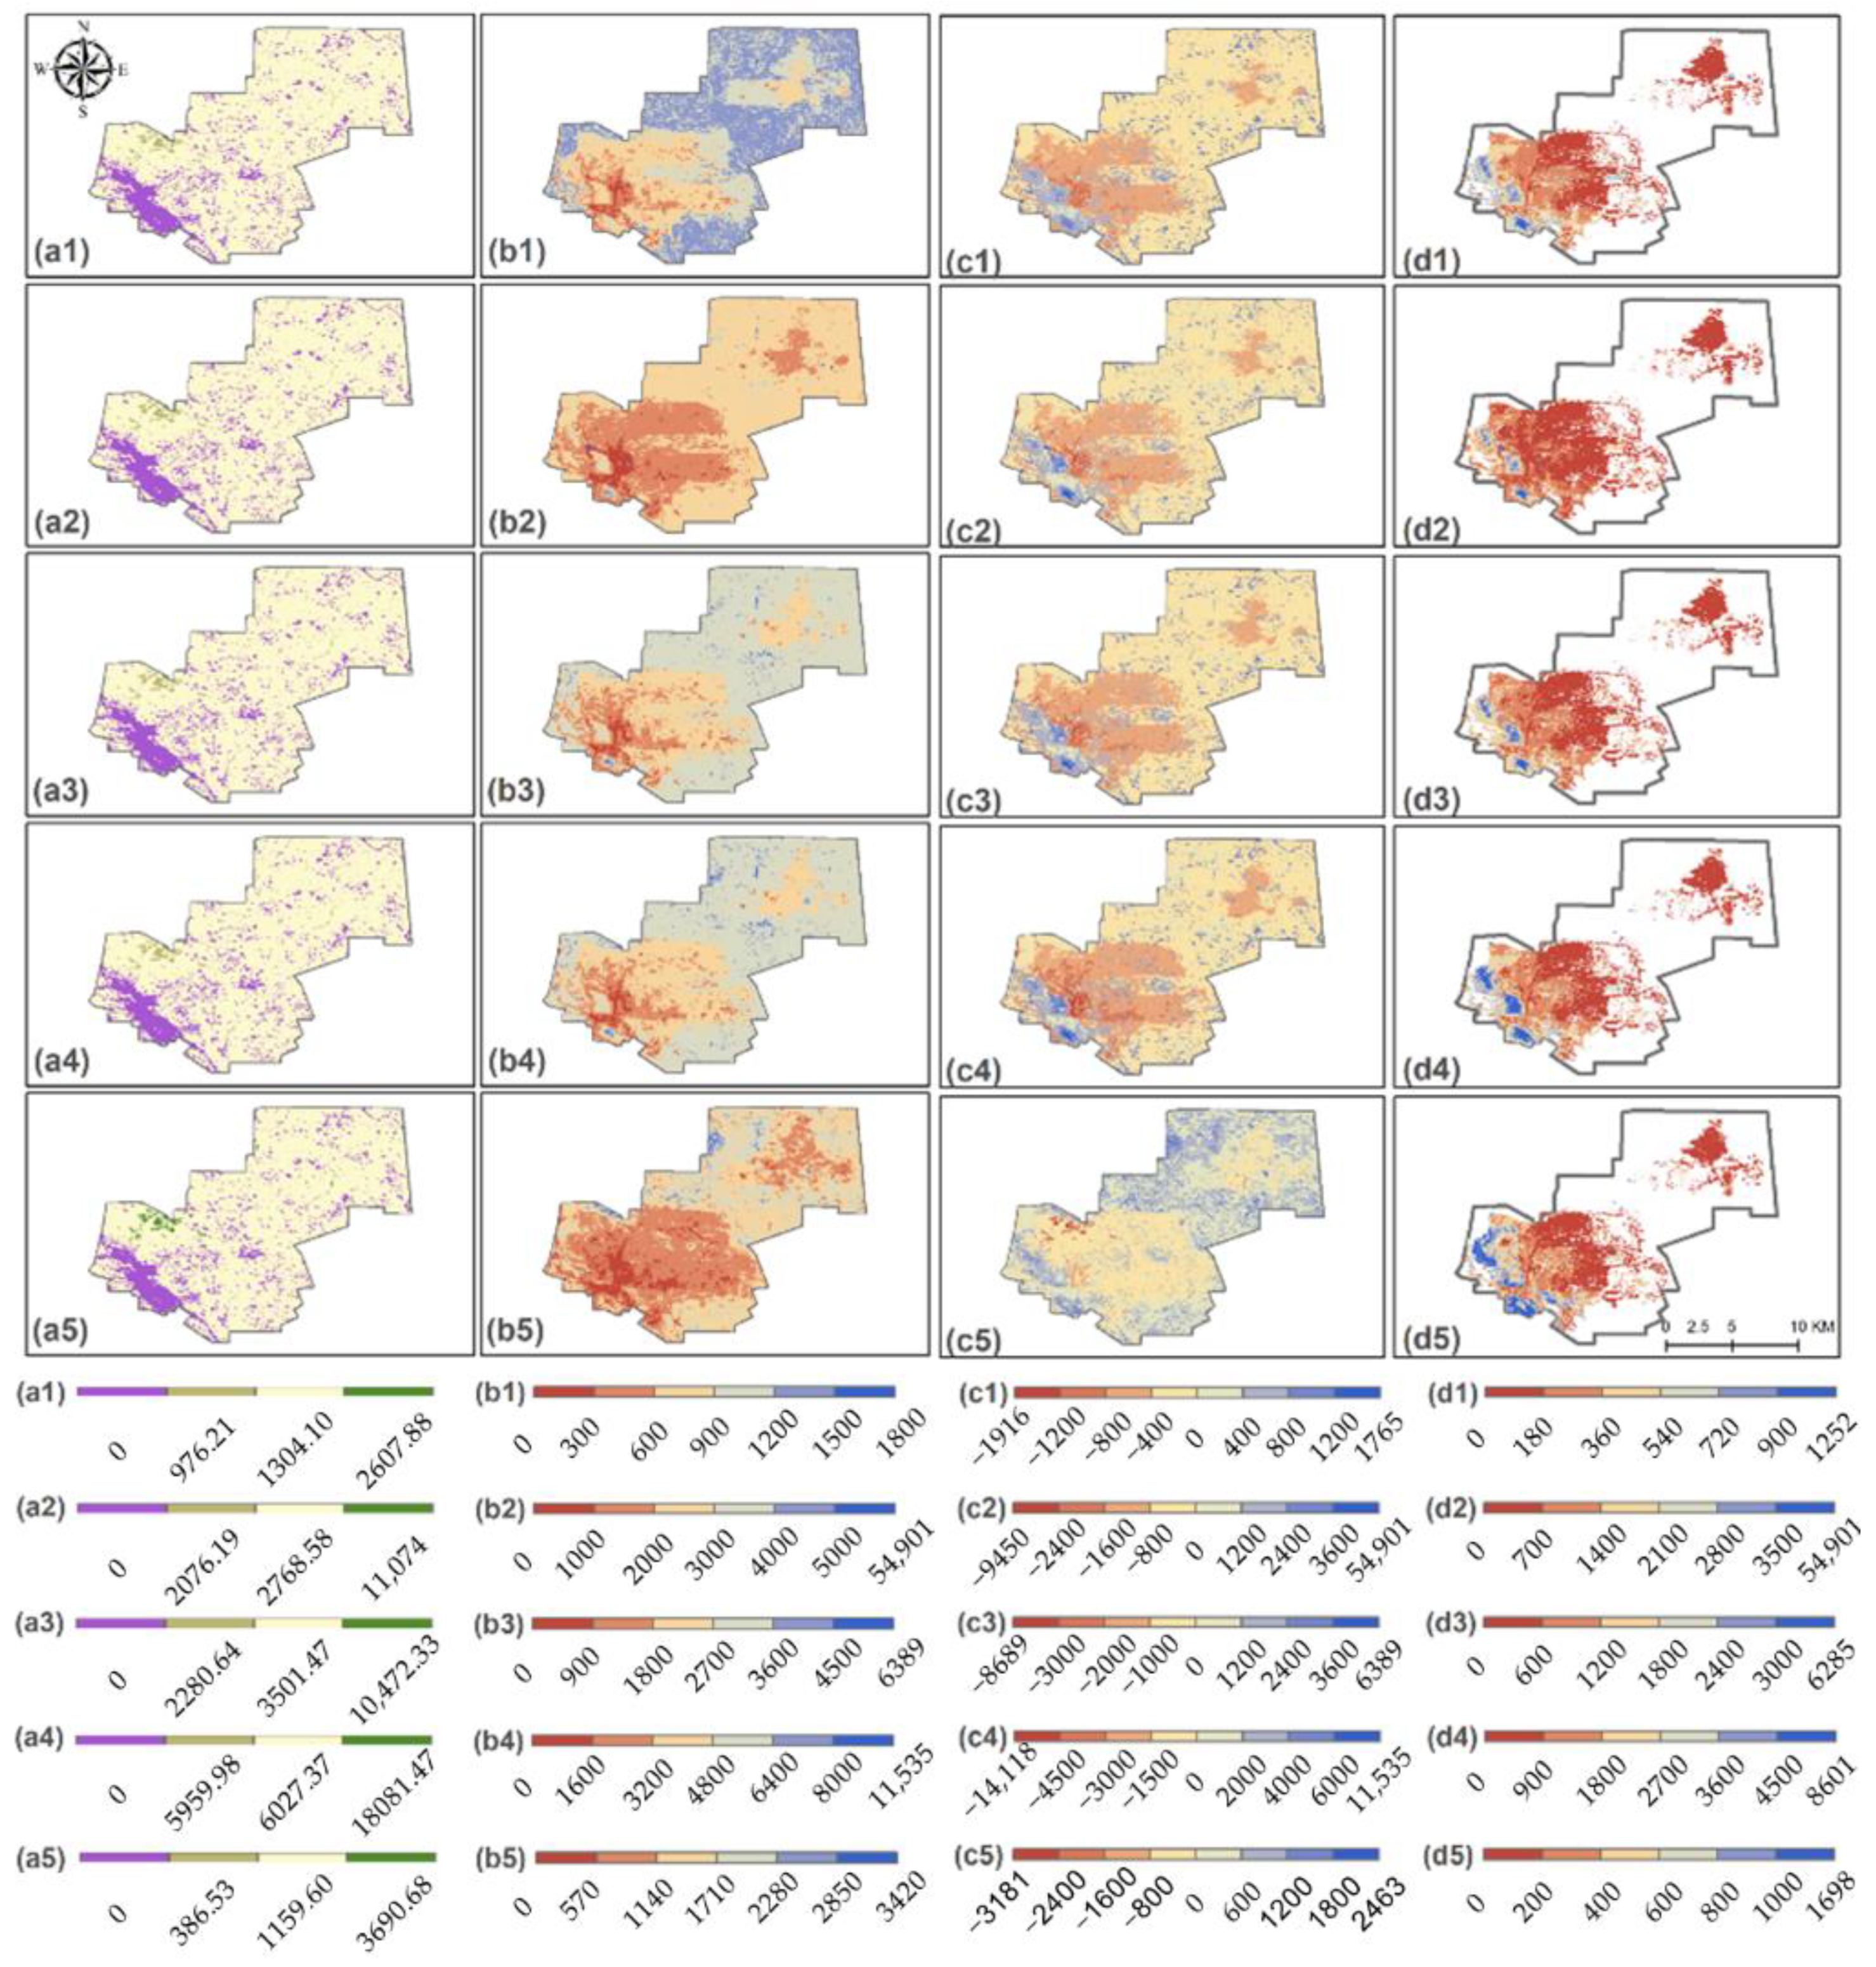
3.4. ECE Spatial Characteristics of Individual Ecosystem Service Functions

Individual ecosystem service functions contribute variably to various types of overall cumulative values, and individual functions also convey variances in nature’s ability to sustain human needs. As a result, the spatial measurements of each ecosystem service function in terms of ideal, actual, loss due to exploitation, and gain/loss due to reclamation were examined in this work (Figure 9 and Table 4). The individual service functions showed different trends in different utilization regions. Only the cumulative value of the food production function increased by 60.88 million RMB over 30 years of mining exploitation, with a rise of 23.01%, while the cumulative value of the remaining four service functions declined. It is noteworthy that, compared to the total amount of the study area, the climate regulation service had the smallest decrease (4.32%) and the soil protection service had the highest decrease (8.83%). It can be understood in NA that the cumulative value of all individual service functions is increasing, which may be due to natural factors such as climate change. Overall, both soil protection and biodiversity maintenance functions in NA increased very little, by only 1.44% and 0.29%. The biodiversity maintenance and food production functions increased by 6.89% and 47.12%, respectively. In DA, the cumulative values of all the service functions showed a decreasing trend and large variation. Soil protection, soil and water conservation, and biodiversity maintenance all decreased by more than 20%, 23.86%, 21.72%, and 24.20%, respectively, and the smallest food production function was 9.15%. This shows that the trends of disturbed areas and natural areas are completely in contrast, and the magnitude is much higher than that of natural areas, with the exception of food production. In RA, it can be seen that the cumulative value of losses still exists, but the magnitude is much smaller than in disturbed areas. The impact of reclamation on soil conservation and food production is minimal, with a loss of only 3.68 and 2.55 million RMB, while soil and water conservation, biodiversity, and climate regulation have a loss of more than 10 million RMB, which is, of course, related to the large total base of these three functions.

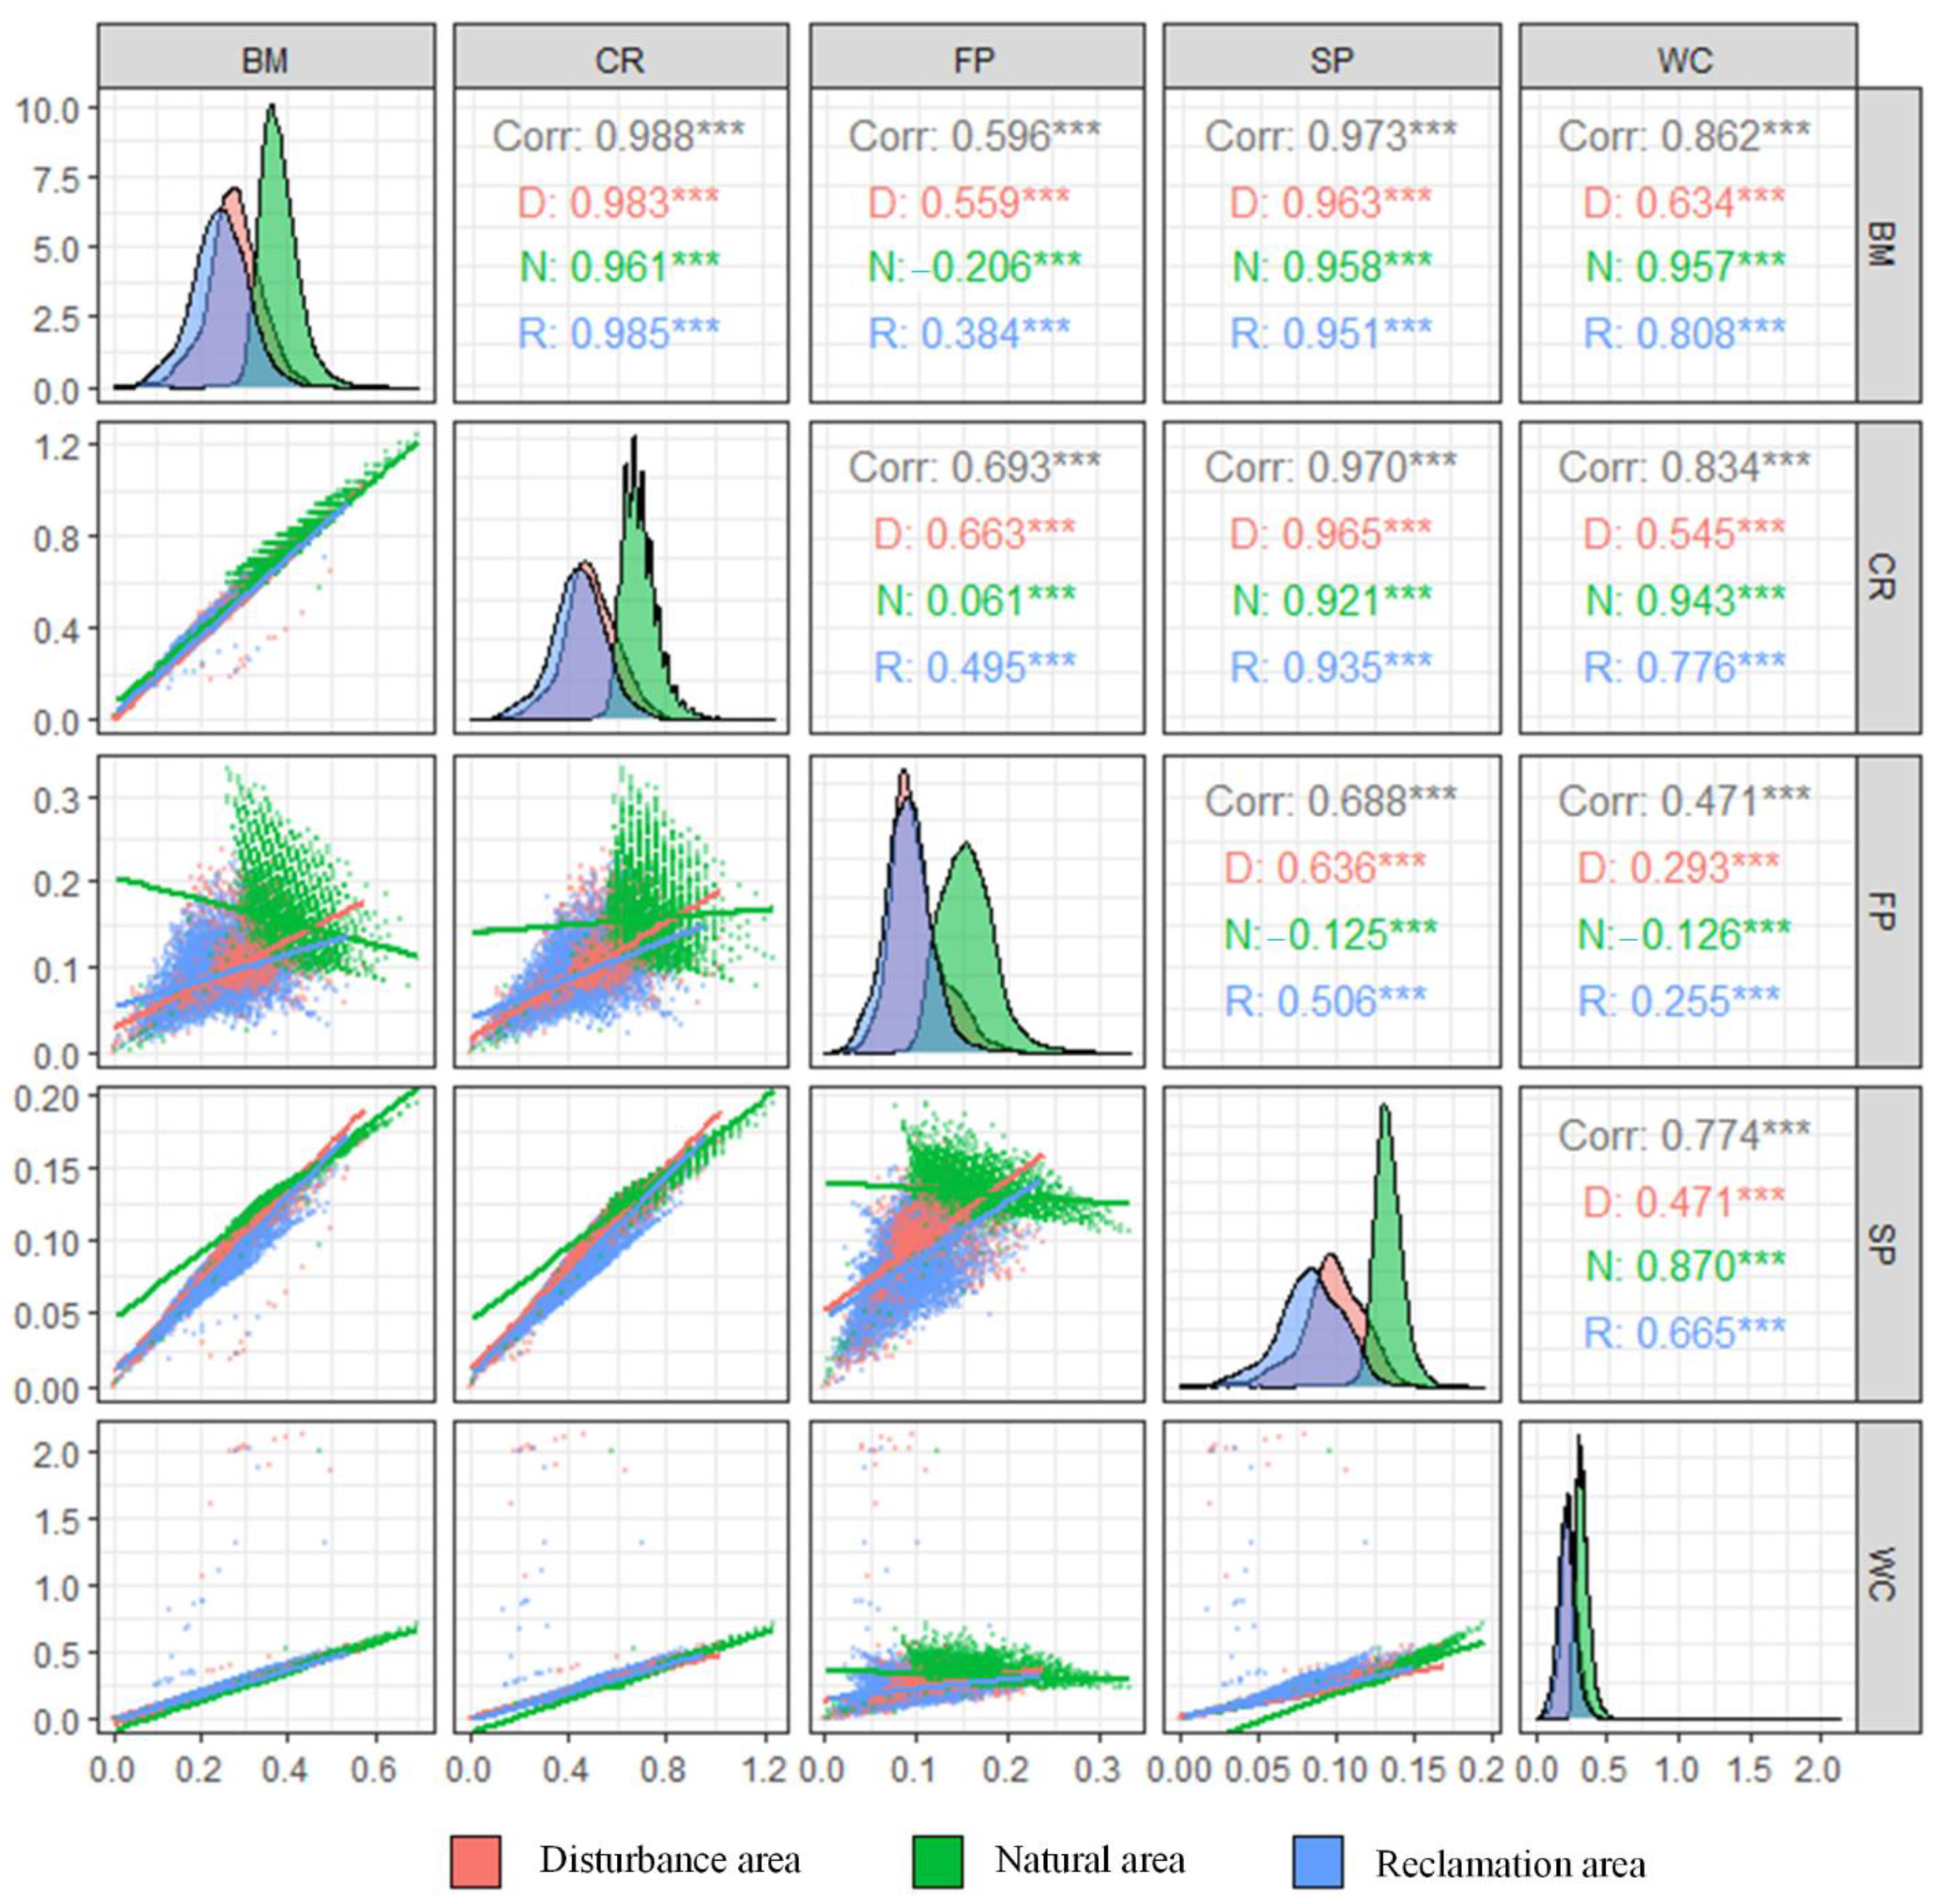
3.5. Exploring Trade-Offs and Synergies among Ecosystem Services

There were 30 possible pairing outcomes based on the cumulative values contributed by each of the five ecosystem service functions in different types of locations, and all 30 pairs were substantially connected at the p < 0.001 level. Only three pairs had highly significant negative correlations, whereas twenty-seven had highly significant positive correlations (Figure 10). In general, except for FP, each service function’s cumulative value exhibited a highly significant positive correlation, while CR, BM, and SP had high Pearson correlation coefficients regardless of the area (r ranging from 0.921 to 0.985), indicating a strong synergistic link. With the cumulative value of each function, FP revealed spatially uneven Pearson correlation values ranging from −0.206 to 0.663. Only in the natural region did FP show significantly negative relationships with the cumulative value of the three service functions, BM, SP, and WC. Their Pearson correlation coefficients (r) ranged from −0.126 to −0.206, with an average of around −0.152, indicating that there is a general trade-off relationship. In conclusion, all service functions’ cumulative values demonstrate regular trade-offs and synergistic interactions. The great majority of service cumulative values will very certainly have a high degree of synergy between them. With the exception of FP, which, in natural regions, exhibits trade-offs with BM, SP, and WC, the cumulative value of each service exhibits varying degrees of synergistic interactions. With the exception of natural areas, FP generally exhibits sporadic synergistic interactions.

4. Discussion

4.1. Spatial and Temporal Changes in ECE

Open-pit coal mining has led to disruptive changes in land cover and surface landscape patterns, and the exploration of land use shifts and landscape index changes serves to evaluate the impact of land disturbance from mining sites. Land use change, on the other hand, is not a complete reflection of human usage and the future survival of natural capital; it can only be found as a result of human actions [44]. Calculations based on the classification of land change over time scales tend to miss the potential to detect major changes, but evaluating the value of ecosystem services and their cumulative effects in mining regions actually shows the ecological gains and losses due to mining and reclamation [45]. Calculations utilizing single-period imaging do not genuinely address ecological concerns of human relevance, and results at rough time scales are inherently erroneous. Cumulative results based on ecosystem service values obtained from time-series data better reflect the human-driven impacts behind land cover, especially because the land cover data on which the calculations are based are uniform in phenology, avoiding the classification accuracy issues that may arise from seasonal variation.
According to the findings of a study conducted in the Antabuse mine region, mining disturbance operations have a significant impact on ecosystem stability and recovery. With a value of less than 55.5% of the average, the area where the genuine cumulative value is determined to be low matches well with the open-pit mining area and is much lower than the area around the mine. Furthermore, the area with the lowest cumulative value accounts for 42.79% of the whole scale area, or roughly half of the research area. Open-pit mining activities resulted in an average drop of 32.25% in cumulative value when compared to the ideal cumulative value of the corresponding region; it should also be noted that it is difficult to compare with the real total ecological improvement of the area. In 1986, the majority of land types in the Antabuse mine region were grassland, and the enormous increase in arable land resulted in a significant increase in the non-mining areas’ cumulative value. The ongoing reclamation of grassland into arable land resulted in a 21.94% increase in the overall cumulative value of services as compared to the non-mining area of optimum cumulative value. As a result, the increase in cultivated land masks the entire cumulative value owing to mining. The cumulative ecological value increases and losses owing to land use activities from 1986 to 2021 are disclosed using spatial raster computations. The restoration of grassland to arable land and mining exploitation are determined to be mostly covered inside the mining region, with these two activities occupying as much as 82.52% of the land area, assuming that the open-pit mining area was not counted in 1986. When the two operations are combined, open-pit mining causes 76.18% of the area to lose cumulative ecological value, while farmland reclamation causes only 6.34% of the area to gain cumulative ecological value. This causes us to question whether our efforts to restore mined land are truly effective.
Further examination of the land use pattern in 2021 finds that arable land represents 9.51% of the area, grassland 76.14%, and mining disturbs only 13.54% of the total mine area. However, we cannot see the reduction in ecosystem services behind the lush grasses when adopting the perspective of the entire mining region. As a result, the examination of cumulative value changes provides a different perspective to land use analysis. The rapid expansion in the amount of arable land and the constant movement of the mined area into smaller regions are the intuitive results of looking at land use cover data. However, using time-series analysis of cumulative ecological values, we can see that open-pit mining’s environmental impacts are significantly overestimated.

4.2. Spatiotemporal Trade-Offs and Synergies among Ecosystem Services

Understanding the synergies and trade-offs between the cumulative value of ecosystem service functions is crucial for unraveling the mechanisms driving mining exploitation, although such impacts do not always occur in a predictable manner [46]. As a result, we calculated the trend of Spearman correlation coefficients for a single function’s cumulative value over time [47]. The synergistic impact between CR, SP, and WC is found to be relatively stable in any partition (Figure 11), with r essentially constant around 1. The synergistic impact of BM and CR, SP, and WC, and SP and WC, respectively, was also generally constant until 2010, with a long-term stable correlation coefficient r. However, the synergistic effect has been declining since 2010, and it is expected to continue to decline in the future. The declining tendency of the total area, disturbed area, and reclaimed area is higher than that of the natural area, as can be seen from the observations. It is possible that the loss is attributable in part to the natural decline brought about by climate change or socioeconomic activities. Mining damage and reclamation that did not improve the biodiversity environment are most likely to blame for the disparity in decrease rates. The trend of cumulative values as a function of the four studies BM, CR, SP, and WC, on the other hand, shows strong oscillations and interferes with regional synergies and trade-offs. Over the course of the trial, the four groups of results indicated largely synergistic benefits, but to varying degrees (r ranging from −0.206 to 0.663). Between 1995 and 2000, however, all four groups demonstrated a low degree of trade-off, which was linked to the prevailing agricultural reclamation program at the time. Throughout the study period, the negative trend was linked to the reclamation of large-scale agriculture, but none of the linkages between the cumulative values of functions were broken again. This demonstrates that the latter reclamation effort is relatively steady and long-term.

4.3. Mapping of ECE in Surface Mining Area

This is the first time, to our knowledge, that ecological service values in a mining area have been described at high temporal resolution (1 year) and high spatial resolution (30 m). This permits the conclusions to be exceptionally close to historical occurrences and fills in the gaps left by earlier studies’ lack of data collection and application. The Landsat program, which provides the world’s oldest continuous record of space-based observations, allows researchers to quickly access enormous amounts of remote sensing data to follow land usage and changes in order to examine the various causes behind the occurrence [48]. We mapped the ecological cumulative value of the Antabuse mining area using the high-quality spatial information provided by the Landsat dataset. Second, the changes in ecological service values in the coal-mining-damaged area were carefully validated in this study. Due to the reducing scope of the mining disturbance, the spatial statistical analysis approach revealed information readily hidden by land use mapping, demonstrating that the mining disturbance did not minimize the influence on the regional ecological environment. Moreover, it was discovered that, despite its small scale, the reclamation of arable land in the mining area greatly reduced further ecological degradation and ensured that the area could be managed sustainably in the future. Finally, our research area was in Inner Mongolia, China, which is a major producer of open-pit coal mines around the world [49]. We effectively mapped the ecological cumulative value distribution of this typical area using the approach of time-series analysis in this study, proving that the method is suitable for determining the repercussions of regional disruptions. As a result, the current technology can be applied to a variety of site scales that have been subjected to severe disturbances, such as sand and gravel quarries, copper mines, and other sites.

4.4. Limitations and Future Research Priorities

Despite the fact that this study created an assessment method of cumulative service value to accurately reconstruct the cumulative loss and gain of overall mining disturbance and reclamation on the environment in the Pingshuo mining area, it still has certain flaws. (1) The evaluation of cumulative effects includes not only the cumulative situation in time and space, but also direct and indirect cumulative outcomes, such as local socioeconomic changes as a result of environmental changes. These side effects are not directly seen in the cumulative ecological effects. (2) Value equivalent coefficients derived from earlier research are used to estimate the cumulative value of particular ecosystem services, and they are reasonably accurate for the wider study region. While these data are still useful for evaluating the Antabuse mine, the functional volume-based calculation method is more accurate. (3) The mining boundary used in this study came from a database, and the disturbance and reclamation results suggest that the boundary does include all mining activities. The ecological cumulative effect border of mining impacts, on the other hand, does not always integrate well with this, and determination of the mining impact boundary and threshold has been a research blind spot. As a result, it is unclear whether adopting a precise research boundary is suitable, which is one of the study’s shortcomings.
In comparison to current academic approaches, the cumulative effects of mining disturbance and reclamation examined in this study are geographically and temporally continuous and exact. We will improve the method in the future to accommodate more open-pit mining sites as well as larger-scale exploration, allowing us to draw more distinctions or commonalities in the study conclusions to direct a series of mining activities in specific mining areas or regions. Furthermore, a more comprehensive and complicated identification of mining effect mechanisms is being planned in order to better quantify the ecological cost of mining by determining impact boundaries or thresholds for each service.

5. Conclusions

Understanding the cumulative ecological effects of mining disturbance and reclamation is critical for fine tuning reclamation targets and sensible resource allocation for mine rehabilitation. This research used phenological indices to reconstruct continuous geographical and temporal changes in land cover, with a focus on tracking the development process of former mining and reclamation regions. We expose the cumulative ecological losses due to open-pit mining in the Pinshuo Pingshuo mining area from 1986 to 2021 by mapping changes in the cumulative value of ecosystem services, as well as the contributions of five ecosystem service functions and their synergistic effects on one another. The study’s findings can help us to better understand the cumulative effects of open-pit mining on ecology and ecosystem services, as well as the synergies and trade-offs across ecosystem service functions in the mining area.
The following are some of the study’s findings: (1) in the Pingshuo mining area, open-pit mining resulted in the formation of 93.51 km2 of natural land, 39.60 km2 of disturbed land, and 44.58 km2 of reclaimed land; (2) open-pit mining in the mining area mainly resulted in the loss of 122.18 km2 (80.91%) of native grassland, but the damaged area caused by mining only slightly increased through reclamation into grassland (31.30 km2) and cropland (16.24 km2); (3) the cumulative ecological value of the mining area decreased by 128.78 million RMB, but the true cumulative value per unit area was lower in DA (1483.47 million RMB) and RA (1297.00 million RMB) than in NA (2120.98 million RMB); (4) with the exception of the cumulative value of the food production function, the cumulative value of the study area increased; (5) with the exception of the cumulative value of the food production function, which grew, the cumulative value of all individual functions in the study region dropped. The majority of service cumulative values have a strong synergistic relationship. FP, on the other hand, exhibits a trade-off with the cumulative value of the BM, SP, and WC service functions in the natural environment.
This study provides an important foundation for ecosystem management and restoration in mining sites by precisely reconstructing the responses of ecosystem service functions and their values as a result of mining activities. The developed methodology could also aid future advancements in other related subject areas, thereby promoting the long-term sustainability of natural, social, and ecological systems.

Author Contributions

W.Y.: conceptualization, methodology, writing—original draft, review, editing, and supervision. T.H.: conceptualization, software, validation, investigation, review. Y.M., W.Z., W.W. and J.L.: writing—original draft. J.P. and X.L.: data curation and analysis. All authors have read and agreed to the published version of the manuscript.

Funding

This research work was funded by the Basic Applied Research Projects of Shanxi Province (No. 201901D111466). The work was also supported by Key projects of Shanxi coal based low carbon joint fund of National Natural Science Foundation of China (No. U1810203) and the China Postdoctoral Science Foundation Funded Project (No. 2021M702795). The authors are grateful to all members of research group for their help in data process.

Data Availability Statement

All data are available upon request from the corresponding author.

Conflicts of Interest

The authors declare that they have no known competing financial interests or personal relationships that could have appeared to influence the work reported in this paper.

References

  1. Xiao, W.; Chen, W.; Deng, X. Coupling and coordination of coal mining intensity and social-ecological resilience in China. Ecol. Indic. 2021, 131, 108167. [Google Scholar] [CrossRef]
  2. Ma, Q.; Wu, J.; He, C.; Fang, X. The speed, scale, and environmental and economic impacts of surface coal mining in the Mongolian Plateau. Resour. Conserv. Recycl. 2021, 173, 105730. [Google Scholar] [CrossRef]
  3. Jiskani, I.M.; Cai, Q.; Zhou, W.; Shah, S.A.A. Green and climate-smart mining: A framework to analyze open-pit mines for cleaner mineral production. Resour. Policy 2021, 71, 102007. [Google Scholar] [CrossRef]
  4. Guan, C.; Zhang, B.; Li, J.; Zhao, J. Temporal and spatial changes of land use and landscape in a coal mining area in Xilingol grassland. IOP Conf. Ser. Earth Environ. Sci. 2017, 52, 12052. [Google Scholar] [CrossRef]
  5. Sagan, V.; Peterson, K.T.; Maimaitijiang, M.; Sidike, P.; Sloan, J.; Greeling, B.A.; Maalouf, S.; Adams, C. Monitoring inland water quality using remote sensing: Potential and limitations of spectral indices, bio-optical simulations, machine learning, and cloud computing. Earth-Sci. Rev. 2020, 205, 103187. [Google Scholar] [CrossRef]
  6. Qian, D.; Yan, C.; Xiu, L.; Feng, K. The impact of mining changes on surrounding lands and ecosystem service value in the Southern Slope of Qilian Mountains. Ecol. Complex. 2018, 36, 138–148. [Google Scholar] [CrossRef]
  7. Xiao, W.; Deng, X.; He, T.; Chen, W. Mapping annual land disturbance and reclamation in a surface coal mining region using google earth engine and the landtrendr algorithm: A case study of the shengli coalfield in Inner Mongolia, China. Remote Sens. 2020, 12, 1612. [Google Scholar] [CrossRef]
  8. Worlanyo, A.S.; Jiangfeng, L. Evaluating the environmental and economic impact of mining for post-mined land restoration and land-use: A review. J. Environ. Manag. 2021, 279, 111623. [Google Scholar] [CrossRef]
  9. Huang, Y.; Chen, Q.; Deng, M.; Japenga, J.; Li, T.; Yang, X.; He, Z. Heavy metal pollution and health risk assessment of agricultural soils in a typical peri-urban area in southeast China. J. Environ. Manag. 2018, 207, 159–168. [Google Scholar] [CrossRef]
  10. Höök, M.; Aleklett, K. Historical trends in American coal production and a possible future outlook. Int. J. Coal Geol. 2009, 78, 201–216. [Google Scholar] [CrossRef]
  11. Yuan, C.; Cui, H.; Wang, W.; Ma, S. Cause factors in emergency process of fire accidents for oil and gas storage and transportation systems based on ISM and AHP. J. Hazard. Toxic Radioact. Waste 2019, 23, 4018038. [Google Scholar] [CrossRef]
  12. Jiang, J.; Zhang, X.S. Fuzzy Comprehensive Evaluation Method for Electric Safety in Plants and Mines. Appl. Mech. Mater. 2010, 40–41, 398–403. [Google Scholar] [CrossRef]
  13. Zhang, J.; Zeng, Y.; Reniers, G.; Liu, J. Analysis of the interaction mechanism of the risk factors of gas explosions in Chinese underground coal mines. Int. J. Environ. Res. Public Health 2022, 19, 1002. [Google Scholar] [CrossRef]
  14. Xu, C.; Zhou, K.; Xiong, X.; Gao, F. Assessment of coal mining land subsidence by using an innovative comprehensive weighted cloud model combined with a PSR conceptual model. Environ. Sci. Pollut. Res. 2022, 29, 18665–18679. [Google Scholar] [CrossRef] [PubMed]
  15. Qiao, X.; Li, G.; Li, M.; Zhou, J.; Du, J.; Du, C.; Sun, Z. Influence of coal mining on regional karst groundwater system: A case study in West Mountain area of Taiyuan City, northern China. Environ. Earth Sci. 2011, 64, 1525–1535. [Google Scholar] [CrossRef]
  16. Zhang, M.; Wang, J.; Feng, Y. Temporal and spatial change of land use in a large-scale opencast coal mine area: A complex network approach. Land Use Policy 2019, 86, 375–386. [Google Scholar] [CrossRef]
  17. Wu, Z.; Lei, S.; Yan, Q.; Bian, Z.; Lu, Q. Landscape ecological network construction controlling surface coal mining effect on landscape ecology: A case study of a mining city in semi-arid steppe. Ecol. Indic. 2021, 133, 108403. [Google Scholar] [CrossRef]
  18. Xu, H.; Wang, Y.; Guan, H.; Shi, T.; Hu, X. Detecting ecological changes with a remote sensing based ecological index (RSEI) produced time series and change vector analysis. Remote Sens. 2019, 11, 2345. [Google Scholar] [CrossRef]
  19. Demirbugan, A. Changes in ecosystem service benefit in Soma lignite region of Turkey. Resour. Policy 2019, 64, 101522. [Google Scholar] [CrossRef]
  20. Cañedo-Argüelles, M.; Kefford, B.J.; Piscart, C.; Prat, N.; Schäfer, R.B.; Schulz, C.-J. Salinisation of rivers: An urgent ecological issue. Environ. Pollut. 2013, 173, 157–167. [Google Scholar] [CrossRef]
  21. Scholte, S.S.K.; van Teeffelen, A.J.A.; Verburg, P.H. Integrating socio-cultural perspectives into ecosystem service valuation: A review of concepts and methods. Ecol. Econ. 2015, 114, 67–78. [Google Scholar] [CrossRef]
  22. Yang, J.; Tang, Y. The increase in ecosystem services values of the sand dune succession in northeastern China. Heliyon 2019, 5, e02243. [Google Scholar] [CrossRef] [PubMed]
  23. Xie, G.; Zhang, C.; Zhen, L.; Zhang, L. Dynamic changes in the value of China’s ecosystem services. Ecosyst. Serv. 2017, 26, 146–154. [Google Scholar] [CrossRef]
  24. Li, J.; Liang, J.; Wu, Y.; Yin, S.; Yang, Z.; Hu, Z. Quantitative evaluation of ecological cumulative effect in mining area using a pixel-based time series model of ecosystem service value. Ecol. Indic. 2021, 120, 106873. [Google Scholar] [CrossRef]
  25. Castro, A.J.; Verburg, P.H.; Martín-López, B.; Garcia-Llorente, M.; Cabello, J.; Vaughn, C.C.; López, E. Ecosystem service trade-offs from supply to social demand: A landscape-scale spatial analysis. Landsc. Urban Plan. 2014, 132, 102–110. [Google Scholar] [CrossRef]
  26. Häyhä, T.; Franzese, P.P.; Paletto, A.; Fath, B.D. Assessing, valuing, and mapping ecosystem services in Alpine forests. Ecosyst. Serv. 2015, 14, 12–23. [Google Scholar] [CrossRef]
  27. Wang, H.; Zhang, C.; Yao, X.; Yun, W.; Ma, J.; Gao, L.; Li, P. Scenario simulation of the tradeoff between ecological land and farmland in black soil region of Northeast China. Land Use Policy 2022, 114, 105991. [Google Scholar] [CrossRef]
  28. Gissi, E.; Manea, E.; Mazaris, A.D.; Fraschetti, S.; Almpanidou, V.; Bevilacqua, S.; Coll, M.; Guarnieri, G.; Lloret-Lloret, E.; Pascual, M. A review of the combined effects of climate change and other local human stressors on the marine environment. Sci. Total Environ. 2021, 755, 142564. [Google Scholar] [CrossRef]
  29. Xu, W.; Wang, J.; Zhang, M.; Li, S. Construction of landscape ecological network based on landscape ecological risk assessment in a large-scale opencast coal mine area. J. Clean. Prod. 2021, 286, 125523. [Google Scholar] [CrossRef]
  30. Ju, J.; Roy, D.P.; Vermote, E.; Masek, J.; Kovalskyy, V. Continental-scale validation of MODIS-based and LEDAPS Landsat ETM+ atmospheric correction methods. Remote Sens. Environ. 2012, 122, 175–184. [Google Scholar] [CrossRef] [Green Version]
  31. Vermote, E.; Justice, C.; Claverie, M.; Franch, B. Preliminary analysis of the performance of the Landsat 8/OLI land surface reflectance product. Remote Sens. Environ. 2016, 185, 46–56. [Google Scholar] [CrossRef] [PubMed]
  32. Cerezo, M.; Sone, A.; Volkoff, T.; Cincio, L.; Coles, P.J. Cost function dependent barren plateaus in shallow parametrized quantum circuits. Nat. Commun. 2021, 12, 1–12. [Google Scholar] [CrossRef] [PubMed]
  33. Kennedy, R.E.; Yang, Z.; Gorelick, N.; Braaten, J.; Cavalcante, L.; Cohen, W.B.; Healey, S. Implementation of the LandTrendr algorithm on google earth engine. Remote Sens. 2018, 10, 691. [Google Scholar] [CrossRef]
  34. Roy, D.P.; Zhang, H.K.; Ju, J.; Gomez-Dans, J.L.; Lewis, P.E.; Schaaf, C.B.; Sun, Q.; Li, J.; Huang, H.; Kovalskyy, V. A general method to normalize Landsat reflectance data to nadir BRDF adjusted reflectance. Remote Sens. Environ. 2016, 176, 255–271. [Google Scholar] [CrossRef]
  35. Yang, Y.; Erskine, P.D.; Lechner, A.M.; Mulligan, D.; Zhang, S.; Wang, Z. Detecting the dynamics of vegetation disturbance and recovery in surface mining area via Landsat imagery and LandTrendr algorithm. J. Clean. Prod. 2018, 178, 353–362. [Google Scholar] [CrossRef]
  36. Dun, Y.; Wang, J.; Bai, Z.; Chen, X.; Guo, Y. Changes in Pingshuo opencast mining area ecosystem service values based on grey prediction modeling. Resour. Sci. 2015, 37, 494. [Google Scholar]
  37. Praticò, S.; Solano, F.; Di Fazio, S.; Modica, G. Machine learning classification of mediterranean forest habitats in google earth engine based on seasonal sentinel-2 time-series and input image composition optimisation. Remote Sens. 2021, 13, 586. [Google Scholar] [CrossRef]
  38. Azar, D.; Engstrom, R.; Graesser, J.; Comenetz, J. Generation of fine-scale population layers using multi-resolution satellite imagery and geospatial data. Remote Sens. Environ. 2013, 130, 219–232. [Google Scholar] [CrossRef]
  39. Grech, A.; Pressey, R.L.; Day, J.C. Coal, cumulative impacts, and the Great Barrier Reef. Conserv. Lett. 2016, 9, 200–207. [Google Scholar] [CrossRef]
  40. Li, S.; Zhao, Y.; Xiao, W.; Yellishetty, M.; Yang, D. Identifying ecosystem service bundles and the spatiotemporal characteristics of trade-offs and synergies in coal mining areas with a high groundwater table. Sci. Total Environ. 2022, 807, 151036. [Google Scholar] [CrossRef]
  41. Jain, A.; Nandakumar, K.; Ross, A. Score normalization in multimodal biometric systems. Pattern Recognit. 2005, 38, 2270–2285. [Google Scholar] [CrossRef]
  42. Zhao, M.; Peng, J.; Liu, Y.; Li, T.; Wang, Y. Mapping watershed-level ecosystem service bundles in the Pearl River Delta, China. Ecol. Econ. 2018, 152, 106–117. [Google Scholar] [CrossRef]
  43. Alarcon, G.G.; Ayanu, Y.; Fantini, A.C.; Farley, J.; Schmitt Filho, A.; Koellner, T. Weakening the Brazilian legislation for forest conservation has severe impacts for ecosystem services in the Atlantic Southern Forest. Land Use Policy 2015, 47, 1–11. [Google Scholar] [CrossRef]
  44. Yuan, D.; Hu, Z.; Yang, K.; Guo, J.; Li, P.; Li, G.; Fu, Y. Assessment of the Ecological Impacts of Coal Mining and Restoration in Alpine Areas: A Case Study of the Muli Coalfield on the Qinghai-Tibet Plateau. IEEE Access 2021, 9, 162919–162934. [Google Scholar] [CrossRef]
  45. Weiqi, L.; Guangzhou, C. Evolution of ecosystem service value and ecological storage estimation in huainan coal mining area. Bull. Environ. Contam. Toxicol. 2021, 107, 1243–1249. [Google Scholar] [CrossRef]
  46. Cortés-Calderón, S.; Mora, F.; Arreola-Villa, F.; Balvanera, P. Ecosystem services supply and interactions along secondary tropical dry forests succession. For. Ecol. Manag. 2021, 482, 118858. [Google Scholar] [CrossRef]
  47. Wu, J.; Zhao, Y.; Yu, C.; Luo, L.; Pan, Y. Land management influences trade-offs and the total supply of ecosystem services in alpine grassland in Tibet, China. J. Environ. Manag. 2017, 193, 70–78. [Google Scholar] [CrossRef]
  48. Tan, W.; Liu, P.; Liu, Y.; Yang, S.; Feng, S. A 30-year assessment of phytoplankton blooms in Erhai Lake using Landsat imagery: 1987 to 2016. Remote Sens. 2017, 9, 1265. [Google Scholar] [CrossRef]
  49. Yang, N.; Tang, S.; Zhang, S.; Huang, W.; Chen, P.; Chen, Y.; Xi, Z.; Yuan, Y.; Wang, K. Fluorine in Chinese coal: A review of distribution, abundance, modes of occurrence, genetic factors and environmental effects. Minerals 2017, 7, 219. [Google Scholar] [CrossRef] [Green Version]
Figure 1. Location of the study area. (a) china, (b) shanxi province, (c) pingshuo coal field.
Remotesensing 14 04381 g001
Figure 2. Workflow of data procession.
Remotesensing 14 04381 g002
Figure 3. Temporal profiles for representative land cover types.
Remotesensing 14 04381 g003
Figure 4. Year distribution map of disturbance and reclamation in Pingshuo coalfield. (a) The study region is divided into natural area (NA), disturbance area (DA), and reclamation area (RA); (b) temporal and spatial distribution of mining process; (c) temporal and spatial distribution of reclamation process; (d,e) the area of land exploited or reclaimed in each year.
Remotesensing 14 04381 g004
Figure 5. Land use classification at 5-year intervals during 1986–2021.
Remotesensing 14 04381 g005
Figure 6. Land use type conversion during 1986–2021.
Remotesensing 14 04381 g006
Figure 7. ESV value curve from 1986 to 2021.
Remotesensing 14 04381 g007
Figure 8. Changes in ECE during 1986–2021 (million RMB). (a) Ideal ecological cumulative value (IECV), (b) real ecological cumulative value (RECV), (c) real ecological cumulative loss (RECL).
Remotesensing 14 04381 g008
Figure 9. Changes in ECE for 5 ecological functions during 1986–2021. (a1a5) Ideal ecological cumulative value (IECV), (b1b5) real ecological cumulative value (RECV), (c1c5) real ecological cumulative loss (RECL), (d1d5) real restoration cumulative value (RRCV).
Remotesensing 14 04381 g009
Figure 10. Pixel-scale correlations between pairwise ecosystem services during 1986–2021. *** Significantly correlated at the 0.001 level.
Remotesensing 14 04381 g010
Figure 11. Significant correlation coefficient changes between pairwise ecosystem services during 1986–2021 (_ represents different pairs of ecosystem service functions—for example, BM_CR is the pair of BM (biodiversity maintenance) and CR (climate regulation)). D: disturbance area, N: natural area, R: reclamation area.
Remotesensing 14 04381 g011
Table 1. Ecosystem service value of land use types per unit area in Pingshuo mining area (RMB/hm2).
Ecosystem ServiceFarmlandForestlandGrasslandFarmland after ReclamationForestland after ReclamationGrassland after ReclamationWater
Soil formation and protection301.3804.9402.5198.5530.3265.20
Water conservation640.83417.9854.5422.12251.9563.021,766.2
Biodiversity maintenance703.93232.21080.7436.82129.5712.02468.8
Climate regulation1839.55580.71860.31211.93676.81225.6950.7
Food production1139.1119.3357.9750.578.6235.8113.9
Note: Other land use types, such as mine land, settlement land, and bare land, were treated as 0 values in this study, so they were excluded from the computation of ecosystem service values in the Pinshuo mining area [36].
Table 2. Accuracy of land use classification obtained based on the phenological index.
Year19861991199620012006201120162021
Overall accuracy/%82%84%83%85%82%87%91%95%
Kappa coefficient0.780.800.790.820.780.830.880.93
Table 3. IECV, RECV, and RECL in different regions during 1986–2021 (million RMB).
ECENADARAStudy Area
Ideal1847.69750.11680.013277.81
Real1983.32587.47578.243149.03
Effect135.63−162.64−101.77−128.78
Table 4. ECE of different ecological service functions in NA, DA, and RA (million RMB).
ECENADARAStudy Area
SPIdeal162.9366.0459.53288.50
Real165.2750.2847.45263.00
Effect2.34−15.76−12.08−25.50
WCIdeal345.95140.27126.62612.84
Real356.62109.80110.87577.29
Effect10.67−30.47−15.75−35.55
BMIdeal437.20177.15159.49773.84
Real438.45134.28130.41703.14
Effect1.25−42.87−29.08−70.70
CRIdeal754.33306.20277.461337.99
Real806.29238.20235.591280.08
Effect51.96−68.00−41.87−57.91
FPIdeal147.2760.4356.89264.59
Real216.6654.9053.91325.47
Effect69.39−5.53−2.9860.88
Publisher’s Note: MDPI stays neutral with regard to jurisdictional claims in published maps and institutional affiliations.

