Article

An Integrated Method for Estimating Forest-Canopy Closure Based on UAV LiDAR Data

1
Research Institute of Forest Resource Information Techniques (IFRIT), Chinese Academy of Forestry (CAF), No. 2 Dongxiaofu, Haidian District, Beijing 100091, China
2
Key Laboratory of Forestry Remote Sensing and Information System, NFGA, No. 2 Dongxiaofu, Haidian District, Beijing 100091, China
*
Author to whom correspondence should be addressed.
Remote Sens. 2022, 14(17), 4317; https://doi.org/10.3390/rs14174317
Submission received: 2 August 2022 / Revised: 25 August 2022 / Accepted: 26 August 2022 / Published: 1 September 2022
(This article belongs to the Special Issue Vegetation Biophysical Variables and Remote Sensing Applications)

Abstract

:
Forest-canopy closure (FCC) reflects the coverage of the forest tree canopy, which is one of the most important indicators of forest structure and a core parameter in forest resources investigation. In recent years, the rapid development of UAV LiDAR and photogrammetry technology has provided effective support for FCC estimation. However, affected by factors such as different tree species and different stand densities, it is difficult to estimate FCC accurately based on the single-tree canopy-contour method in complex forest regions. Thus, this study proposes a method for estimating FCC accurately using algorithm integration with an optimal window size for treetop detection and an optimal algorithm for crown-boundary extraction using UAV LiDAR data in various scenes. The research results show that: (1) The FCC estimation accuracy was improved using the method proposed in this study. The accuracy of FCC in a camphor pine forest (Pinus sylvestris var. mongolica Litv.) was 89.11%, with an improvement of 6.77–11.25% compared to the results obtained from other combined conditions. The FCC accuracy for white birch (White birch platyphylla Suk) was about 87.53%, with an increase of 3.25–8.42%. (2) The size of the window used for treetop detection is closely related to tree species and stand density. With the same forest-stand density, the treetop-detection window size of camphor pine was larger than that of white birch. The optimal window size of camphor pine was between 5 × 5~11 × 11 (corresponding 2.5~5.5 m), while that of white birch was between 3 × 3~7 × 7 (corresponding 1.5~3.5 m). (3) There are significant differences in the optimal-canopy-outline extraction algorithms for different scenarios. With a medium forest-stand density, the marker-controlled watershed (MCW) algorithm has the best tree-crown extraction effect. The region-growing (RG) method has better extraction results in the sparse areas of camphor pine and the dense areas of white birch. The Voronoi tessellation (VT) algorithm is more suitable for the dense areas of camphor pine and the sparse regions of white birch. The method proposed in this study provides a reference for FCC estimation using high-resolution remote-sensing images in complex forest areas containing various scenes.

1. Introduction

Forest-canopy closure (FCC) is defined as the proportion of the vertical projection area of the tree crown [1], which is an important parameter for the monitoring of forest resources often used to assess forest disturbance [2,3], forest structure characteristics and growth state [4,5], wildlife habitat and wildfire risk [6,7], and species richness [8]. The traditional method of FCC estimation relies on field measurement, which involves considerable labor, time, and energy [9,10]. Remote-sensing data can monitor land surfaces globally and promptly. These data have also become a priority for forest-resource monitoring. Therefore, it is necessary to explore more accurate and efficient FCC-estimation methods based on remote-sensing data to improve the accuracy of forest-resource monitoring.
At present, the common FCC-estimated algorithms based on remote-sensing data include building statistical models or physical models. The application of building statistical models is more common. These models estimate FCC by constructing linear nonlinear or parametric nonparametric models between the feature factors extracted from remote-sensing data and the measured FCCs of plots [11]. The method of constructing statistical models is simple in principle, as well as reliable, and has achieved good results in many studies [12,13,14,15,16]. However, the parameters used in this method lack physical meaning, and the universality of this model is low. Physical models used for FCC estimation include the Li–Strahler geometrical–optical model and the PROSAIL model. Zeng et al. (2008) evaluated the FCC in the Three Gorges area with the Li–Strahler model based on MODIS and TM data and obtained a high level of accuracy (90%) [17]. Gu et al. (2016) estimated the FCC of a Moso bamboo forest based on Landsat 5 using physical models [18]. Although this kind of model is more interpretable, some factors limit the use of this model such as the difficulty of obtaining required parameters and disturbance by other factors [19,20,21,22].
The very-high-resolution (VHR) remote-sensing images can better present the details of ground objects [23], making it possible to extract the canopy directly using this approach. The object-oriented FCC estimation method usually makes full use of the homogeneity of the same ground objects and the information of different ground objects such as shape, size, or spectral value. This method takes the object as the basic unit of feature extraction and analysis and can delineate the tree-crown-boundary more accurately [24]. This method requires high image resolution, so it is rarely used in existing research. The wide application of UAV in modern forest resource-monitoring makes the available remote-sensing data more diversified and abundant [25,26,27]. The emergence of airborne LiDAR data and ultra-high-resolution RGB images made it possible to monitor a forest at the individual tree scale [28,29]. In this context, it is highly possible to directly extract the crown border from UAV data and then obtain the FCC information by the statistical analysis of the crown proportion within the unit area. Thus, this study made full use of the advantages of UAV data to explore a more accurate method for estimating FCC.
LiDAR can penetrate the canopy cover down to the ground surface, so it is often used in forest inventories or ecological assessments [30,31]. This data contains 3D information that describes tree morphology more correctly. The canopy-height model (CHM) obtained from the LiDAR data can express the tree-crown shape effectively. These data are generated by the digital surface model (DSM) minus the digital terrain model (DTM). The pixel values of the CHM denote height, which is helpful to presenting tree-crown contours clearly. Much research has explored individual tree recognition and crown delineation based on this product [32,33,34]. In the implementation of the method proposed in this study, crown-contour extraction is the most critical step. Although many studies have developed many algorithms, such as individual treetop detection and tree-crown extraction based on UAV images or LiDAR point clouds [35,36,37,38], most studies used the above results to obtain tree-measurement parameters such as tree height, crown area, and biomass [24,39,40]. Few studies have applied these results to FCC estimation. Tree-crown delineation includes two key steps: treetop detection and tree-crown delineation. The classical local maximum (LM) method is usually used to detect the treetops by searching for the highest pixel value location within a specified window size. This approach, with its advantage of simplicity, has been widely used for estimating forest structural parameters such as crown diameter, tree height, and canopy-based height [41,42]. However, different window sizes may generate different results of treetop detection especially in complex forest regions. Thus, it is necessary to explore suitable window sizes for certain forest species and stand densities. Tree-crown delineation based on CHM data commonly uses treetop locations as seed points and involves several methods such as the maker-controlled watershed algorithm (MCW) algorithm, the region-growing method (RG), and the voronoi tessellation (VT) algorithm. It is worth noting that different tree-crown-extraction methods have different principles [43,44,45]. For example, the MCW method is a classical algorithm for image segmentation even in tree-crown delineation, which was developed from mathematical morphology [46]. When conducting tree-crown segmentation, the CHM data are considered as the “topography” or highs and lows of the area and the treetop location as seed points. The algorithm delineates a polygon around each seed point containing higher pixel values than those seeds. The region-growing algorithm aggregates groups of elements into larger regions, which merges adjacent regions with similar features based on each seed point [47]. The Voronoi tessellation method is an algorithm of partitioning space, which applies a buffer around the seed points obtained from the treetop location to generate the initial region of the tree crown then adopts Voronoi polygons to divide the overlapping areas of tree crowns. The application of above tree-crown delineation methods varies with different tree species or stand densities. Therefore, it is difficult to delineate the tree-crown-boundary accurately using only a single algorithm. This study area is in a hilly region which contains conifers, broadleaf trees, and various stand densities. Based on the above considerations, this study proposed a process-optimization method integrating treetop detection and crown-boundary extraction to estimate FCC.
The aims of this study were to develop an optimized FCC estimation method, which differs from traditional statistical model and physical model using UAV LiDAR data; to explore the optimal window size in different scenarios when using the local maximum model to detect treetops; to analyze and compare the extraction potential of three methods at different scenarios in complex forest areas; and to evaluate the applicability of this algorithm in FCC estimation and attempt to provide a reference for subsequent related studies.

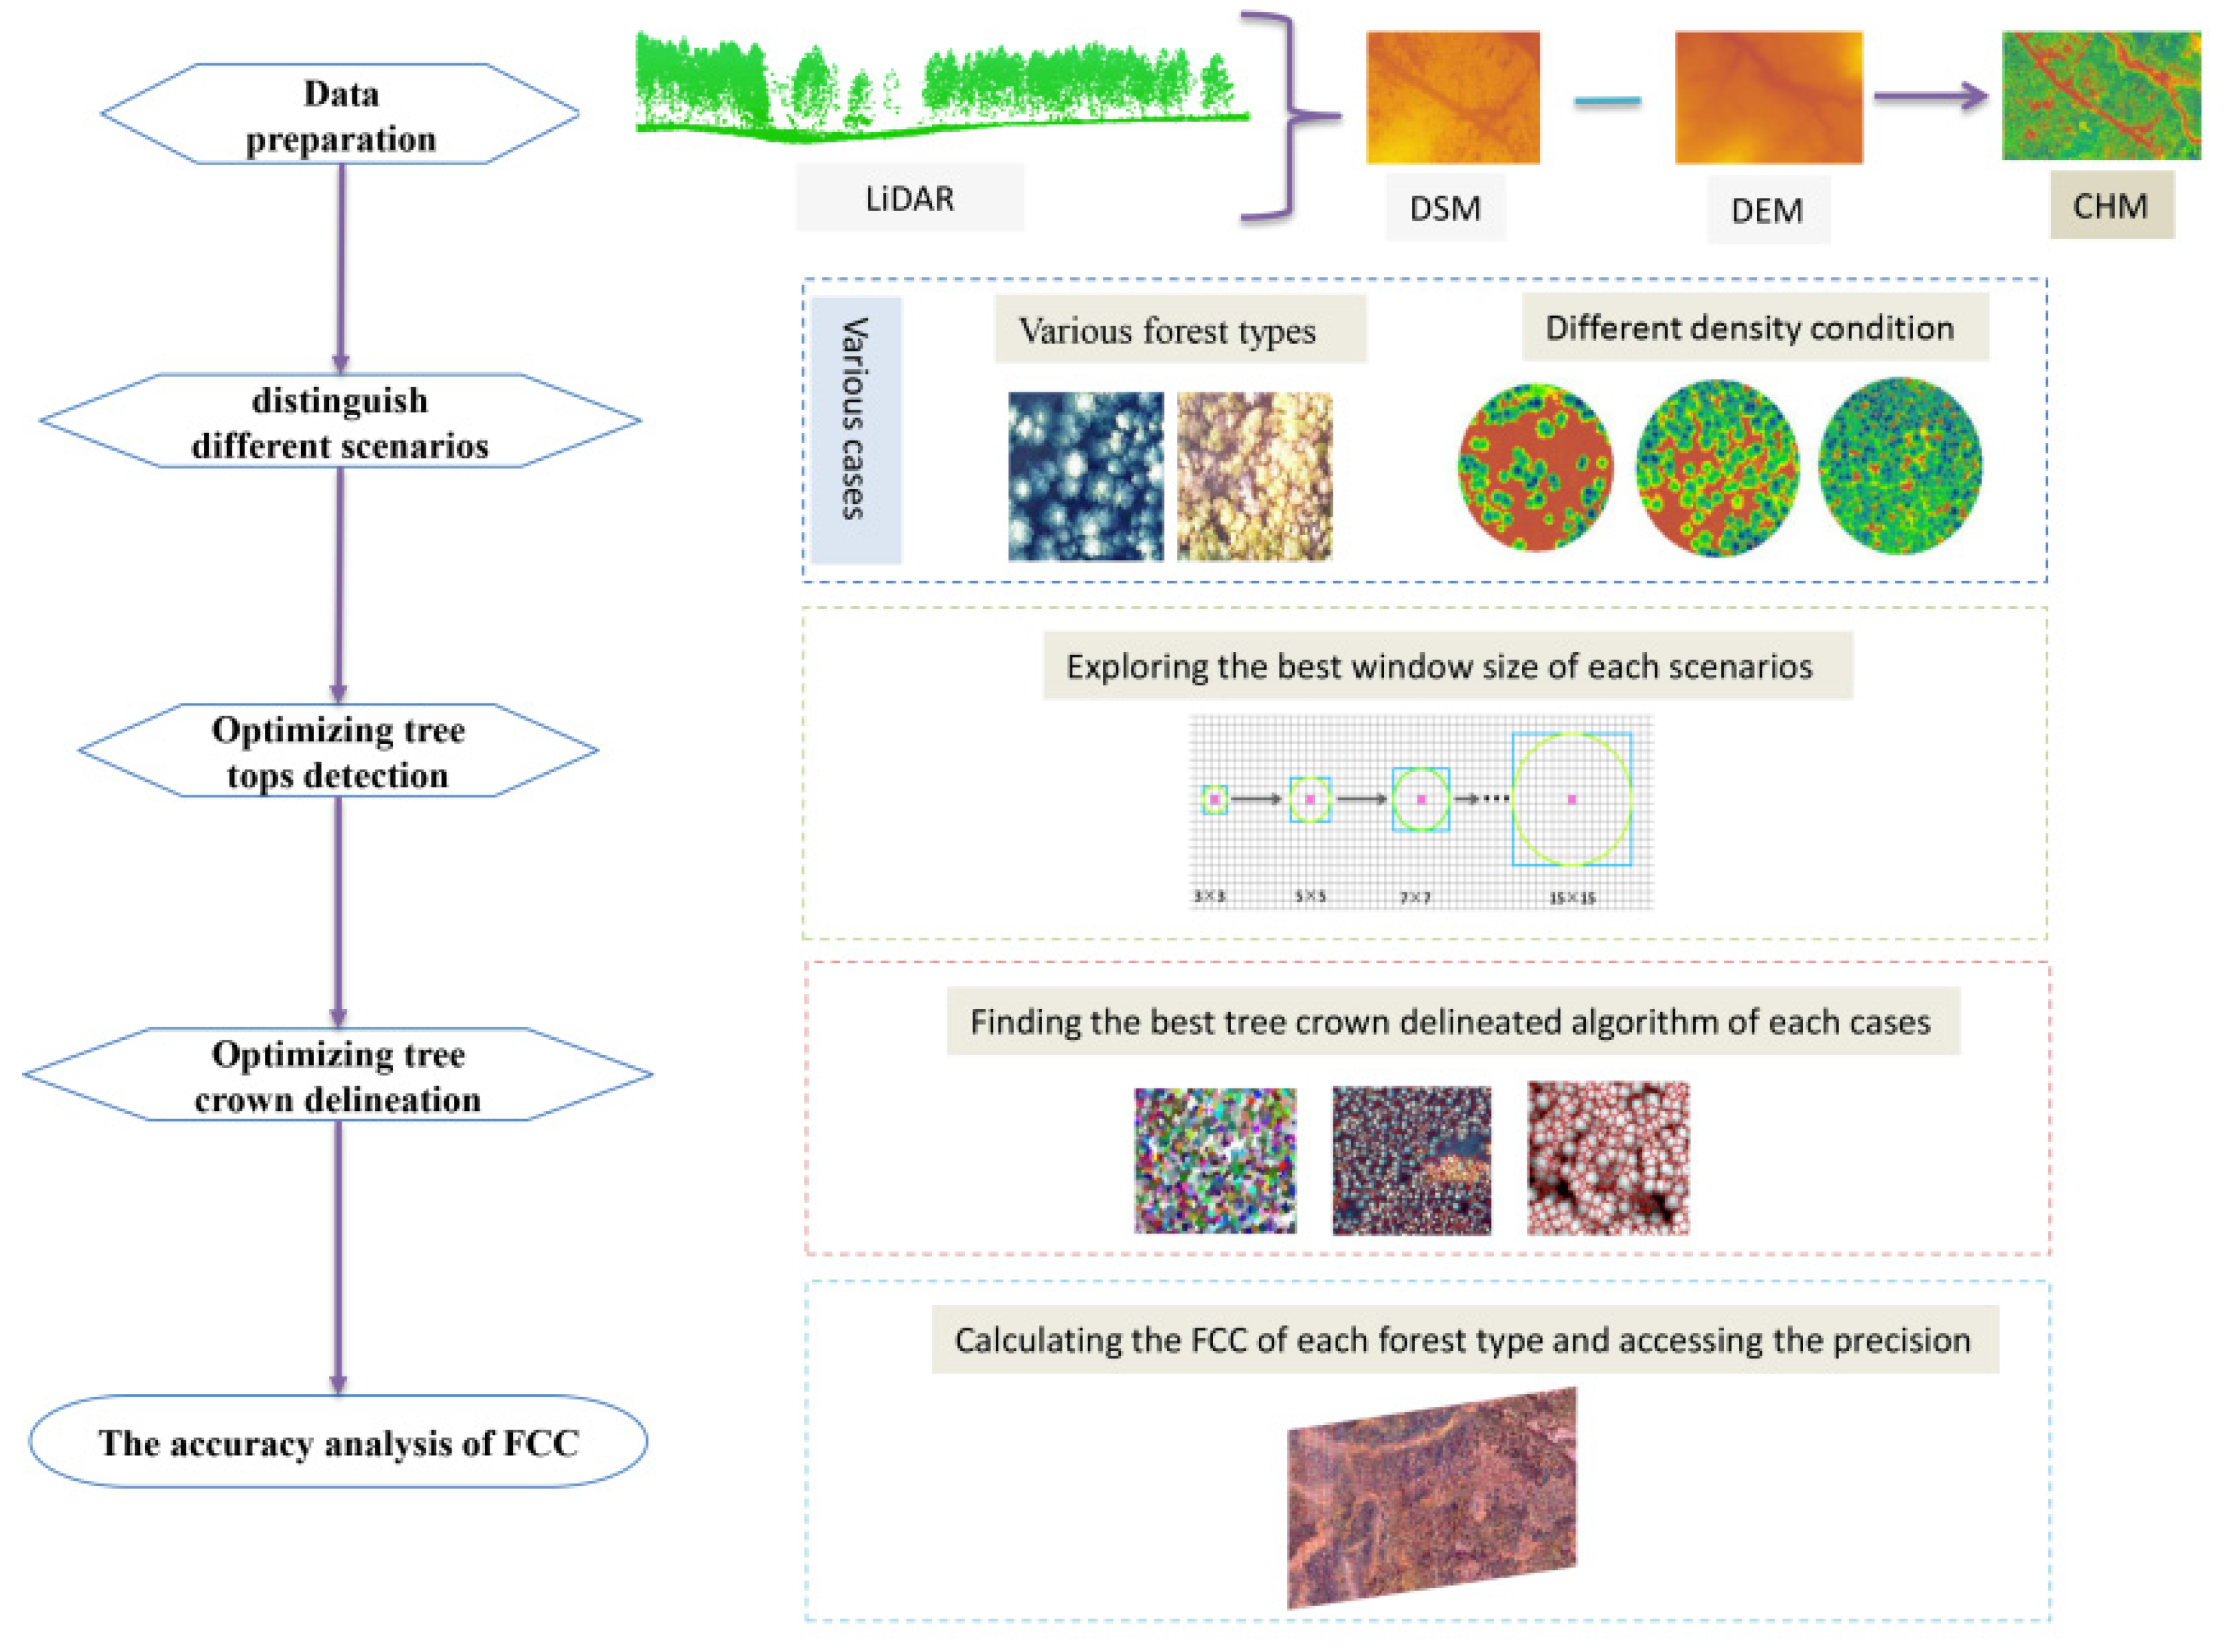
2. Materials and Methods

This study proposed a method of FCC estimated accurately using algorithm integration containing the optimal window size for treetop detection and the optimal algorithm for crown-boundary extraction using UAV LiDAR data in various scenes. First, the optimal treetop points were obtained by screening the optimal window sizes of treetop detection with different tree species and different density states. Then, the optimal crown-boundary extraction algorithms in different scenes were compared and analyzed based on the treetop results. By combining the optimal crown-boundary extraction results in different scenes, the optimized FCC estimation value was generated. The workflow of this study is presented in Figure 1.

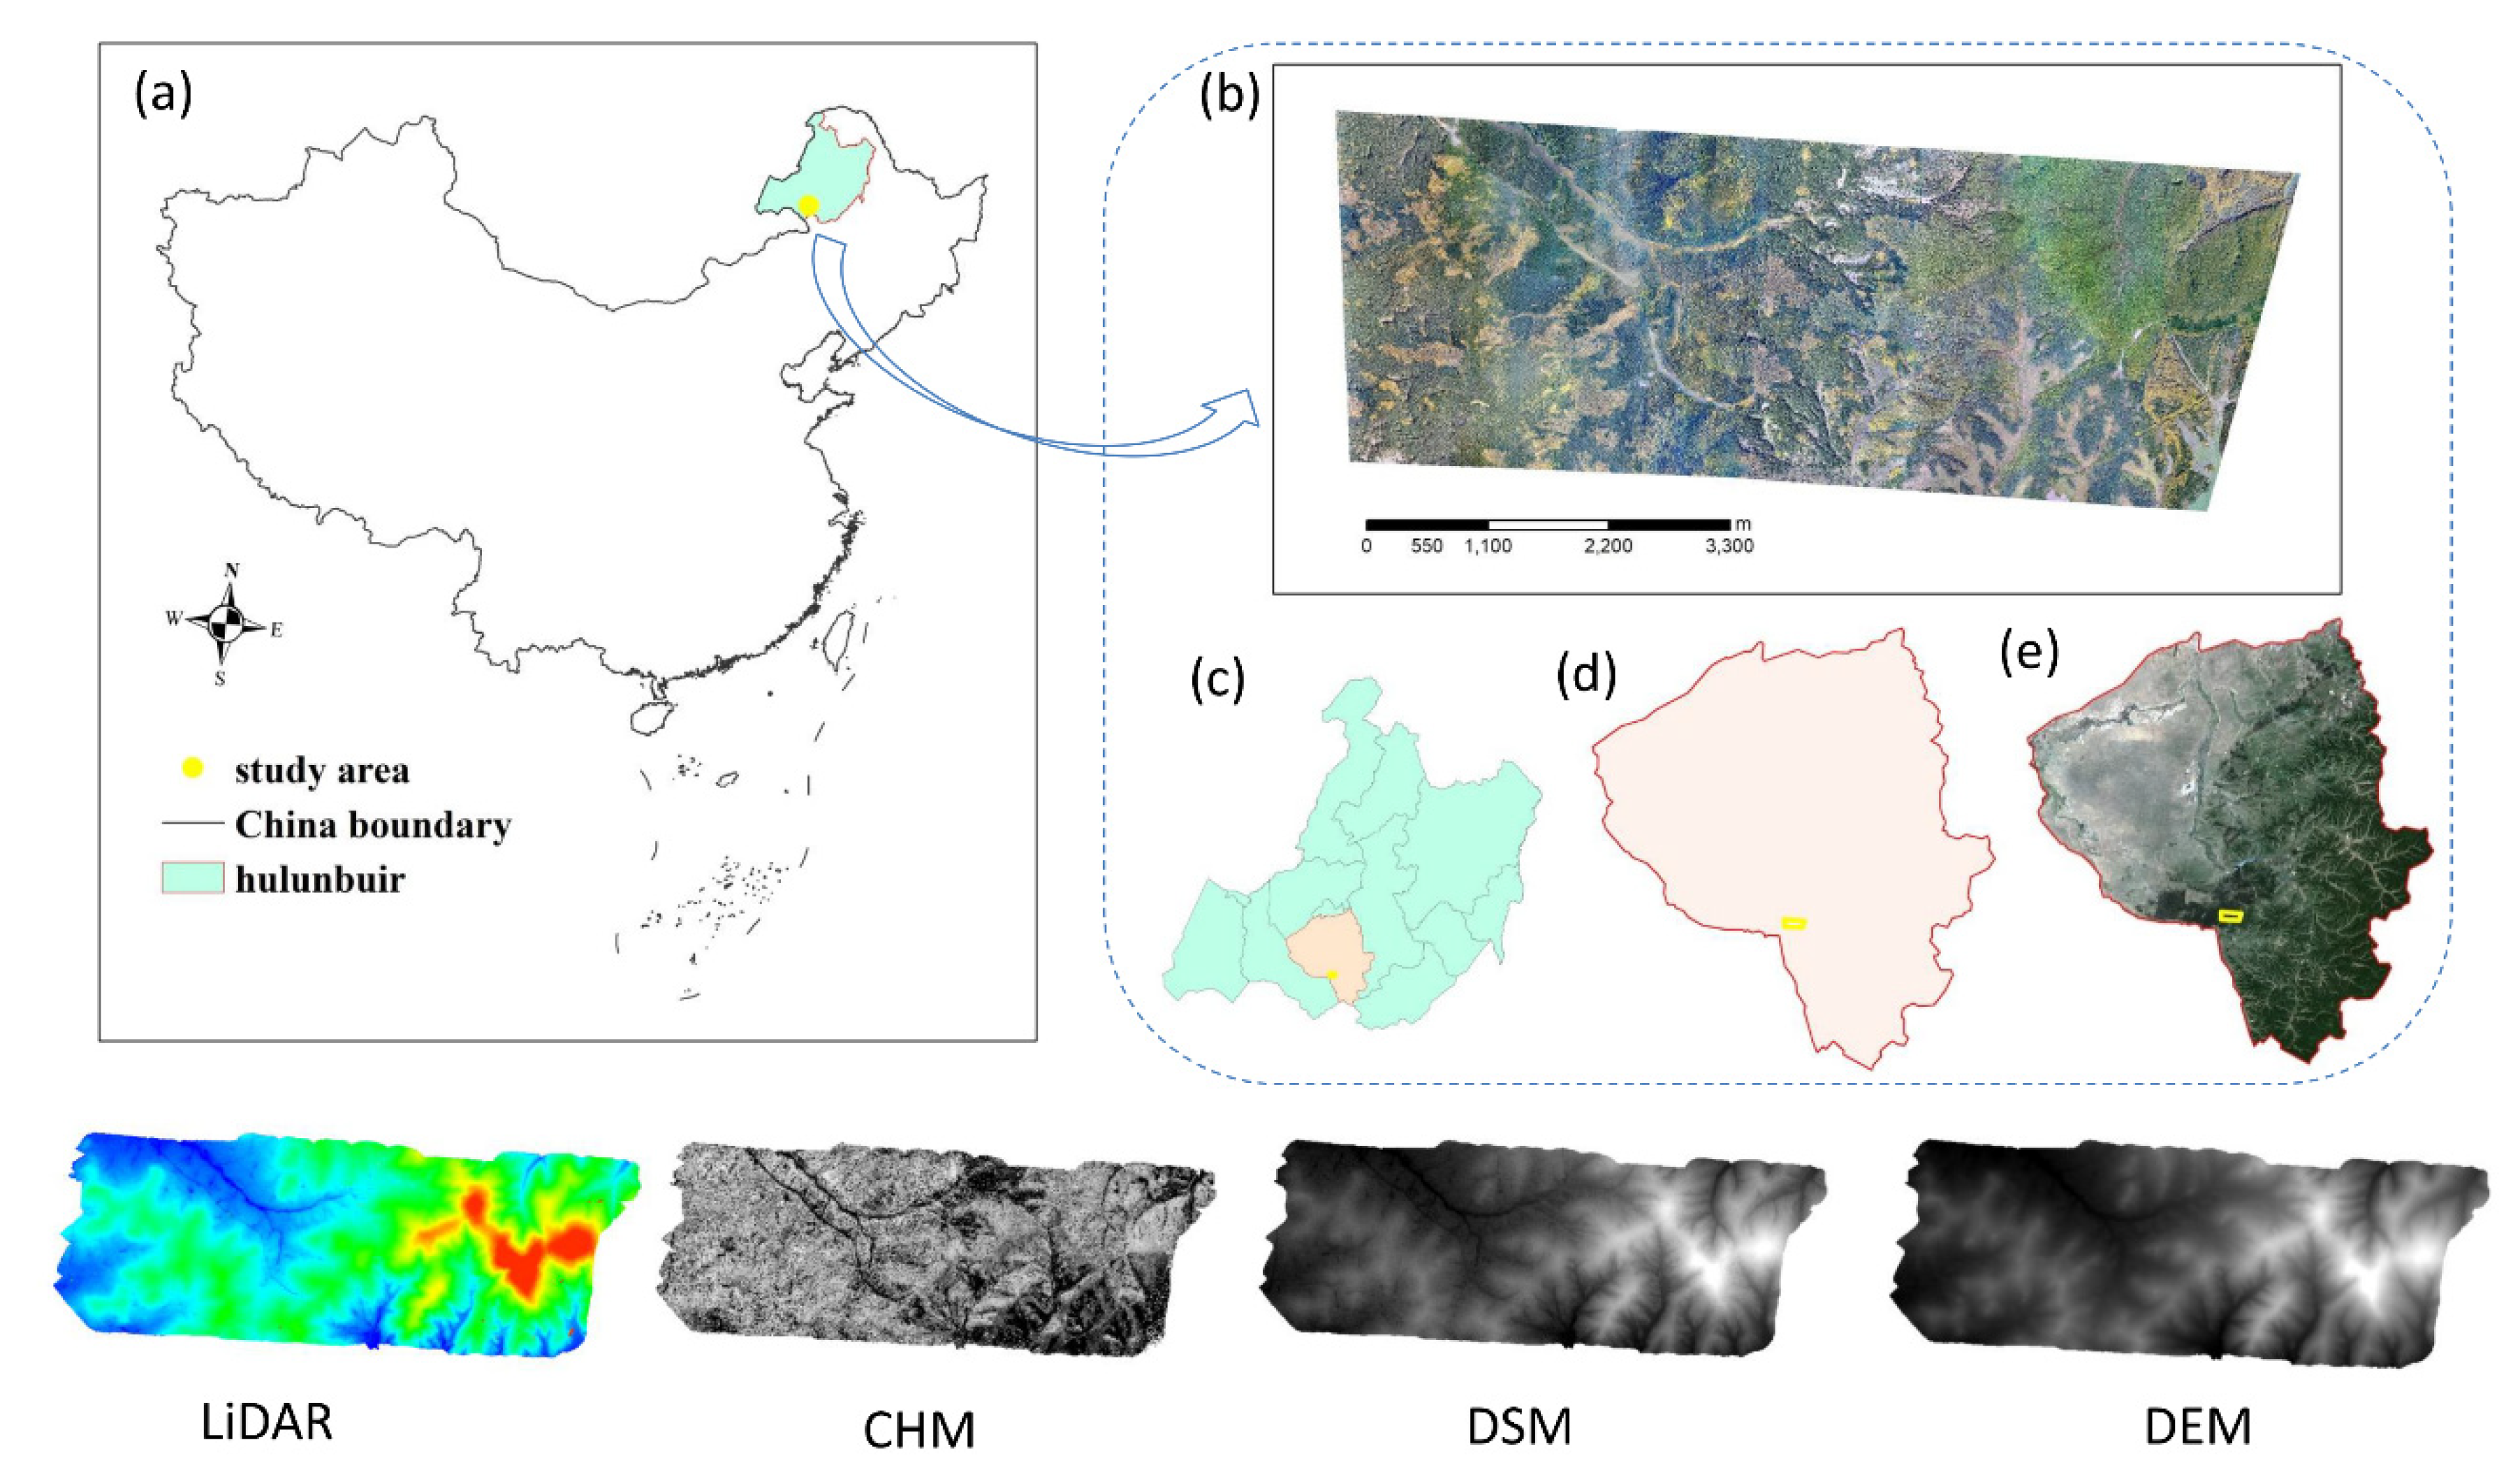
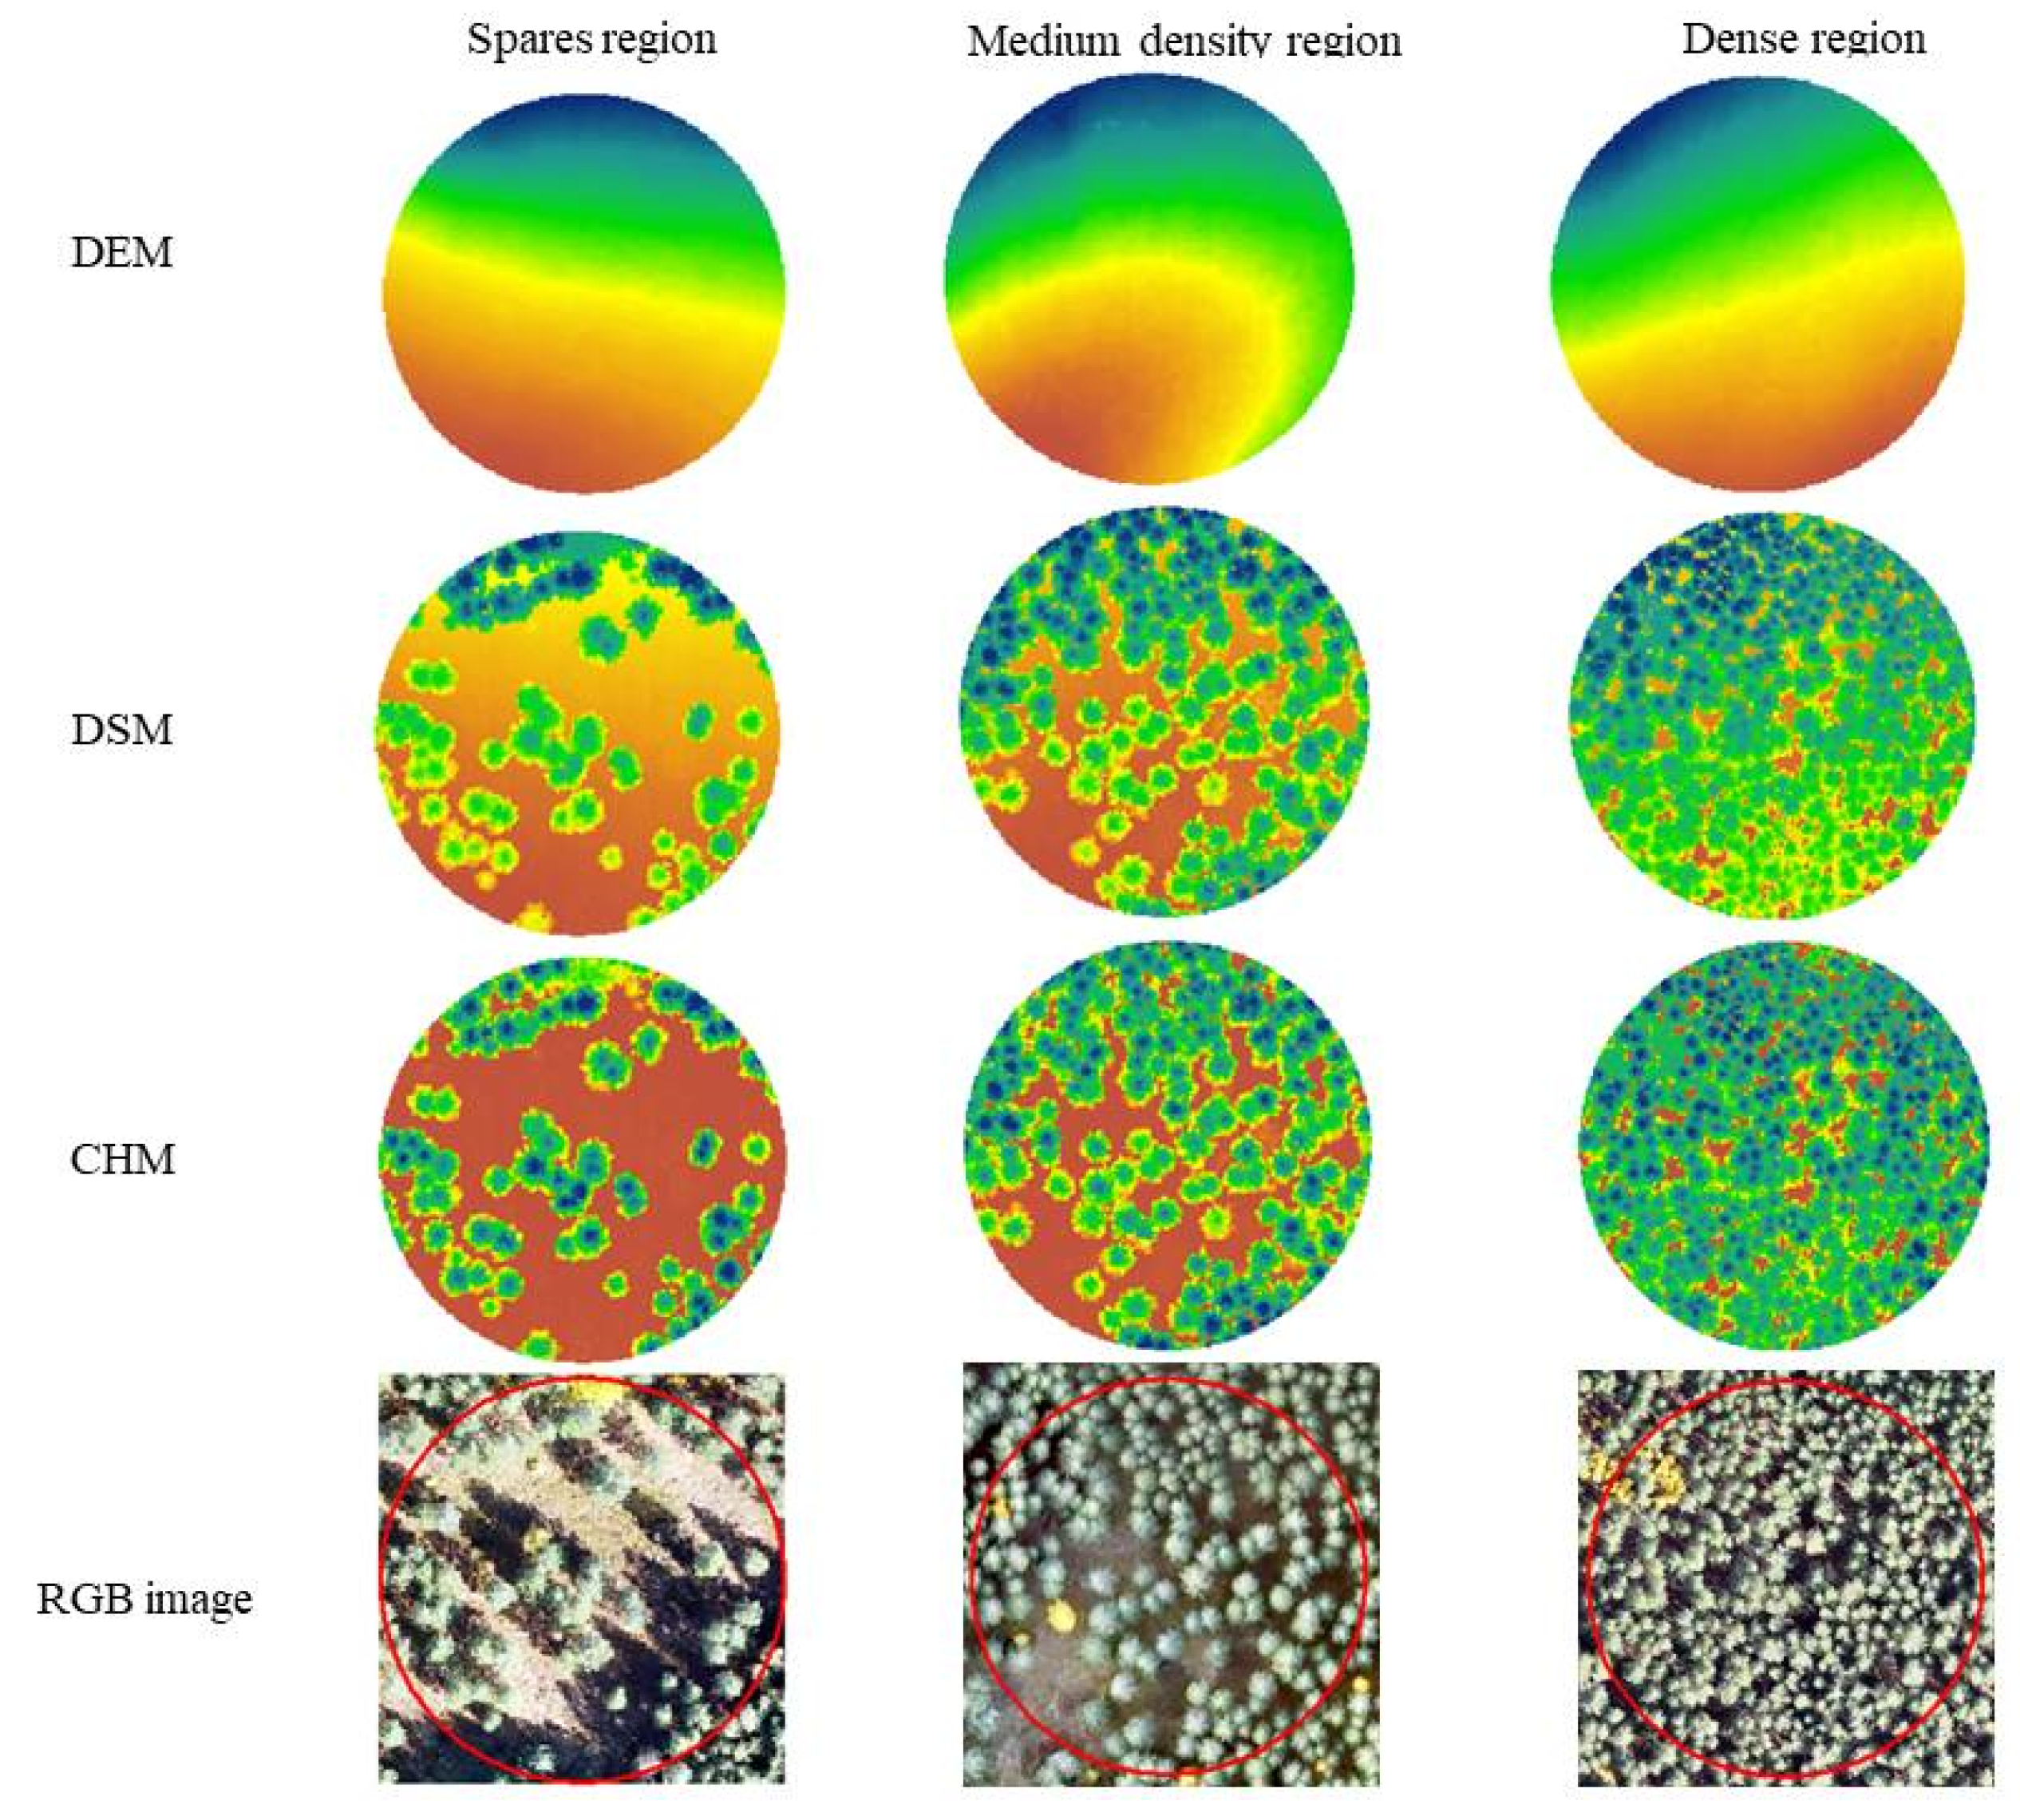
2.1. Study Area and Data

The study area is located in the Honghuaerji Town (48°02′~48°36′ N, 119°58′~120°32′ E; Figure 2), Ewenke Banner (d and e), and Hulunbuir City (c), Inner Mongolia, China, and belongs to the transitional zone from the west slope of the middle section of Daxing’anling Mountains to the Inner Mongolia Plateau, with an altitude of 767~1100 m. It has a cold, temperate, continental monsoon climate. The annual average temperature is 1.5 °C, and the average annual precipitation is 344–375 mm. The distribution of forests in this area is concentrated. Forest types in this study include camphor pine coniferous forest and white birch broad-leaved forest, which have different stand densities. The camphor pine and white birch are native forests. The terrain in the area gradually rises from northwest to southeast, with ridge-shaped and undulating sandy landform types, and there are low mountains and hills with gentle slopes.

2.2. UAV Data and Preprocessing

UAV datasets containing LiDAR point data and RGB image data, which were consistent with field measurements work and covered about 20 km2, were acquired on 30 August 2020. UAV-borne LiDAR data were captured using a LiAir D1350 laser scanner system (GreenValley International Company, Beijing, China). We flew over the study area at an altitude of 300 m above the ground with 80% overlap and 85% side-lap. The flight speed was about 70–80 km/h. The point cloud density was about 24/m2. The LiDAR points of the study area were classified as ground points and forests points. The DTM was generated with the triangulated irregular networks algorithm from the ground points. The DSM was generated by a method of inverse-distance weighting. The resolution of both DTM and DSM were 0.5 m. We generated a CHM which denotes the relative height of trees within the study area at an average resolution of 0.5 m by subtracting the DTM values from DSM. RGB image data were acquired by DJI phantom4 on the same day with UAV-borne LiDAR data. All surveys were restricted to days with low wind speeds and no rain to ensure weather conditions did not interfere with data collection and processing. Figure 3 takes camphor pine as an example to show the status of the above products in different scenarios.

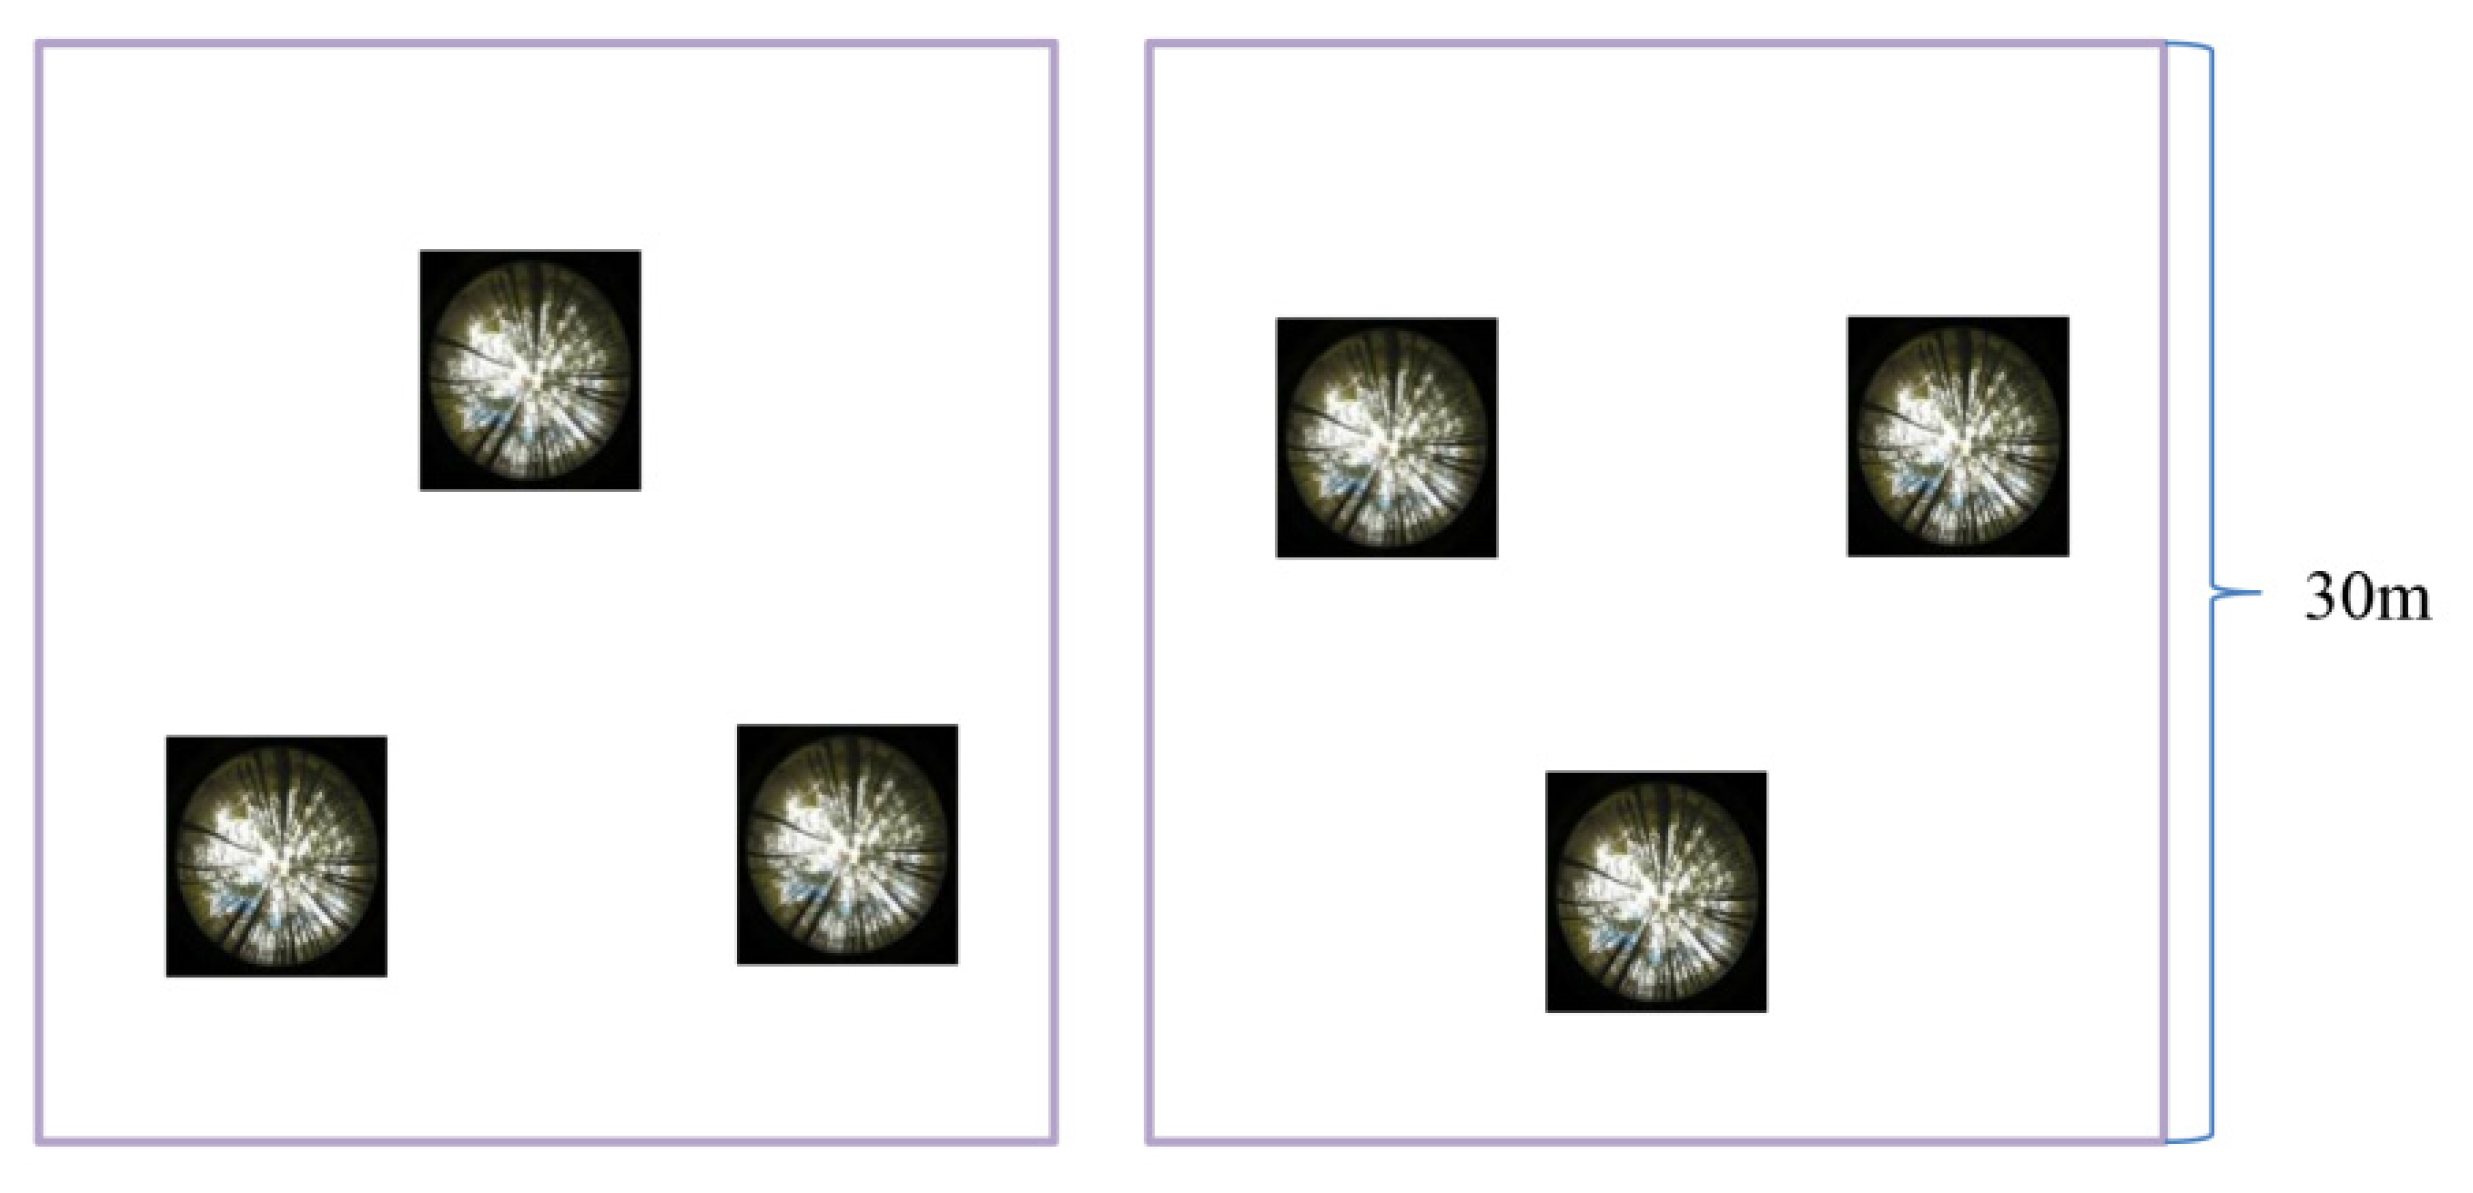
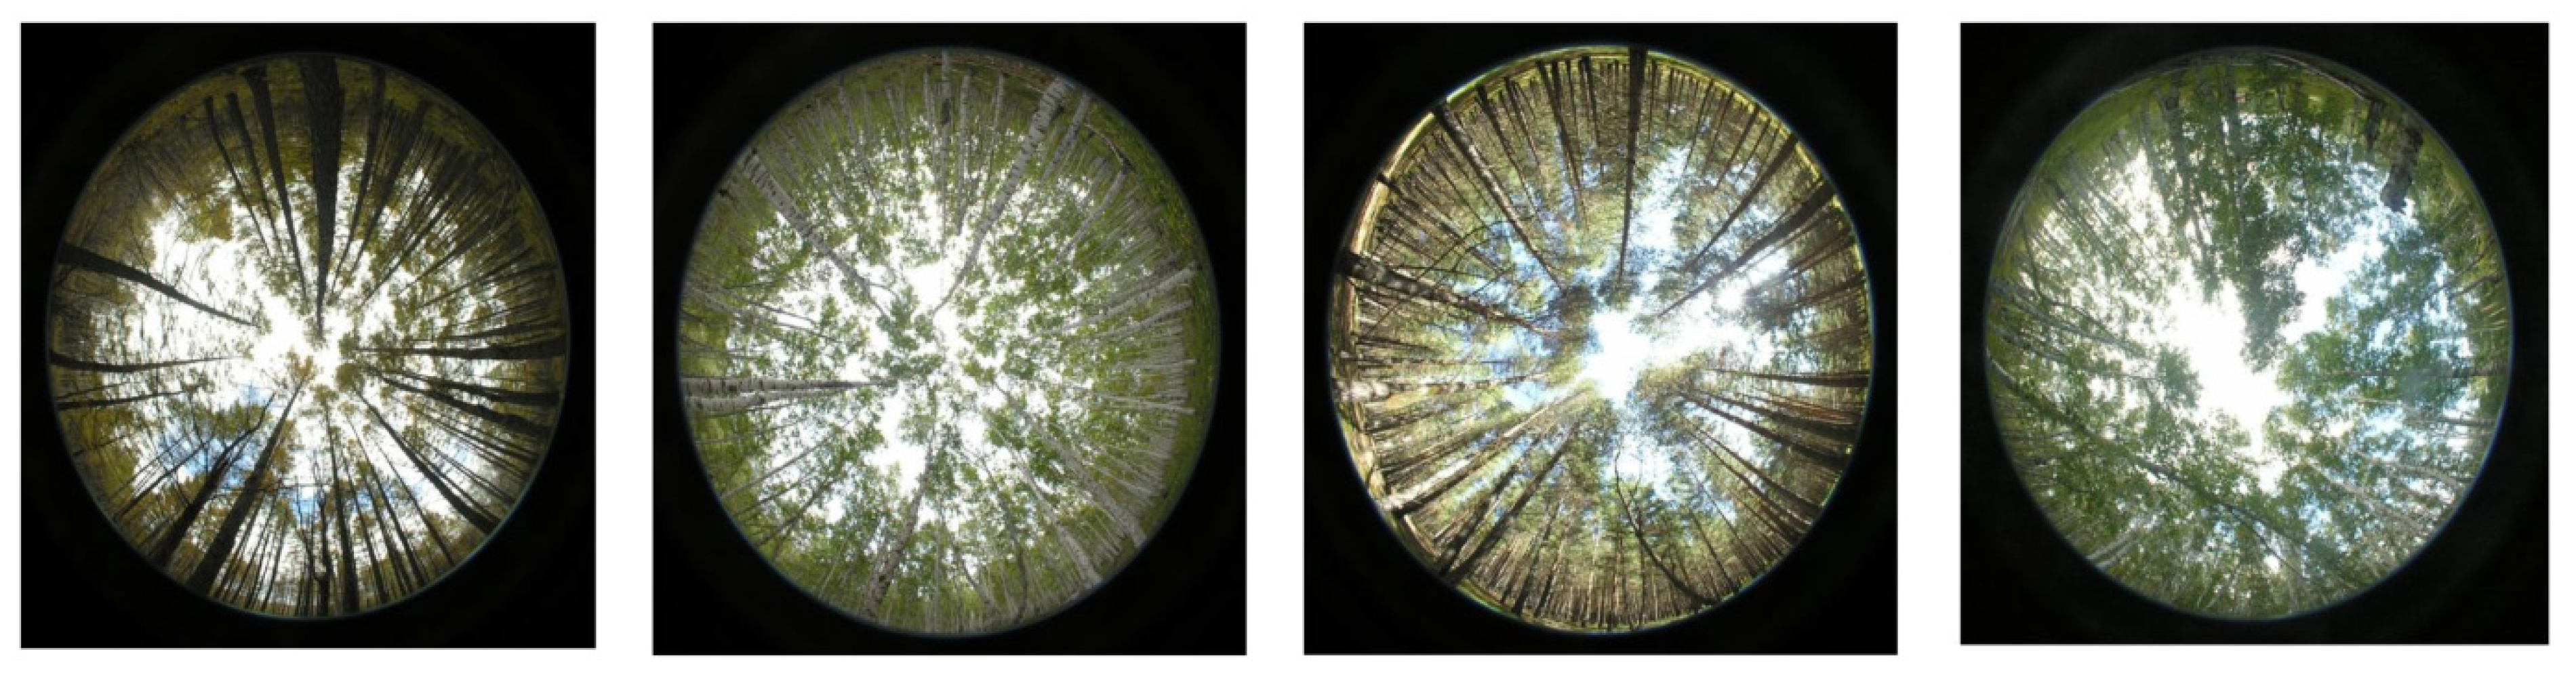
2.3. Field Data Acquisition and Preprocessing

There were 68 field plots of 30 × 30 m including 38 plots of camphor pine (11 sparse plots (SPs), 14 medium density plots (MDs), and 13 dense plots (DDs)) and 30 plots of white birch (10 SPs, 10 MDs, and 10 DDs). The fisheye photos (resolution 3264 × 2448) were taken with a Nikon E8400 camera equipped with a lens with an extremely short focal length and an angle of view close to or equal to 180°. The principle of calculating FCC using fisheye photos was that the percentage of canopy pixels in the effective total pixels refers to FCC. Firstly, “Photoshop” software was used to cut the photo into a circle with the center of the photo as the center and a radius of 10 cm to obtain the effective calculated area and convert the color photo to gray mode. Secondly, a binary classification was performed on the processed photos. The pixel number of the canopy occlusion was calculated, and then the FCC was generated. For each plot, three fisheye photos were obtained randomly, which were used to acquire the true FCC value of field (Figure 4 and Figure 5). All field FCC data were calculated using Photoshop and arcgis10.6 based on the fisheye photos. Each field FCC was the mean of three FCC calculations from the fisheye photos. The statistical information of the field FCC is presented in Table 1. This study estimated the FCC at the 30 × 30 m scale the same with the field observations.

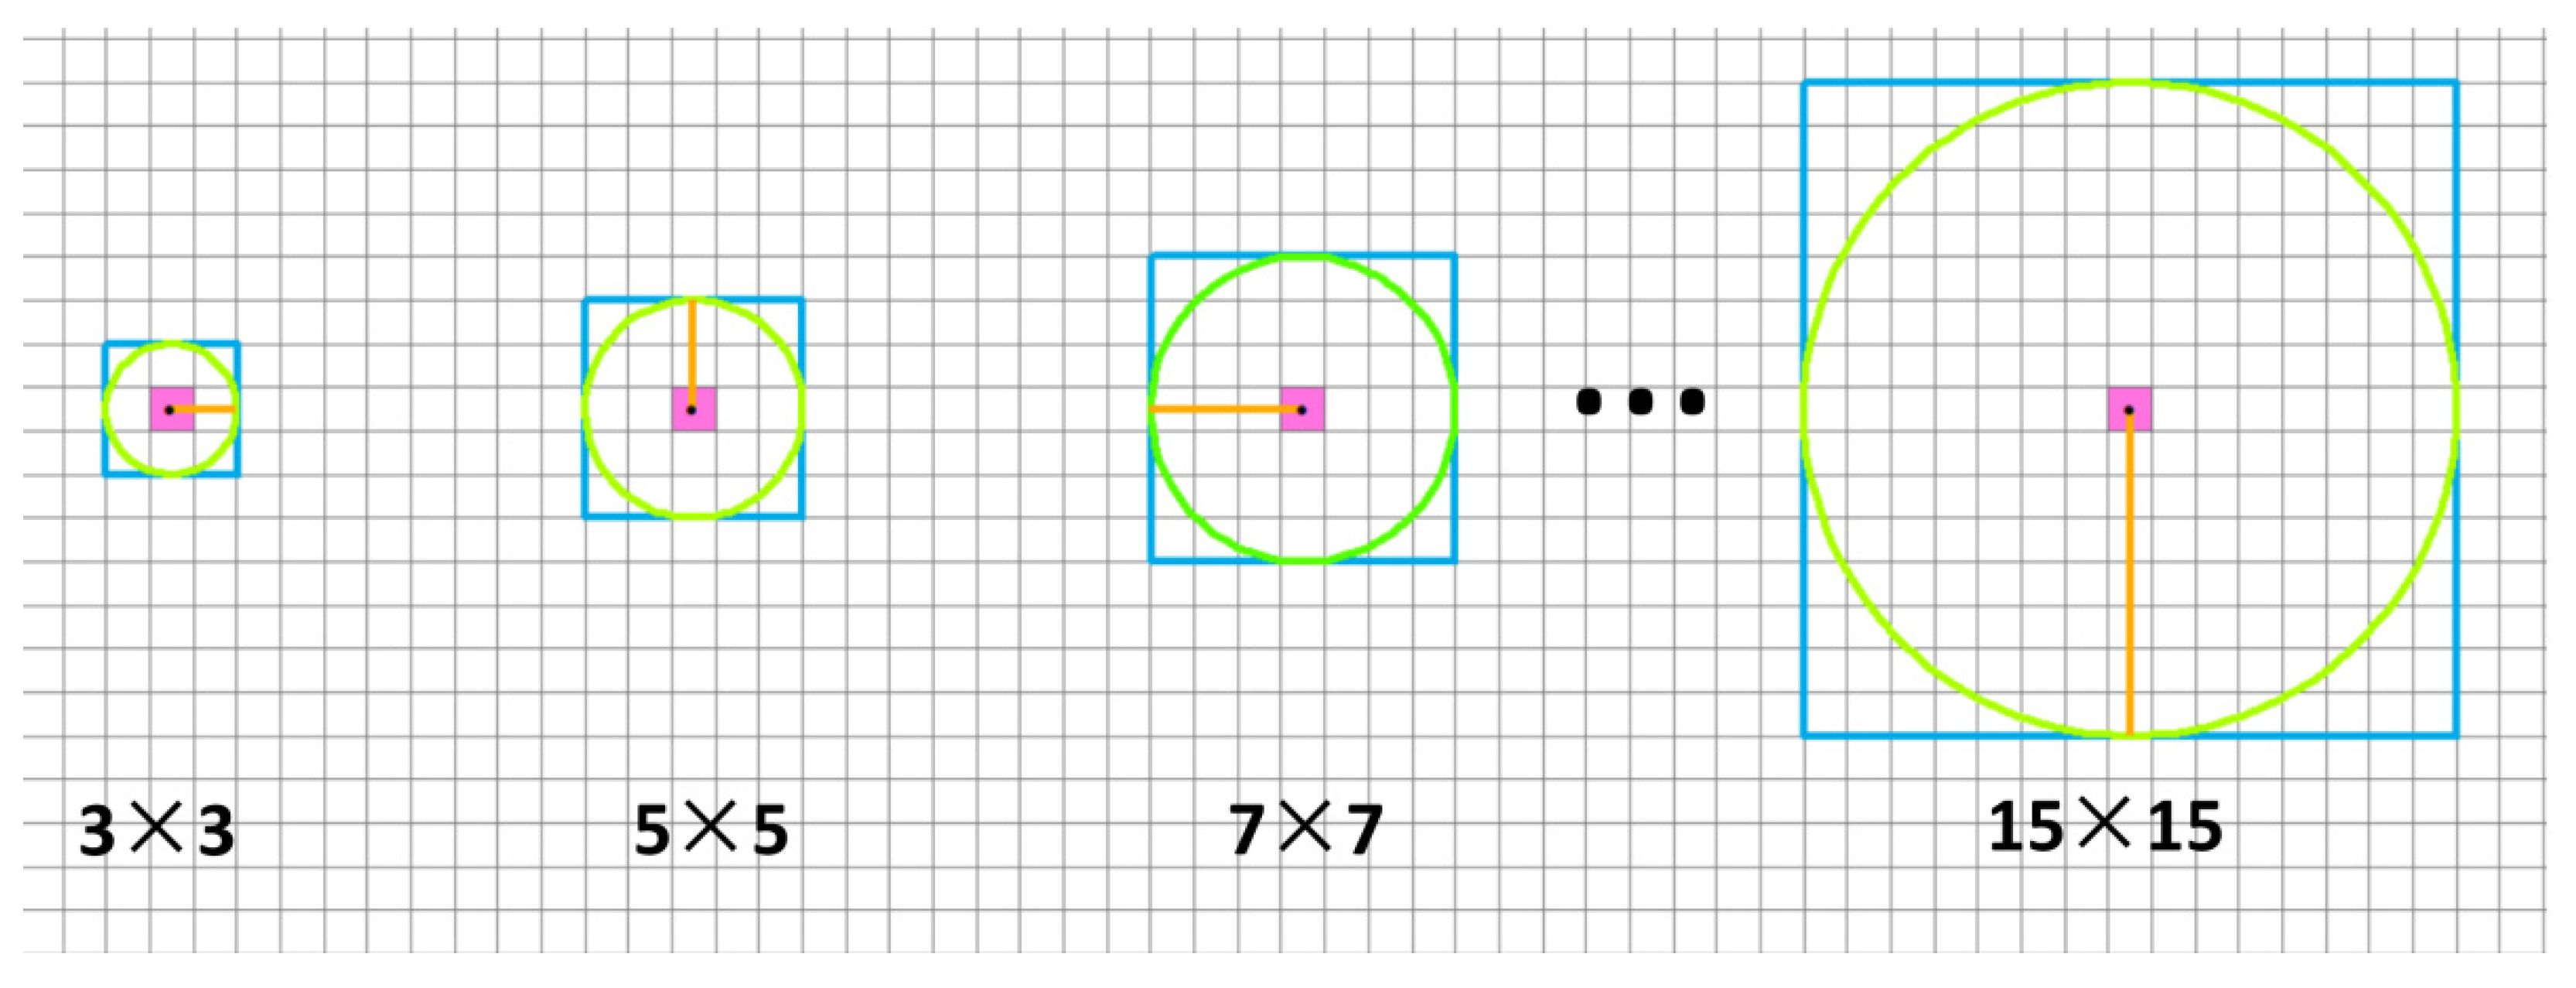
2.4. Treetop Detection

In this study, tree-crown delineation relied on the treetop results as the input data. Thus, it is necessary to explore the method of treetop detection. The classic local maximum algorithm was used in this study to detect the treetop location; its effectiveness has been demonstrated extensively [48,49,50]. The window size has an influence on the accuracy of treetop detection [51,52]. This study explored the differences of various circular window diameters (3 × 3, 5 × 5, 7 × 7, 9 × 9, 11 × 11, 13 × 13, and 15 × 15) in treetop detection and then analyzed the window sizes suitable for different scenes to optimize the result of the treetop detection (Figure 6). This operation was realized using the “lmf() function” in the “lidR’ package of R language [53], which needs three parameters. The first was window size; this study compared seven window sizes for various scenes involving six cases. The second parameter was set to 2 m, which represents the minimum height of the tree to be detected. The setting of this value was guided by several reference studies and the analysis results of field measurement data [49,54]. The third parameter was the window shape, which was set to a circle in this study.

2.5. Tree-Crown-Boundary Extraction

In this study, the tree-crown-boundary was extracted using the treetop position detected using the local maximum method as seed points. The applicability of the region-growing method, Voronoi tessellation algorithm, and Marker-controlled watershed method in different scenes was compared and analyzed.
The region-growing method was used to extract the four-pixel values adjacent to the seed point firstly and then judge whether the difference in value between the pixel value and the height value corresponding to the seed point was less than the specified threshold value, step by step. If the difference in value was less, the pixels were added to the region where the seed point was located, and the process was repeated for all the pixels in the region until no new pixels entered the region. In this process, the “dalponte2016 ()” function in the “lidR” package [53,55] of the R language was used, and the relevant parameters were adjusted according to the situation of plots. Pixels with CHM pixel values of less than 2 m were not considered part of the tree crown.
The Voronoi tessellation algorithm first uses a variable radius to establish a buffer for the tree vertices to determine the initial contour line of the trees, then uses the centroidal Voronoi tessellation method to determine the dividing line of the overlapping areas to separate the individual tree crowns while removing the pixels with values lower than 30% of the treetop. The final boundary that belongs to each tree is the tree-crown outline [44]. This crown-boundary-extraction method was implemented using the “Silva2016 ()” function in the R language “lidR” package [44,53]. This function involves five parameters. In this study, the parameters were modified according to the actual situation. The “max_cr_factor”, that is, the ratio between the maximum crown diameter and the tree height, was set to 0.5. The second parameter (whether the pixel is considered as the threshold of the crown) was set to 0.1, because the average tree height in this study’s area was about 20 m, and the area below 2 m is not considered to be the crown.
The marker-controlled watershed method is a mathematical morphological segmentation method based on topological theory. It adds markers that can guide the segmentation process based on the traditional watershed algorithm to prevent the occurrence of over-segmentation. The process of this algorithm is similar to the process of water immersion. The marker guides the water flow to the low-elevation water basin until a dam is constructed where the two water basins meet, which forms a dividing line [56]. In this study, the algorithm was completed using the “mcws () function” in ForestTools [57] in the R language. To be consistent with the other two algorithms, the “minHeight” which refers to the minimum height of trees, was set to 2.
To choose the best method of identifying crown-boundary extraction algorithms in different scenes, this study compared and analyzed the differences of three methods in different cases. The manually delineated tree crowns were taken as a reference. All manual samples delineated various cases of field plots. The number of white birch manual samples totaled 1871 (392 SPs; 610 MDs; 869 SPs). The number of camphor pine manual samples totaled 1387 (296 SPs; 483 MDs; 608 SPs). It was considered as matched when the overlapping area between the segmented crown and the reference crown exceeded 50% [58,59]. According to the above principle, this study firstly matched the delineated tree crown with a reference crown and then compared the applicability of three tree-crown delineation methods based on the ratio obtained by dividing the delineated crown-contour area by the reference crown area. A ratio value around 1 indicates that the algorithm can effectively depict the actual crown contour; >1 indicates that the crown extracted by the algorithm is larger than the actual crown contour; >n indicates that n crowns are merged and not divided; <1 indicates that the crown extracted by the algorithm is smaller than the actual crown contour; and 0 indicates that the tree crown exists but was missed by the algorithm.

2.6. FCC Estimation

In this study, the FCC refers to the proportion of a given area covered by the vertical projection of the tree crowns present. Based on this definition and the canopy-cover results, generated by integrating the optimal window of treetop recognition and the optimal algorithm of crown contour extraction, the canopy coverage ratio in each 30 × 30 m field plot was analyzed statistically. The FCC estimation results of each forest type were obtained by averaging the FCC of each plot. In this study, we assume that the crown gaps can be shielded from each other, and there is no gap inside the individual tree crown.

2.7. Accuracy Evaluation

The reference data of treetop detection accuracy evaluation include two parts: field measured data and recognition results of VHR images. If the distance between the detected treetop position and the reference treetop position was less than 2 m, it was considered to be matched. The recall rate (Rc), the correct rate (Pc), and the overall accuracy F-score (Fs) were used for evaluating indices [60] as follows:
R c = N TP N TP + N FN
P c = N TP N TP + N FP
F s = 2 R c × P c R c + P c   ,
where NTP is the number of corrected treetops, NFN is the number of trees that were not detected, NFP is the number of extra trees that do not exist in the field (commission error), Rc is the tree detection rate or recall, Pc is the correctness of the detected trees or precision, and Fs is the harmonic mean of Rc and Pc, which represent the overall accuracy. Rc, Pc, and Fs range from 0 to 1, and the higher the Fs value, the higher the treetop detection accuracy.
The FCC of the measured plots were used as reference data; the Root Mean Square Error (RMSE), Relative RMSE (rRMSE), and EA between the estimated value and the measured value were calculated to comprehensively evaluate the estimation accuracy of FCC. Further analyses were conducted to compare the accuracy of the optimal algorithm with results generated by other methods at each forest type.
RMSE = i = 1 n ( y i y pred _ i ) 2 n
rRMSE = RMSE / mean ( y )
EA = 1 rRMSE ,
where yi refers to the FCC of measured data, and ypred_i is the predicted FCC.
Among the above indices, EA was used as the final index to evaluate the FCC-estimation accuracy. The higher the value of EA, the better the accuracy of the FCC estimated. RMSE refers to the root mean square error between the estimated FCC value and the field-measured FCC value, and rRMSE denotes the relative root mean square error, which is a dimensionless quantity. RMSE and rRMSE also were used to assess the accuracy of the FCC estimation. The lower the value of the above two indices, the higher the FCC estimated accuracy.

3. Results

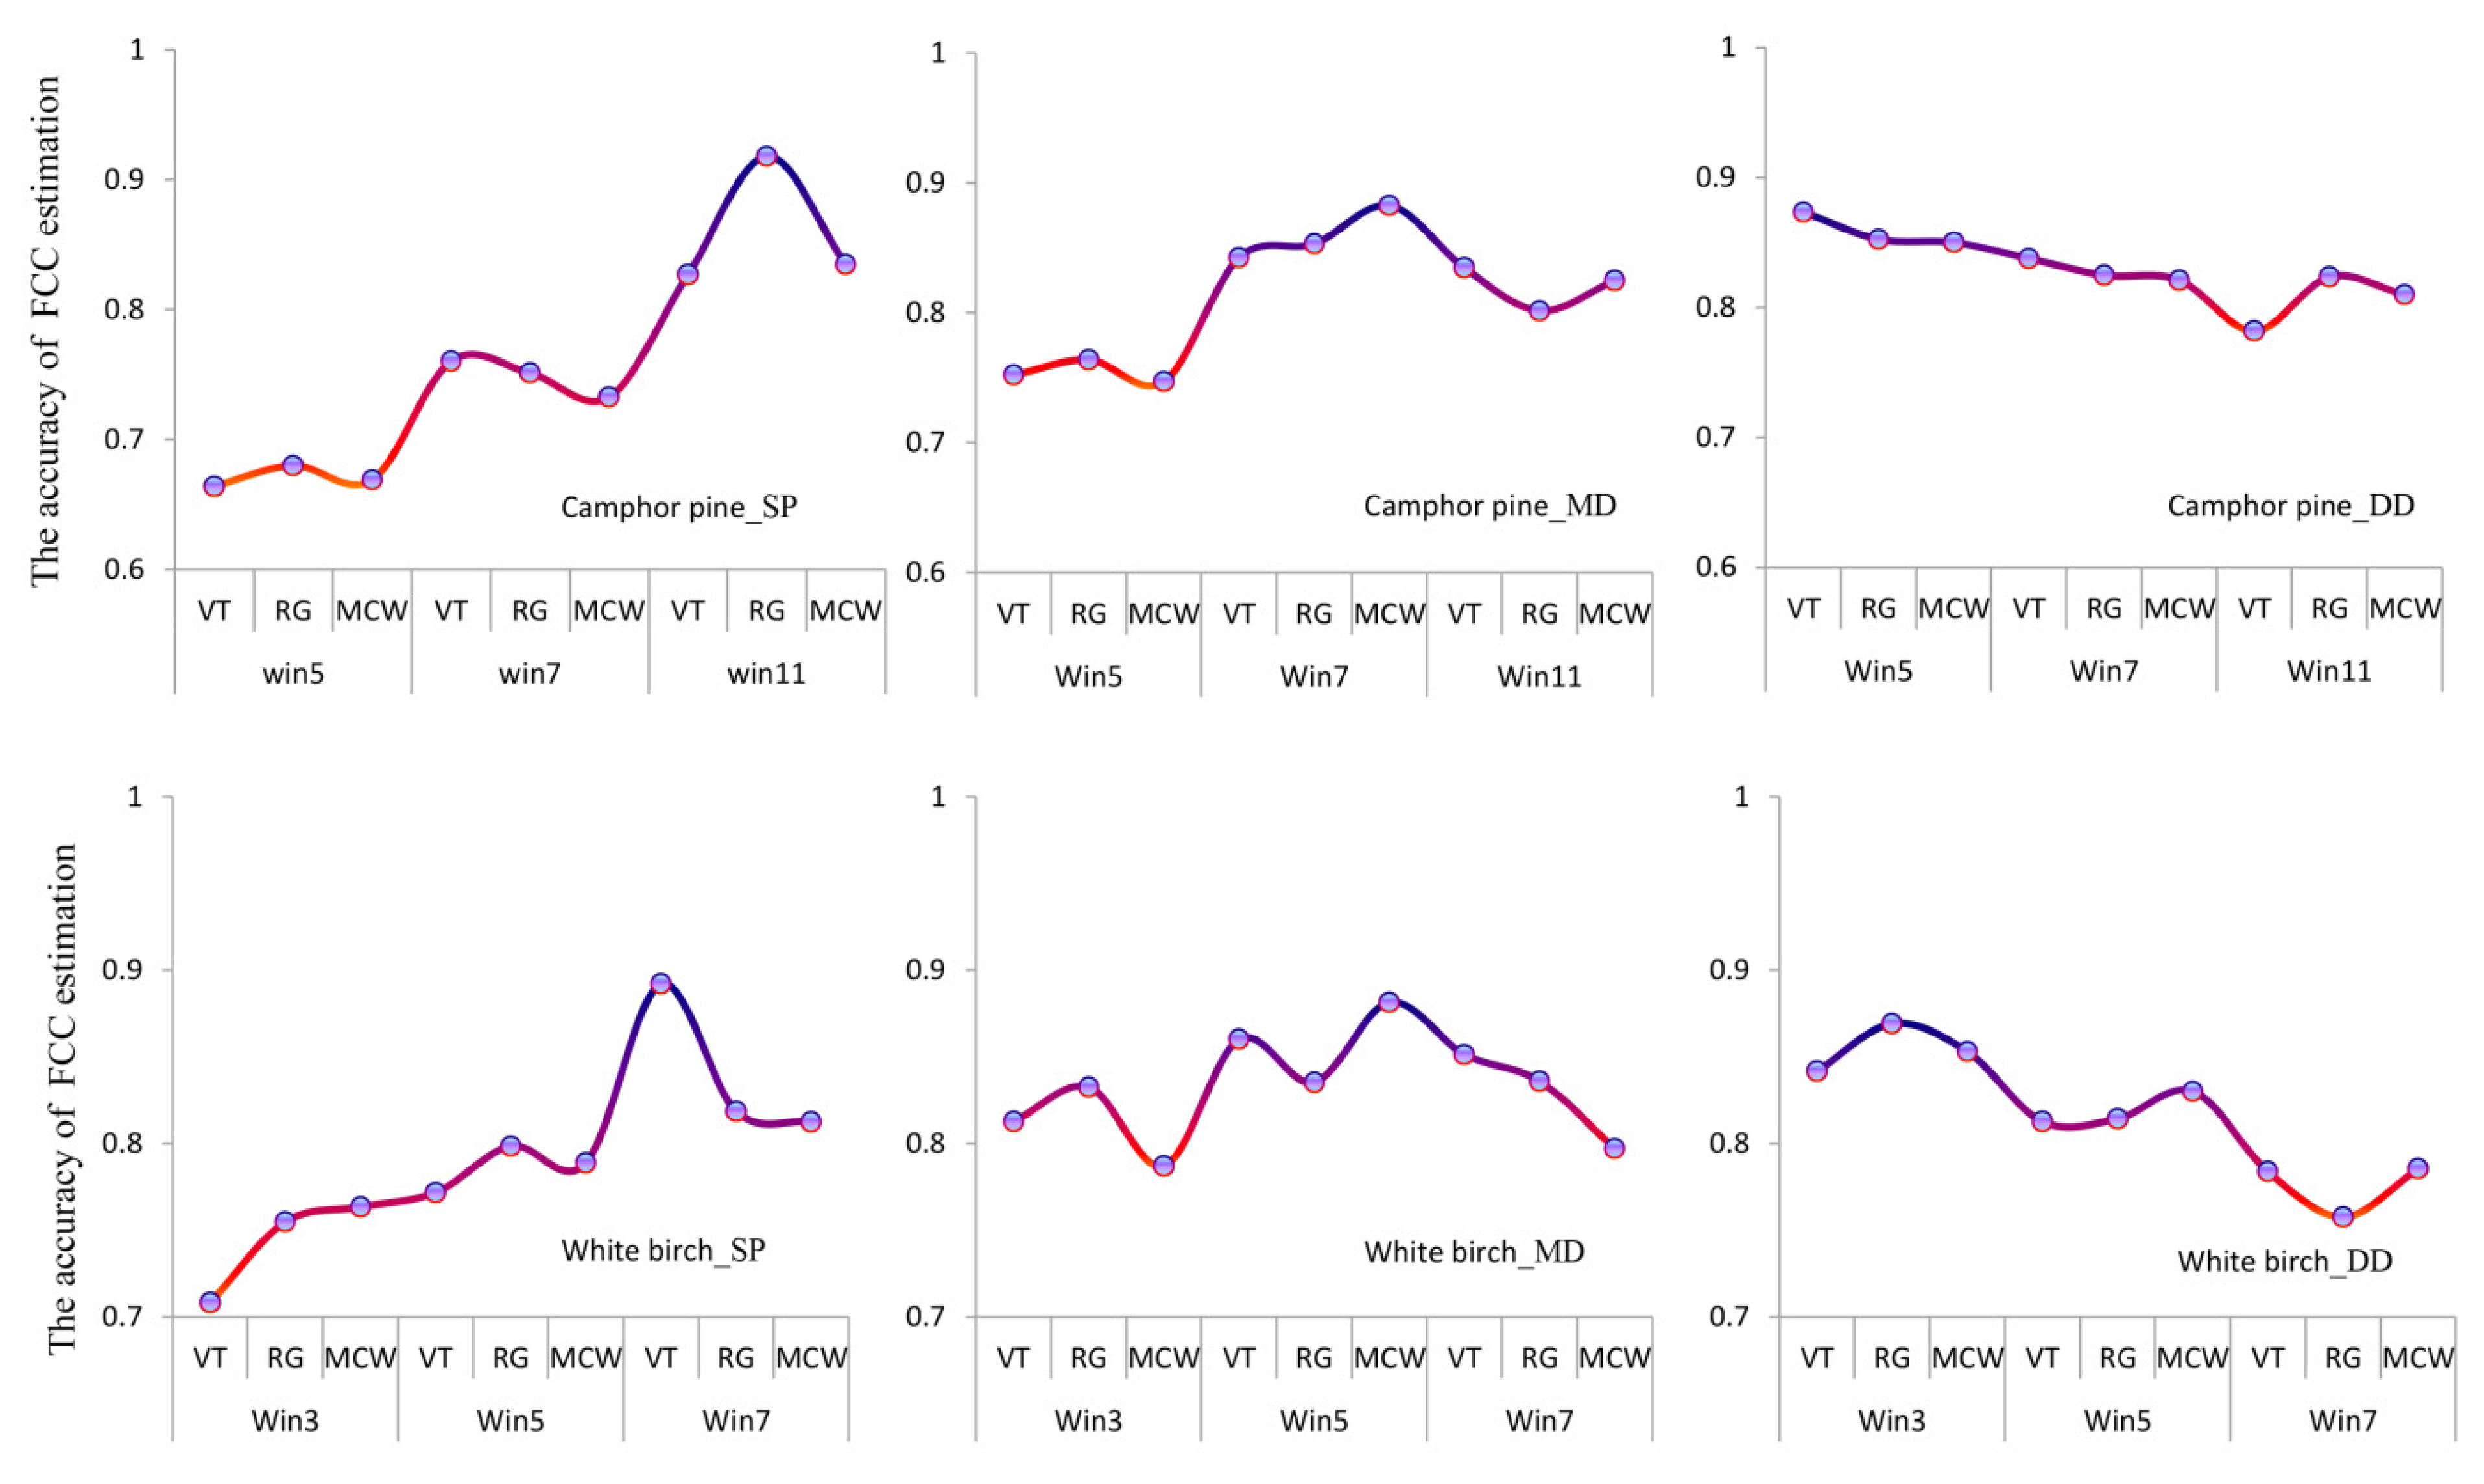
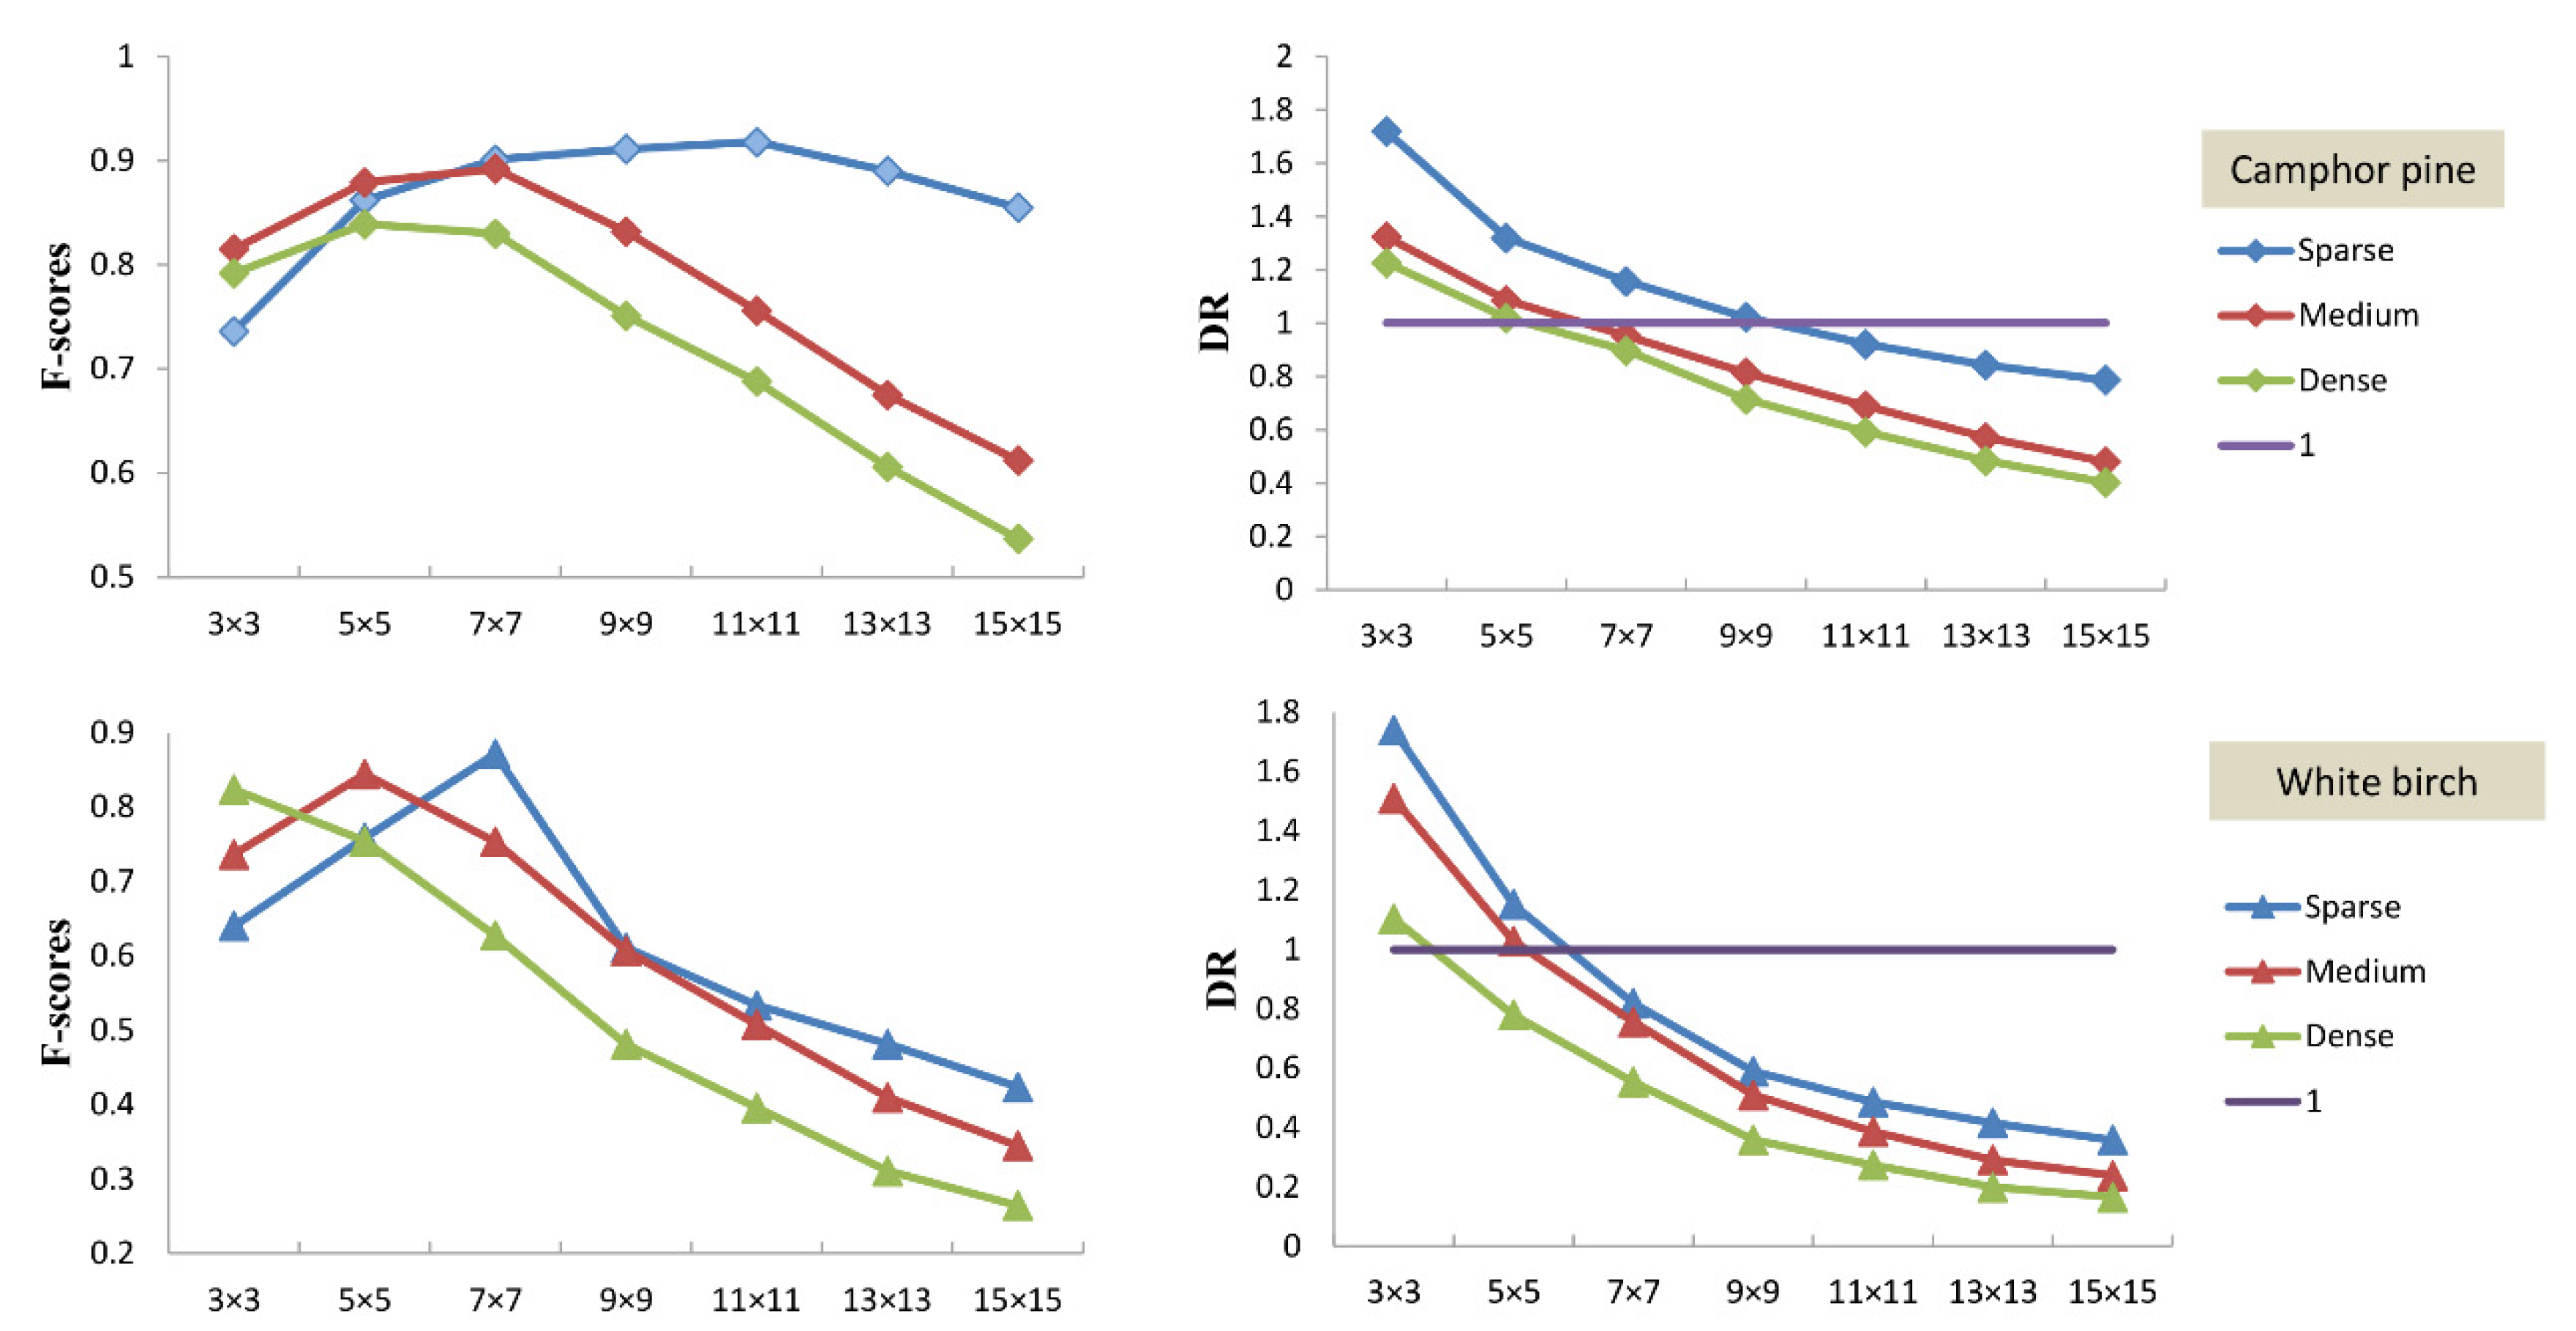
3.1. Window Size Selection and Treetop Detection

The results show that the optimum circular window sizes of camphor pine forest under the sparse, medium, and dense conditions were 11 × 11, 7 × 7, and 5 × 5. The corresponding total accuracy F-scores were 0.918, 0.892, and 0.839 (Figure 7). The window required in the sparse area was larger than the other two cases, which may be due to two reasons: the smaller gap between individual trees in medium density area or dense area and the mutual occlusion between tree crowns. Thus, the window sizes required in medium or dense areas were smaller than those of sparse areas. A detection rate close to 1 in various cases required different window sizes. For example, when detecting a treetop location with a window size of 7 × 7 at the medium density area of camphor pine, the detection rate was closest to 1. In the sparse area of camphor pine, the window sizes with the detection rate closest to 1 were 9 × 9 and 11 × 11. When adopting a 5 × 5 window to detect treetops in dense areas, the detection rate was closest to 1. These results demonstrated that the indicator of detection rate could also reflect the optimal required window size of treetops detected at various cases to some extent. The optimum circular window sizes of white birch forest were 7 × 7, 5 × 5, and 3 × 3 with corresponding F-scores (overall accuracy) of 0.871, 0.844, and 0.823 in different density areas. The window size required by white birch was smaller than that of camphor pine. The reason for this was that camphor pines in this study were mostly at a mature state with large crowns, while camphor pine (a pioneer tree species) ordinarily grows in clusters with small and scattered crowns. In addition, similar to camphor pine, white birch needs larger windows in sparse areas than in medium density or dense areas, which is caused by the mutual occlusion between crowns with the increase in density.
In short, the treetop-detection accuracy of camphor pine using the LM algorithm was higher than that of white birch, which may because the crown shape of camphor pine (coniferous species) was closer to a circle than the broad-leaved species. The crown outline of camphor pine was more regular and easier to identify. To sum up, in the process of treetop-position detection, choosing the appropriate window size according to the different species and density is a crucial step that helps to improve the accuracy of tree-crown delineation.

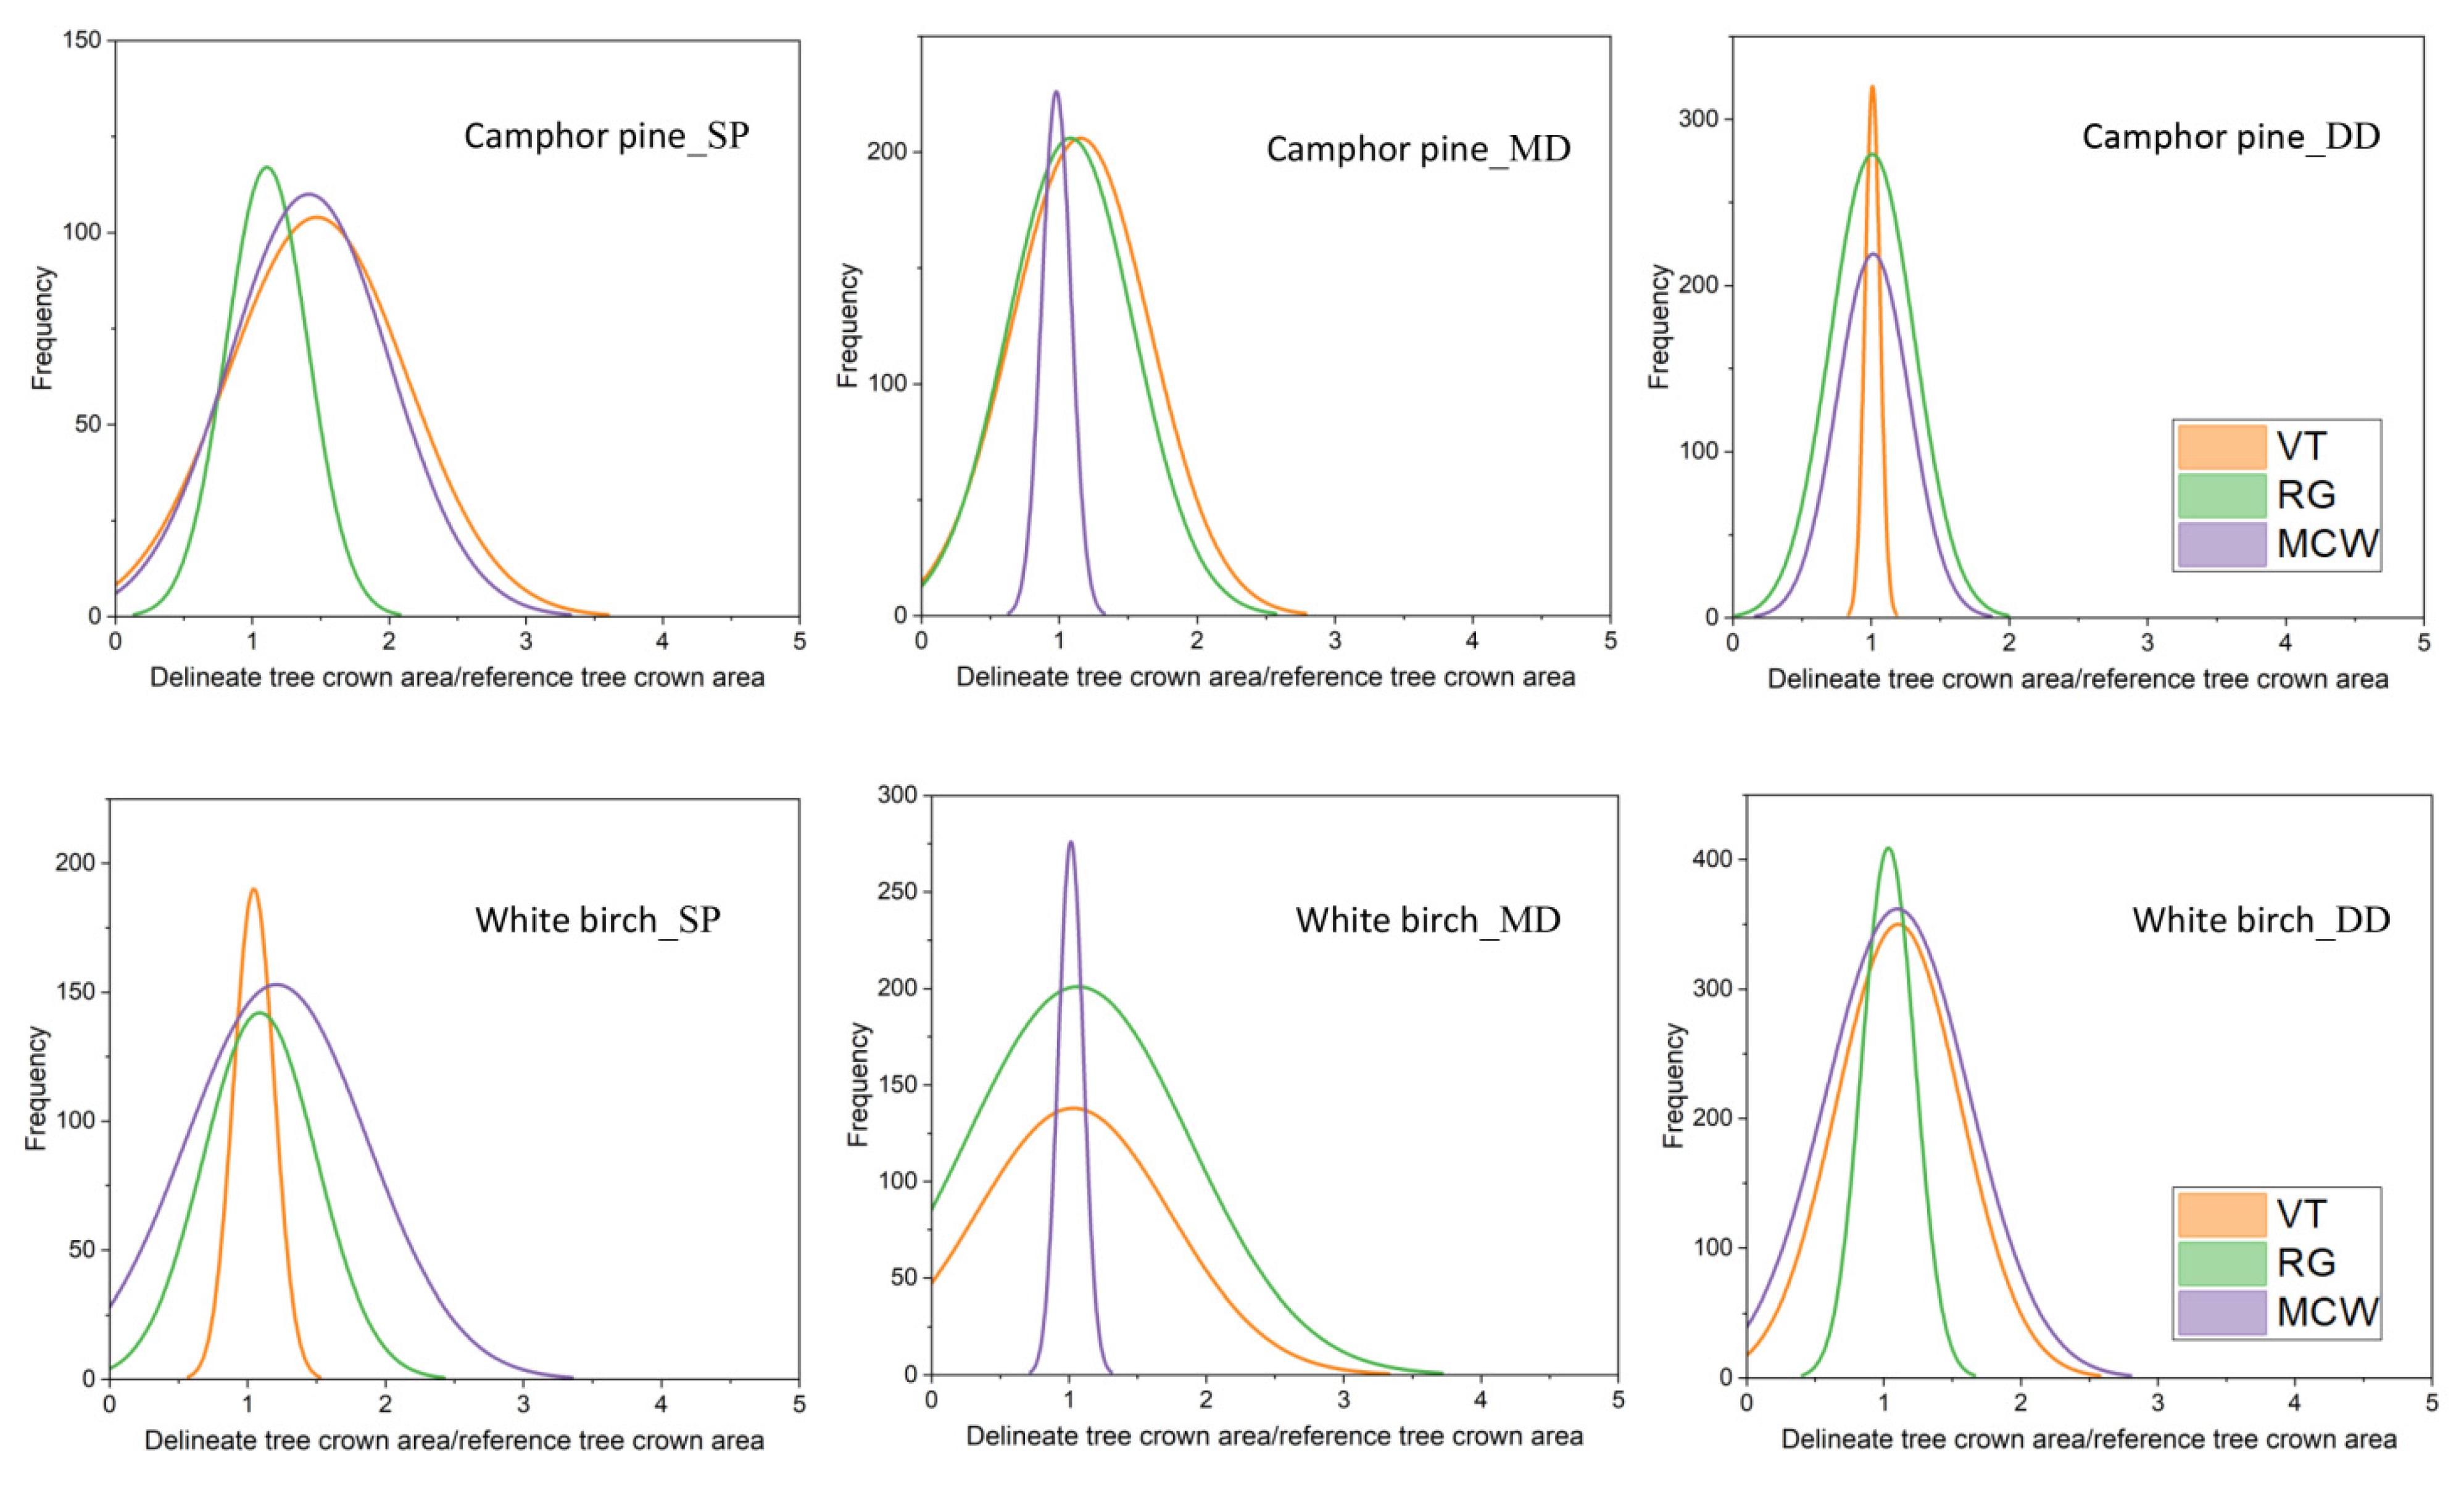
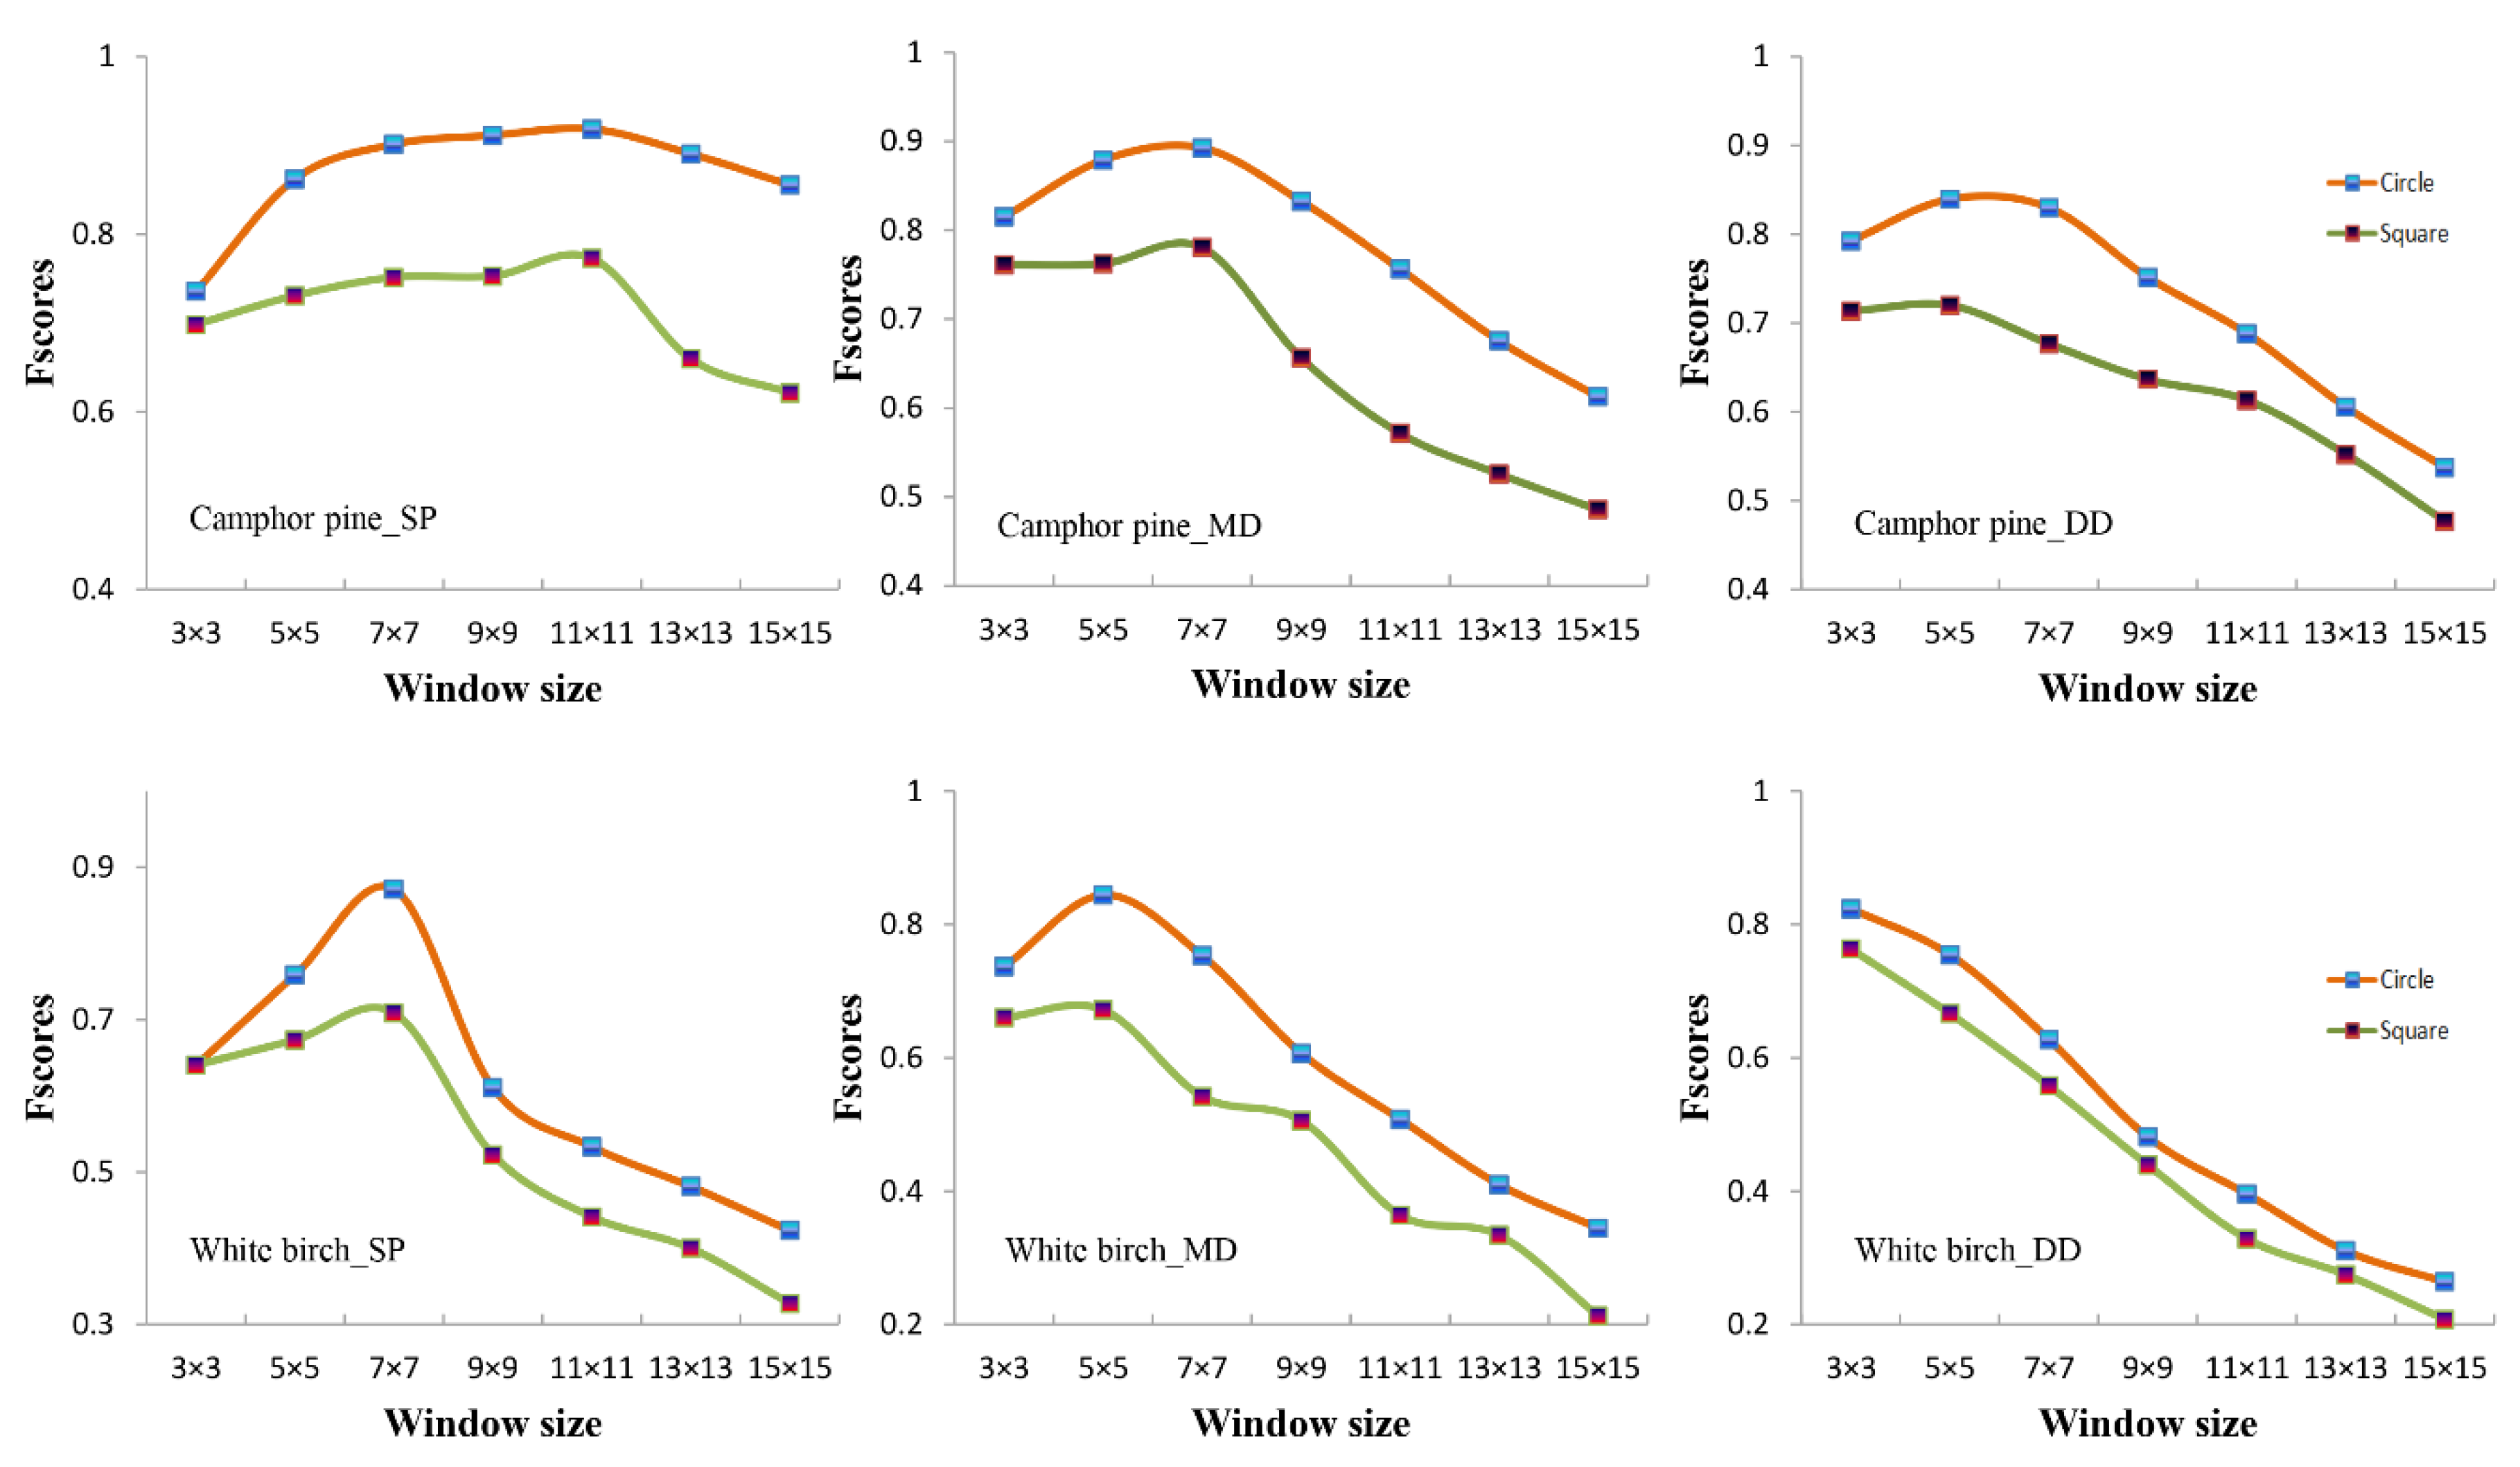
3.2. Optimal Tree-Crown Extraction

By analyzing the results of three kinds of tree-crown-boundary extraction algorithms, we concluded that different algorithms were suitable for different scenarios. It can be seen from Figure 8 and Table 2 that the region-growing algorithm was suitable for two scenes: the sparse area of camphor pine and the dense area of white birch. Compared with other algorithms, the crown extracted by this algorithm has a higher matching rate with the reference crown, and the ratio of these two crown boundaries was distributed around 1, which indicates that most crown contours can be well depicted. The MCW algorithm has the best effect in the medium-density area of camphor pine and white birch forest. The matching rate between the crown-boundary extracted by this algorithm and the reference crown was higher. The ratio between them was close to 1, which showed that this algorithm could better depict the actual crown boundary in the above two scenes. The VT algorithm was suitable for the dense areas of camphor pine and the sparse areas of white birch. Although the ratios of the crown area generated by the three algorithms to the reference crown area were all distributed around 1, the distribution range of this method was more concentrated, and the peak value was higher. These indices demonstrate that the difference between the delineated crown and the reference crown was small, and most crowns were effectively extracted.
The reasons for the above differences came from the differences of crown shape and the principles of each algorithm. The crown boundary of camphor pine was close to circular, and the crown shape was regular. Compared with camphor pine, the crown of white birch was smaller in this study area, so there are differences in crown-boundary-extraction algorithms required by the two species with different stand densities. It is worth noting that the MCW algorithm was suitable for medium-density areas of white birch and camphor pine. This scenario with medium density and a certain degree of mutual occlusion between crowns make it suited to the principles of the MCW algorithm, leading to effective crown-boundary extraction. Different algorithms were applicable in different scenarios, so it was critical to choose the best crown-boundary-extraction algorithm to improve the accuracy of FCC estimation.

3.3. Integrated Estimation of FCC in Various Forest Scenes

The accuracy of the FCC-estimation method proposed in this study was analyzed based on the measured data of plots (Table 1). As shown in Figure 9 and Table 3 and Table 4, the results show that the overall FCC-estimation accuracy of camphor pine using the integrated method proposed by this study was about 89.11%, which was 6.77–11.25% higher than that generated under other combination conditions. Other combination conditions refer to treetop detection using any window size and tree-crown delineation using any contour extraction algorithm regardless of forest species and density. The accuracy of the optimal FCC estimated in sparse areas was generated by the combination of treetop detection using a 11 × 11 window size and the tree-crown contour extracted using the RG method. This combination method improved the accuracy of FCC by 8.33–25.39% compared to other combinations. The medium-density region increased by 2.93–13.54%, and the dense areas improved by 2.06–9.14%. The overall FCC accuracy of white birch was about 87.53%, which was 3.25–8.42% higher than that obtained under other combined conditions. The definition of other combined conditions is the same as that of camphor pine. The optimal combination method of FCC estimation in sparse areas was the treetop-detection method with a 7 × 7 circular window, and the crown-contour-extraction algorithm with the MCW algorithm led to an accuracy of about 89.2%. This result was 7.35–18.39% higher than other combination methods. The estimation accuracy of FCC in medium-dense areas was about 88.1%, which improved the accuracy by 1.13–9.45%, and the estimation accuracy of FCC in dense areas increased by 1.56–11.15% after using the optimization method.
To sum up, the optimization method proposed in this study improved the estimation accuracy of FCC to a certain extent, especially in sparse areas. Trees in sparse areas grow at a scattered distribution state, which causes the results of treetop detection to have a strong influence on judging the presence of crowns in FCC estimation. Therefore, adopting the optimal treetop-detection-window size and crown-boundary-extraction algorithm ensured the crown-range-extraction accuracy and improved the accuracy of the FCC estimation. In addition, the accuracy of the camphor pine FCC estimation was higher than that for white birch, which was caused by the crown characteristics and growth statuses of these two species. The camphor pine forests were mostly mature forests with more regular crowns, while the crowns of the white birch forests were mostly scattered.

4. Discussion

4.1. Treetop-Detection-Window Size and Influence Factors

One critical problem in treetop detection is choosing the optimal window size in different scenes, which has a significant relationship with the shape and size of the actual tree crown. Camphor-pine-top-detection accuracy was higher than that of white birch, which is mainly because camphor pines have obvious top and crown shapes, making them easier to detect. As Figure 10 shows, the window size corresponding to the high-value region of F-scores was concentrated below 7 × 7 in most scenarios. The local maximum method was not effective with the larger window, which was related to the tree species and their growth status in this area. Excessive window size may cause some treetops to be missed, influencing the accuracy of treetop detection. Notably, when the window size was 3 × 3 the effect of the local maximum method in sparse areas was weaker than that in medium areas or dense areas. By analyzing the crown size of sparse areas in this study area, it can be seen that the crown diameter was greater than 1.5 m (about 3 pixels), so errors occurred when using a 3 × 3 window to detect treetops. The window size required for the sparse region was larger than the medium or dense region regardless of camphor pine or white birch, which demonstrated that the density of forests is also an important factor influencing the parameter set and accuracy of treetop detection. Further research should consider this issue when adopting the LM method in identifying individual trees.
Square windows are also widely used for treetop detection. To compare the difference between these two types of window shape at treetop detection, this study conducted tree detection with circle and square windows in various cases. The results show that the value of the F-scores obtained from the square windows was lower than circle windows in most scenarios. The accuracy of treetop detection varied with different window sizes. These above results demonstrate that the performance of the circular window is preferred to that of the square window in most scenarios regardless of camphor pine or white birch. The optimal window sizes of circular or square windows in each case were similar, which indicated that the shape of the window influences the accuracy of the treetop detection of each scenario. Therefore, in treetop detection, the circular window has better performance and fits the tree-crown shape better. This result is consistent with previous studies [51,52].

4.2. Factors Influencing Tree-Crown Extraction

Tree-crown extraction was a critical step for estimating the FCC in this study. The optimal method of tree-crown extraction varied according to species and forest density. These results indicated that it is necessary to explore crown extraction algorithms suitable for different scenarios and then apply the results to estimate FCC to improve accuracy. Some other researchers have investigated three tree-crown methods used in this study under different conditions such as for oil palm trees, managed pine forests, deciduous and isolated forests, plantation forests, and complex and dense forest [61,62,63,64]. The tree-crown-extraction accuracy varied in these studies, though the method of accuracy evaluation may show some difference. These results support the view presented in this study that screening suitable algorithms for different tree species and different forest densities in the extraction of the canopy contour is necessary. Current and forthcoming very-high-resolution satellites such as QuickBird, IKONOS, and GEOEYE1 also have the potential to extract tree crowns. They are equipped with more spectral features that relate to tree-crown states, though these data do not contain height information. Further research will attempt to combine LiDAR data with multispectral passive optical data to conduct tree-crown delineation.
This study focuses on whether the tree crowns of given area can be extracted, and some tree-crown extraction errors have little impact on FCC estimation. For example, two or more tree crowns merged and were not divided, and their intersect boundaries were not well delineated, but the outer contours were well extracted, missing some very small and low trees and so on. Thus, the crown-extraction algorithm used for FCC estimation does not necessarily need to accurately delineate the individual tree crowns. The results of the treetop detection impact the accuracy of tree-crown delineation, because of the treetop detection used as seed points in this study. Selecting the appropriate size of the treetop-detection window according to different tree species and density conditions can generate more accurate treetop location results to a certain extent, thereby improving the accuracy of tree-crown-contour extraction.

4.3. Factors Influencing FCC Estimation

The FCC-estimation accuracy varied in different cases including tree species and stand densities. This study combined the optimal methods of treetop detection and tree crowns delineated for different tree species, which achieved higher accuracy than other combined conditions. For example, the optimal FCC estimation at the sparse region of camphor pine was achieved using the 11 × 11 circle window to detect treetops and applying the region-growth algorithm to delineate tree crowns. The optimal combinations in the medium or dense region of camphor pine were different. These results show that the applicable top-detection window size and crown-delineation algorithm varied from tree species to stand density. This indicates that it is necessary to distinguish scenes when estimating FCC by extracting the tree-crown-cover ratio of the unit area based on high-resolution images. The FCC accuracy of camphor pine is higher than white birch, which is mainly because camphor pine is equipped with a more regular tree-crown shape and is more easily correctly delineated than white birch. The above results demonstrated that one of the important factors influencing FCC estimation was the difference between various cases, which paves the way for further studies to improve the FCC accuracy adopted in this method by distinguishing more detailed cases based on the conditions of the study area.
In this study, the results of the treetop detection were used as the input data of the canopy-boundary extraction, which then were used as the basic data of the FCC estimation. These two steps may accumulate errors, even increasing the error of FCC estimation. In view of this situation, this study generated the optimal results of the first step by screening the best window sizes of different scenes. We then optimized the second step’s results by delineating tree crowns using the most suitable algorithms in various cases. Thus, the FCC estimation errors achieved were reduced to some extent; however the accuracy of the method proposed in this study was affected by the window size in treetop recognition and different algorithms in tree-crown-boundary extraction. In most scenarios, the influence of the treetop-detection-window size on the final FCC-estimation accuracy was more obvious than the difference of the crown-contour-extraction algorithm. The main reason for the above phenomenon was that the accurate identification of the treetop position was directly related to whether a tree could be detected. All crown-contour-extraction algorithms take the treetop positions as seed points, which further deepen the dependence on the first step. This conclusion not only reflects the necessity of dividing scenes but also provides a new idea for subsequent FCC estimation.

4.4. Limitations and Future Research

This study used LiDAR data and high-resolution aerial RGB images to estimate the FCC by directly extracting the vertical projection area of the canopy at the field plot efficiently and accurately. However, the FCC was defined as the proportion of the canopy area commonly observed from the top-down, while the field-measured FCC data were always obtained from the bottom-up view. In response to this problem, this study used the CHM product generated from LiDAR point cloud data as the data for tree-canopy extraction. These data were obtained by DSM minus DEM. The pixel value represents the height of the tree canopy. There were differences between the different positions of individual trees and the heights of different trees. Therefore, the shape of the tree crown using this data can be closer to the actual crown size of the tree. This data can be, to a certain extent, to avoid the bias introduced by this definition. In treetop identification and tree-crown delineation, some small trees are inevitably blocked by large trees, and this may cause omission errors. Although the occurrence of this situation was one of the error sources in FCC estimation, this issue has a limited impact on the accuracy of FCC compared with the limitations of the algorithm itself. This was because the FCC per unit area contributed by the large canopy and low and small trees with small canopies has a higher probability overlap with the large canopy. In addition, the difference of the local maximum algorithm and crown-delineated algorithm used in treetop-position detection and tree-crown delineated in various cases was one of the main factors affecting the accuracy of FCC estimation, which also demonstrated the necessity of distinguishing the different scenes. The follow-up study will focus on considering the differences of other factors, such as terrain and climate, and then divide more detailed scenes to generate more accurate FCC-estimation results.

5. Conclusions

Tree-crown shape and size vary in different forest species and densities. Therefore, it is necessary to distinguish different scenarios in FCC estimation. The conclusions of this study are as follows. (1) There were differences in the size of the treetop-detection windows in different scenarios. The top detection window of camphor pine was larger than that of white birch with the same stand density, which was between 5 × 5~11 × 11 (corresponding to 2.5~5.5 m) for camphor pine and 3 × 3~7 × 7 (corresponding to 1.5~3.5 m) for white birch. (2) Forest-crown-extraction algorithms performed differently in different scenes. With a medium stand density, the MCW algorithm had the best extraction effect. The RG algorithm had a better extraction effect in sparse areas of camphor pine and dense areas of white birch. The VT algorithm was more suitable for dense areas of camphor pine and sparse areas of white birch. (3) The method used for FCC estimation based on the idea of integration proposed in this study had a good effect, and its overall estimation accuracy was obviously improved. The accuracy of FCC in the camphor pine forest was 89.11%, representing an improvement of 6.77–11.25%, compared to the results obtained from other combined conditions. The accuracy of the optimal FCC estimated in sparse areas was improved by 8.33–25.39%, medium density areas increased by 2.93–13.54%, and dense areas improved by 2.06–9.14%. The overall FCC accuracy for white birch was about 87.53%, which was 3.25–8.42% higher than that of other combined conditions. The FCC accuracy for the sparse area was about 89.2%, which was 7.35–18.39% higher than the other combination methods. The estimated accuracy of white birch FCC in medium-dense areas was improved about 1.13–9.45%. The estimated accuracy of FCC in dense areas was increased by 1.56–11.15%. The above results show that. with the increasing spatial resolution of remote-sensing images, the method of directly extracting canopy coverage per unit area and then calculating FCC is expected to be widely used. This study provides a new method for the accurate estimation of forest-canopy density with very-high-resolution images.

Author Contributions

Conceptualization, Z.G., T.G. and B.S.; methodology, T.G.; software, Y.L.; validation, P.Q., Z.Y. and T.G.; formal analysis, T.G. and Y.L.; investigation, T.G., Y.L., P.Q. and Z.Y.; writing—original draft preparation, T.G. and B.S.; writing—review and editing, B.S., Z.G. and T.G.; visualization, T.G.; supervision, Z.G. and B.S.; project administration, Z.G.; funding acquisition, B.S. and Z.G. All authors have read and agreed to the published version of the manuscript.

Funding

This research was funded by the Fundamental Research Funds for the Central Non-profit Research Institution of CAF, grant number “CAFYBB2019ZB004”, and the National Science and Technology Major Project of China’s High Resolution Earth Observation System, grant number “21-Y30B02-9001-19/22-3”.

Data Availability Statement

Not applicable.

Acknowledgments

Thanks to the support provided in the form of the funding above. Constructive comments from our instructors and classmates are also greatly appreciated.

Conflicts of Interest

The authors declare that they have no known competing financial interests or personal relationships that could have appeared to influence the work reported in this paper.

References

  1. Korhonen, L.; Korhonen, K.T.; Rautiainen, M.; Stenberg, P. Estimation of forest canopy cover: A comparison of field measurement techniques. Silva Fenn. 2006, 40, 577–588. [Google Scholar] [CrossRef]
  2. Deljouei, A.; Sadeghi, S.M.M.; Abdi, E.; Bernhardt-Römermann, M.; Pascoe, E.L.; Marcantonio, M. The impact of road disturbance on vegetation and soil properties in a beech stand, Hyrcanian forest. Eur. J. For. Res. 2018, 137, 759–770. [Google Scholar] [CrossRef]
  3. Pyngrope, O.R.; Kumar, M.; Pebam, R.; Singh, S.K.; Kundu, A.; Lal, D. Investigating forest fragmentation through earth observation datasets and metric analysis in the tropical rainforest area. SN Appl. Sci. 2021, 3, 1–17. [Google Scholar] [CrossRef]
  4. Korhonen, L.; Packalen, P.; Rautiainen, M. Comparison of Sentinel-2 and Landsat 8 in the estimation of boreal forest canopy cover and leaf area index. Remote Sens. Environ. 2017, 195, 259–274. [Google Scholar] [CrossRef]
  5. Senf, C.; Sebald, J.; Seidl, R. Increasing canopy mortality affects the future demographic structure of Europe’s forests. One Earth 2021, 4, 749–755. [Google Scholar] [CrossRef]
  6. Gastón, A.; Blázquez-Cabrera, S.; Mateo-Sánchez, M.; Simón, M.; Saura, S. The role of forest canopy cover in habitat selection: Insights from the Iberian lynx. Eur. J. Wildl. Res. 2019, 65, 1–10. [Google Scholar] [CrossRef]
  7. Nakamura, A.; Kitching, R.L.; Cao, M.; Creedy, T.J.; Fayle, T.M.; Freiberg, M.; Hewitt, C.N.; Itioka, T.; Koh, L.P.; Ma, K.; et al. Forests and Their Canopies: Achievements and Horizons in Canopy Science. Trends Ecol. Evol. 2017, 32, 438–451. [Google Scholar] [CrossRef]
  8. Seidel, D.; Leuschner, C.; Scherber, C.; Beyer, F.; Wommelsdorf, T.; Cashman, M.J.; Fehrmann, L. The relationship between tree species richness, canopy space exploration and productivity in a temperate broad-leaf mixed forest. For. Ecol. Manag. 2013, 310, 366–374. [Google Scholar] [CrossRef]
  9. Jin, D.; Qi, J.; Huang, H.; Li, L. Combining 3D Radiative Transfer Model and Convolutional Neural Network to Accurately Estimate Forest Canopy Cover from Very High-Resolution Satellite Images. IEEE J. Sel. Top. Appl. Earth Obs. Remote Sens. 2021, 14, 10953–10963. [Google Scholar] [CrossRef]
  10. Fiala, A.C.; Garman, S.L.; Gray, A.N. Comparison of five canopy cover estimation techniques in the western Oregon Cascades. For. Ecol. Manag. 2006, 232, 188–197. [Google Scholar] [CrossRef]
  11. Hansen, M.C.; Potapov, P.V.; Moore, R.; Hancher, M.; Turubanova, S.A.; Tyukavina, A.; Thau, D.; Stehman, S.V.; Goetz, S.J.; Loveland, T.R.; et al. High-Resolution Global Maps of 21st-Century Forest Cover Change. Science 2013, 342, 850–853. [Google Scholar] [CrossRef] [PubMed]
  12. Ahmed, O.S.; Franklin, S.E.; Wulder, M.A.; White, J.C. Characterizing stand-level forest canopy cover and height using Landsat time series, samples of airborne LiDAR, and the Random Forest algorithm. ISPRS J. Photogramm. Remote Sens. 2015, 101, 89–101. [Google Scholar] [CrossRef]
  13. Chen, G.; Lou, T.; Jing, W.; Wang, Z. Sparkpr: An Efficient Parallel Inversion of Forest Canopy Closure. IEEE Access 2019, 7, 135949–135956. [Google Scholar] [CrossRef]
  14. Ganz, S.; Adler, P.; Kändler, G. Forest cover mapping based on a combination of aerial images and Sentinel-2 satellite data compared to National Forest Inventory data. Forests 2020, 11, 1322. [Google Scholar] [CrossRef]
  15. Hua, Y.; Zhao, X. Multi-Model Estimation of Forest Canopy Closure by Using Red Edge Bands Based on Sentinel-2 Images. Forests 2021, 12, 1768. [Google Scholar] [CrossRef]
  16. Karlson, M.; Ostwald, M.; Reese, H.; Sanou, J.; Tankoano, B.; Mattsson, E. Mapping tree canopy cover and aboveground biomass in Sudano-Sahelian woodlands using Landsat 8 and random forest. Remote Sens. 2015, 7, 10017–10041. [Google Scholar] [CrossRef]
  17. Zeng, Y.; Schaepman, M.E.; Wu, B.; Clevers, J.G.; Bregt, A.K. Scaling-based forest structural change detection using an inverted geometric-optical model in the Three Gorges region of China. Remote Sens. Environ. 2008, 112, 4261–4271. [Google Scholar] [CrossRef]
  18. Gu, C.; Du, H.; Mao, F.; Han, N.; Zhou, G.; Xu, X.; Sun, S.; Gao, G. Global sensitivity analysis of PROSAIL model parameters when simulating Moso bamboo forest canopy reflectance. Int. J. Remote Sens. 2016, 37, 5270–5286. [Google Scholar] [CrossRef]
  19. Wang, C.; Du, H.; Zhou, G.; Xu, X.; Sun, S.; Gao, G. Retrieval of crown closure of moso bamboo forest using unmanned aerial vehicle (UAV) remotely sensed imagery based on geometric-optical model. Yingyong Shengtai Xuebao 2015, 26, 1501–1509. [Google Scholar]
  20. Li, J.; Mao, X. Comparison of Canopy Closure Estimation of Plantations Using Parametric, Semi-Parametric, and Non-Parametric Models Based on GF-1 Remote Sensing Images. Forests 2020, 11, 597. [Google Scholar] [CrossRef]
  21. Tian, H.; Cao, C.; Bao, D.; Dang, Y.; Xu, M. Temporal changing analysis of forest crown closure of Anshan city based on spectral mixture analysis. In Proceedings of the 2013 IEEE International Geoscience and Remote Sensing Symposium-IGARSS, Melbourne, Australia, 21–26 July 2013; pp. 3809–3812. [Google Scholar]
  22. Jacquemoud, S. Inversion of the PROSPECT + SAIL canopy reflectance model from AVIRIS equivalent spectra: Theoretical study. Remote Sens. Environ. 1993, 44, 281–292. [Google Scholar] [CrossRef]
  23. Li, P.; He, X.; Cheng, X.; Gao, X.; Li, R.; Qiao, M.; Li, D.; Qiu, F.; Li, Z. Object Extraction From Very High-Resolution Images Using a Convolutional Neural Network Based on a Noisy Large-Scale Dataset. IEEE Access 2019, 7, 122784–122795. [Google Scholar] [CrossRef]
  24. Yurtseven, H.; Akgul, M.; Coban, S.; Gulci, S. Determination and accuracy analysis of individual tree crown parameters using UAV based imagery and OBIA techniques. Measurement 2019, 145, 651–664. [Google Scholar] [CrossRef]
  25. de Castro, A.I.; Shi, Y.; Maja, J.M.; Peña, J.M. UAVs for Vegetation Monitoring: Overview and Recent Scientific Contributions. Remote Sens. 2021, 13, 2139. [Google Scholar] [CrossRef]
  26. Torresan, C.; Berton, A.; Carotenuto, F.; Di Gennaro, S.F.; Gioli, B.; Matese, A.; Miglietta, F.; Vagnoli, C.; Zaldei, A.; Wallace, L. Forestry applications of UAVs in Europe: A review. Int. J. Remote Sens. 2017, 38, 2427–2447. [Google Scholar] [CrossRef]
  27. Pleșoianu, A.-I.; Stupariu, M.-S.; Șandric, I.; Pătru-Stupariu, I.; Drăguț, L. Individual Tree-Crown Detection and Species Classification in Very High-Resolution Remote Sensing Imagery Using a Deep Learning Ensemble Model. Remote Sens. 2020, 12, 2426. [Google Scholar] [CrossRef]
  28. Apostol, B.; Petrila, M.; Lorenţ, A.; Ciceu, A.; Gancz, V.; Badea, O. Species discrimination and individual tree detection for predicting main dendrometric characteristics in mixed temperate forests by use of airborne laser scanning and ultra-high-resolution imagery. Sci. Total Environ. 2020, 698, 134074. [Google Scholar] [CrossRef]
  29. Yoshii, T.; Matsumura, N.; Lin, C. Integrating UAV and Lidar Data for Retrieving Tree Volume of Hinoki Forests. In Proceedings of the IGARSS 2020–2020 IEEE International Geoscience and Remote Sensing Symposium, Waikoloa, HI, USA, 26 September–2 October 2020; pp. 4124–4127. [Google Scholar]
  30. Hyyppä, J.; Hyyppä, H.; Leckie, D.; Gougeon, F.; Yu, X.; Maltamo, M. Review of methods of small-footprint airborne laser scanning for extracting forest inventory data in boreal forests. Int. J. Remote Sens. 2008, 29, 1339–1366. [Google Scholar] [CrossRef]
  31. Maltamo, M.; Næsset, E.; Vauhkonen, J. Forestry applications of airborne laser scanning. Concepts Case Stud. Manag Ecosys 2014, 27, 460. [Google Scholar]
  32. Pitkänen, J.; Maltamo, M.; Hyyppä, J.; Yu, X. Adaptive methods for individual tree detection on airborne laser based canopy height model. Int. Arch. Photogramm. Remote Sens. Spat. Inf. Sci. 2004, 36, 187–191. [Google Scholar]
  33. Jing, L.; Hu, B.; Li, J.; Noland, T. Automated delineation of individual tree crowns from LiDAR data by multi-scale analysis and segmentation. Photogramm. Eng. Remote Sens. 2012, 78, 1275–1284. [Google Scholar] [CrossRef]
  34. Picos, J.; Bastos, G.; Míguez, D.; Alonso, L.; Armesto, J. Individual tree detection in a eucalyptus plantation using unmanned aerial vehicle (UAV)-LiDAR. Remote Sens. 2020, 12, 885. [Google Scholar] [CrossRef]
  35. Dalponte, M.; Frizzera, L.; Gianelle, D. Individual tree crown delineation and tree species classification with hyperspectral and LiDAR data. PeerJ 2019, 6, e6227. [Google Scholar] [CrossRef] [PubMed]
  36. Díaz-Varela, R.A.; De la Rosa, R.; León, L.; Zarco-Tejada, P.J. High-resolution airborne UAV imagery to assess olive tree crown parameters using 3D photo reconstruction: Application in breeding trials. Remote Sens. 2015, 7, 4213–4232. [Google Scholar] [CrossRef]
  37. Ghanbari Parmehr, E.; Amati, M. Individual Tree Canopy Parameters Estimation Using UAV-Based Photogrammetric and LiDAR Point Clouds in an Urban Park. Remote Sens. 2021, 13, 2062. [Google Scholar] [CrossRef]
  38. Wagner, F.H.; Ferreira, M.P.; Sanchez, A.; Hirye, M.C.M.; Zortea, M.; Gloor, E.; Phillips, O.L.; de Souza Filho, C.R.; Shimabukuro, Y.E.; Aragão, L.E.O.C. Individual tree crown delineation in a highly diverse tropical forest using very high resolution satellite images. ISPRS J. Photogramm. Remote Sens. 2018, 145, 362–377. [Google Scholar] [CrossRef]
  39. Coomes, D.A.; Dalponte, M.; Jucker, T.; Asner, G.P.; Banin, L.F.; Burslem, D.F.; Lewis, S.L.; Nilus, R.; Phillips, O.L.; Phua, M.-H. Area-based vs tree-centric approaches to mapping forest carbon in Southeast Asian forests from airborne laser scanning data. Remote Sens. Environ. 2017, 194, 77–88. [Google Scholar] [CrossRef]
  40. Jucker, T.; Caspersen, J.; Chave, J.; Antin, C.; Barbier, N.; Bongers, F.; Dalponte, M.; van Ewijk, K.Y.; Forrester, D.I.; Haeni, M.; et al. Allometric equations for integrating remote sensing imagery into forest monitoring programmes. Glob. Change Biol. 2017, 23, 177–190. [Google Scholar] [CrossRef]
  41. Korpela, I.; Dahlin, B.; Schäfer, H.; Bruun, E.; Haapaniemi, F.; Honkasalo, J.; Ilvesniemi, S.; Kuutti, V.; Linkosalmi, M.; Mustonen, J. Single-tree forest inventory using lidar and aerial images for 3D treetop positioning, species recognition, height and crown width estimation. In Proceedings of the ISPRS workshop on laser scanning, Espoo, Finland, 12–14 September 2007; pp. 12–14. [Google Scholar]
  42. Yu, X.; Hyyppä, J.; Vastaranta, M.; Holopainen, M.; Viitala, R. Predicting individual tree attributes from airborne laser point clouds based on the random forests technique. ISPRS J. Photogramm. Remote Sens. 2011, 66, 28–37. [Google Scholar] [CrossRef]
  43. Yun, T.; Jiang, K.; Li, G.; Eichhorn, M.P.; Fan, J.; Liu, F.; Chen, B.; An, F.; Cao, L. Individual tree crown segmentation from airborne LiDAR data using a novel Gaussian filter and energy function minimization-based approach. Remote Sens. Environ. 2021, 256, 112307. [Google Scholar] [CrossRef]
  44. Silva, C.A.; Hudak, A.T.; Vierling, L.A.; Loudermilk, E.L.; O’Brien, J.J.; Hiers, J.K.; Jack, S.B.; Gonzalez-Benecke, C.; Lee, H.; Falkowski, M.J.; et al. Imputation of Individual Longleaf Pine (Pinus palustris Mill.) Tree Attributes from Field and LiDAR Data. Can. J. Remote Sens. 2016, 42, 554–573. [Google Scholar] [CrossRef]
  45. Dalponte, M.; Coomes, D.A. Tree-centric mapping of forest carbon density from airborne laser scanning and hyperspectral data. Methods Ecol. Evol. 2016, 7, 1236–1245. [Google Scholar] [CrossRef] [PubMed]
  46. Zhang, Y.; Feng, X.; Le, X. Segmentation on multispectral remote sensing image using watershed transformation. In Proceedings of the 2008 Congress on Image and Signal Processing, Sanya, China, 27–30 May 2008; pp. 773–777. [Google Scholar]
  47. Adams, R.; Bischof, L. Seeded region growing. IEEE Trans. Pattern Anal. Mach. Intell. 1994, 16, 641–647. [Google Scholar] [CrossRef] [Green Version]
  48. Wang, L.; Gong, P.; Biging, G.S. Individual tree-crown delineation and treetop detection in high-spatial-resolution aerial imagery. Photogramm. Eng. Remote Sens. 2004, 70, 351–357. [Google Scholar] [CrossRef]
  49. Koch, B.; Heyder, U.; Weinacker, H. Detection of individual tree crowns in airborne lidar data. Photogramm. Eng. Remote Sens. 2006, 72, 357–363. [Google Scholar] [CrossRef]
  50. Wulder, M.; Niemann, K.O.; Goodenough, D.G. Local Maximum Filtering for the Extraction of Tree Locations and Basal Area from High Spatial Resolution Imagery. Remote Sens. Environ. 2000, 73, 103–114. [Google Scholar] [CrossRef]
  51. Doruska, P.F.; Burkhart, H.E. Modeling the diameter and locational distribution of branches within the crowns of loblolly pine trees in unthinned plantations. Can. J. For. Res. 1994, 24, 2362–2376. [Google Scholar] [CrossRef]
  52. Popescu, S.C.; Wynne, R.H. Seeing the trees in the forest. Photogramm. Eng. Remote Sens. 2004, 70, 589–604. [Google Scholar] [CrossRef]
  53. Roussel, J.-R.; Auty, D.; Coops, N.C.; Tompalski, P.; Goodbody, T.R.; Meador, A.S.; Bourdon, J.-F.; de Boissieu, F.; Achim, A. lidR: An R package for analysis of Airborne Laser Scanning (ALS) data. Remote Sens. Environ. 2020, 251, 112061. [Google Scholar] [CrossRef]
  54. Plakman, V.; Janssen, T.; Brouwer, N.; Veraverbeke, S. Mapping species at an individual-tree scale in a temperate forest, using sentinel-2 images, airborne laser scanning data, and random forest classification. Remote Sens. 2020, 12, 3710. [Google Scholar] [CrossRef]
  55. Roussel, J.; Auty, D. Airborne LiDAR Data Manipulation and Visualization for Forestry Applications R Package, Version 3.1.2; R Fundation for Statistical Computing: Vienna, Austria, 2021. [Google Scholar]
  56. Meyer, F.; Beucher, S. Morphological segmentation. J. Vis. Commun. Image Represent. 1990, 1, 21–46. [Google Scholar] [CrossRef]
  57. Plowright, A.; Plowright, M.A. Package ‘ForestTools’. CRAN. 2018. Available online: https://github.com (accessed on 11 December 2021).
  58. Kwong, I.H.; Fung, T. Tree height mapping and crown delineation using LiDAR, large format aerial photographs, and unmanned aerial vehicle photogrammetry in subtropical urban forest. Int. J. Remote Sens. 2020, 41, 5228–5256. [Google Scholar] [CrossRef]
  59. Zhen, Z.; Quackenbush, L.J.; Zhang, L. Impact of tree-oriented growth order in marker-controlled region growing for individual tree crown delineation using airborne laser scanner (ALS) data. Remote Sens. 2014, 6, 555–579. [Google Scholar] [CrossRef] [Green Version]
  60. Goutte, C.; Gaussier, E. A Probabilistic Interpretation of Precision, Recall and F-Score, with Implication for Evaluation. In Proceedings of the Advances in Information Retrieval, Santiago de Compostela, Spain, 21–23 March 2005; pp. 345–359. [Google Scholar]
  61. Ramli, M.F.; Tahar, K.N. Homogeneous tree height derivation from tree crown delineation using Seeded Region Growing (SRG) segmentation. Geo-Spat. Inf. Sci. 2020, 23, 195–208. [Google Scholar] [CrossRef]
  62. Lee, H.; Slatton, K.C.; Roth, B.E.; Cropper, W.P. Adaptive clustering of airborne LiDAR data to segment individual tree crowns in managed pine forests. Int. J. Remote Sens. 2010, 31, 117–139. [Google Scholar] [CrossRef]
  63. Yang, J.; He, Y.; Caspersen, J. A multi-band watershed segmentation method for individual tree crown delineation from high resolution multispectral aerial image. In Proceedings of the 2014 IEEE Geoscience and Remote Sensing Symposium, Quebec City, QC, Canada, 13–18 July 2014; pp. 1588–1591. [Google Scholar]
  64. Larsen, M.; Eriksson, M.; Descombes, X.; Perrin, G.; Brandtberg, T.; Gougeon, F.A. Comparison of six individual tree crown detection algorithms evaluated under varying forest conditions. Int. J. Remote Sens. 2011, 32, 5827–5852. [Google Scholar] [CrossRef]
Figure 1. Methodological workflow of FCC estimated. This contains five steps: data preprocess treetop detection, tree-crown delineation, FCC estimation, and accuracy evaluation. This study focuses on six cases involving two tree species, namely camphor and white birch, and three degrees of stands densities, namely sparse area, medium area, and dense area.
Remotesensing 14 04317 g001
Figure 2. Location of the study area. (ae) show the location of the study area in China. Our research mainly focuses on the region that UAV_LiDAR covered (b); (c) denotes the location relationship of the study area (marked by yellow polygon) and Hulunbuir City. (d,e) present the location relationship of study area and Ewenke Banner. The LiDAR point data and their products such as CHM (canopy height model), DSM (digital surface model) and DEM (digital elevation model) are also presented below.
Remotesensing 14 04317 g002
Figure 3. Local maps of DSM, DEM, and CHM data in different density states (taking camphor pine as an example, from left to right, these are sparse area, medium density area, and dense region).
Remotesensing 14 04317 g003
Figure 4. Partial display of fisheye photos in sample plots. The size of field plots was set 30 × 30 m, and three fisheye photos were acquired at each field plot randomly. FCC of each field plot was calculated as the mean FCC of three fisheye photos.
Remotesensing 14 04317 g004
Figure 5. The presentation of different forest species in fisheye photos. The first and third photos were taken from camphor pine, and the second and fourth photos were taken from white birch.
Remotesensing 14 04317 g005
Figure 6. Various window sizes from 3 × 3 to 15 × 15 used in treetop detection.
Remotesensing 14 04317 g006
Figure 7. Treetop-detection accuracy in various cases. X axes refers to various treetop-detection-window sizes; y axes refer to F-scores or DR, where F-scores refer to the overall accuracy of treetop detection based on the local maximum method. The higher the value of F-scores, the higher the accuracy of treetops detected. DR denotes the detection rate, values of which close to 1 indicted a superior the treetops detected effect.
Remotesensing 14 04317 g007
Figure 8. Frequency-distribution map of the ratio value of the delineated crown and the reference crown in various scenarios. Camphor pine_SP, Camphor pine_MD, and Camphor pine _DD refer to the sparse area, medium area, and dense area of camphor pine, respectively; White birch_SP, White birch_MD and White birch_DD refer to the sparse, medium, and dense areas of white birch. Orange, green, and purple lines refer to the tree-crown delineation using the methods of VT, RG, and MCW, respectively.
Remotesensing 14 04317 g008
Figure 9. The accuracy comparison of FCC at various scenes using the method of integrating different window sizes to detect treetops and different algorithms to extract tree-crown boundaries. The three images above represent the case of camphor pine, while the three images below denote the case of white birch.
Remotesensing 14 04317 g009
Figure 10. Treetop-detection accuracy of various window size and shape at different density states and forest species. The yellow line refers to the F-scores of treetop detection with various circle window sizes; the green line refers to the F-scores of treetops detected using various square window sizes.
Remotesensing 14 04317 g010
Table 1. Statistical information of field plots including the number of field plots, stands density of field plots, and FCC of camphor pine and white birch. FCC refers to the mean forest-canopy closure of field plots. SPs is the abbreviation of sparse plots; MDs is the abbreviation of medium density plots; DDs refers to dense plots.
Camphor PineWhite Birch
SPsMDsDDsSPsMDsDDs
Number of field plots (N)111413101010
Density (N/ha)202383520436678966
FCC0.450.760.860.540.850.94
Table 2. The matched conditions of tree-crown results obtained by different crown-contour algorithms with reference-crown results among various scenarios.
MatchedCamphor PineWhite Birch
SPsMDsDDsSPsMDsDDs
RG0.910.870.820.810.820.84
MCW0.810.890.780.790.860.67
VT0.820.860.850.870.830.74
Table 3. FCC-estimation accuracy of white birch forest. Win3_VT refers to adopting 3 × 3 window size to detect treetops and using the Voronoi tessellation algorithm to delineate tree-crown area. Our method refers to the FCC estimation of this study used, which combines the optimal results of treetop detection and tree-crown delineation.
win3_VTwin3_MCWwin3_RGwin5_VTwin5_MCWwin5_RGwin7_VTwin7_MCWwin7_RGOur Method
RMSE0.160.150.140.150.120.140.140.160.170.10
rRMSE0.200.190.170.190.160.170.170.210.210.12
EA79.9280.7182.8581.0084.2882.7182.5779.1879.1187.53
Table 4. The FCC-estimation accuracy of camphor pine forest.
win5_VTwin5_RGwin5_MCWwin7_RGwin7_MCWwin7_VTwin11_RGwin11_VTwin11_MCWOur Method
RMSE0.160.160.170.130.130.130.130.140.130.08
rRMSE0.220.220.230.180.180.180.180.200.180.11
EA77.8578.3877.0281.9582.2882.3481.9980.3181.5289.11
Publisher’s Note: MDPI stays neutral with regard to jurisdictional claims in published maps and institutional affiliations.

