Article

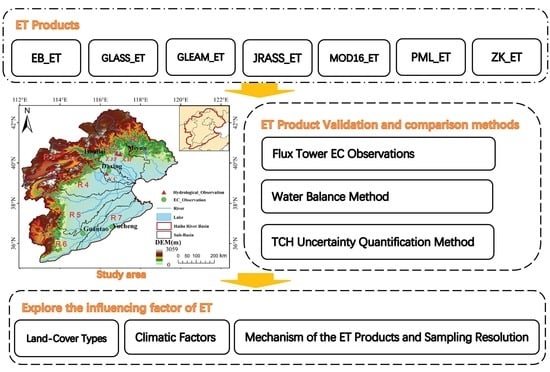
Validation and Comparison of Seven Land Surface Evapotranspiration Products in the Haihe River Basin, China

1
College of Resource Environment and Tourism, Capital Normal University, Beijing 100048, China
2
Beijing Laboratory of Water Resources Security, Beijing 100048, China
3
Land-Atmosphere Interaction and Its Climatic Effects Group, State Key Laboratory of Tibetan Plateau Earth System, Resources and Environment (TPESRE), Institute of Tibetan Plateau Research, Chinese Academy of Sciences, Beijing 100101, China
*
Author to whom correspondence should be addressed.
Remote Sens. 2022, 14(17), 4308; https://doi.org/10.3390/rs14174308
Submission received: 30 June 2022 / Revised: 12 August 2022 / Accepted: 26 August 2022 / Published: 1 September 2022

Abstract

:
Evapotranspiration (ET) is an important part of the surface energy balance and water balance. Due to imperfect model parameterizations and forcing data, there are still great uncertainties concerning ET products. The validation of land surface ET products has a certain research significance. In this study, two direct validation methods, including the latent heat flux (LE) from the flux towers validation method and the water balance validation method, and one indirect validation method, the three-corned hat (TCH) uncertainty analysis, were used to validate and compare seven types of ET products in the Haihe River Basin in China. The products evaluated included six ET products based on remotely-sensed observations (surface energy balance based global land evapotranspiration [EB-ET], Moderate Resolution Imaging Spectroradiometer [MODIS] global terrestrial evapotranspiration product [MOD16], Penman–Monteith–Leuning Evapotranspiration version 2 [PML_V2], Global Land Surface Satellite [GLASS], global land evaporation Amsterdam model [GLEAM], and Zhangke evapotranspiration [ZK-ET]) and one ET product from atmospheric re-analysis data (Japanese 55-year re-analysis, JRA-55). The goals of this study were to provide a reference for research on ET in the Haihe River Basin. The results indicate the following: (1) The results of the six ET products have a higher accuracy when the flux towers validation method is used. Except for MOD16_ET and EB_ET, the Pearson correlation coefficients (R) were all greater than 0.6. The root mean square deviation (RMSD) values were all less than 40 W/m2. The GLASS_ET data have the smallest average deviation (BIAS) value. Overall, the GLEAM_ET data have a higher accuracy. (2) When the validation of the water balance approach was used, the low values of the MOD16_ET were overestimated and the high values were underestimated. The values of the EB_ET, GLEAM_ET, JRA_ET, PML_ET, and ZK_ET were overestimated. According to the seasonal variations statistics, most of the ET products have higher R values in spring and lower R values in summer, and the RMSD values of most of the products were the highest in summer. (3) According to the results of the uncertainty quantification based on the TCH method, the average value of the relative uncertainties of the GLEAM_ET data were the lowest. The relative uncertainties of the JRA_ET and ZK_ET were higher in mountainous areas than in non-mountainous area, and the relative uncertainties of the PML_ET were lower in mountainous areas. The performances of the EB_ET, GLEAM_ET, and MOD16_ET in mountainous and non-mountainous areas were relatively equal. The relative uncertainties of the ET products were significantly higher in summer than in other periods, and they also varied in the different sub-basins.

Graphical Abstract

1. Introduction

Terrestrial evapotranspiration (ET) consists of evaporation from soil and canopy interception, as well as transpiration from vegetation [1]. It has importance for surface energy and water balance, and has profound implications for climate change [2,3]. The types of ET products include physical process models [4,5,6], energy balance models [7,8], atmospheric re-analysis [9], and machine learning or integration models [10]. The rapid development of remote sensing satellite-based models in the past few decades has made it possible to capture the spatial and temporal variability of ET from regional to continental and even global scales. However, these remote sensing satellite-based models usually present different degrees of uncertainties depending on their theories, structural assumptions, and input parameterization, and those limitations are mainly governed by changes in landscape, climatological, and hydrological conditions [11]. RS-ET products are susceptible to spatial heterogeneity and meteorological complexity, so they have different applicability in different regions. Due to the quality and quantity of atmospheric data, atmospheric re-analysis products also have uncertainties. The uncertainties of the models and input data of the ET products affect the accuracy and application scope of the products. Therefore, the accuracies of ET products need to be evaluated.
Reliable information on ET is very important for various bio-geophysical applications, including those of the forestry, hydrological, agricultural, and meteorological disciplines [12]. The accurate quantification of ET is challenging because its variations are controlled by complex interactions among soil moisture availability, atmospheric feedback, and heterogeneous vegetation conditions [13]. The current land surface ET product accurate evaluation methods usually consist of direct validation and indirect validation [14]. Direct validation is based on the use of in situ measurements to obtain the ground truth values. This method can be used as the primary and reliable method of validating ET data and is usually employed at the pixel-scale and regional-scales [15,16]. In situ measurements, including the Bowen ratio, lysimeters, laser isotopes, and eddy co-variance, can be used as the relative true values in pixel-scale evaluations to evaluate ET products. Regional evaluations are based on the water balance method [17,18,19,20,21] and the multi-site scale expansion method [22]. In the absence of ground truth ET data, indirect validation becomes feasible, which includes the cross-checking method, multi-scale evaluation method based on high-resolution remote sensing data, and spatiotemporal change trend analysis method. Many ET products have good test results at specific observation stations, but since observation stations cannot cover all surface types, it is not clear whether they can be applied to other surface types [23]. The cross-validation method focuses on evaluating the relative accuracy of different surface evapotranspiration products and the consistency of temporal and spatial change trends. In particular, the cross-validation of multiple ET products has been further improved after the introduction of quantified methods, such as triple collocation (TC) [24] and three-cornered hat (TCH) [25,26,27,28,29,30]. TC and TCH are innovative and reliable approaches for estimating the error variance of various time-series products. The generalized TCH method allows for a relative comparison of at least three datasets based on their respective uncertainties without the need of a priori knowledge of their uncertainties [31].
The above methods have been applied in various basins. Previous studies have usually focused on the accuracy validation of only one ET model or product. For example, Zhou et al. [32] used the evapotranspiration data calculated using the Penman–Monteith (PM) formula to verify the SEBAL model in the Xilin River Basin, proving that the estimation results have a good accuracy. Liu et al. [33] used eddy correlation observations to verify the SEBAL model in the growing season in the Liaohe Delta region of China, and their validation results indicate that the SEBAL model is suitable for wetland evapotranspiration research. Studies have also been conducted on the applicability and comparison of several ET products. For example, Velpuri et al. [15] evaluated the accuracy of the MOD16 and operational simplified surface energy balance (SSEBop) products in the continental United States, and their results indicate that both products are suitable for most land cover types and that both ET products are reliable at the basin scale. Chao et al. [34] comprehensively evaluated the accuracy of five ET products (GLEAM, Penman–Monteith–Leuning (PML), MODIS, process-based land surface evapotranspiration/heat fluxes algorithm (P-LSH), and multi-tree ensemble (MTE)) based on ground-based and Gravity Recovery and Climate Experiment (GRACE) satellite observations over the continental United States. Their results showed that the P-LSH and GLEAM products were consistent with the recon data in the middle-value range. The MODIS and MTE had larger average deviation (BIAS) and root mean square deviation (RMSD) values on the yearly scale, and the MODIS and MTE datasets tended to underestimate and overestimate the ET values over the entire value range, respectively. Wartenburger et al. [35] evaluated the abilities of a range of monthly-scale ET products at the global scale and applied cluster analysis to identify the spatiotemporal differences between all of the datasets using factors such as the model choice, the meteorological forcing used to drive the assessed models, the data category, the ET scheme, and the number of soil layers in the model. Their results indicate that the model selection is mostly the dominant factor. Xie et al. [36] evaluated the applicability of three ET products using the water balance method in the Northwest Inland River of China, and their results revealed that the GLEAM data have the best fit in most of the alpine basins, and overestimation generally occurred in the ERA data in summer and autumn and in the MODIS data from October to January.
ET is affected by land use, soil moisture availability, and climate conditions [37], which makes it highly variable across heterogeneous landscapes [38]. All ET products have uncertainties [39,40], and it was suggested that combining artificial intelligence algorithms or data-driven algorithms and physical process algorithms will further improve the accuracy of ET estimation algorithms and the quality of ET datasets, as well as enhancing their capacity to be applied in different climate regions [34].
Although there is research that evaluated the ET products across China, the conclusion was that all the global ET products were unable to reasonably reproduce the ET time-series in most basins at the basin scale [41]. The Haihe River Basin is one of China’s main river basins, however, comprehensive comparative studies of multiple ET products are lacking. In this study, we mainly selected remotely-sensed ET (RS-ET) products for evaluation in this study. The principle of re-analysis data is different from that of remote sensing data, which combine ground station observations, satellite remote sensing data, and numerical simulation data to best reflect the atmospheric conditions. Therefore, a re-analysis data product was selected for comparison with the remote sensing products in this study. Direct and indirect evaluation methods were used to evaluate the applicability of ET products in the Haihe River Basin. The purposes of this study were: (i) to assess the performances of seven ET products in the Haihe River Basin using EC observation and the water balance method, and (ii) to systematically compare the relative uncertainties of the seven ET products.

2. Materials and Methods
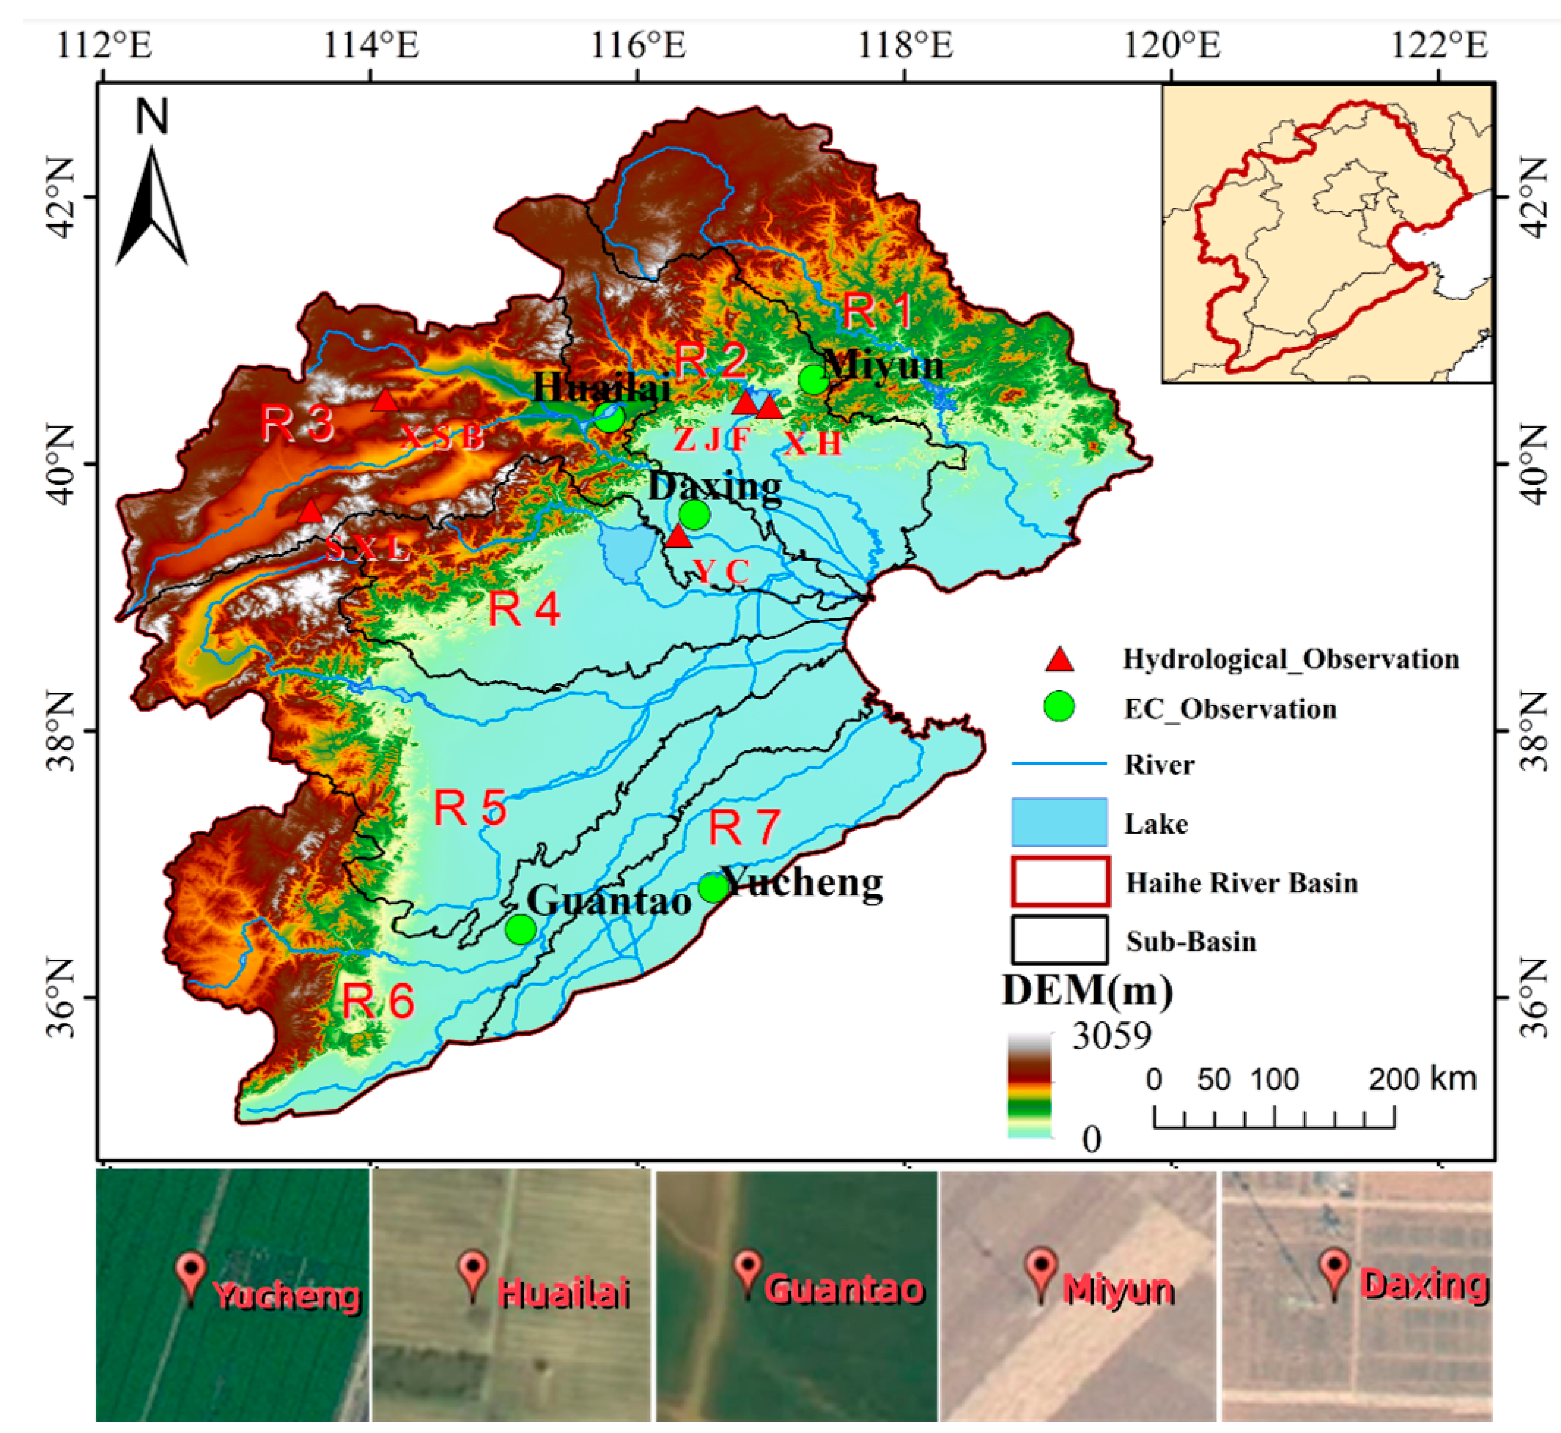
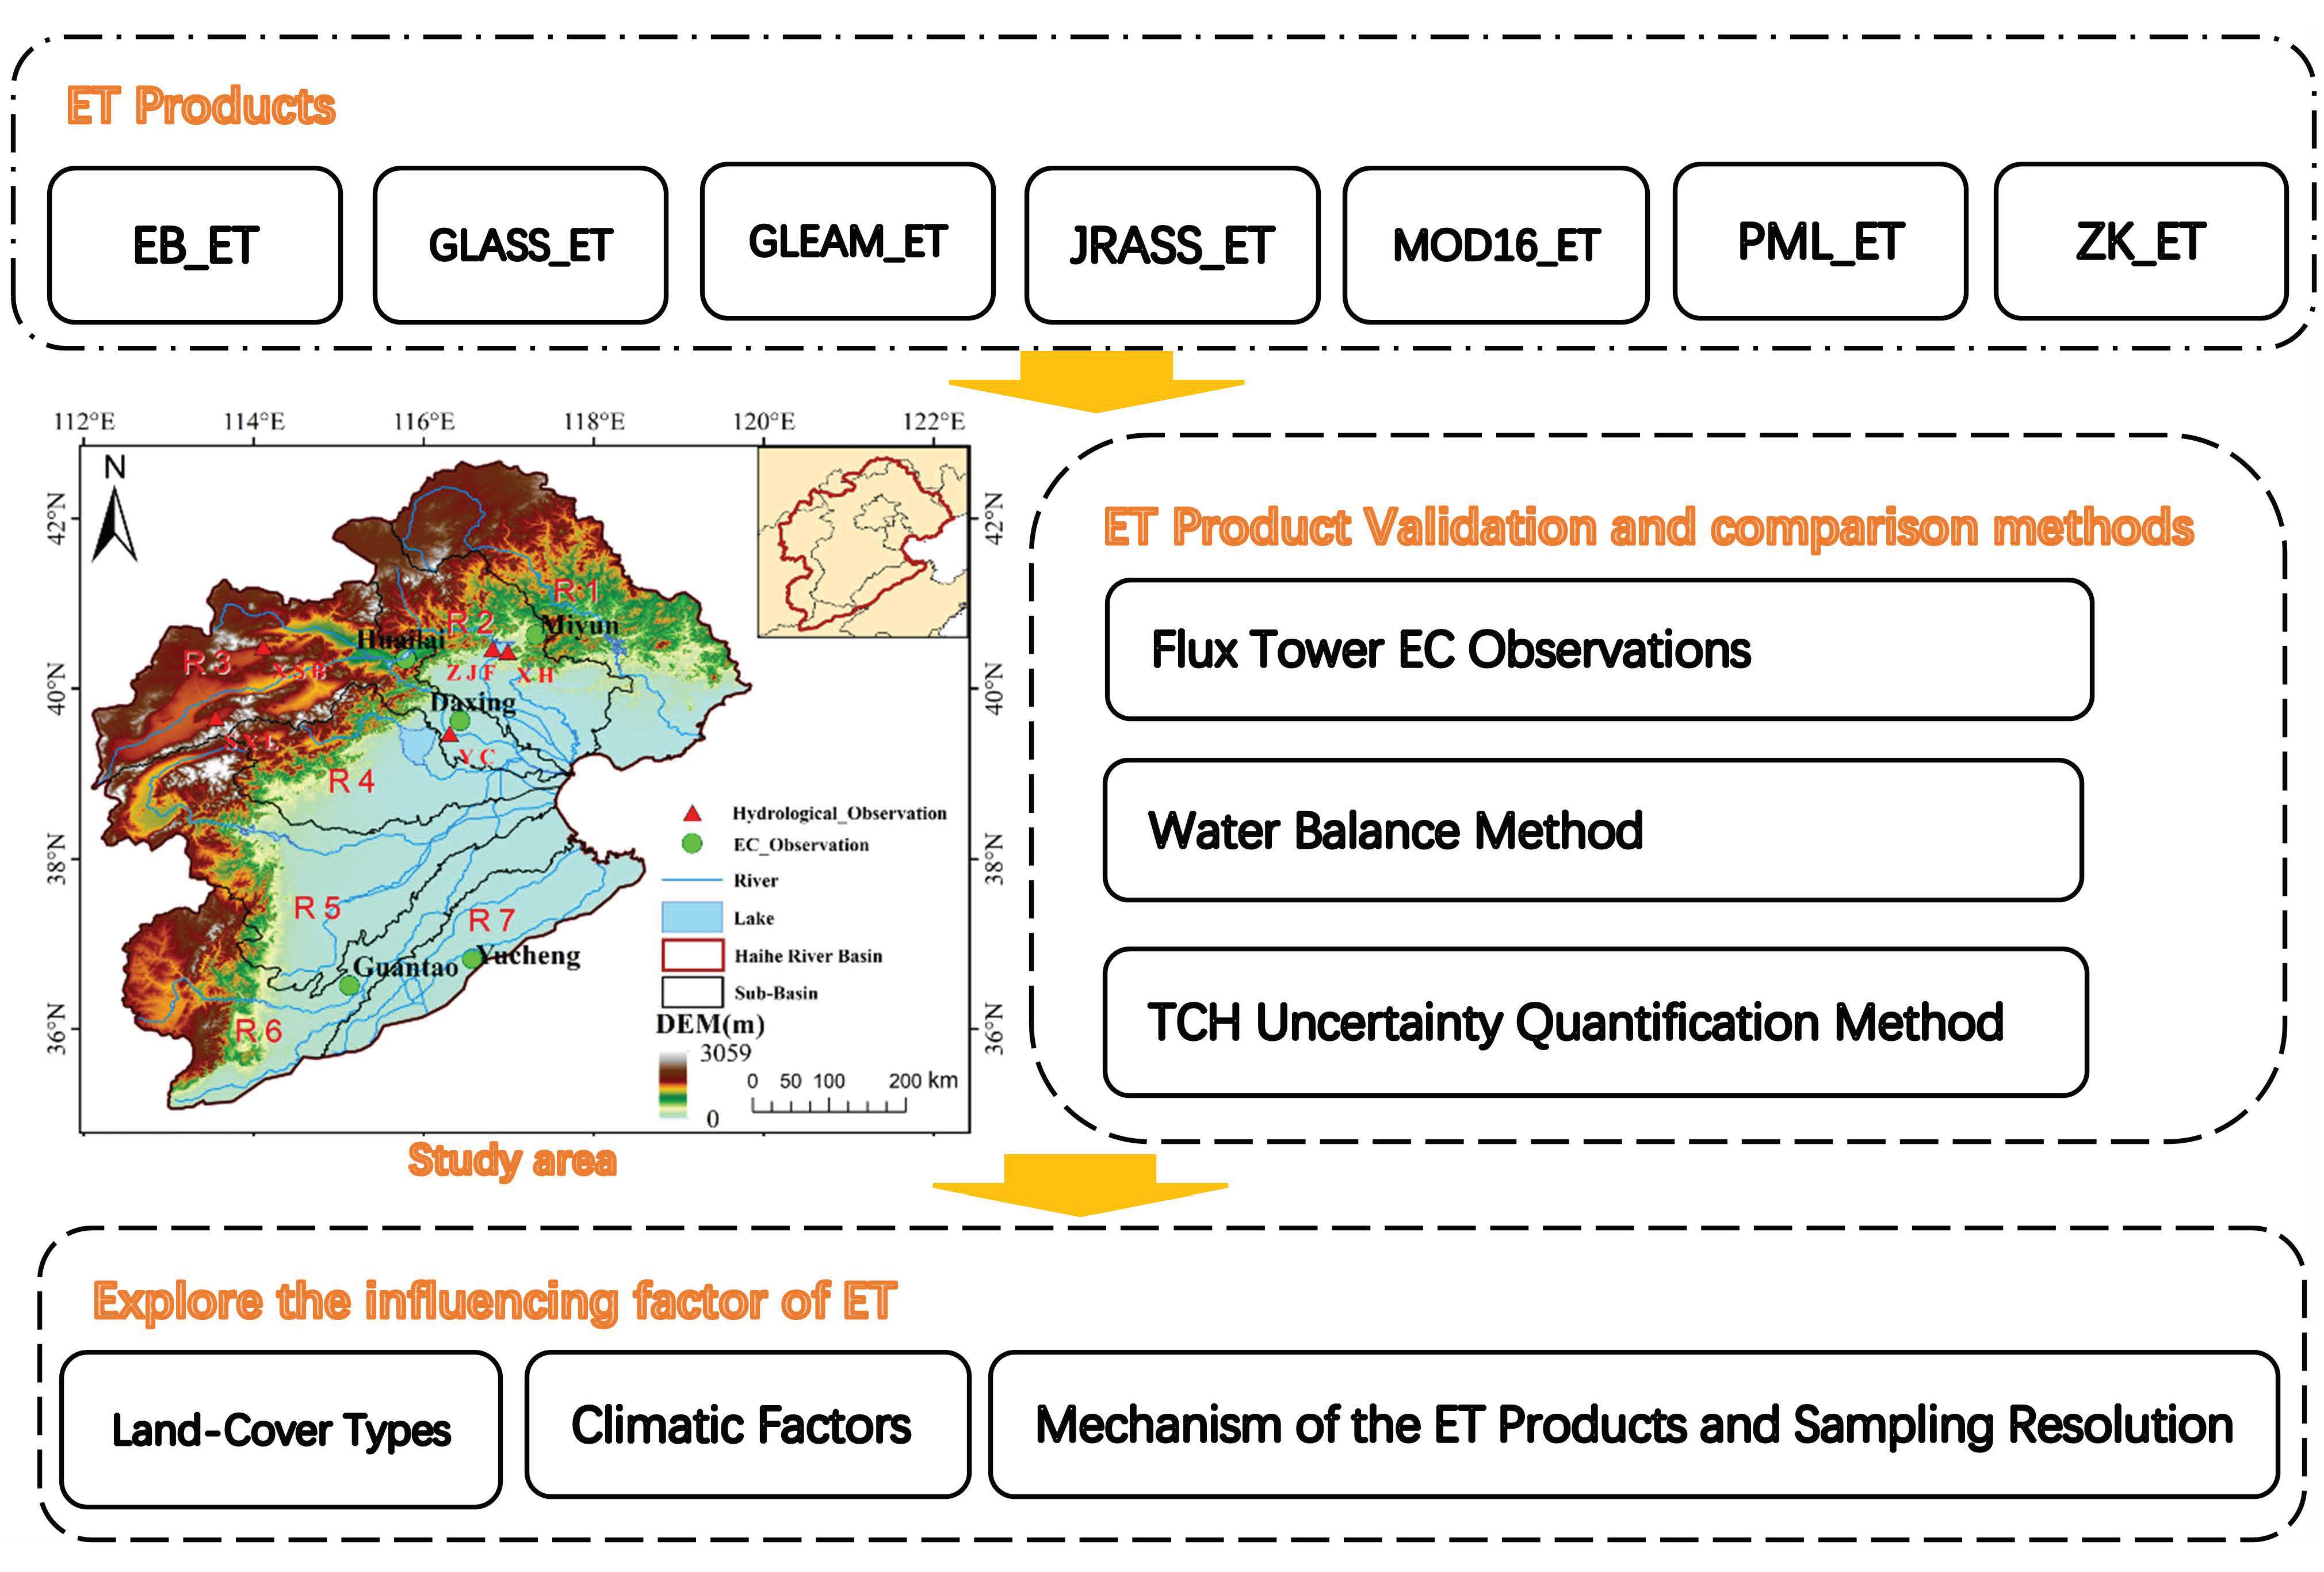
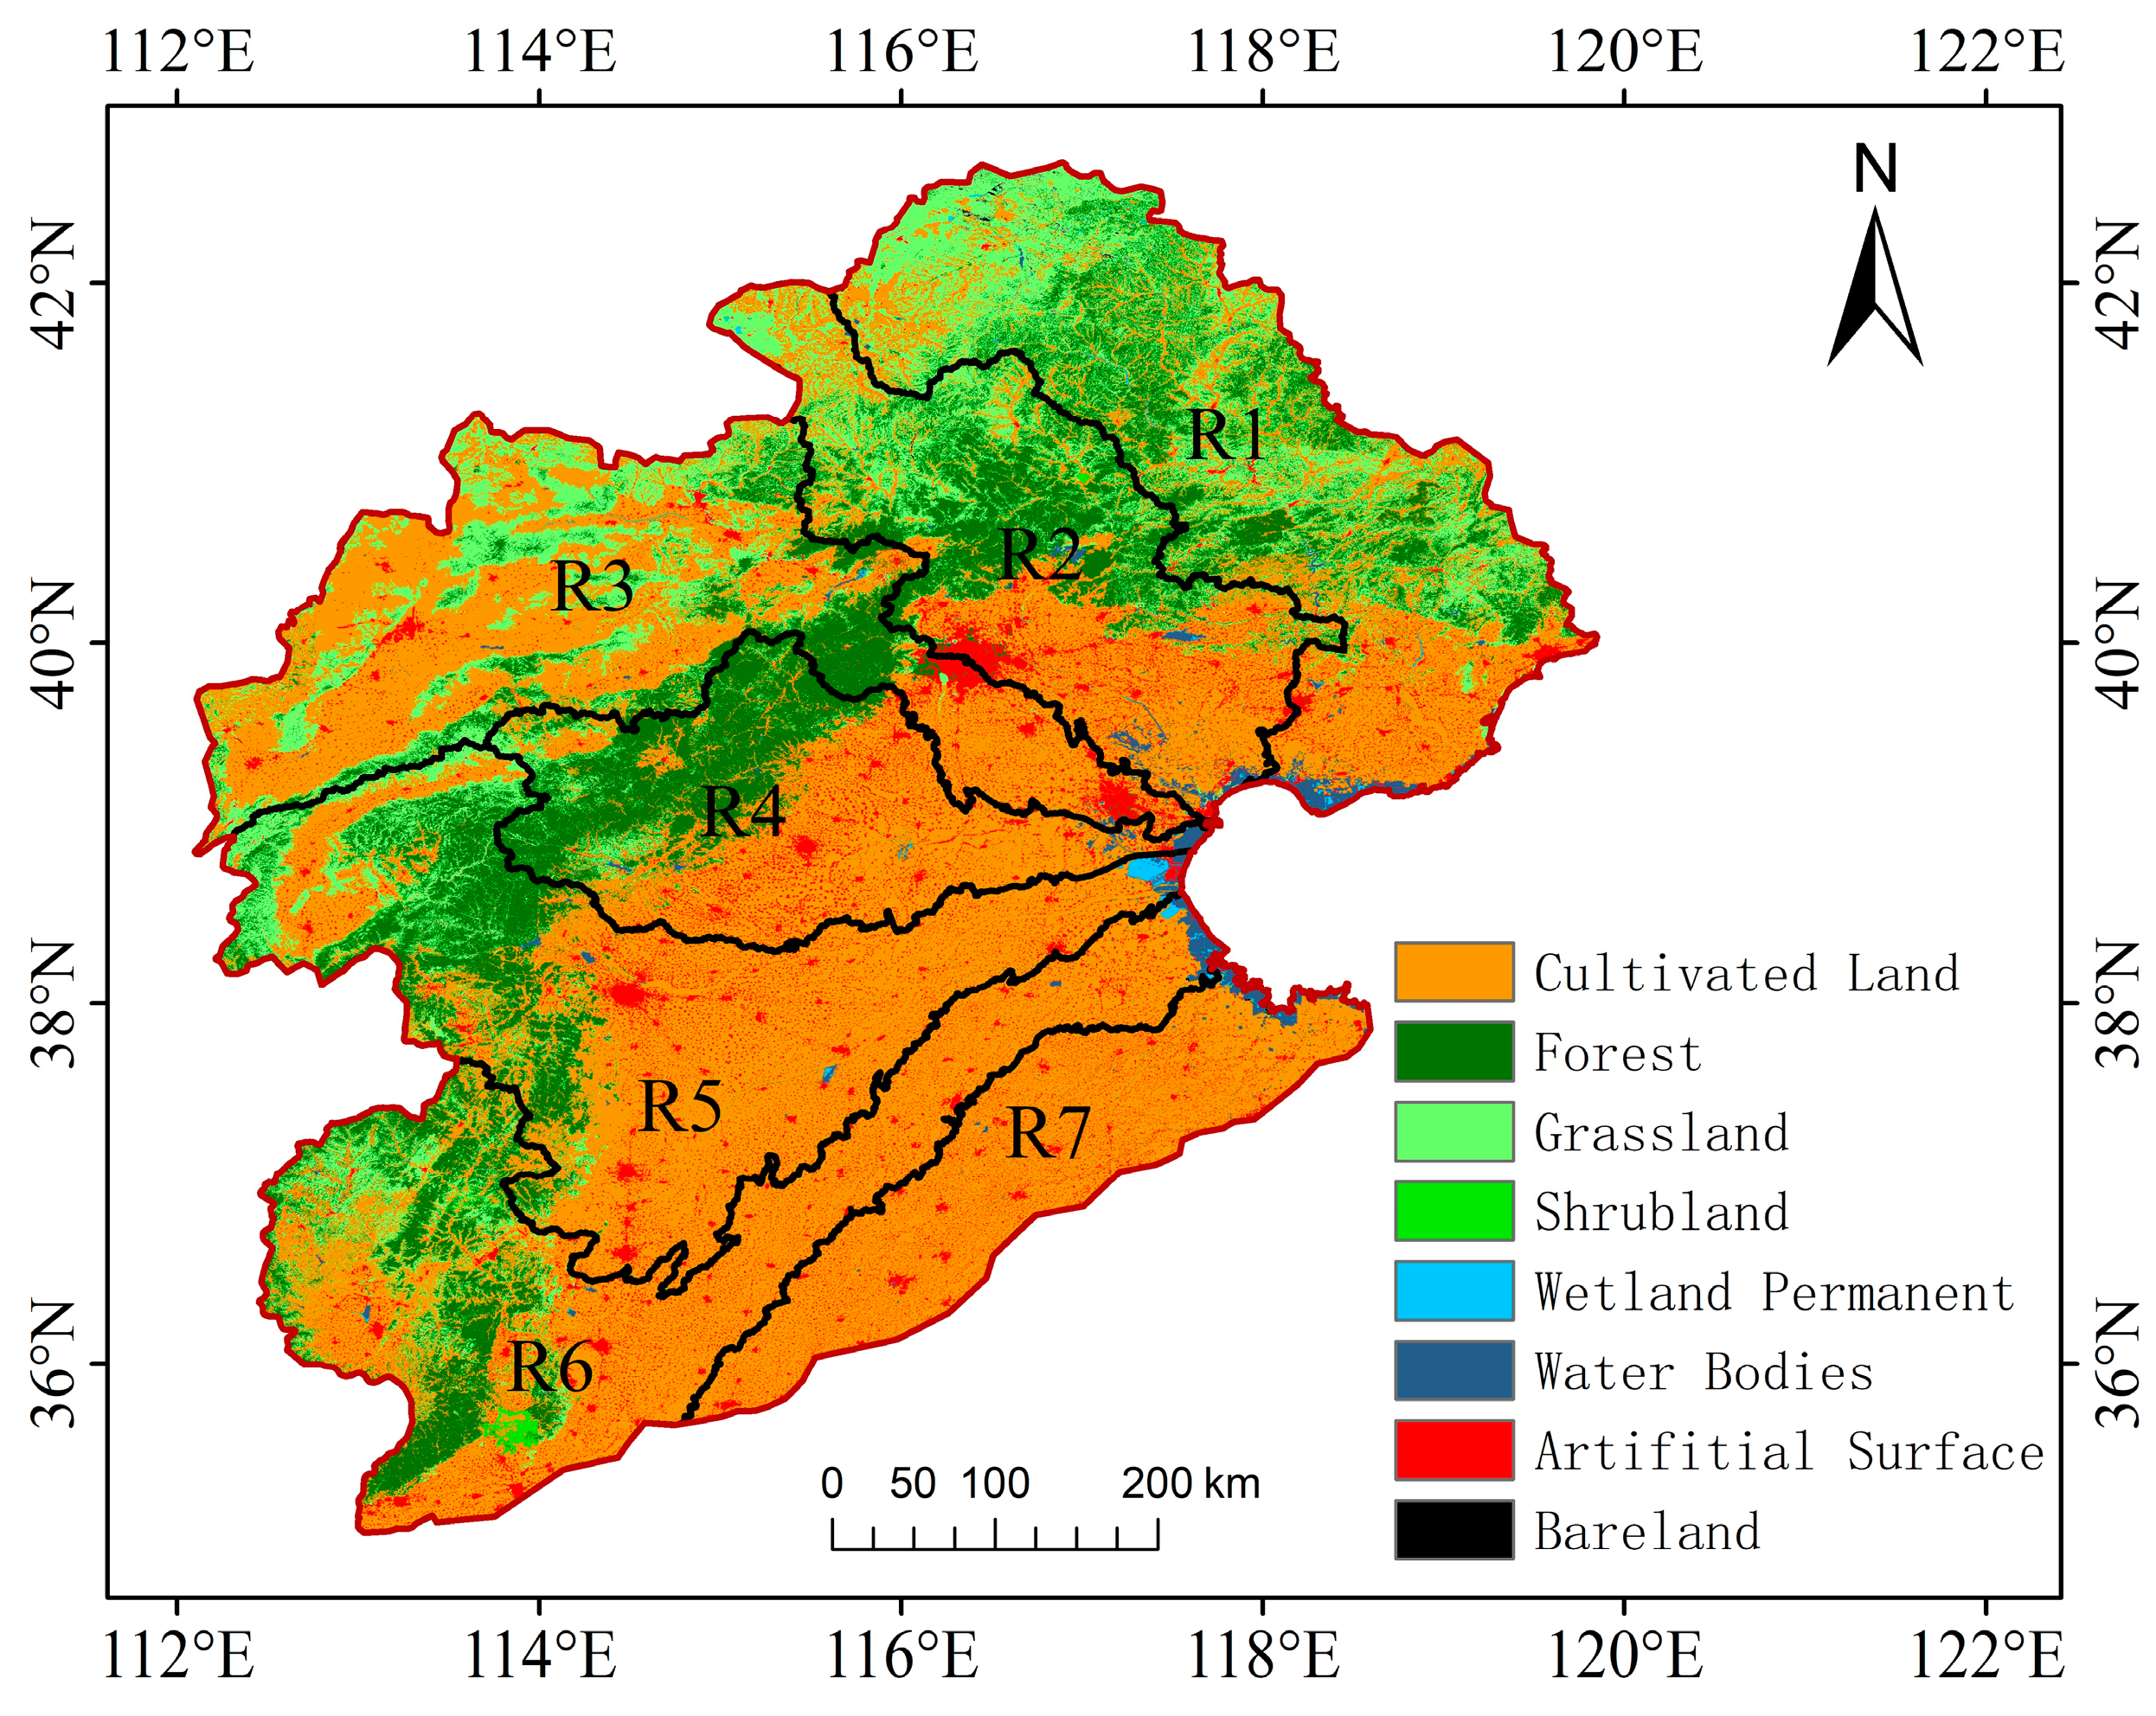
2.1. Study Area

The Haihe River Basin is one of China’s main river basins. It is located in a semi-humid and semi-arid zone in the northern part of China (35–43°N, 112–120°E) (Figure 1). The Beijing–Tianjin–Hebei Economic Circle, which is one of China’s three major economic circles, is located in this basin. Geographically, the Haihe River Basin is bordered by Bohai Bay to the east, the Taihang Mountain to the west, the Yellow River to the south, and the Mongolian Plateau to the north. The total area of the basin is about 320,600 km2. The Haihe River Basin has a temperate monsoon climate, with an annual average temperature of 8–12 °C and an annual average precipitation of 539 mm [42].
Using digital elevation model data (DEM) as the input data, the geospatial hydrologic modeling extension (HEC-GeoHMS) hydrological model was adopted to extract the sub-basins [43]. The Haihe River Basin was divided into 2605 small basins, and then, according to the data obtained from the Hydrological Yearbook of the People’s Republic of China, the small basins were merged into seven sub-basins: the Luan River Basin (R1), Chaobai River and Jiyun River Basin (R2), Inland River Basin (R3), Daqing River Basin (R4), Ziya River Basin (R5), South Canal Basin (R6), and Tuhai River and Majia River Basin (R7).
The land cover in the study area can be classified into eight classes, including Cultivated Land, Forest, Grassland, Artificial Surfaces, Water Bodies, Wetland, Shrubland, and Bare Land (Figure 2), and the area percentage of the above land-cover types accounted for 53.6%, 18.67%, 18.16%, 7.68%, 1.37%, 0.25%, 0.21%, and 0.06%, respectively.

2.2. Datasets

The data used in this study included ET product data, eddy correlation (EC) observation data from flux towers, DEM data, terrestrial water storage data, runoff data, and precipitation data.

2.2.1. The Evaluated ET Products

Seven ET product datasets were comprehensively evaluated in this study: the surface energy balance based global land evapotranspiration (EB-ET in this paper) [2,44], GLEAM (GLEAM_ET in this paper) [4,45], MOD16 (MOD16_ET in this paper) [5], Penman–Monteith–Leuning Evapotranspiration version 2 (PML_V2) global evapotranspiration and gross primary production (PML_ET in this paper) [6], land evapotranspiration of Global Land Surface Satellite products (GLASS_ET in this paper) [46], a continuous satellite-derived global record of land surface evapotranspiration product created by Zhang Ke (ZK_ET in the paper) [47], and land evapotranspiration of the JRA_55 (JRA_ET in this paper) [9]. The ET products included a single-source model ET product (EB_ET), ET products based on the Penman–Monteith formula (MOD16_ET, PML_ET, and ZK_ET), an ET product based on the Priestley–Taylor (PT) formula (GLEAM_ET, ZK_ET), an integrated model product (GLASS_ET), and a re-analysis product (JRA_ET). A summary of these ET products used in the study are presented in Table 1.

2.2.2. Other Datasets

The EC observation data from the flux towers (green dots in Figure 1) used for the ET product validation at the pixel-scale were obtained from the Observations Network of the Qinghai–Tibet Plateau Science Data Center (https://data.tpdc.ac.cn/zh-hans/, accessed on 17 January 2020) and the China Flux Observations Data Alliance Network (http://www.chinaflux.org/, accessed on 17 January 2020). The flux data included 30-min scale and daily-scale data. Table 2 presents the information about the five flux towers. The main land-cover type at the sites of the five flux towers was agricultural land. The latent heat flux of the EC data from the five flux towers were used for the direct validation of the ET products.
The SRTM DEM data from the United States Geological Survey (https://lpdaac.usgs.gov/, accessed on 22 February 2018) was used to divide the study area into mountainous and non-mountainous areas based on an elevation threshold of 200 m. The spatial resolution of the DEM data was 90 m × 90 m. The terrestrial water storage data, runoff data, and precipitation data were used in the ET product validation using the water balance method. The monthly-scale data from 2003 to 2012 were used in this study.
The Gravity Recovery and Climate Experiment (GRACE) was adopted to represent the terrestrial water storage change (TWSC) [48]. The values in each pixel represent the equivalent water height, which is an anomaly based on the mean value from January 2004 to December 2009. The RL06M version of the monthly-scale data was used (http://www2.csr.utexas.edu/grace/, accessed on 9 May 2021). The spatial resolution of the data was 0.5° × 0.5°.
The runoff data (https://geonetwork.nci.org.au, accessed on 27 May 2021) used in this study were a global gridded runoff product (Linear Optimal Runoff Aggregate, LORA) [49], with a spatial resolution of 0.5° × 0.5° at monthly timescales for the period of 1980–2012, and includes time-variant uncertainty. This product merges runoff estimates from hydrological models constrained with observational streamflow records. The product broadly agrees with published runoff estimates at many river basins and represents the seasonal runoff cycle for most of the globe. The LORA data were validated using the monthly observed discharge of five hydrological stations in the Haihe River basin in 2003 [50]. We needed to convert the observed discharge data into runoff depth data, which were consistent with the LORA data, according to the upstream drainage area of the hydrological station. The locations of the five hydrological stations were showed in Figure 1, including Shixiali station (SXL, with drainage area of 2.39 × 10⁴ km2) in Sanggan River, Xiangshuibao station (XSB, with drainage area of 1.45 × 10⁴ km2) in Yang River, Yanchi station (YC, with drainage area of 4.37 × 10⁴ km2) in Yongding River, Zhangjiafen station (ZJF, with drainage area of 0.85 × 10⁴ km2) in Bai River, and Xiahui station (XH, with drainage area of 0.53 × 10⁴ km2) in Chao River. The precipitation and temperature data used in this study were obtained from the Monthly Data of Surface Precipitation and Temperature in China dataset (http://data.cma.cn/, accessed on 16 January 2018), which was developed by the basic ground meteorological data construction project. The data have been updated since 1961, and this meteorological dataset is commonly used in many studies. Spatial kriging interpolation was performed on the data with missing pixels to ensure the integrity of the data. The spatial resolution was 1 km × 1 km.
The surface net radiation data used for the analysis of ET influencing factors is the GLASS-NR product (http://www.glass.umd.edu/NR/, accessed on 27 March 2021), with a spatial resolution of 0.05° × 0.05° and a temporal resolution of 1 day.
The land-cover type data used in this study was GlobeLand30 (http://www.globallandcover.com/, accessed on 8 August 2021) from 2010, which is the first global geo-information public product provided by China to the United Nations, with the spatial resolution of 0.5° × 0.5°.

2.3. Methods

Direct evaluation methods, including EC observation and the water balance method, were used to evaluate the applicability of the ET products in the Haihe River Basin. The applicability evaluation index adopts the BIAS, RMSD, Pearson correlation coefficient (R), and Taylor plots. Then, the TCH uncertainty quantification method, as an indirect evaluation method, was used to assess the performances of the ET products. In order to explore the influencing factor of ET, the spatial distribution of ET under different land-cover types and the cosine similarity between the temporal variation of ET products and meteorological data were adopted.

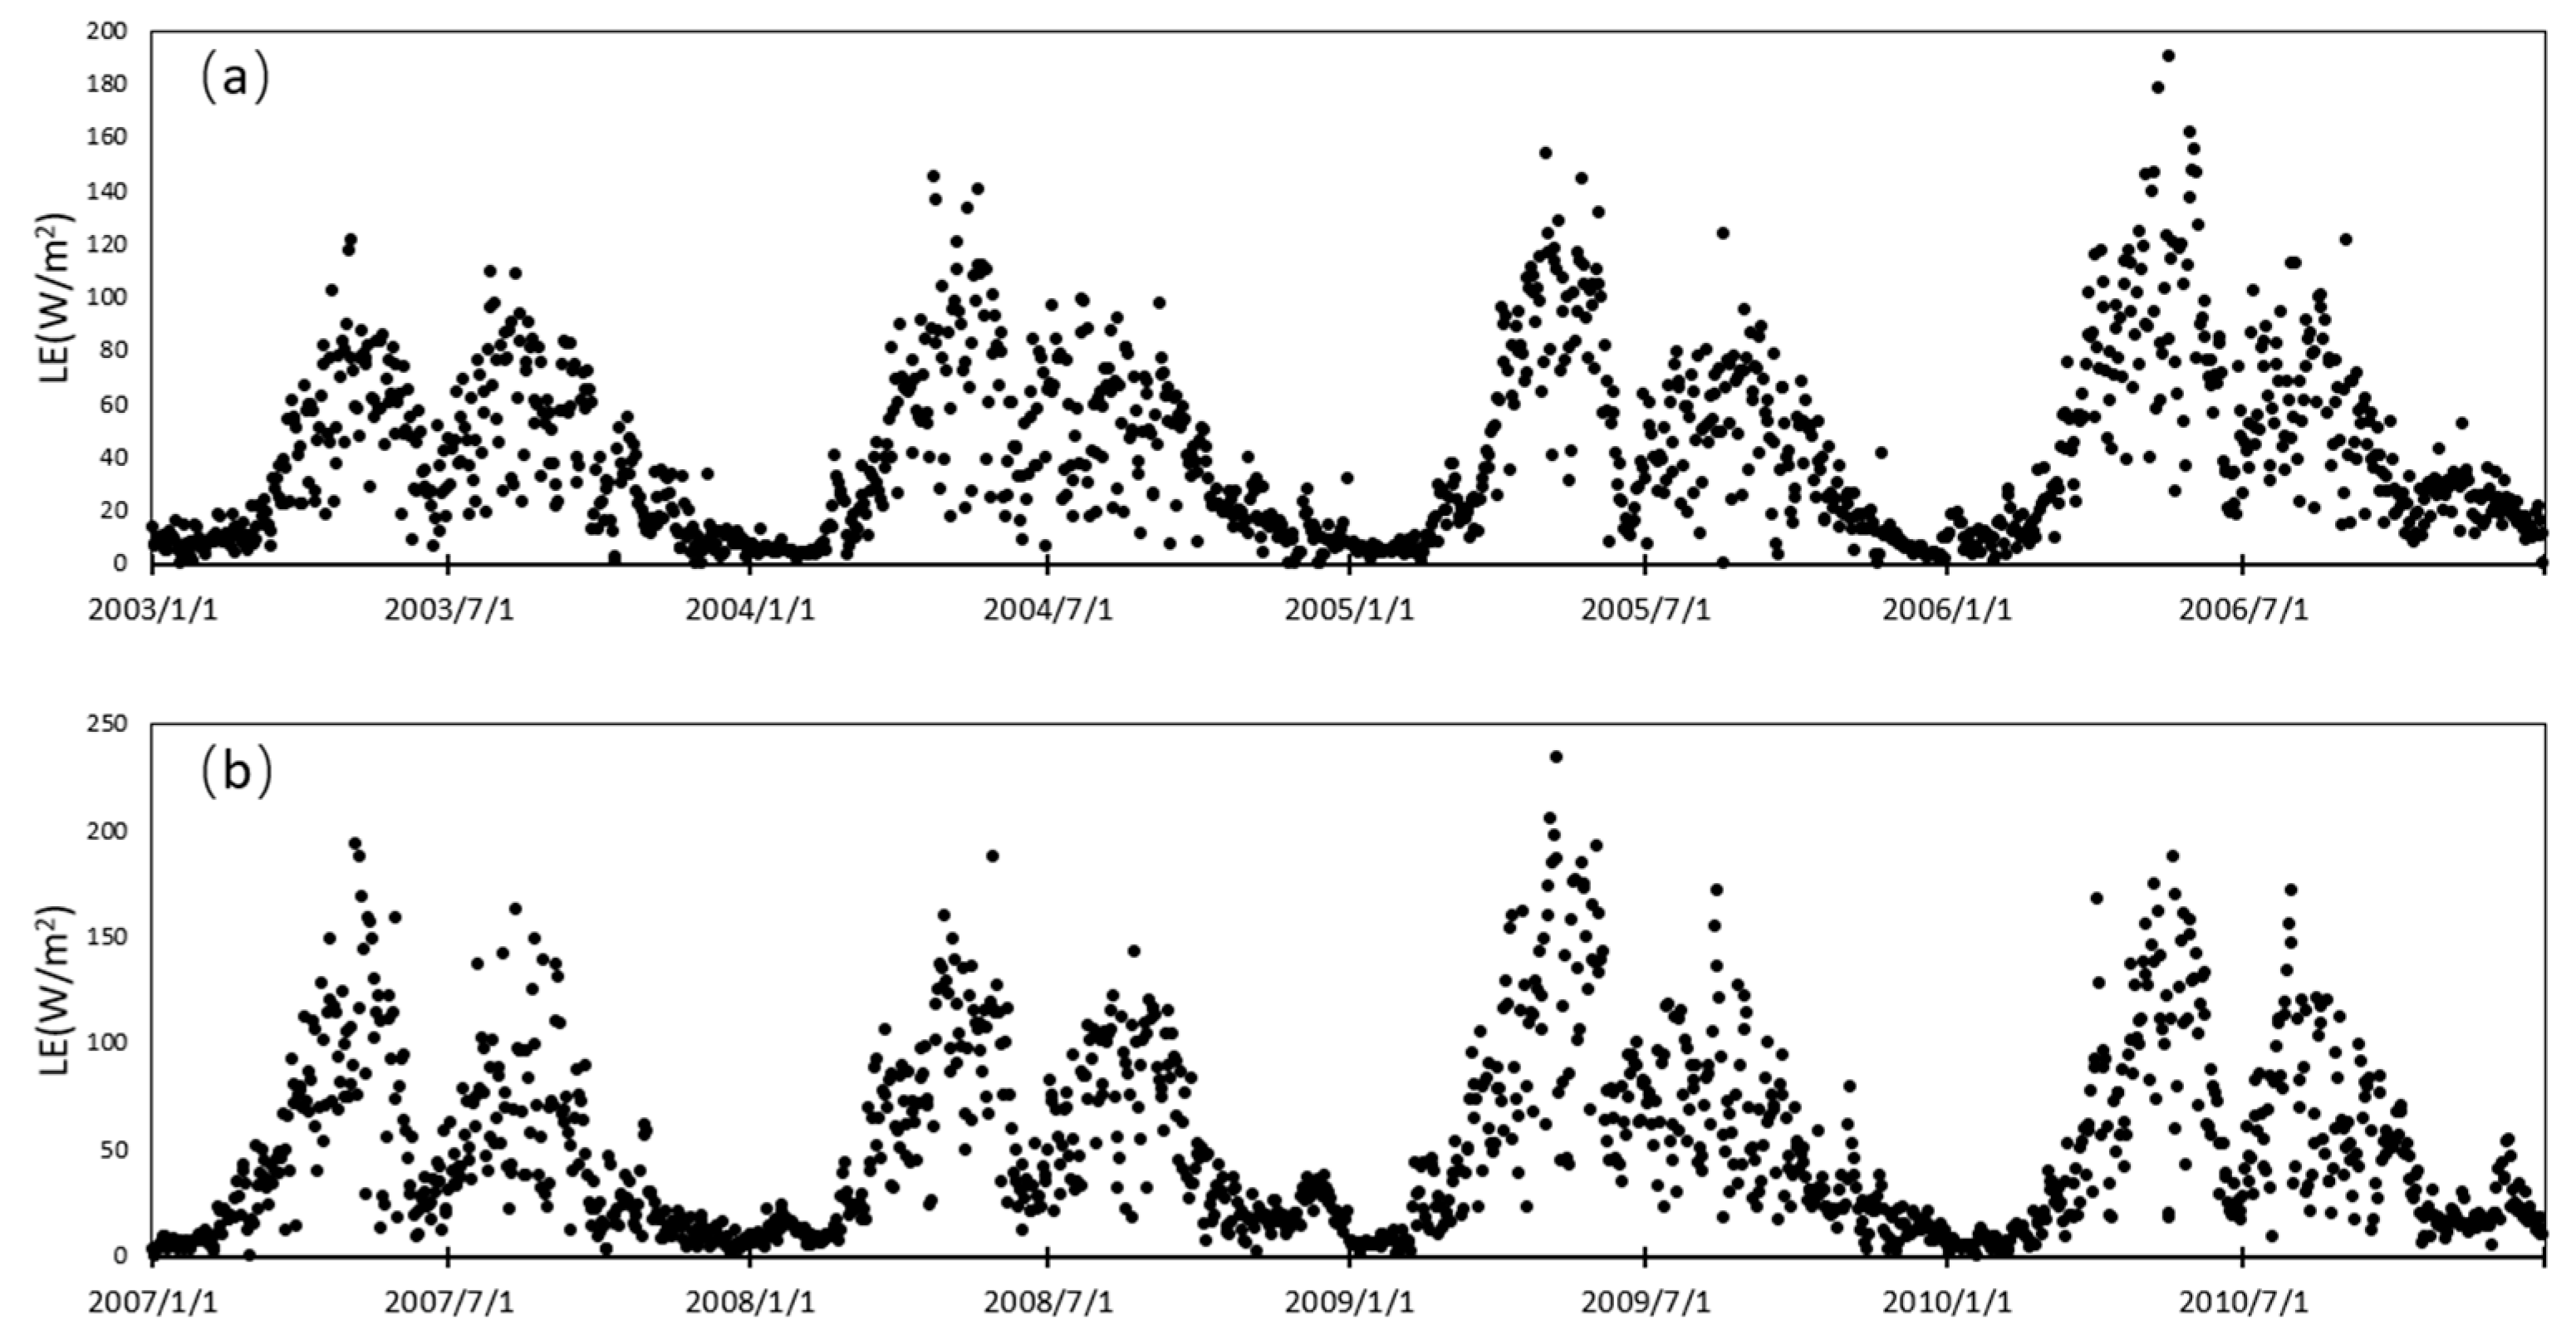
2.3.1. ET Product Validation Using Flux Tower EC Observations

Taking the multi-year observation data from five flux stations in the Haihe River Basin from 2003 to 2010 as the true values, the 30-min scale flux tower EC observation data with no more than 30% of the data missing were selected for the screening and daily-scale synthesis [51]. The ZK_ET product does not include daily-scale data, so it was not evaluated in this section. The MOD16_ET product provides the total evapotranspiration over a period of 8 days (5 or 6 days at the end of the year) in units of 0.1 mm/8 days, 0.1 mm/6 days, or 0.1 mm/5 days. In order to ensure the comparability of the data, the units were uniformly converted into the standard latent heat flux units, W/m2. Through comparison of the pixel values of the EC products and the values of the EC observations, the six types of ET products (EB-ET, GLEAM_ET, JRA_ET, MOD16_ET, PML_ET, and GLASS-ET,) were verified. The applicability evaluation index adopts the BIAS, RMSD, Pearson correlation coefficient (R), and normalized central root mean square deviation (RMSD’) for the Taylor plots. Taylor plots are used to present an accuracy assessment, using metrics such as the Pearson correlation coefficient (R), standard deviation (STD), and RMSD’. The above evaluation indexes are calculated as follows:
B I A S = 1 N i = 1 N X i Y i ,
R M S D = 1 N i = 1 N X i Y i 2 1 2 ,
R = i = 1 N X i X a v e Y i Y a v e i = 1 N X i X a v e 2   i = 1 N Y i Y a v e 2 ,
R M S D = R M S D 2 B I A S 2 ,
S T D = 1 N i = 1 N X i X a v e 2 1 2 ,
where N is the number of sample groups, X i and Y i are the evapotranspiration value to be verified and the true value of the relative evapotranspiration in group i , respectively, and X a v e   and Y a v e are the mean values of X i and Y i in the N groups of data, respectively.

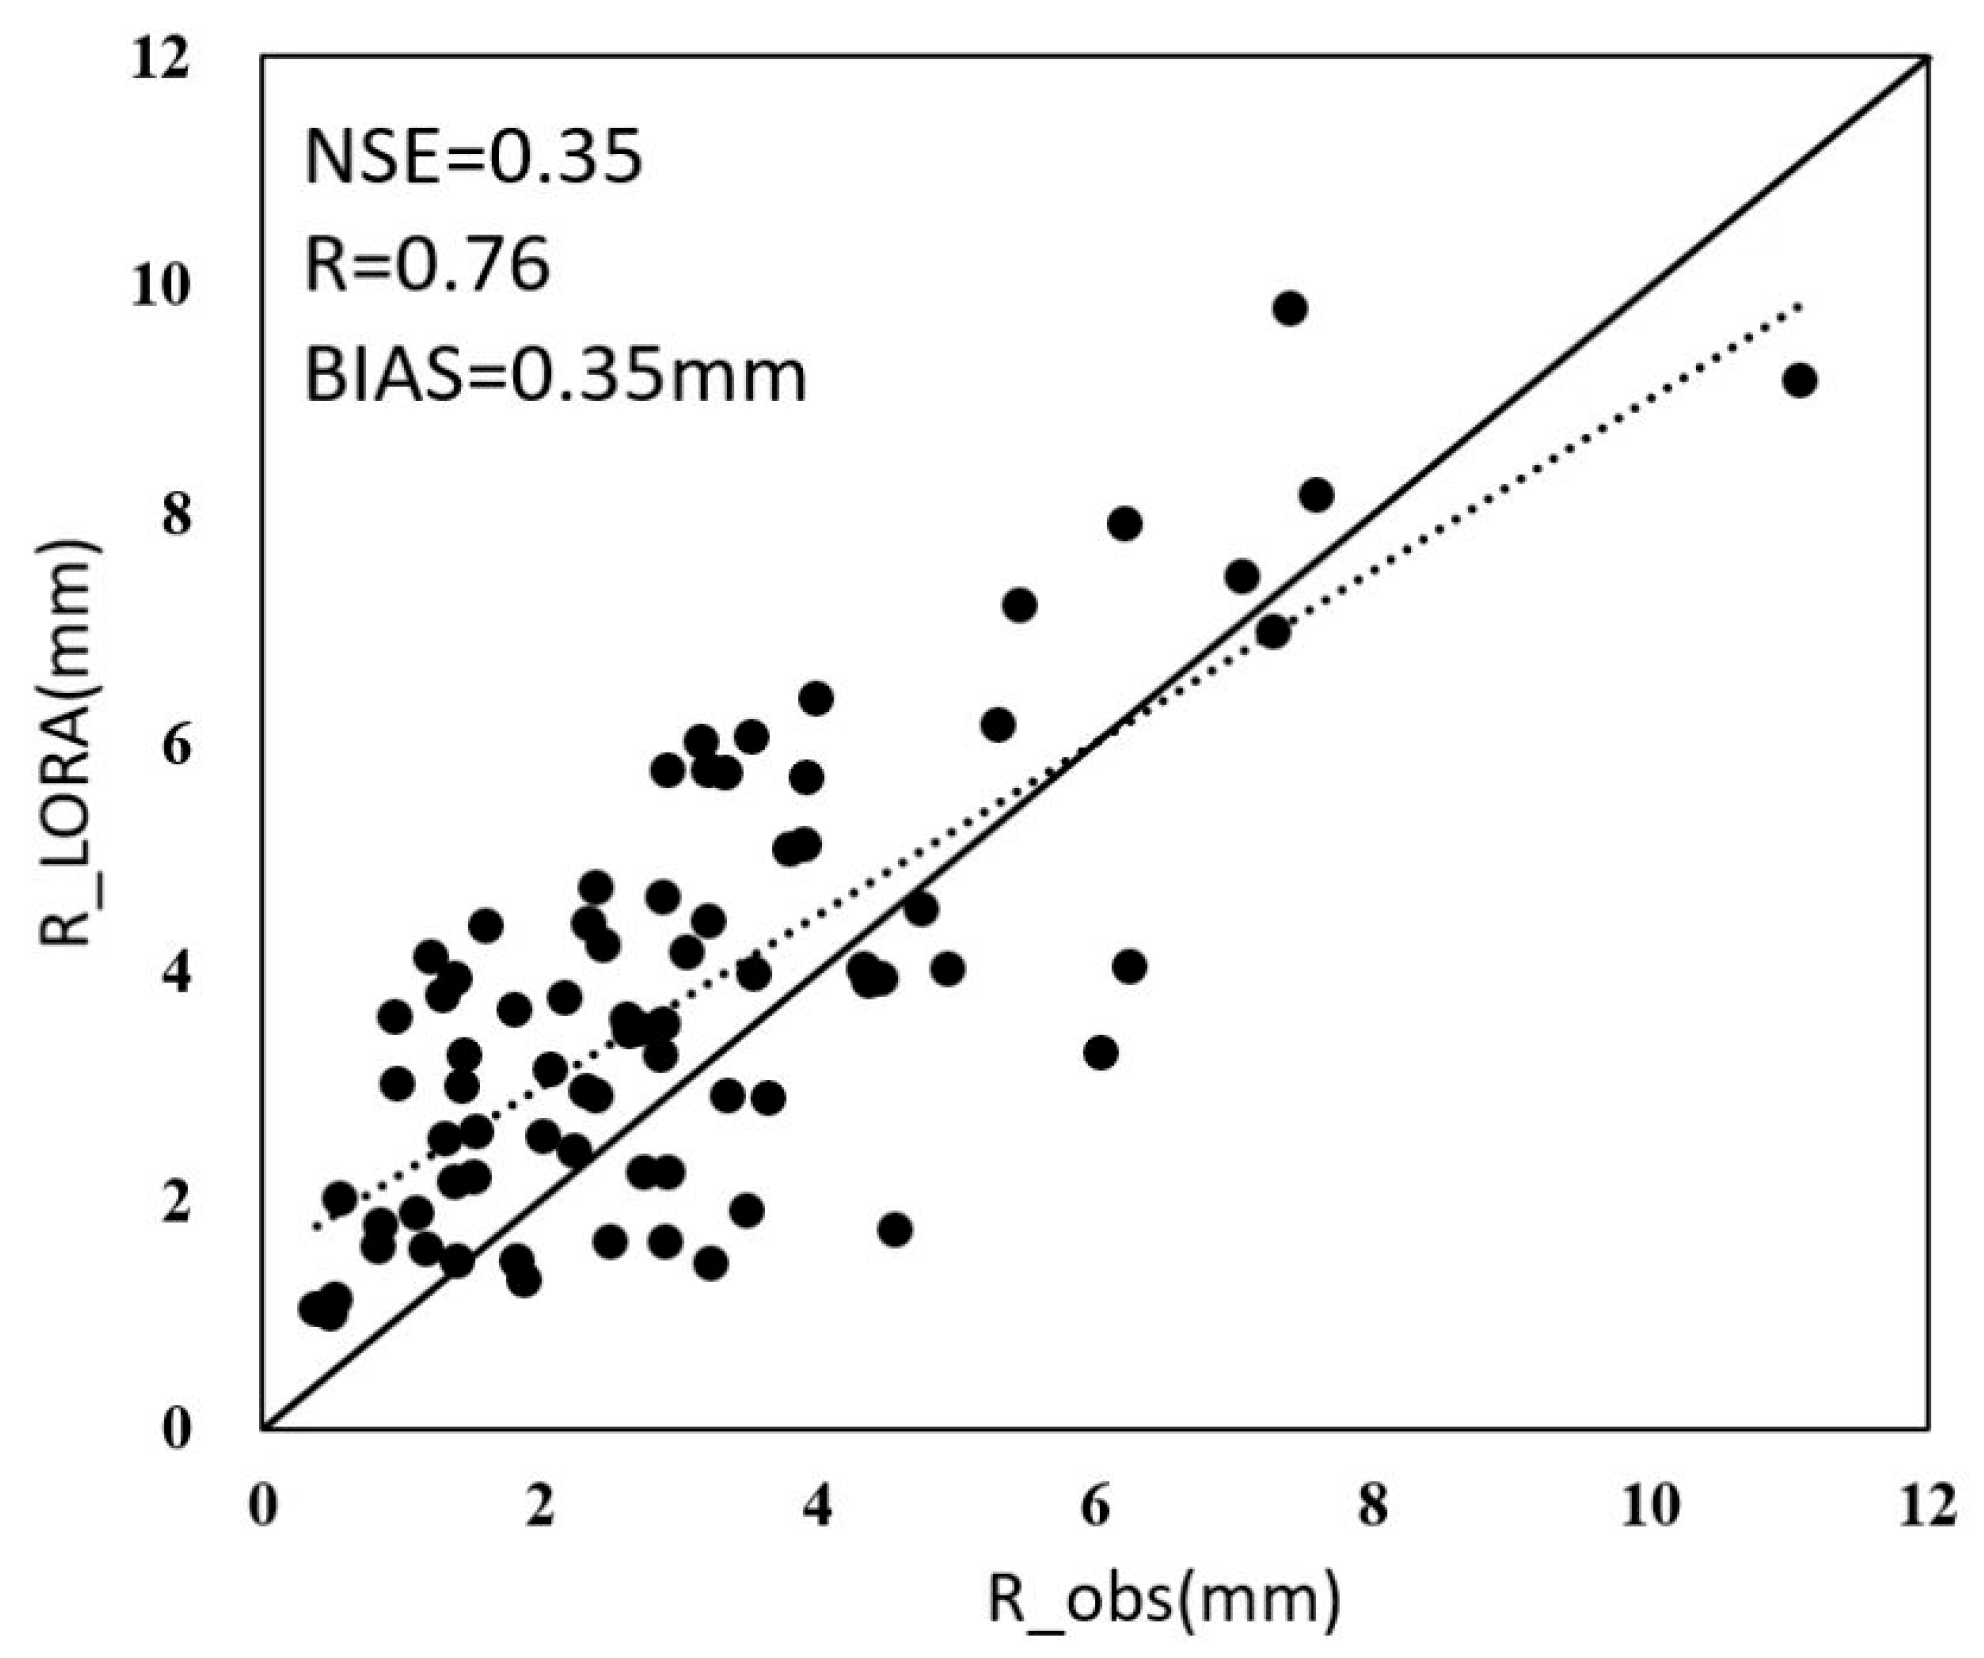
2.3.2. ET Product Validation Using Water Balance Method

The water balance principle is a method of calculating the actual evapotranspiration in a closed watershed [52]. The calculation formula is:
W B _ E T i = P i   R i     T W S C i ,
where P i is the average precipitation in the basin (mm/month), R i is the average runoff depth in the basin (mm/month), and T W S C i is the monthly water storage change of the underlying surface of the basin (mm/month). The T W S C i data were calculated from the GRACE data using the following equation:
T W S C i T W S A i + 1 T W S A i 1 2 i ,
where T W S A i is the anomalous value of the water storage in a certain month, i denotes the month, and the i is the monthly unit. This formula is helpful in reducing the noise.
Since the GLASS_ET is composed of single-day evapotranspiration data on an 8-day scale, there are large errors in the monthly-scale synthesis. In this study, the other six ET products were compared and analyzed on the monthly scale using the water balance method.
The period of the data used was 2003–2012. Among them, the monthly scale standard products of the GLEAM_ET, JRA_ET, MOD16_ET, and ZK_ET were directly used. The daily-scale data of the EB_ET and PML_ET were synthesized into monthly-scale data. In this study, the water balance method was used to analyze the product accuracies of these six ET products on the annual scale and in different seasons.

2.3.3. ET Product Comparison Using TCH Uncertainty Quantification Method

The three-cornered hat method (TCH) is a method for evaluating multiple sets of data sequences, which was developed in the last century. Its methodology was proposed and further developed by Premoli and Tavella [26,27]. Assuming that there are N groups of different observation sequences { x i } (i = 1,…, N ), each group of x i is the result of adding the true value and the measurement error, that is, x i   = x t r u e   + e i . The traditional three-cornered hat method is limited to the case of N = 3 [25], while the generalized three-cornered hat method can be used for the case of N > 3.
First, any observation sequence is selected as the reference values, and then the difference sequence y i between the remaining observation sequences and the reference values is obtained:
y i = x i x r = e i e r   i = 1 , , N 1 .
An interpolation sequence matrix Y and difference sequence co-variance matrix S are constructed:
Y = y 1 y 2 y N 1 .
S = c o v   Y .
An N × N noise co-variance symmetric matrix R and auxiliary matrix J are introduced:
J N 1 , N = 1 0 1 0 1 1 0 0 1 .
R = r 11 r 12 r 1 N r 12 r 22 r 2 N r 1 N r 2 N r N N .
S = J · R · J T .
By combining these matrices, a set of equations r i j = s i j r N N + r i N + r j N   ( i , j < N ) can be obtained. At this time, the number of equations is less than the number of unknowns, so the equations cannot be solved [26]. In order to ensure the positive definiteness of the co-variance matrix, constraint condition H is used as the constraint condition [26]:
H 2 ( r 1 N , , r N N ) = H 1 ( r 1 N , , r N N ) K < 0 ,
K = S N 1 ,
H 1 ( r 1 N , , r N N ) = R S = r n n r 1 n r n n , r n 1 n r n n S 1 r 1 n r n n , r n 1 n r n n T .
Introducing the squared and mean squared values of the off-diagonal elements of the noise matrix 1 n i < j n 1 r i j 2 ensures that the global correlation of all of the datasets satisfies R > 0 under the smallest premise. Thus, the following equation can be obtained:
F ( r 1 N , , r N N ) = 1 K 2 · i < j N r i j 2 .
In order to ensure that the initial value is within the constraint conditions, the initial value of the above equation iteration is as follows:
r n 0 = 0       f o r   i < N ,
r n n 0 = 1 2 s * , s   * = 1 , , 1   S 1 1 , , 1 T ,
Equation (17) is minimized under the constraints in order to obtain the optimal solution. The mean squared value of the diagonal elements corresponding to the symmetric matrix R is the uncertainty of the corresponding input dataset.
In this paper, the TCH method is used to calculate the relative uncertainties of the monthly-scale ET products, and the period is 2003–2012. The relative uncertainties of six products, including EB_ET, GLEAM_ET, JRA_ET, MOD16_ET, PML_ET, and ZK_ET, are calculated.

2.3.4. Cosine Similarity

Cosine similarity [53] is a measure of similarity between two datasets. The cosine of two sets can be derived by the Euclidean dot product formula:
c o s A , B = i = 1 n A i × B i i = 1 n A i 2 × i = 1 n B i 2
where n is the number of observations, Σ is the summation symbol, Ai is the A value for observation i, and Bi is the B value for observation i. In this paper, cosine similarity is used to study the similarity between the temporal variation of evapotranspiration products and meteorological data.

3. Results and Analysis

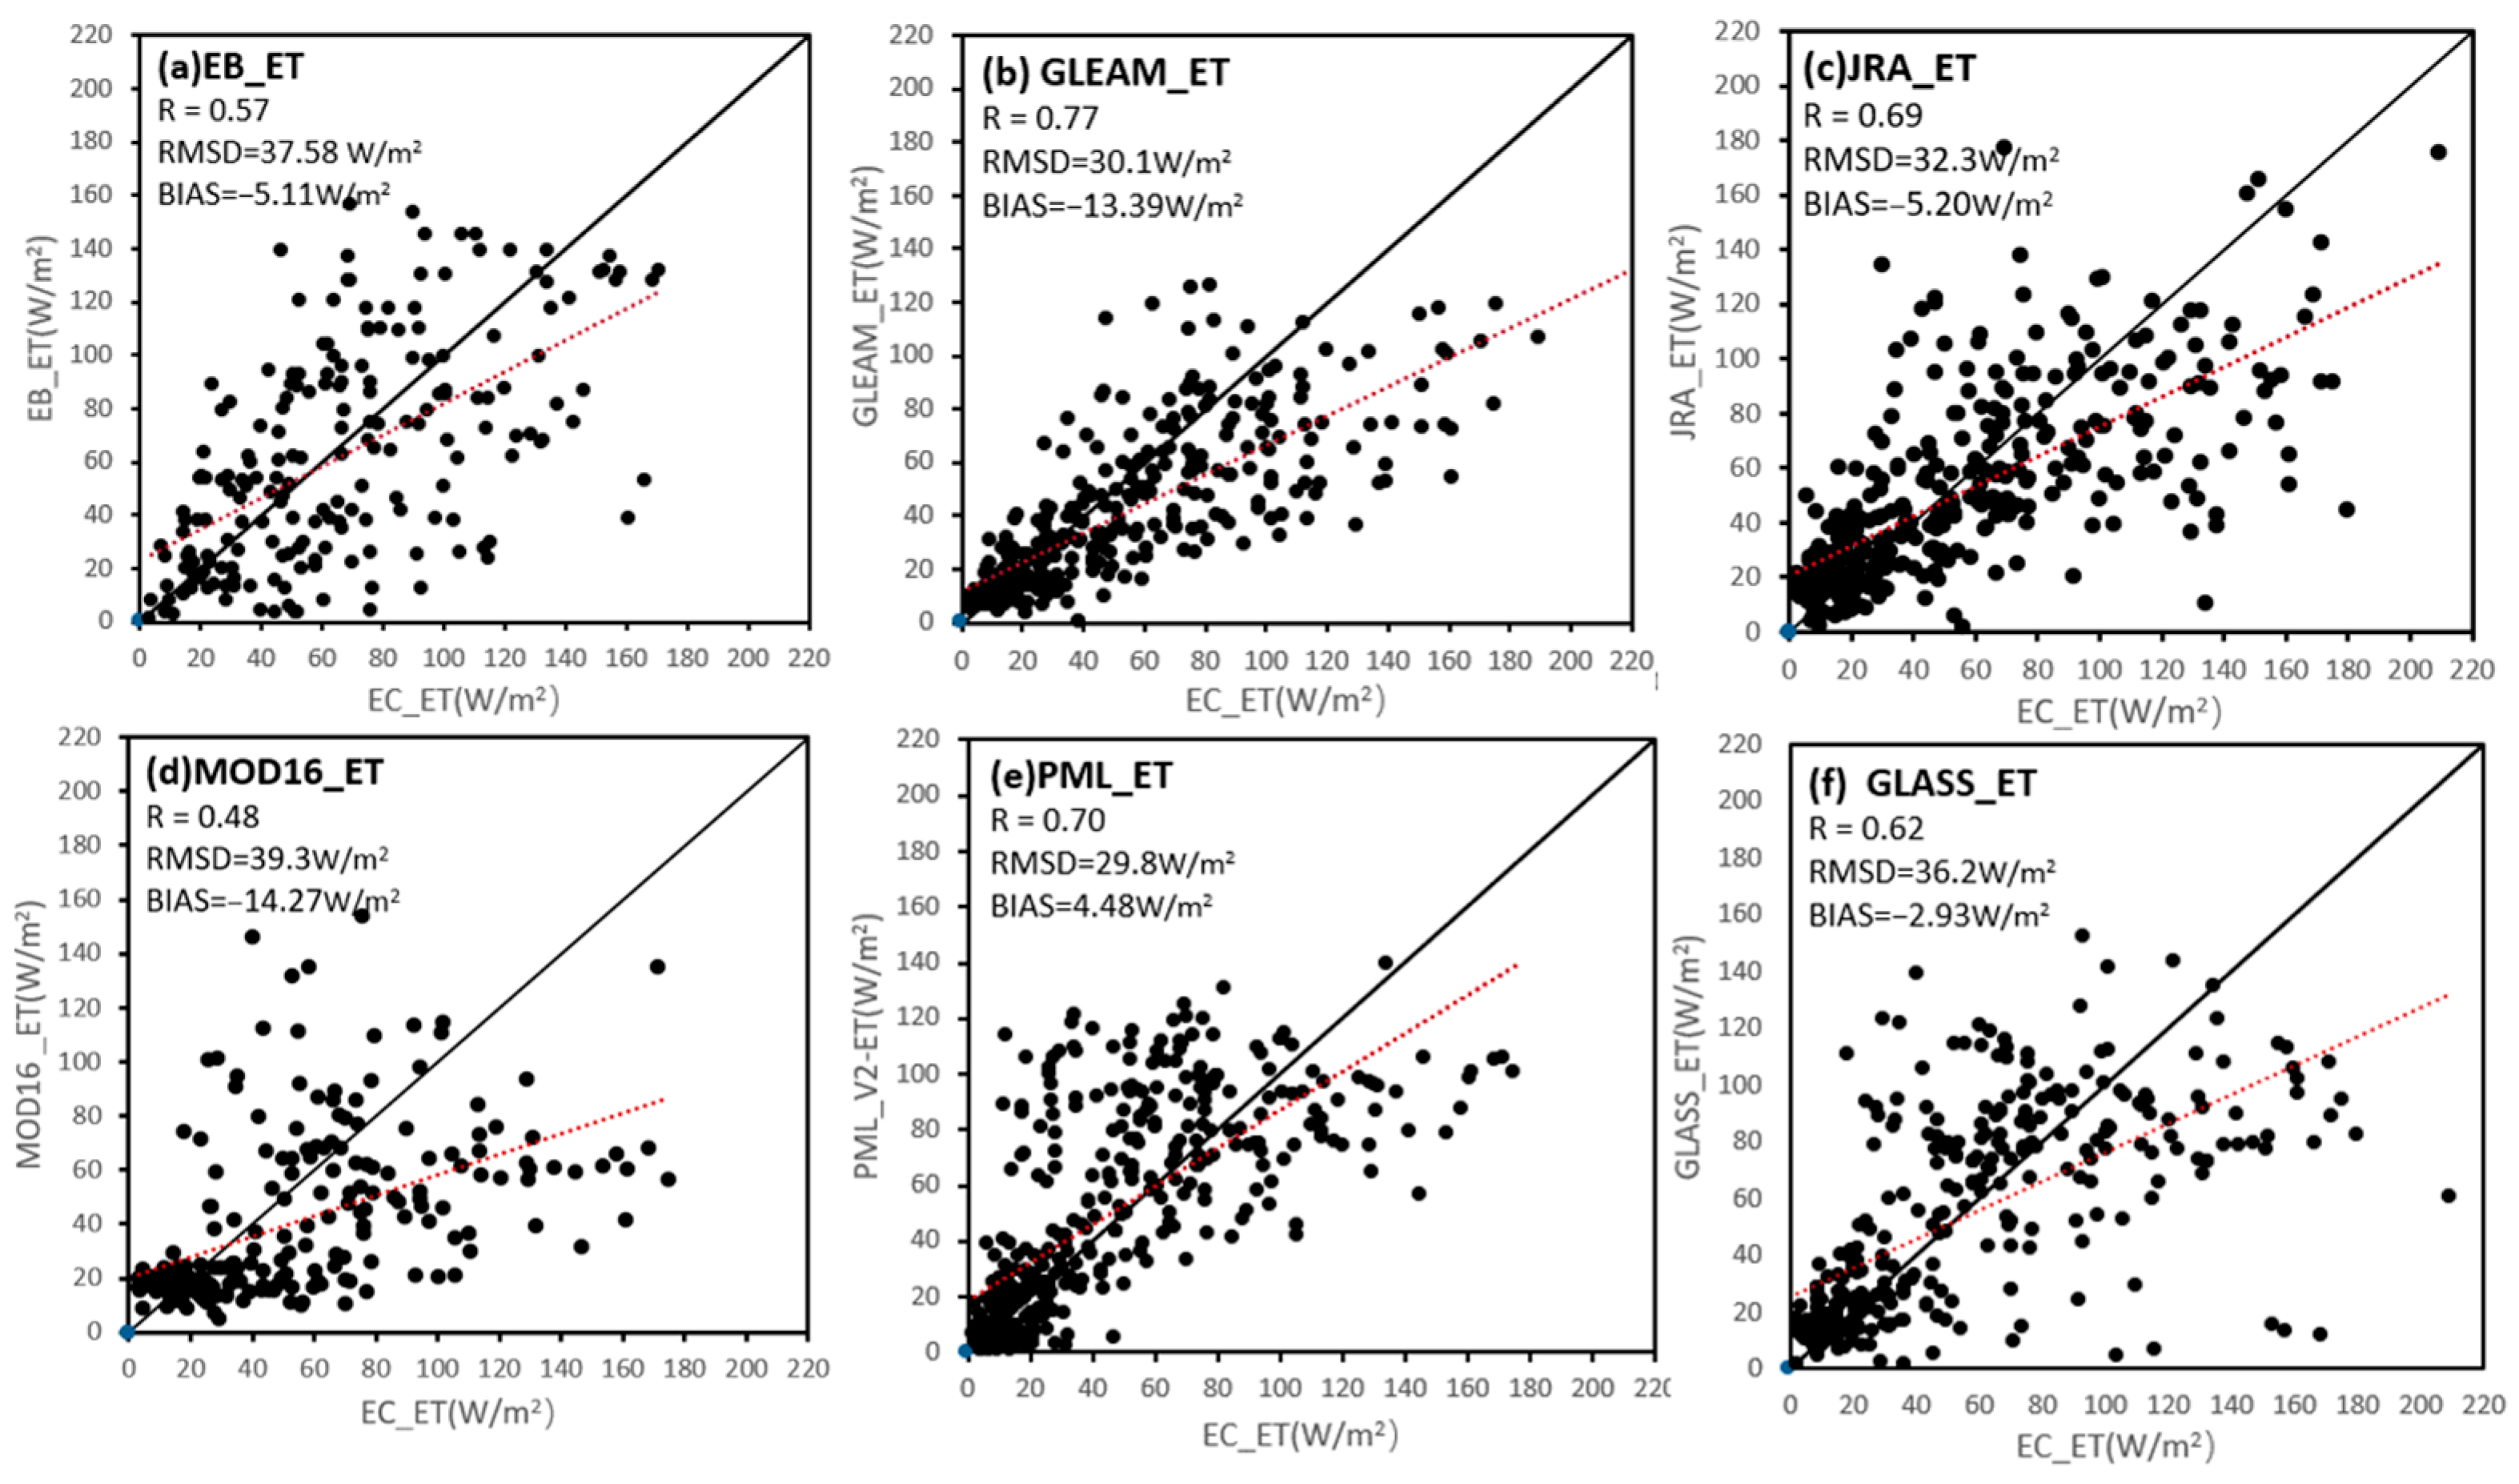
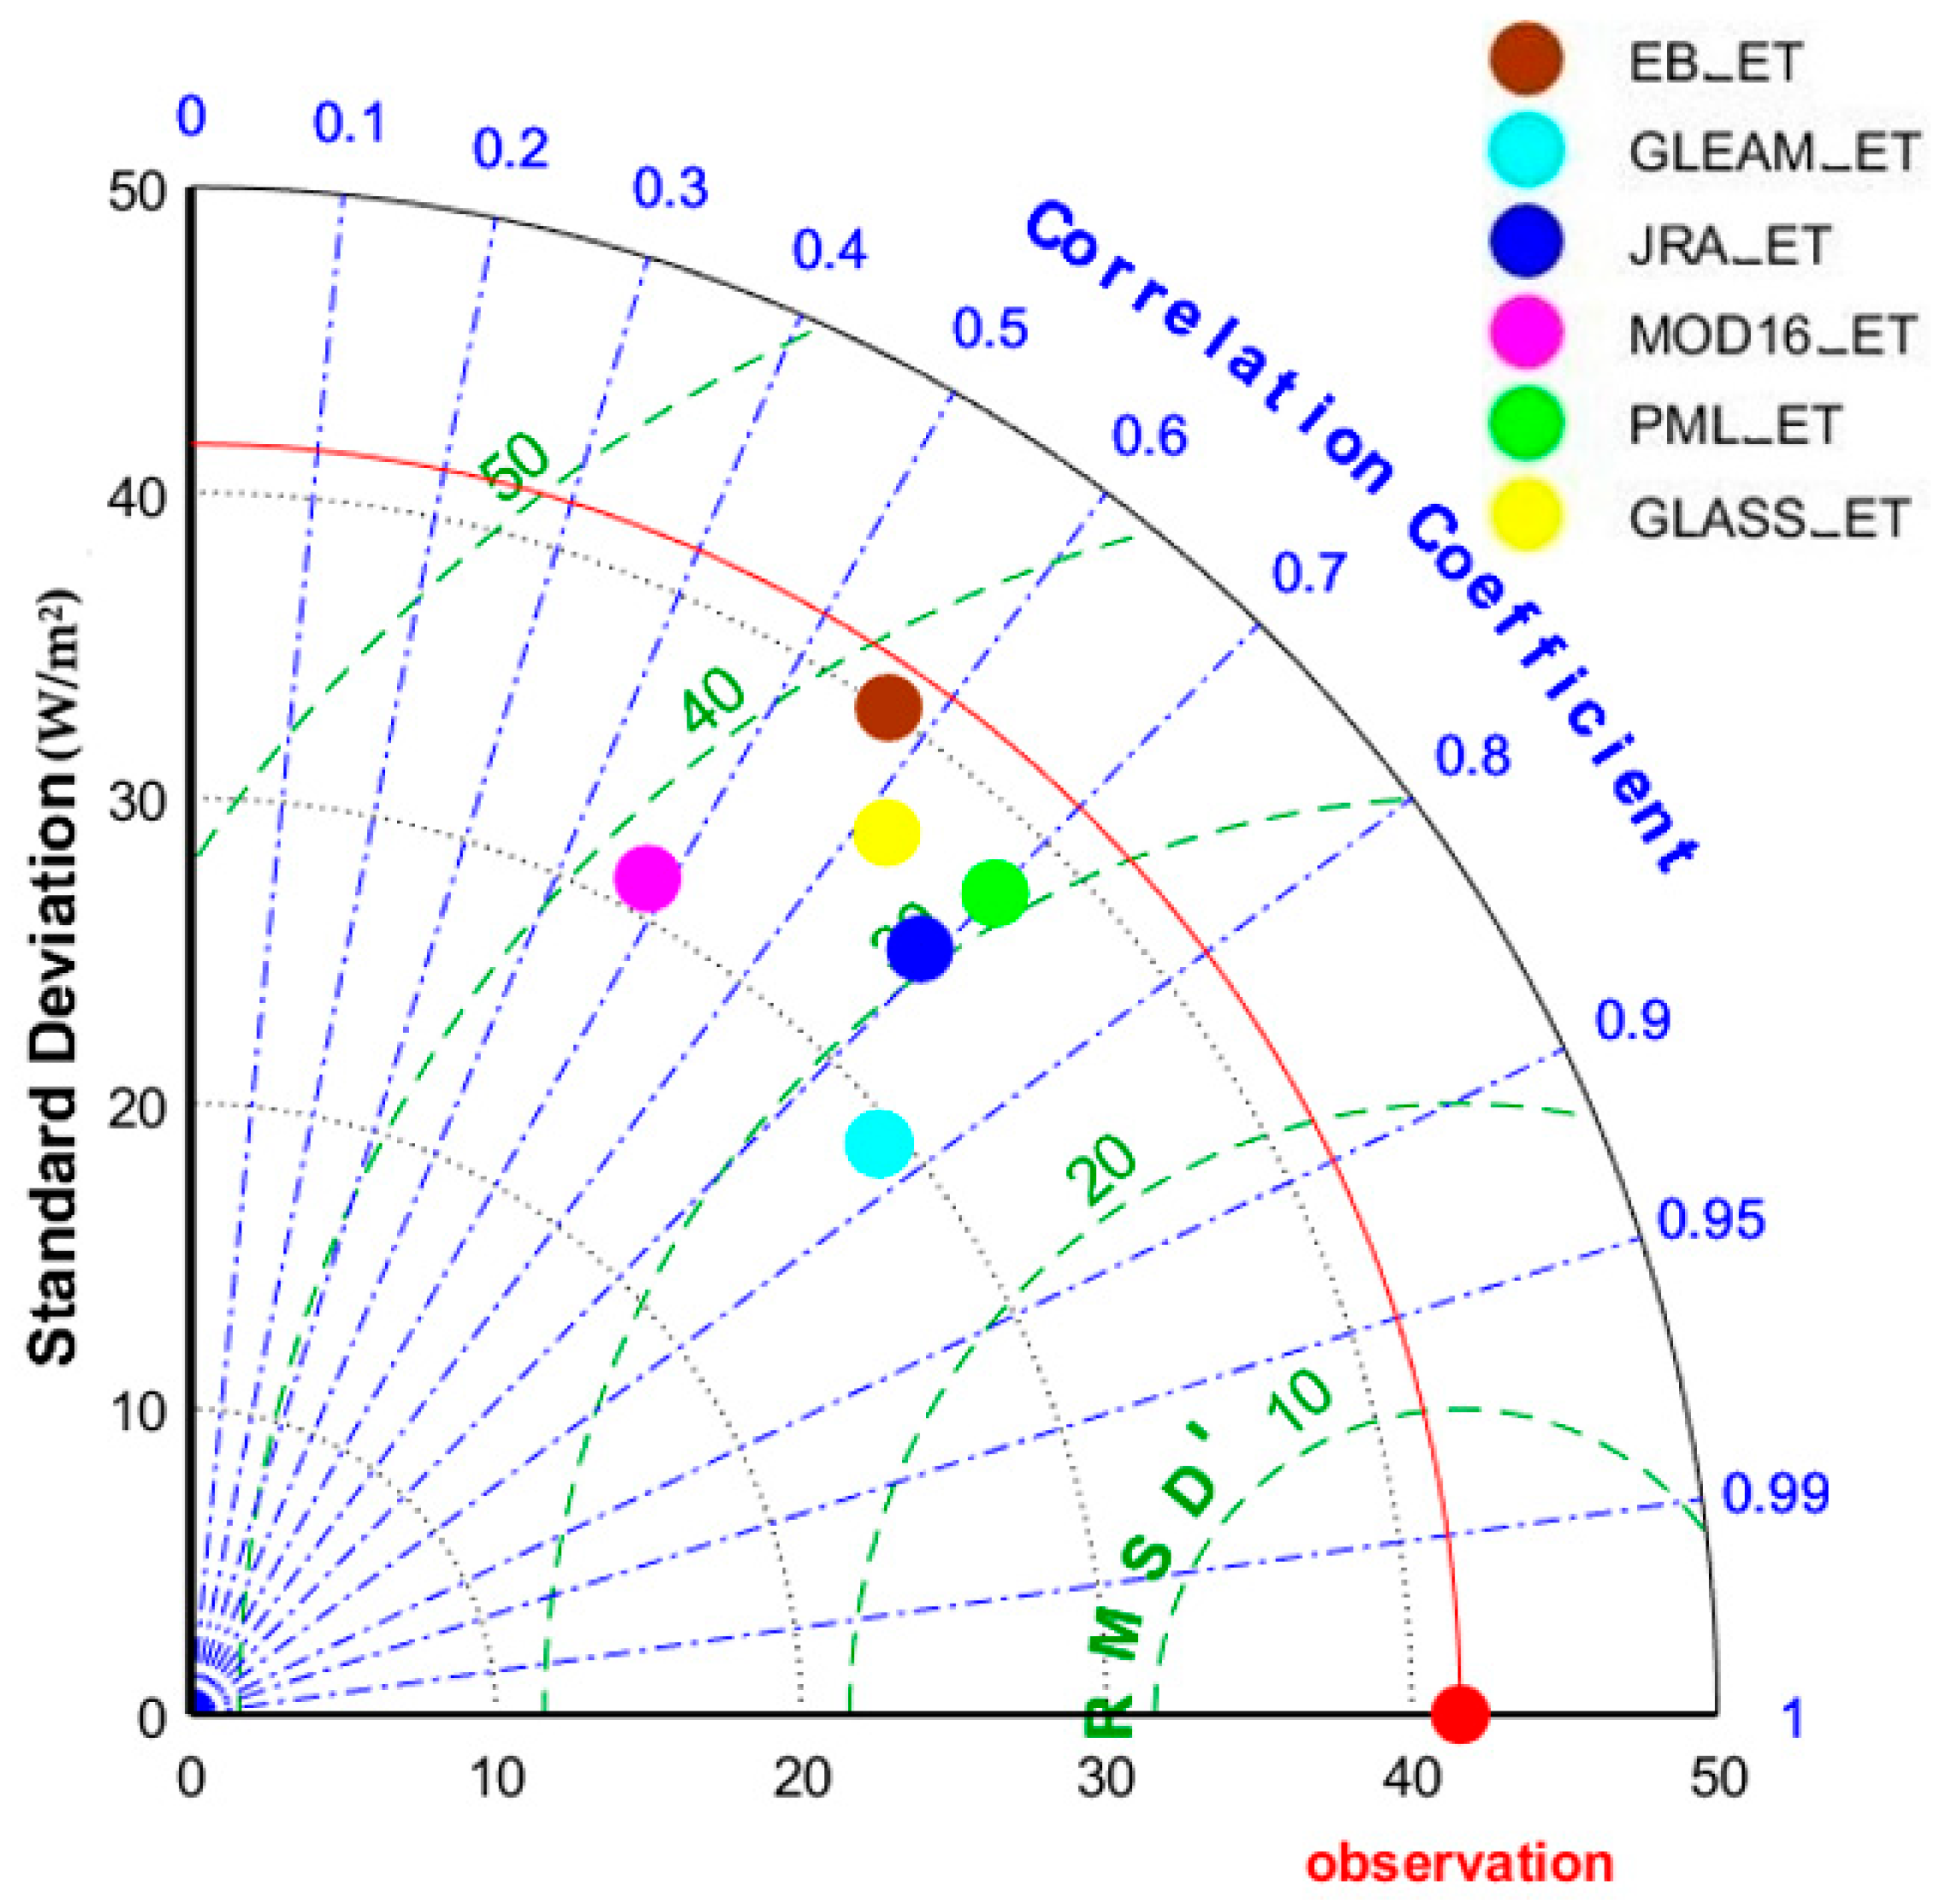
3.1. Results of ET Product Validation Using Flux Tower EC Observations

The pixel scale ET product validation depends on the Latent Heat Flux (LE) data observed by EC of the flux station. Taking Yucheng flux station as an example, Figure 3 shows the scatter diagram of the daily scale LE data from 2003 to 2010. The data shows a relatively regular temporal change trend. In a year, the LE gradually increased from January to June, then decreased since June and began to rise around the beginning of July, and reached a peak in August, then decreased gradually from August to December. The farmland where Yucheng station was located adopts the Winter Wheat–Summer Maize Rotation System. The data information of “key points for the integrated management of winter wheat and summer corn rotation” issued by the Ministry of agriculture and rural affairs of the People’s Republic of China shows that the winter wheat sown in the previous year will be harvested in mid-June, and the summer maize will be sown in late June. Therefore, the emergence of the sudden drop of LE was caused by crop harvesting.
The ET product pixel value at the location of the flux tower was extracted and compared with the latent heat flux observations. According to the results of the flux tower validation (Figure 4), the ET products generally overestimated the low value and underestimated the high values. There is a variation of 0.48–0.77 in R. Except for MOD16_ET and EB_ET, the R values were all greater than 0.6. According to the calculated BIAS values, with a variation 2.93–14.27mm, the GLASS data were less biased. The RMSD ranged from 29.8mm to 39.3mm, with the lowest value coming from PML_ET.
The evaluation results of the ET validation conducted using the EC observations are presented as a Taylor diagram (Figure 5). The red origin represents the actual observation data. The horizontal and vertical axes represent the STD. The blue radial line represents the R value. The green dashed line represents the RMSD’ values. The results indicate that GLEAM_ET had the highest R value and the lowest RMSD’.
Due to the uneven distribution of the observation sites in China, the data were very limited; and because the observation footprint of the flux site itself was affected by the meteorological environment, the observation range was irregular, and the uncertainty caused by it cannot be overcome. Therefore, there are still errors in the evaluation results, which need to be combined with other validation methods.

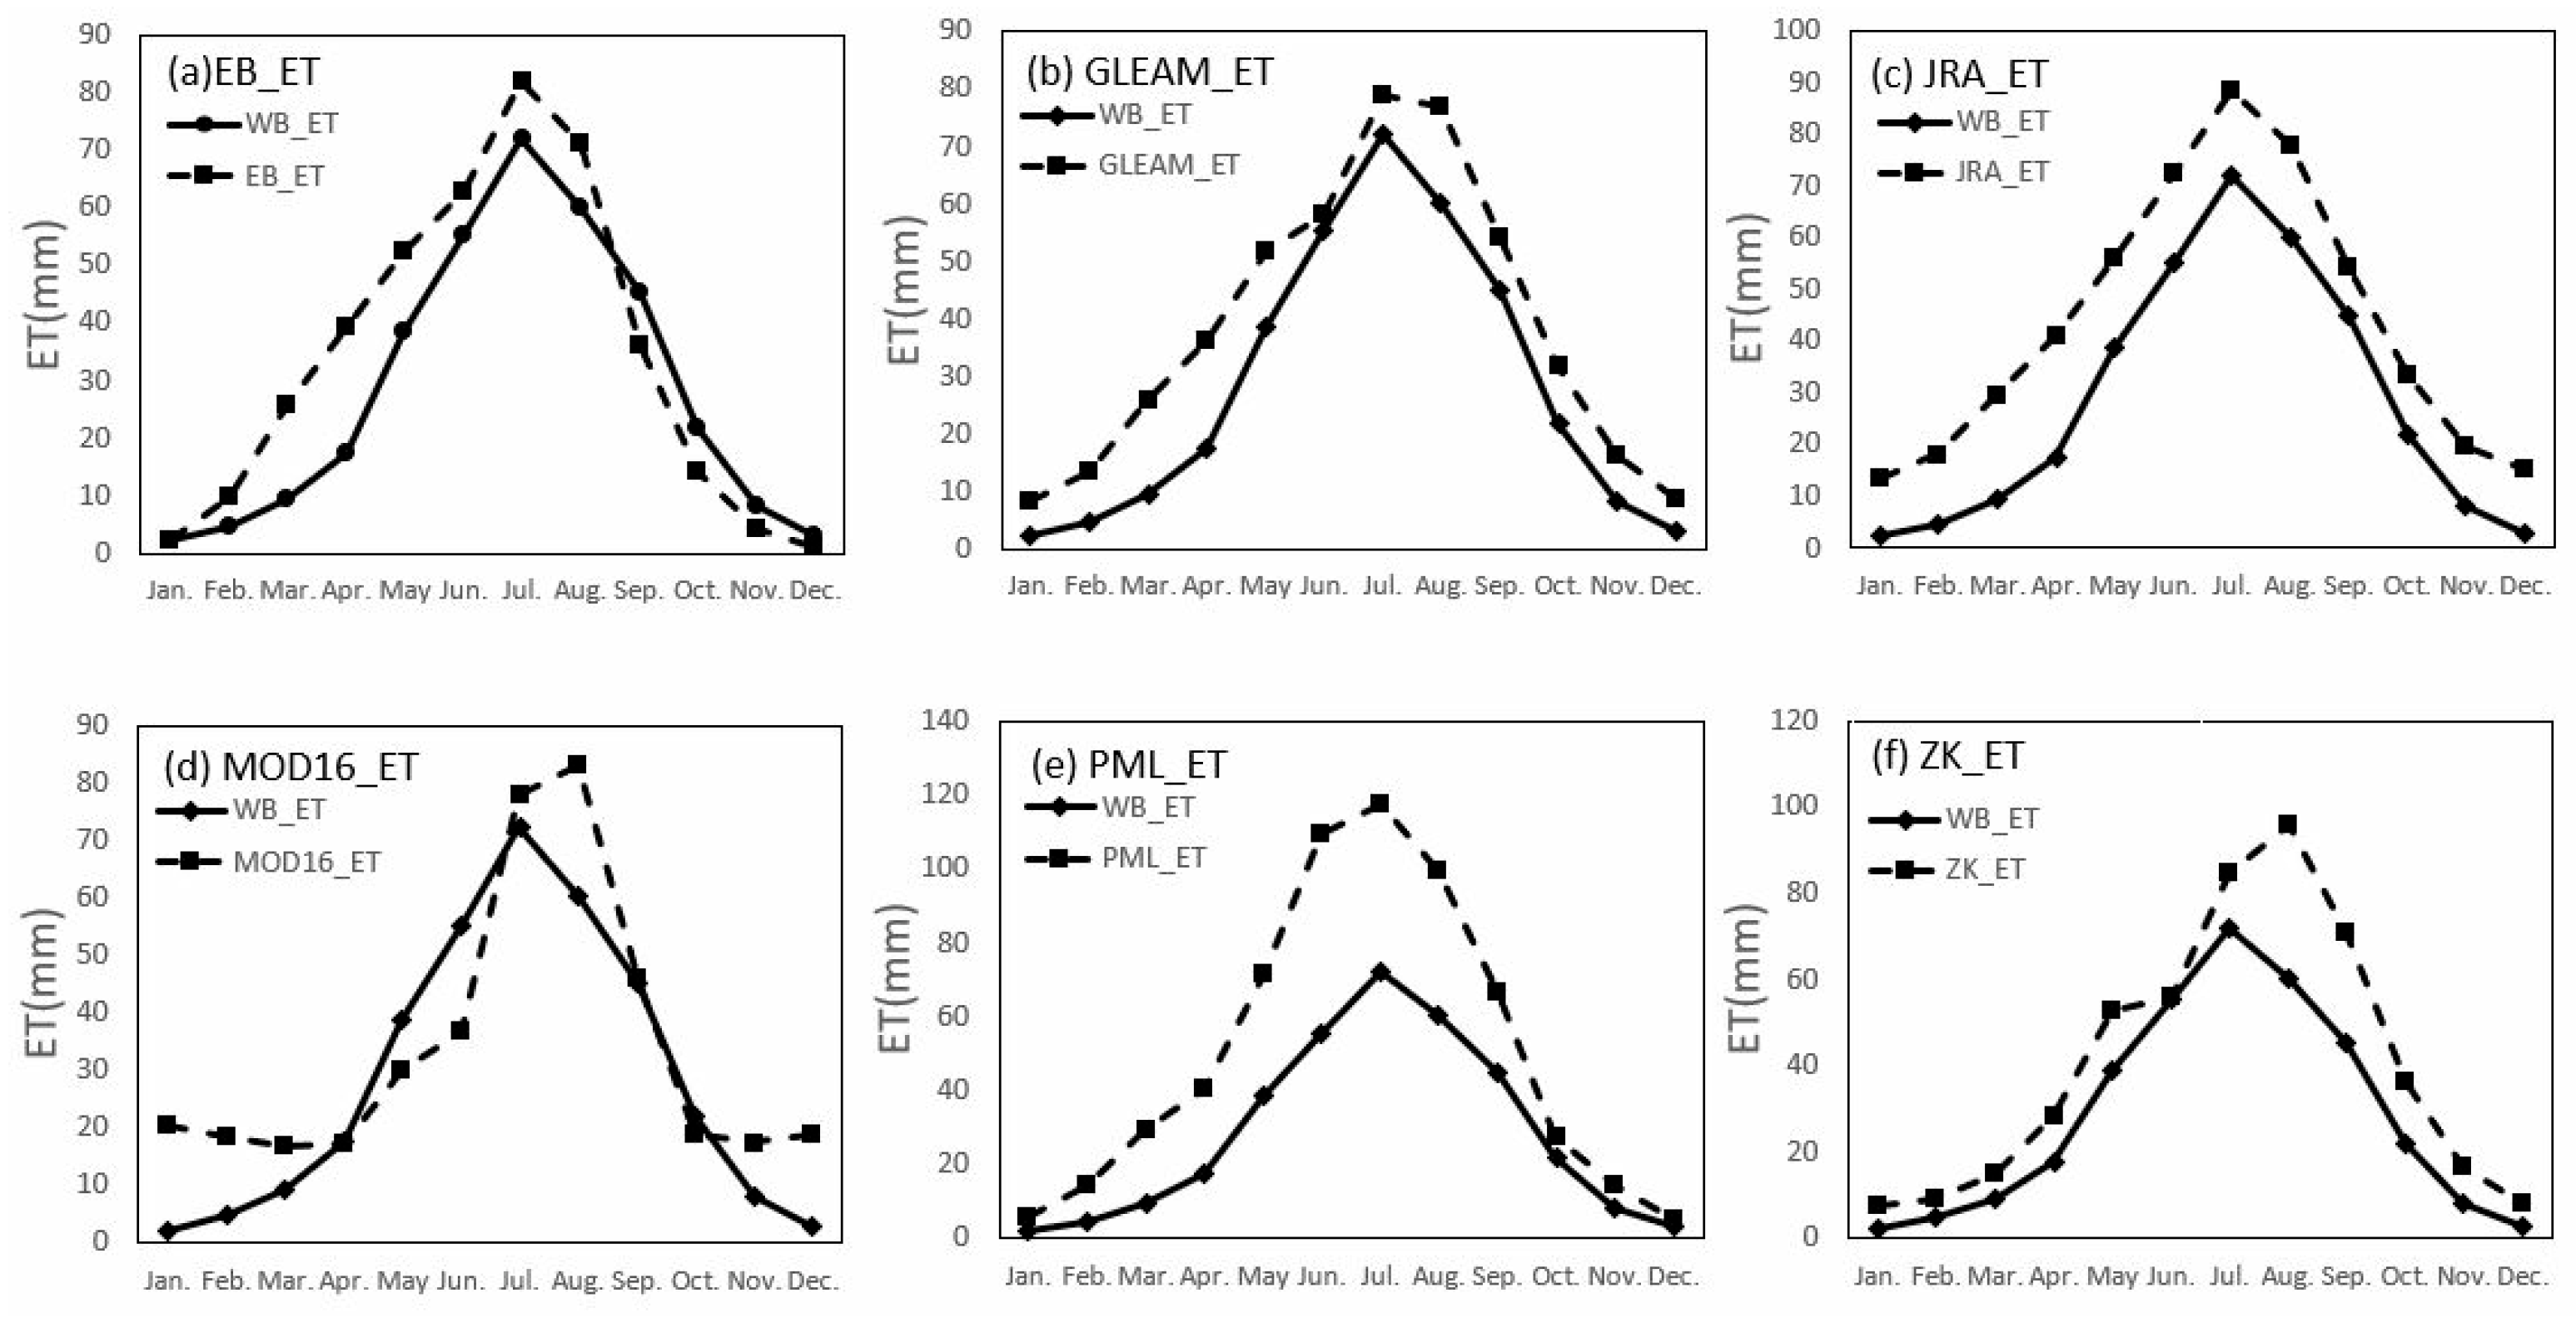
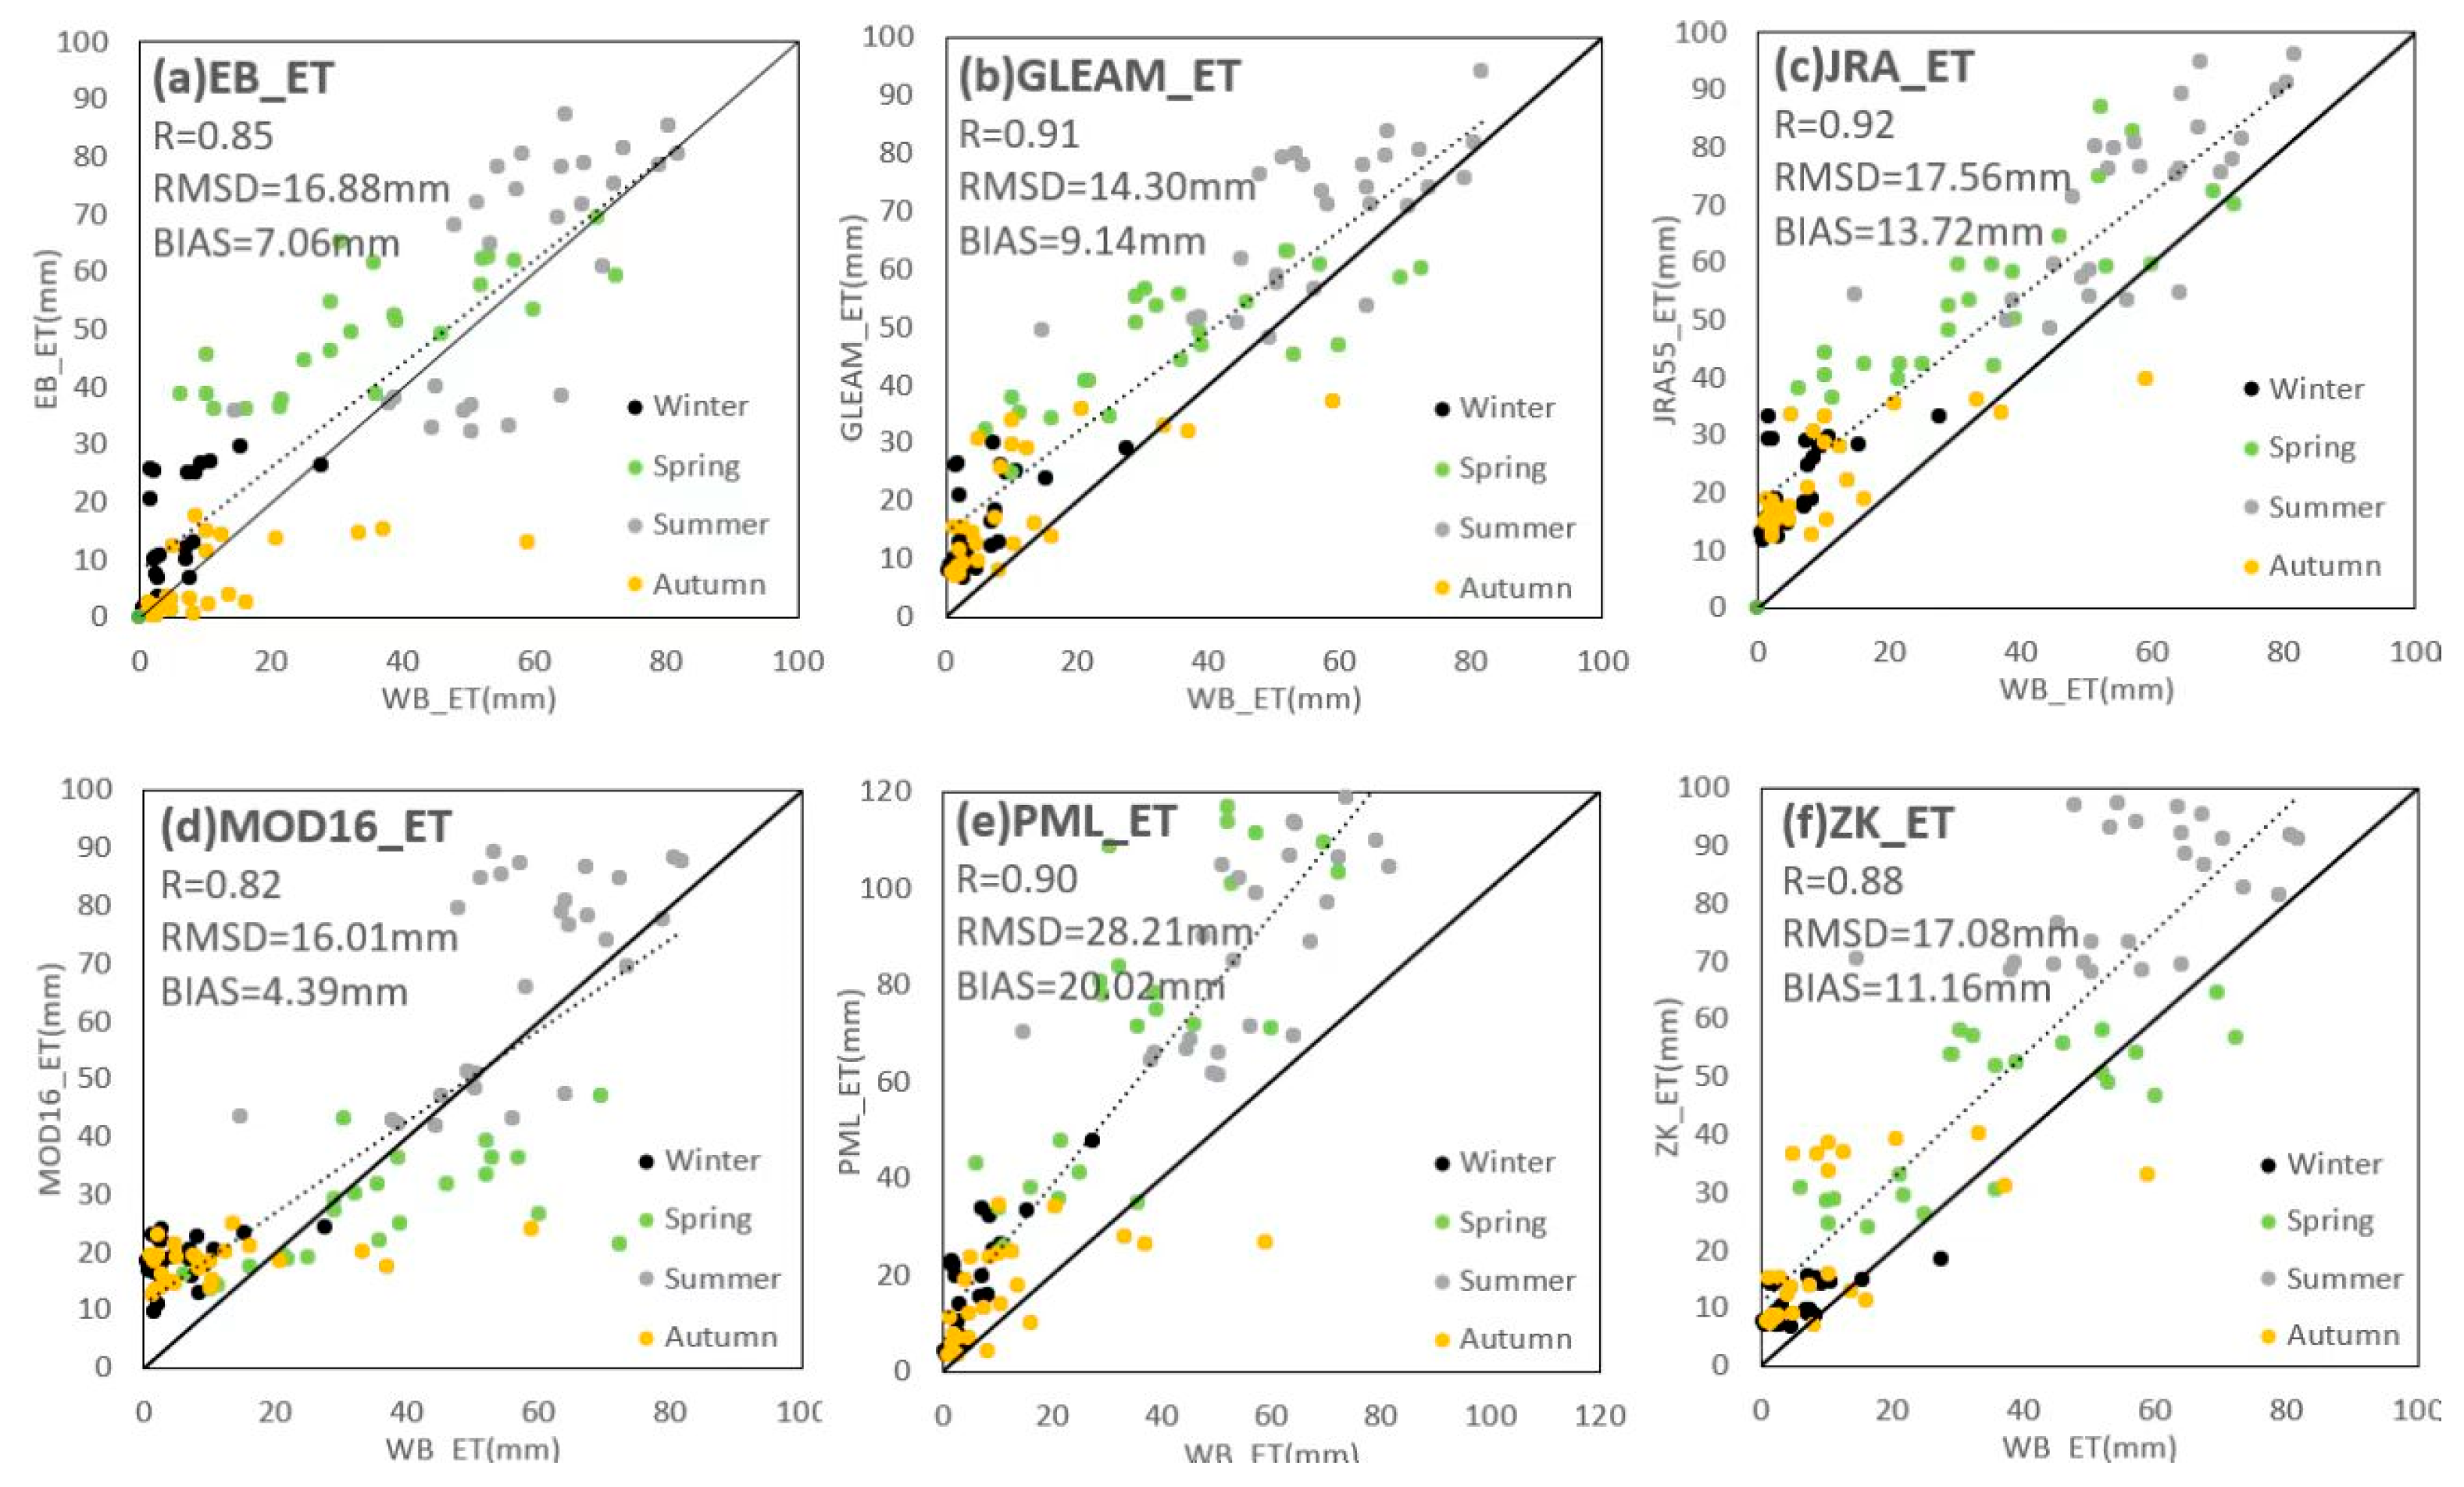
3.2. Results of ET Product Validation Using Water Balance Method

The LORA verification result was shown in Figure 6. The Nash–Sutcliffe Efficiency (NSE), BIAS, and R value are 0.35, 0.35, and 0.76 respectively, which indicate that the accuracy of the LORA runoff dataset in the Haihe River Basin is not very good, while the BIAS and R value were acceptable.
In order to show the changes in the water-balance-derived ET (WB_ET in this paper) and the six types of ET products in the different months, the multi-year average monthly evapotranspiration of the data was calculated. The statistical results are shown in Figure 7. The results indicate that the six ET products had an obvious seasonal pattern. The evapotranspiration values were slightly lower in winter and autumn and were relatively high in spring and summer. During most parts of the study period, all six ET products captured the seasonal ET estimations and corresponded well with the WB_ET. The evapotranspiration values of the JRA_ET, PML_ET, and ZK_ET were significantly higher than those of the WB_ET. The highest value of the WB_ET occurred in July, while the highest values of the ZK_ET and MOD16_ET occurred in August. The EB_ET and GLEAM_ET were in good agreement with the WB_ET.
The monthly runoff depth data were usually less than 6 mm, and this part of the runoff in LORA has been overestimated, which may lead to the low ET value that was estimated by the water balance method.
Figure 8 presents the validation scatter plots for the comparison of the six ET products with the WB_ET, and Figure 9 presents the results as a Taylor diagram. The results show that the six ET products were strongly correlated with the WB_ET. The low values of the EB_ET and MOD16_ET were overestimated, while the high values were underestimated in the Haihe River Basin. The validation points were divided by season. The results indicate that the six ET products exhibited obvious seasonal variation characteristics. As is shown in Figure 6, the JRA_ET and GLEAM_ET had higher R and lower RMSD’ values.
As is shown in Table 3, most of the ET products had higher R values in fall and lower R values in summer. As for the RMSD and BIAS values, the difference between the two was quite large for the different products. Except for the EB_ET, most of the products had the highest RMSD values in summer. According to the BIAS value results, most of the BIAS values were positive, and the negative BIAS values between the EB_ET and MOD16_ET mainly occurred in autumn, indicating that the product values were generally higher than the WB_ET values.

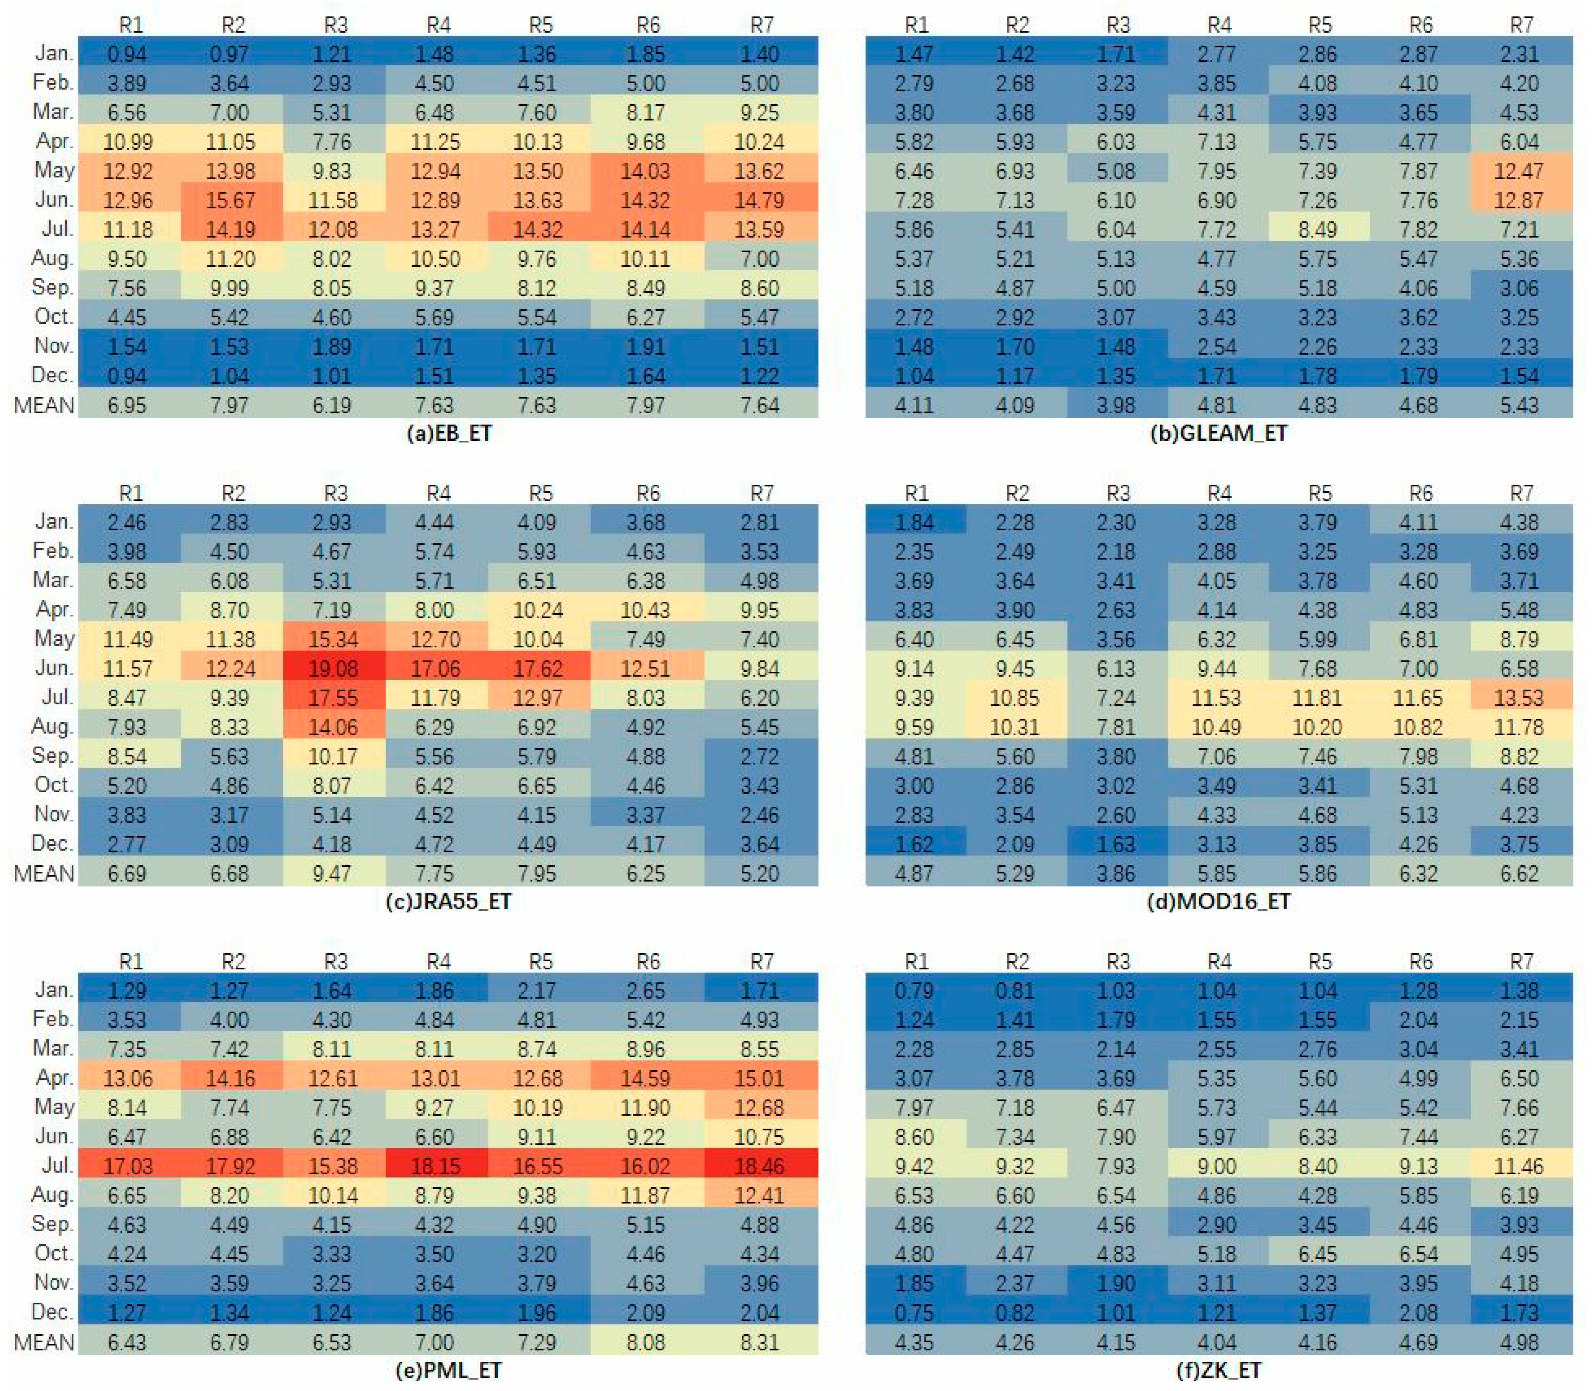
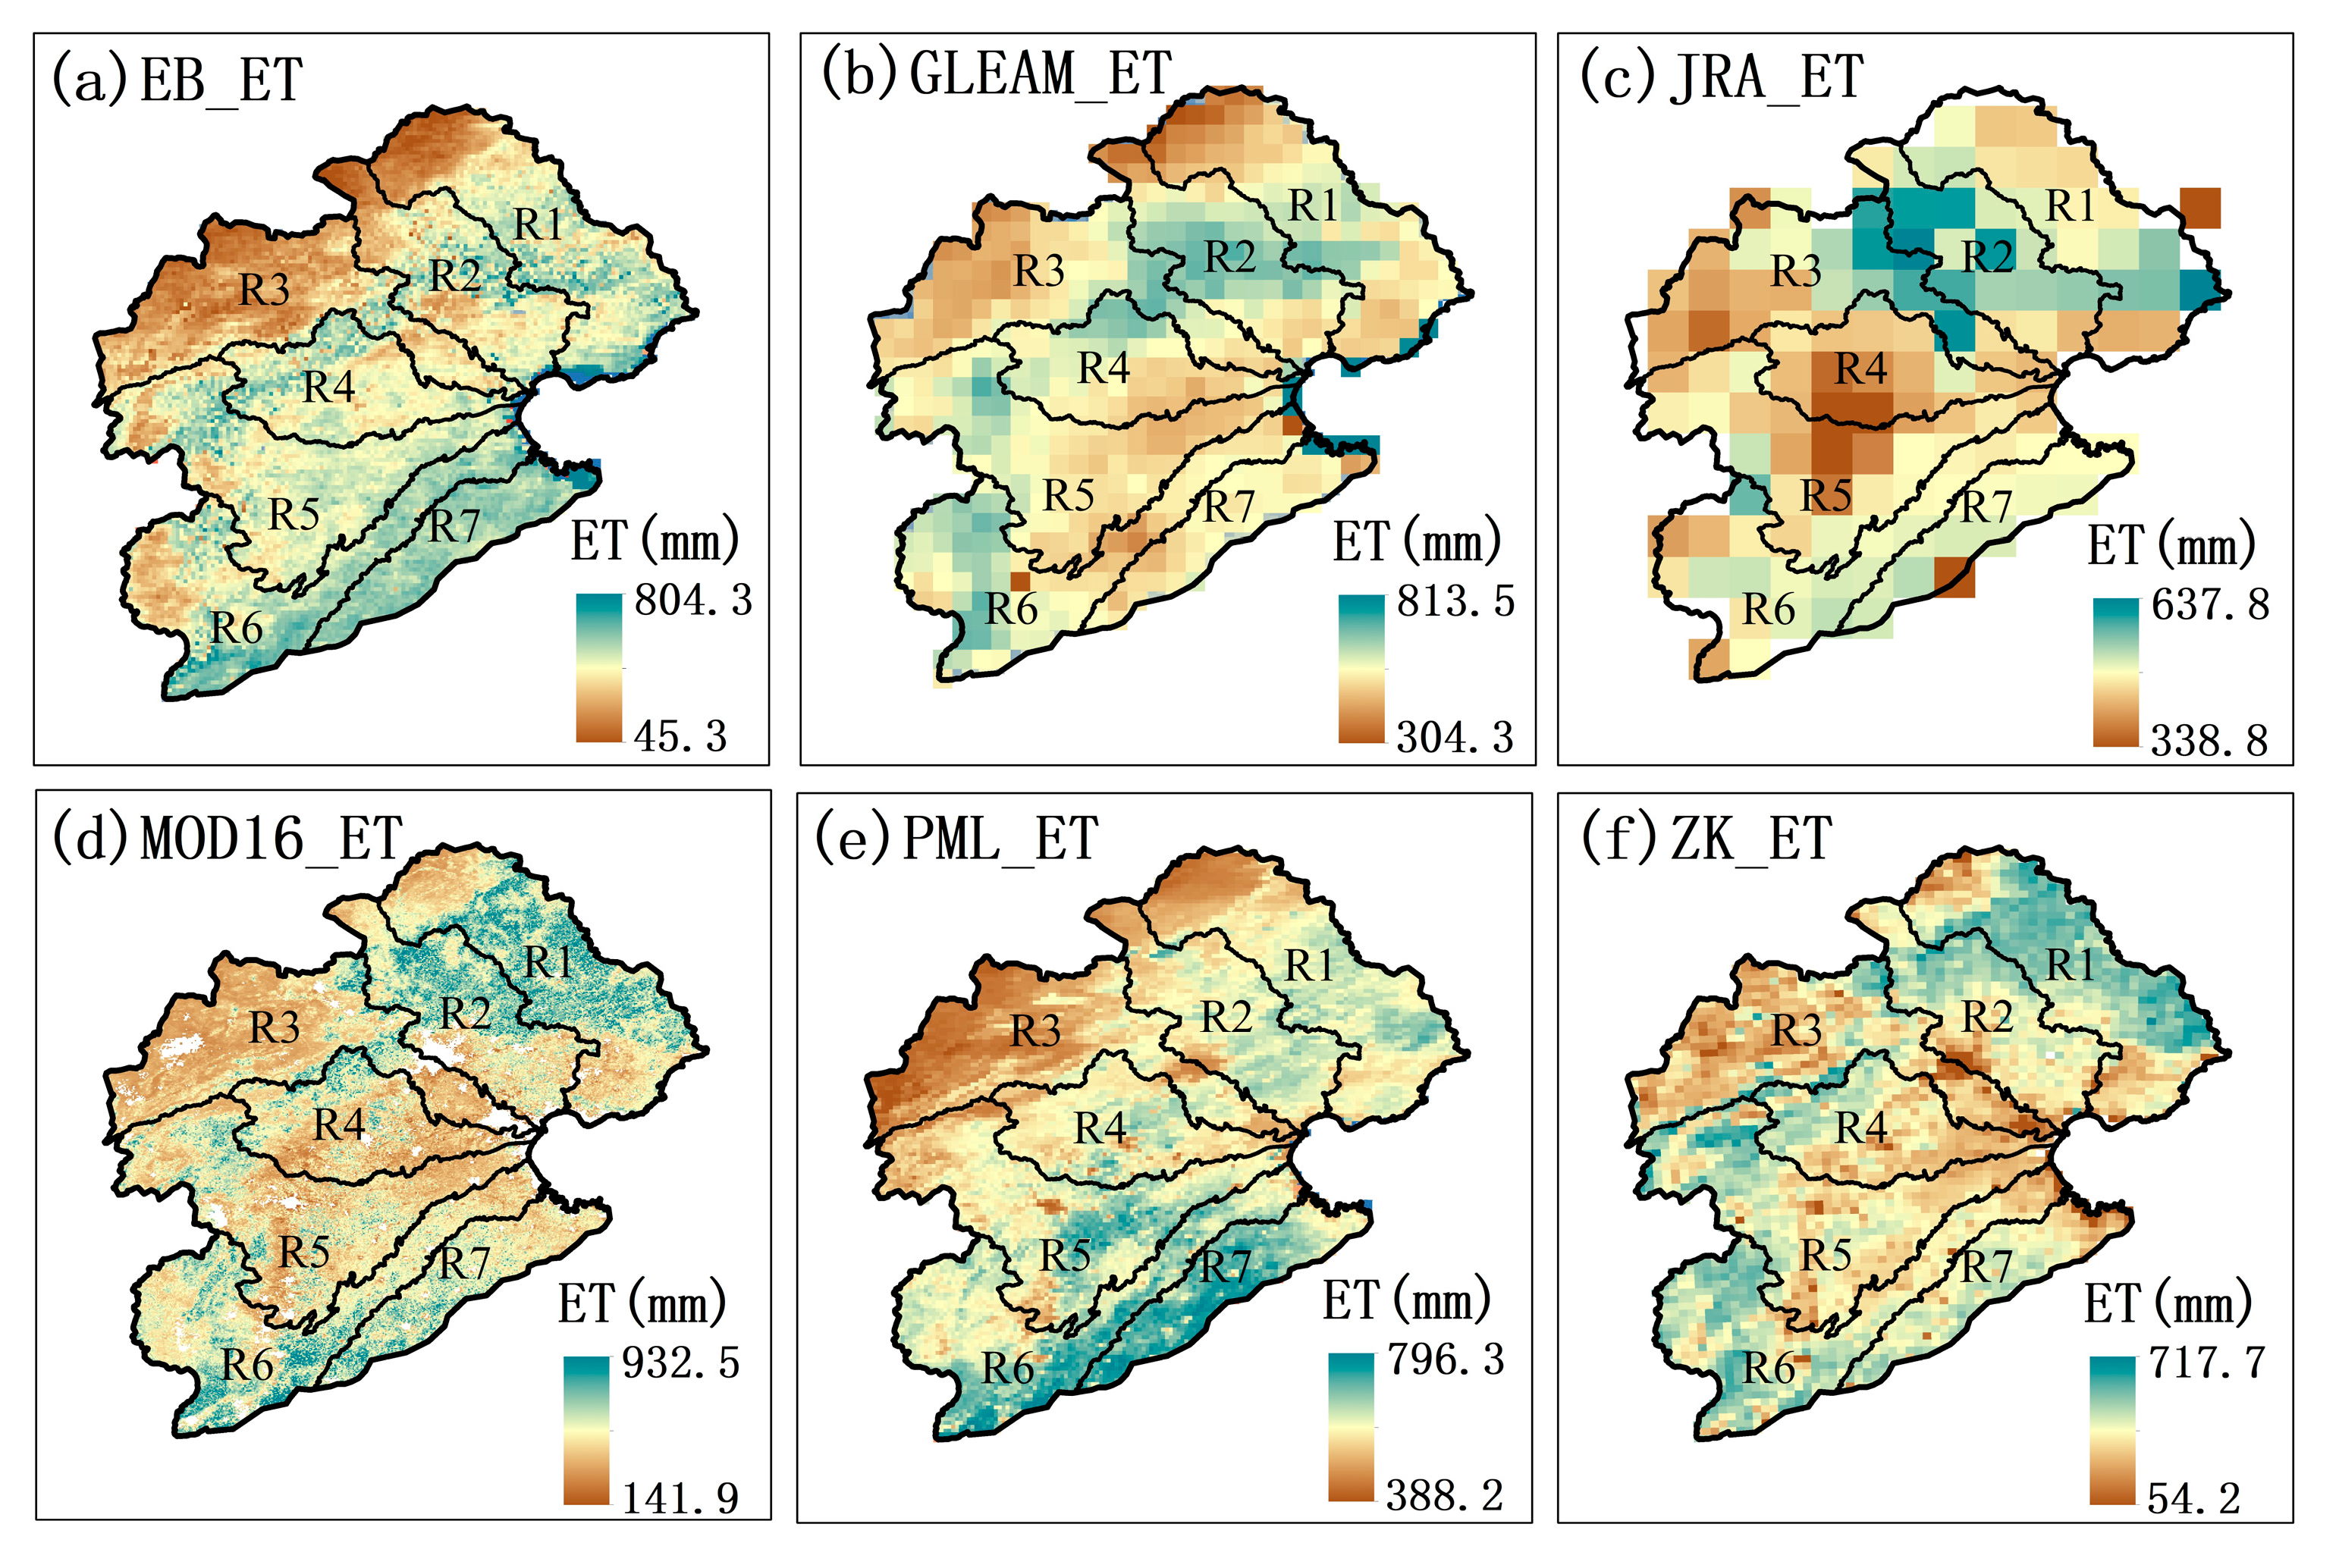
3.3. Results of ET Product Comparison Using TCH Uncertainty Quantification

The relative uncertainties of the six products were calculated using the TCH method. The relative uncertainty is the ratio of the uncertainty to the mean ET value, and it can describe the model skill by neglecting the ET magnitude. The average values of the relative uncertainties of the EB_ET, GLEAM_ET, JRA_ET, MOD16_ET, PML_ET, and ZK_ET were 12.50%, 6.04%, 10.40%, 17.20%, 16.30%, and 13.50%, respectively. It can be seen that the relative uncertainties of the GLEAM data were significantly lower than those of the other products. According to the results presented in Figure 10, the higher relative uncertainty values of the different products occurred at different locations. For example, the higher values of the PML_ET data were mainly located in the southeast. The JRA_ET had a low spatial resolution, and its higher values were concentrated in the northwest. According to the division index of the basic landform morphology [54], the Haihe River Basin was divided into mountainous and non-mountainous areas. The results are presented in Table 4. According to the distribution of the relative uncertainties, the uncertainties of the EB_ET, GLEAM_ET, and MOD16_ET were relatively consistent in the mountainous and non-mountainous areas. The JRA_ET and ZK_ET had higher relative uncertainties in the mountainous areas; while the PML_ET had higher relative uncertainties in the non-mountainous areas.
The relative uncertainties in each sub-basin in the different months are shown in Figure 11. The ET products had slightly higher relative uncertainties in summer. The climate influencing factors of evapotranspiration vary greatly in summer, as well as with high temperature and precipitation simultaneously, which lead to a large range of evapotranspiration in summer, thereby resulting in the increased uncertainty of ET.
In terms of the sub-basins, there was not much difference between the different sub-basins. Except for the JRA_ET data, the highest or second-highest values of the other products all occurred in the Tuhai River and Majia River Basin (R7).

4. Discussion

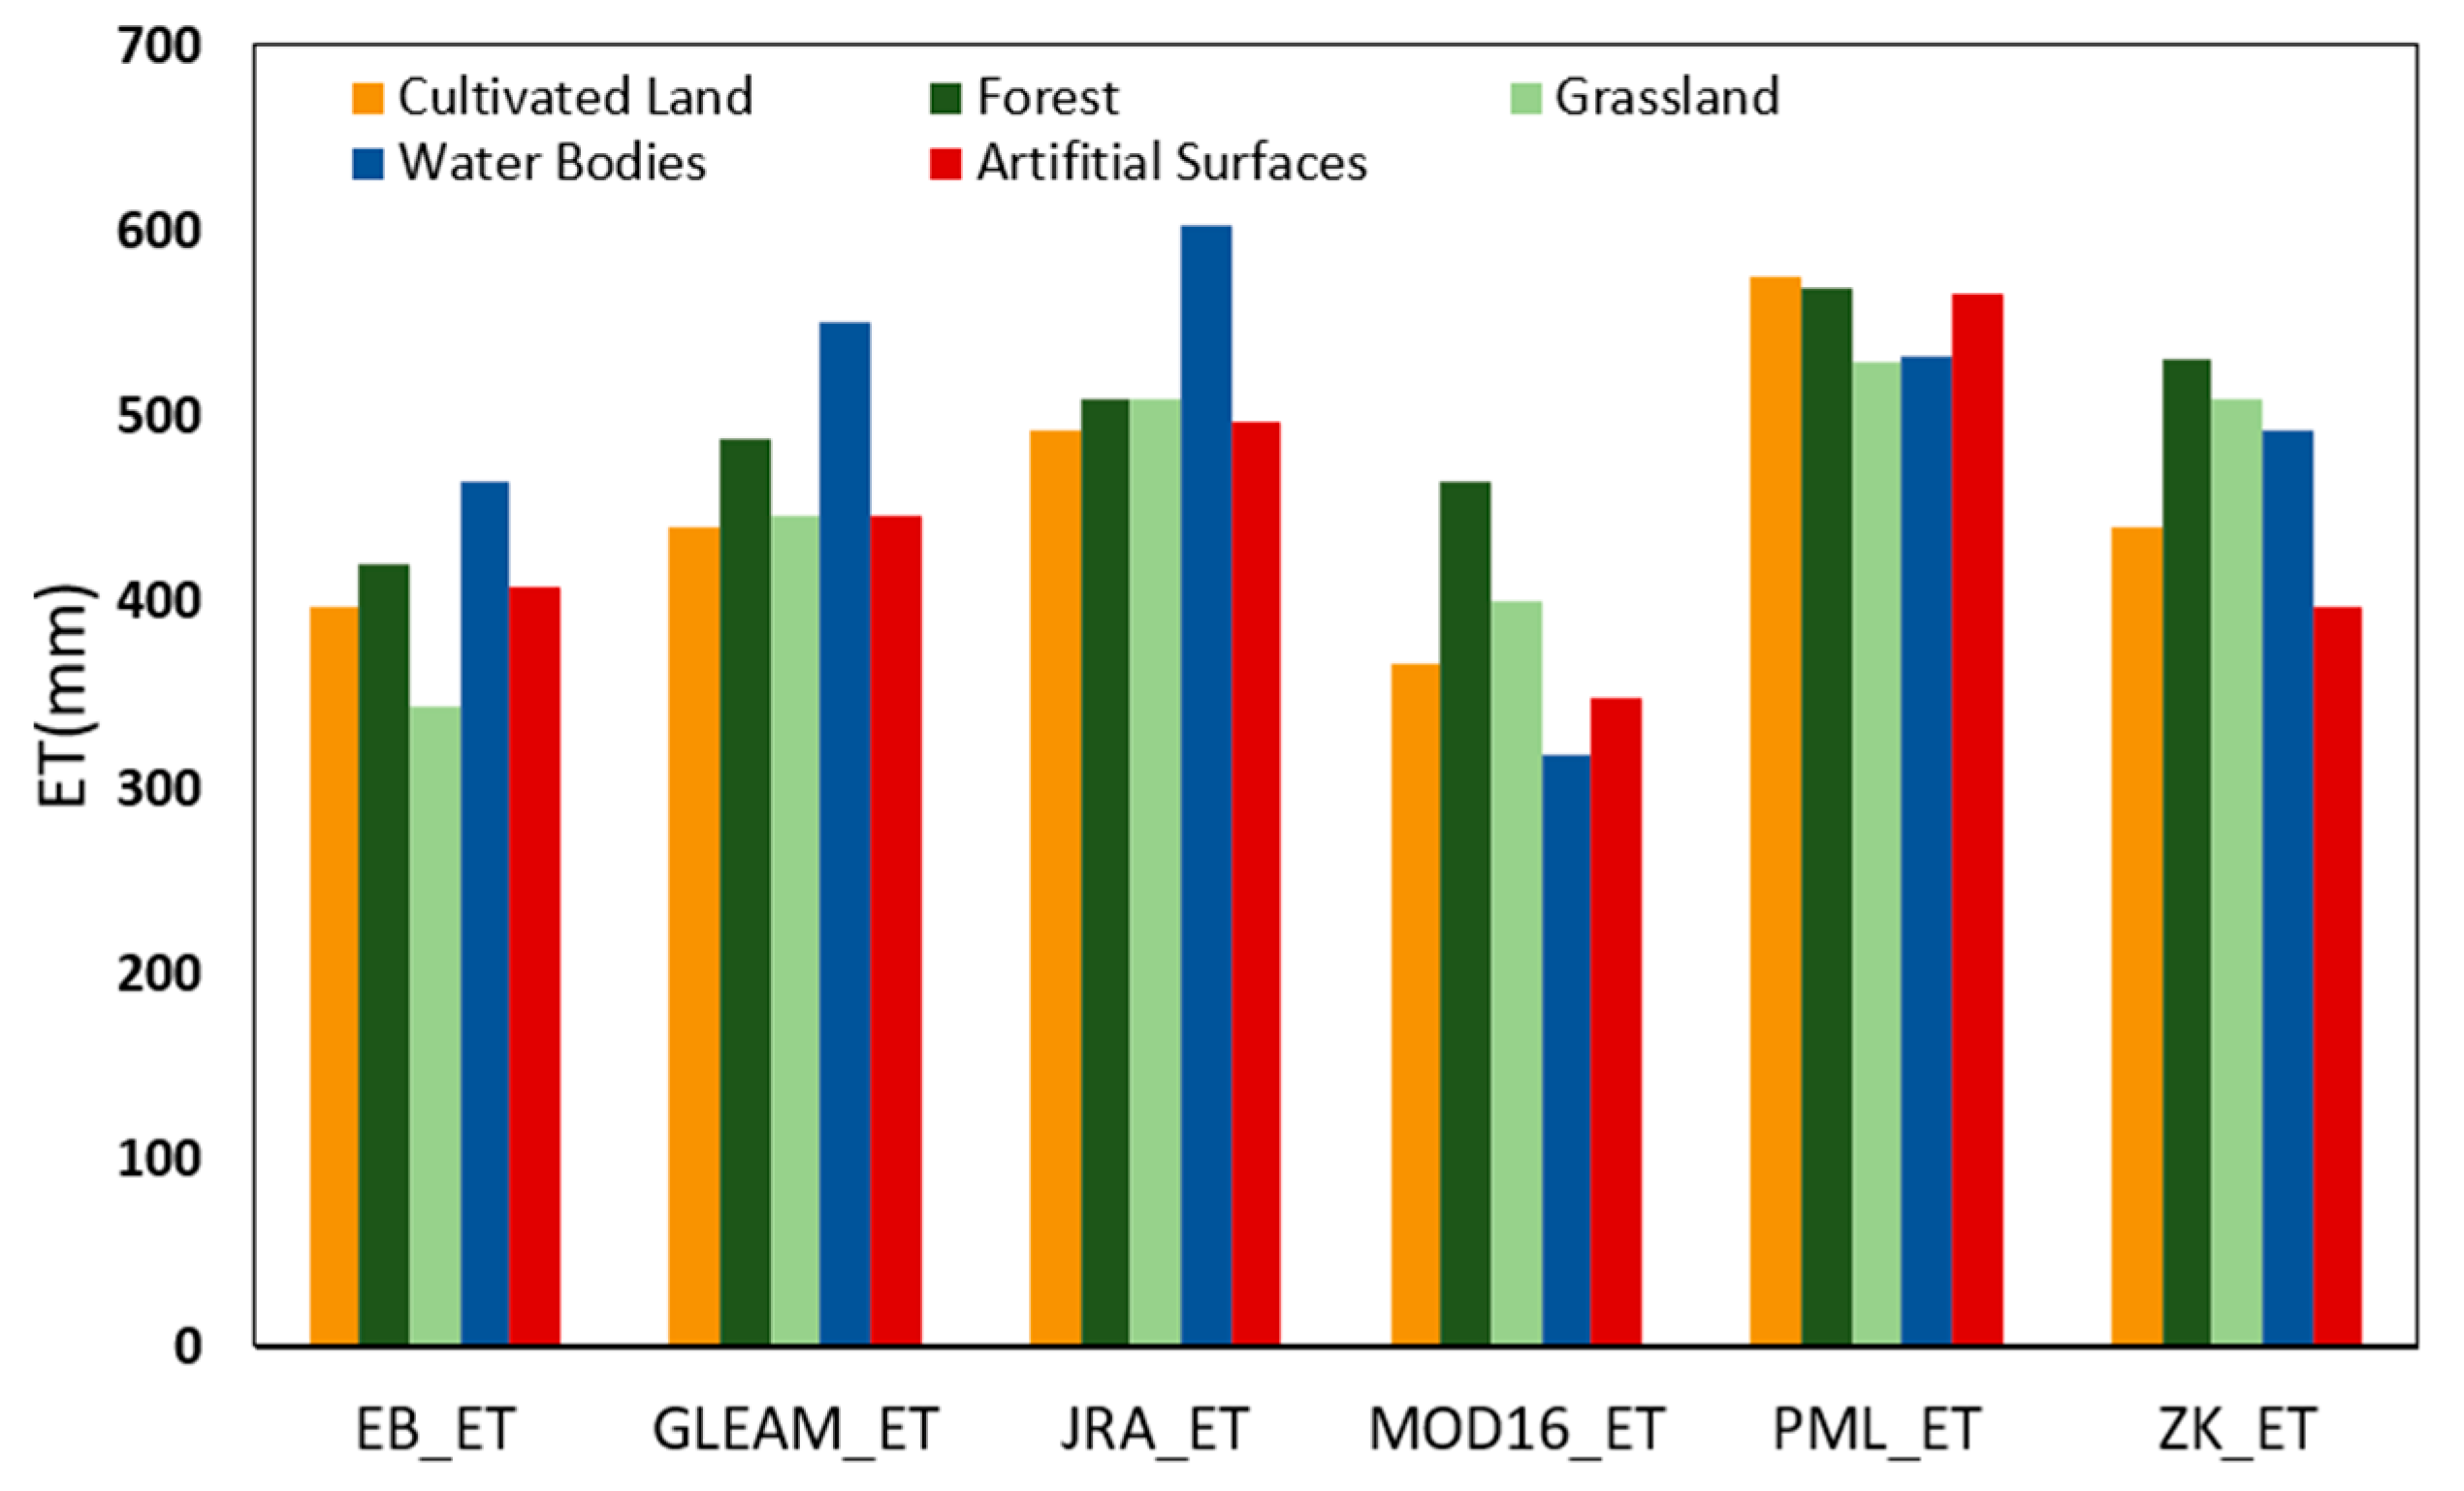
4.1. Spatial Distribution of ET under Different Land-Cover Types

The spatial distributions of the mean annual ET from 2003 to 2012 are shown in Figure 12. The ranges of different ET products vary greatly. Generally, the coarser the spatial resolution of the ET products, the smaller the range of the ET values. According to the spatial distribution of ET, the evapotranspiration in the northwest of the Haihe River Basin is lower than that in the southeast.
The areas of wetland, shrubland, and bare land were relatively less in the study area, so the mean annual ET of the other five land-cover types from 2003 to 2012 were calculated in Figure 13. Generally, the ET value is the highest in water bodies and the lowest in artificial surfaces. The ET values of forest and grassland are higher than those of bare land and artificial surfaces. Forestlands have greater abilities at retaining incoming precipitation due to a deeper root zone and thus higher soil moisture storage, resulting in greater occurrences of ET compared to other land uses [55]. The ET value in cultivated land is affected by the growth of crops, which also leads to fluctuations in evapotranspiration throughout the year. Most of these features were reflected by GLEAM_ET, EB_ET, and JRA_ET, while the ET of all types of land cover were relatively high in PML_ET and low in MOD16_ET.

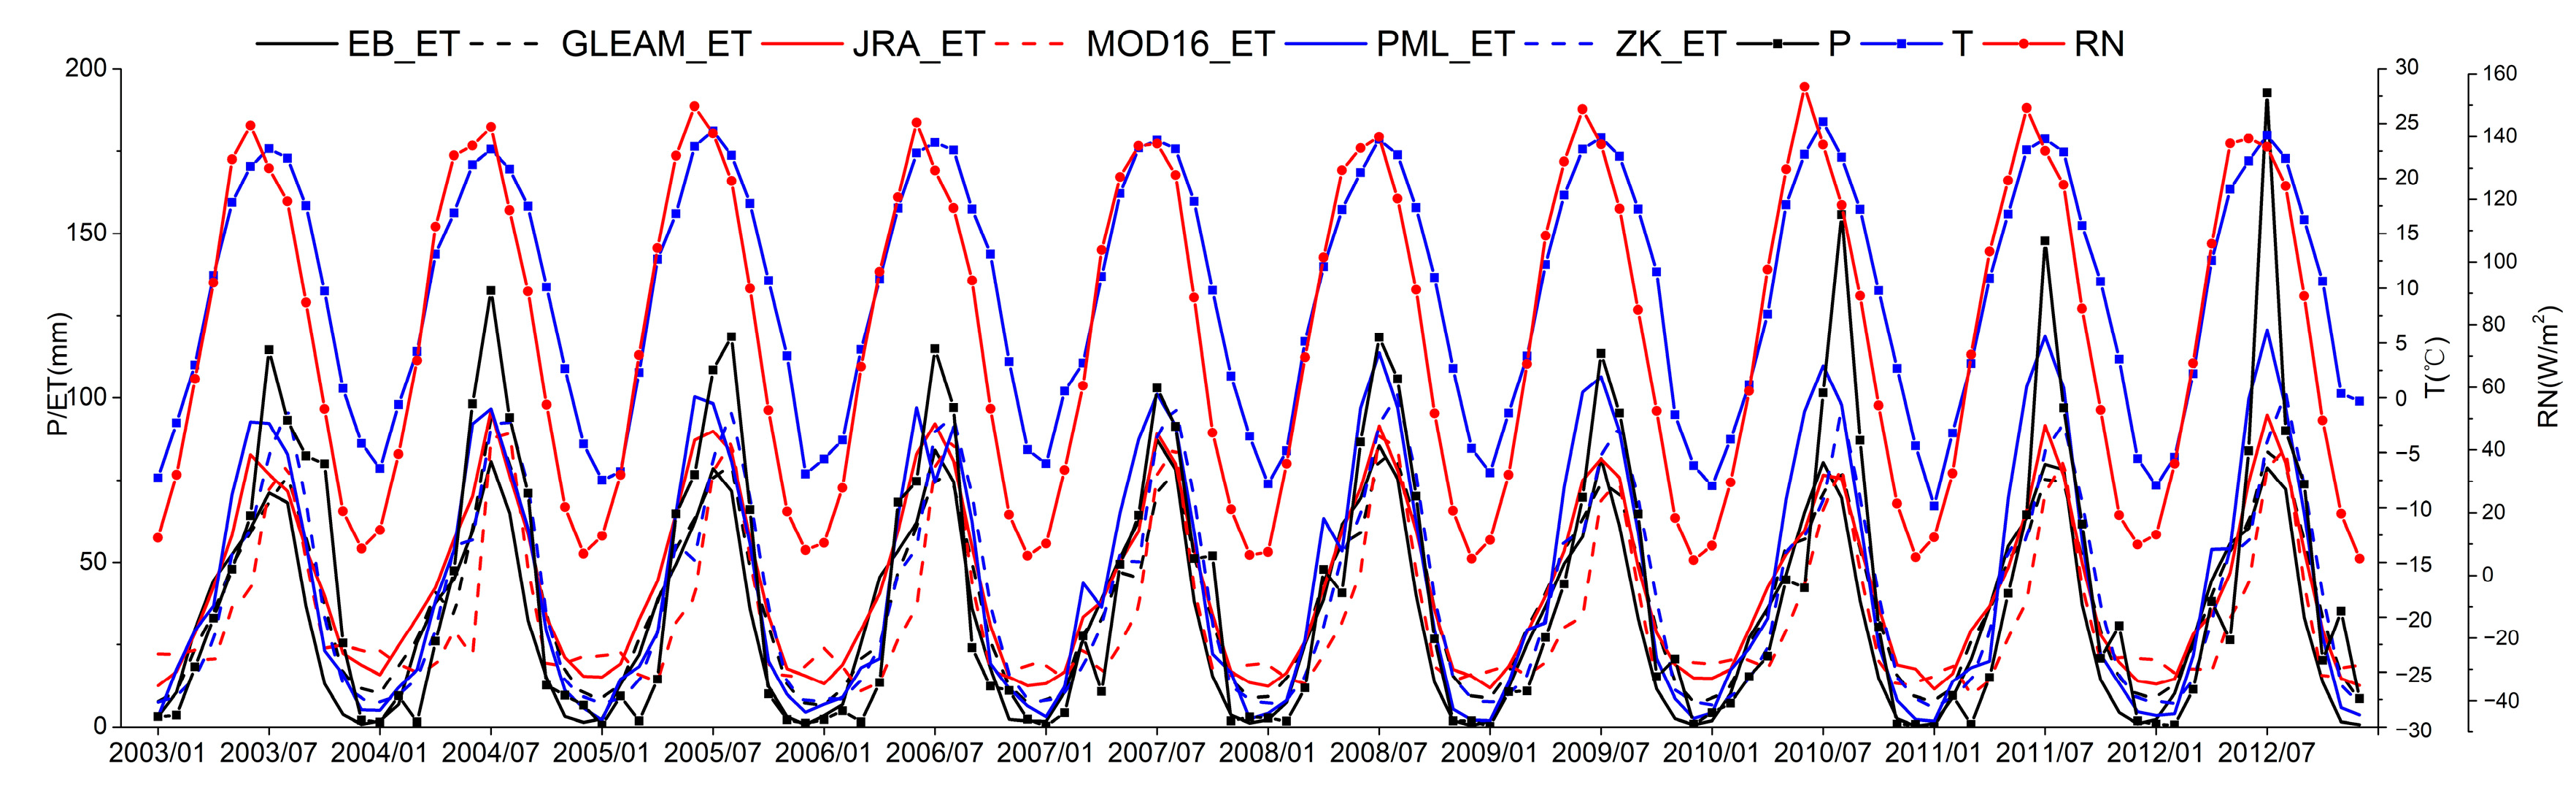
4.2. Analysis of the Influence of Climatic Factors on ET

A time-series of evapotranspiration data, precipitation data (P), air temperature data (T), and surface net radiation data (RN) at a monthly scale from 2003 to 2012 are displayed in Figure 14. It can be seen that the fluctuation of ET is similar to those of P, T, and RN, and the cosine similarity between climatic factors and ET products shows a very high similarity (Table 5), which showed that all of the ET products were closely related to the above three climatic factors. All the cosine similarity values were above 0.930, except for those between MOD16_ET and temperature/net radiation. Under the temperate monsoon climate of the study area, the abundant precipitation in summer increases the soil water storage in the region and the higher temperatures increase the soil water evaporation capacity. Therefore, the phenomenon of high summer evapotranspiration is consistent with this theory.

4.3. Sampling Resolution and the Mechanism of the ET Products

Currently, various remote sensing ET products are constantly being developed, greatly facilitating academic research, and the evaluation of these products is helpful in ensuring the appropriate application of these products. An applicability evaluation is an important method used to evaluate the errors of ET products. In the applicability evaluation of ET products, the flux tower validation method and the water balance validation method are the most commonly used methods. However, in terms of applicability evaluation, the flux tower validation’s errors cannot be ignored. This is due to the fact that: (1) Since the spatial scale of the EC observation data is one hundred meters and the observation range is irregular due to factors such as the wind speed, a more accurate method of calculating the flux footprint needs to be applied in future studies. (2) The spatial resolutions of the ET products evaluated in this paper range from 500 m to 50 km approximately, this mismatch increases the error in the flux tower validation method and weakens the comparability of the evaluations. (3) There are not many flux site data for the study area. The representativeness of the flux site data has also become a major problem in the flux tower validation method. At present, five agricultural surface-type flux tower EC observation datasets are available in the Haihe River Basin, but it is difficult for these five datasets to represent the entire river basin. It is difficult to use observational data to characterize the overall accuracy of the ET products.
As for the water balance method, the applicability of auxiliary data, such as water storage, runoff, and precipitation data, will affect the accuracy of the entire water balance formula. The spatial resolution of each product is different, and it is inevitable that some information will be lost during resampling. In addition, the different evaluation methods also have their own limitations. The EB_ET adopts the improved SEBS algorithm [44,56], which was found to have the smallest deviation in the water balance method evaluation conducted in this study, but it differs from the measured EC data. The results of the overestimation and underestimation of MOD16_ET were similar to previous research results for the Hanjiang River Basin [57] and the Northwest Inland River in China [36]. The GLEAM_ET, JRA_ET, PML_ET, and ZK_ET produced overestimation. The overestimations of the PML_ET, ZK_ET and JRA55 have also been confirmed in the Hanjiang River Basin in China [58].
The MOD16_ET, PML_ET, and ZK_ET are calculated based on the modified PM formula. The PM formula has a solid theory and high accuracy. It is a commonly used ET estimation method. According to relevant research conclusions [59], the PM formula has a high correlation with climate data. Therefore, the accuracy of the climate data determines the accuracy of the PM formula.
The PT formula is a revised version of the PM formula, and it omits the aerodynamic processes. Compared with the PM formula, the accuracy of the PT formula is somewhat lower; however, the results of this study demonstrate that the applicability of the PT model product (GLEAM_ET) in the Haihe River Basin is much higher than that of the PM data products, and the good applicability of GLEAM_ET in the Haihe River Basin has also been confirmed in other studies [60].
The JRA-55 is re-analysis data, and it was created using a complete observation system from 1958 to the present. However, the data from the observation system are not uniformly distributed geographically, so some of the characteristics of the Haihe River Basin cannot be observed.
The GLASS_ET is a Bayesian method integrated product, which integrates five traditional latent heat flux algorithms: the MODIS algorithm, improved PM model and the Priestley–Taylor Jet Propulsion Laboratory (PT-JPL), modified satellite-based Priestley–Taylor (MS-PT), and semi-empirical Penman algorithms. In this study, only the flux tower validation of the GLASS_ET was carried out, and due to the lack of monthly-scale data, the water balance method and TCH uncertainty validations were not applied to the GLASS_ET. The results indicate that this product has large errors in the high ET value seasons, especially in summer.

5. Conclusions

Seven ET products, including the EB_ET, GLEAM_ET, JRA_ET, MOD16_ET, PML_ET, GLASS_ET, and ZK_ET, were evaluated in this study using three methods: pixel-scale flux tower validation, regional-scale water balance method validation, and TCH uncertainty analysis. The applicability of the above data products in the Haihe River Basin was evaluated. The results of this study provide data support for the promotion of ET products and water resource evaluation in the Haihe River Basin. The main conclusions of this study are as follows:
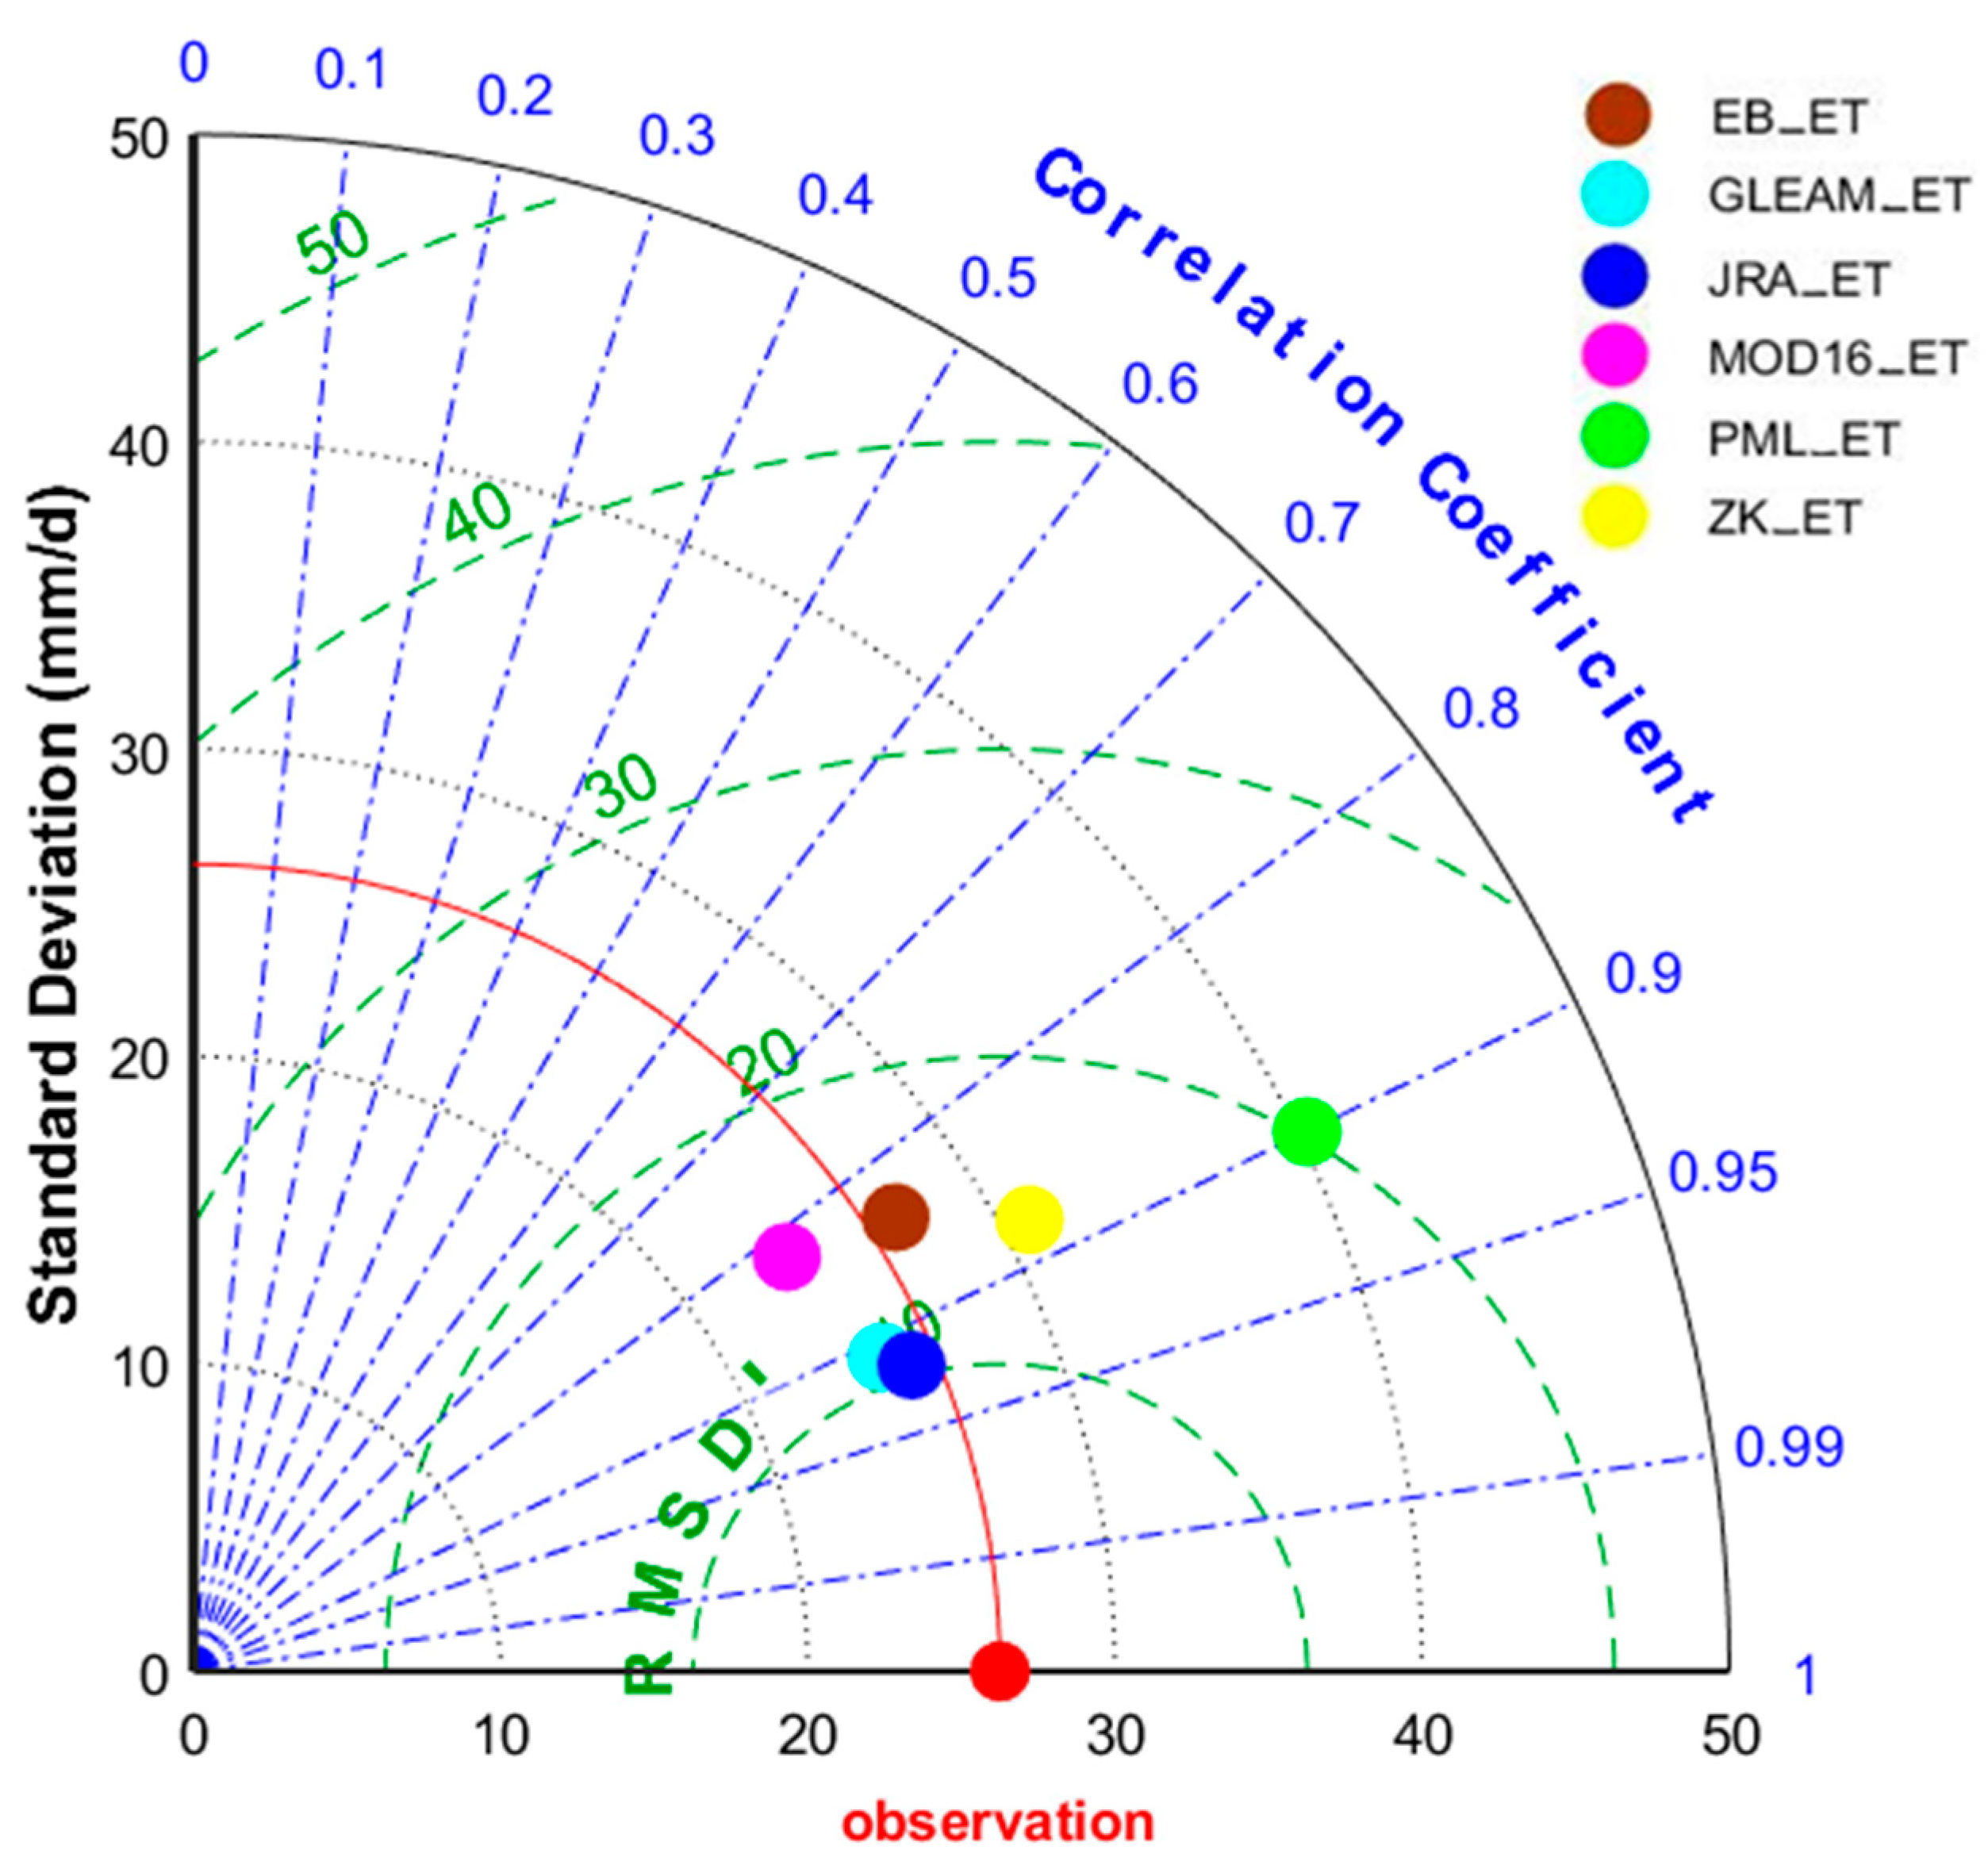
  • For validation based on flux tower EC observations, the results indicate that, except for MOD16_ET and EB_ET, the R values were all greater than 0.6. The BIAS values of GLASS_ET were the lowest (2.93 w/m2). GLEAM_ET had the highest R (0.77) value and the lowest RMSD’ (27.3 w/m2). Overall, the GLEAM data fitted the EC measured data well, and the RMSD values were relatively low;
  • Based on the validation using the water balance method, the EB_ET, GLEAM_ET, JRA_ET, PML_ET, and ZK_ET overestimated the values in the Haihe River Basin. The multi-year averaged monthly evapotranspiration of the WB_ET and the ET products showed that the EB_ET and GLEAM_ET were in good agreement with the WB_ET. Overall, the JRA_ET (R = 0.92, BIAS = 13.72 mm/month, and RMSD′ = 10.96 mm/month) and GLEAM_ET (R = 0.91, BIAS = 9.14 mm/month, and RMSD′ = 11.00 mm/month) data have higher accuracies;
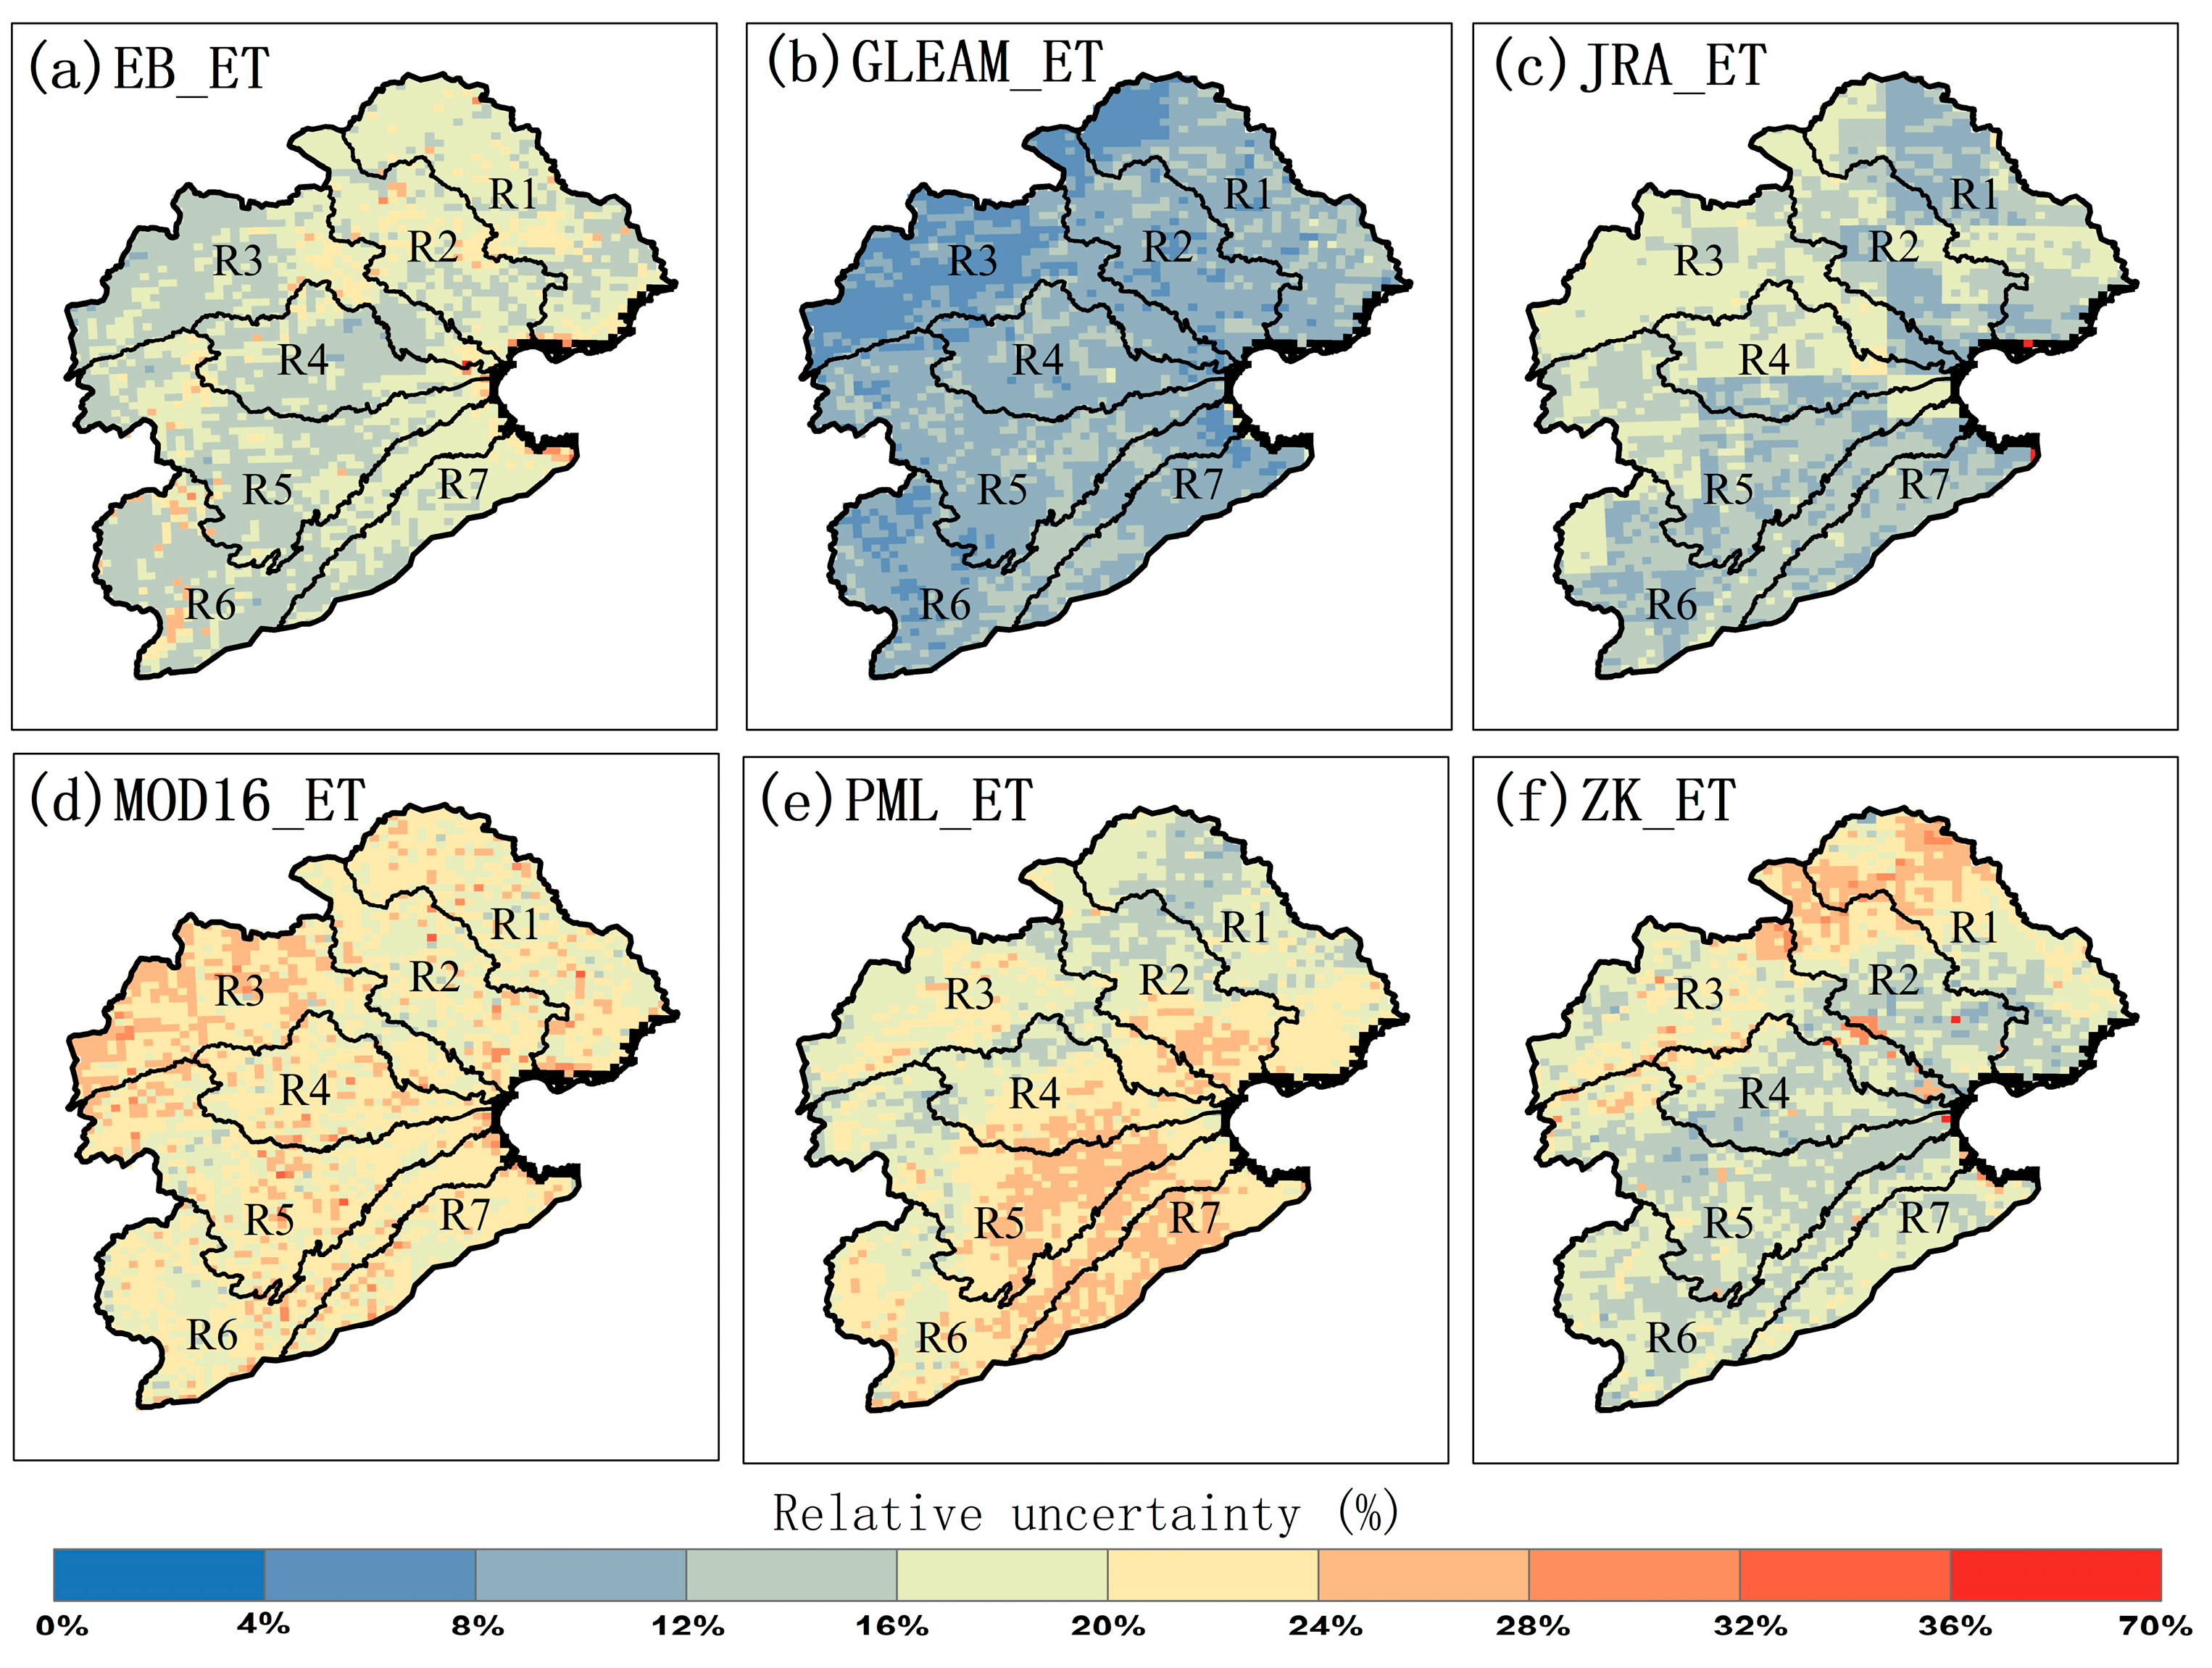
  • For the uncertainty analysis based on the TCH method, the average relative uncertainties of the GLEAM data were significantly lower than those of the other ET products. The relative uncertainties of the JRA_ET and ZK_ET were relatively high in the mountainous areas. The PML_ET had higher relative uncertainties in the non-mountainous areas. The performances of the EB_ET, GLEAM_ET, and MOD16_ET in the mountainous and non-mountainous areas were relatively equal.
Overall, among the seven products, GLEAM_ET shows the best consistency with the point EC observations, better consistency with the basin-scale benchmark data, and the lowest relative uncertainties. We thus recommend GLEAM_ET as the preferred choice for application among the seven products in the Haihe River Basin. This study offers useful information for product users to choose the appropriate ET product(s) to conduct their specific studies and also helps product developers to improve the accuracy of their ET products.

Author Contributions

Conceptualization, X.G., D.M., X.C. and X.L.; methodology, X.G., D.M., X.C. and X.L.; formal analysis, X.G.; writing—original draft preparation, X.G.; writing—review and editing, D.M., X.C. and X.L.; visualization, X.G.; and supervision, D.M. All authors have read and agreed to the published version of the manuscript.

Funding

This research was partially funded by the China Geological Survey, Ministry of Natural Resources of the People’s Republic of China-“investigation and monitoring of hydrogeology and water resources in northern Haihe River Basin and inland rivers of Inner Mongolia” (No. DD20221759) and “Hydrogeological Survey of Shaying River and Wo River Basin” (No. DD20190354), and the National Natural Science Foundation of China (41975009).

Data Availability Statement

Not applicable.

Acknowledgments

We thank Chen, X.L., Kobayashi, S., Martens, B., Miralles, D. G., Mu, Q., Zhang, Y., Yao, Y. J., and Zhang, K. for providing the long-term global remote sensing ET products (EB-ET, JRA55-ET, GLEAM, MOD16_ET, PML_V2, GLASS, and Zhangke). We thank NASA, the USGS, and the National Meteorological Information Center (NMIC) for providing the DEM, water storage, runoff, and precipitation data. Finally, we thank the Institute of Tibetan Plateau Research for providing the EC data. We gratefully thank the anonymous reviewers for their critical comments and constructive suggestions on the manuscript. We thank LetPub (www.letpub.com, accessed on 29 June 2022) for its linguistic assistance during the preparation of this manuscript.

Conflicts of Interest

The authors declare that they have no conflict of interest.

References

  1. Xu, T.; Guo, Z.; Xia, Y.; Ferreira, V.G.; Liu, S.; Wang, K.; Yao, Y.; Zhang, X.; Zhao, C. Evaluation of Twelve Evapotranspiration Products from Machine Learning, Remote Sensing and Land Surface Models over Conterminous United States. J. Hydrol. 2019, 578, 124105. [Google Scholar] [CrossRef]
  2. Jung, M.; Reichstein, M.; Ciais, P.; Seneviratne, S.I.; Sheffield, J.; Goulden, M.L.; Bonan, G.; Cescatti, A.; Chen, J.; De Jeu, R.; et al. Recent decline in the global land evapotranspiration trend due to limited moisture supply. Nature 2010, 467, 951–954. [Google Scholar] [CrossRef] [PubMed]
  3. Vinukollu, R.K.; Wood, E.F.; Ferguson, C.R.; Fisher, J.B. Global estimates of evapotranspiration for climate studies using multi-sensor remote sensing data: Evaluation of three process-based approaches. Remote Sens. Environ. 2011, 115, 801–823. [Google Scholar] [CrossRef]
  4. Miralles, D.G.; Holmes, T.R.H.; De Jeu, R.A.M.; Gash, J.H.; Meesters, A.G.C.A.; Dolman, A.J. Global land-surface evaporation estimated from satellite-based observations. Hydrol. Earth Syst. Sci. 2011, 15, 453–469. [Google Scholar] [CrossRef]
  5. Mu, Q.; Zhao, M.; Running, S.W. Improvements to a MODIS global terrestrial evapotranspiration algorithm. Remote Sens. Environ. 2011, 115, 1781–1800. [Google Scholar] [CrossRef]
  6. Zhang, Y.; Kong, D.; Gan, R.; Chiew, F.H.S.; McVicar, T.R.; Zhang, Q.; Yang, Y. Coupled estimation of 500 m and 8-day resolution global evapotranspiration and gross primary production in 2002–2017. Remote Sens. Environ. 2019, 222, 165–182. [Google Scholar] [CrossRef]
  7. Chen, X.; Su, Z.; Ma, Y.; Trigo, I.; Gentine, P. Remote Sensing of Global Daily Evapotranspiration based on a Surface Energy Balance Method and Reanalysis Data. J. Geophys. Res. Atmos. 2021, 126, e2020JD032873. [Google Scholar] [CrossRef]
  8. Su, Z. The surface energy balance system SEBS for estimation of turbulent heat fluxes. Hydrol. Earth Syst. Sci. 2002, 6, 85–100. [Google Scholar] [CrossRef]
  9. Kobayashi, S.; Ota, Y.; Harada, Y.; Ebita, A.; Moriya, M.; Onoda, H.; Onogi, K.; Kamahori, H.; Kobayashi, C.; Endo, H.; et al. The JRA-55 Reanalysis: General Specifications and Basic Characteristics. J. Meteorol. Soc. Jpn. Ser. II 2015, 93, 5–48. [Google Scholar] [CrossRef]
  10. Xu, J.Z.; Peng, S.Z.; Zhang, R.M.; Li, D.X. Neural network model for reference crop evapotranspiration prediction based on weather forecast. ASCE J. Hydraul. Div. 2006, 37, 376–379. [Google Scholar]
  11. Xu, S.; Wu, C.; Wang, L.; Gonsamo, A.; Shen, Y.; Niu, Z. A new satellite-based monthly precipitation downscaling algorithm with non-stationary relationship between precipitation and land surface characteristics. Remote Sens. Environ. 2015, 162, 119–140. [Google Scholar] [CrossRef]
  12. Baik, J.; Liaqat, U.W.; Choi, M. Assessment of satellite- and reanalysis-based evapotranspiration products with two blending approaches over the complex landscapes and climates of Australia. Agric. For. Meteorol. 2018, 263, 388–398. [Google Scholar] [CrossRef]
  13. Miralles, D.G.; Jiménez, C.; Jung, M.; Michel, D.; Ershadi, A.; McCabe, M.F.; Hirschi, M.; Martens, B.; Dolman, A.J.; Fisher, J.B.; et al. The WACMOS-ET project-part 2: Evaluation of global terrestrial evaporation data sets. Hydrol. Earth Syst. Sci. 2016, 20, 823–842. [Google Scholar] [CrossRef]
  14. Zhang, Y.; Jia, Z.Z.; Liu, S.M.; Xu, Z.W.; Xu, T.R.; Yao, Y.J.; Ma, Y.F.; Song, L.S.; Li, X.; Hu, X.; et al. Advances in validation of remotely sensed land surface evapotranspiration. J. Remote Sens. 2020, 24, 975–999. [Google Scholar]
  15. Velpuri, N.M.; Senay, G.B.; Singh, R.K.; Bohms, S.; Verdin, J.P. A comprehensive evaluation of two MODIS evapotranspiration products over the conterminous United States: Using point and gridded FLUXNET and water balance ET. Remote Sens. Environ. 2013, 139, 35–49. [Google Scholar] [CrossRef]
  16. Bai, J.; Jia, L.; Liu, S.M.; Xu, Z.; Hu, G.; Zhu, M.; Song, L. Characterizing the Footprint of Eddy Covariance System and Large Aperture Scintillometer Measurements to Validate Satellite-Based Surface Fluxes. IEEE Geosci. Remote Sens. Lett. 2015, 12, 943–947. [Google Scholar] [CrossRef]
  17. Soltani, M.; Koch, J.; Stisen, S. Using a Groundwater Adjusted Water Balance Approach and Copulas to Evaluate Spatial Patterns and Dependence Structures in Remote Sensing Derived Evapotranspiration Products. Remote Sens. 2021, 13, 853. [Google Scholar] [CrossRef]
  18. Liu, Y.; Yang, Z.; Lin, P.; Zheng, Z.; Xie, S. Comparison and evaluation of multiple land surface products for the water budget in the Yellow River Basin. J. Hydrol. 2019, 584, 124534. [Google Scholar] [CrossRef]
  19. Sriwongsitanon, N.; Suwawong, T.; Thianpopirug, S.; Williams, J.; Jia, L.; Bastiaanssen, W. Validation of seven global remotely sensed ET products across Thailand using water balance measurements and land use classifications. J. Hydrol. Reg. Stud. 2020, 30, 100709. [Google Scholar] [CrossRef]
  20. Weerasinghe, I.; Bastiaanssen, W.; Mul, M.; Jia, L.; Van Griensven, A. Can we trust remote sensing evapotranspiration products over Africa. Hydrol. Earth Syst. Sci. 2020, 24, 1565–1586. [Google Scholar] [CrossRef]
  21. Ruhoff, A.; de Andrade, B.C.; Laipelt, L.; Fleischmann, A.S.; Siqueira, V.A.; Moreira, A.A.; Barbedo, R.; Cyganski, G.L.; Fernandez, G.M.R.; Brêda, J.P.L.F.; et al. Global Evapotranspiration Datasets Assessment Using Water Balance in South America. Remote Sens. 2022, 14, 2526. [Google Scholar] [CrossRef]
  22. Xu, T.; Guo, Z.; Liu, S.; He, X.; Meng, Y.; Xu, Z.; Xia, Y.; Xiao, J.; Zhang, Y.; Ma, Y.; et al. Evaluating different machine learning methods for upscaling evapotranspiration from flux towers to the regional scale. J. Geophys. Res. Atmos. 2018, 123, 8674–8690. [Google Scholar] [CrossRef]
  23. Timmermans, W.J.; Kustas, W.P.; Anderson, M.C.; French, A.N. An intercomparison of the Surface Energy Balance Algorithm for Land (SEBAL) and the Two-Source Energy Balance (TSEB) modeling schemes. Remote Sens. Environ. 2007, 108, 369–384. [Google Scholar] [CrossRef]
  24. Khan, M.S.; Liaqat, U.W.; Baik, J.; Choi, M. Stand-alone uncertainty characterization of GLEAM, GLDAS and MOD16 evapotranspiration products using an extended triple collocation approach. Agric. For. Meteorol. 2018, 252, 256–268. [Google Scholar] [CrossRef]
  25. Long, D.; Longuevergne, L.; Scanlon, B.R. Uncertainty in evapotranspiration from land surface modeling, remote sensing, and GRACE satellites. Water Resour. Res. 2014, 50, 1131–1151. [Google Scholar] [CrossRef]
  26. Premoli, A.; Tavella, P. A revisited three-cornered hat method for estimating frequency standard instability. IEEE Trans. Instrum. Meas. 1993, 42, 7–13. [Google Scholar] [CrossRef]
  27. Tavella, P.; Premoli, A. Estimating the instabilities of N clocks by measuring differences of their readings. Metrologia 1994, 30, 479. [Google Scholar] [CrossRef]
  28. Koot, L.; Viron, O.D.; Dehant, V. Atmospheric angular momentum time-series: Characterization of their internal noise and creation of a combined series. J. Geod. 2006, 79, 663–674. [Google Scholar] [CrossRef]
  29. Yao, C.; Li, Q.; Luo, Z.; Wang, C.; Zhou, B. Uncertainties in GRACE-derived terrestrial water storage changes over mainland China based on a generalized three-cornered hat method. Chin. J. Geophys. 2019, 62, 883–897. [Google Scholar]
  30. Galindo, F.J.; Palacio, J. Post-processing ROA data clocks for optimal stability in the ensemble timescale. Metrologia 2003, 40, S237–S244. [Google Scholar] [CrossRef]
  31. Ferreira, V.G.; Montecino, H.D.C.; Yakubu, C.I.; Heck, B. Uncertainties of the gravity recovery and climate experiment time-variable gravity-field solutions based on three-cornered hat method. J. Appl. Remote Sens. 2016, 10, 015015. [Google Scholar] [CrossRef]
  32. Zhou, Y.J.; Liu, T.X.; Duan, L.M.; Wang, Y.X.; Li, X.; Li, M.Y. Estimation of evapotranspiration and its spatiotemporal characteristics in the upper reaches of the Xilin River Basin. Arid Zone Res. 2020, 37, 974–984. [Google Scholar]
  33. Liu, M.Q.; Hu, D.Y.; Yu, C.; Wang, S.S. Temporal and spatial change characteristics of growing season evapotranspiration and its cause analysis in Liaohe River delta wetland. Acta Ecol. Sin. 2020, 40, 701–710. [Google Scholar]
  34. Chao, L.; Zhang, K.; Wang, J.; Feng, J.; Zhang, M. A Comprehensive Evaluation of Five Evapotranspiration Datasets Based on Ground and GRACE Satellite Observations: Implications for Improvement of Evapotranspiration Retrieval Algorithm. Remote Sens. 2021, 13, 2414. [Google Scholar] [CrossRef]
  35. Wartenburger, R.; Seneviratne, S.I.; Hirschi, M.; Chang, J.F.; Ciais, P.; Deryng, D.; Elliott, J.; Folberth, C.; Gosling, S.N.; Gudmundsson, L.; et al. Evapotranspiration simulations in ISIMIP2a—Evaluation of spatio-temporal characteristics with a comprehensive ensemble of independent datasets. Environ. Res. Lett. 2018, 13, 075001. [Google Scholar] [CrossRef]
  36. Xie, X.H.; Wu, L.; Wei, J.M.; Lv, J.N.; Li, C.B. Applicability assessment of AET products in the alpine regions of Northwestern China. J. Lanzhou Univ. Med. Sci. 2021, 57, 437–446. [Google Scholar]
  37. Wu, J.; Lakshmi, V.; Wang, D.; Lin, P.; Pan, M.; Cai, X.; Wood, E.F.; Zeng, Z. The Reliability of Global Remote Sensing Evapotranspiration Products over Amazon. Remote Sens. 2020, 12, 2211. [Google Scholar] [CrossRef]
  38. Khan, M.S.; Baik, J.; Choi, M. Inter-comparison of evapotranspiration datasets over heterogeneous landscapes across Australia. Adv. Space Res. 2020, 66, 533–545. [Google Scholar] [CrossRef]
  39. Sörensson, A.A.; Ruscica, R. Intercomparison and uncertainty assessment of nine evapotranspiration estimates over South America. Water Resour. Res. 2018, 54, 2891–2908. [Google Scholar] [CrossRef]
  40. Panahi, D.M.; Tabas, S.S.; Kalantari, Z.; Ferreira, C.; Zahabiyoun, B. Spatio-temporal assessment of global gridded evapotranspiration datasets across Iran. Remote Sens. 2021, 13, 1816. [Google Scholar] [CrossRef]
  41. Peng, B.; Liu, X. Intercomparison and evaluation of three global high-resolution evapotranspiration products across China. J. Hydrol. 2018, 566, 743–755. [Google Scholar]
  42. Chen, X.; Liu, Y.; Sun, Z.; Zhang, J.; Guan, T.; Jin, J.; Liu, C.; Wang, G.; Bao, Z. Centennial Precipitation Characteristics Change in Haihe River Basin, China. Atmosphere 2022, 13, 1025. [Google Scholar] [CrossRef]
  43. Peng, C.J. Study on to division of Qingshan River Basin based on HEC-GeoHMS module. Water Resour. Inf. 2019, 3, 32–36. [Google Scholar]
  44. Chen, X.; Su, Z.; Ma, Y.; Yang, K.; Wen, J.; Zhang, Y. An Improvement of Roughness Height Parameterization of the Surface Energy Balance System (SEBS) over the Tibetan Plateau. J. Appl. Meteorol. Clim. 2013, 52, 607–622. [Google Scholar] [CrossRef]
  45. Martens, B.; Gonzalez Miralles, D.; Lievens, H.; Van Der Schalie, R.; De Jeu, R.A.M.; Fernández-Prieto, D.; Beck, H.E.; Dorigo, W.A.; Verhoest, N.E.C. GLEAM v3: Satellite-based land evaporation and root-zone soil moisture. Geosci. Model Dev. 2017, 10, 1903–1925. [Google Scholar] [CrossRef]
  46. Yao, Y.; Liang, S.; Li, X.; Hong, Y.; Fisher, J.; Zhang, N.; Chen, J.; Cheng, J.; Zhao, S.; Zhang, X.; et al. Bayesian multimodel estimation of global terrestrial latent heat flux from eddy covariance, meteorological, and satellite observations. J. Geophys. Res. Atmos. 2014, 119, 4521–4545. [Google Scholar] [CrossRef]
  47. Zhang, K.; Kimball, J.S.; Nemani, R.R.; Running, S.W. A continuous satellite-derived global record of land surface evapotranspiration from 1983 to 2006. Water Resour. Res. 2010, 46. [Google Scholar] [CrossRef]
  48. Wahr, J.; Swenson, S.; Zlotnicki, V.; Velicogna, I. Time-variable gravity from GRACE: First results. Geophys. Res. Lett. 2004, 31, L11501. [Google Scholar] [CrossRef] [Green Version]
  49. Hobeichi, S.; Abramowitz, G.; Evans, J.; Beck, H.E. Linear Optimal Runoff Aggregate (LORA): A global gridded synthesis runoff product. Hydrol. Earth Syst. Sci. 2019, 23, 851–870. [Google Scholar] [CrossRef]
  50. Ministry of Water Resources of the People’s Republic of China. China River Sediment Bulletin (2003) [R]; China Water Power Press: Beijing, China, 2004.
  51. Yao, Y.; Liang, S.; Li, X.; Zhang, Y.; Chen, J.; Jia, K.; Zhang, X.; Fisher, J.B.; Wang, X.; Zhang, L.; et al. Estimation of high-resolution terrestrial evapotranspiration from Landsat data using a simple Taylor skill fusion method. J. Hydrol. 2017, 553, 508–526. [Google Scholar] [CrossRef]
  52. Ferreira, V.G.; Gong, Z.; He, X.; Zhang, Y.; Andam-Akorful, S.A. Estimating total discharge in the yangtze river basin using satellite-based observations. Remote Sens. 2013, 5, 3415–3430. [Google Scholar] [CrossRef]
  53. da Silva, M.R.; de Carvalho, O.A.; Guimarães, R.F.; Trancoso Gomes, R.A.; Rosa Silva, C. Wheat planted area detection from the MODIS NDVI time series classification using the nearest neighbour method calculated by the Euclidean distance and cosine similarity measures. Geocarto Int. 2020, 35, 1400–1414. [Google Scholar] [CrossRef]
  54. Wang, G.; Li, S.J.; Zhang, X.G. Classification of Geomorphic Forms of Huaihe River Source Based on DEM. Bull. Soil Water Conserv. 2018, 38, 292–296. [Google Scholar]
  55. Sriwongsitanon, N.; Taesombat, W. Effects of land cover on runoff coefficient. J. Hydrol. 2011, 410, 226–238. [Google Scholar] [CrossRef]
  56. Chen, X.; Massman, W.J.; Su, Z. A column canopy-air turbulent diffusion method for different canopy structures. J. Geophys. Res. Atmos. 2019, 124, 488–506. [Google Scholar] [CrossRef]
  57. Yao, G.Z.; Wang, W.G.; Li, J.X. Evaluation of various remote sensing evapotranspiration products in the Han River Basin. China Rural. Water Resour. Hydropower 2018, 5, 103–108. [Google Scholar]
  58. Wang, S.; Tian, W.; Liu, X.M.; Liu, C.M. Comparisons of various evapotranspiration products in the Hanjiang River Basin. South-to-North Water Transf. Water Sci. Technol. 2018, 16, 1–9. [Google Scholar]
  59. Wang, J.Q.; Ye, J.S.; Fan, Y. Applicability evaluation of reference crop evapotranspiration calculation models in different climatic regions of China. Water Sav. Irrig. 2022, 47, 82–91. [Google Scholar]
  60. Yang, Z.L.; Li, Y.Z.; Bai, P.; Du, S.W.; Hao, Y.; Qian, C.; Li, C.F. Spatial-temporal Dynamics of Evapotranspiration and Its Components in Nine River Basins of China from 1980 to 2020 based on GLEAM-ET Products. J. Geo-Inf. Sci. 2022, 24, 889–901. [Google Scholar] [CrossRef]
Figure 1. Study area: locations of the seven sub-basins and five EC observation sites. The DEM was derived from the Shuttle Radar Topography Mission (SRTM) elevation model. The lakes and rivers are shown in the figure. The green dots show the locations of the eddy co-variance (EC) flux towers, which were used for the ET validation. The red triangles show the location of the hydrological observation stations, which were used for the LORA validation.
Remotesensing 14 04308 g001
Figure 2. Map of land cover types in 2010.
Remotesensing 14 04308 g002
Figure 3. Daily Latent Heat Flux (LE) data of Yucheng EC station in 2003–2006 (a) and 2007–2010 (b).
Remotesensing 14 04308 g003
Figure 4. Analytical plots of the ET product data versus the EC observations.
Remotesensing 14 04308 g004
Figure 5. The results of the ET validation conducted using the EC observations shown as a Taylor diagram. The units of the STD and RMSD’ values are W/m2.
Remotesensing 14 04308 g005
Figure 6. Verification results of LORA runoff data by observation data of the hydrological stations.
Remotesensing 14 04308 g006
Figure 7. Comparison of multi-year averaged monthly evapotranspiration of the WB_ET and the different products from 2003 to 2012.
Remotesensing 14 04308 g007
Figure 8. Analytical scatter plots of the monthly ET products for 2003–2012 against the WB_ET.
Remotesensing 14 04308 g008
Figure 9. Monthly ET products for 2003–2012, validated at the basin scale using the water balance—as shown in the Taylor diagram. The units of the STD and RMSD’ are mm/month.
Remotesensing 14 04308 g009
Figure 10. Relative uncertainties (unit: %) of the six ET products at the monthly-scale.
Remotesensing 14 04308 g010
Figure 11. TCH comparison results for each sub-basin in the different months. Blue represents low uncertainty, red represents high uncertainty. The color from blue to red represents the value of uncertainty from low to high. R1—Luan River Basin; R2—Chaobai River and Jiyun River Basin; R3—Inland River Basin; R4—Daqing River Basin; R5—Ziya River Basin; R6—South Canal Basin; R7—Tuhai River and Majia River Basin.
Remotesensing 14 04308 g011
Figure 12. Spatial distribution of mean annual ET from 2003 to 2012.
Remotesensing 14 04308 g012
Figure 13. Annual mean ET of different land-cover types in 2003-2012.
Remotesensing 14 04308 g013
Figure 14. Time-series of climatic factors and ET products at monthly scale from 2003 to 2012.
Remotesensing 14 04308 g014
Table 1. Information about ET product datasets evaluated in this study.
Product NameApproachTemporal
Resolution
Spatial ResolutionUnits
EB_ETSEBS, Re-analysis DataDaily, monthly0.05° × 0.05°mm
GLEAM_ETModified Priestley–Taylor, soil stress factorDaily, monthly0.25° × 0.25°mm
JRA_ETRe-analysis6 h, Monthly0.5612° × 0.56162°W/m2
MOD16_ETModified Penman–Monteith-Leuning, surface conductance model8 day, monthly1 km × 1 kmmm
PML_ETModified Penman–Monteith-Leuning8 day500 m × 500 mmm
ZK_ETModified Penman–Monteith for canopy and soil, Priestley-Taylor for waterMonthly0.1° × 0.1°mm
GLASS_ETIntegratedDaily every 8 days1 km × 1 kmW/m2
Table 2. Information about the flux towers used in this study.
EC Site NameLand CoverRegionPeriodLongitude
(°E)
Latitude
(°N)
YuchengWheat/cornShandong2003–2010116.5736.82
HuailaiCornHebei2013–2017115.7940.35
GuantaoWheat/corn, cottonHebei2008–2010115.1336.52
MiyunOrchardBeijing2008–2010117.3240.63
DaxingWheat/corn, orchardBeijing2008–2010116.4339.62
Table 3. Accuracy evaluation index values for the ET products.
IndexSeasonEB_ETGLEAM_ETJRA_ETMOD16_ETPML_ETZK_ET
RSpr.0.770.80.840.820.810.79
Sum.0.470.460.60.310.230.3
Fall0.760.880.910.890.890.87
Win.0.480.520.460.810.560.33
Yearly0.850.910.920.820.900.88
RMSD (mm)Spr.19.8316.3619.689.8227.313.11
Sum.14.5322.7227.7325.853.2830.22
Fall15.7612.0212.3613.8912.4714.77
Win.3.857.7412.8116.437.195.68
Yearly16.8814.317.5616.0128.2117.08
BIAS (mm)Spr.17.3213.2917.15−0.7322.848.42
Sum.9.6813.4420.368.8347.1220.82
Fall−8.562.364.16−3.495.078.87
Win.1.090.80.840.820.810.79
Yearly7.069.1413.724.3920.0211.16
RMSD’ (mm)Spr.9.669.549.659.7914.9510.05
Sum.10.8418.3218.8324.2424.8721.90
Fall13.2311.7911.6413.4411.3911.81
Win.3.697.7012.7816.417.145.62
Yearly15.3311.0010.9615.4019.8712.93
Table 4. Relative uncertainties (%) of the six products in mountainous and non-mountainous areas.
EB_ETGLEAM_ETJRA55_ETMOD16_ETPML_ETZK_ET
Non-mountainous area12.396.699.5117.4819.1512.04
Mountainous area12.815.5811.1817.1214.0314.89
Table 5. Cosine similarity between climatic factors and ET products.
EB_ETGLEAM_ETJRA_ETMOD16_ETPML_ETZK_ET
T0.9460.9400.9280.8520.9520.942
RN0.9760.9710.9750.8890.9630.937
P0.9320.9440.9380.9350.9500.948
Publisher’s Note: MDPI stays neutral with regard to jurisdictional claims in published maps and institutional affiliations.

