Article

RI-LPOH: Rotation-Invariant Local Phase Orientation Histogram for Multi-Modal Image Matching

1
Key Laboratory of Infrared System Detection and Imaging Technology, Shanghai Institute of Technical Physics, Chinese Academy of Sciences, Shanghai 200083, China
2
University of Chinese Academy of Sciences, Beijing 100049, China
3
Shanghai Institute of Technical Physics, Chinese Academy of Sciences, Shanghai 200083, China
*
Author to whom correspondence should be addressed.
Remote Sens. 2022, 14(17), 4228; https://doi.org/10.3390/rs14174228
Submission received: 8 July 2022 / Revised: 22 August 2022 / Accepted: 24 August 2022 / Published: 27 August 2022

Abstract

:
To better cope with the significant nonlinear radiation distortions (NRD) and severe rotational distortions in multi-modal remote sensing image matching, this paper introduces a rotationally robust feature-matching method based on the maximum index map (MIM) and 2D matrix, which is called the rotation-invariant local phase orientation histogram (RI-LPOH). First, feature detection is performed based on the weighted moment equation. Then, a 2D feature matrix based on MIM and a modified gradient location orientation histogram (GLOH) is constructed and rotational invariance is achieved by cyclic shifting in both the column and row directions without estimating the principal orientation separately. Each part of the sensed image’s 2D feature matrix is additionally flipped up and down to obtain another 2D matrix to avoid intensity inversion, and all the 2D matrices are concatenated by rows to form the final 1D feature vector. Finally, the RFM-LC algorithm is introduced to screen the obtained initial matches to reduce the negative effect caused by the high proportion of outliers. On this basis, the remaining outliers are removed by the fast sample consensus (FSC) method to obtain optimal transformation parameters. We validate the RI-LPOH method on six different types of multi-modal image datasets and compare it with four state-of-the-art methods: PSO-SIFT, MS-HLMO, CoFSM, and RI-ALGH. The experimental results show that our proposed method has obvious advantages in the success rate (SR) and the number of correct matches (NCM). Compared with PSO-SIFT, MS-HLMO, CoFSM, and RI-ALGH, the mean SR of RI-LPOH is 170.3%, 279.8%, 81.6%, and 25.4% higher, respectively, and the mean NCM is 13.27, 20.14, 1.39, and 2.42 times that of the aforementioned four methods.

Graphical Abstract

1. Introduction

With the increasing improvement of remote sensing systems in recent years, the joint application of multi-modal remote sensing images (MRSIs) has received more and more attention. As a basic step required for MRSIs processing, image matching is the process of aligning two or more images with overlapping ranges obtained under different imaging conditions [1], and its accuracy has an important impact on subsequent applications. However, due to different physical imaging mechanisms, MRSIs may have significant nonlinear radiation distortions (NRD) and geometric distortions, which pose a considerable challenge to image matching [2].
There are three main categories of current multi-modal image matching methods: area-based, feature-based, and learning-based methods [3]. With the continuous advancement of technology, learning-based matching algorithms have gradually matured and achieved some good results [4,5]. However, these algorithms require large datasets for training, have weak generalization ability, and require high computational resources, so their generality is limited.
The key of area-based matching methods is to establish reasonable and effective similarity measures. Traditional spatial domain methods include the sum of squared differences (SSD) [6], normalized cross-correlation (NCC), mutual information (MI) [7], and matching by tone mapping (MTM) [8], but such methods have high time complexity. Kuglin et al. developed a phase correlation algorithm based on frequency domain information by transforming SAR and optical satellite images into the frequency domain [9]. The OS-PC algorithm proposed by Xiang et al. combined robust feature representation with 3D phase correlation to make the algorithm more robust to radiometric and geometric differences [10]. To match images with significant NRD, Ye et al. proposed a novel HOPC descriptor [11] that uses phase congruency [12] features instead of the original gradient features to represent geometric structure or shape features of images with better matching results. To compensate for the drawback of sparse sampling of the HOPC algorithm, Ye et al. developed the channel feature of the orientated gradients (CFOG) algorithm for constructing descriptors pixel by pixel [13]. Fan et al. further proposed an angle-weighted orientation gradients (AWOG) descriptor that assigns gradient values to only the two most relevant orientations and uses 3D phase correlation as a similarity metric, which obviously improves the algorithm’s performance [14]. However, the area-based methods need to have good initial correspondence and can only handle simple translational transformations, so they have not been widely used.
Feature-based matching methods accomplish the final match by determining reliable feature correspondences between images. The scale-invariant feature transform (SIFT) is one of the most representative algorithms that has been widely used in optical image registration [15]. Since then, many improved versions of the SIFT algorithm have been developed. PCA-SIFT effectively simplifies the computation of the original algorithm by principal component analysis [16]. Speeded-up robust feature (SURF) is based on the Hessian matrix for feature detection and accelerates the operation through the integral graph technique [17]. Affine-SIFT makes SIFT affine-invariant by simulating two camera axis orientation parameters [18]. SAR-SIFT enhances robustness to speckle noise by introducing a new gradient definition [19]. Adaptive binning scale-invariant feature transform (AB-SIFT) adopts an adaptive binning strategy to compute the local feature descriptor, which greatly increases the distinguishability of the descriptor [20]. PSO-SIFT overcomes the intensity differences between remote sensing images by optimizing the gradient definition and improves the feature matching strategy by integrating the location, scale, and orientation information of each keypoint [21]. OS-SIFT utilizes the multiscale ratio of exponentially weighted averages and multiscale Sobel operators for gradient calculation. Then, keypoints are determined by performing a local maximum search in the scale space and considering the spatial relationship between the keypoints, which significantly enhances the robustness of the algorithm [22]. To further enhance robustness to NRD, Gao et al. proposed a feature-based multiscale histogram of local main orientation (MS-HLMO) registration algorithm for feature extraction on a partial main orientation map (PMOM) with a generalized gradient location, which is characterized by high intensity, rotation, and scale invariance [23]. Yao et al. constructed a new co-occurrence scale space based on the co-occurrence filter (CoF), optimized the image gradient, and established a position-optimized Euclidean distance function. The performance of the algorithm was found to be significantly improved [1].
The above algorithms all use gradients to describe features, which mainly utilize the spatial domain information of the image. Moreover, frequency domain information also plays an important role in feature-based matching algorithms. Fan et al. proposed a structural descriptor (PCSD) that combines nonlinear diffusion and phase congruency, built on phase congruency structural images in a grouping manner, effectively increasing the distinguishability of the descriptors [24]. Ye et al. proposed the use of MMPC-Lap for feature detection and the use of a local histogram of orientated phase congruency (LHOPC) to describe features, which can resist variations in illumination and contrast [25]. Radiation-invariant feature transform (RIFT) first introduced the concept of the maximum index map (MIM), which can resist a certain degree of NRD [26]. Yao et al. constructed the anisotropic weighted moment equation and extended the phase congruency model to design the histogram of absolute phase consistency gradients (HAPCG) [27] algorithm. Yu et al. proposed a novel descriptor called the rotation-invariant amplitudes of log-Gabor orientation histograms (RI-ALGH) by combining spatial feature detection with local frequency domain description [28]. Fan et al. proposed an effective coarse-to-fine matching method for multi-modal remote sensing images (3MRS), which further improves the matching accuracy of the algorithm by performing template matching through a 3D phase correlation strategy based on coarse matching using MIM [29]. Yang et al. constructed the improved local phase sharpness feature and phase orientation feature to replace the original gradient amplitude and orientation features, and established a local phase sharpness orientation (LPSO) descriptor by the log-polar coordinate system [30]. Although the above feature-based matching algorithms possess varying degrees of robustness to radiometric and geometric distortions, the performance of the algorithms degrades significantly when both are present, mainly facing two major difficulties [2]: (1) when performing feature description, the estimation of the principal orientation based on local image features is often time-consuming and error-prone, affecting the final matching results and (2) when performing feature matching, a large number of outliers are generated due to the presence of significant NRD.
Based on the above analysis, we propose a rotationally robust feature-matching method based on the MIM and 2D matrix, called the rotation-invariant local phase orientation histogram (RI-LPOH), which can better handle severe rotational and translational deformations in the presence of significant NRD. There are three main contributions provided by RI-LPOH:
  • We improved the gradient location orientation histogram (GLOH) structure and achieved robustness to rotation by cyclic shifting of the 2D feature matrix in both the column and row directions without estimating the principal orientation separately, which greatly improved the computational efficiency.
  • We additionally flipped each part of the sensed image’s 2D feature matrix up and down after the cyclic shift to further avoid intensity inversion and improve the success rate of matching.
  • By introducing the RFM-LC [31] algorithm to screen the obtained initial matches, we alleviated the adverse effects caused by the high proportion of outliers.
The rest of this paper is organized as follows: Section 2 describes the implementation of the proposed method in detail. Section 3 shows the experiments and results concerning RI-LPOH. Section 4 discusses several important aspects related to RI-LPOH. Section 5 summarizes the whole paper.
2. Materials and Methods

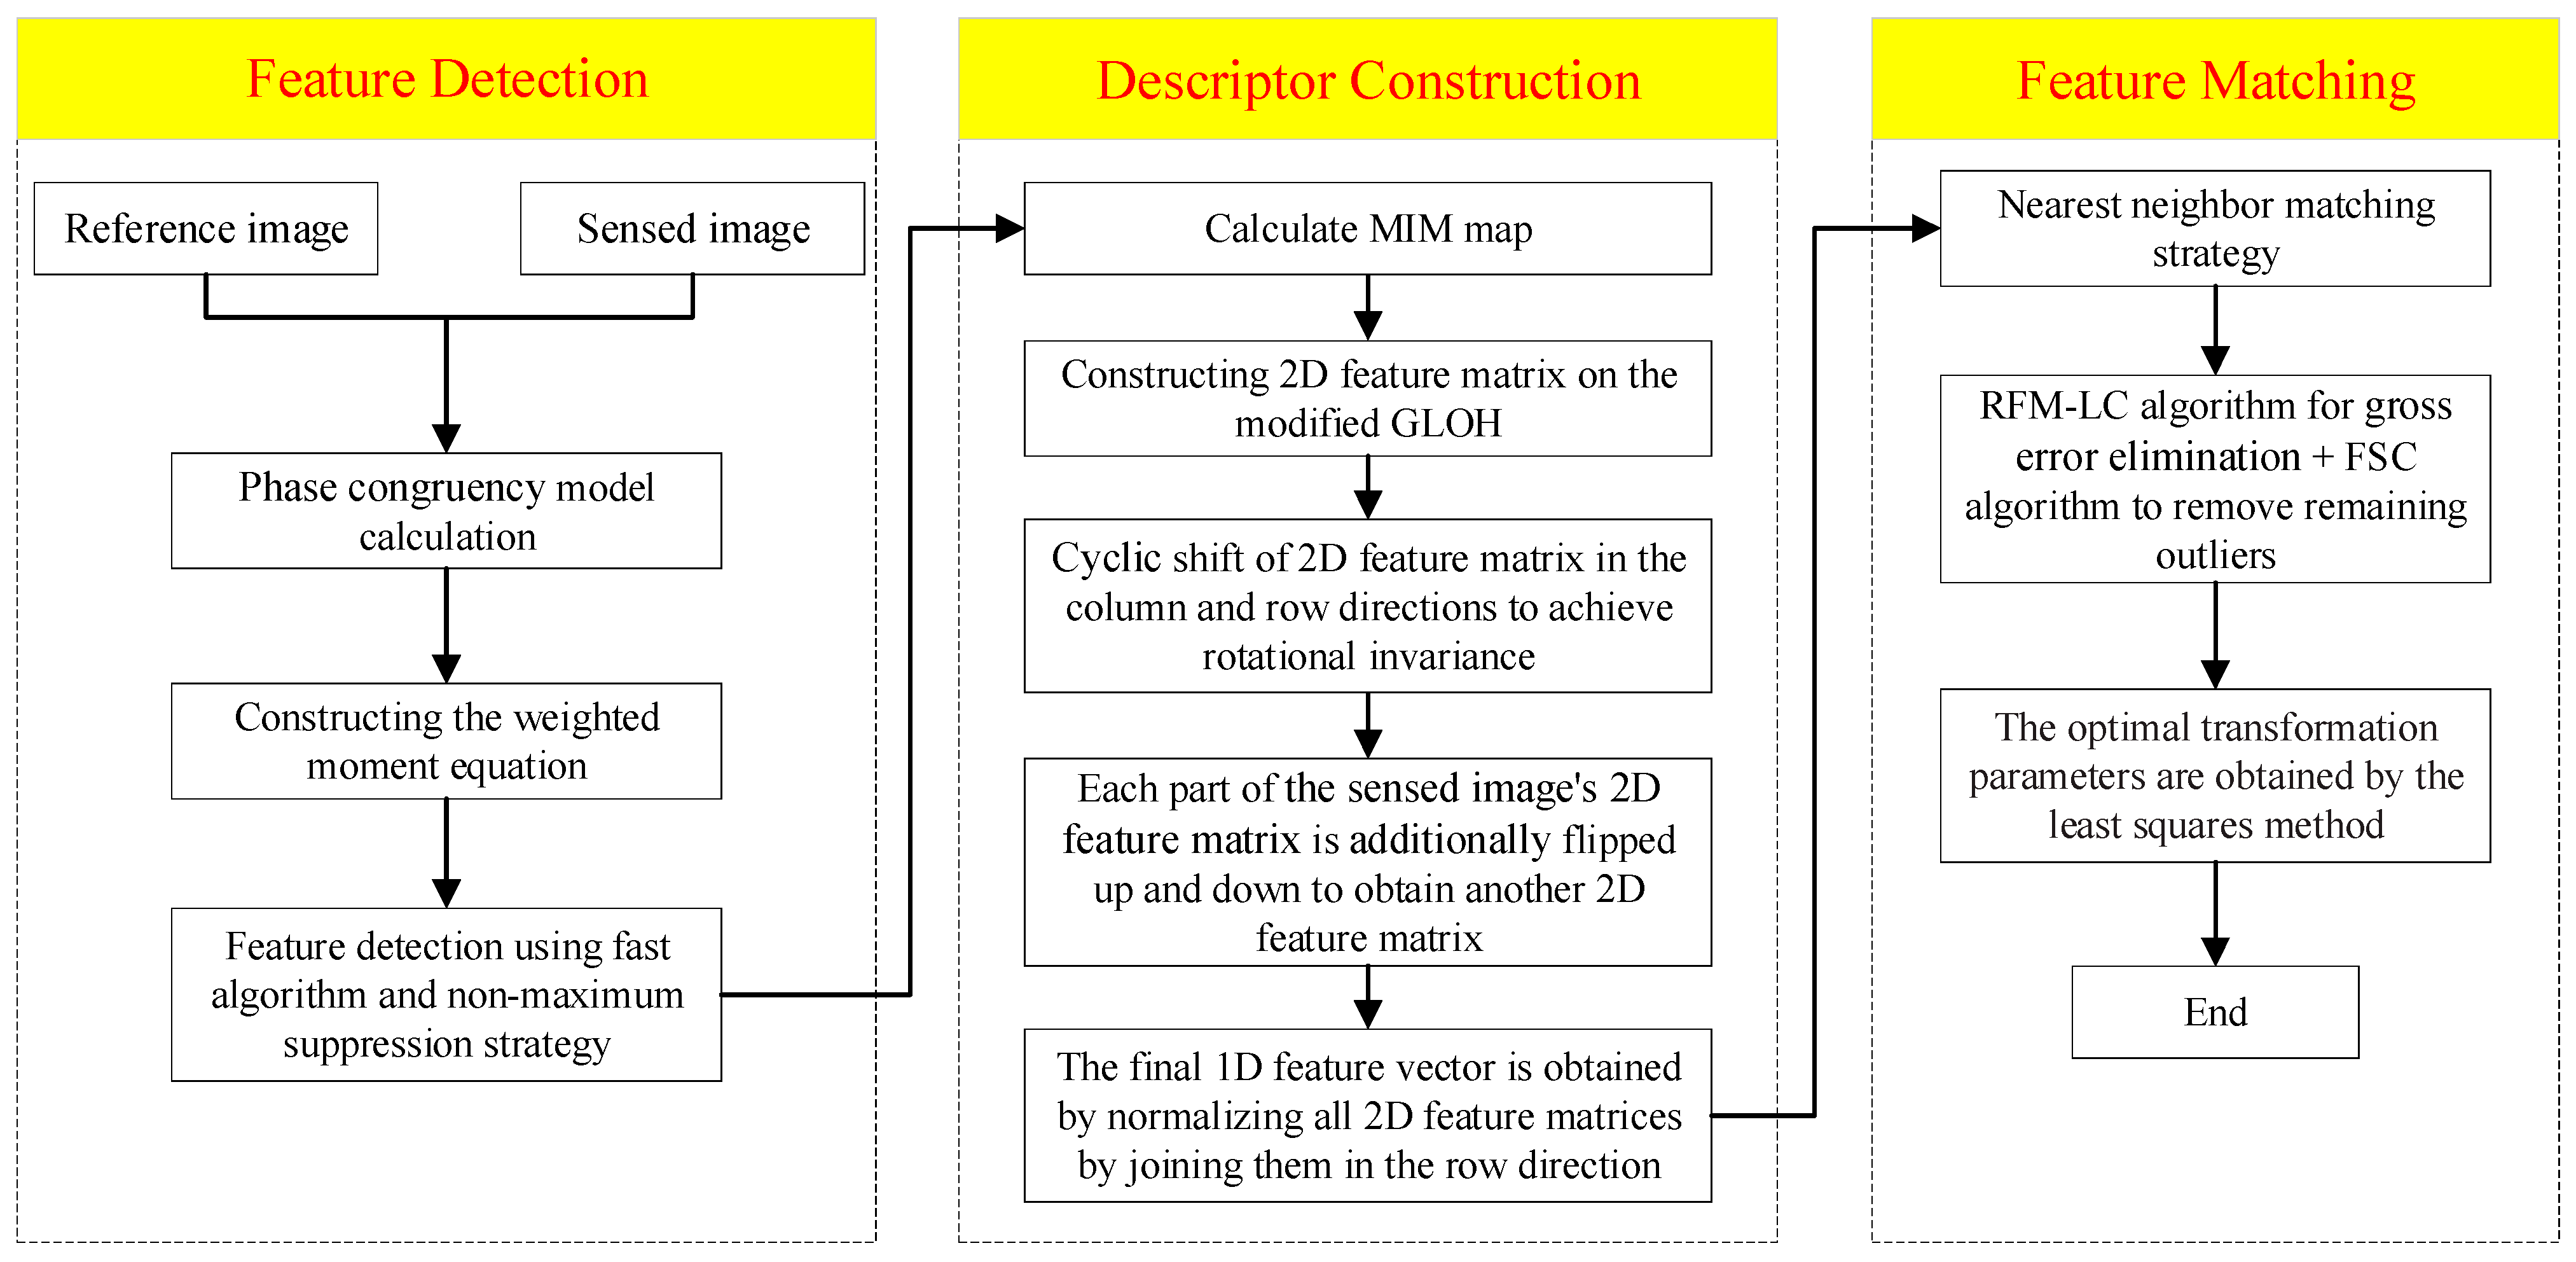
As shown in Figure 1, the proposed RI-LPOH matching method can be divided into the following three steps: (1) feature detection based on the weighted moment equation; (2) construction of rotationally robust feature descriptors based on the MIM and 2D matrix; and (3) feature matching and removal of outliers to obtain the optimal transformation parameters.

2.1. Feature Detection

Log-Gabor wavelets can better simulate the response of the human visual system to images, and the transfer function always does not contain DC components, which enhances the robustness to illumination. The definition of the 2D log-Gabor filter in the frequency domain is as follows [32]:
L G s , o ( f , θ ) = e x p ( ( l o g ( f / f 0 ) ) 2 ( l o g ( σ f / f 0 ) ) ) · e x p ( θ θ s , o 2 σ θ 2 ) ,
where f 0 and θ s , o represent the central frequency and orientation angle, respectively; σ f defines the filter bandwidth; σ θ defines the angular bandwidth; and subscripts s and o define the scale and orientation of the filter.
The spatial domain representation of the 2D log-Gabor filter can be obtained by an inverse Fourier transform [33]:
L G s , o ( x , y ) = L G s , o e v e n ( x , y ) + i · L G s , o o d d ( x , y ) ,
where the real part L G s , o e v e n ( x , y ) and the imaginary part L G s , o o d d ( x , y ) correspond to the even-symmetric and the odd-symmetric log-Gabor wavelets, respectively.
For a given image I ( x , y ) , the log-Gabor responses E s o ( x , y ) , O s o ( x , y ) in a specific orientation and scale can be obtained by convolution, leading to the derivation of the corresponding amplitude component A s o ( x , y ) and phase component Φ s o ( x , y ) [26].
{ E s o ( x , y ) = I ( x , y ) L G s , o e v e n ( x , y ) O s o ( x , y ) = I ( x , y ) L G s , o o d d ( x , y ) ,
A s o ( x , y ) = E s o ( x , y ) 2 + O s o ( x , y ) 2 ,
Φ s o ( x , y ) = arctan ( O s o ( x , y ) / E s o ( x , y ) ) .
Phase congruency (PC) has been shown to be more robust to intensity variations under different imaging modalities. Therefore, we used the 2D PC model to represent the structural features of the images, which can be calculated using components at multiple scales and orientations of the log-Gabor wavelet according to the following formula [12,34]:
P C ( x , y ) = s o ω o ( x , y ) A s o ( x , y ) Δ Φ s o ( x , y ) T s o A s o ( x , y ) + ϵ ,
where ω o ( x , y ) is the weighting factor based on frequency spread; Δ Φ s o ( x , y ) is the phase deviation at scale s and orientation o ; T compensates the noise; ϵ is a small constant to prevent division by zero; and is a truncation function that produces an output equal to the argument when the value is positive or zero otherwise.
According to Equation (6), we can obtain a PC map that accurately describes the edges [26]. However, it ignores the information that the phase congruency of each point in the image varies with the orientation. To solve this problem, Kovesi [34] proposed calculating the phase congruency for each direction independently. We then calculated the moments of these PC maps and observed the variation of the moments with the orientation as follows:
a = o ( P C ( θ o ) cos ( θ o ) ) 2 ,
b = 2 o ( P C ( θ o ) cos ( θ o ) ) ( P C ( θ o ) sin ( θ o ) ) ,
c = o ( P C ( θ o ) sin ( θ o ) ) 2 ,
ψ = 1 2 arctan ( b a c ) ,
M ψ = 1 2 ( c + a + b 2 + ( a c ) 2 ) ,
m ψ = 1 2 ( c + a b 2 + ( a c ) 2 ) ,
where P C ( θ o ) is the PC map at orientation θ o ; a , b , and c are the three intermediate quantities; ψ is the principal axis; and M ψ and m ψ are the maximum and minimum moments, respectively.
According to the moment analysis algorithm [35], a large value of M ψ indicates an edge feature point and a large value of m ψ means that point should be a corner. Therefore, we constructed a weighted moment equation based on the maximum and minimum moments, normalized it to obtain the feature map M w containing both edge and corner points, then used the fast algorithm [36] and non-maximum suppression strategy for feature detection, which is calculated as follows:
M w = t · M ψ + ( t 1 ) · m ψ ,
M w = M w min ( M w ) max ( M w ) min ( M w ) ,
where t is the weighting factor, and, in this paper, t is taken as 0.5.
Figure 2 gives the results of feature extraction on a pair of optical–optical images using the fast algorithm [36] and the non-maximum suppression strategy on the corresponding original image, minimum moment map m ψ , maximum moment map M ψ , and weighted moment map M w , respectively. From the figure, it can be seen that although the feature detection based on the original image can detect many feature points, the detection ability of the edges is weak and the distribution of feature points at the edges is less. The feature detection based on the minimum moment map is the worst, and the distribution of feature points is very sparse. The feature detection based on the maximum moment map is improved compared with the first two cases, and there is a greater distribution of feature points at the edges. The feature extraction based on the weighted moment map can obtain the best results, and a large number of reliable and well-distributed corner and edge feature points can be detected.

2.2. Descriptor Construction

After completing feature detection, the feature descriptors need to be constructed to enhance the distinguishability of the features. To enhance the robustness to NRD, Li et al. proposed the use of MIM instead of the PC map for descriptor construction. For orientation o , the log-Gabor layer A o ( x , y ) is obtained by summing the amplitudes of all N s scales, and the orientation index corresponding to the max ( A o ( x , y ) ) as the value at M I M ( x , y ) [26]:
A o ( x , y ) = s = 1 N s A s o ( x , y ) ,     o = 1 N o ,
M I M ( x , y ) = arg   max o ( A o ( x , y ) ) ,     o = 1 N o ,
where N s denotes the number of convolution scales of the log-Gabor filter, and N o represents the number of filter orientations.
To achieve robustness of the algorithm to rotation, Li et al. further determined the relationship between rotation and the MIM values and found that the starting layer of the convolution sequence was highly correlated with the rotation angle [26]. Therefore, the simplest traversal strategy was used, listing all possible cases to determine the best starting layer, and the dominant orientation method was used to achieve rotational invariance. Yu et al. improved on this by first using the magnitude and orientation of phase congruency to form an orientation histogram, selecting the highest peak in the histogram as the principal orientation, and any other peaks that were at least 80% of the height of the highest peak were selected as auxiliary orientations. Then, the corresponding MIM patch was rotated to the principal orientation. On this basis, the rotated MIM patch index of the reference image was cyclically shifted by r o u n d ( r o t a t i o n 180 ° / N o ) positions, and the rotated MIM patch index of the sensed image was cyclically shifted by c e i l ( r o t a t i o n 180 ° / N o ) and f l o o r ( r o t a t i o n 180 ° / N o ) positions, i.e., only one feature vector was constructed for each possible orientation of keypoints in the reference image, while two feature vectors were constructed for each possible orientation of keypoints in the sensed image [28].
Although the above processes can achieve a certain degree of rotation invariance, they are both very time consuming and have limited success rate. Therefore, we propose an improved descriptor construction method: on the modified GLOH, a 2D feature matrix is constructed, and rotational invariance is achieved by cyclic shifting of the 2D matrix in both the column and row directions. This process does not need to estimate the principal orientation separately, which greatly improves the computational efficiency.
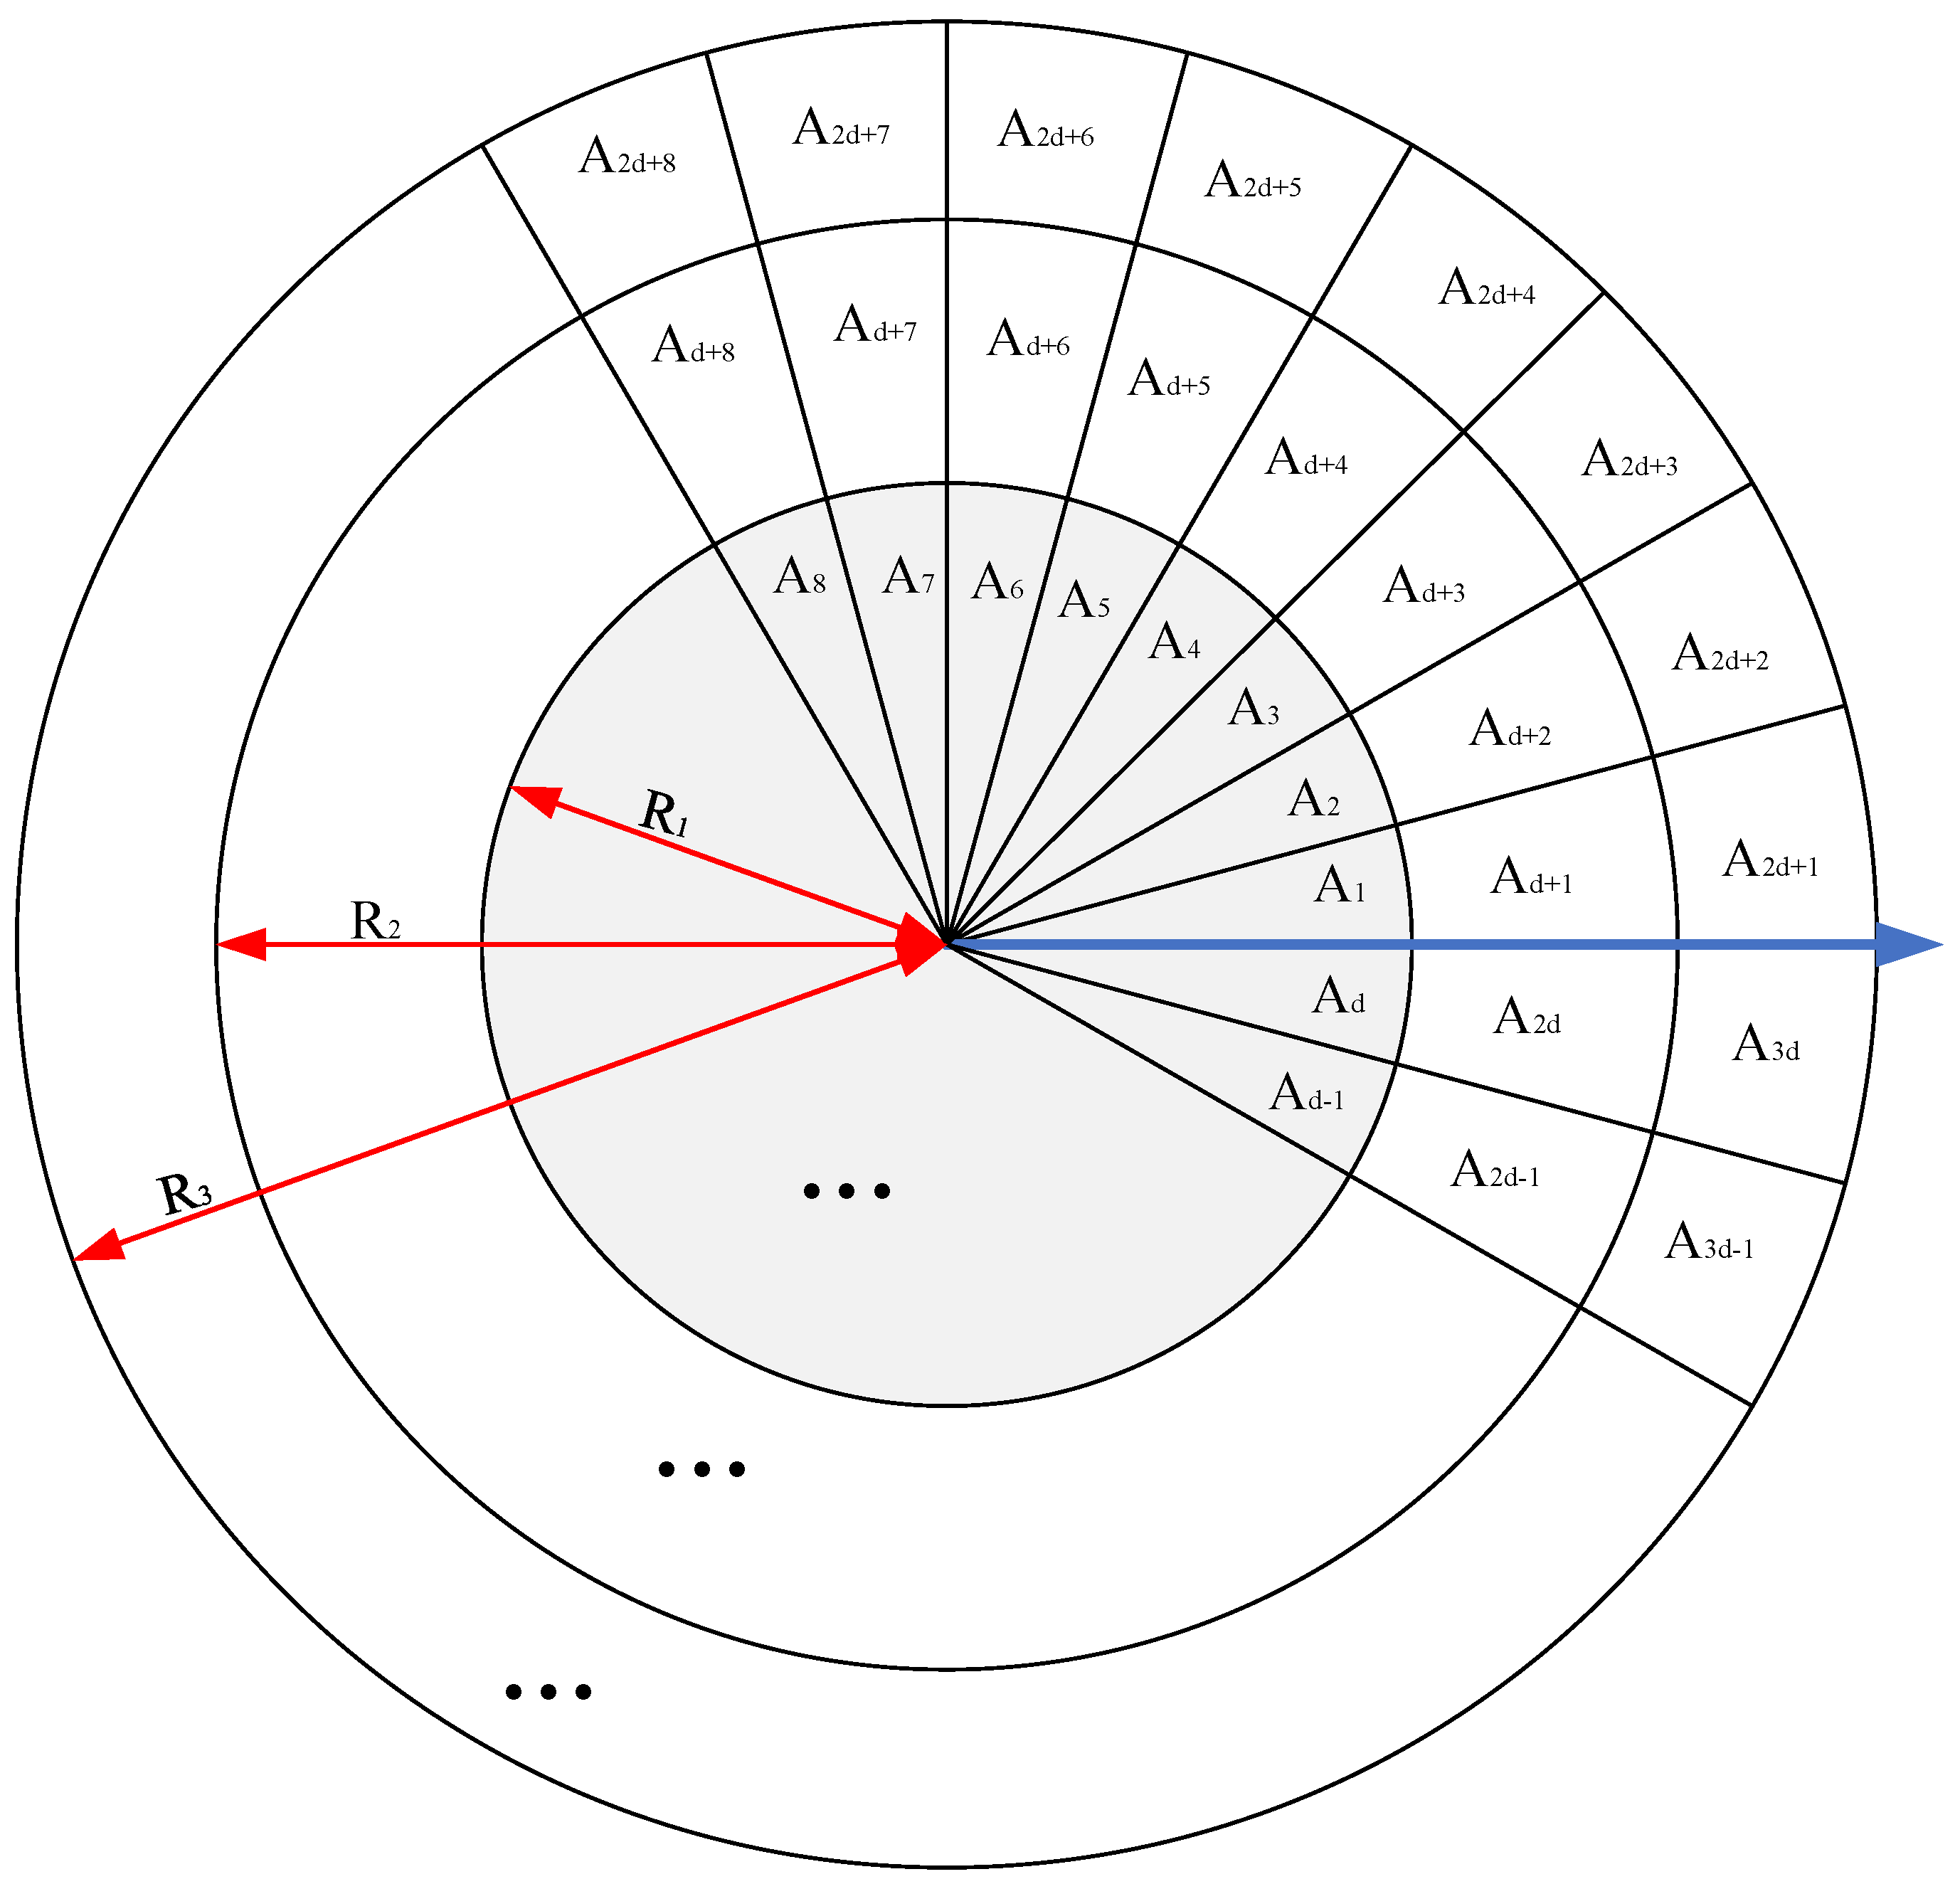
The common GLOH divides a circular neighborhood into 3 radial bins and 8 angular bins in the log-polar coordinate system [21]. However, the uniqueness of the GLOH structure is reduced because the inner circular bin is not radially divided [20]. Therefore, Yu et al. proposed also dividing the inner circular neighborhood into 8 bins [28]. However, the number of divided angular bins affects the characterization ability of the descriptors when dealing with different types of images. If the number of divided angular bins is too small, the character of feature points is not significant, and if the number of divisions is too large, the descriptor dimension will be too high, which increases the burden of redundant computation. Therefore, we propose a modified GLOH structure, as shown in Figure 3, where the number of angular bins is set as an unknown parameter d , which increases the flexibility and scalability of the algorithm. Considering that the number of pixels in each subregion should be approximately the same, the following relationship can be obtained:
π · R 1 2 = π · ( R 2 2 R 1 2 ) = π · ( R 3 2 R 2 2 ) .  
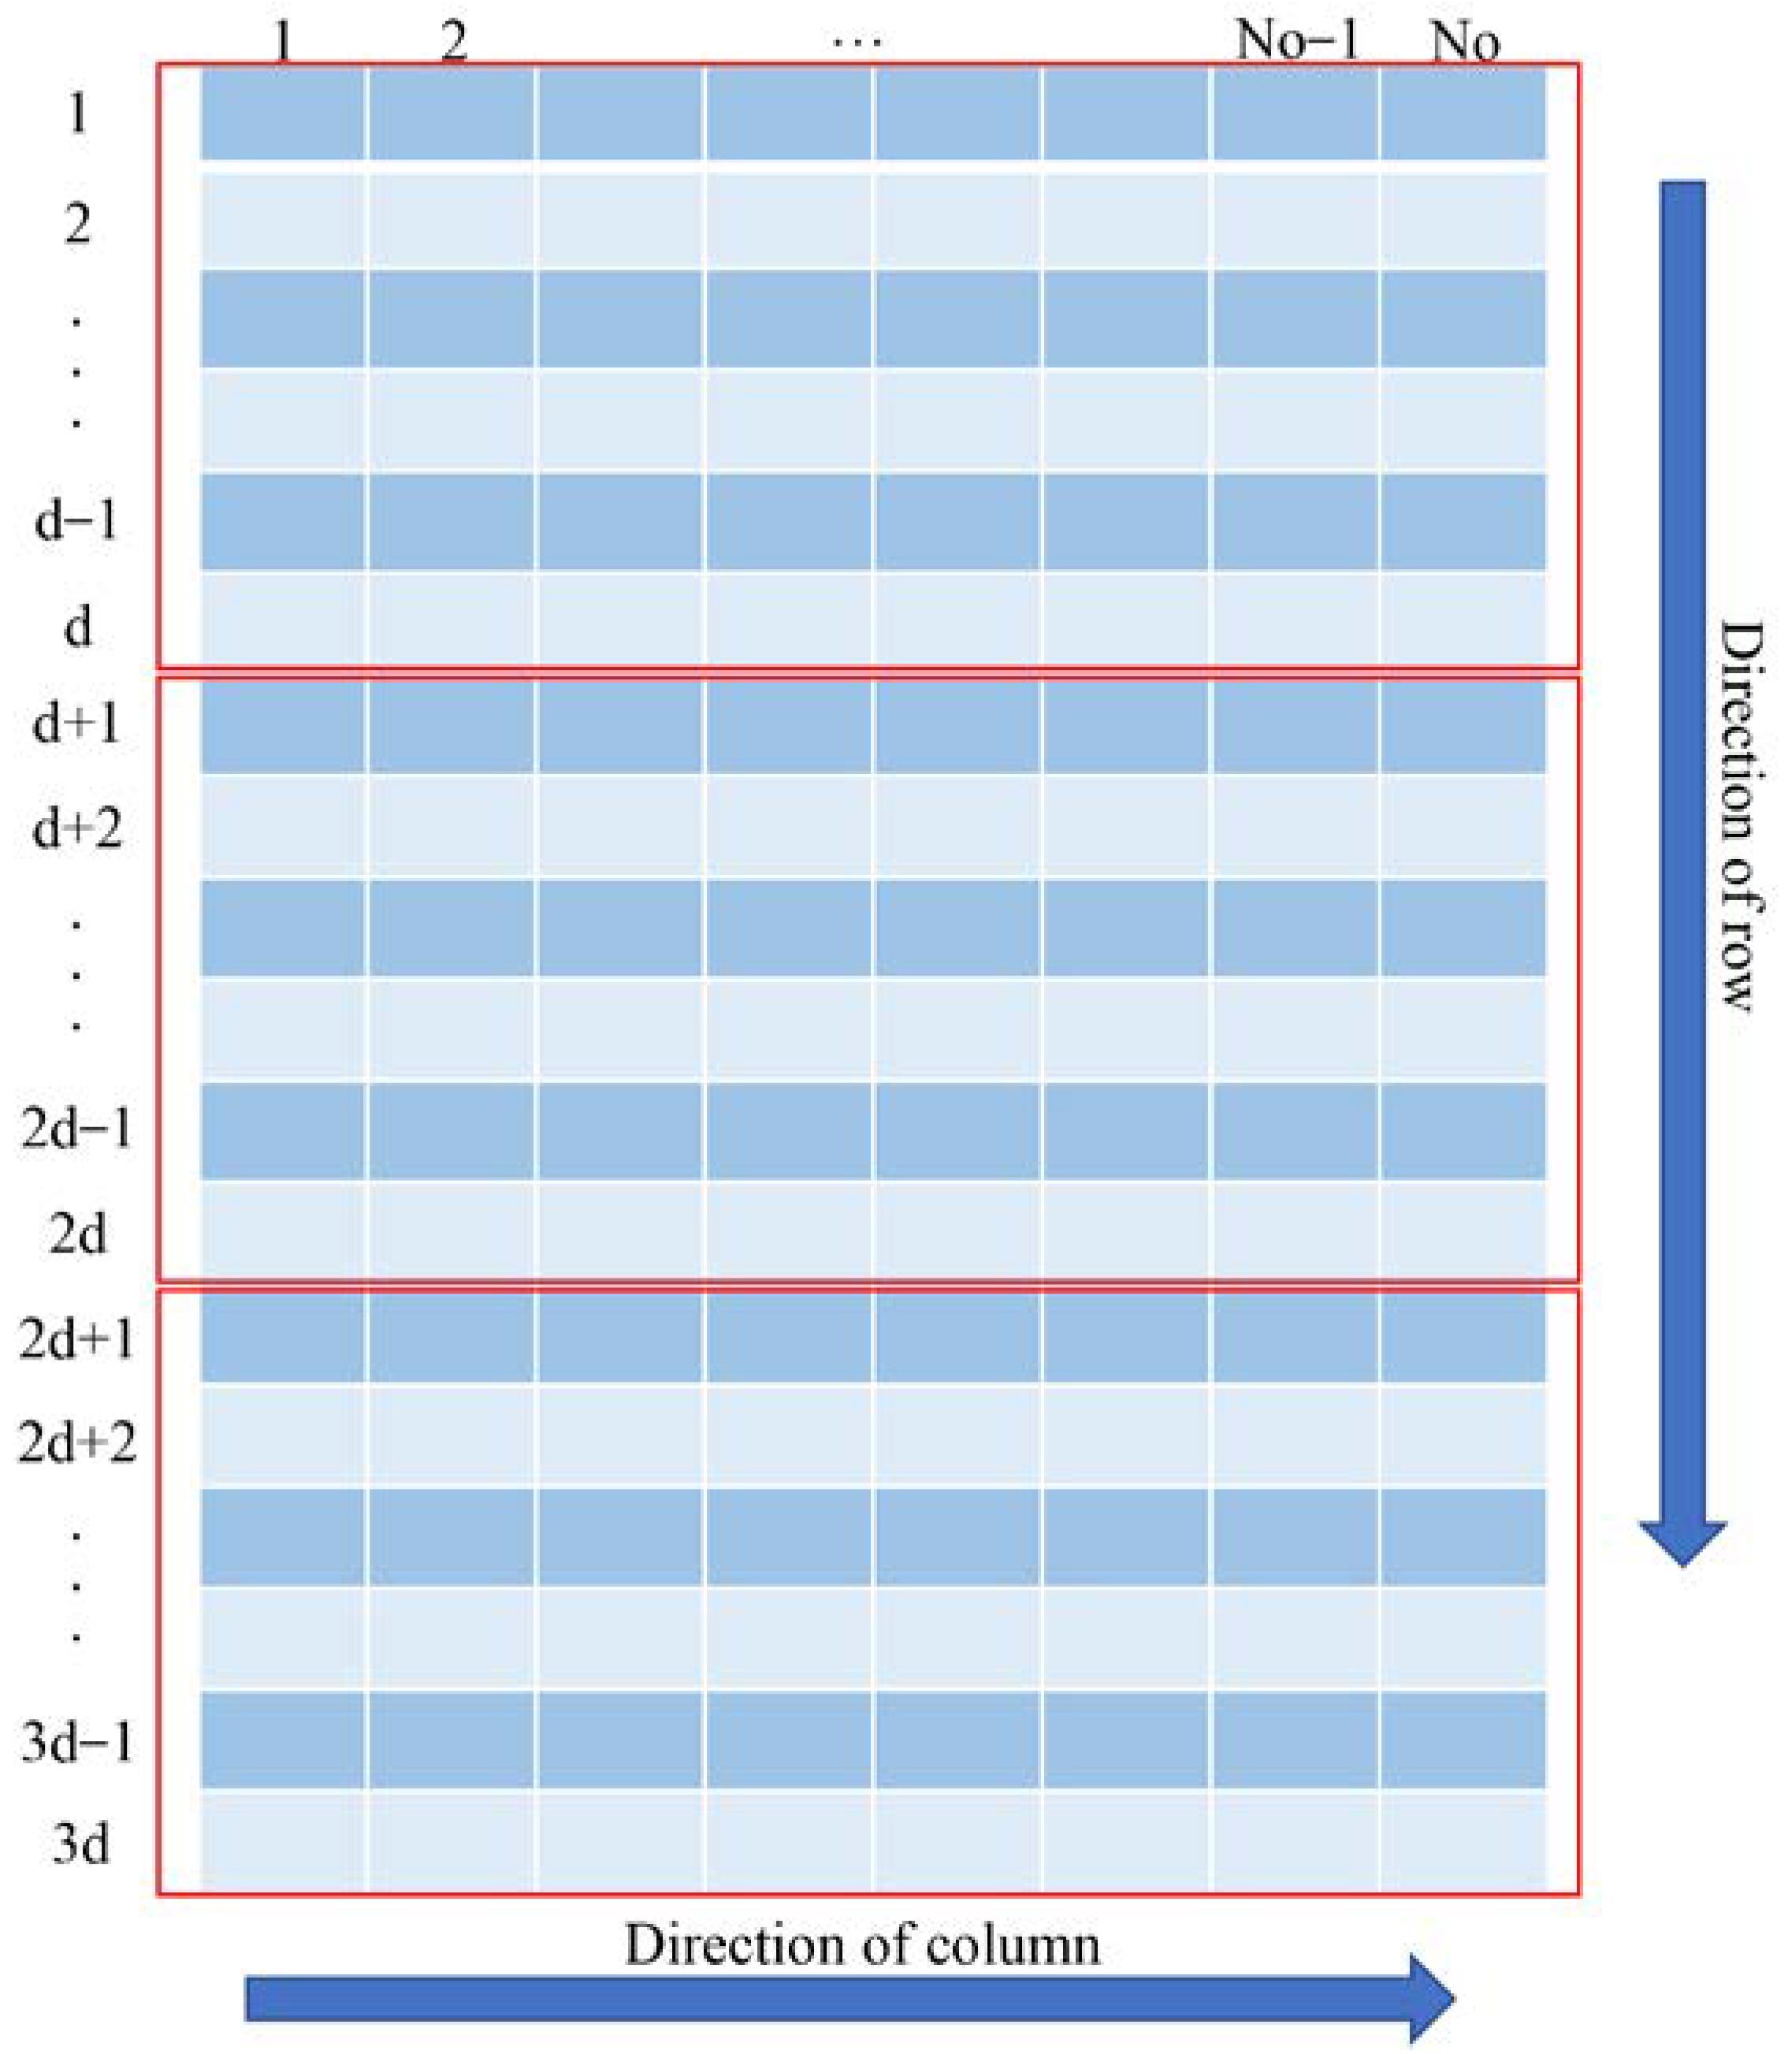
For each detected feature point, a local circular neighborhood with the feature point as the center and R as the radius is selected, subregions are divided according to the modified GLOH structure (i.e., R 3 = R ), and a distribution histogram with N o bins is created for each subregion, weighted by the PC value corresponding to Equation (6). All the histograms are connected to obtain a 2D matrix F 2 D of 3 d × N o , as shown in Figure 4. The row number of the matrix corresponds to the number of the subregion, and the column number of the matrix corresponds to the direction index of the MIM map.
To further achieve the rotation invariance of the algorithm, the distribution histogram of each orientation index within the whole local circular neighborhood is counted. The index corresponding to the highest peak in the histogram is selected as the principal index, and the indexes corresponding to any other peaks that are at least 80% of the height of the highest peak are selected as auxiliary indexes, which are grouped into the candidate index set D i r together with the principal index.
For each element d i r i in the candidate index set D i r , the 2D matrix F 2 D first cyclically shifts d i r i 1 positions in the column direction, then cyclically shifts in the row direction in three segments (i.e., the innermost circular bin, the second circular bin, and the outermost circular bin) to obtain the final 2D feature matrix F 2 D ¯ ; the process is as follows:
F 2 D = c i r c s h i f t ( F 2 D ,   [ 0 , ( d i r i 1 ) ] ) ,
F 2 D ¯ = [ c i r c s h i f t ( F 2 D ( 1 : d , : ) , [   l o c , 0 ] ) c i r c s h i f t ( F 2 D ( d + 1 : 2 d , : ) ,   [   l o c , 0 ] ) c i r c s h i f t ( F 2 D ( 2 d + 1 : 3 d , : ) ,   [   l o c , 0 ] ) ] ,
l o c = ( d i r i 1 ) · ( 180 ° / N o ) 360 ° / d ,
where c i r c s h i f t denotes the cyclic shift, and l o c denotes the number of cyclic shift positions of the 2D matrix in the row direction. In order to achieve the same angular resolution for the cyclic shift in the column and row directions, we took d = 2 N o , so Equation (20) can be rewritten as:
l o c = d i r i 1 ,
To avoid the effect of intensity inversion, we additionally performed the following step on the sensed image: each part of the 2D feature matrix F 2 D ¯ (i.e., rows 1 to d corresponding to the innermost circular bin, rows d + 1 to 2d corresponding to the second circular bin, and rows 2d + 1 to 3d corresponding to the outermost circular bin) was flipped up and down, as shown in Figure 5, to form another 2D feature matrix F 2 D f ¯ .
The 2D feature matrices F 2 D ¯ , F 2 D f ¯ were connected in the row direction and then normalized to obtain the final 1D feature vectors, which have dimension 6 N o 2 . For each candidate index element in the reference image, we constructed only one feature vector, while for each candidate index element in the sensed image, two feature vectors were constructed.

2.3. Feature Matching

After obtaining the descriptor, the nearest neighbor matching strategy was used to obtain the initial correspondences. However, due to the high proportion of outliers, we introduced the RFM-LC algorithm proposed by Chen et al. for gross error elimination. First, the spatial neighborhood consistency of the feature points was used to remove the outliers with obvious errors by means of the multi-K-nearest neighbor strategy for preliminary filtering; then, the motion characteristics of the feature points were considered, including numerical deviation, length ratio deviation, and angle deviation to screen outliers. The total deviation strategy and quantization strategy were introduced to eliminate outliers by minimizing the cost function C [31]:
C ( I ; S , α ) = i I j I ( s i + α ( N | I | ) ) ,
where I denotes an unknown inliers set; N is the number of putative feature correspondences; s i is the quantized total deviation; and | · | represents the cardinality of the set. The first term in the equation is the penalty term for matches that do not maintain the local consensus; the second term controls the number of outliers; and the parameter α > 0 is used to balance the weights of these two terms. More details about the RFM-LC algorithm can be found in [31].
To avoid the inliers being deleted by mistake, we set α to 0.6, and the rest of the parameter settings were kept consistent with the original paper. On this basis, the fast sample consensus (FSC) [37] method was used to eliminate the remaining outliers, and the least squares method was used to obtain the optimal transformation parameters.

3. Experiments and Results

In order to verify the effectiveness of the proposed method, we compared the proposed RI-LPOH method with four state-of-the-art methods: PSO-SIFT [21], MS-HLMO [23], CoFSM [1], and RI-ALGH [28], where the codes of the first three methods are provided by the authors and RI-ALGH is our replication of the paper [28]. For a fair comparison, the parameters of the first three methods were taken according to the original papers. For RI-ALGH, the scale invariance in the original paper was not considered in the implementation, the feature extraction algorithm was consistent with that in this paper, and the relevant parameter settings were also the same as those in this paper.

3.1. Dataset Introduction

We chose the CoFSM dataset [1] provided by Yao et al. for our experiments, which contains images of six modalities (multi temporal–optical, optical–infrared, optical–depth, optical–map, optical–SAR, and day–night) and can be downloaded from https://skyearth.org/publication/project/CoFSM (accessed on 20 April 2022). Each type consists of 10 sets of images, each with approximately 10 to 30 high-precision correspondences manually determined by the provider, which can be used to estimate the transformation model H for the image pairs. Due to different illumination conditions, imaging times, and sensor differences, there are significant NRD and slight geometric differences between these image pairs, mainly translational distortions. To demonstrate that our method can better handle the severe rotational and translational distortions in the presence of significant NRD, we applied rotational distortions in the range [ π 2 , π 2 ] manually to each image pair. To avoid imposing rotation angles that are exactly integer multiples of 180 ° N o , we generated eight different rotational distortions on the basis of each original sensed image at π 7 intervals: [ π 2 , 5 π 14 , 3 π 14 , π 14 , π 14 , 3 π 14 , 5 π 14 , π 2 ] . Thus, for each method, we validated it on a total of 6 × 10 × 8 pairs of images. Combining the above transformation model H and the rotation angle, the truth transformation model H t r u t h was obtained for each image pair.
For quantitative evaluation, we chose the number of correct matches (NCM), success rate (SR), root mean square error (RMSE), and running time (RT) to evaluate the performance of each method. The matches with residual errors less than 3 pixels calculated using H t r u t h were defined as the correct matches. SR is the ratio between the number of successfully matched image pairs and the total number of image pairs. The match was considered successful if the NCM of the image pair was not less than 10 [38]. A large SR value indicates that the method has good applicability. The RMSE is defined as follows:
R M S E = 1 N C M i = 1 N C M ( y i H t r u t h ( x i ) ) 2 ,
where { ( x i , y i ) } 1 N C M are correct matches. The smaller RMSE indicates that the method has high matching accuracy.

3.2. Parameter Settings

In addition to the parameters already explained in the paper, there are three other parameters to be discussed, namely, N s , N o , and R . Parameter N s denotes the number of convolution scales of the log-Gabor filter, and since it does not have much influence on the method, we took the default value of 4 here. N o is the number of filter orientations. Generally speaking, the larger the N o , the more information the constructed MIM contains, and the more complex the computation. Additionally, d = 2 N o , the value of N o affects the dimensionality of the feature vector and thus the computational efficiency. Parameter R represents the radius of the local circular neighborhood. If the radius is too small, the information contained is not enough to reflect the uniqueness of the features; if the radius is too large, the performance is easily affected by the local geometric distortion. Therefore, it is very important to choose a suitable parameter. We randomly selected a pair of day–night images for the experiments, and the results of the SR, NCM, RMSE, and RT with different parameters are shown in Table 1, Table 2, Table 3 and Table 4. It should be noted that when calculating the mean values of RMSE and RT, only the cases that were judged to be successful matches, i.e., the NCM ≥ 10, were considered (the following analyses are all the same).
With the premise of ensuring a higher SR, we combined the results of the NCM, RMSE, and RT, then set the parameters to N o = 10 and R = 48 .

3.3. Performance Evaluation

3.3.1. Qualitative Comparisons

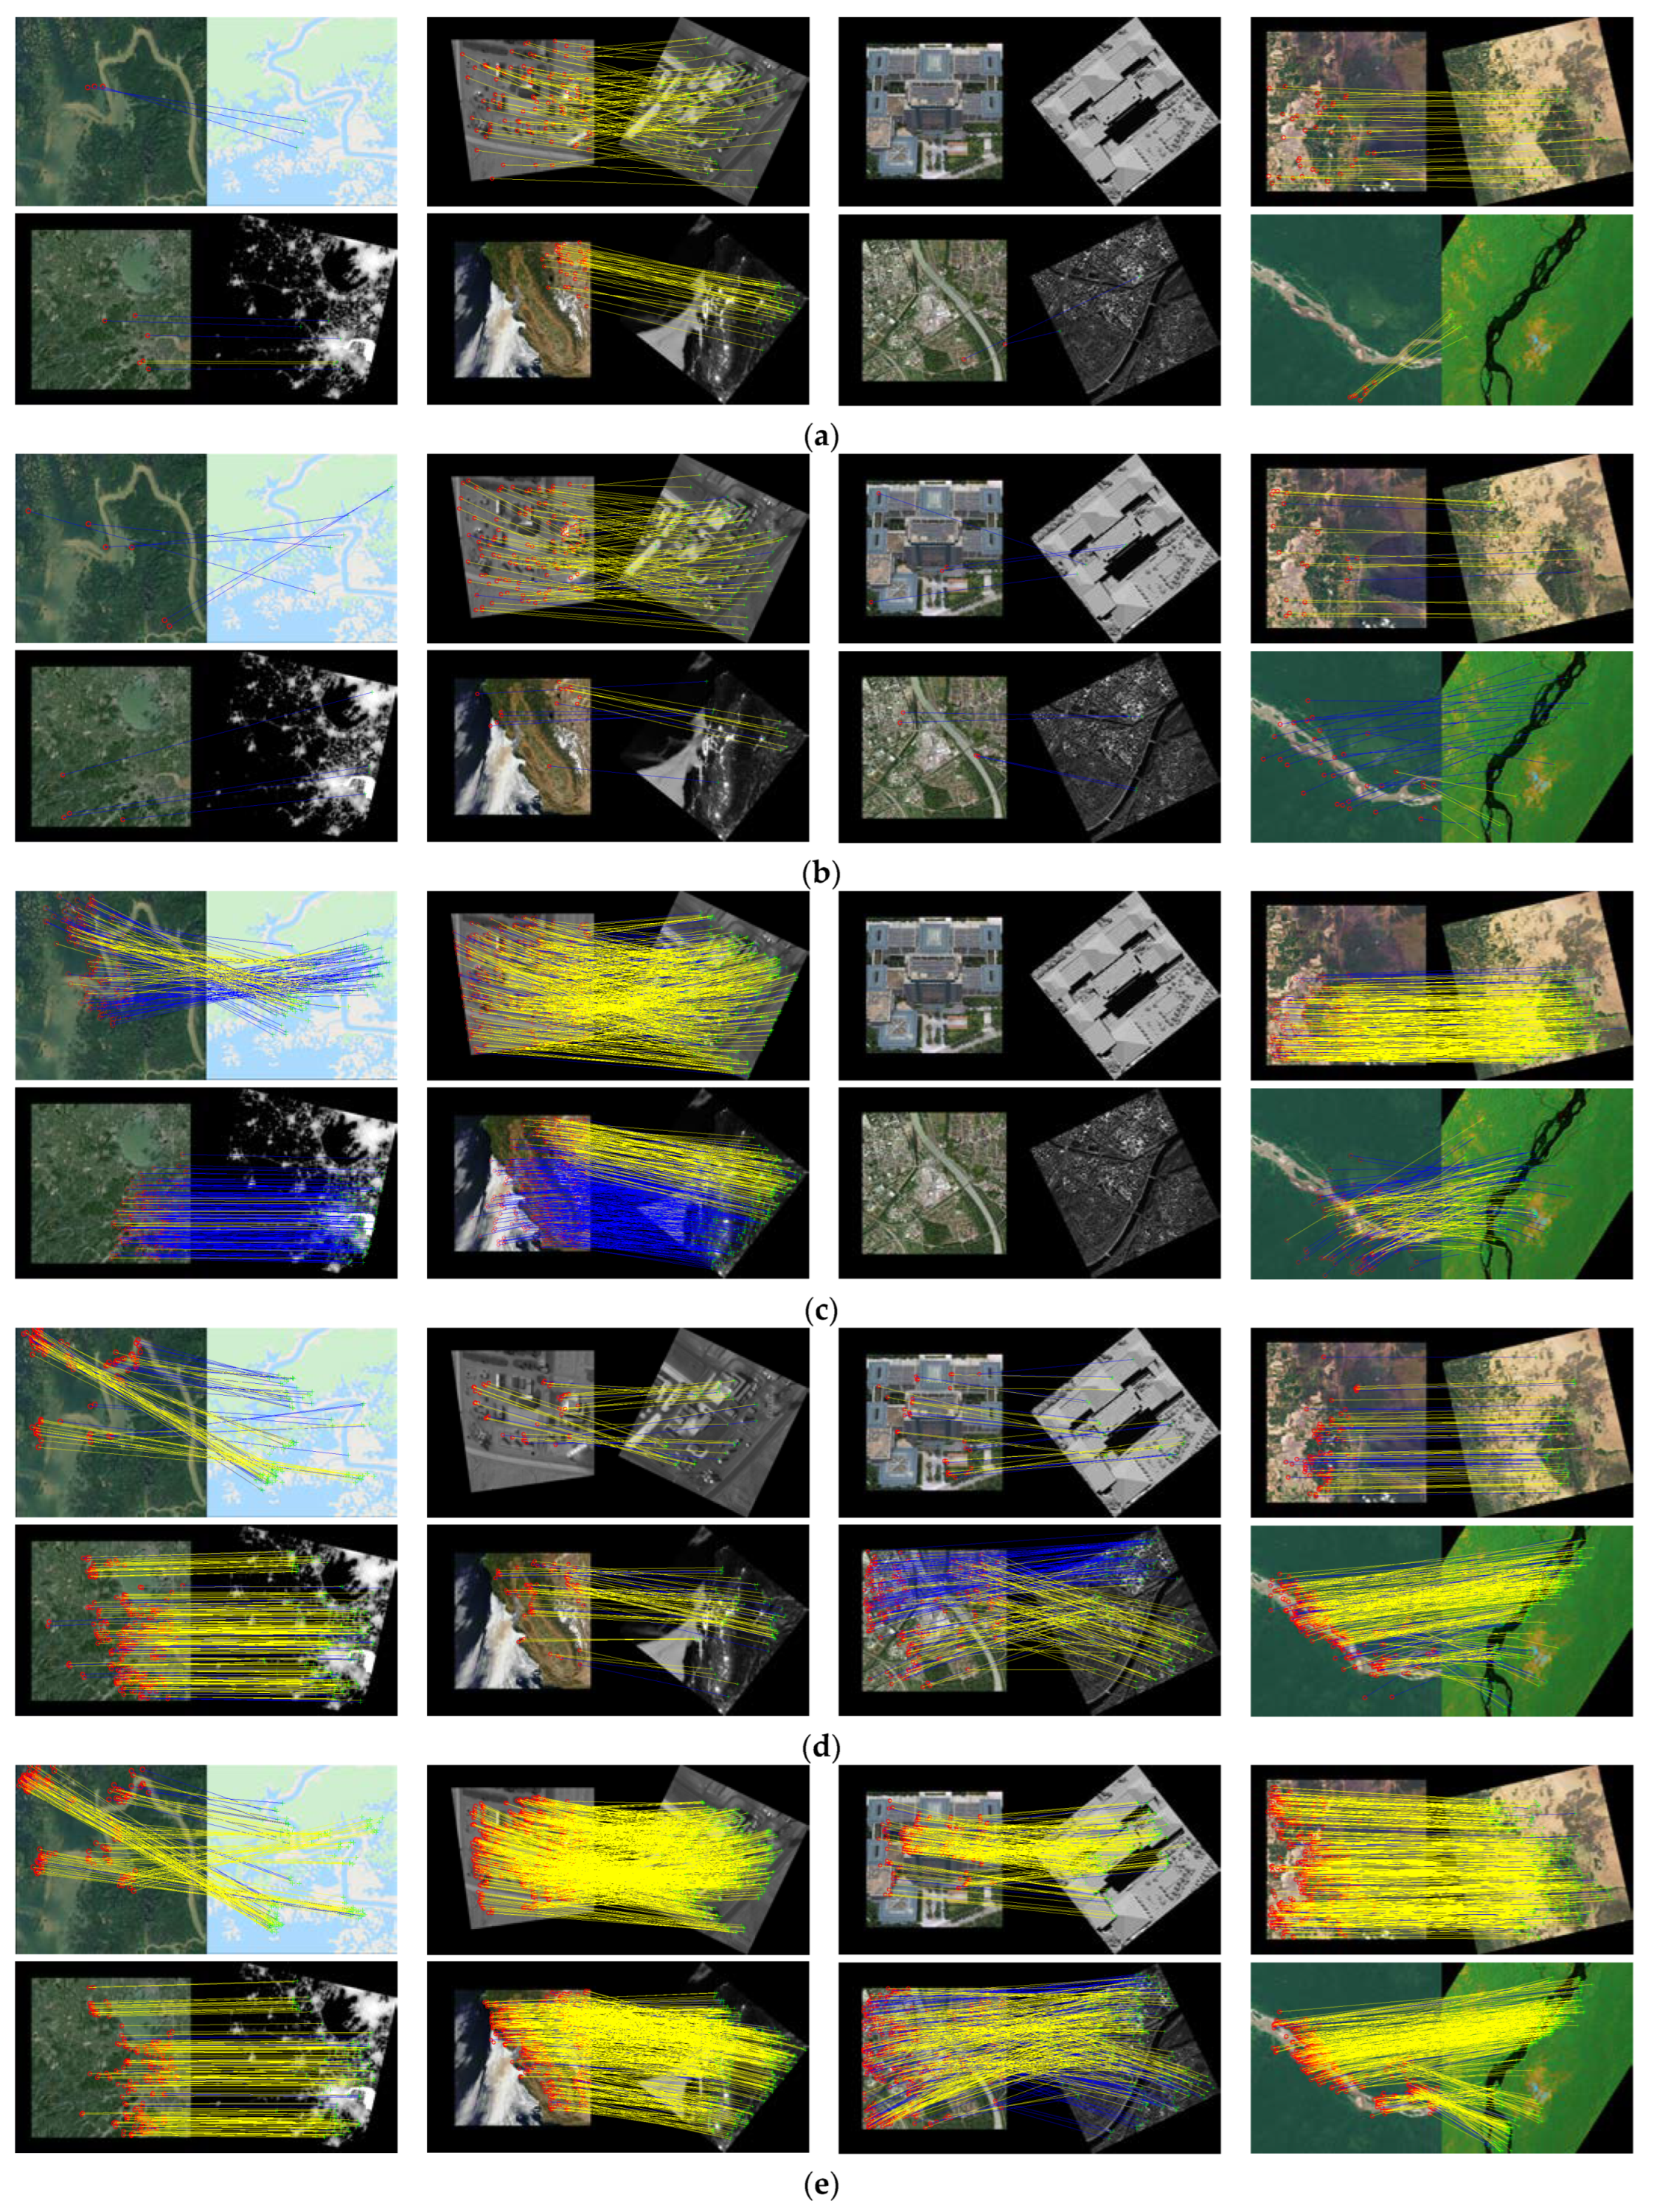
At least one pair of images was randomly selected from each multi-modal dataset and rotational deformations in the range [ π 2 , π 2 ] were applied. Due to the different time phases or imaging mechanisms, significant NRD was found in these image pairs, and the results processed by each method are shown in Figure 6.
As can be seen throughout Figure 6, PSO-SIFT and MS-HLMO detected the least number of correct matches, followed by CoFSM and RI-ALGH, and our proposed method detected the highest number of correct matches. For both pairs of optical–depth ( 3 π 14 ) and optical–SAR ( 5 π 14 ) images, only RI-ALGH and our proposed method matched successfully. Analytically, PSO-SIFT, MS-HLMO, and CoFSM all use the optimized gradient information for feature description, which mainly utilizes the spatial domain information of the image. Among them, PSO-SIFT uses the Sobel operator to calculate the second-order gradient based on the Gaussian scale space [21]; MS-HLMO introduces the average squared gradient (ASG) to improve the original gradient [23]; and CoFSM optimizes the gradient based on the co-occurrence scale space using the low-pass Butterworth filter and the Sobel operator [1]. Although all these improvements increased the robustness of the method to NRD to varying degrees, the matching success rate was still limited in the presence of both NRD and geometric distortion. RI-ALGH and our proposed method, on the other hand, mainly exploited the frequency domain information of the image and had a higher matching success rate.
From Figure 6e alone, the proposed method obtains more correct matches in texture-rich regions, while the number of correct matches that can be obtained in poor texture regions is significantly reduced. Analyzing the reasons, there are two main points: (1) for poor texture regions, fewer keypoints can be obtained in feature detection. (2) Our proposed method is essentially constructing a structural descriptor. The descriptor vector of each keypoint is the geometric statistic in a circular neighborhood of a specific size centered on this keypoint. The characterization power of the descriptor is slightly reduced for flat regions with less texture. Therefore, in the subsequent study, we will further focus on the feature extraction and characterization performance of poor texture regions.

3.3.2. Quantitative Comparisons

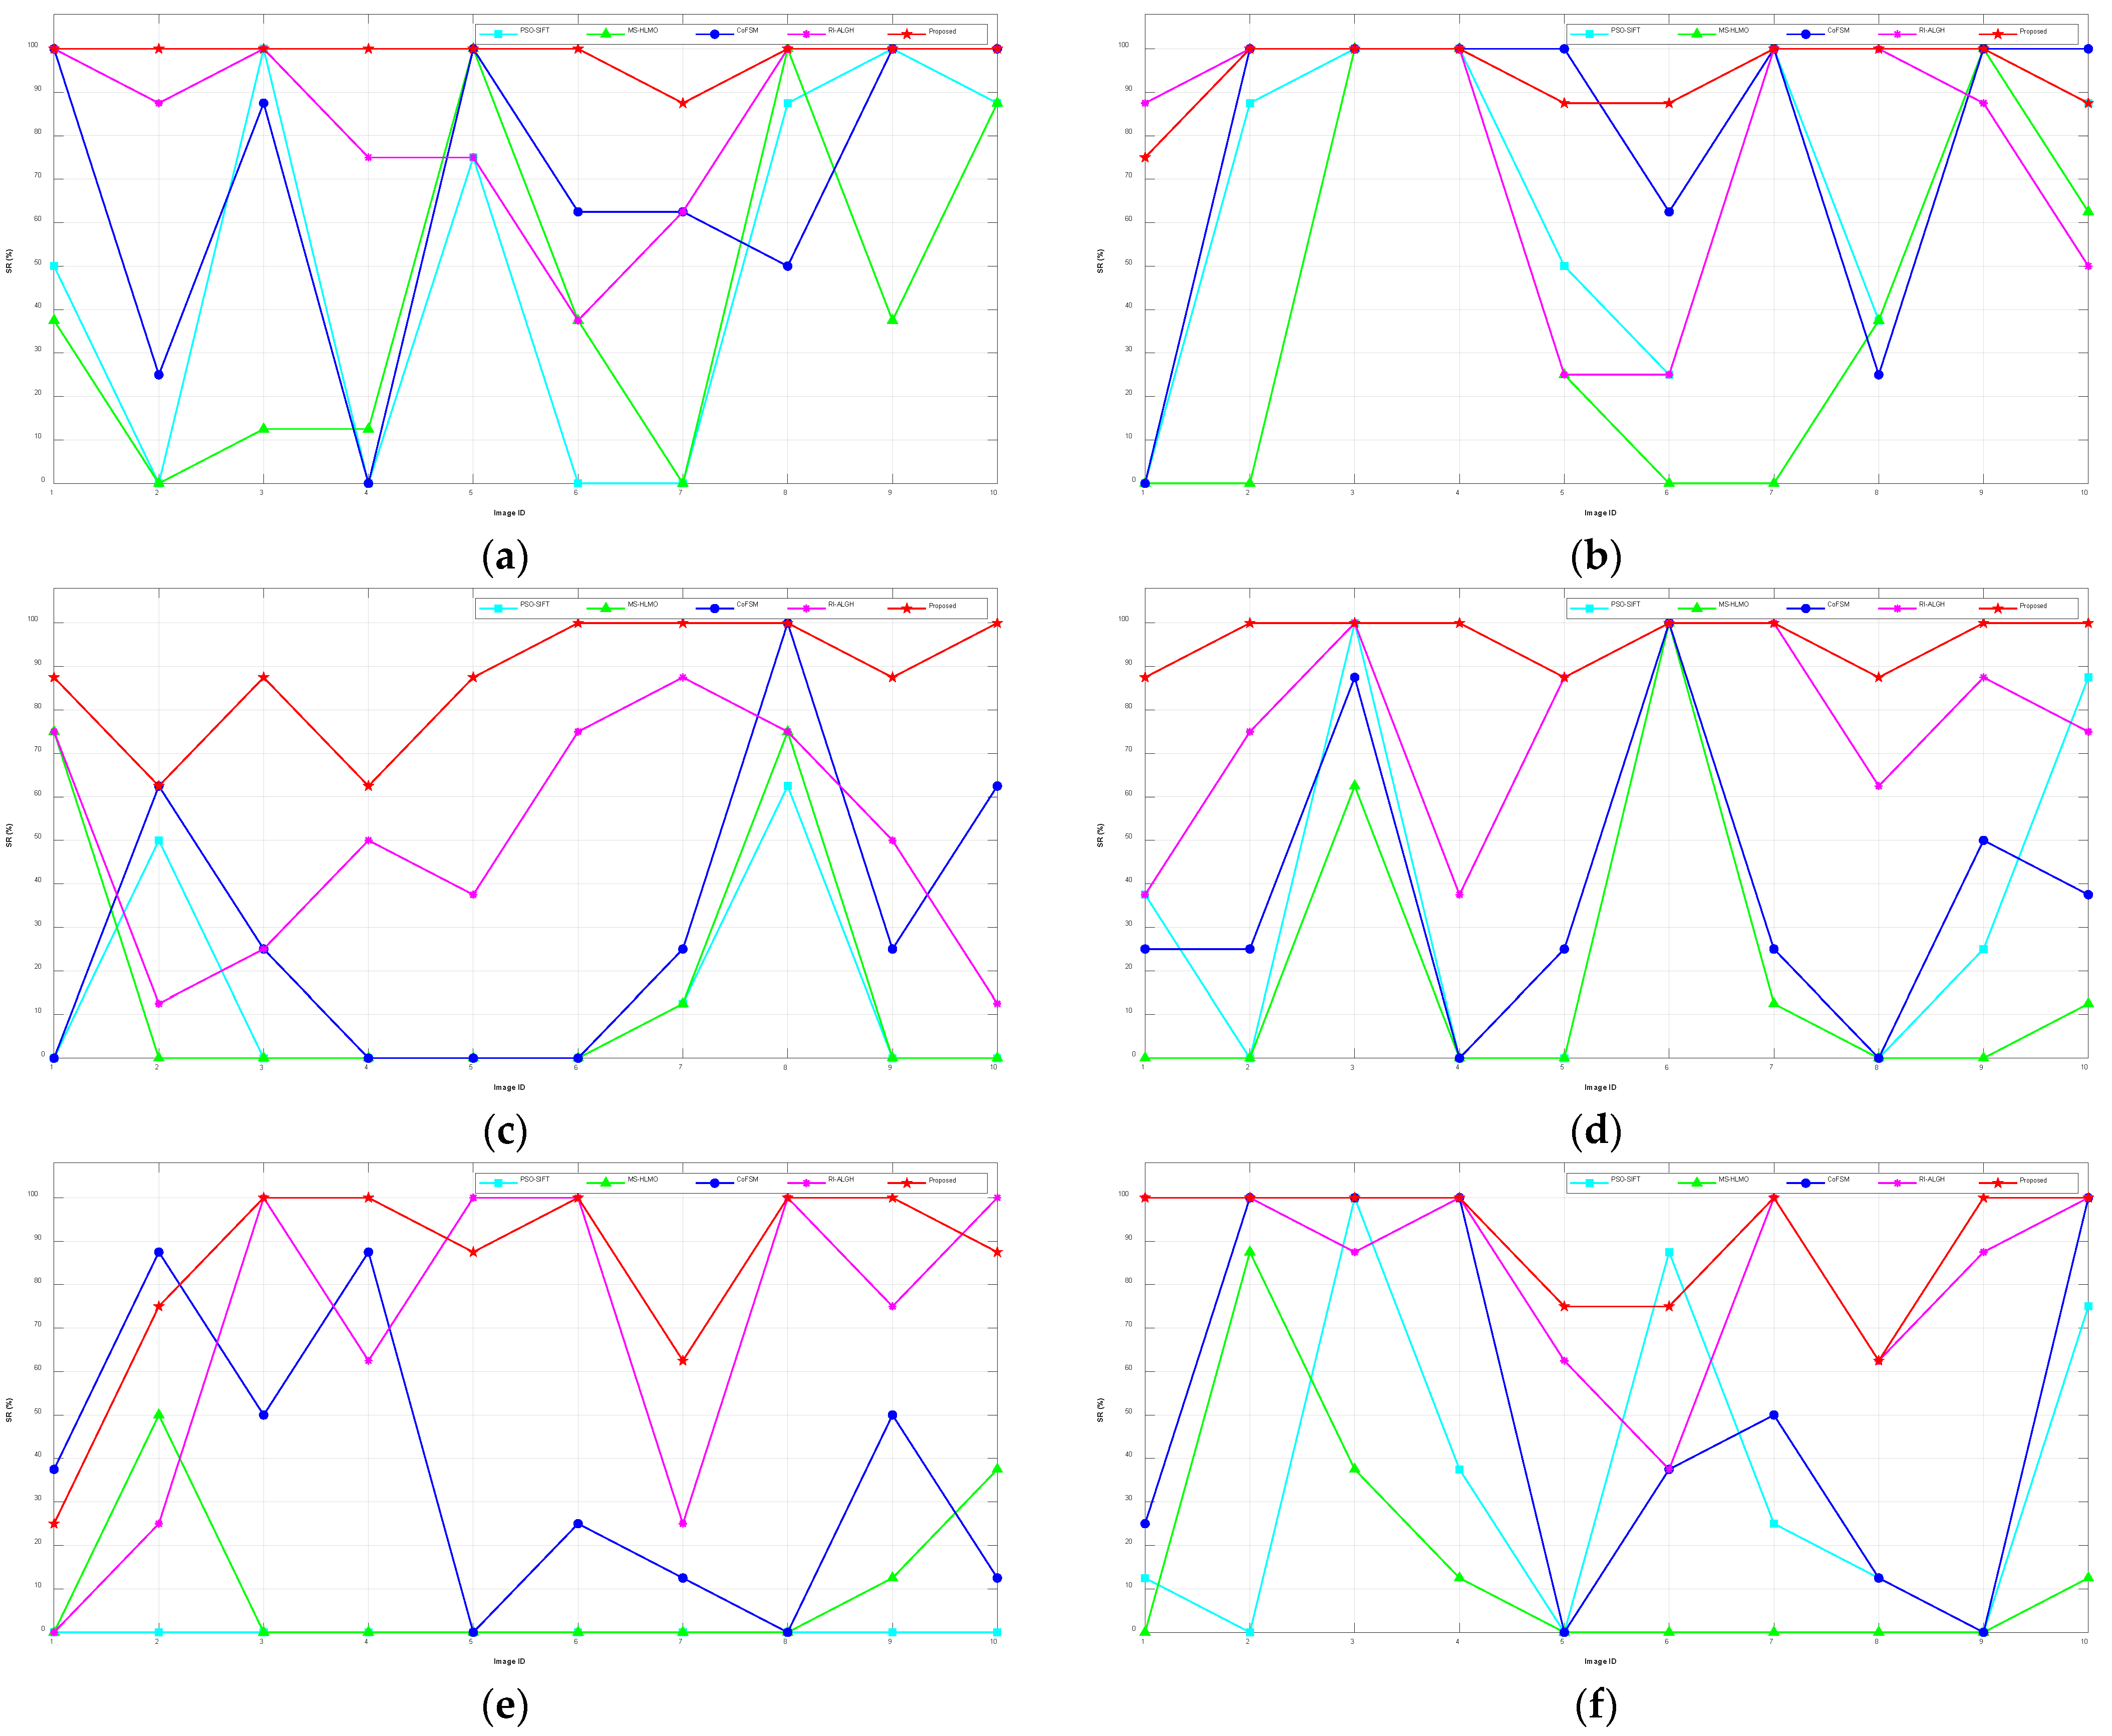
To better compare the performance of the methods, a more detailed quantitative evaluation was performed. As shown in Figure 7, the SR metric of each method for different datasets is demonstrated. Among them, the SR of PSO-SIFT and MS-HLMO is the worst for all types of image pairs, especially for the two datasets of optical–depth and optical–SAR. This is followed by CoFSM, which also has a lower SR for optical–depth, optical–map, and optical–SAR. RI-ALGH and our proposed method have obvious advantages in SR, especially our proposed method, which was found to have a mean SR higher than 80% for each dataset, proving the better robustness of the method.
Figure 8 shows the results of the different methods of NCM, where PSO-SIFT and MS-HLMO performed the worst, obtaining very few matches on all types of image pairs, followed by RI-ALGH. CoFSM and our proposed method had comparable performance regarding the NCM metric and significant advantages over the other methods.
The mean SR and NCM of each method for all the tested image pairs are shown in Table 5. Compared with PSO-SIFT, MS-HLMO, CoFSM, and RI-ALGH, the mean SR of RI-LPOH was 170.3%, 279.8%, 81.6%, and 25.4% higher, respectively; the mean NCM was 13.27, 20.14, 1.39, and 2.42 times that of the aforementioned four methods. Additionally, the mean SR of our proposed method was higher than 80% for all the datasets, and the detected mean NCM was higher than 100, indicating that the method has good generality and robustness and is almost independent of the radiation distortion type and rotation.
Since the SR of PSO-SIFT and MS-HLMO was below 50%, we only considered CoFSM, RI-ALGH, and our proposed RI-LPOH method in the subsequent evaluation. Considering the accuracy, the RMSE of each method is shown in Table 6 (only the cases judged as successful matches were considered). From the table, it can be seen that the RMSE performance of each method was similar. Additionally, considering the high SR of our proposed method, it was able to handle most of the geometric distortions. In the future, the coarse-to-fine matching strategy [29,39,40] can be used. On the current basis, the template-matching algorithm was used for fine matching to further improve the matching accuracy of the algorithm.
Table 7 shows the running time of different method for all 480 image pairs. All results were calculated on a desktop computer with an Intel(R) Xeon(R) W-2275 CPU @ 3.30GHz 3.31GHz and 128 GB of RAM. RI-ALGH and our proposed method were implemented in Matlab 2020b, while CoFSM was implemented in Matlab 2018a.
As can be seen from the table, the RT of CoFSM was only 0.58 times that of the proposed method, which has obvious advantages. It is worth noting that CoFSM uses a multi-thread parallel processing strategy [1] in the implementation, which utilizes 12 workers for computation and greatly improves the computational efficiency. This is also a valuable aspect of our proposed method for subsequent implementations. Compared with RI-ALGH, the RT of our proposed method was only 0.16 times that of the former. This is due to the fact that our proposed method can achieve rotation invariance by simple cyclic shifting of the 2D feature matrix in both the column and row directions, without the need to estimate the principal orientation and rotate it separately; thus, this strategy greatly improves the computational efficiency of the method.

4. Discussion

4.1. Method Rationality Analysis

Unlike the spatial domain-based method that uses an improved gradient definition to construct descriptors, our proposed RI-LPOH mainly utilizes the frequency domain information of the image and constructs a 2D feature matrix based on the MIM to perform the feature description. According to the qualitative and quantitative results, it can be seen that our proposed method can better handle severe rotational and translational deformations with a high matching success rate in the presence of significant NRD. This is mainly due to the following three strategies:
  • The original GLOH is improved, and the number of angular bins is determined experimentally, which effectively increases the flexibility and scalability of the descriptors. Additionally, the rotation invariance is achieved by cyclic shifting of the 2D feature matrix in both the column and row directions without estimating the principal orientation separately, which greatly improves the computational efficiency of the method.
  • To avoid intensity inversion, each part of the sensed image’s 2D feature matrix after the cyclic shift is flipped up and down to obtain another corresponding 2D feature matrix, i.e., for each feature point of the sensed image, at least two corresponding feature descriptors are obtained.
  • Due to the presence of significant NRD, a large number of outliers are generated when feature matching of MRSIs is performed. To avoid the impact of the high proportion of outliers in the subsequent processing, we introduced the RFM-LC [31] algorithm and used the local neighborhood consistency of the spatial and motion features of the keypoints to filter the obtained initial matches, which effectively reduced the proportion of outliers.
To verify the rationality of the proposed method, we designed the following two comparative experiments to illustrate the usefulness of strategies (2) and (3): A: verify the effectiveness of flipping up and down each part of the sensed image’s 2D feature matrix after the cyclic shifts, and B: verify the effectiveness of gross error elimination using RFM-LC during the whole processing. The experiments were conducted using day–night images, and the results are shown in Table 8.
As can be seen from the table, the running time increased slightly after adding the two operations mentioned above. Additionally, the NCM metric was significantly improved; especially after flipping up and down each part of the sensed image’s 2D feature matrix, the success rate of the method reached 100%, and the NCM metric was improved to more than twice the original value, which illustrates the rationality and effectiveness of our proposed strategy.

4.2. Fusion and Registration Performance

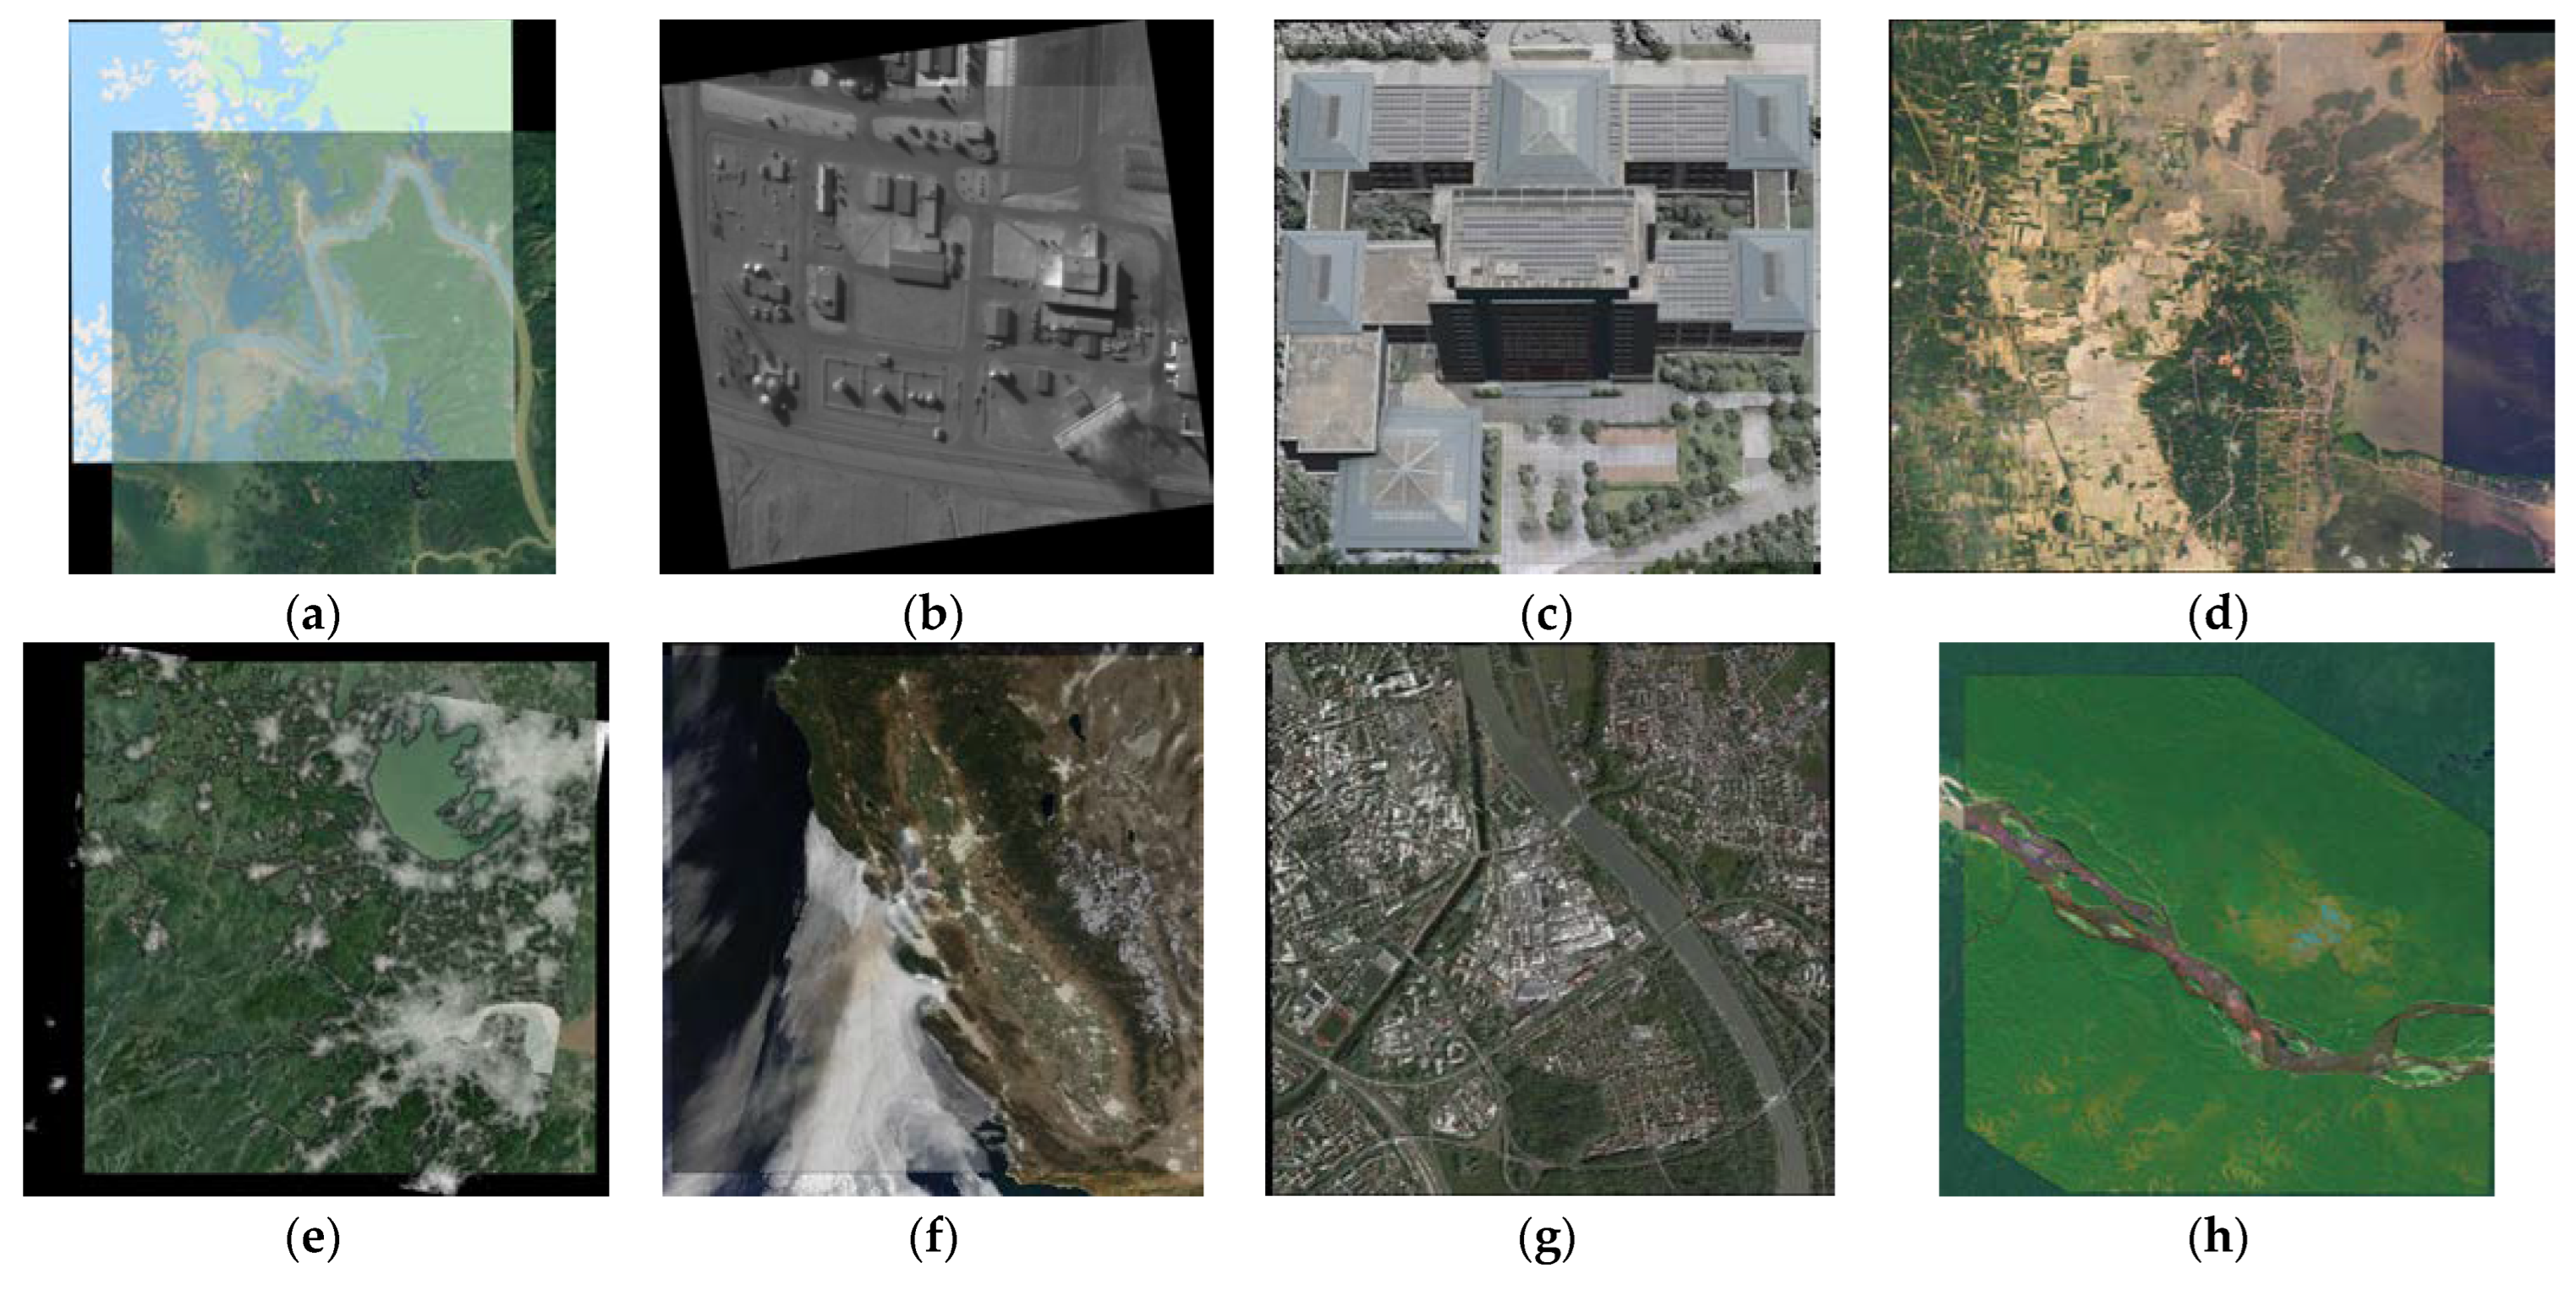
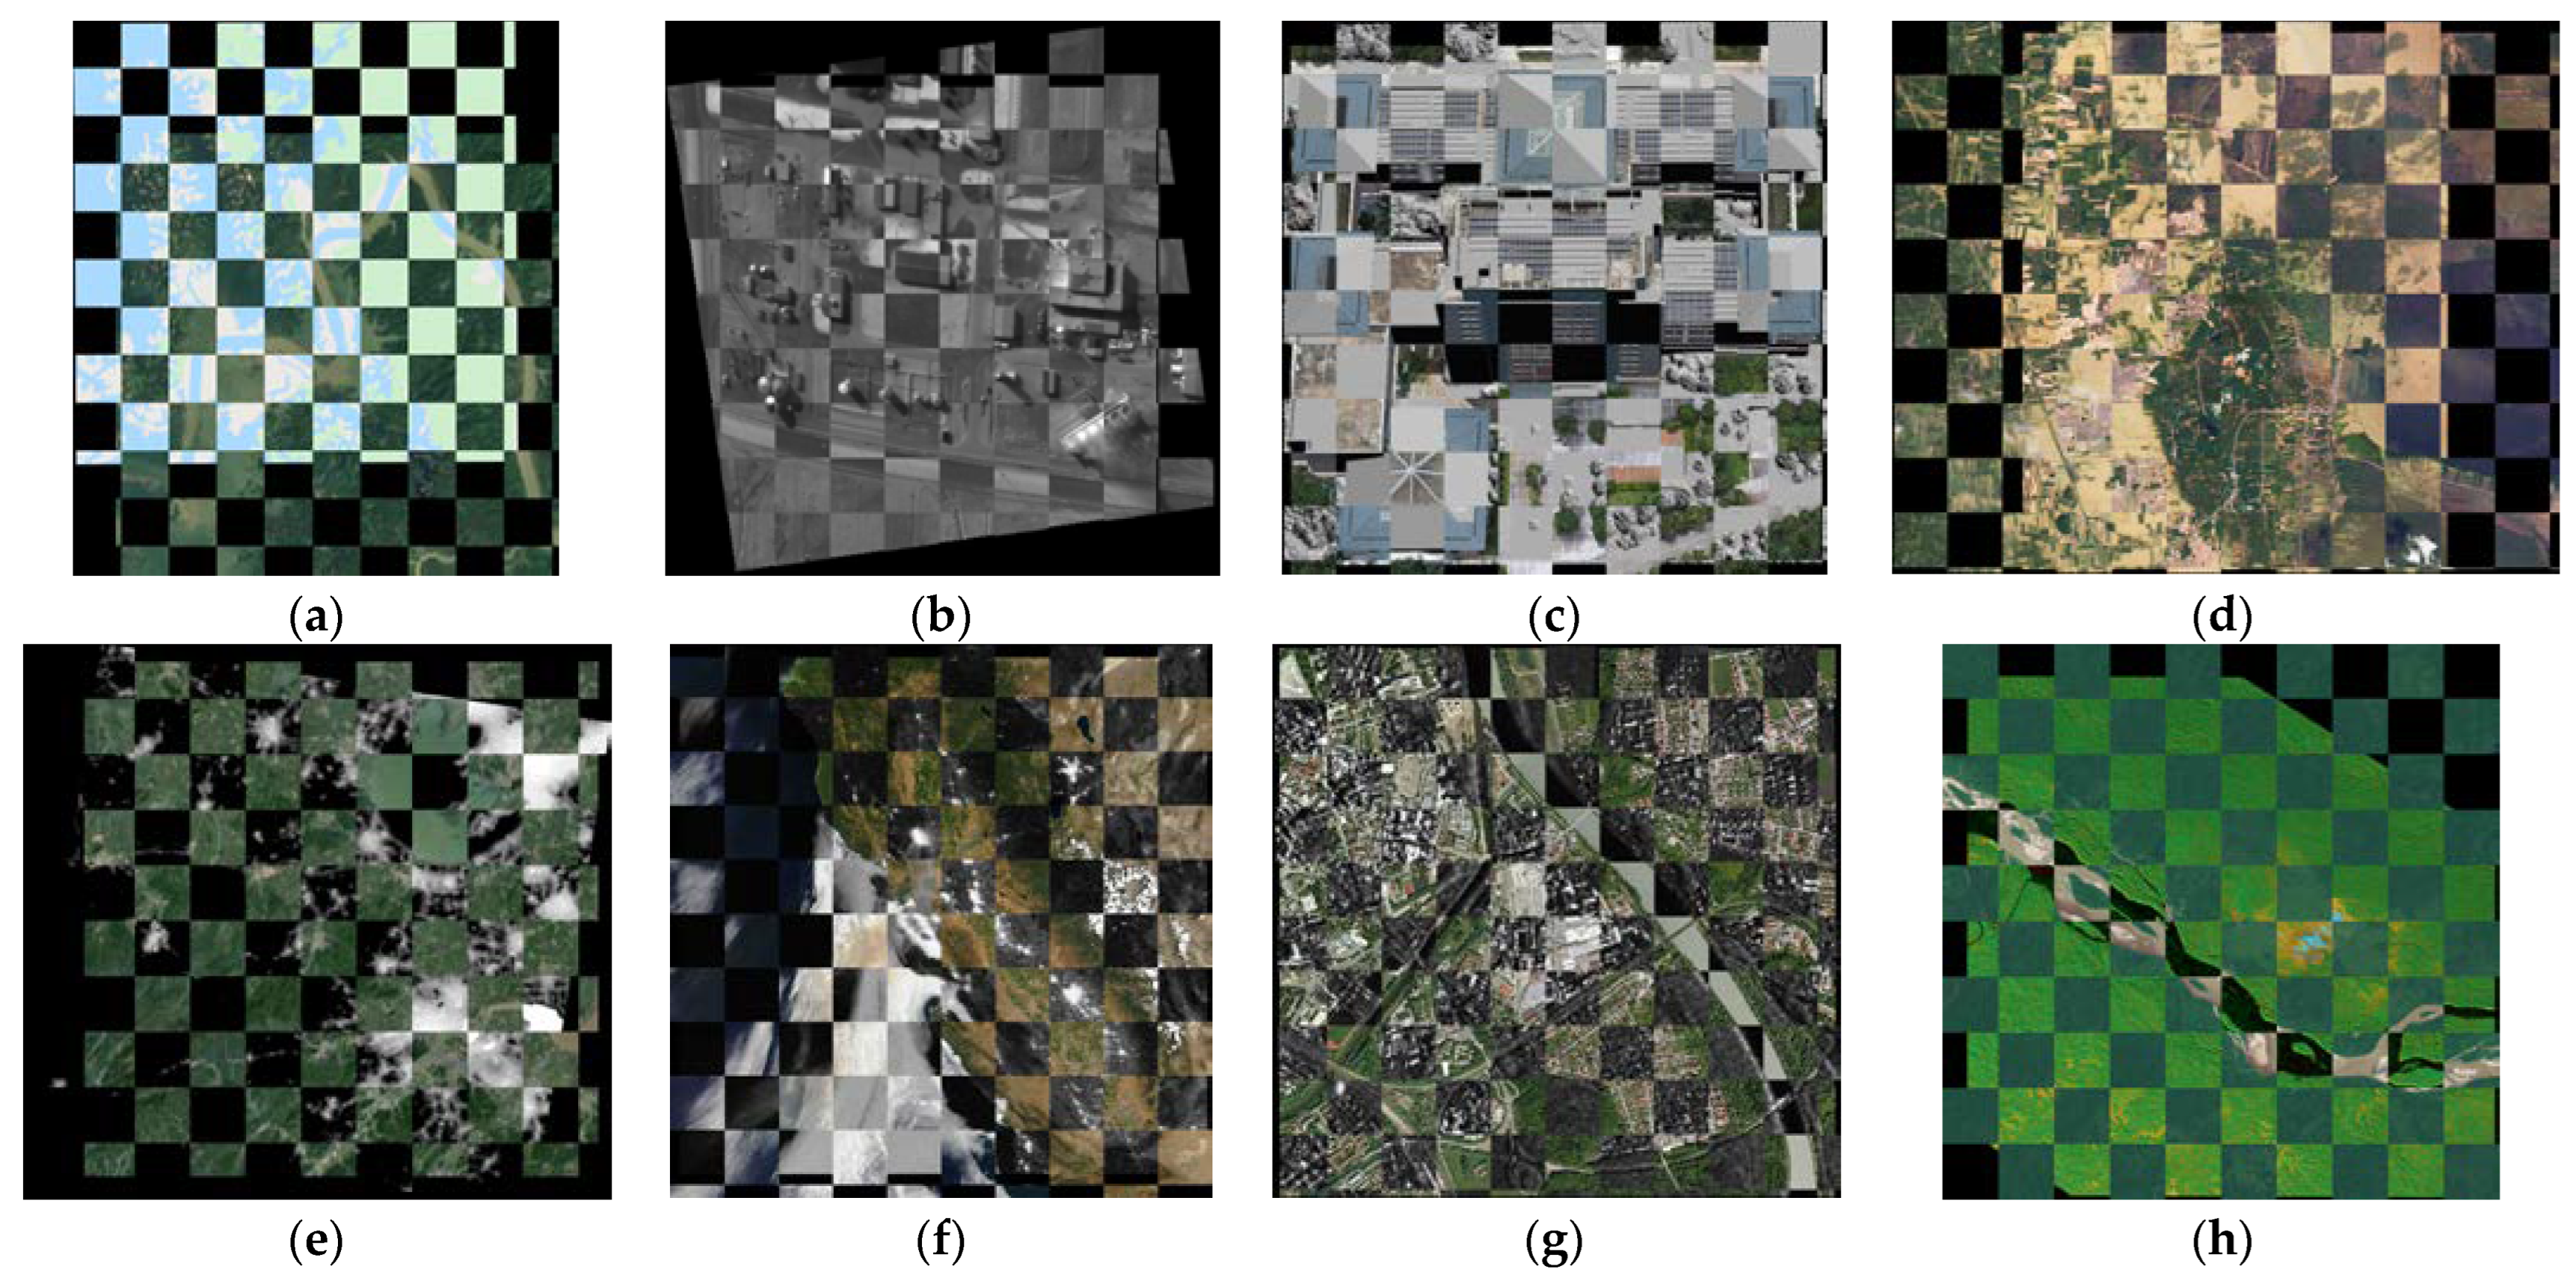
In addition to the visualization results of image matching, we further show the results of image pair fusion and registration obtained by the proposed method. Based on the outlier removal, image fusion and registration were performed according to the optimal transformation parameters obtained by the least squares method, and the results are shown in Figure 9 and Figure 10, respectively. As can be seen from the figure, in the presence of significant NRD and concurrent severe rotational distortion, our proposed method was still able to obtain good fusion and registration results. In the fusion result shown in Figure 9, there is no obvious ghosting in the image; in the registration result shown in Figure 10, each checkerboard edge can be matched well and there are no obvious misalignments, which further verifies the good generalizability of the method.

5. Conclusions

In order to better handle severe rotational and translational deformations in the presence of significant NRD, we proposed a rotationally robust feature-matching method called the rotation-invariant local phase orientation histogram (RI-LPOH). We first introduced the concepts of log-Gabor wavelets and phase congruency to construct weighted moment equations for feature detection. Following an analysis of the shortcomings of the current methods, we introduced the process of descriptor construction in detail: rotation invariance was achieved by cyclic shifting of the 2D feature matrix and further suppressing the effects caused by intensity inversion. Finally, by introducing the RFM-LC [31] algorithm, the adverse effects caused by the high proportion of outliers were mitigated. Compared with four other state-of-the-art methods, our proposed method has significant advantages in SR and NCM, and the algorithm performance is almost independent of the radiation distortion type and rotation deformation and also has better stability and robustness.
However, we did not consider how scale transformation may affect the method in this paper. Therefore, in future research, we will realize the scale invariance of the method by establishing a suitable scale space, such as Gaussian scale space [19], nonlinear diffusion scale space [24], or co-occurrence scale space [1]. The running time of the method will also be further reduced with the assistance of preprocessing operations such as saliency extraction [41] and technical means such as parallel computing.

Author Contributions

Conceptualization, H.T. and C.H.; methodology, H.T.; software, H.T.; validation, H.T. and Y.Z.; formal analysis, H.T.; investigation, Y.Z.; resources, C.H.; data curation, C.H.; writing—original draft preparation, H.T. and Y.Z.; writing—review and editing, H.T. and C.H.; visualization, C.H.; supervision, C.H.; project administration, C.H. All authors have read and agreed to the published version of the manuscript.

Funding

This research was funded by the Innovation Project of Shanghai Institute of Technical Physics, Chinese Academy of Sciences CX-262.

Data Availability Statement

Not applicable.

Conflicts of Interest

The authors declare no conflict of interest.

References

  1. Yao, Y.; Zhang, Y.; Wan, Y.; Liu, X.; Yan, X.; Li, J. Multi-Modal Remote Sensing Image Matching Considering Co-Occurrence Filter. IEEE Trans. Image Process. 2022, 31, 2584–2597. [Google Scholar] [CrossRef] [PubMed]
  2. Cui, S.; Xu, M.; Ma, A.; Zhong, Y. Modality-Free Feature Detector and Descriptor for Multimodal Remote Sensing Image Registration. Remote Sens. 2020, 12, 2937. [Google Scholar] [CrossRef]
  3. Jiang, X.; Ma, J.; Xiao, G.; Shao, Z.; Guo, X. A review of multimodal image matching: Methods and applications. Inform. Fusion 2021, 73, 22–71. [Google Scholar] [CrossRef]
  4. Dusmanu, M.; Rocco, I.; Pajdla, T.; Pollefeys, M.; Sivic, J.; Torii, A.; Sattler, T. D2-net: A trainable CNN for joint description and detection of local features. In Proceedings of the IEEE/CVF Conference on Computer Vision and Pattern Recognition, Virtual Event, 15–20 June 2019. [Google Scholar]
  5. Efe, U.; Ince, K.G.; Alatan, A. Dfm: A performance baseline for deep feature matching. In Proceedings of the IEEE/CVF Conference on Computer Vision and Pattern Recognition, Virtual Event, 19–25 June 2019. [Google Scholar]
  6. Hisham, M.B.; Yaakob, S.N.; Raof, R.A.; Nazren, A.A.; Wafi, N.M. Template matching using sum of squared difference and normalized cross correlation. In Proceedings of the 2015 IEEE Student Conference on Research and Development (SCOReD), Kuala Lumpur, Malysia, 13–14 December 2015. [Google Scholar]
  7. Cole-Rhodes, A.A.; Johnson, K.L.; LeMoigne, J.; Zavorin, I. Multiresolution registration of remote sensing imagery by optimization of mutual information using a stochastic gradient. IEEE Trans. Image Process. 2003, 12, 1495–1511. [Google Scholar] [CrossRef] [PubMed]
  8. Hel-Or, Y.; Hel-Or, H.; David, E. Matching by tone mapping: Photometric invariant template matching. IEEE Trans. Pattern Anal. Mach. Intell. 2013, 36, 317–330. [Google Scholar] [CrossRef]
  9. Kuglin, C.D. The phase correlation image alignment methed. In Proceedings of the International Conference on Cybernetics and Society/IEEE Systems, Man, and Cybernetics Society, New York, NY, USA, 26–28 October 1975. [Google Scholar]
  10. Xiang, Y.; Tao, R.; Wan, L.; Wang, F.; You, H. OS-PC: Combining feature representation and 3-D phase correlation for subpixel optical and SAR image registration. IEEE Trans. Geosci. Remote Sens. 2020, 58, 6451–6466. [Google Scholar] [CrossRef]
  11. Ye, Y.; Shen, L. Hopc: A novel similarity metric based on geometric structural properties for multi-modal remote sensing image matching. ISPRS Ann. Photogramm. Remote Sens. Spat. Inf. Sci. 2016, 3, 9. [Google Scholar] [CrossRef]
  12. Kovesi, P. Phase congruency: A low-level image invariant. Psychol. Res. 2000, 64, 136–148. [Google Scholar] [CrossRef]
  13. Ye, Y.; Bruzzone, L.; Shan, J.; Bovolo, F.; Zhu, Q. Fast and robust matching for multimodal remote sensing image registration. IEEE Trans. Geosci. Remote Sens. 2019, 57, 9059–9070. [Google Scholar] [CrossRef]
  14. Fan, Z.; Zhang, L.; Liu, Y.; Wang, Q.; Zlatanova, S. Exploiting High Geopositioning Accuracy of SAR Data to Obtain Accurate Geometric Orientation of Optical Satellite Images. Remote Sens. 2021, 13, 3535. [Google Scholar] [CrossRef]
  15. Lowe, G. Sift-the scale invariant feature transform. Int. J. 2004, 2, 2. [Google Scholar]
  16. Ke, Y.; Sukthankar, R. PCA-SIFT: A more distinctive representation for local image descriptors. In Proceedings of the 2004 IEEE Computer Society Conference on Computer Vision and Pattern Recognition, 2004 CVPR 2004, Washington, DC, USA, 27 June–2 July 2004. [Google Scholar]
  17. Bay, H.; Ess, A.; Tuytelaars, T.; Van Gool, L. Speeded-up robust features (SURF). Comput. Vis. Image Underst. 2008, 110, 346–359. [Google Scholar] [CrossRef]
  18. Morel, J.-M.; Yu, G. ASIFT: A new framework for fully affine invariant image comparison. SIAM J. Imaging Sci. 2009, 2, 438–469. [Google Scholar] [CrossRef]
  19. Dellinger, F.; Delon, J.; Gousseau, Y.; Michel, J.; Tupin, F. SAR-SIFT: A SIFT-like algorithm for SAR images. IEEE Trans. Geosci. Remote Sens. 2014, 53, 453–466. [Google Scholar] [CrossRef]
  20. Sedaghat, A.; Ebadi, H. Remote sensing image matching based on adaptive binning SIFT descriptor. IEEE Trans. Geosci. Remote Sens. 2015, 53, 5283–5293. [Google Scholar] [CrossRef]
  21. Ma, W.; Wen, Z.; Wu, Y.; Jiao, L.; Gong, M.; Zheng, Y.; Liu, L. Remote sensing image registration with modified SIFT and enhanced feature matching. IEEE Geosci. Remote Sens. Lett. 2016, 14, 3–7. [Google Scholar] [CrossRef]
  22. Xiang, Y.; Wang, F.; You, H. OS-SIFT: A robust SIFT-like algorithm for high-resolution optical-to-SAR image registration in suburban areas. IEEE Trans. Geosci. Remote Sens. 2018, 56, 3078–3090. [Google Scholar] [CrossRef]
  23. Gao, C.; Li, W.; Tao, R.; Du, Q. MS-HLMO: Multi-scale Histogram of Local Main Orientation for Remote Sensing Image Registration. arXiv, 2022; preprint. arXiv:220400260. [Google Scholar] [CrossRef]
  24. Fan, J.; Wu, Y.; Li, M.; Liang, W.; Cao, Y. SAR and optical image registration using nonlinear diffusion and phase congruency structural descriptor. IEEE Trans. Geosci. Remote Sens. 2018, 56, 5368–5679. [Google Scholar] [CrossRef]
  25. Ye, Y.; Shan, J.; Hao, S.; Bruzzone, L.; Qin, Y. A local phase based invariant feature for remote sensing image matching. ISPRS J. Photogramm. Remote Sens. 2018, 142, 205–221. [Google Scholar] [CrossRef]
  26. Li, J.; Hu, Q.; Ai, M. RIFT: Multi-modal image matching based on radiation-variation insensitive feature transform. IEEE Trans. Image Process. 2019, 29, 3296–3310. [Google Scholar] [CrossRef]
  27. Ao, Y.; Zhang, Y.; Wan, Y.; Liu, X.; Guo, H. Heterologous Images Matching Considering Anisotropic Weighted Moment and Absolute Phase Orientation. Geomat. Inf. Sci. Wuhan Univ. 2021, 46, 1727–1736. [Google Scholar]
  28. Yu, Q.; Ni, D.; Jiang, Y.; Yan, Y.; An, J.; Sun, T. Universal SAR and optical image registration via a novel SIFT framework based on nonlinear diffusion and a polar spatial-frequency descriptor. ISPRS J. Photogramm. Remote Sens. 2021, 171, 1–17. [Google Scholar] [CrossRef]
  29. Fan, Z.; Liu, Y.; Liu, Y.; Zhang, L.; Zhang, J.; Sun, Y.; Ai, H. 3MRS: An Effective Coarse-to-Fine Matching Method for Multimodal Remote Sensing Imagery. Remote Sens. 2022, 143, 478. [Google Scholar] [CrossRef]
  30. Yang, W.; Xu, C.; Mei, L.; Yao, Y.; Liu, C. LPSO: Multi-source image matching considering the description of local phase sharpness orientation. IEEE Photonics J. 2022, 14, 1–9. [Google Scholar] [CrossRef]
  31. Chen, J.; Yang, M.; Peng, C.; Luo, L.; Gong, W. Robust Feature Matching via Local Consensus. IEEE Trans. Geosci. Remote Sens. 2022, 60, 1–16. [Google Scholar] [CrossRef]
  32. Li, Z. Research on Iris Recognition Algorithm Based on 2D Log-Gabor Wavelet. Ph.D. Thesis, Northeastern University, Boston, MA, USA, 2013. [Google Scholar]
  33. Ye, Y.; Shan, J.; Bruzzone, L.; Shen, L. Robust registration of multimodal remote sensing images based on structural similarity. IEEE Trans. Geosci. Remote Sens. 2017, 55, 2941–2958. [Google Scholar] [CrossRef]
  34. Kovesi, P. Phase congruency detects corners and edges. In Proceedings of the Seventh International Conference on Digital Image Computing: Techniques and Applications, Sydney, Australia, 10–12 December 2003. [Google Scholar]
  35. Horn, B.; Klaus, B.; Horn, P. Robot Vision; MIT Press: Cambridge, MA, USA, 1986. [Google Scholar]
  36. Rosten, E.; Drummond, T. Machine learning for high-speed corner detection. In Proceedings of the European Conference on Computer Vision, Graz, Austria, 7–13 May 2006; Springer: Berlin/Heidelberg, Germany, 2006. [Google Scholar]
  37. Wu, Y.; Ma, W.; Gong, M.; Su, L.; Jiao, L. A novel point-matching algorithm based on fast sample consensus for image registration. IEEE Geosci. Remote Sens. Lett. 2014, 12, 43–47. [Google Scholar] [CrossRef]
  38. Li, J.; Xu, W.; Shi, P.; Zhang, Y.; Hu, Q. LNIFT: Locally Normalized Image for Rotation Invariant Multimodal Feature Matching. IEEE Trans. Geosci. Remote Sens. 2022, 60, 1–14. [Google Scholar] [CrossRef]
  39. Yang, H.; Li, X.; Zhao, L.; Chen, S. A novel coarse-to-fine scheme for remote sensing image registration based on SIFT and phase correlation. Remote Sens. 2019, 11, 1833. [Google Scholar] [CrossRef]
  40. Rasmy, L.; Sebari, I.; Ettarid, M. Automatic sub-pixel co-registration of remote sensing images using phase correlation and Harris detector. Remote Sens. 2021, 13, 2314. [Google Scholar] [CrossRef]
  41. Jiang, F.; Kong, B.; Li, J.; Dashtipour, K.; Gogate, M. Robust visual saliency optimization based on bidirectional Markov chains. Cogn. Comput. 2021, 13, 69–80. [Google Scholar] [CrossRef]
Figure 1. The pipeline of RI-LPOH.
Remotesensing 14 04228 g001
Figure 2. Feature detection results: (a) based on the original image; (b) based on the minimum moment map; (c) based on the maximum moment map; and (d) based on the weighted moment map.
Remotesensing 14 04228 g002
Figure 3. The modified GLOH.
Remotesensing 14 04228 g003
Figure 4. The 2D matrix schematic.
Remotesensing 14 04228 g004
Figure 5. The 2D matrix processing of the sensed image: (a) rows 1 to d ; (b) rows d + 1 to 2 d ; and (c) rows 2 d + 1 to 3 d .
Remotesensing 14 04228 g005
Figure 6. Qualitative comparison results of the sample data. The processed images are as follows: optical–map ( π 2 ) , optical–infrared ( 5 π 14 ) , optical–depth ( 3 π 14 ) , optical–optical ( π 14 ) , day–night ( π 14 ) , day–night ( 3 π 14 ) , optical–SAR ( 5 π 14 ) , and optical–SAR ( π 2 ) . The red circles and the green crosshairs in the figure correspond to the feature points on the reference image and the sensed image, respectively; the yellow lines and the blue lines represent the correct matches and the incorrect matches, respectively: (a) the results of PSO-SIFT; (b) the results of MS-HLMO; (c) the results of CoFSM; (d) the results of RI-ALGH; and (e) the results of the proposed method.
Remotesensing 14 04228 g006
Figure 7. Comparative results for the SR metric: (a) optical–optical; (b) optical–infrared; (c) optical–depth; (d) optical–map; (e) optical–SAR; and (f) day–night.
Remotesensing 14 04228 g007
Figure 8. Comparative results for the NCM metric: (a) optical–optical; (b) optical–infrared; (c) optical–depth; (d) optical–map; (e) optical–SAR; and (f) day–night.
Remotesensing 14 04228 g008aRemotesensing 14 04228 g008b
Figure 9. Fusion effect of image pairs: (a) optical–map ( π 2 ) ; (b) optical–infrared ( 5 π 14 ) ; (c) optical–depth ( 3 π 14 ) ; (d) optical–optical ( π 14 ) ; (e) day–night ( π 14 ) ; (f) day–night ( 3 π 14 ) ; (g) optical–SAR ( 5 π 14 ) ; and (h) optical–SAR ( π 2 ) .
Remotesensing 14 04228 g009
Figure 10. Registration effect of image pairs: (a) optical–map ( π 2 ) ; (b) optical–infrared ( 5 π 14 ) ; (c) optical–depth ( 3 π 14 ) ; (d) optical–optical ( π 14 ) ; (e) day–night ( π 14 ) ; (f) day–night ( 3 π 14 ) ; (g) optical–SAR ( 5 π 14 ) ; and (h) optical–SAR ( π 2 ) .
Remotesensing 14 04228 g010
Table 1. SR with different parameter settings (%).
N o 68101214
R
2475.075.075.075.087.5
3675.087.5100.087.5100.0
4875.087.5100.0100.0100.0
6087.587.5100.0100.0100.0
7287.587.5100.0100.0100.0
Table 2. NCM with different parameter settings.
N o 68101214
R
2496.7573.1397.6396.0017.50
36112.00141.25179.00172.7564.50
48116.38166.75219.75251.75127.75
60119.63160.25234.38277.63139.00
72108.50158.88250.75279.38128.38
Table 3. RMSE with different parameter settings (pixels).
N o 68101214
R
241.841.871.871.841.89
361.841.961.831.851.89
481.851.931.881.881.88
601.851.911.911.911.99
721.891.931.921.931.98
Table 4. RT with different parameter settings(s).
N o 68101214
R
246.407.969.8011.6414.25
368.219.5812.3313.9516.43
489.7512.9814.4516.1219.28
6011.6015.5316.6620.1122.66
7213.6919.0221.7424.5927.43
Table 5. Quantitative evaluation results for each method.
MetricPSO-SIFTMS-HLMOCoFSMRI-ALGHProposed
SR (%)34.024.250.673.391.9
NCM16.3310.76155.6489.50216.69
Table 6. RMSE evaluation results for each method (pixels).
MethodOptical–OpticalOptical–InfraredOptical–DepthOptical–MapOptical–SARDay–NightMean Value
CoFSM1.891.911.901.951.981.921.92
RI-ALGH1.911.891.851.952.031.921.92
Proposed1.851.871.881.922.001.901.90
Table 7. RT evaluation results for each method(s).
MethodOptical–OpticalOptical–InfraredOptical–DepthOptical–MapOptical–SARDay–NightMean Value
CoFSM10.6710.7113.6512.3311.9014.0612.22
RI-ALGH115.24139.0593.05126.37138.90184.32132.82
Proposed20.5621.5319.0521.4221.2022.4321.03
Table 8. Performance evaluation results for comparative experiments.
RI-LPOH
(Not Flipped Up and Down)
RI-LPOH (No RFM-LC)RI-LPOH
SR (%)62.5100.0100.0
NCM84.38197.00219.75
RMSE (pixels)1.901.881.88
RT (s)10.0412.9114.45
Publisher’s Note: MDPI stays neutral with regard to jurisdictional claims in published maps and institutional affiliations.