Article

Evaluation of Global Historical Cropland Datasets with Regional Historical Evidence and Remotely Sensed Satellite Data from the Xinjiang Area of China

1
College of Resources and Environment, Shanxi University of Finance and Economics, Taiyuan 030006, China
2
Key Laboratory of Land Surface Pattern and Simulation, Institute of Geographic Sciences and Natural Resources Research, Chinese Academy of Sciences, Beijing 100101, China
3
University of Chinese Academy of Sciences, Beijing 100049, China
4
Key Research Institute of Yellow River Civilization and Sustainable Development & Collaborative Innovation Center on Yellow River Civilization Jointly Built by Henan Province and Ministry of Education, Henan University, Kaifeng 475001, China
*
Author to whom correspondence should be addressed.
Remote Sens. 2022, 14(17), 4226; https://doi.org/10.3390/rs14174226
Submission received: 13 June 2022 / Revised: 18 August 2022 / Accepted: 24 August 2022 / Published: 27 August 2022

Abstract

:
Global land use/cover change (LUCC) datasets are essential for quantitatively assessing the impacts of LUCC on global change, but many uncertainties in existing global datasets seriously hamper climate modeling. Evaluating the reliability of existing global LUCC datasets is a precondition for improved data quality. In this study, based on the regional historical document-based reconstructions, satellite-based data, and historical reclamation evidence for the Xinjiang area of China, the accuracy and rationality of cropland data for this area in the HYDE 3.2 and SAGE datasets were evaluated by utilizing comparative analysis regarding three aspects, namely the change tendency of the cropland area, the area of cropland, and the differences in spatial pattern. This study concluded that the amount of cropland in the Xinjiang area in the global and regional datasets shows both disparate trends and large differences in absolute values. Spatially, historical reclamation evidence indicated that agricultural cultivation in the Xinjiang area underwent expansion from south to north and from east to west over the past 300 years; however, the global datasets revealed that the cropland spatial patterns in the Xinjiang area in the historical period are similar to those in the current period. These differences are attributable to the uncertainties of the basic assumptions, per capita cropland area estimates, and reconstruction methods in the global datasets. The findings of the study highlight the necessity of regional studies on historical LUCC in the Xinjiang area.

1. Introduction

Historical anthropogenic land use has significantly modified the land cover of the Earth’s surface [1,2,3,4,5]. Approximately 44% of the natural vegetation on the land surface has been transformed under human land use during the past 300 years [6]. These changes have led to anthropogenic greenhouse gas emissions, subsequently influencing global climate change [7,8,9,10]. Historical land use and land cover change (LUCC) is a significant parameter for many Earth system models, such as integrated assessment models (IAMs) and Earth system models (ESMs) [3]. Thus, accurate high-resolution historical land cover datasets are essential for simulations of climate and environmental dynamics and projections of future land use, food security, climate, and biodiversity [11,12,13,14,15]. Consequently, much focus has been given to reconstructing historical LUCC in many major global research projects, such as the LUCC project, Global Land Project (GLP), LandCover 6K, and Future Earth.
Over the past several decades, based on satellite data and multi-source historical statistics and inventory data, substantial progress has been made in global and regional historical LUCC reconstruction, with the most representative achievements shown in four global LUCC datasets: a historical database of global cropland and pasture for AD 1700–1992 and AD 800–1700, produced by the Center for Sustainability and the Global Environment (SAGE) and Pongratz Julia (PJ), respectively [6,16]; the Historical Database of the Global Environment (HYDE), established by the Netherlands Environmental Assessment Agency, and the latest version with reconstructed global cropland, pasture, and built-up land cover for 10,000 BC–AD 2015 [3]; KK10, developed by Kaplan and Krumhardt in AD 2010, including anthropogenic land cover change for 8000 BP–AD 2015 [7]. Thus far, these global land use datasets have been widely utilized to simulate LUCC impacts on the global and regional climate and ecological environment, as well as in studies of carbon emissions, because of their high spatial resolutions and long-term coverage [17,18,19,20].
However, these global datasets are still subject to major uncertainties and limitations, which are not often addressed, such as large temporal and spatial variations in historical basic data, reconstruction assumptions about the relationship between population and land use, and space allocation algorithms. Therefore, the different global datasets show obvious inconsistencies in the total areas and spatial distributions of land use and land cover changes. For example, the total amount of agricultural area computed by HYDE3.2 is significantly smaller than the estimates of KK10 [3], and the anthropogenic land use area in the pre-industrial era estimated by the HYDE is ~80% lower than that of the KK10 [7]. Moreover, many inaccuracies in these datasets also have been demonstrated by regional datasets reconstructed using local historical records, especially for cropland [21]. For instance, the HYDE and SAGE datasets significantly overestimate the cropland area of Eastern China over the past 300 years, whereas they significantly underestimate the cropland area in the Qinghai–Tibet Plateau over the past 100 years [22,23,24]. Moreover, HYDE greatly underestimates the crop density in high cropland coverage regions but overestimates it in low-density regions in the United States for the period 1850–2016 [25]. In addition, the amount of cropland in Germany over the last 1000 years in the HYDE is considered to display a low level of accuracy [26]. Furthermore, global land use datasets also do not objectively reflect the spatial distribution and change characteristics of land use/cover in the abovementioned regions in historical periods. Thus, the LandCover6K program initiated by Past Global Change suggests that the global change and historical LUCC researchers should further clarify possible uncertainties in existing global historical LUCC datasets and reconstruct more reliable regional data using local historical documents for the data that need to be updated, revised, or reconstructed [27,28,29]. Moreover, Future Earth plans emphasize the importance of relevant research in vulnerable areas on the land surface, including coastal zones, arid areas, tropical rainforests, and Arctic and Antarctic regions [30].
Xinjiang is located in the middle temperate arid zone, a typical vulnerable area of the Earth’s surface. Furthermore, its land use pattern has undergone a significant transformation over the past 300 years due to the large-scale movement of agricultural migrants since the Qing Dynasty [31]. The historical LUCC information on Xinjiang and its quantitative effects on the regional or global climate and environment have attracted the particular attention of global change researchers [30]. However, due to the regional long-term LUCC data scarcity, current research mainly focuses on the past 50 years, with abundant satellite data [32,33,34,35,36,37]. Although the global datasets cover the Xinjiang area, the accuracy and reliability of these datasets in Xinjiang have still not been systematically evaluated. Therefore, the main objective of this study is to evaluate the reliability of cropland data for the Xinjiang area, extracted from global datasets, using the regional historical cropland data reconstructed by local researchers based on historical documents, modern statistics, and satellite data and combined with historical information on land reclamation. The results of the evaluation will provide a reference for the reconstruction of regional cropland datasets on Xinjiang and the improvement of global datasets at the regional scale.

2. Materials and Methods
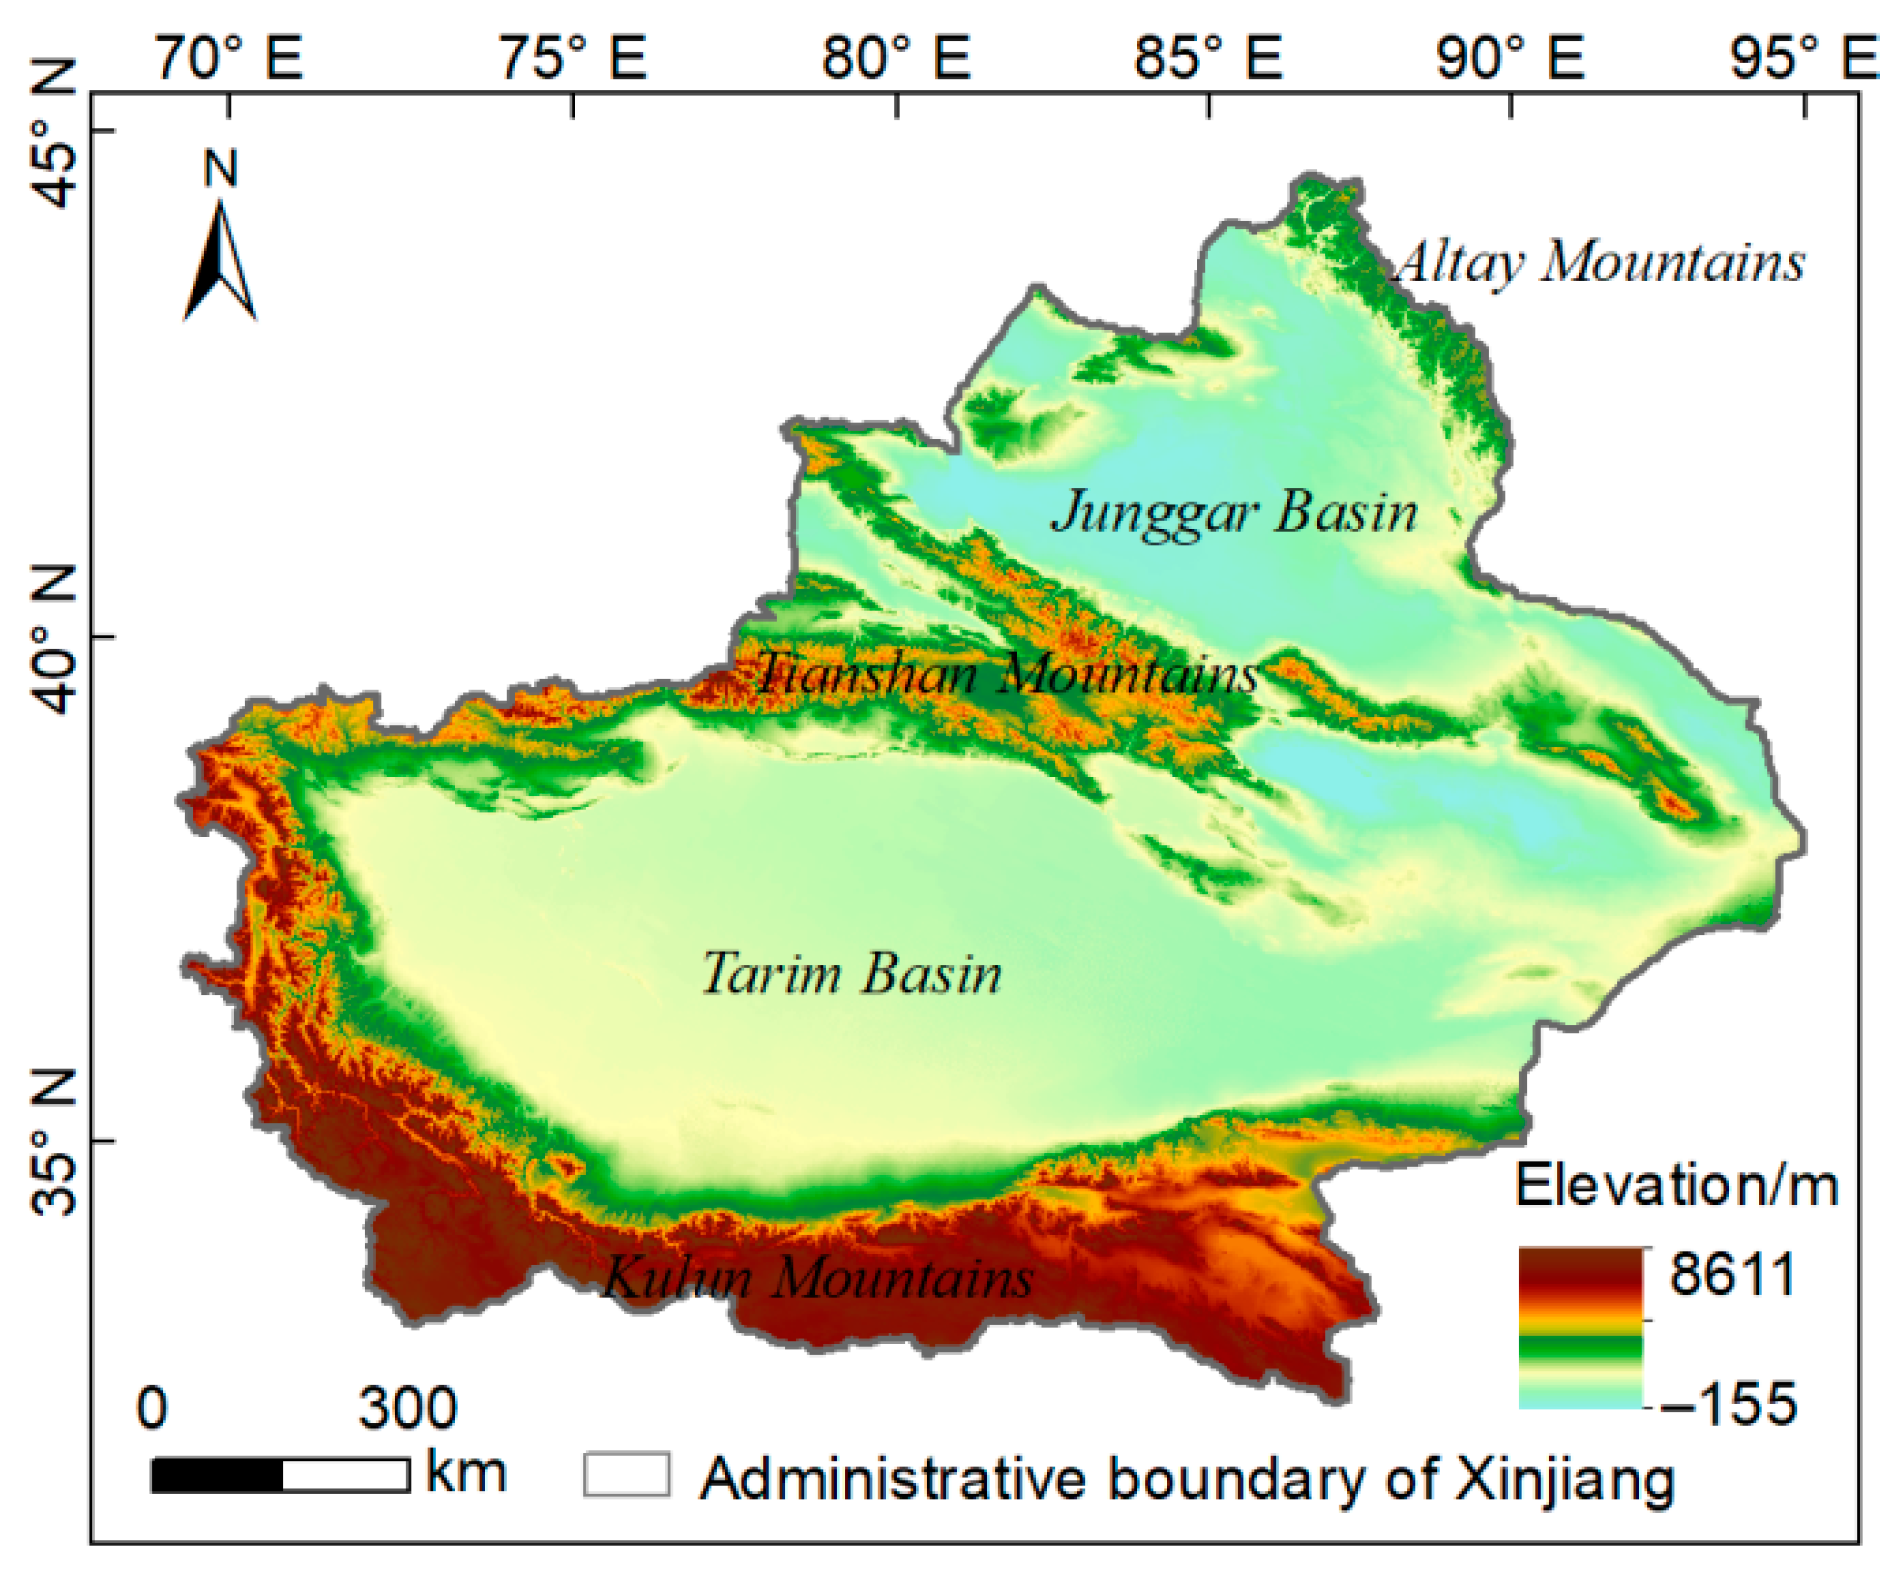
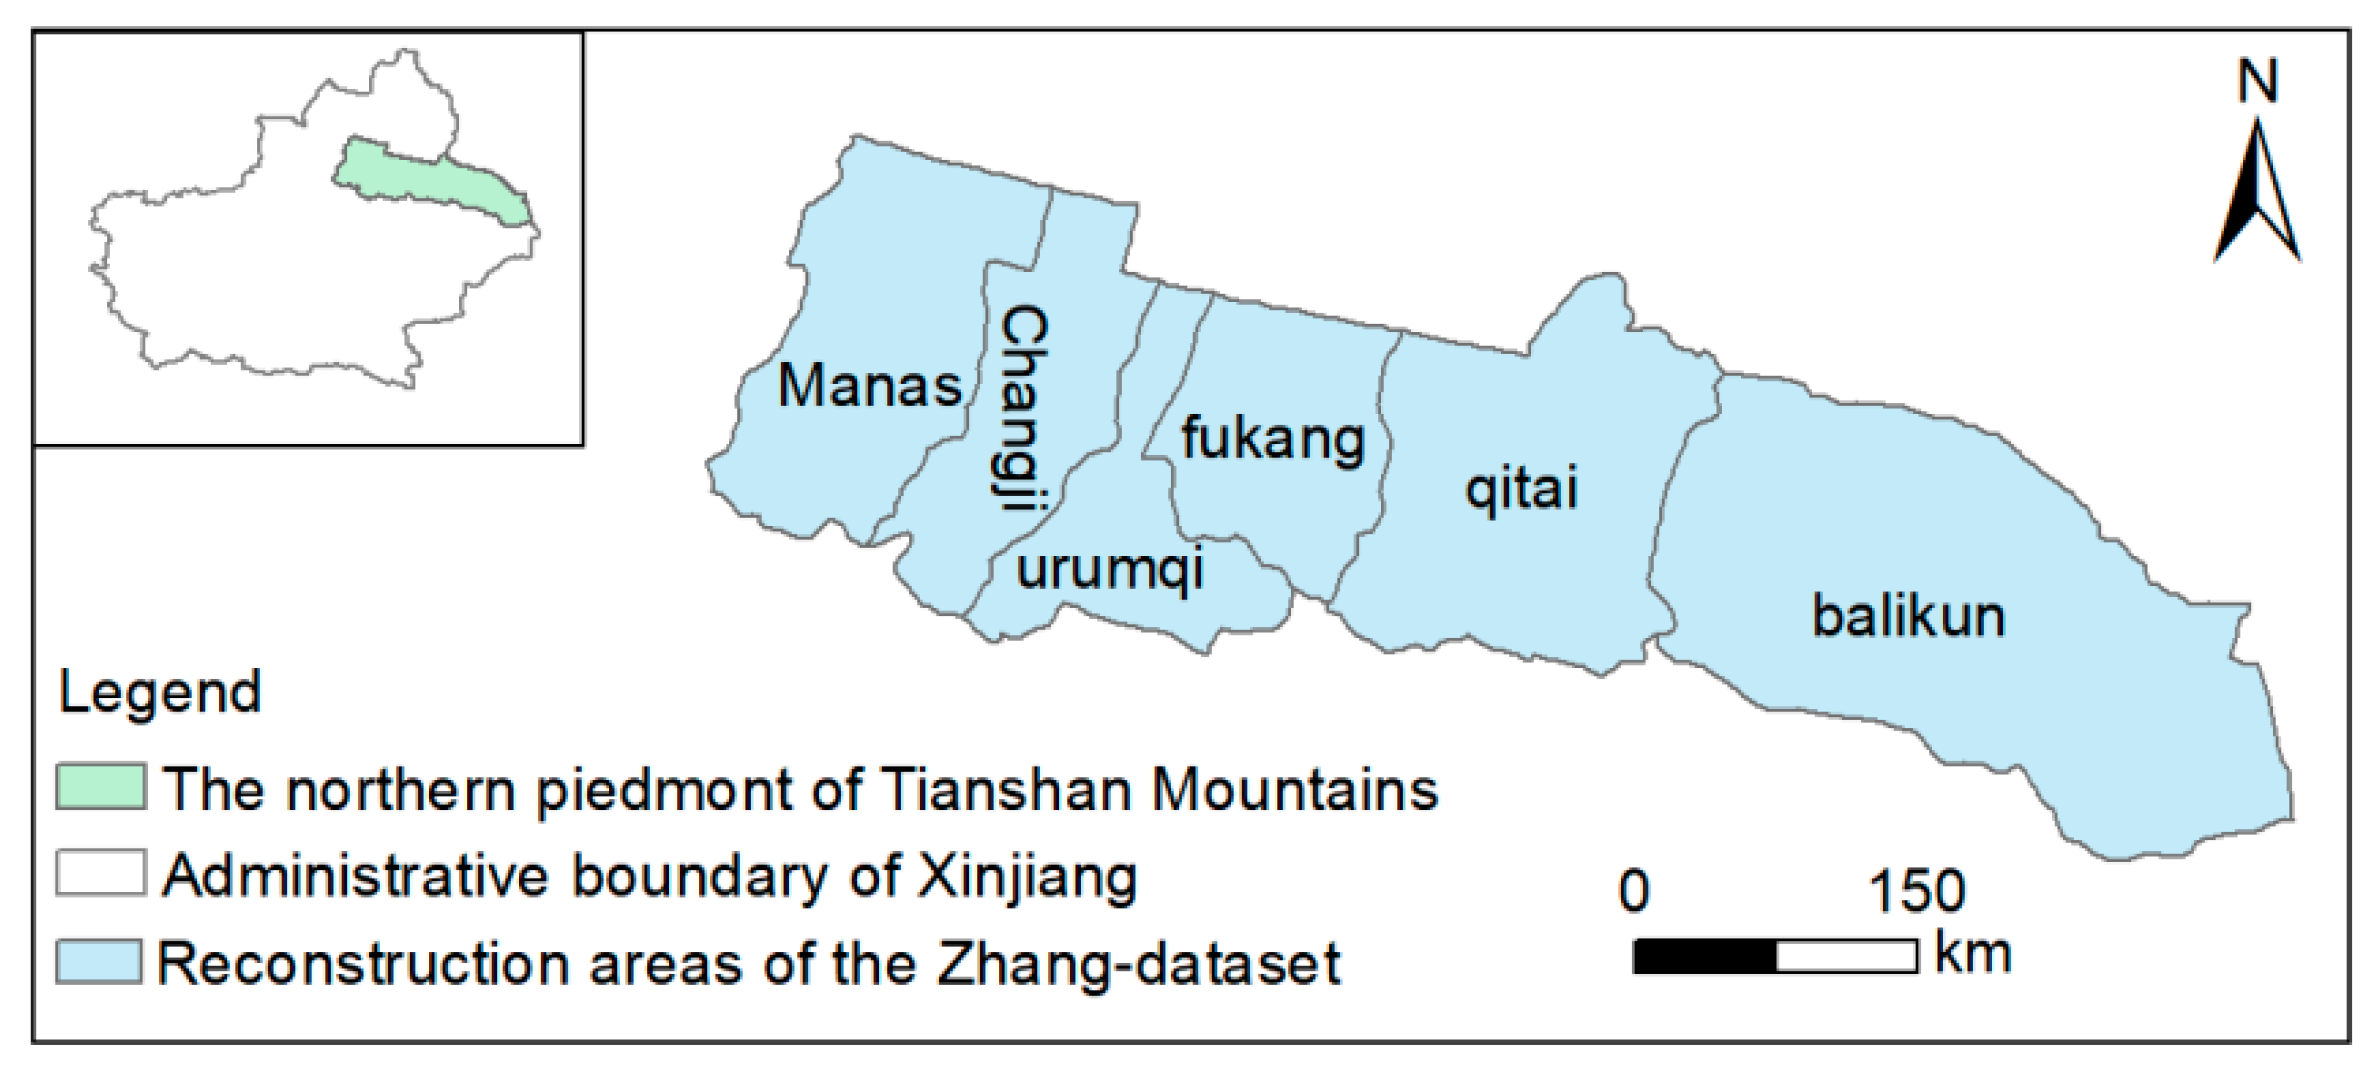
2.1. Study Area

Xinjiang province is located in the northwest of China, deep in the hinterland of Eurasia, bordered by the Pamir Plateau to the west, the Mongolian Plateau to the northeast, and the Qinghai–Tibet Plateau to the south, and connected to Gansu province through the Hexi Corridor to the east. Xinjiang is located between the latitudes 34°40′N and 49°51′N and the longitudes 73°40′E and 96°18′E, and it covers an area of approximately 1.66 million square kilometers. The terrain of Xinjiang is dominated by mountains and basins; the Altai Mountains, Junggar Basin, Tianshan Mountains, Tarim Basin, and the Kunlun Mountains are distributed from north to south (Figure 1). Xinjiang has an arid and semi-arid climate, with average annual rainfall of only 145 mm. The climatic zone of Xinjiang is temperate, but, bounded by the Tianshan Mountains, the northern and southern areas of Xinjiang belong to the arid middle and arid warm temperate zones, respectively. Consequently, Southern Xinjiang is relatively rich in light and heat resources compared with Northern Xinjiang, with glacier snow melt into rivers, creating favorable conditions for agricultural development in arid areas. Therefore, Xinjiang has maintained a land use pattern of “southern farming and northern grazing” for three millennia. In Southern Xinjiang, there is a mixed economy characterized by millet–wheat/barley–animal husbandry, while Northern Xinjiang is dominated by a nomadic economy, and this pattern was maintained until to the end of the 17th century [30].
From the end of the 17th century to the middle of the 18th century (AD 1690–1755), the Qing Dynasty (AD 1636–1912) gradually unified Xinjiang from east to west. During this period, a mass of troops and agricultural migrants from Eastern China were moved into Xinjiang for garrison and wasteland reclamation. After Xinjiang was completely incorporated into the territory of the Qing Dynasty, to maintain the stability of Xinjiang and promote its agricultural development, the government continued to formulate preferential policies to attract immigrants from the eastern agricultural area of China to cultivate wasteland in Xinjiang, especially in Northern Xinjiang. Subsequently, the government of the Republic of China and the People’s Republic of China also inherited and developed these policies. These policies caused a large number of immigrants to pour into Xinjiang. According to previous studies and population census data, the large-scale immigration resulted in a population increase in Xinjiang, from less than one million in the early Qing Dynasty to ~5 million after the founding of the People ‘s Republic of China, and more than 20 million in the early 21st century, amounting to a population increase of 20 times [38,39]. The explosive population growth resulted in large-scale wasteland reclamation. This caused the land use pattern in Xinjiang to undergo a transformation from “southern farming and northern grazing” to “agriculture-oriented” over the past 300 years, and Northern Xinjiang has become the current main agricultural area in Xinjiang [40].

2.2. Data Sources and Processing

Data from three sources were used to evaluate cropland accuracy in the global datasets in this study (Table 1): (1) historical document-based cropland reconstructions, including the provincial cropland dataset of China for AD 1933–1999 (hereafter, Ge dataset) [41], and the cropland dataset for the northern piedmont of the Tianshan Mountains in the Xinjiang area for AD 1766–1944 (hereafter, Zhang dataset) [42]; (2) the satellite-based land use/cover change dataset of the Xinjiang area for the 1980s–2015 [43]; and (3) historical records on the wasteland reclamation sites dedicated to migrants and garrison troops in the Xinjiang area for the early (AD 1716–1721) and middle (AD 1756–1778) Qing Dynasty [44].

2.2.1. Global Historical Land Use Datasets

Existing historical global land use/cover datasets, including the HYDE, SAGE, and KK10 datasets, encompass the entirety of Xinjiang province as well as our study time period. Because the KK10 dataset estimates global land areas under anthropogenic land cover change instead of cropland area, only cropland data from the HYDE and SAGE datasets were evaluated in this study (Table 1).
(1) HYDE cropland datasets. Cropland areas in the HYDE datasets for AD 1960–2015 were drawn directly from the FAO data, and for the pre-1961 period, they were estimated using the FAO per capita cropland area and population data for the historical period, assuming that the per capita values for cropland were constant or slightly increased or decreased over time. Then, these cropland areas were allocated to grid cells with a resolution of 5 arc minutes, according to the current spatial patterns reference map of 2010 for cropland, derived from satellite imagery of ESA (2016), and other weighing maps, including population, soil, coastline and river plain, topography, and climate maps [3]. The original version of the HYDE dataset only covered the past 300 years, whereas version HYDE 3.1 extended the reconstruction period to 10,000 BC–AD 2000. The latest version, HYDE 3.2, has updated the basic data on populations and cropland and incorporates allocation algorithms from modern remote sensing.
(2) SAGE cropland datasets. Historical cropland cover maps for AD 1700–1992 in the SAGE dataset were derived by the following approach: assuming that the cropland pattern of AD 1992 represents the historical spatial patterns within each political unit, we used political unit cropland inventory data for AD 1992 to calibrate the satellite-based DISCover dataset to obtain a cropland cover map for AD 1992; subsequently, we estimated the historical cropland cover of each political unit based on historical inventory data on population and cropland and calculated the ratio of crop cover in the past to the crop cover in AD 1992 for each political unit, which was then further converted to a spatial map; finally, historical crop cover maps at 0.5° spatial resolution were achieved by multiplying the two maps obtained as above [16]. The initial version of the SAGE dataset covered AD 1700–1992; then, the reconstruction period was extended to 2007, and some original data were also revised, such as Boston University’s MODIS-based global land cover product and the SPOT VEGETATION-based Global Land Cover 2000 dataset, which are used in its latest version.

2.2.2. Regional Historical Cropland Datasets

Two regional cropland datasets covering the whole and partial regions of Xinjiang province were utilized in this study, the Ge dataset and Zhang dataset [41,42]. The former dataset reconstructed the provincial-level cropland area of China for AD 1933–1999 by analyzing, comparing, and verifying various survey statistics and relevant research reports covering the Republican period and after AD 1949. For the latter, based on historical records of land use in local historical documents for the Xinjiang area, Zhang et al. estimated the total cropland area for the northern piedmont of the Tianshan Mountains in Xinjiang province for AD 1766–1944 and the corresponding sub-regional-level cropland area for AD 1777–1944, including the Balikun, Qitai, Fukang, Urumqi, Changji, and Manas regions (Table 1, Figure 2).

2.2.3. Satellite-Based Land Use Datasets

Historical cropland spatial patterns for HYDE and SAGE were reconstructed based on satellite-based cropland cover, so the regional satellite-based land cover dataset was also used to evaluate the uncertainties in these global datasets. Satellite-based cropland cover data of Xinjiang province were extracted from the remote sensing monitoring dataset of land use/cover change in six provinces in Western China (CWLUCC) (Table 1). Based on Landsat TM/ETM remote sensing images from the late 1970s, 1980s, 1990, 1995, 2000, 2005, 2010, and 2015, Liu et al. generated CWLUCC at 30 m, 100 m, and 1 km resolution with six classes of land use/cover—cropland, woodland, grassland, water bodies, unused land, and built-up land—by using professional software and manual visual interpretation methods, and these data products were also validated using field observation [43]. The CWLUCC can be downloaded from the National Tibetan Plateau Data Center (http://data.tpdc.ac.cn (accessed on 23 May 2022)).

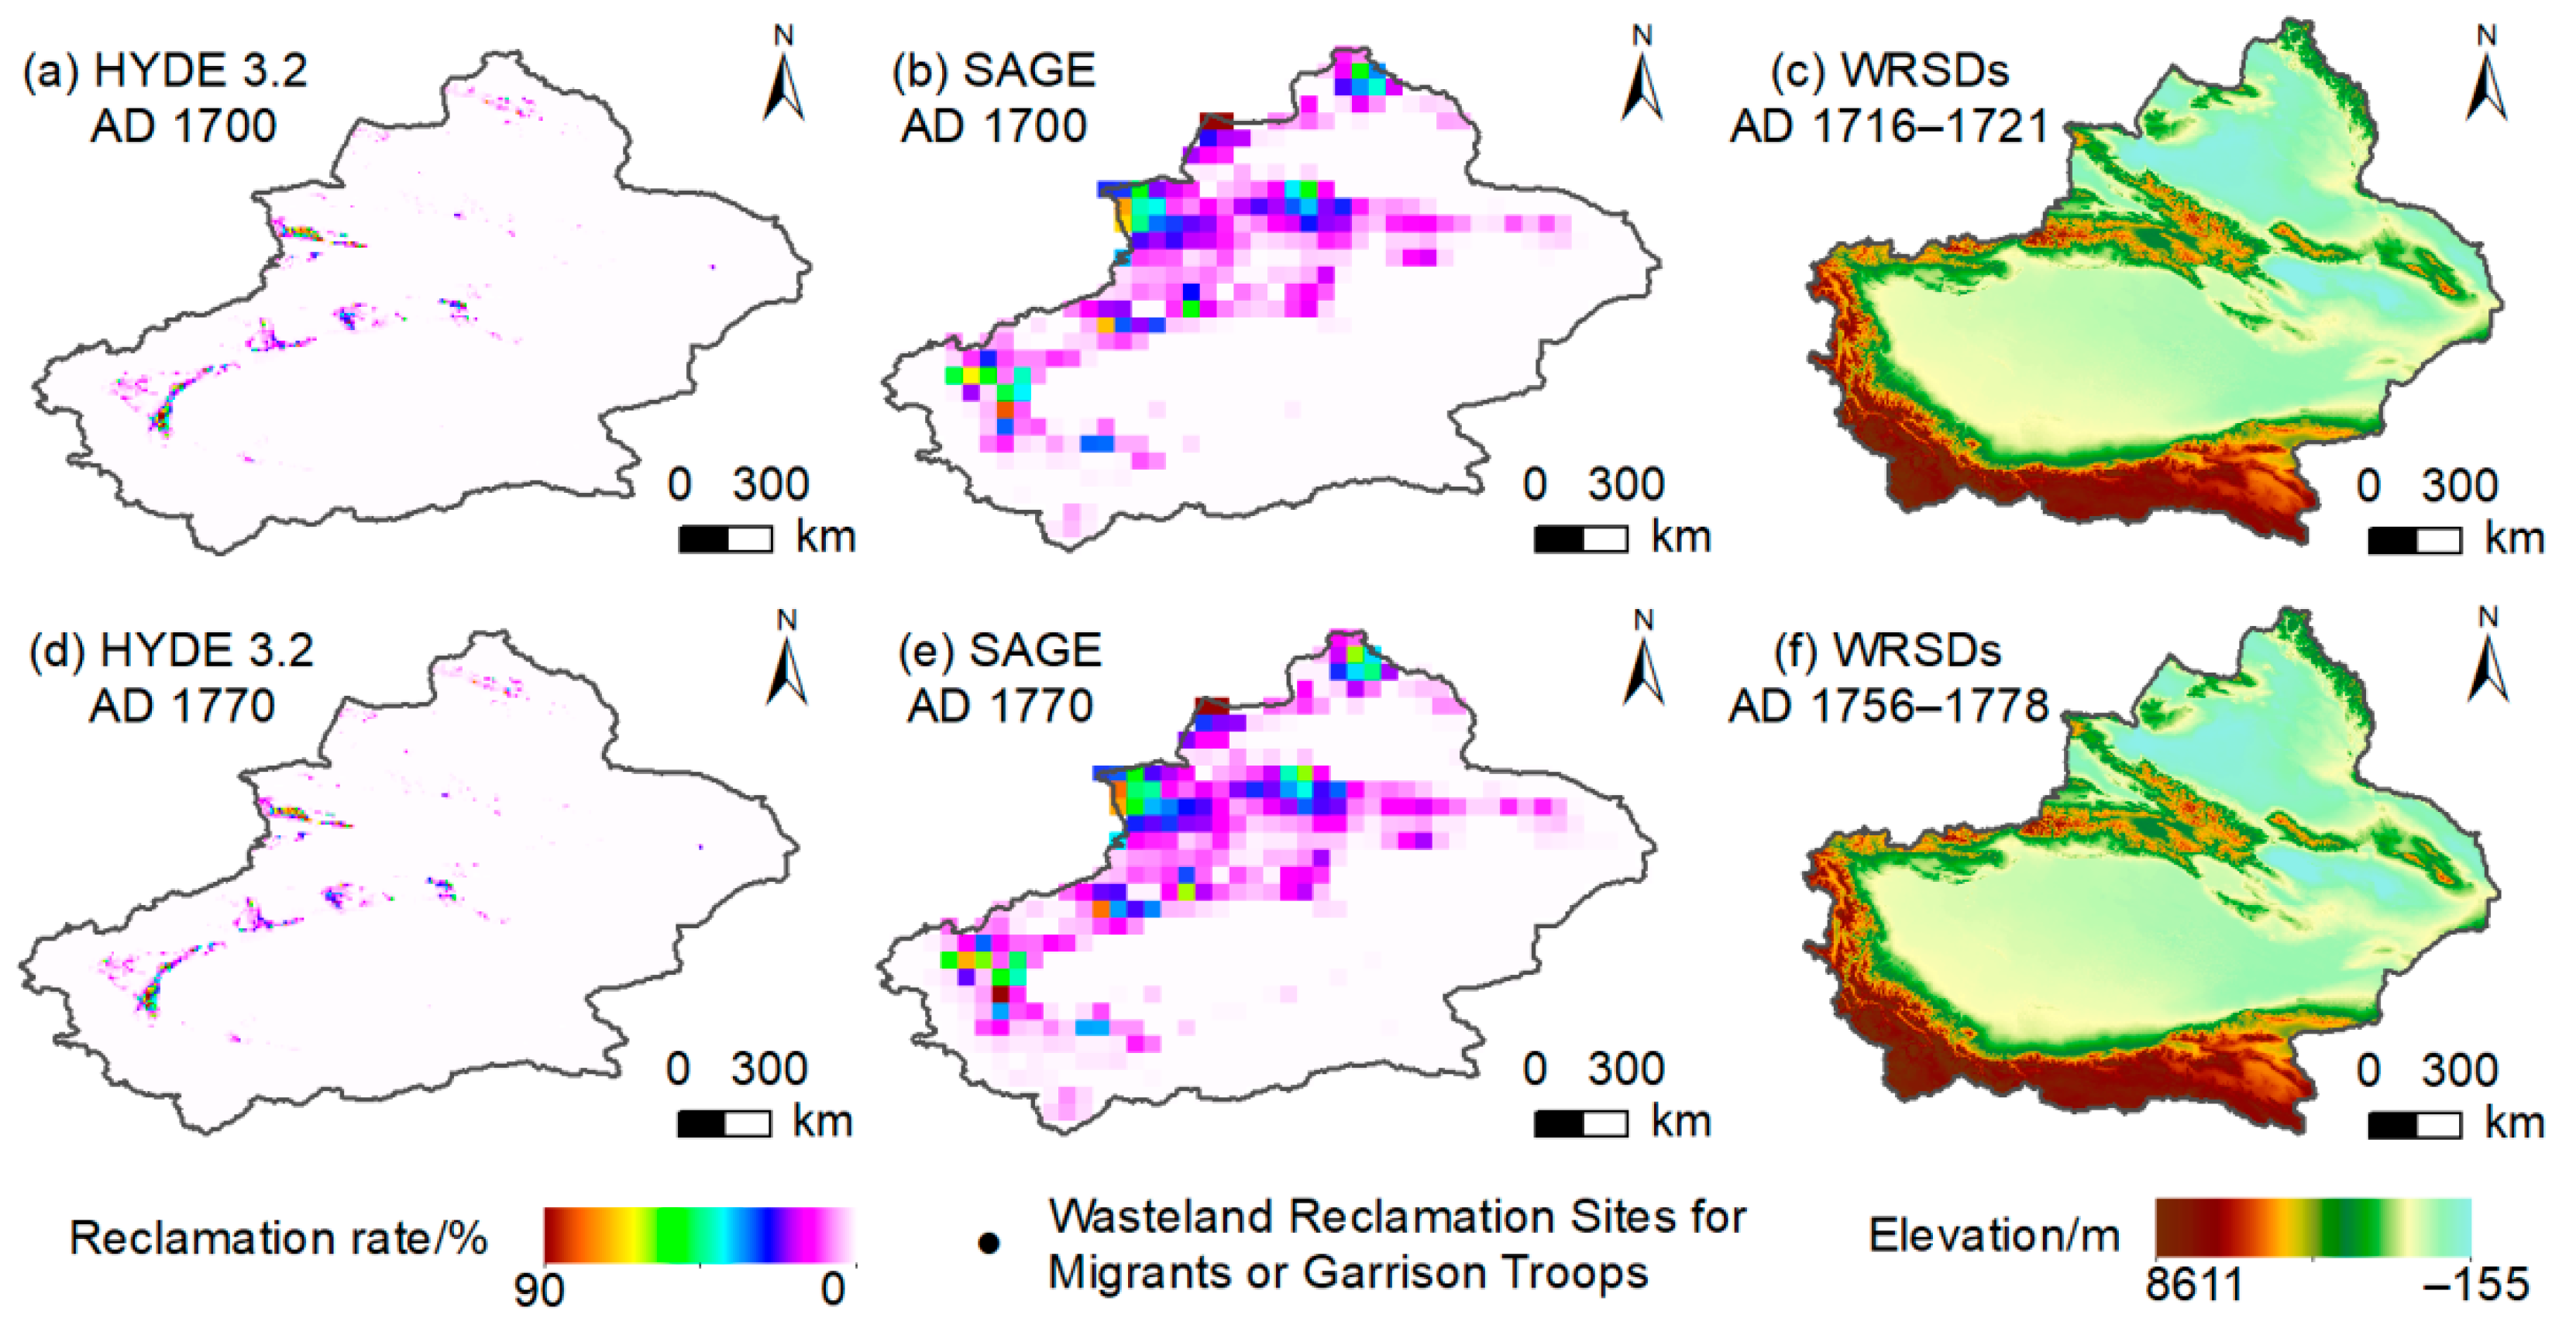
2.2.4. Historical Data of Wasteland Reclamation Sites for Migrants or Garrison Troops

Although the Chinese Historical Cropland Dataset (CHCD) includes the cropland spatial distribution data of Xinjiang province over the past 300 years, this dataset still has many uncertainties regarding Xinjiang province and cannot reflect its historical cropland spatial distribution well. Historical data on the wasteland reclamation sites for migrants or garrison troops (hereafter, WRSD) can provide the spatial pattern information on cropland in the Xinjiang area in the Qing Dynasty, so these data were used to evaluate the uncertainties of cropland spatial patterns from the global datasets in this study. The WRSD were mainly derived from the Study on Tunken of Silk Road [44], which has systematically collated WRSD in the Xinjiang area in the Qing Dynasty according to historical documents and local gazetteers, and confirmed the modern corresponding geographic names and positions of these WRSD by using field investigation and archaeological verification methods (Table 1). We integrated this spatial information of the wasteland reclamation sites for migrants or garrison troops based on a modern administrative division map of the Xinjiang area and digitized these sites by using GIS, including 5 sites in the early Qing Dynasty (AD 1716–1721) and 109 sites in the middle Qing Dynasty (AD 1756–1778); then, the corresponding spatial distribution maps were obtained.

2.3. Evaluation Methods

Based on regional cropland datasets and the historical data on wasteland reclamation sites for migrants or garrison troops, the reliability of cropland data in Xinjiang for AD 1766–1944, AD 1933–1999, and the 1980s–2010 within the global datasets was evaluated by using accuracy and rationality evaluation methods.

2.3.1. Accuracy Evaluation Methods

Accuracy evaluation is a type of quantitative reliability evaluation that uses regional land use data reconstructed by using historical or natural records as the baseline. In this method, the accuracy of the data in the historical global land use datasets for the study area is evaluated by calculating their deviation from regional land use data [21]. In this study, trend comparison and the relative difference rate were selected to evaluate the accuracy of the amount of cropland data for the Xinjiang area in HYDE 3.2 and SAGE.
(1) Trend Comparison. Trend comparison is a method that can reveal the differences in the changing trends of different datasets from a macro perspective [45]. This study used the trend comparison method to quantitatively evaluate the uncertainties of the changing cropland trends in Xinjiang in the global datasets for the described evaluation periods. Through this method, we took the land use dynamic degree as an indicator, and it was calculated using the following Equation (1):
K = C ( t 2 ) C ( t 1 ) C ( t 1 ) × 1 T × 100 %
where K is the dynamic degree of cropland change in the study period, and its absolute value can indicate the changing intensity of the cropland area. C (t1) and C (t2) are the cropland areas for year t1 and year t2 in the global and regional datasets in the Xinjiang area, respectively. T is the study duration and has a unit of years in this study. The K value is the annual change rate of the cropland area, and a positive or negative K indicates an increase or decrease in the cropland area, respectively.
(2) Relative Difference Rate. The relative difference rate can be used to characterize the degrees of difference between different individuals of the same type [23]. We used the relative difference rate to assess the different degrees of cropland area or coverage in the whole territory, region, and grid scale of Xinjiang within the different datasets considered in this study. The calculation equation is given below (Equation (2)):
R = C g l o b e ( t ) C X J ( t ) C X J ( t ) × 100 %
where Cglobe (t) and CXJ (t) are the cropland area or its coverage at the scale of the whole territory, region, and grid scale of Xinjiang in global datasets and regional datasets, respectively. The R value is the relative difference rate between Cglobe (t) and CXJ (t), and its absolute value can indicate the degree of difference among the cropland area or its coverage in the global datasets and regional datasets. Meanwhile, a positive or negative R indicates that the cropland area or its coverage in the global datasets is higher or lower than that in the regional datasets, respectively.
Because the cropland reconstruction time points in the global and regional datasets are not completely consistent, this study calculated the R values between the cropland area or its coverage for AD 1930, 1950, 1960, 1980, and 2000 in global datasets and that for AD 1933, 1955, 1960, 1980, and 1999 in the Ge dataset; the R values between the cropland area for AD 1980, 2000, 2005, and 2010 in global datasets and that in CWLUCC; and the R values between the cropland area or its coverage for AD 1770, 1790, 1810, 1850, 1910, and 1940 in global datasets and that for AD 1766, 1795, 1806, 1852, 1909, and 1944 in the Zhang dataset, respectively. The total cropland areas of the study area from the global datasets were calculated on the basis of each grid area within the study area and corresponding cropland coverage using MATLAB 9.10 developed by the MathWorks in Massachusetts of Amarica, whereas the corresponding values from CWLUCC were calculated by using “Spatial Analyst/Raster Calculator” in ArcGIS 10.2.
Moreover, the R values between the cropland coverage in global datasets for AD 2000 and that in CWLUCC were also calculated at the grid scale. As the two global datasets, including HYDE 3.2 and SAGE, and CWLUCC data vary in time and spatial resolution, to facilitate spatial comparison, the cropland data of Xinjiang province for AD 2000 in the two global datasets and CWLUCC were selected, and these data were resampled to 10 km using the data management tool “Resample” in ArcGIS 10.2. Then, “Spatial Analyst/Raster Calculator” in ArcGIS 10.2 was used to calculate the relative difference rates between the two global datasets and CWLUCC at a scale of 10 km.

2.3.2. Rationality Evaluation Methods

For some regions where fewer quantitatively reconstructed regional cropland datasets are available, historical facts relating to regional agricultural development can be used as evidence for a rationality evaluation. A variety of historical records could be used directly or indirectly to indicate the characteristics of regional agricultural development. Examples of direct records include historical descriptions of processes of regional land reclamation and agricultural development and archeological relics of crops and farming tools. Examples of indirect records include descriptions of land policies, advancing technologies, population and migration characteristics, major social events, settlement relics, and sediments relating to the regional agricultural history [21].
Because no spatially explicit cropland datasets covering the entirety of Xinjiang province can be used to evaluate the uncertainties in historical cropland spatial patterns in these global datasets, the regional historical distribution data on wasteland reclamation sites designated for migrants or garrison troops in the early (AD 1716–1721) and middle Qing Dynasty (AD 1756–1778) and the cropland coverage at the sub-region scale for the northern piedmont of Tianshan Mountains covering AD 1766–1944 (Zhang dataset) were used to evaluate the spatial patterns and changes in cropland for AD 1716–1778 and AD 1777–1944 in the Xinjiang area for the HYDE 3.2 and SAGE datasets, respectively.
By utilizing GIS, the wasteland reclamation sites for migrants or garrison troops in the early (AD 1716–1721) and middle Qing Dynasty (AD 1756–1778), recorded in historical records, were calibrated and digitized; the cropland coverage at the sub-region scale for the northern piedmont of the Tianshan Mountains covering AD 1766–1944 was calculated, and the corresponding spatial distribution maps were also obtained. We then compared these maps with the cropland spatial patterns for the corresponding time points in the HYDE 3.2 and SAGE datasets to assess the rationality of the historical cropland spatial patterns in the Xinjiang area from these global datasets.

3. Results

3.1. Differences in Cropland Area

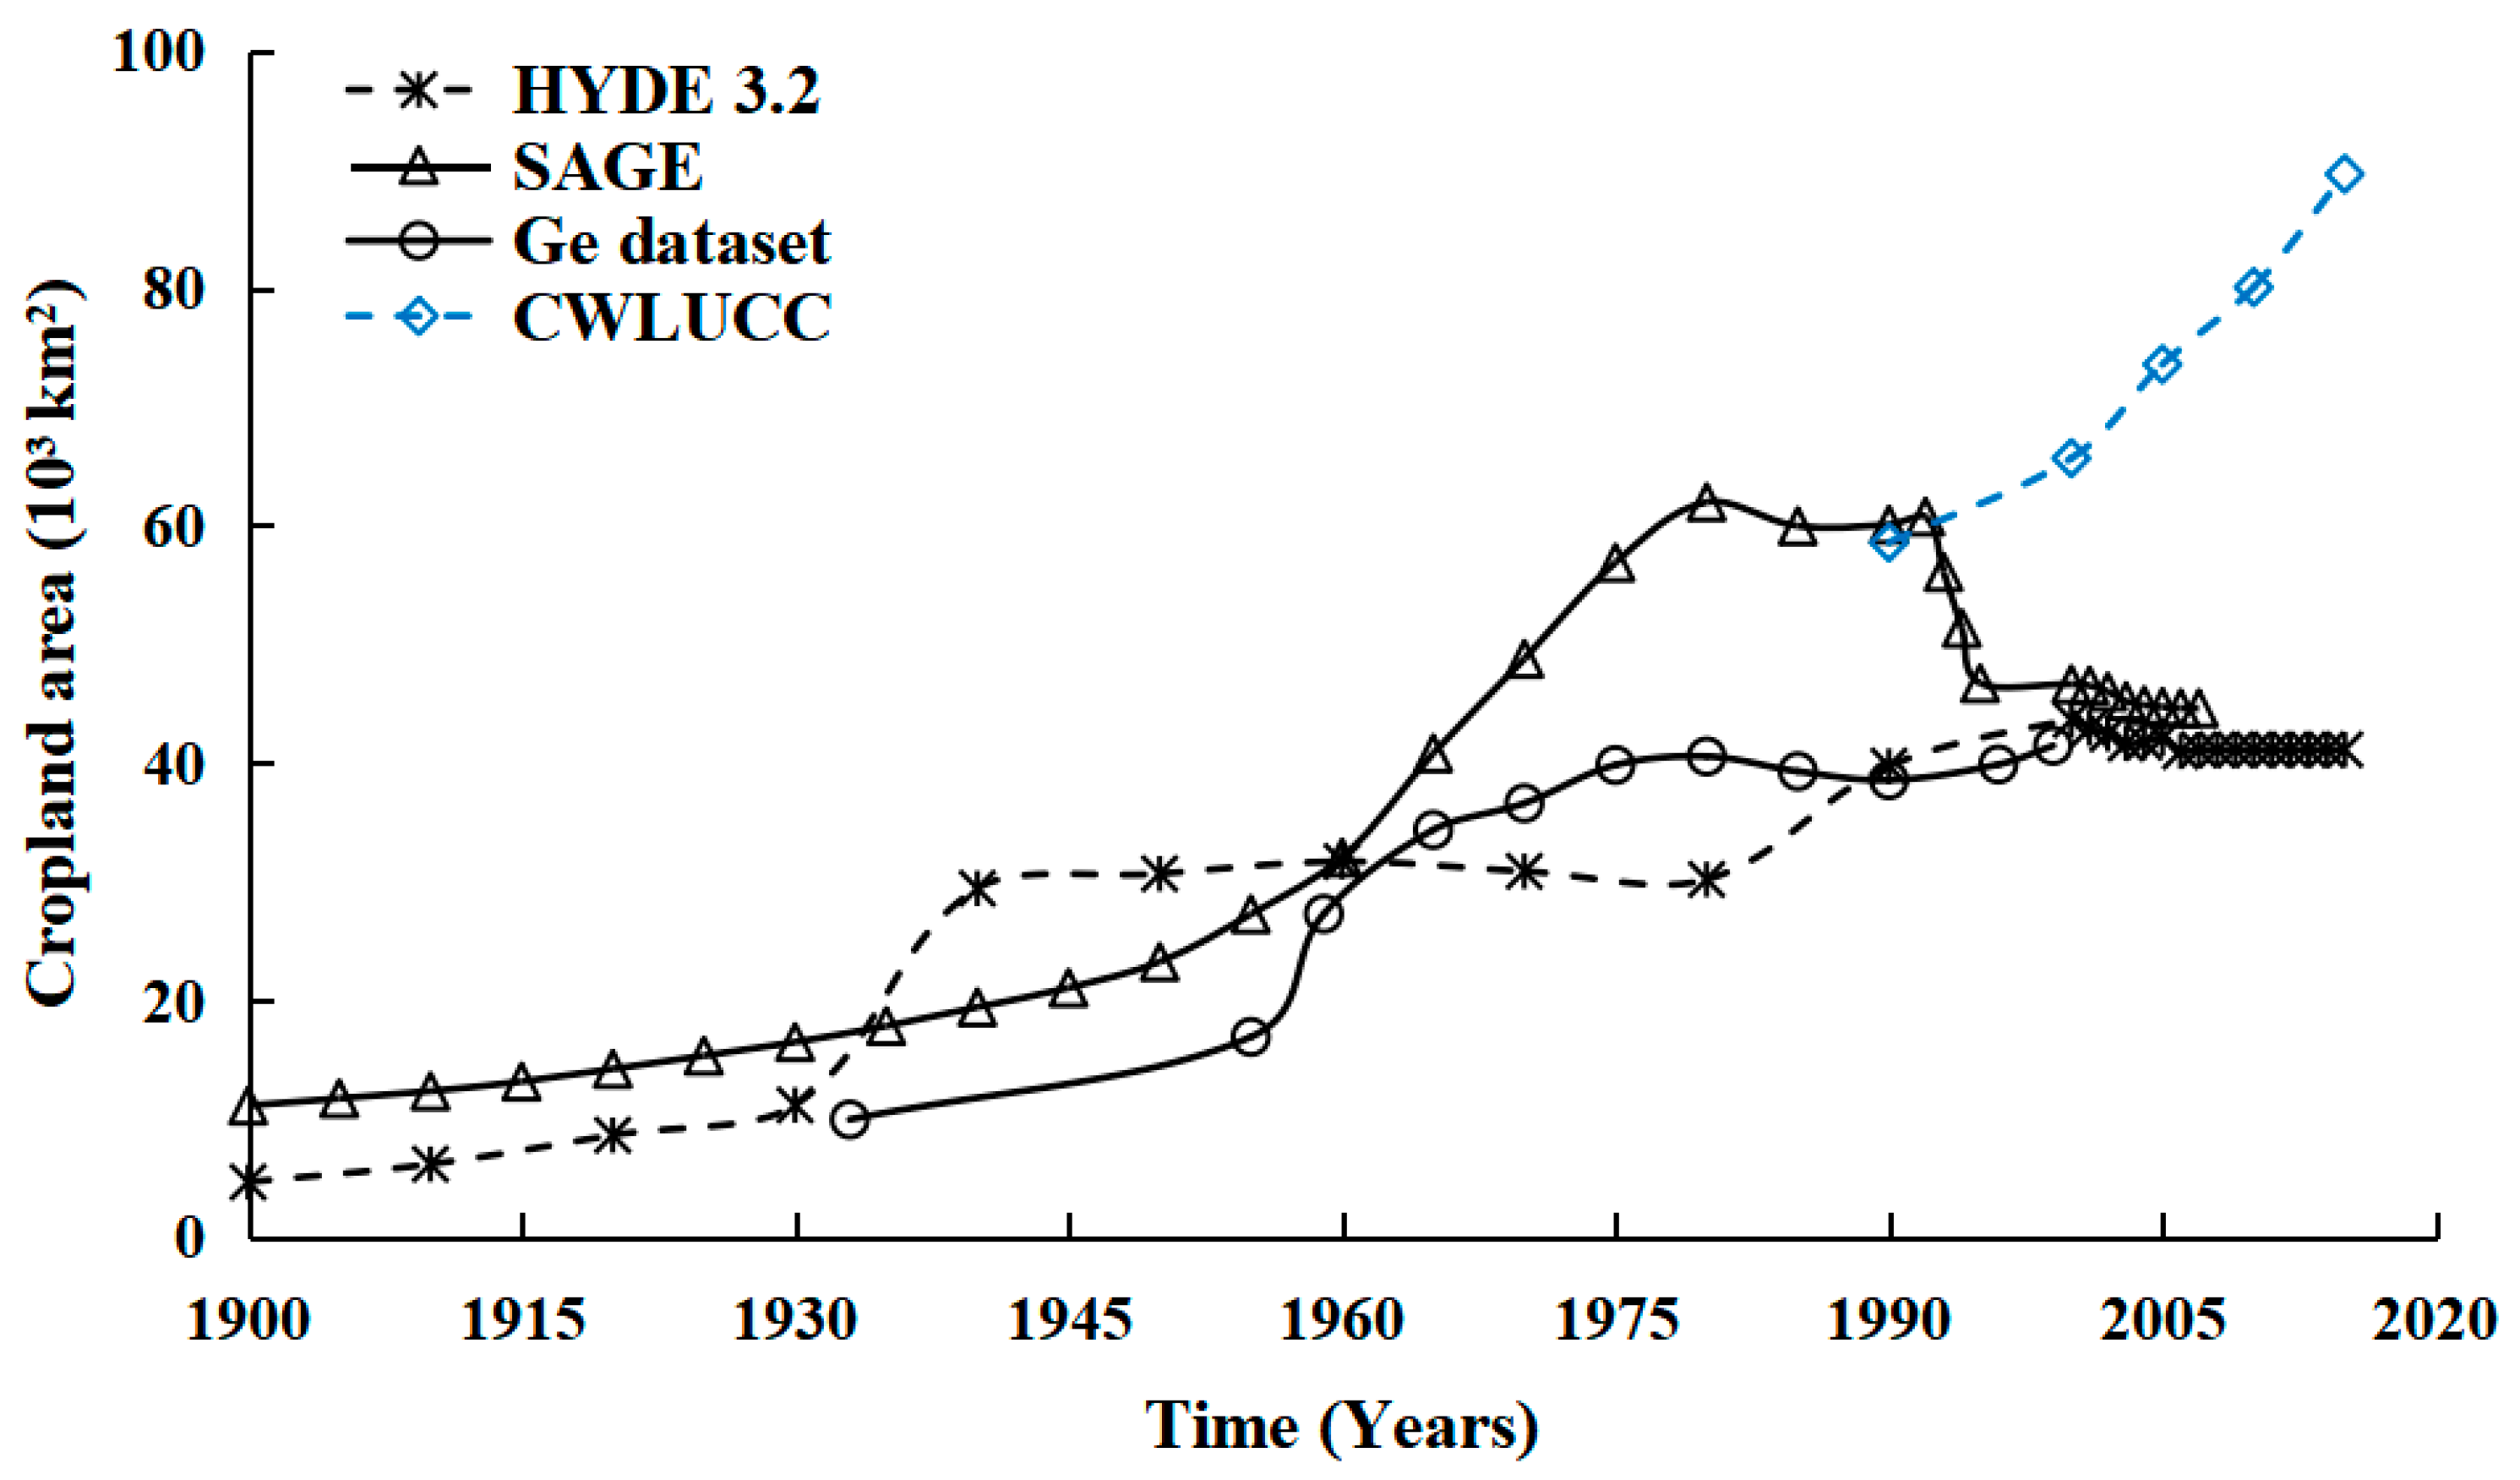
3.1.1. Cropland Area for Xinjiang Province

Two regional datasets, the historical reconstruction Ge dataset and the remote sensing source CWLUCC, were used in this study to evaluate the total cropland area in Xinjiang in global datasets over the past 100 years and AD 1980–2010, respectively.
The cropland area in Xinjiang province in the global datasets was generally increasing over the past 100 years (Figure 3). In HYDE 3.2, the cropland coverage in Xinjiang province increased from 0.28% in AD 1900 to 2.47% in AD 2010, and the cropland area increased by 7.80 times. Moreover, five stages were identified in HYDE 3.2: a slow growth period from AD 1900 to 1930, with an annual growth rate of 4.63%; a rapid growth period from AD 1930 to 1940, with an annual growth rate of 16.35%; a relatively stable or slow growth period from AD 1940 to 1980, with an annual change rate of 0.06%; a rapid growth period from AD 1980 to 2000, with an annual change rate of 2.23%; and a slowly decreasing and gradually stabilizing period from AD 2000 to 2010, with an annual change rate of –0.58%. In SAGE, the cropland coverage in Xinjiang province increased from 0.28% in AD 1900 to 3.72% in AD 1980, and the cropland area increased by 4.58 times. Subsequently, the cropland coverage decreased to 2.68% in AD 2007. Five stages were also identified in SAGE: a slow growth period for AD 1900–1960, with an annual growth rate of 3.13%; a rapid growth period for AD 1960–1980, with an annual growth rate of 4.68%; a slowly decreasing period for AD 1980–1990, with an annual growth rate of –0.31%; a rapid decline period for AD 1990–1995, with an annual growth rate of –4.45%; and a slowly decreasing and gradually stabilizing period from AD 1995 to 2007, with an annual growth rate of –0.37%. According to the Chinese Ge dataset, the cropland area in Xinjiang province also increased in the past 100 years, but the change trend was quite different from that presented in the global datasets. Three stages were identified in the Ge dataset: a slow growth period from AD 1933 to 1955, with an annual growth rate of 3.18%; a rapid growth period from AD 1955 to 1980, with an annual growth rate of 5.59%; and a relatively stable period post-1980, during which the cropland coverage fluctuated between 2.31% and 2.49%.
The relative difference rates were used to evaluate the differences in the total cropland area of Xinjiang province between the two global datasets and the Chinese datasets in this study. The evaluation results for the past 100 years are depicted in Table 2. Pre-1960, the total cropland area in HYDE 3.2 was significantly greater than that in the Ge dataset; post-1960, the former was significantly lower than the latter. In particular, for AD 1955, the total cropland area in Xinjiang province in HYDE 3.2 was 81.87% greater (i.e., almost twice as high) than that of the Ge dataset. However, the former was 25.57% lower than the latter in AD 1980. For SAGE, the total cropland area of Xinjiang province was generally greater than that in the Ge dataset. Although the total cropland area of Xinjiang province was similar in the two datasets in 1960, with a relative difference rate of 24.31%, in AD 1933 and 1980, the relative difference rate of the two datasets reached 65.66% and 52.86%—grossly significant differences.
For the 1980s–2010, the total cropland area in Xinjiang province showed a rapid growth trend in CWLUCC (Figure 1). The cropland coverage increased from 3.52% in the 1980s to 4.81% in 2010, and the total cropland area increased by 36.71%. However, the total cropland area of Xinjiang province in the two global datasets was generally stable, with coverage of 2.39–2.47% and 2.68–2.80%, respectively (Table 3). The total cropland area of Xinjiang province in the HYDE 3.2 and SAGE datasets was also significantly different from that in CWLUCC, with the relative difference rates ranging from –48.67% and –44.16% to –32.18% and 2.56%, respectively. The comparison results indicated that both the HYDE 3.2 and SAGE datasets underestimate the cropland area of Xinjiang province after AD 1980.

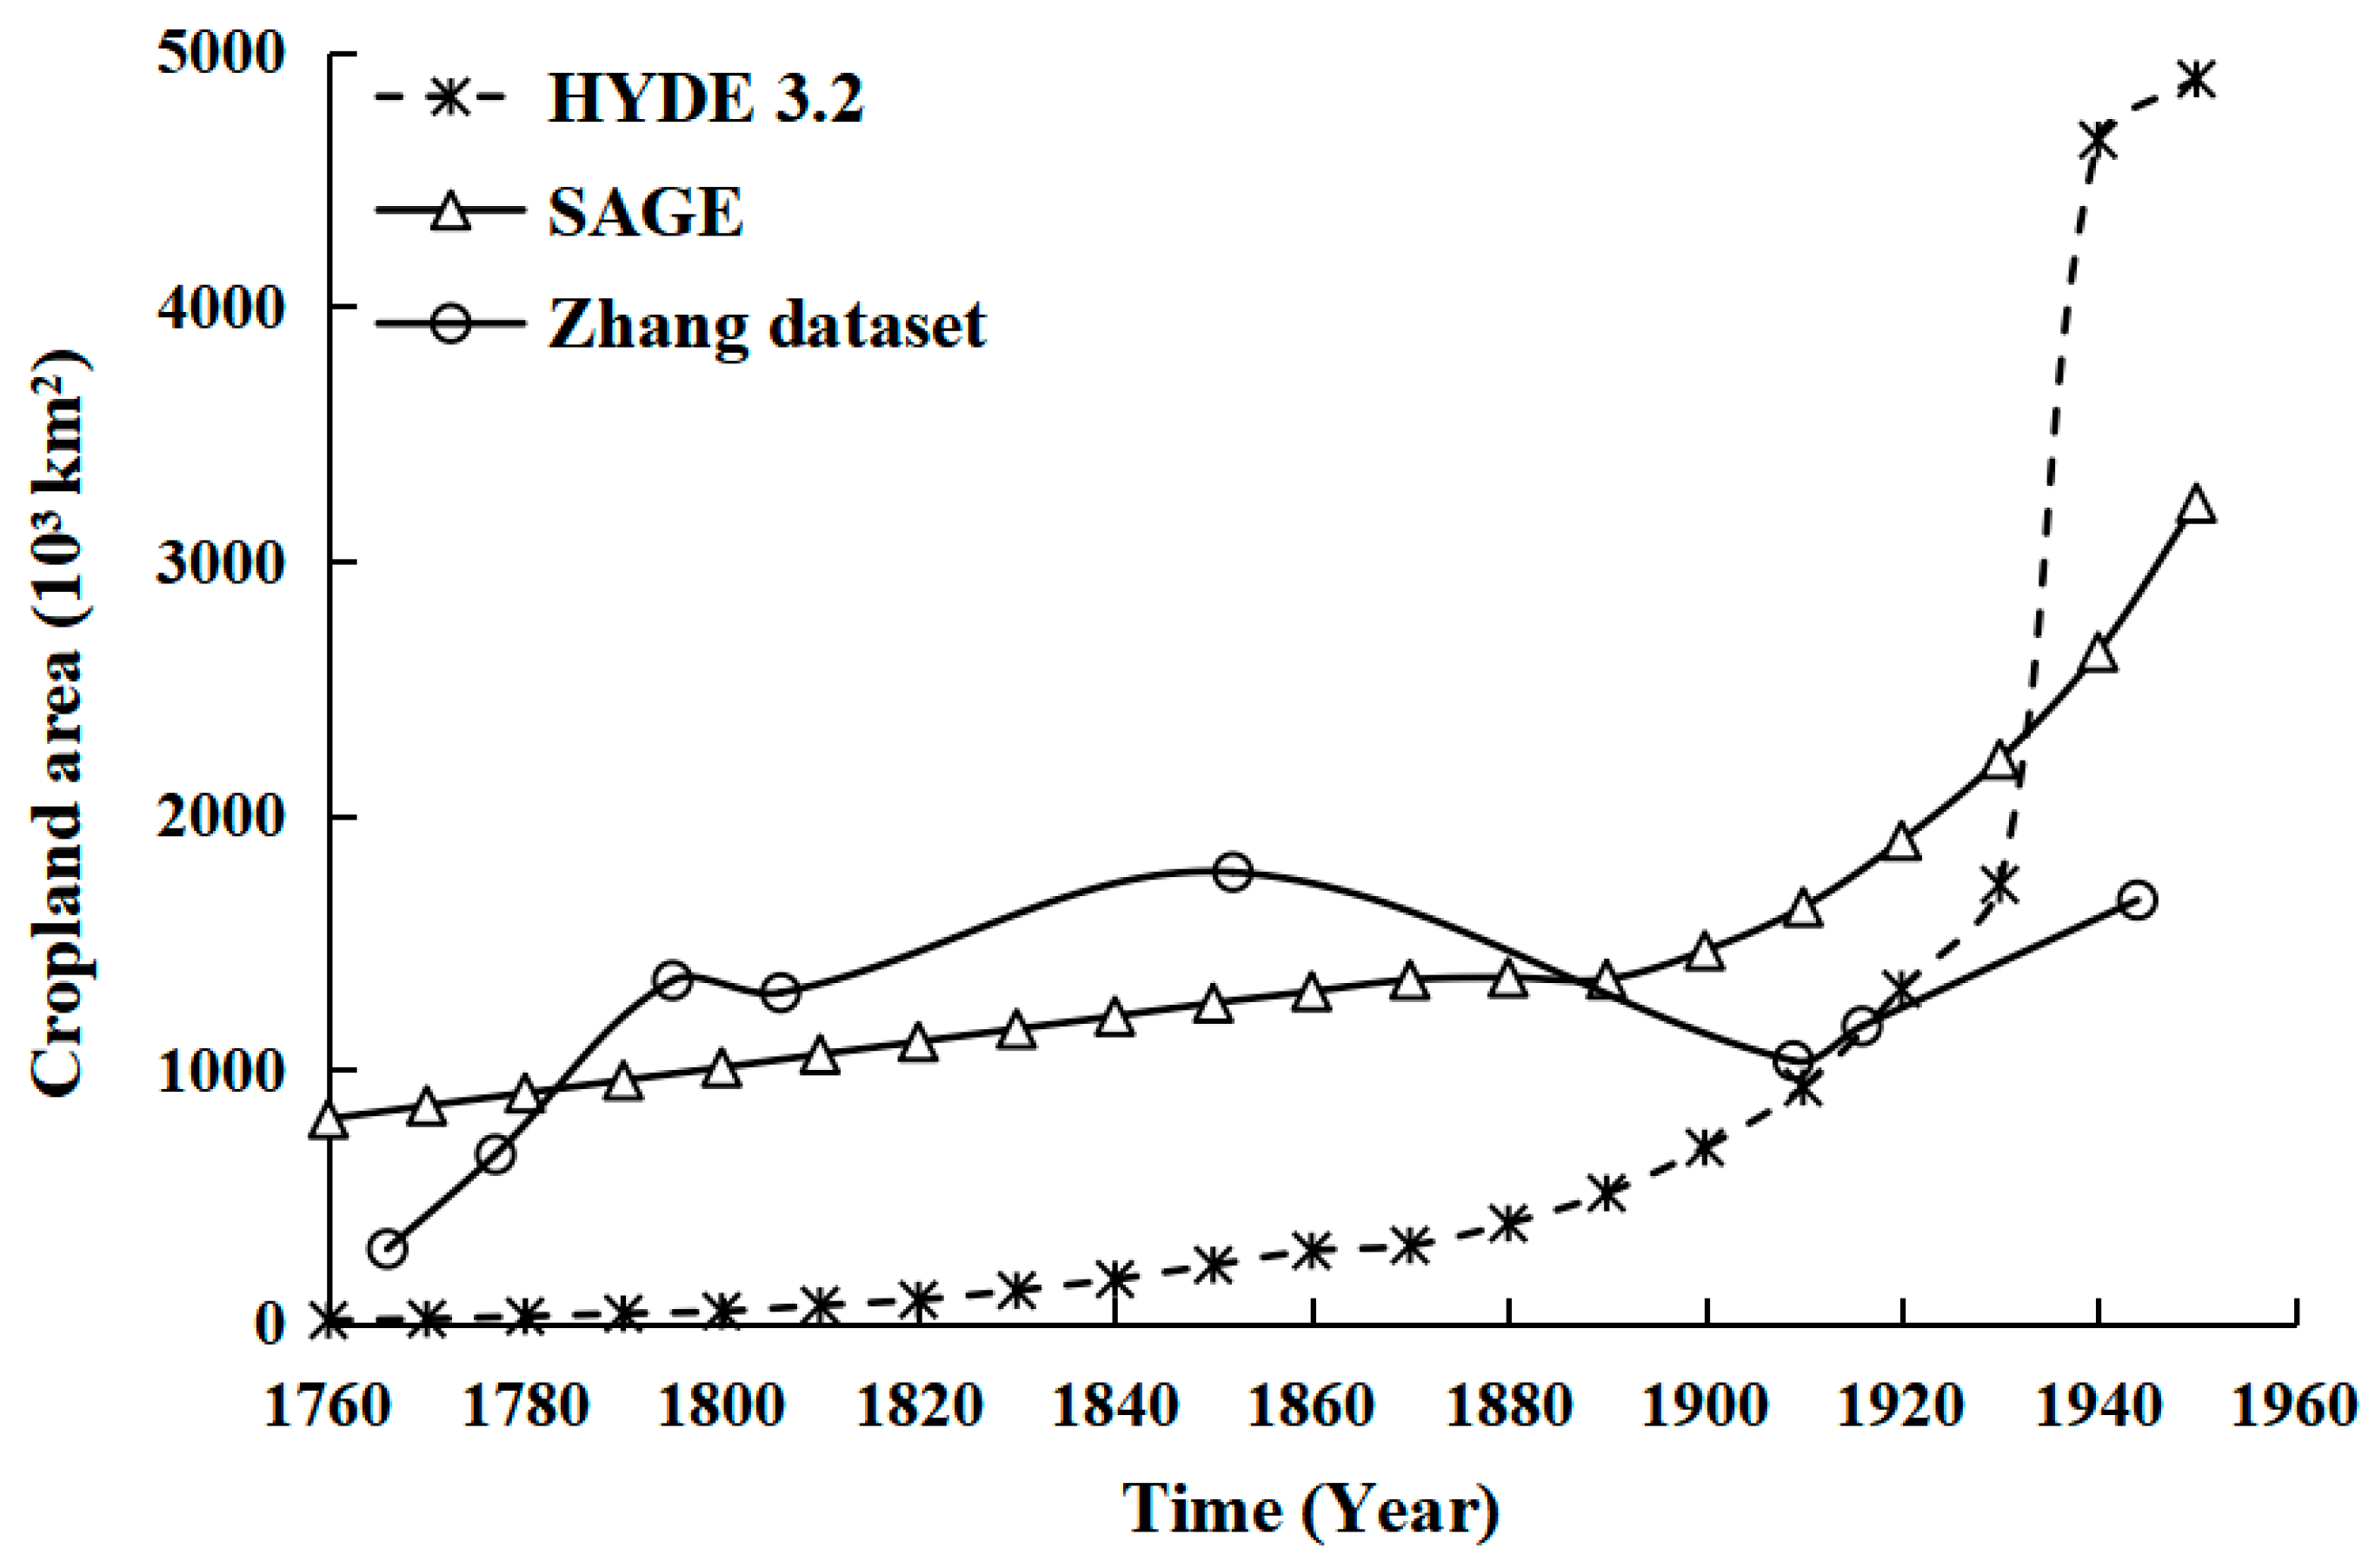
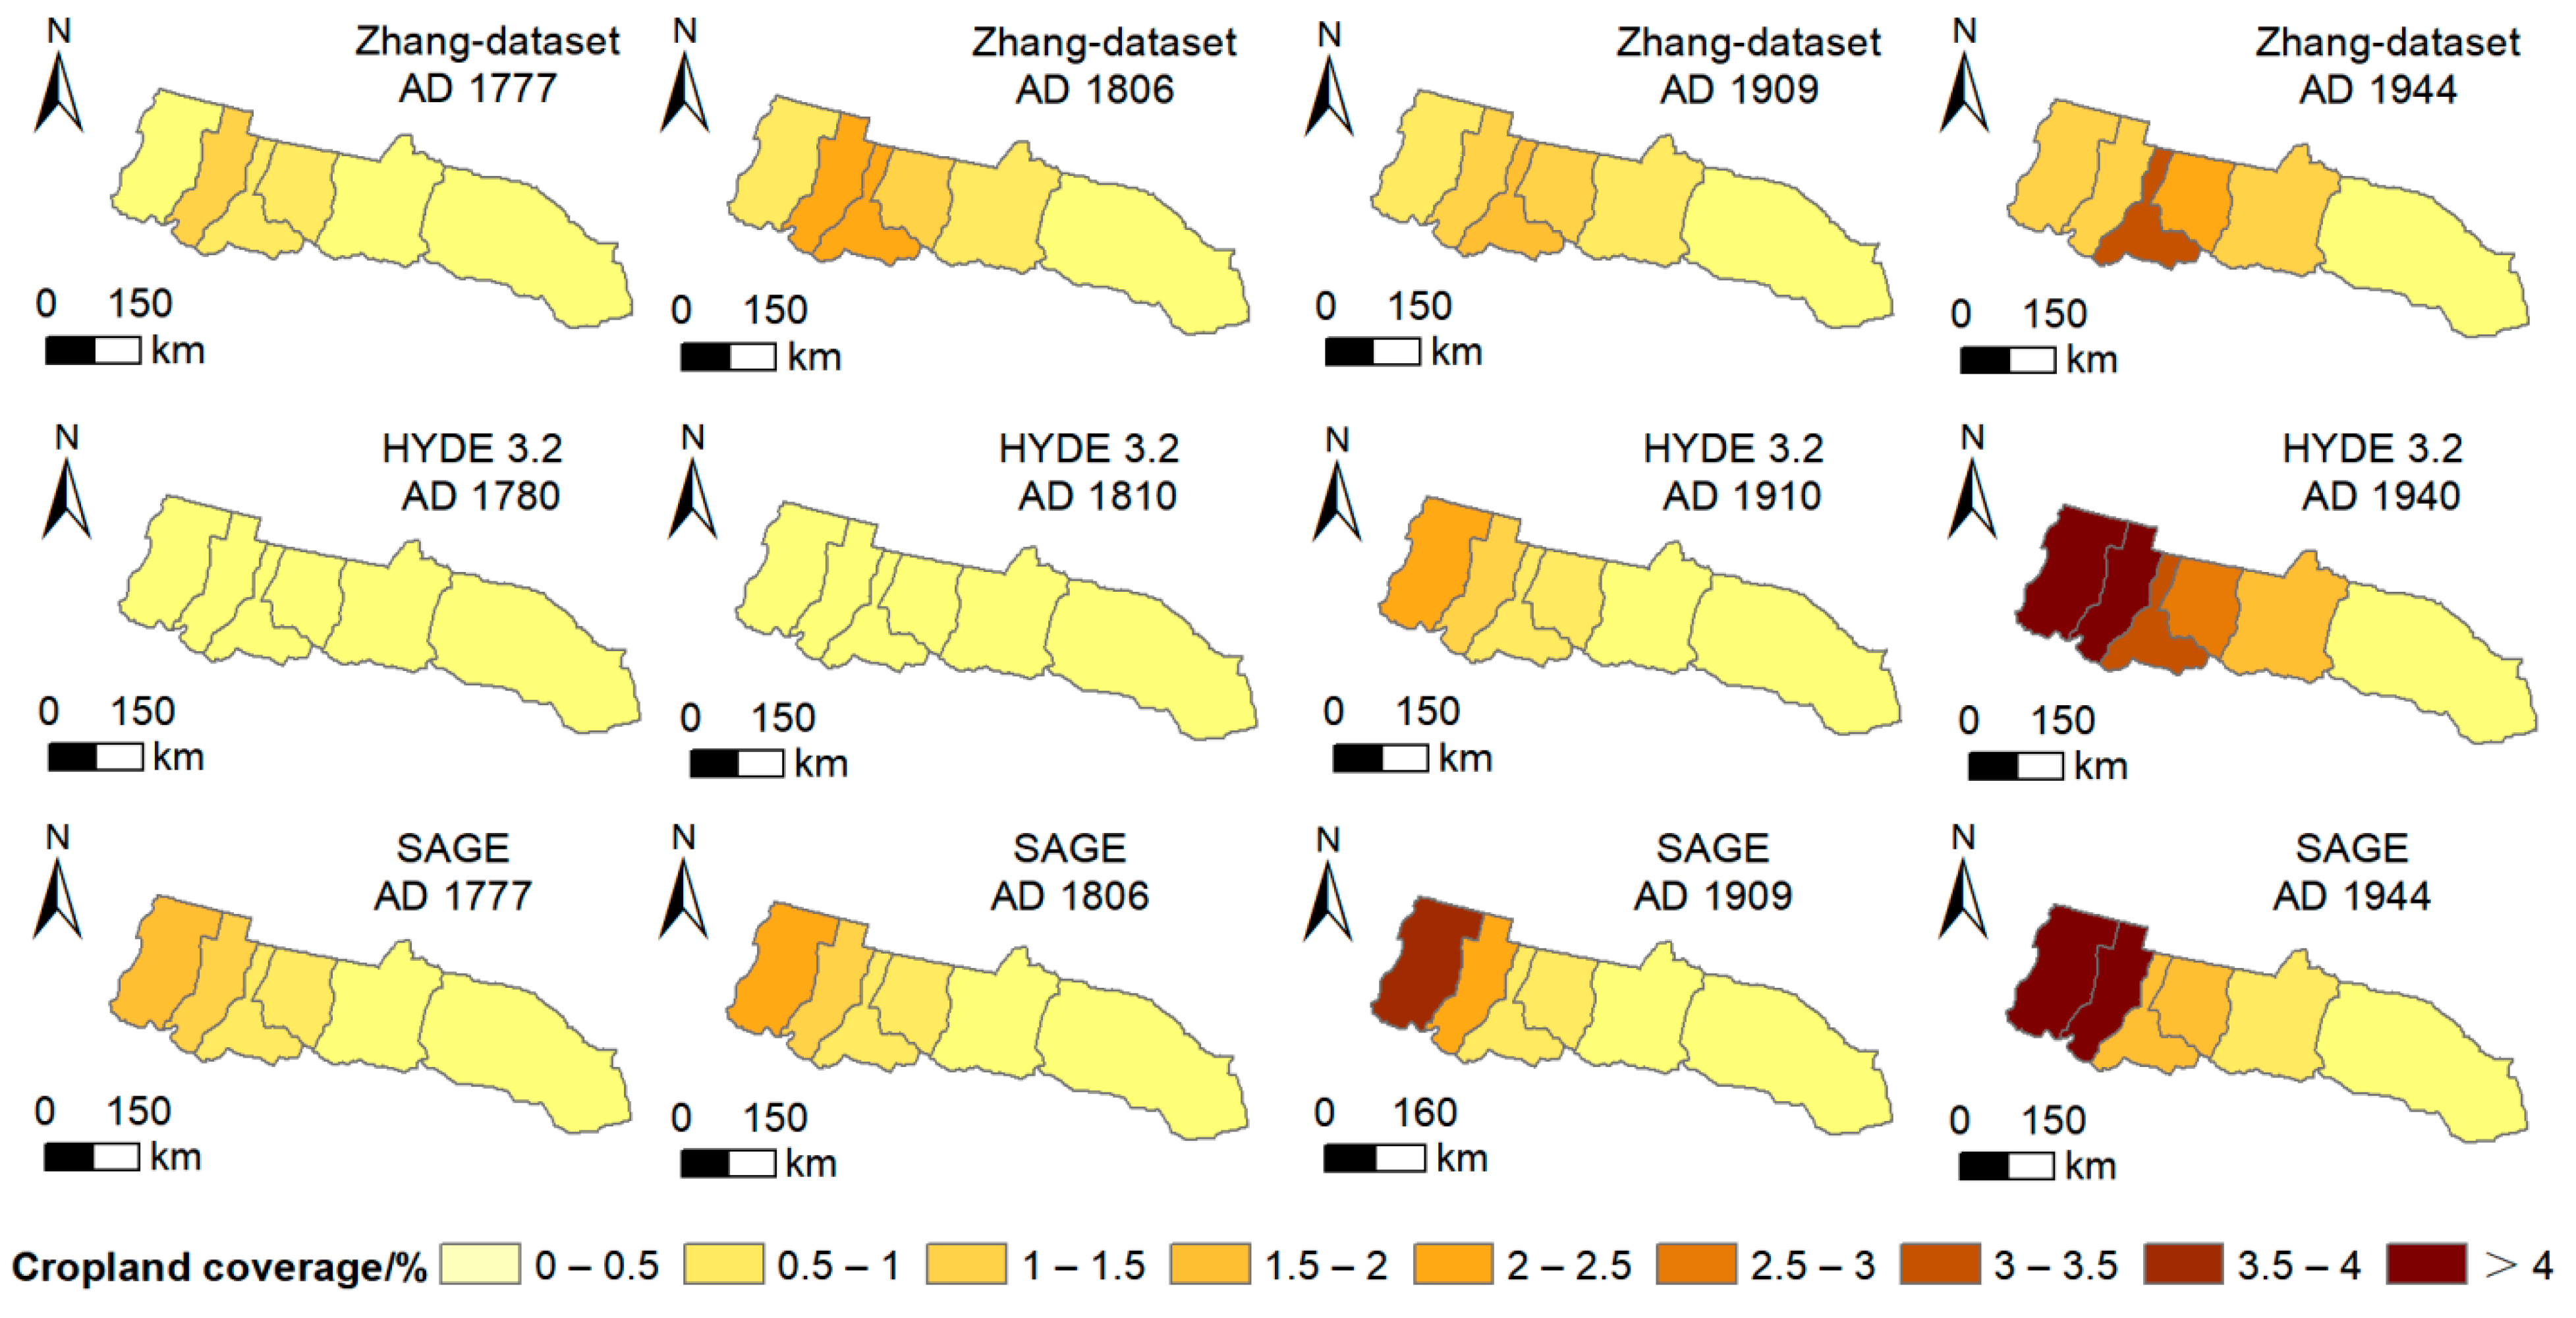
3.1.2. Cropland Area for the Northern Piedmont of the Tianshan Mountains

To further clarify the possible uncertainties of the cropland data in the Xinjiang area in these global datasets, this study chose the Zhang dataset, which reconstructed the cropland area of the northern piedmont of the Tianshan Mountains in the Xinjiang area for the middle of the Qing Dynasty to Republican China (AD 1766–1944), in order to quantitatively evaluate the HYDE 3.2 and SAGE datasets for a longer time period.
As shown in Figure 4, the changing trend of the cropland area in the northern piedmont of the Tianshan Mountains from AD 1770 to 1940 in the Zhang dataset is quite different from the trend revealed by the global dataset. Global datasets indicate that the cropland area in the northern piedmont of the Tianshan Mountains showed an increasing trend for AD 1770–1940. In HYDE 3.2, the cropland coverage increased from 0.01% in AD 1770 to 2.93% in AD 1940, and the cropland area increased by ~263.21 times. Two stages were identified in HYDE 3.2: a slow growth period from AD 1770 to 1930, with an annual growth rate of 2.91%, and a rapid growth period from AD 1930 to 1940, with an annual growth rate of 10.43%. In SAGE, the cropland coverage increased from 0.54% in AD 1770 to 1.66% in AD 1940, and the cropland area increased by ~2.08 times. It can be also roughly divided into two stages in SAGE: a slow growth period from AD 1770 to 1890, with an annual growth rate of 0.38%, and rapid growth from AD 1890 to 1940, with an annual growth rate of 1.35%. However, in the Zhang dataset, under the influence of war, the land reclamation in the northern piedmont of the Tianshan Mountains experienced three stages from the middle Qing Dynasty to the Republic of China (AD 1766–1944): (1) opening up the original wasteland, (2) abandoning the cropland due to war, and (3) reclaiming the abandoned cropland [39]. The corresponding cropland coverage first increased from 0.18% in AD 1766 to 1.12% in AD 1852, with an annual growth rate of 2.12%; then, it dropped to 0.65% in AD 1909, with an annual decline rate of −0.94%; and then it recovered to 1.05% in AD 1944, with an annual growth rate of 1.37%.
The relative difference rate indicates that the cropland areas in these global datasets in the northern piedmont of Tianshan Mountains are significantly different from those in the Zhang dataset (Table 4). Pre-1910, the cropland areas of the northern piedmont of the Tianshan Mountains in HYDE 3.2 are significantly lower than that in the Zhang dataset; post-1910, the former is significantly greater than the latter. Specifically, for AD 1790 and 1940, the relative difference rates between HYDE 3.2 and the Zhang dataset are –97.14% and 179.56%, respectively. Although the cropland areas in the northern piedmont of the Tianshan Mountains in SAGE are generally close to those in the Zhang dataset, the relative difference rates between the two datasets still reach up to 192.42% and 58.67% in AD 1770 and 1940, respectively.

3.2. Spatial Patterns of Cropland

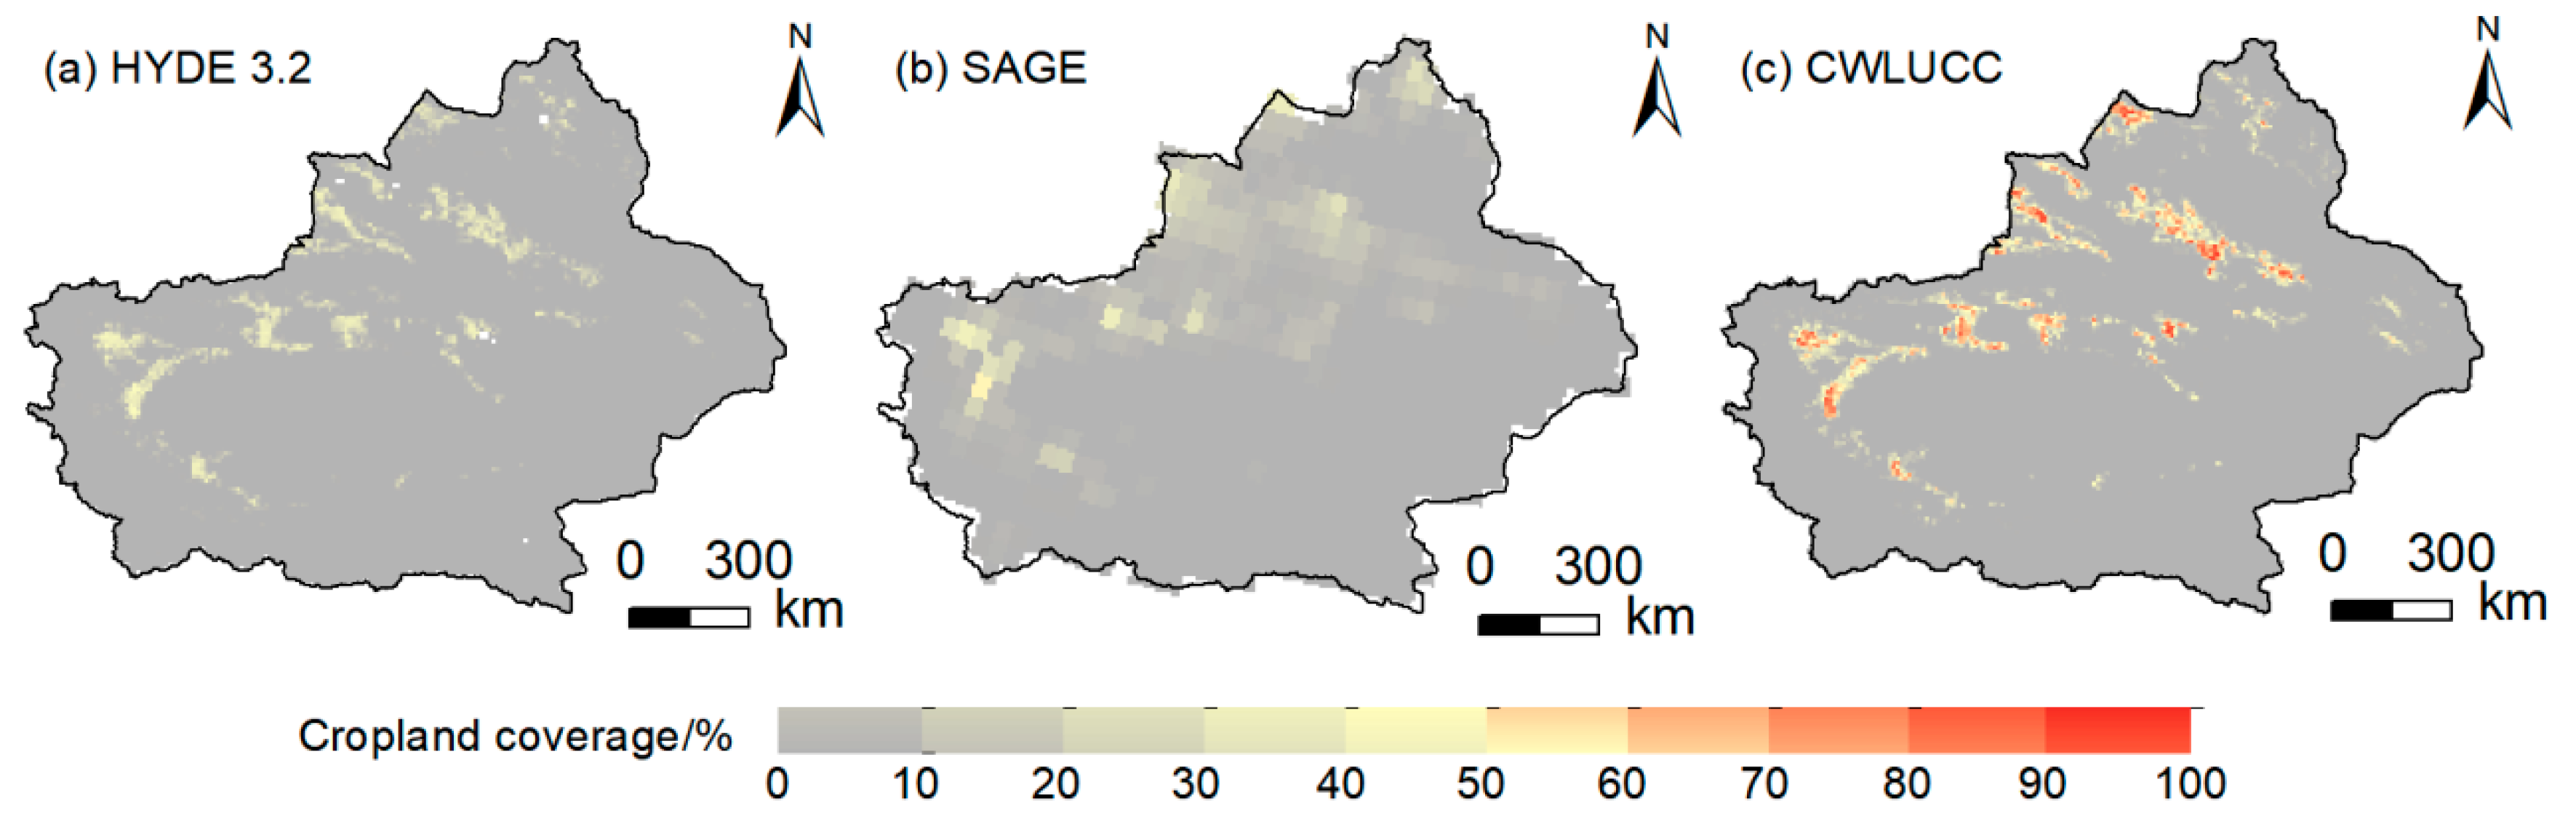
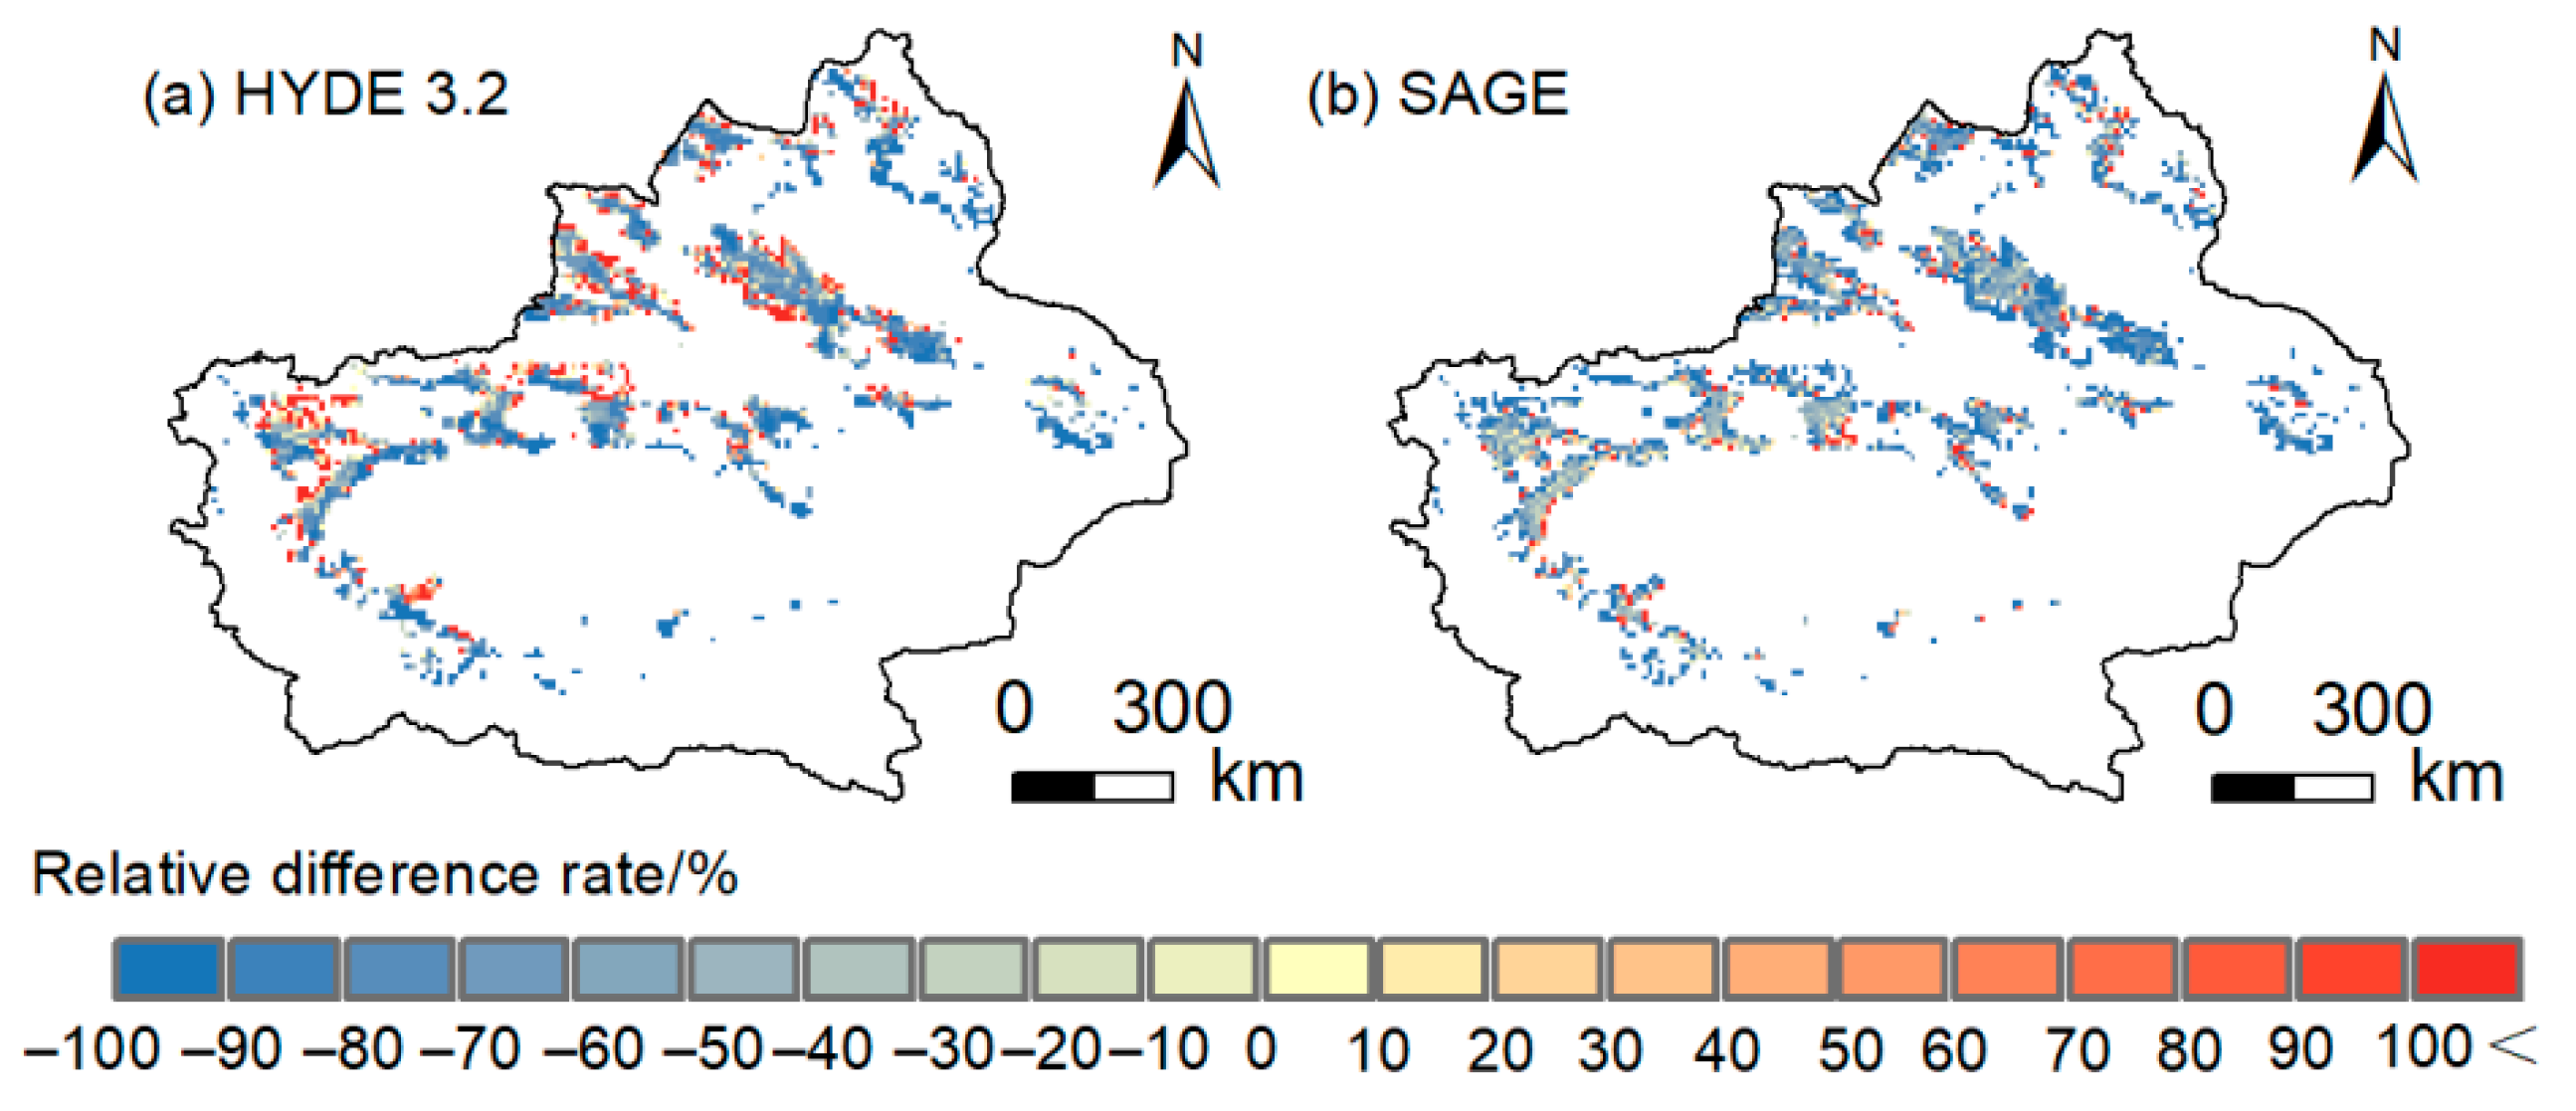
3.2.1. Satellite-Based Spatial Patterns

Figure 5 shows the spatial distribution of cropland in Xinjiang province for AD 2000 from HYDE 3.2, SAGE, and CWLUCC. As shown, the cropland spatial distributions from the three datasets are relatively close at the provincial scale, indicating that the cropland of Xinjiang province is mainly distributed in the oasis areas, such as the two sides of the Tianshan Mountains, the south side of the Altai Mountains, and the north side of the Kunlun Mountains, and sporadic cropland can be found in Eastern Xinjiang. However, the cropland spatial patterns also reflect obvious differences, due to the large variations in the total cropland areas. For example, in CWLUCC, cropland areas in the center of the oasis are significantly greater than those at the edge of the oasis due to the dense population, whereas cropland is evenly distributed in the oasis areas and the cropland distribution is spatially tiled in HYDE 3.2 and SAGE.
The relative difference rates between the cropland coverage in the global and CWLUCC datasets were calculated at the grid scale. The corresponding results are presented in Figure 6. As shown, there are significant negative relative difference rates in the center of the oasis, while the edges of the oasis have large positive relative difference rates in comparing the two global datasets with CWLUCC. This study further performed a statistical analysis of the relative difference rates for the cropland coverage between CWLUCC and the HYDE 3.2 and SAGE datasets. The results indicated that the proportion of grids with a small relative difference rate (–20%~0 and 0~20%) for HYDE 3.2 and SAGE is only 7.14% and 6.58%, respectively. However, the percentage of grids with a relative difference rate greater than 60% (>60% and <–60%) is as high as 65.98% and 71.01%, respectively. These comparison results indicate that the global remote sensing data used in the global datasets have greater uncertainties on the regional scale, and this is consistent with the previous modern global cropland datasets’ evaluation results [46].

3.2.2. Historical Spatial Patterns

As shown in Figure 7, the cropland spatial distributions for AD 1700 and 1770 are relatively close to those for AD 2000 at the provincial scale from HYDE 3.2 and SAGE, all indicating that the cropland of Xinjiang province is mainly distributed in the oasis areas, such as the two sides of the Tianshan Mountains, the south side of the Altai Mountains, and the north side of the Kunlun Mountains, and sporadic cropland can be found in Eastern Xinjiang. However, historical records on the wasteland reclamation sites for migrants or garrison troops in the Xinjiang area reveal that the cropland was sporadic and mainly distributed in Eastern Xinjiang, which was controlled by the Qing government during the early Qing Dynasty (AD 1716–1721), while the land use in Northern Xinjiang was still dominated by grazing (Figure 7c). After this, the wasteland reclamation sites for migrants or garrison troops in Xinjiang gradually expanded westward with the expansion of the territory of the Qing government, and the cropland began to spread throughout the northern and southern regions of the Tianshan Mountains during the mid-Qing Dynasty (AD 1756–1778) (Figure 7f). However, for this period, the wasteland reclamation sites for migrants or garrison troops were still not established in the south side of the Altai Mountains. As confirmed by previous studies, the cropland expansion of the Xinjiang area displayed a process of change from south to north and from east to west in the Qing Dynasty, and Northern Xinjiang experienced a significant transformation in land use from grazing to agriculture under the influence of the immigrant reclamation policy “migration to strengthen frontier defense” of the Qing government [20,34]. This observation indicates that the two global datasets have large uncertainties in cropland spatial patterns for the Xinjiang area for the historical periods.
Spatial distributions of cropland in the northern piedmont of the Tianshan Mountains for AD 1777–1944 from HYDE 3.2, SAGE, and the Zhang dataset are shown in Figure 8. From the Zhang dataset, cropland in the northern piedmont of the Tianshan Mountains showed an increasing trend, followed by decreasing and increasing trends; moreover, Urumqi, the political center of the Xinjiang area, and its surrounding areas had relatively high cropland coverage (Figure 8). However, trends in the cropland coverage in the northern piedmont of the Tianshan Mountains from HYDE 3.2 and SAGE were increasing continuously, especially in the Manas and Changji areas in the Manas River Basin. In the Urumqi and Fukang areas, cropland coverage from HYDE 3.2 and SAGE was significantly lower than that from the Zhang dataset. Cropland coverage from HYDE 3.2 and SAGE for the Manas and Changji areas was clearly greater than that from the Zhang dataset (Figure 8). During the study period, the relative difference rates in the northern piedmont of the Tianshan Mountains were very high in comparing the two global datasets with the Zhang dataset, especially for the Manas and Changji areas for AD 1944, for which the corresponding values were as high as 728.76% and 387.83% for HYDE3.2 and 418.06% and 181.67% for SAGE. The above analysis also reveals the great uncertainties in the reconstruction of cropland spatial patterns in the northern piedmont of the Tianshan Mountains in the global dataset.

4. Discussion

Our evaluation indicates that cropland data from the global datasets show inconsistencies in the amount and spatial distribution of cropland changes over time and space with the regional cropland datasets in the Xinjiang area. Explanations for these differences can be presented from the following two perspectives.

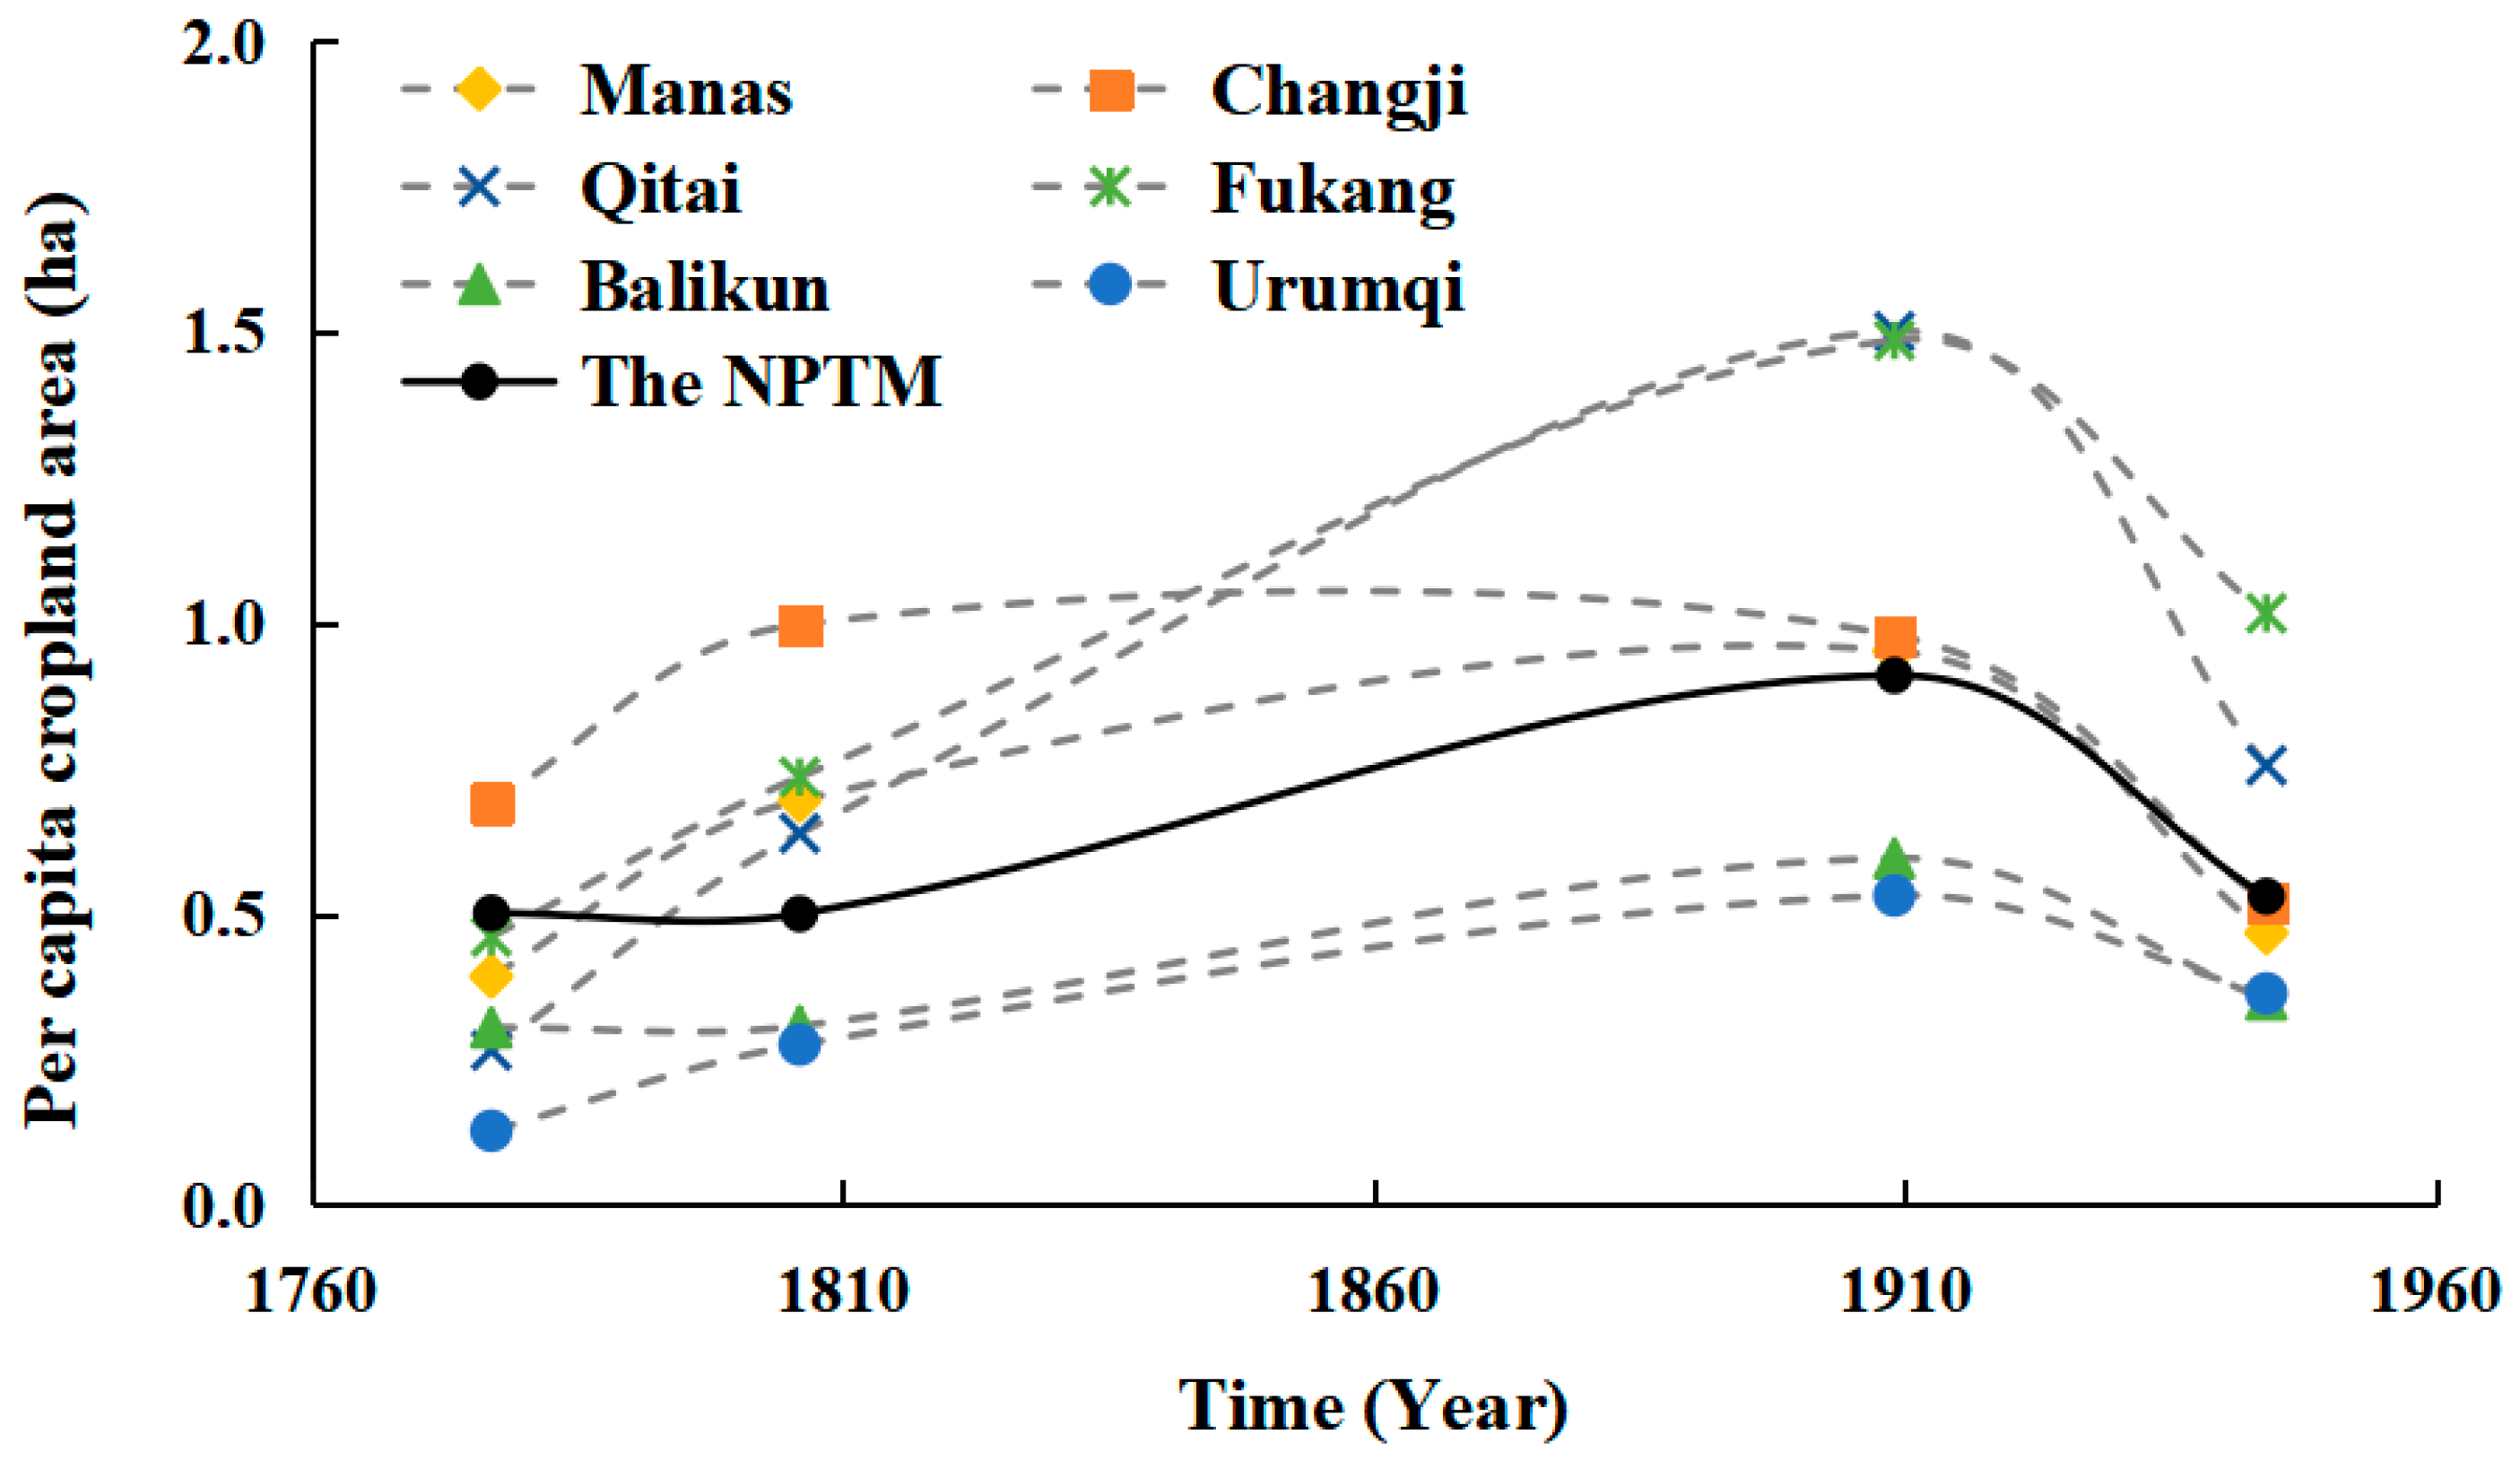
4.1. Per Capita Cropland Area

For existing historical global land use/cover datasets, the total areas of cropland for the pre-1961 period are mainly reconstructed by combining population estimates with per capita cropland estimates. Therefore, uncertainties of cropland data do not only arise due to large temporal and spatial variations in historical population data, but they also, and especially, relate to the assumptions that are made about the per capita cropland [3]. Earlier versions of the HYDE dataset kept per capita land use constant over time or, in the uncertainty estimates, homogeneously varied it with time across the globe [44]. Subsequently, its basic data on population and cropland have been updated several times to improve the historical land use trajectories and reduce the uncertainties of the per capita cropland and total cropland numbers. The latest version, HYDE 3.2, defines different shapes of the per capita cropland curve for different countries, including concave-shaped, bell-shaped, and convex-shaped curves, depending on the limited historical sources found. Furthermore, HYDE 3.2 considers that per capita values for cropland in China slightly decrease over time for their study period, and the corresponding values decreased from 0.66 ha in AD 1 to 0.16 ha in AD 1960 [47].
Regional cropland datasets for the Xinjiang area were reconstructed by using abundant historical documents, taxed cropland area data, household numbers and population data, tax systems, and changes in land policies in Xinjiang during the studied time period. We calculated the per capita cropland area of the northern piedmont of the Tianshan Mountains at the regional level as well as at the sub-regional level for AD 1777–1944 on the basis of the Zhang dataset. The results reveal that clear differences in per capita cropland area at the regional level, as well as at the sub-regional level, existed over the course of the studied period. Overall, regional data show that the per capita cropland area of the northern piedmont of the Tianshan Mountains increased from 0.50 ha in AD 1777 to 0.91 ha in AD 1909, and then dropped to 0.53 ha in AD 1944 (Figure 9), and that of six sub-regions also presented a similar change trend—a significantly different result to that presented by the HYDE dataset. Moreover, the per capita values of cropland area also show a large deviation between the regional and global datasets. For instance, per capita cropland values of the Manas, Changji, Qitai, and Fukang regions for AD 1806 and 1909 in the Zhang dataset are obviously higher than the corresponding values for AD 1 in HYDE 3.2, and the values of the former for AD 1806 and 1909 of variance range from 0.69 ha to 1.00 ha, and from 0.95 ha to 1.50 ha, respectively. Furthermore, the per capita cropland areas of the six sub-regions for AD 1944 in the Zhang dataset, of variance, range from 0.35 ha to 1.02 ha, and are also higher than those for AD 1960 in HYDE 3.2. This is an important difference, because this variable is the main parameter used in reconstructions of historical cropland areas; any variation in per capita cropland area will lead to a significant difference in the results of the total cropland reconstructions. Therefore, more research should be conducted to define a more reliable per capita cropland curve for different study areas by obtaining more regional historical sources and incorporating local research.

4.2. Spatial Reconstruction Method

The basic assumptions used for cropland spatial reconstruction in these global datasets have many uncertainties, especially when applied to some particular regions. Cropland spatial reconstruction at a grid cell level in these global datasets is based on a basic assumption that the cropland pattern of the current period represents the historical spatial patterns [3,16]. On the basis of this assumption, cropland spatial patterns derived from the satellite imagery from ESA (2016) for AD 2010 and Boston University’s MODIS-based global land cover product and the SPOT VEGETATION-based Global Land Cover 2000 dataset are used in HYDE3.2 and SAGE, respectively. Then, SAGE and HYDE 3.2 hindcasted the present cropland data back to AD 1700 and 10,000 BC, respectively. The reconstruction results will inevitably show that the cropland spatial distribution patterns of historical periods are similar to those of current times. Some regional assessments have been made and the results indicate that this assumption does not apply to some particular regions, such as Eastern China, the Qinghai–Tibet Plateau, the United States, and Germany [22,23,24,25,26]. For the Xinjiang area, local historical land reclamation evidence reveals that, bound by the Tianshan Mountains, the land use pattern of this region was characterized by farming in the south and grazing in the north, and this pattern was maintained until the early 18th century. The spatial patterns and changes in wasteland reclamation sites for migrants or garrison troops indicate that agricultural cultivation in Northern Xinjiang began to appear in the 1710s, and cropland was mainly distributed in the eastern part. Subsequently, with the large-scale influx of agricultural migrants from Eastern China, land use types of Northern Xinjiang gradually transformed from grazing-oriented to farming-oriented, which has continued to the present. However, the global datasets have allocated a large amount of cropland to Northern Xinjiang in AD 1700, which is inconsistent with the cropland spatial patterns revealed by local historical evidence. Therefore, spatial comparison results indicate that this assumption is also not fully applicable to the spatial reconstruction of historical cropland in the Xinjiang area, where land use patterns have greatly changed during the historical periods.
In addition, the algorithm models for cropland spatial reconstruction in these global datasets, on the basis of the land use practices in Europe and the United States, utilize the same algorithm models throughout the world for different historical periods. However, the land use practices of a country or region may be significantly different from those of others, as they are deeply influenced by factors such as the local culture, natural conditions, and technology. Using the algorithm models created based on the land use practices of a specific country or region for the whole world will lead to many regional uncertainties. For example, HYDE 3.2 allocated historical cropland for each grid cell combined with other weighting maps, including population, soil, coastline and river plain, topography, and climate maps. The distance from current water bodies is considered as an important influencing factor and used in cropland spatial reconstruction in HYDE3.2. Correspondingly, HYDE 3.2 allocated a large amount of cropland to the Manas area in the northern piedmont of the Tianshan Mountains, where the Manas River is distributed nowadays (Figure 8). However, the spatial patterns of cropland reconstructed by Chinese scholars based on historical data indicate that cropland coverage in the Manas area was lower than other areas of the northern piedmont of the Tianshan Mountains, as the large river in this region created difficulties for diversion irrigation. Therefore, it is necessary to explore spatial reconstruction methods suitable for specific types of areas according to the characteristics of land reclamation in different regions and at different historical stages.
Our comparative results show that large uncertainties exist in cropland data for the Xinjiang area in the global datasets, not only in terms of the amount but also in terms of the spatial patterns. Thus, we should systematically collect historical data in the Xinjiang area, extensively research the regional historical characteristics of land reclamation, identify the various human factors that represent regional human farming behavior and spatial diffusion behavior (i.e., reclamation system, immigration history, reclamation policy, and farming methods), and develop a spatial reconstruction method of historical cropland suitable for the analysis of the land use paradigm of Xinjiang in future studies. This not only could provide reliable regional cropland data with explicit spatial information on the Xinjiang area for the accuracy improvement of the historical global land use datasets and the simulation of global and regional climate and environment changes, but could also serve to develop a default method for areas with similar land use paradigms. This is also a goal of the ongoing LandCover6K program, which was initiated by Past Global Change [27,28].

5. Conclusions

Accurate historical global land use datasets are essential for a better understanding of the impacts of LUCC on global change. However, there are not only evident inconsistencies in current historical global land use/cover datasets, but inaccuracies in the data in these global datasets, revealed by historical record-based reconstructed regional data throughout the world. A focus in historical LUCC and global change research relates to how the reliability of global land use datasets can be assessed, and the accuracy of the uncertainty areas, especially the vulnerable areas on the land surface, in these global datasets can be improved using local historical materials. Xinjiang province in China is a typical arid, vulnerable area with a profound influence on human land use in historical periods; its historical LUCC information and related quantitative effects on the regional or global climate and environment have attracted the particular attention of global change researchers. However, the accuracy and reliability of existing land use datasets covering the Xinjiang area have still not been systematically evaluated.
This study collected the regional historical cropland data reconstructed by local researchers based on historical documents and modern statistics, as well as remotely sensed satellite data, and the data on wasteland reclamation sites for migrants and garrison troops from the Xinjiang area of China; then, we evaluated the reliability of cropland data from historical global datasets using qualitative and quantitative comparison methods, and provided a reference for studies on the improvement of future regional cropland reconstructions and global datasets.
The study concluded that the amount and spatial patterns of cropland in the Xinjiang area extracted from the global datasets have a significant difference from those indicated by the local cropland datasets and historical reclamation evidence. Quantitatively, although the total cropland area at the provincial and regional levels in the global and regional datasets were increasing overall, there existed large variations in the amount of cropland area. Moreover, the relative difference rates of the total cropland area in Xinjiang province between the HYDE 3.2 and SAGE datasets and the Ge dataset were around 25.57–81.87% and 12.50–65.66%, respectively; the corresponding values in the northern piedmont of the Tianshan Mountains between the two global datasets and the Zhang dataset were around −87.05–179.56% and −28.99–192.42%, respectively. Spatially, both the expansion process of wasteland reclamation sites for migrants and garrison troops and the land reclamation history evidence indicated that the land reclamation in the Xinjiang area underwent a process of expansion from south to north and from east to west over the past 300 years. Moreover, Northern Xinjiang was still dominated by nomadic pastoralism in the early 18th century. However, according to the two global datasets, most of the cropland had been allocated to the Northern Xinjiang area in the same study periods, accounting for 42.84% and 61.26% of the total regional cropland, respectively. In addition, the proportion of grids with a small relative difference rate (−20–0% and 0–20%) for HYDE 3.2 and SAGE in AD 2000 was only 7.14% and 6.58%, respectively. Concomitantly, at the regional level, more cropland was distributed in the Manas area, with a large river, and in Urumqi, with a larger population, according to the global datasets and Zhang dataset during AD 1777 to 1944, respectively. These differences are attributable to the uncertainties of the basic assumptions, per capita cropland area estimates, and reconstruction methods in the global datasets.
Further studies should collect more local historical records and remotely sensed satellite data for the Xinjiang area; investigate deeply the relationships between cropland and population with changing space and time in quantity reconstruction for historical cropland; establish a historical cropland spatial pattern reconstruction model suitable for the regional land use paradigm by integrating human factors, such as reclamation policies, immigrant history, and cultivation mode, especially in those areas where land use patterns have greatly changed during the historical periods; and, furthermore, provide more credible regional cropland data for the global datasets’ improvement and for global or regional climate change simulations.

Author Contributions

Conceptualization, M.L. and F.H.; Formal analysis, M.L.; Investigation, M.L. and F.H.; Methodology, M.L. and F.Y.; Software, C.Z. and F.Y.; Supervision, F.H.; Validation, M.L., F.H., C.Z. and F.Y.; Writing—original draft, M.L.; Writing—review and editing, F.Y. All authors have read and agreed to the published version of the manuscript.

Funding

This research was funded by the National Key R&D Program of China, grant number 2017YFA0603304, and the Strategic Priority Research Program of the Chinese Academy of Sciences, grant number XDA19040101.

Data Availability Statement

Data will be available upon request.

Conflicts of Interest

The authors declare no conflict of interest.

References

  1. Foley, J.A.; Defries, R.; Asner, G.P.; Barford, C.; Bonan, G.; Carpenter, S.R.; Chapin, F.S.; Coe, M.T.; Daily, G.C.; Gibbs, H.K.; et al. Global consequences of land use. Science 2005, 309, 570–574. [Google Scholar] [CrossRef] [PubMed]
  2. Biík, I.; Kupková, L.; Jeleek, L.; Kabrda, J.; Winklerová, J. Land Use Changes in the Czech Republic 1845–2010: Socio-Economic Driving Forces; Springer International Publishing: Cham, Switzerland, 2015; pp. 95–170. [Google Scholar]
  3. Klein Goldewijk, K.; Beusen, A.; Doelman, J.; Stehfest, E. Anthropogenic land use estimates for the Holocene-HYDE 3.2. Earth Syst. Sci. Data 2017, 9, 927–953. [Google Scholar] [CrossRef]
  4. Stephens, L.; Fuller, D.; Boivin, N.; Rick, T.; Gauthier, N.; Kay, A.; Marwick, B.; Armstrong, C.G.D.; Barton, C.M.; Denham, T.; et al. Archaeological assessment reveals Earth’s early transformation through land use. Science 2019, 365, 897–902. [Google Scholar] [PubMed]
  5. Ellis, E.C.; Gauthier, N.; Klein Goldewijk, K.; Bird, R.B.; Boivin, N.; Díaz, S.; Fuller, D.Q.; Gill, J.L.; Kaplan, J.O.; Kingston, N.; et al. People have shaped most of terrestrial nature for at least 12,000 years. Proc. Natl. Acad. Sci. USA 2021, 118, e2023483118. [Google Scholar] [CrossRef] [PubMed]
  6. Pongratz, J.; Reick, C.; Raddatz, T.; Claussen, M. A reconstruction of global agricultural areas and land cover for the last millennium. Glob. Biogeochem. Cycles 2008, 22, GB3018. [Google Scholar] [CrossRef]
  7. Kaplan, J.O.; Krumhardt, K.M.; Ellis, E.C.; Ruddiman, W.F.; Lemmen, C.; Klein Goldewijk, K. Holocene carbon emissions as a result of anthropogenic land cover change. Holocene 2011, 21, 775–791. [Google Scholar] [CrossRef]
  8. Houghton, R.A.; Nassikas, A.A. Global and regional fluxes of carbon from land use and land cover change 1850–2015. Global Biogeochem. Cycles 2017, 31, 456–472. [Google Scholar]
  9. Harper, A.B.; Tom, P.; Cox, P.M.; Joanna, H.; Chris, H.; Lenton, T.M.; Stephen, S.; Eleanor, B.; Chadburn, S.E.; Collins, W.J. Land-use emissions play a critical role in land-based mitigation for Paris climate targets. Nat. Commun. 2018, 9, 2938. [Google Scholar]
  10. Mendelsohn, R.; Sohngen, B. The net carbon emissions from historic land use and land use change. J. For. Econ. 2019, 34, 263–283. [Google Scholar]
  11. Klein Goldewijk, K.; Ramankutty, N. Land cover change over the last three centuries due to human activities: The availability of new global data sets. Geojournal 2004, 61, 335–344. [Google Scholar] [CrossRef]
  12. Hurtt, G.C.; Frolking, S.; Fearon, M.G.; Moore, B.; Shevliakova, E.; Malyshev, S.; Pacala, S.W.; Houghton, R.A. The underpinnings of land-use history: Three centuries of global gridded land-use transitions, wood-harvest activity, and resulting secondary lands. Glob. Change Biol. 2006, 12, 1208–1229. [Google Scholar] [CrossRef]
  13. Hurtt, G.C.; Chini, L.; Sahajpal, R.; Frolking, S.; Bodirsky, B.L.; Calvin, K.; Doelman, J.C.; Fisk, J.; Fujimori, S.; Klein Goldewijk, K.; et al. Harmonization of global land-use change and management for the period 850–2100 (LUH2) for CMIP6. Geosci. Model Dev. 2020, 13, 5425–5464. [Google Scholar] [CrossRef]
  14. Zhang, Y.; Wu, D.; Lyu, X. A review on the impact of land use/land cover change on ecosystem services from a spatial scale perspective. J. Nat. Resour. 2020, 35, 1172–1189. [Google Scholar]
  15. Liu, X.; Liang, X.; Li, X.; Xu, X.; Ou, J.; Chen, Y.; Li, S.; Wang, S.; Pei, F. A future land use simulation model (FLUS) for simulating multiple land use scenarios by coupling human and natural effects. Landsc. Urban Plan. 2017, 168, 94–116. [Google Scholar] [CrossRef]
  16. Ramankutty, N.; Foley, J.A. Estimating historical changes in global land cover: Croplands from 1700 to 1992. Glob. Biogeochem. Cycles 1999, 13, 997–1027. [Google Scholar] [CrossRef]
  17. Pielke, R.A.; Pitman, A.; Niyogi, D.; Mahmood, R.; McAlpine, C.; Hossain, F.; Klein Goldewijk, K.; Nair, U.; Betts, R.; Fall, S.; et al. Land use/land cover changes and climate: Modeling analysis and observational evidence. WIREs Clim. Change 2011, 2, 828–850. [Google Scholar] [CrossRef]
  18. Kaplan, J.O.; Krumhardt, K.M.; Zimmermann, N.E. The effects of land use and climate change on the carbon cycle of Europe over the past 500 years. Glob. Change Biol. 2012, 18, 902–914. [Google Scholar] [CrossRef]
  19. Peng, S.S.; Ciais, P.; Maignan, F.; Li, W.; Chang, J.F.; Wang, T.; Yue, C. Sensitivity of land use change emission estimates to historical land use and land cover mapping. Glob. Biogeochem. Cycles 2017, 31, 626–643. [Google Scholar] [CrossRef]
  20. Fuchs, R.; Prestele, R.; Verburg, P.H. A global assessment of gross and net land change dyna- mics for current conditions and future scenarios. Earth Syst. Dynam. 2018, 9, 441–458. [Google Scholar] [CrossRef]
  21. Fang, X.Q.; Zhao, W.Y.; Zhang, C.P.; Zhang, D.Y.; Wei, X.Q.; Qiu, W.L.; Ye, Y. Methodology for credibility assessment of historical global LUCC datasets. Sci. China Earth Sci. 2020, 63, 13. [Google Scholar] [CrossRef]
  22. He, F.N.; Li, S.C.; Zhang, X.Z.; Ge, Q.S.; Dai, J.H. Comparisons of cropland area from multiple datasets over the past 300 years in the traditional cultivated region of China. J. Geogr. Sci. 2013, 23, 978–990. [Google Scholar] [CrossRef]
  23. Li, B.B.; Fang, X.Q.; Ye, Y.; Zhang, X.Z. Accuracy assessment of global historical cropland datasets based on regional reconstructed historical data: A case study in Northeast China. Sci. China Earth Sci. 2010, 40, 1048–1059. [Google Scholar] [CrossRef]
  24. Li, S.C.; He, F.N.; Zhang, X.Z.; Zhou, T.Y. Evaluation of global historical land use scenarios based on regional datasets on the Qinghai-Tibet Area. Sci. Total Environ. 2019, 657, 1615–1628. [Google Scholar] [CrossRef] [PubMed]
  25. Yu, Z.; Lu, C. Historical cropland expansion and abandonment in the continental U.S. during 1850 to 2016. Global Ecol. Biogeogr. 2018, 27, 322–333. [Google Scholar] [CrossRef]
  26. Zhang, D.Y.; Fang, X.Q.; Yang, L.E. Comparison of the HYDE cropland data over the past millennium with regional historical evidence from Germany. Reg. Environ. Change 2021, 21, 1–15. [Google Scholar] [CrossRef]
  27. Gaillard, M.J.; LandCover6k Interim Steering Group members. LandCover6k: Global anthropogenic land-cover change and its role in past climate. PAGES Program News 2015, 23, 38–39. [Google Scholar] [CrossRef]
  28. Gaillard, M.J.; Morrison, K.D.; Madella, M.; Whitehouse, N. Past land-use and land-cover change: The challenge of quantification at the subcontinental to global scales. PAGES Mag. 2018, 26, 1–44. [Google Scholar]
  29. Hua, L.; Li, S.C.; Gao, D.; Li, W.J. Uncertainties of Global Historical Land Use Datasets in Pasture Reconstruction for the Tibetan Plateau. Remote Sens. 2022, 14, 3777. [Google Scholar] [CrossRef]
  30. Fu, B.J.; Leng, S.Y.; Song, C.Q. The characteristics and tasks of geography in the new era. Sci. Geogr. Sin. 2015, 35, 939–945. [Google Scholar]
  31. An, C.B.; Zhang, M.; Wang, W.; Liu, Y.; Dong, W.M. Characteristics of geographical environment and formation of farming and pastoral pattern in Xinjiang. Sci. China Earth Sci. 2020, 50, 295–304. [Google Scholar]
  32. Chen, X. Land Use/Cover Change in Arid Areas in China; Science Press: Beijing, China, 2008. [Google Scholar]
  33. Zhou, L.P.; Wei, D.H.; Ding, F.; Chen, F.; Li, Y.; Hu, X.K.; Zhan, K.J. Spatial-temporal variation and dynamic evolution of the cultivated land in Shiyang River Basin from 1973 to 2010. Arid. Zone Res. 2015, 32, 483–491. [Google Scholar]
  34. Liu, W.R.; Chen, C.B.; Luo, G.P.; He, H.L. Change processes and trends of land use/cover in the Balkhash Lake basin. Arid. Zone Res. 2021, 38, 1452–1463. [Google Scholar]
  35. Zhao, R.f.; Chen, Y.N.; Shi, P.J.; Zhang, L.H.; Pan, J.H.; Zhao, H.L. Land use and land cover change and driving mechanism in the arid inland river basin: A case study of Tarim River, Xinjiang, China. Environ. Earth Sci. 2013, 68, 591–604. [Google Scholar] [CrossRef]
  36. Sun, F.; Wang, Y.; Chen, Y.; Li, Y.; Zhang, Q.; Qin, J.; Kayumba, P.M. Historic and simulated desert-oasis ecotone changes in the arid Tarim River Basin, China. Remote Sens. 2021, 13, 647. [Google Scholar] [CrossRef]
  37. Hou, Y.F.; Chen, Y.N.; Ding, J.L.; Li, Z.; Li, Y.P.; Sun, F. Ecological impacts of land use change in the arid Tarim River Basin of China. Remote Sens. 2022, 14, 1894. [Google Scholar] [CrossRef]
  38. Cao, S.J. The History of Chinese Population: The Qing Dynasty; Fudan University Press: Shanghai, China, 2000. [Google Scholar]
  39. The Main Data Bullet in of Sixth National Census in Xinjiang Uygur Autonomous Region in 2010. Available online: http://www.stats.gov.cn/tjsj/tjgb/rkpcgb/dfrkpcgb/201202/t2012022830407.html (accessed on 28 February 2022).
  40. Hua, L. History of the Agricultural Development in Xinjiang in the Qing Dynasty; Heilongjiang Education Publishing House: Harbin, China, 1998. [Google Scholar]
  41. Ge, Q.S.; Zhao, M.C.; Zheng, J.Y. Land use change of China during the 20th century. Acta Geogr. Sin. 2000, 67, 698–706. [Google Scholar]
  42. Zhang, L. Land Reclamation and Environmental Changes in the Northern Piedmont of Tianshan Mountains (1757–1949); China Social Sciences Press: Beijing, China, 2021. [Google Scholar]
  43. Liu, J.Y. Remote Sensing Monitoring Dataset of Land Use Status in Six Provinces in Western China for Many Years (1970s, 1980s, 1995, 2000, 2005, 2010, 2015); CSTR: 18406.11.Socioeco.tpdc.270469; National Tibetan Plateau Data Center: Beijing, China, 2019. [Google Scholar]
  44. Zhao, Y.Z. Immigrant Reclamation of Silk Road; Xinjiang People’s Publishing House: Urumqi, China, 2009. [Google Scholar]
  45. He, F.N.; Li, S.C.; Yang, F.; Li, M.J. Evaluating the accuracy of Chinese pasture data in global historical land use datasets. Sci. China Earth Sci. 2018, 61, 1685–1696. [Google Scholar] [CrossRef]
  46. Zhang, C.P.; Ye, Y.; Fang, X.Q.; Li, H.S.B.; Wei, X.Q. Synergistic modern global 1 km cropland dataset derived from multi-sets of land cover products. Remote Sens. 2019, 11, 2250. [Google Scholar] [CrossRef]
  47. Klein Goldewijk, K.; Dekker, S.C.; Zanden, J.L.V. Per-capita estimations of long-term historical land use and the consequences for global change research. J. Land Use Sci. 2017, 12, 313–337. [Google Scholar] [CrossRef] [Green Version]
Figure 1. Schematic diagram of the study area.
Remotesensing 14 04226 g001
Figure 2. Reconstruction regions of the Zhang dataset.
Remotesensing 14 04226 g002
Figure 3. Trends in cropland area change for Xinjiang province over the past 100 years from HYDE 3.2, SAGE, the Ge dataset, and CWLUCC.
Remotesensing 14 04226 g003
Figure 4. The changing trends of cropland area in the northern piedmont of the Tianshan Mountains in Xinjiang area (AD 1766–1944) from HYDE 3.2, SAGE, and Zhang datasets.
Remotesensing 14 04226 g004
Figure 5. Cropland spatial pattern in Xinjiang province for AD 2000 from HYDE 3.2, SAGE, and CWLUCC.
Remotesensing 14 04226 g005
Figure 6. Spatial distributions of the relative difference rate for cropland in Xinjiang province between CWLUCC and the HYDE 3.2 and SAGE datasets for AD 2000.
Remotesensing 14 04226 g006
Figure 7. Cropland spatial patterns for AD 1700 and 1770 from HYDE 3.2 and SAGE and of wasteland reclamation sites in the early (AD 1716–1721) and middle Qing (AD 1756–1778) Dynasty in Xinjiang area.
Remotesensing 14 04226 g007
Figure 8. Comparison of changes in cropland coverage in the northern piedmont of the Tianshan Mountains between the Zhang dataset, HYDE 3.2, and SAGE for AD 1777, 1810, 1910, and 1944.
Remotesensing 14 04226 g008
Figure 9. Computed regional and sub-regional per capita cropland areas in the Zhang dataset. The NPTM represents the northern piedmont of the Tianshan Mountains.
Remotesensing 14 04226 g009
Table 1. Global historical cropland datasets and regional cropland data in Xinjiang area of China.
DatasetsTemporal CoverageSpatial Resolution
Global land use datasets [3,16]HYDE 3.210,000 BC–AD 20155′
SAGEAD 1700–20070.5°
Regional cropland datasets [41,42,43]Ge datasetAD 1933–1999Provincial
Zhang datasetAD 1766–1944Sub-regional
CWLUCCAD 1970–20151 km
Historical data of wasteland reclamation sites for migrants or garrison troops [44]WRSDAD 1716–1778Point data
Table 2. The relative difference rates of the total cropland area in Xinjiang province from AD 1933 to 1999 between HYDE 3.2, SAGE, and the Ge datasets (unit: %).
YearAD 1933AD 1955AD 1960AD 1980AD 1999
HYDE 3.212.3181.8716.16−25.575.24
SAGE65.6661.2024.3152.8612.50
Table 3. The relative difference rates between HYDE 3.2, SAGE, and the remote sensing source CWLUCC from the 1980s to 2010 in Xinjiang area (unit: %).
YearAD 1980AD 2000AD 2005AD 2010
HYDE 3.2−32.18−33.59−42.82−48.67
SAGE2.56−29.01−44.16N/A
Table 4. The relative difference rates between HYDE 3.2, SAGE, and the Zhang dataset from AD 1770 to 1940 in the northern piedmont of the Tianshan Mountains (unit: %).
YearAD 1766AD 1795AD 1806AD 1852AD 1909AD 1944
HYDE 3.2–93.99–97.14–94.53–87.05–10.13179.56
SAGE192.4236.33–18.62–28.9958.4958.67
Publisher’s Note: MDPI stays neutral with regard to jurisdictional claims in published maps and institutional affiliations.

