Article

Spatial Trend and Impact of Snowmelt Rate in Spring across China’s Three Main Stable Snow Cover Regions over the Past 40 Years Based on Remote Sensing

1
State Key Laboratory of Cryospheric Science, Koktokay Snow Station, Northwest Institute of Eco-Environment and Resources, Chinese Academy of Sciences, Lanzhou 730000, China
2
College of Environmental and Resource Science, Chengdu University of Information Technology, Chengdu 610225, China
*
Author to whom correspondence should be addressed.
Remote Sens. 2022, 14(17), 4176; https://doi.org/10.3390/rs14174176
Submission received: 30 June 2022 / Revised: 10 August 2022 / Accepted: 21 August 2022 / Published: 25 August 2022
(This article belongs to the Special Issue Remote Sensing for Mountain Vegetation and Snow Cover)

Abstract

:
Historical patterns of snow cover and snowmelt are shifting due to climate warming and perhaps some human activities, threatening natural water resources and the ecological environment. Passive microwave remote sensing provides quantitative data for snow mass evaluation. Here, we evaluated the long-term impact of climate warming on snowmelt rates, using snow water equivalent (SWE) datasets derived from passive microwave remotely sensed data over China’s three main stable snow cover regions during the past 40 years (1981–2020). The results showed that higher ablation rates in spring were found in locations with a deeper SWE because of high snowmelt rates that occurred in late spring and early summer in areas with a deeper snowpack. Annual maximum SWE (snow water equivalent) has declined across two out of the three main mountains of China’s snow cover regions over the past 40 years under climate warming. The maximum and mean snowmelt rate was ca. 30 and 3 mm/day, respectively, over the three regions. Further, due to SWE being reduced in these deep snowpack areas, moderate and high rates of snowmelt showed trends of decline after 2000. Accordingly, an earlier snow onset day (average 0.6~0.7 day/a) and slower snowmelt rates characterized the mountainous areas across the three main snow cover regions. The slower snowmelt rate is also closely related to vegetation improvement over the three main stable snow cover regions. Therefore, not only vegetation in spring but also streamflow and other ecological processes could be affected by the pronounced changes in SWE and snowmelt rates. These findings strengthen our understanding of how to better assess ecological and environmental changes towards the sustainable use of freshwater resources in spring and earlier summer months in snow-rich alpine regions.

Graphical Abstract

1. Introduction

Snow formation and deposition arises from weather-climate processes. Snow cover is a key component of the Earth’s cryosphere, for which alpine snow has an extensive distribution whose subsequent melting can dominate local and regional hydrological dynamics in mountainous areas, including those of China. At such high elevations, especially at higher latitudes, snow cover and snowmelt jointly influence how the eco-geographical system changes seasonally. Snowmelt is a major freshwater resource in many snow-rich regions, with snowmelt water sustaining one-fourth of global GDP (gross domestic product) and supplying more than one-sixth of the Earth’s population with drinking water [1]. With about two-thirds of its ground covered by snow in winter, China is a snow-rich country where snowmelt is a vital freshwater resource. It is the main water supply source for rivers, reservoirs, and soil in northern China in spring, being directly related to the sustainable development of the country’s economy in its main snow-covered regions. Hence, rigorous evaluation of the rate of snowmelt and its spatiotemporal variation is imperative to support social progress and economic development.
China is a vast country with complex terrain, spanning about 50 degrees in latitude and 61 degrees in longitude from east to west. China is located in a temperate seasonal snow zone, and the snow cover is mainly distributed in three regions: northeastern China–Inner Mongolia (herein northeast China), northern Xinjiang, and the Tibetan Plateau [2]. In northern Xinjiang, yearly snowfall begins at the end of September, with more snow coming during the winter months. Additionally, the stable seasonal snow in the region constitutes an important freshwater resource in spring [3] and they are also prone to frequent snow disasters [4]. Northeast China includes the provinces of Heilongjiang, Jilin, and Liaoning and the northeast prairie region of Inner Mongolia, where yearly snowfall begins in early October. This region has mountains (Changbai Mountains), forests (the Xing’an Mountains region), and prairie pastures, for which snow is a crucial natural reservoir in winter and a source of freshwater in spring during the sowing season of staple crops. The melting of snow is also a critical hydrological process on the Tibetan Plateau, whose snow patterning is quite complex. Due to the Plateau’s high altitude, glaciers and frozen soil are distributed widely, such that both seasonally stable snow and unstable snow co-occur in this region, which is the source of many major Asian rivers, hence its moniker: “Asia’s Water Tower” [5].
Ground-based observations of alpine SWE (snow water equivalent) or other snow properties are challenging to obtain because of the great difficulty in accessing high-elevation mountains and their risk of dangerous avalanches [6]. In recent years, remote sensing has emerged as a dependable and efficient way to detect variation in the cryosphere and its characteristics, namely the monitoring of snow cover [7,8]. Moreover, high-precision remotely sensed datasets are now pivotal for performing snowmelt calculations over large areas at the regional scale. In this respect, elucidating the spatiotemporal changes in China’s snow properties based on remote sensing—e.g., snow cover extent, snow cover phenology, snow depth, snow density, and SWE—has progressed substantially in recent decades [9,10,11].
Given ongoing global warming and China climate warming [12,13,14,15], snow cover extent and SWE measurements based on remote sensing over the past four decades have been widely studied [16,17,18,19,20]. Snow’s phenology and meteorology inferred from remotely sensed data has revealed its dynamic relationship to climate change and the functioning of ecosystems [21,22,23]. Yet, how snowmelt rates respond to climate change and related consequences for the ecological environment are still scarcely reported on. Although a few studies have investigated the snowmelt process in single or multiple basins [24,25,26], the spatiotemporal variability of the snowmelt rate in China and its response to climate warming and associated environmental effects remain unclear. However, snowmelt rates in alpine regions have fast-changing hydrologic characteristics correlated with climatological processes, soil moisture regimes, ecosystem functions, and streamflow changes. For example, decreased spring snow cover over eastern Europe and the western Siberia Plain was shown to closely correspond with irregular dry soil conditions from spring to summer, thereby increasing surface heat flux and near-surface temperatures [27].
Snowmelt rate represents an integrated metric of snow in both its amount and timing of melting, which determines the minimum hydrological partitioning to streamflow in cold regions [28]. Change in the snowmelt rate simply means altered patterns of this process, which may disrupt the balance between freshwater’s demand and supply, bring soil up to field capacity, or facilitate percolation into the root zone and streamflow [29]. Therefore, the magnitude of the snowmelt rate is the paramount factor governing the above processes. In this way, pronounced changes in the snowmelt rate across the three main snow cover regions of China may threaten both their timing and amount of snowmelt, thereby further influencing groundwater, runoff, and vegetation growth. Some studies suggested strong relationships exist between the date of snowmelt and the onset of flowering for different plant species. Snow mass loss and snowmelt change in winter and spring can also affect plant performance (growth/survival) across space, the vulnerability of species, and the spatial heterogeneity of plant communities in alpine and subalpine ecosystems [30,31]. This is because persistent snowmelt and soil warming might slightly, yet nonetheless importantly, accelerate the onset of flowering in colder ecosystems [32]. Finally, snowmelt is among the major factors that significantly affects the CO2 balance and enhances the springtime carbon uptake in boreal biomes across high latitudes [33]. However, shifting to an earlier snow phenology could augment risks faced by ecosystems via too-cold currents flowing in spring and a greater probability of vegetation incurring frost damage. It is, therefore, imperative to conduct large-scale research on changing snowmelt rates across China’s three main stable snow cover regions to better understand how climate warming impacts snowmelt, and how that affects hydrological cycles and the local ecological environment.
In this study, high-precision SWE datasets acquired via remote sensing were used to investigate and analyze the changes in snowmelt rates across China’ three stable snow cover regions. First, daily snow depletion was calculated to evaluate the changes in snowmelt rates over the past 40 years in each of the three main stable snow cover regions. Second, the spatiotemporal variability in snowmelt was analyzed for the 1981–2020 period, for which the relationship between the snowmelt rate and snowpack volume was investigated to explain likely causes for the trends found. Finally, the consequences of changing snowmelt rates are discussed to reveal their dynamic impacts on hydrological cycles, water resources, and ecosystems.

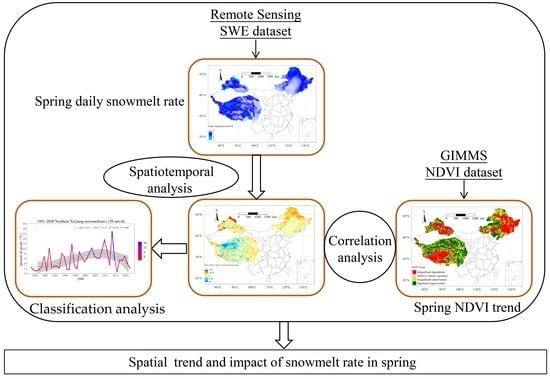
2. Materials and Methods

The long-term SWE dataset consisted of China’s daily product for 1980 through to 2020 at a spatial resolution of 25 km × 25 km, that is, the latest version released by National Cryosphere Desert Data Center (http://www.ncdc.ac.cn; accessed on 5 August 2022) at the beginning of 2021. This dataset covers the main land surface of China and was generated from remote sensing data acquired by the Special Sensor Microwave Radiometer (SMMR) (1980–1987), Special Sensor Microwave Imager (SSM/I) (1988–2008), and Special Sensor Microwave Imager/Sounder (SSMI/S) (2009–2020) [34]. Firstly, two SMMR instruments were operated in 1978, one aboard Nimbus-7 and one aboard SEASAT (Seafaring Satellite) [35,36]. While only about 3 months of data from the SEASAT mission exist, the SMMR on Nimbus-7 delivered a data record covering nearly 8 years from 25 October 1978 until 20 August 1987. The Nimbus-7 spacecraft operated in a sun-synchronous orbit with an inclination of 99° and an average altitude of 955 km. This configuration results in an orbital period of about 104 min and provided approximately 14 orbits per day. The SMMR is a ten-channel radiometer, measuring microwave radiation from the Earth’s atmosphere and surface in five frequencies at vertical and horizontal polarization. Six radiometers were integrated in the instrument, fed by one multi-spectral feedhorn. While the four radiometers at the lower frequencies (from 6.6 to 21 GHz) measured alternating polarization each half-scan, the other two at 37 GHz measured continuously vertical and horizontal polarization. SSM/I sensors have been operated aboard the DMSP satellites as part of the global satellite observing system since 1987. Up to three satellites have been in orbit simultaneously. An extensive description of the instrument and satellite characteristics has been published by Hollinger et al. (1987) and Wentz (1991) [37,38]. The SSM/I is a 7-channel total power radiometer measuring emitted microwave radiation at 4 frequency intervals centered at 19.35, 22.235, 37.0, and 85.5 GHz. All frequencies are sampled at horizontal and vertical polarization, except for the 22.235 GHz channel, which measures only vertically polarized radiation. The SSMI/S has been the successor to the SSM/I since 2008. The SSMI/S instruments are operated, as the SSM/I, aboard the DMSP satellites in an early morning orbit, continuing the existing data record at the same overpass time. The SSMI/S has a wider Earth viewing angular sector (144°) than the SSM/I, resulting in a 1700-km-wide swath. A detailed description about SSMI/S and SSMI/I can be found in Kunkee et al. (2008) [39].
To better obtain the spatial coverage of snow depth across China, the ascending and descending overpass data were combined in this SWE product, but overpass data at night have priority. In order to improve the product and the dataset’s overall quality, the main retrieved methods are as follows [34]: (i) cold overpass data (ascending for F08-SSM/I; descending for others) are used if both ascending and descending data are available in order to avoid the impact of wet snow on the snow depth estimation process; (ii) warm overpass data are selected to fill gaps in the cold overpass orbits; (iii) after the above two steps, the previous and next days’ data are selected to achieve full spatial coverage if there are still existing gaps. Meanwhile, numerous studies have demonstrated that no single standard algorithm can describe snow cover characteristics well everywhere. Thus, regional algorithms that have been calibrated at a local scale might be capable of providing a reasonable snow depth estimation. This SWE product was also divided by Chinese snow cover into different regions based on the topography, land cover, and snow cover duration, e.g., Xinjiang, Tibetan Plateau, Northeast, and others. The dry snow, wet snow, deep snow, and shallow snow in different regions of China have been taken into consideration at a certain extent when the SWE product was retrieved [40]. A linear unmixing method was applied to the passive microwave data after using cross-calibration and bias-correction to improve the SWE dataset’s overall quality [34,41]. The mixed pixels’ (farmland, grassland, and forest) impact was fully considered in the dataset’s assembly process [41]. In terms of data accuracy, the unbiased root-mean-square error of snow depth is about 5–7 cm. The correlation coefficient is 0.84 (p < 0.01), representing the significant relationship between ground-based measurements and snow depth estimates. This corresponds to 10–15 mm for SWE, when compared with stations’ measurements and field data collected from snow courses [34]. Therefore, this remote sensing data product may be used for climatic and hydrological research. Next, daily SWE data from the remote sensing dataset over China in the past 40 years (1981–2020) were processed by IDL programming language and ArcGIS and classified into 5 categories: very shallow (<10 mm), shallow (10–20 mm), moderate (20–30 mm), deep (30–40 mm), and very deep (>40 mm), based on the spatial distribution of the 40-year mean annual maximum SWE.
Snowmelt is difficult to measure directly from remote sensing data, but it can be reasonably derived from the daily depletion of measured SWE [42]. Snowmelt, as used here, refers to the observed daily SWE depletion, which implicitly includes both the melting of snow and snow surface sublimation and accretion. The snowmelt rates were calculated as the daily loss of the SWE, with an upper limit of ≤1 mm/day, and expressed as absolute values (i.e., losses). The 1 mm/day value is just a bulk estimation of the minimum measurement uncertainty. Passive microwave data spanning 1979 to 1987 were acquired from Nimbus-7 Scanning Multichannel Microwave Radiometer (SMMR) sensors, which were used to derive the daily SWE time-series every other day. Actually, the loss value of SWE should be negative due to snow melt day by day in spring. However, in order to calculate the daily snowmelt rate conveniently, we defined the absolute value of SWE loss as the ablation. So, the daily snowmelt rate was calculated as follows:
(SWEday-2 − SWEday)/2 = daily SWEloss
Herein, daily SWEloss refers to the daily snowmelt value in spring, SWEday refers to the snow water equivalent on a day in spring, and SWEday-2 refers to the snow water equivalent two days earlier than the given day. The Special Sensor Microwave/Imager (SSM/I) sensors have been operational in several DMSP-satellites since 1987; hence, daily SWE data extracted from these date back to fall 1987. The daily snowmelt rate was calculated as follows:
SWEday-1 − SWEday = daily SWEloss
Herein, SWEday-1 refers to the snow water equivalent earlier one day than the given day. Accumulation events (such as snowfall) were set to zero (no snowmelt happened in the day). The redistribution of snow by wind across 25-km2 grid cells was presumed negligible. The ensuing snowmelt rate values were classified into three categories: low (<10 mm/day), moderate (10–20 mm/day), and high (>20 mm/day). Snowmelt water volumes were calculated from corresponding daily ablation values.
The spatiotemporal trends in SWE and the snowmelt rate were analyzed using quantitative statistical techniques (using a “robust” least absolute deviation method and error analysis). Slope values were obtained via least-squares fitting and their significance assessed by a t-test using R language. The p-value (the probability value) is known as the level of marginal significance within the hypothesis testing that represents the probability of occurrence of the given event. The day of snowmelt onset per year was identified as the date on which the SWE began to decrease once the SWEmax had been reached.
Normalized Difference Vegetation Index-3rd generation (NDVI) using the Global Inventory Monitoring and Modeling System (GIMMS): vegetation indices are radiometric measures of photosynthetically active radiation absorbed by chlorophyll in the green leaves of vegetation canopies and are therefore good surrogate measures of the physiologically functioning surface greenness level of a region. The latest version of the GIMMS NDVI data set spans the period July 1981 to December 2015 and is termed NDVI3g (third-generation GIMMS NDVI from AVHRR sensors) and released by NASA (http://glcf.umd.edu; accessed on 3 August 2022). The dataset is at a 1/12 degree spatial resolution and a daily temporal resolution. Monthly data for the period of 1982–2015 were retrieved for the study region from the KNMI climate explorer (http://climexp.knmi.nl; accessed on 5 August 2022) and data for the spring (March to May) mean of 1982–2015 were calculated directly from the AVHRR dataset. We resampled the NDVI data by referring to the SWE dataset with a spatial resolution of 25 km × 25 km and conducted a spatial correlation analysis between the NDVI and snowmelt rate in spring for their common period 1982–2015.

3. Results

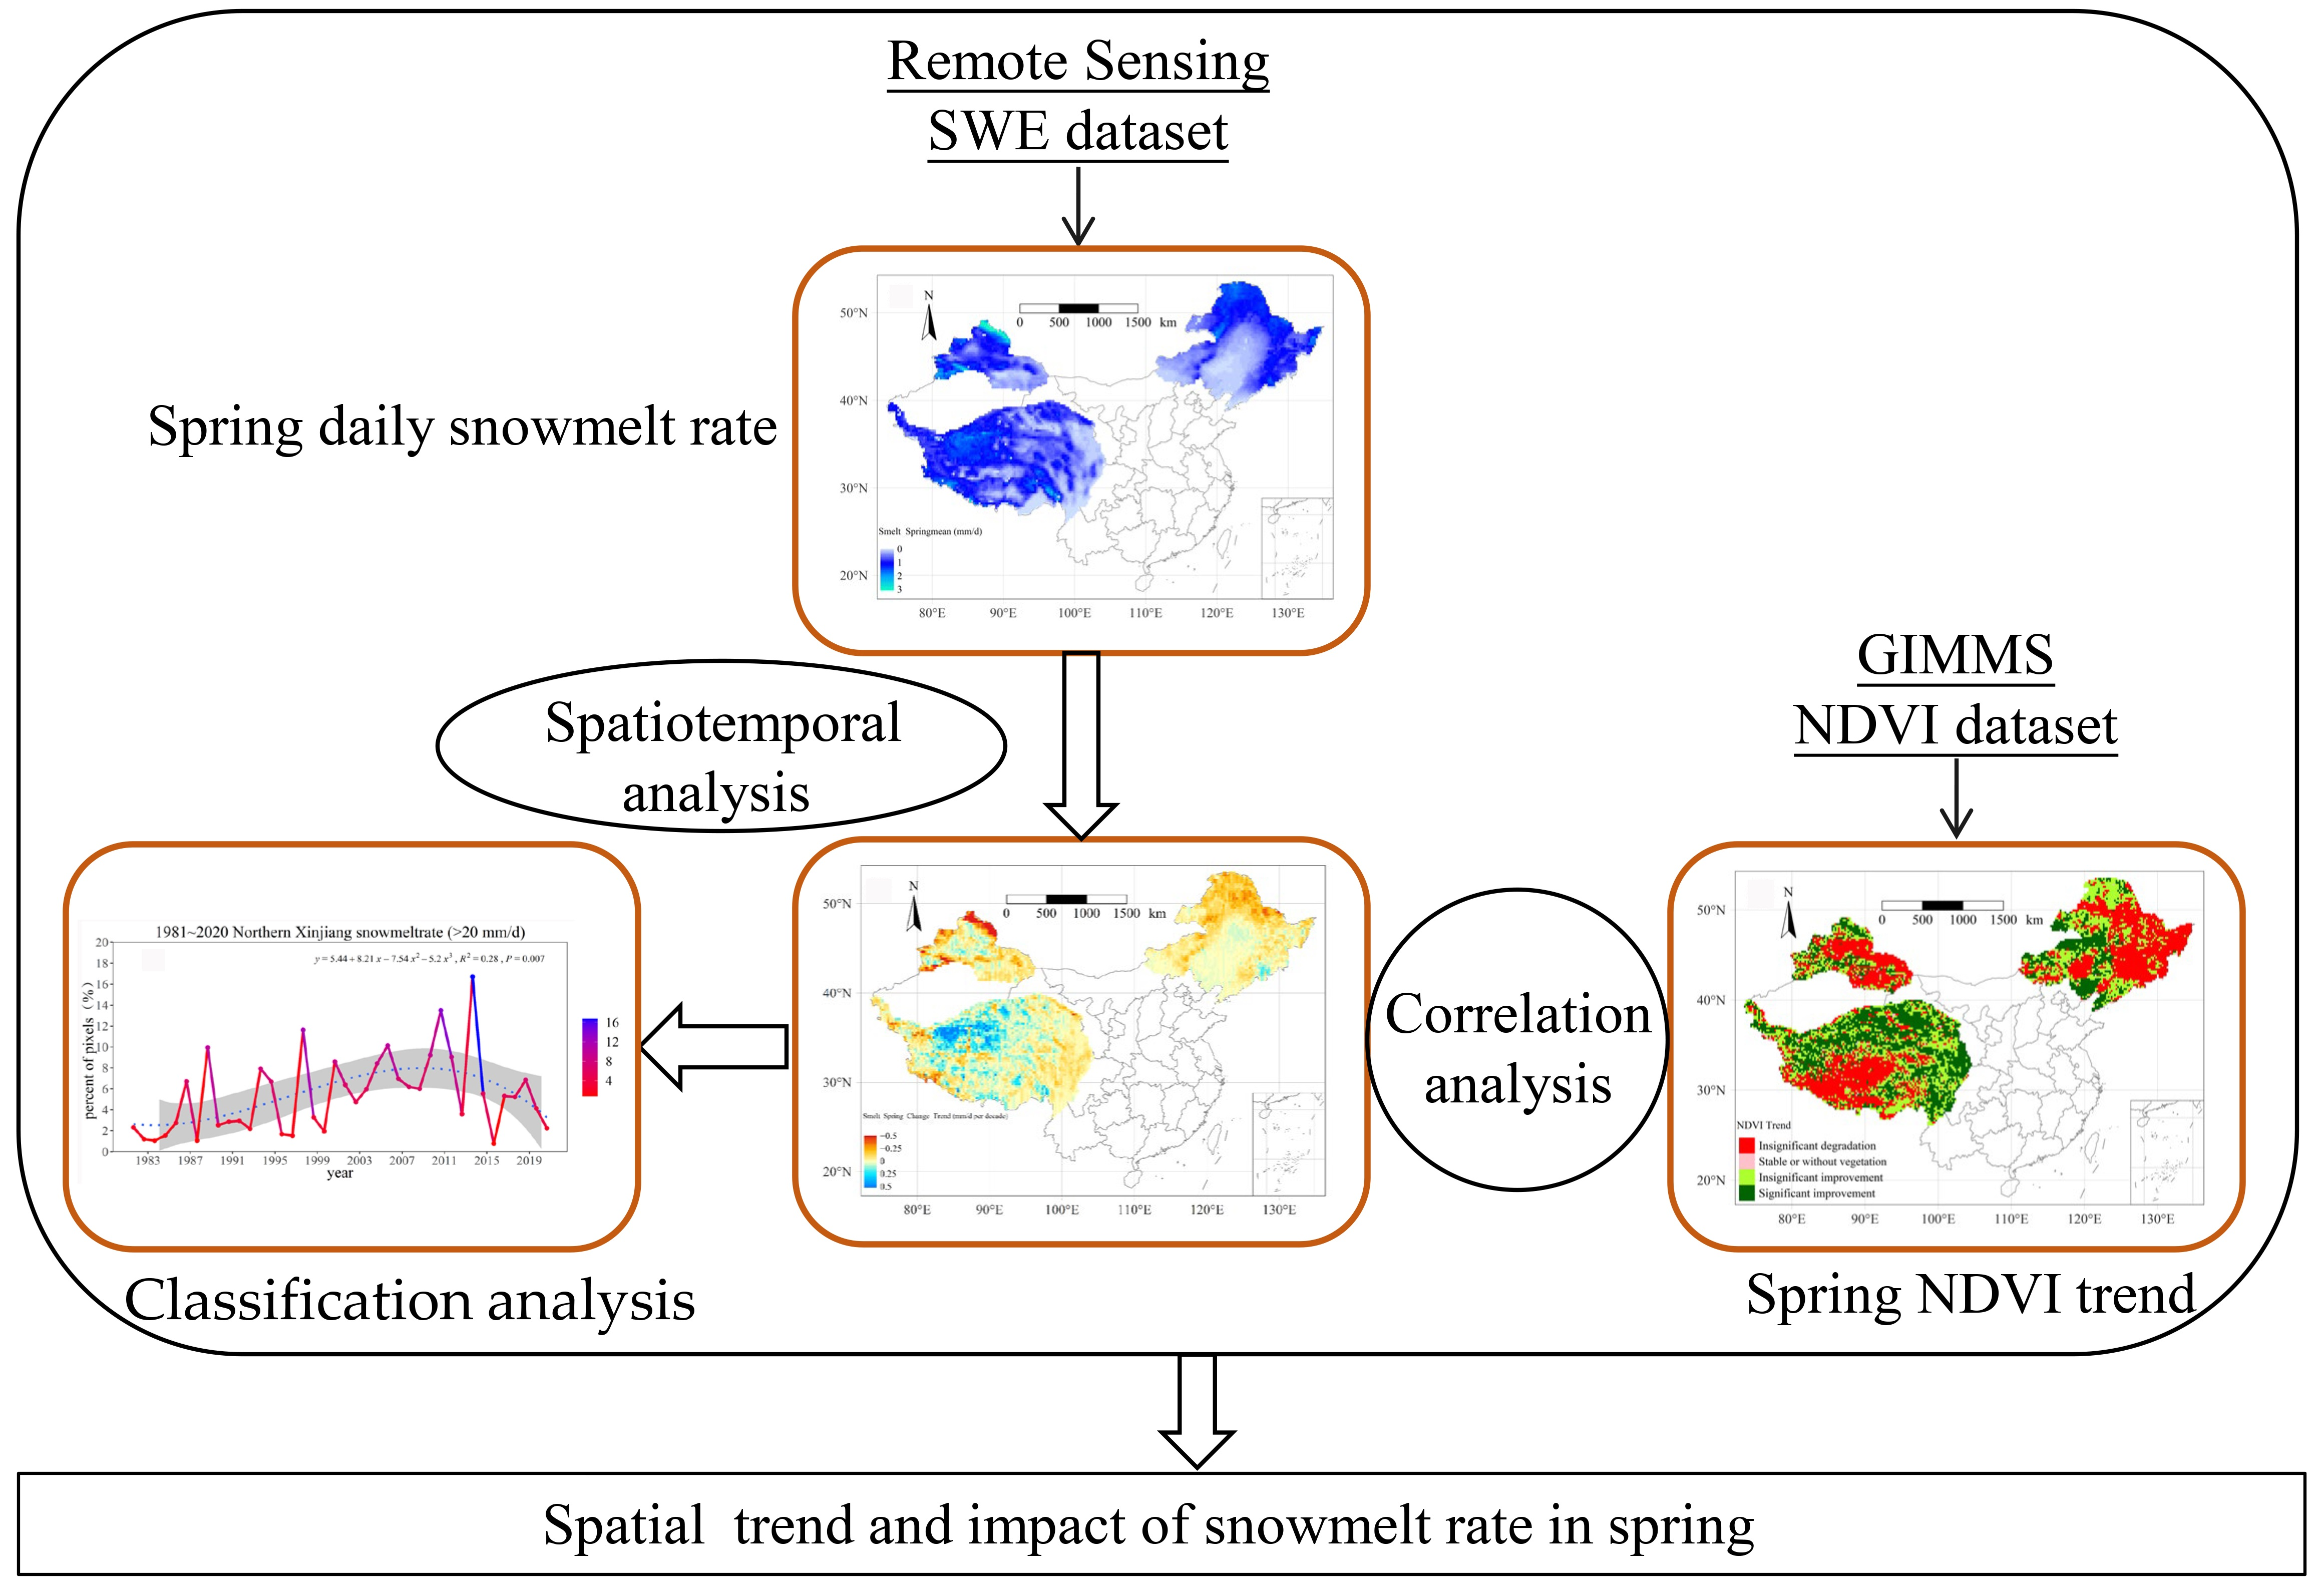
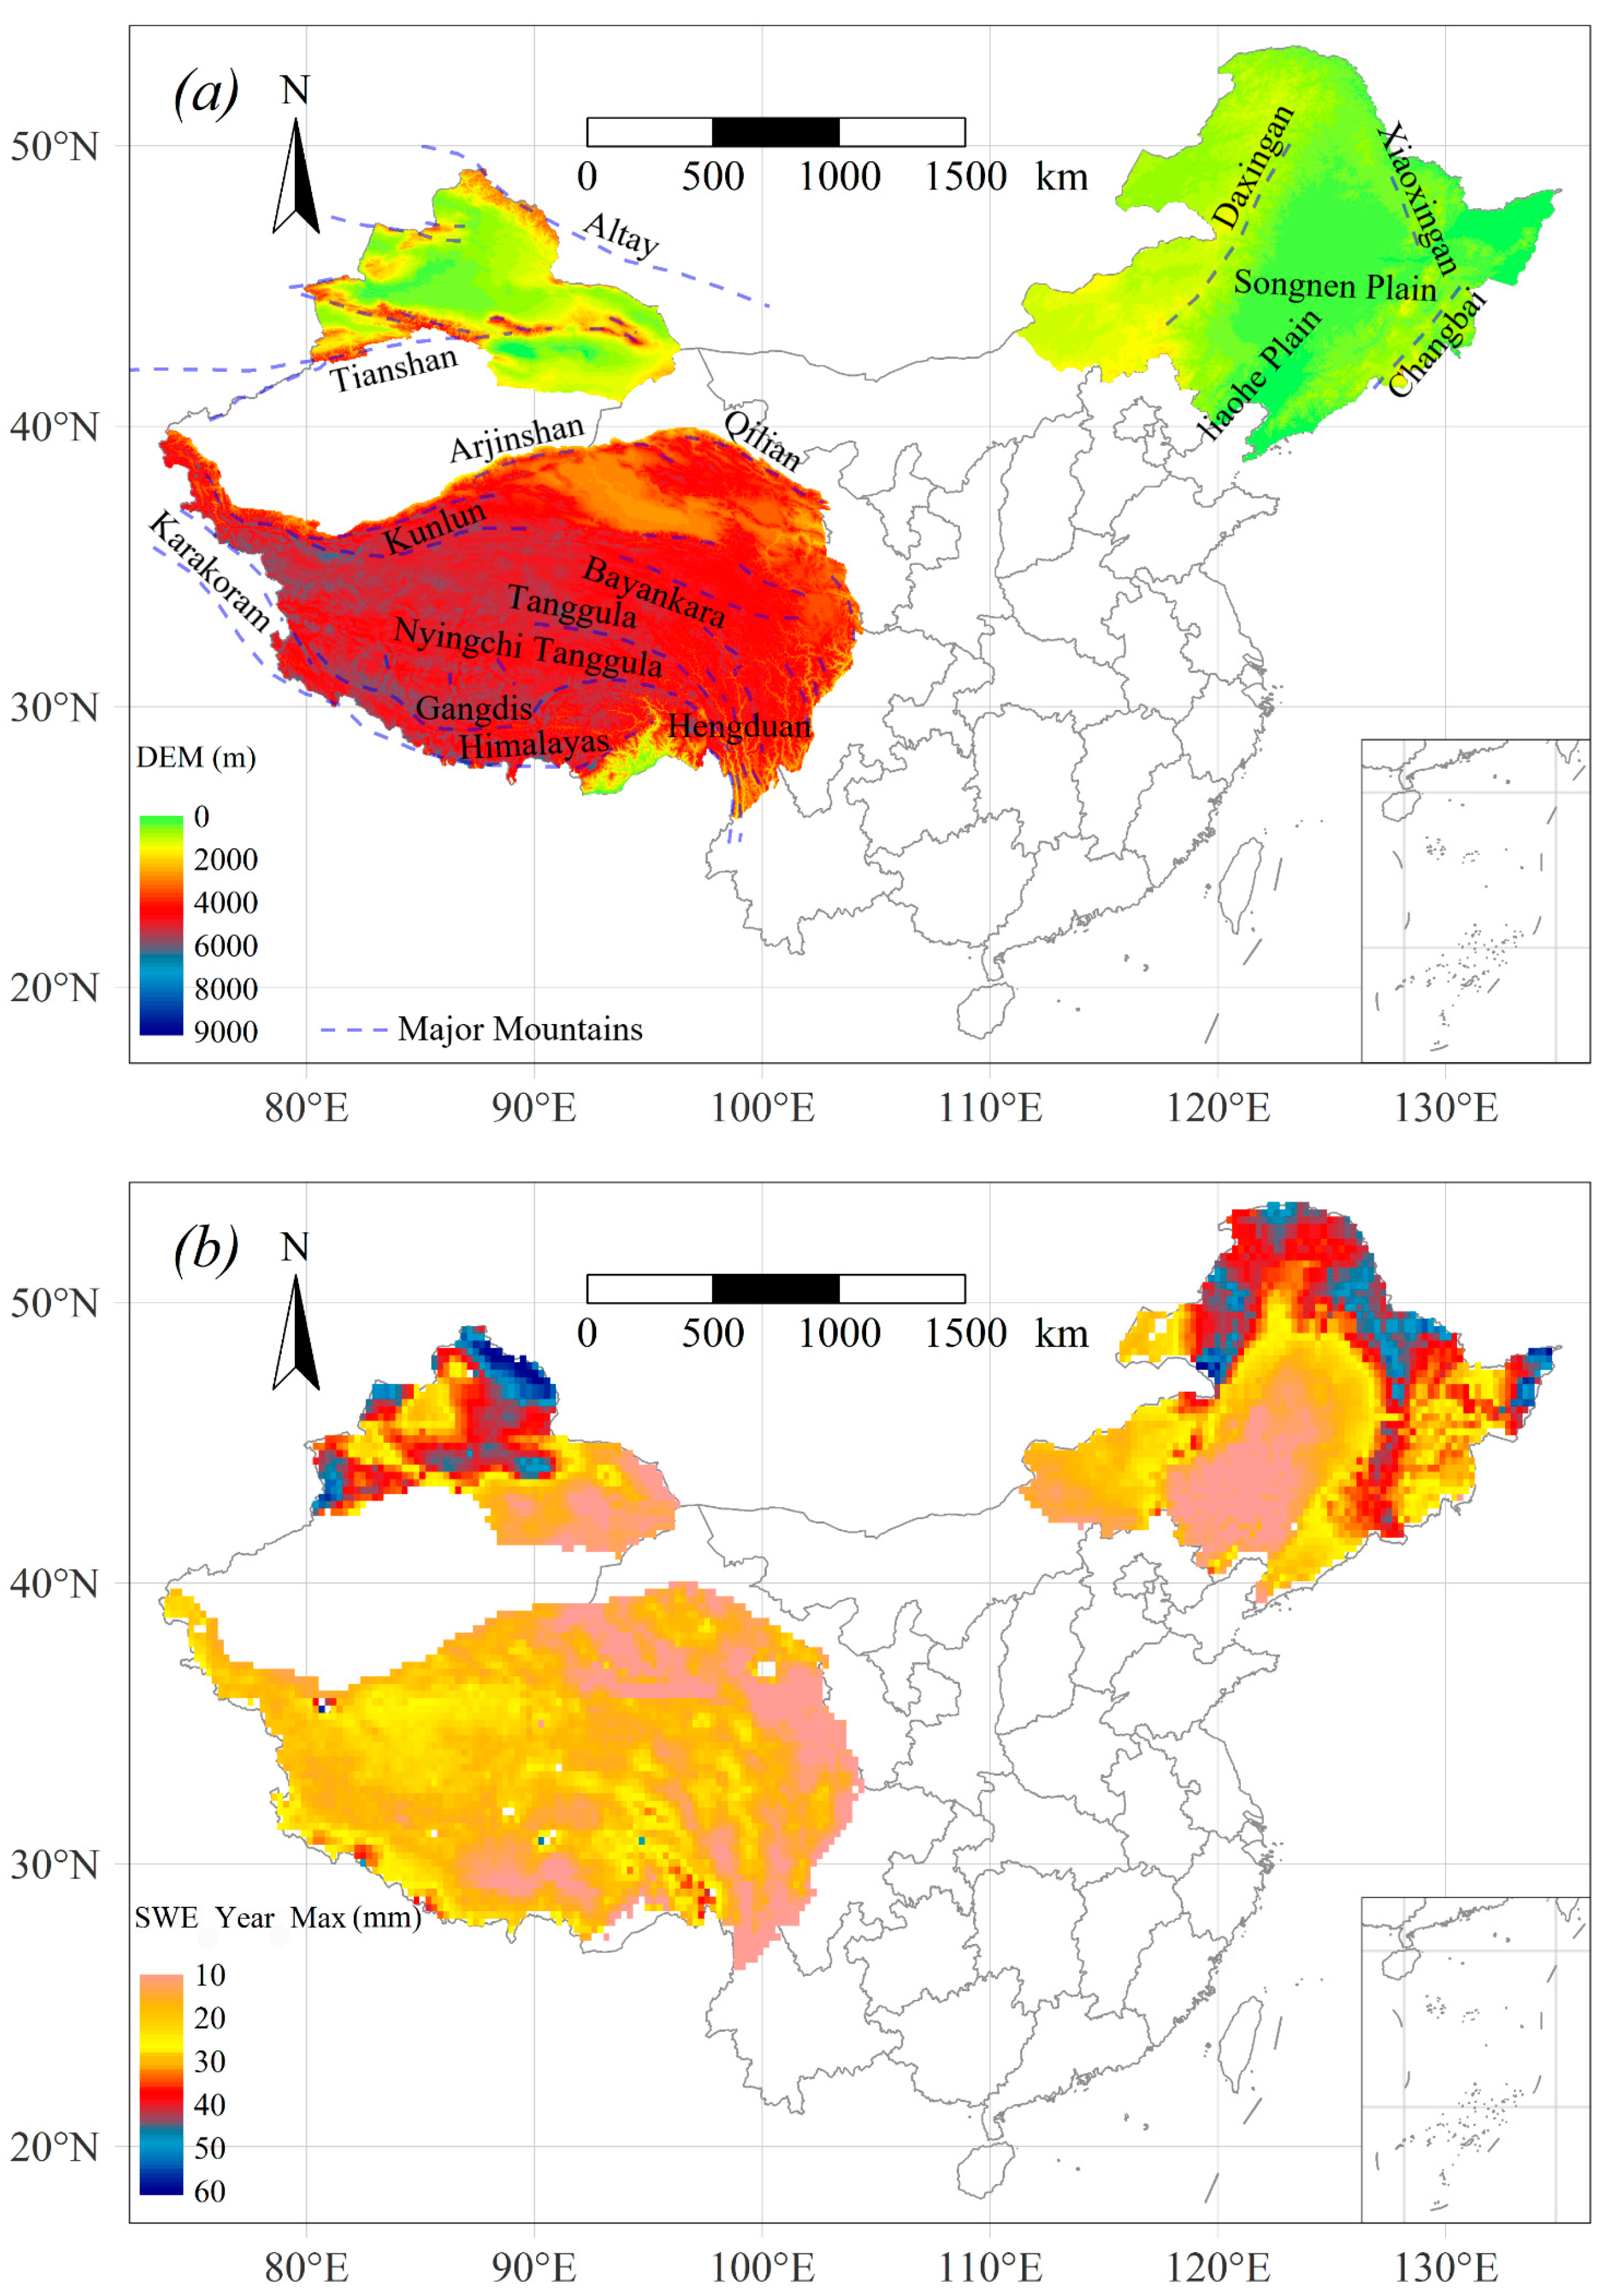
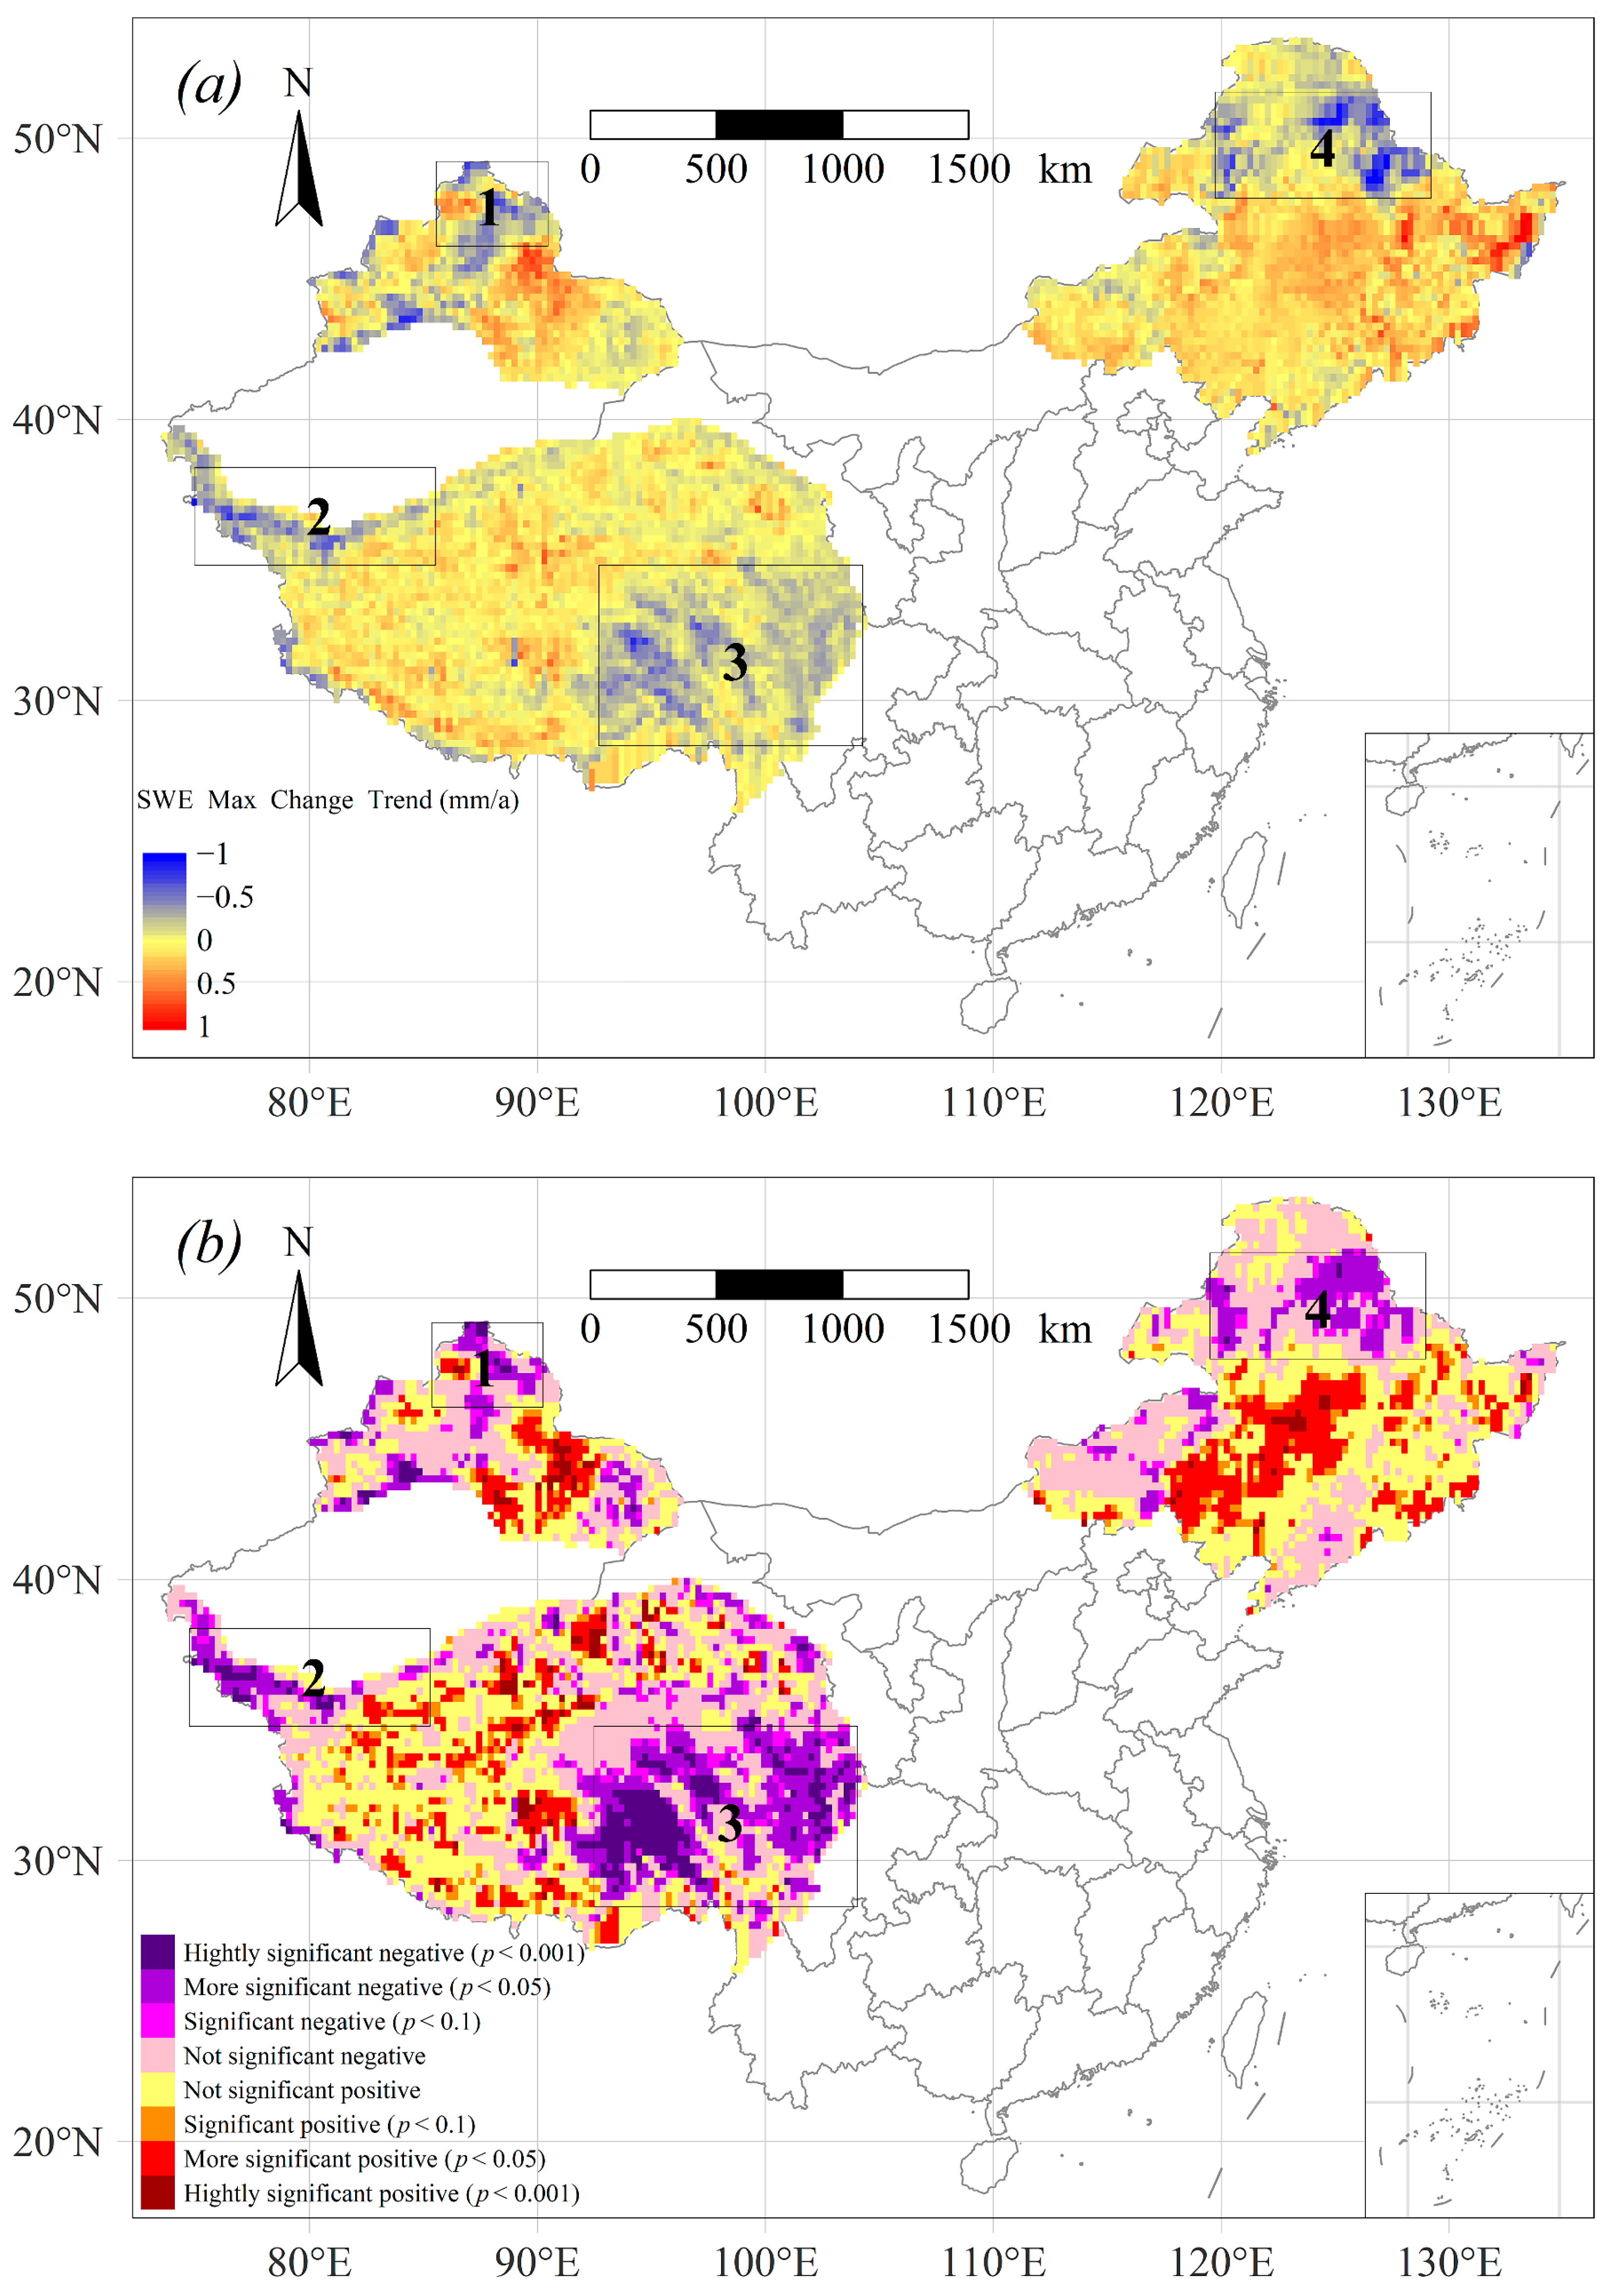
3.1. Spatiotemporal Dynamics and Tendencies of Annual Maximum SWE

Figure 1a shows a digital elevation map of China’s three main stable snow cover regions. In northeast China, the elevation ranges from 0 to 2000 m, with higher-altitude areas mainly distributed in the Da and Xiao Xing’an Mountains and Changbai Mountains. In northern Xinjiang, the elevation is greater, spanning 0 to 4000 m, in which higher-altitude areas are found to mainly be distributed in the Altay Mountains and Tianshan Mountains. By comparison, the spatial heterogeneity in the elevation is relatively large for the Tibetan Plateau, at 2000–8800 m, where the higher-altitude areas are distributed primarily in the Himalayas, Kunlun Mountains, and other areas with bigger mountains.
Figure 1b shows the results for the classified SWE values over three main stable snow cover regions. The proportions that designated very shallow, shallow, moderate, deep, and very deep (binned according to the mean annual maximum SWE) were 2.7%, 31.3%, 15%, 25%, and 26.1%, respectively, in northeast China. The corresponding values in northern Xinjiang were 5.1%, 31%, 23.5%, 23.5%, and 16.9%, and likewise, in the Tibetan Plateau, they were 7.9%, 67.6%, 23%, 1.2%, and 0.2%. Evidently, the distribution of SWE in northern Xinjiang featured latitudinal zonality but both latitudinal zonality and elevational zonality in northeast China. In stark contrast, in Tibetan Plateau, the distribution of SWE depends mostly on elevation only, with a prevailing SWE of 10–30 mm, which is less than that in northern Xinjiang or northeast China. Many glaciers exist in the Tibetan Plateau, most of which were not recorded in the remote-sensing-based SWE dataset because its ca. 25-km spatial resolution exceeds the width of the majority of glaciers. This could explain why an SWE value of 0 was observed in some areas (pixels).
Figure 2 depicts the trends in the annual maximum SWE change from 1981 to 2020, which clearly revealed much spatial heterogeneity in the three main stable snow cover regions of China. Four subregions were distinguished by an SWE reduction (−0.5~−1.0 mm per year) (p < 0.001): the central and southern Altay Mountains (46–48°N, 86–91°E) (No. 1 subregion), west Kunlun Mountains (35–39°N, 75–85°E) (No. 2 subregion) in the Tibetan Plateau, southeastern Tibetan Plateau (28–35°N, 93–103°E) (No. 3 subregion), and the north Da and Xiao Xing’an Mountains (47–52°N, 120–129°E) (No. 4 subregion). For other subregions within the three main snow cover regions, the variation in their annual maximum SWE tended to increase or slightly increase. In other words, according to the average annual maximum SWE over the last 40 years, significant decreasing trends were found in the mountainous areas with a deeper SWE (between 40 and 60 mm) over northeast China and northern Xinjiang, and with about 30 mm over southeastern Tibetan Plateau. Specifically, for northern Xinjiang, the area proportion of its land with an increasing vs. decreasing trend in SWE was 45% vs. 55%, and the mean change in the rate of the annual maximum SWE was −0.1 mm/decade. For northeast China, more of its land was characterized by an increasing trend in SWE (66%) than a decreasing one (34%), for which the mean change in the rate of SWE was 0.6 mm/decade. Finally, for the Tibetan Plateau, 43% of its land area featured an increasing trend in SWE with slightly more distinguished by a decreasing trend (57%); the mean rate of change in SWE was −0.4 mm/decade. In sum, snow water reserves in mountainous areas declined in two out of the three main stable snow cover regions in China.

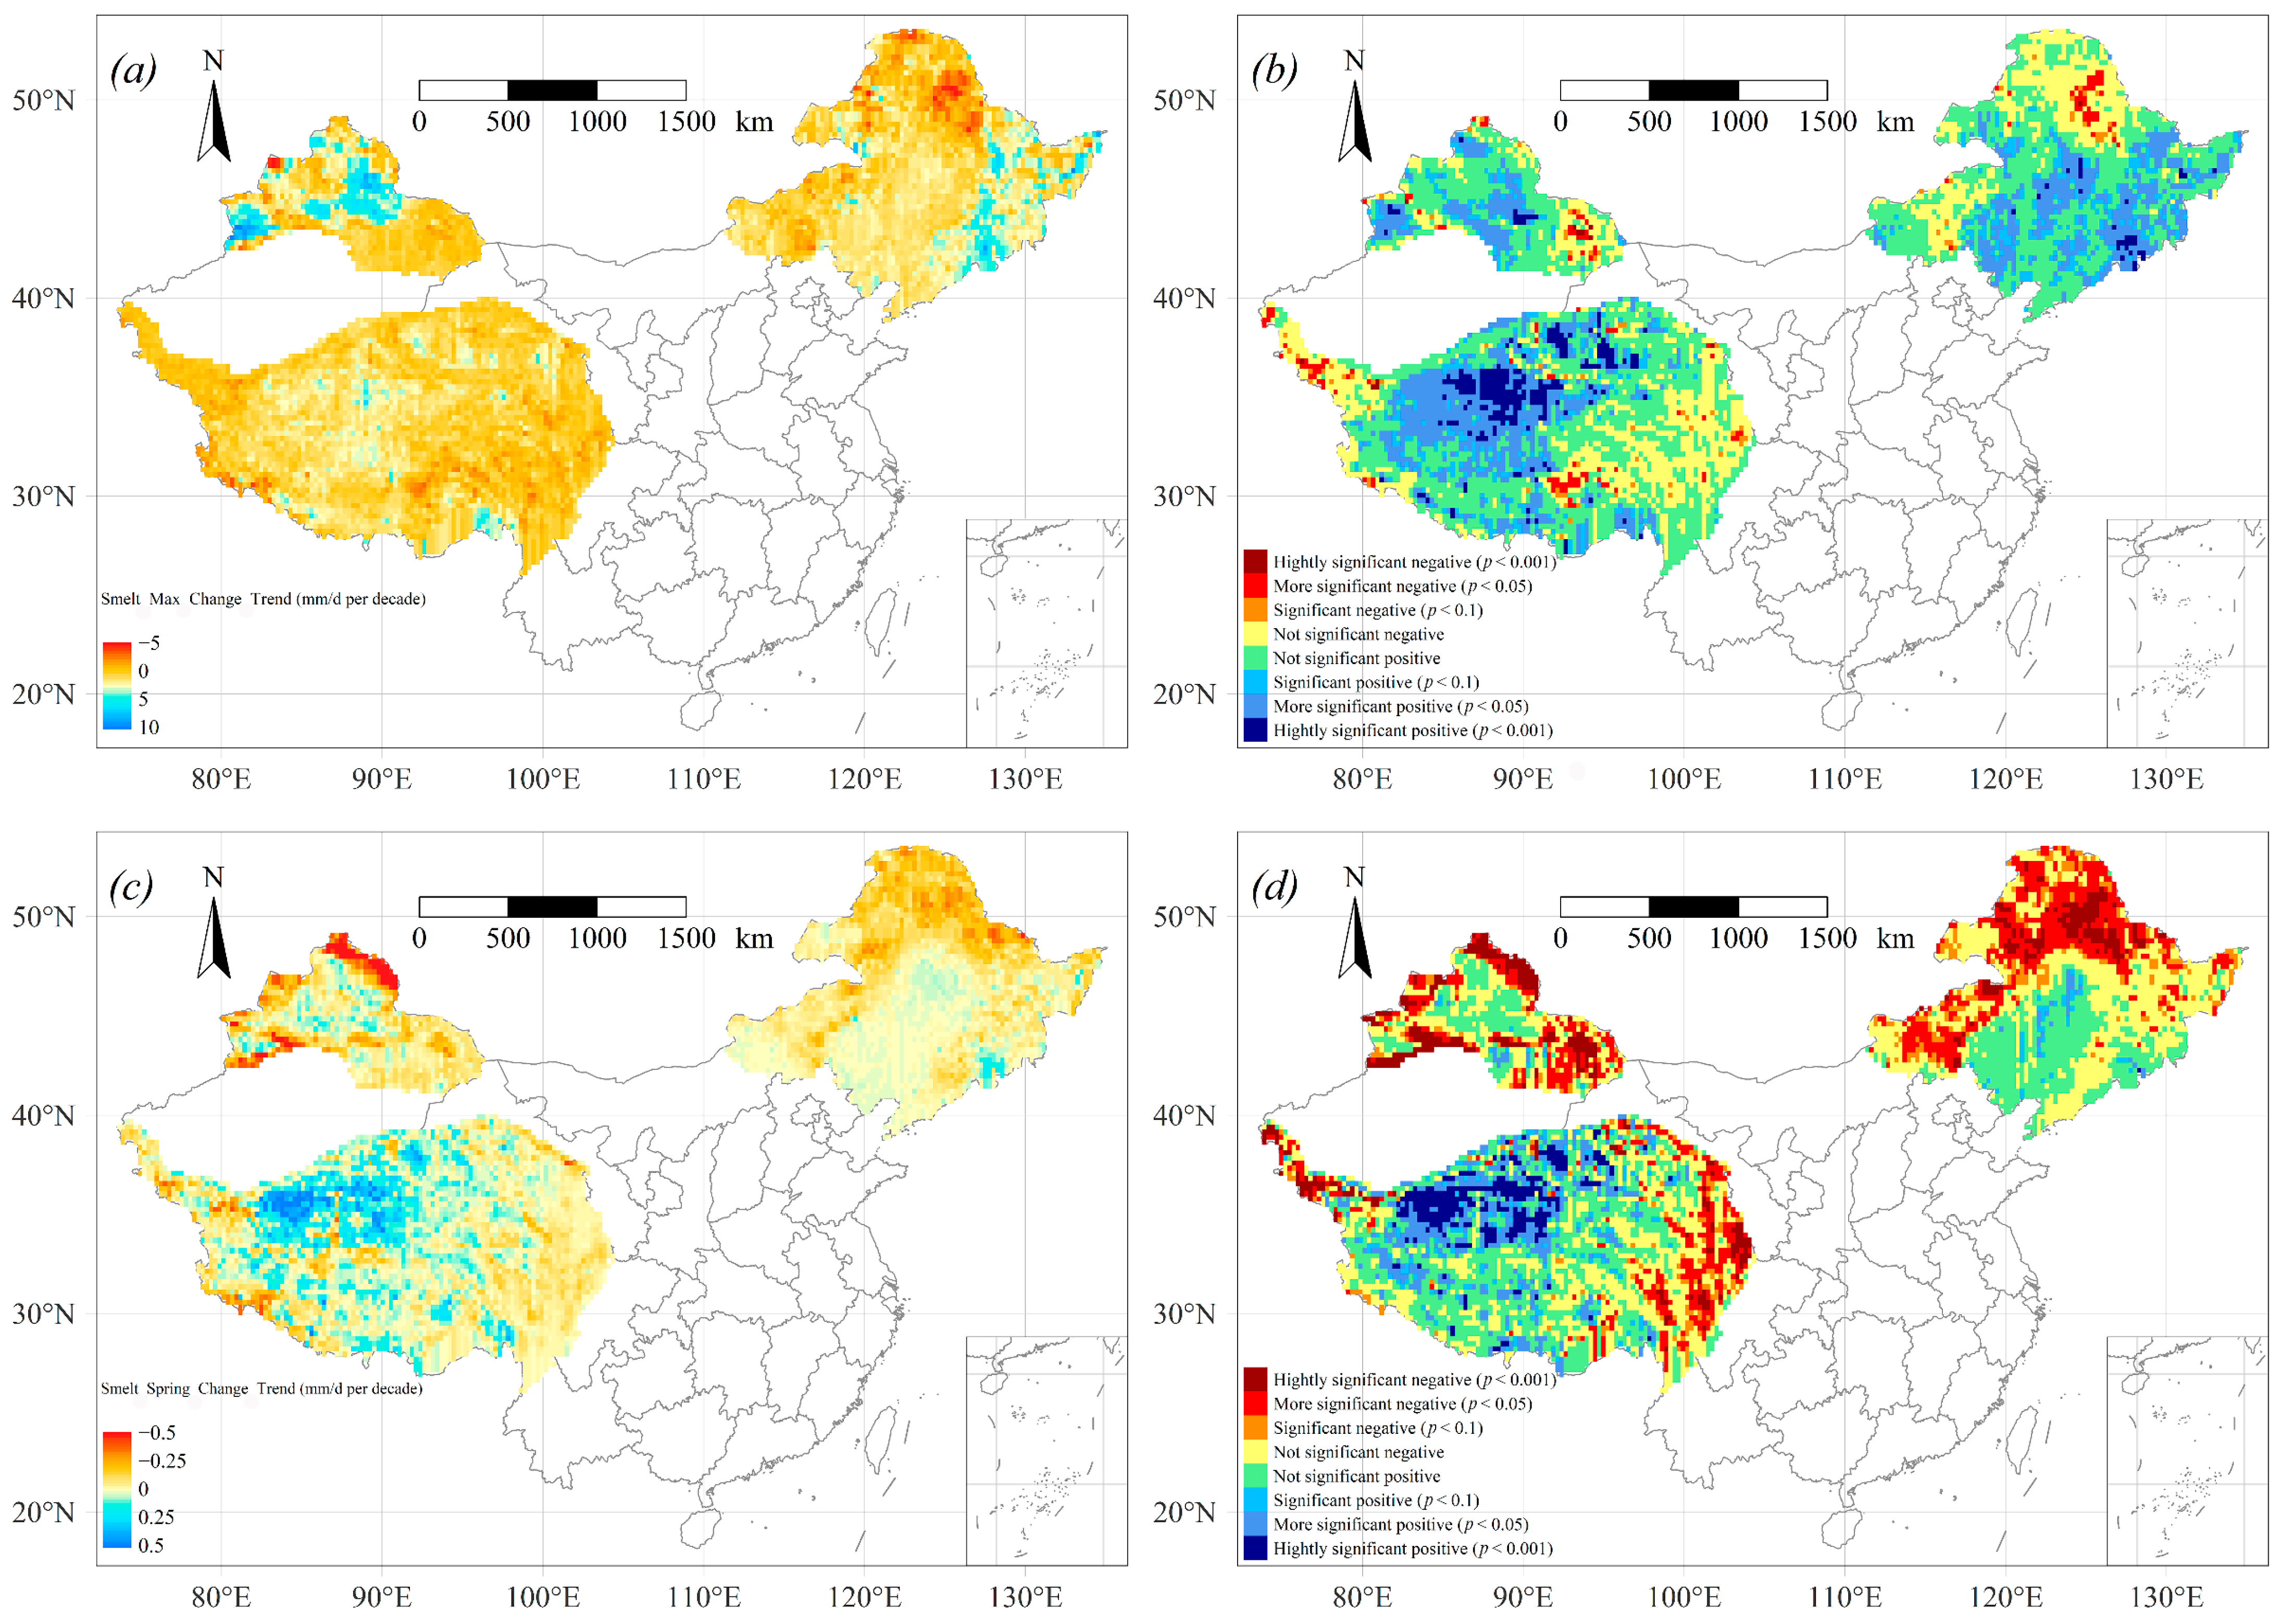
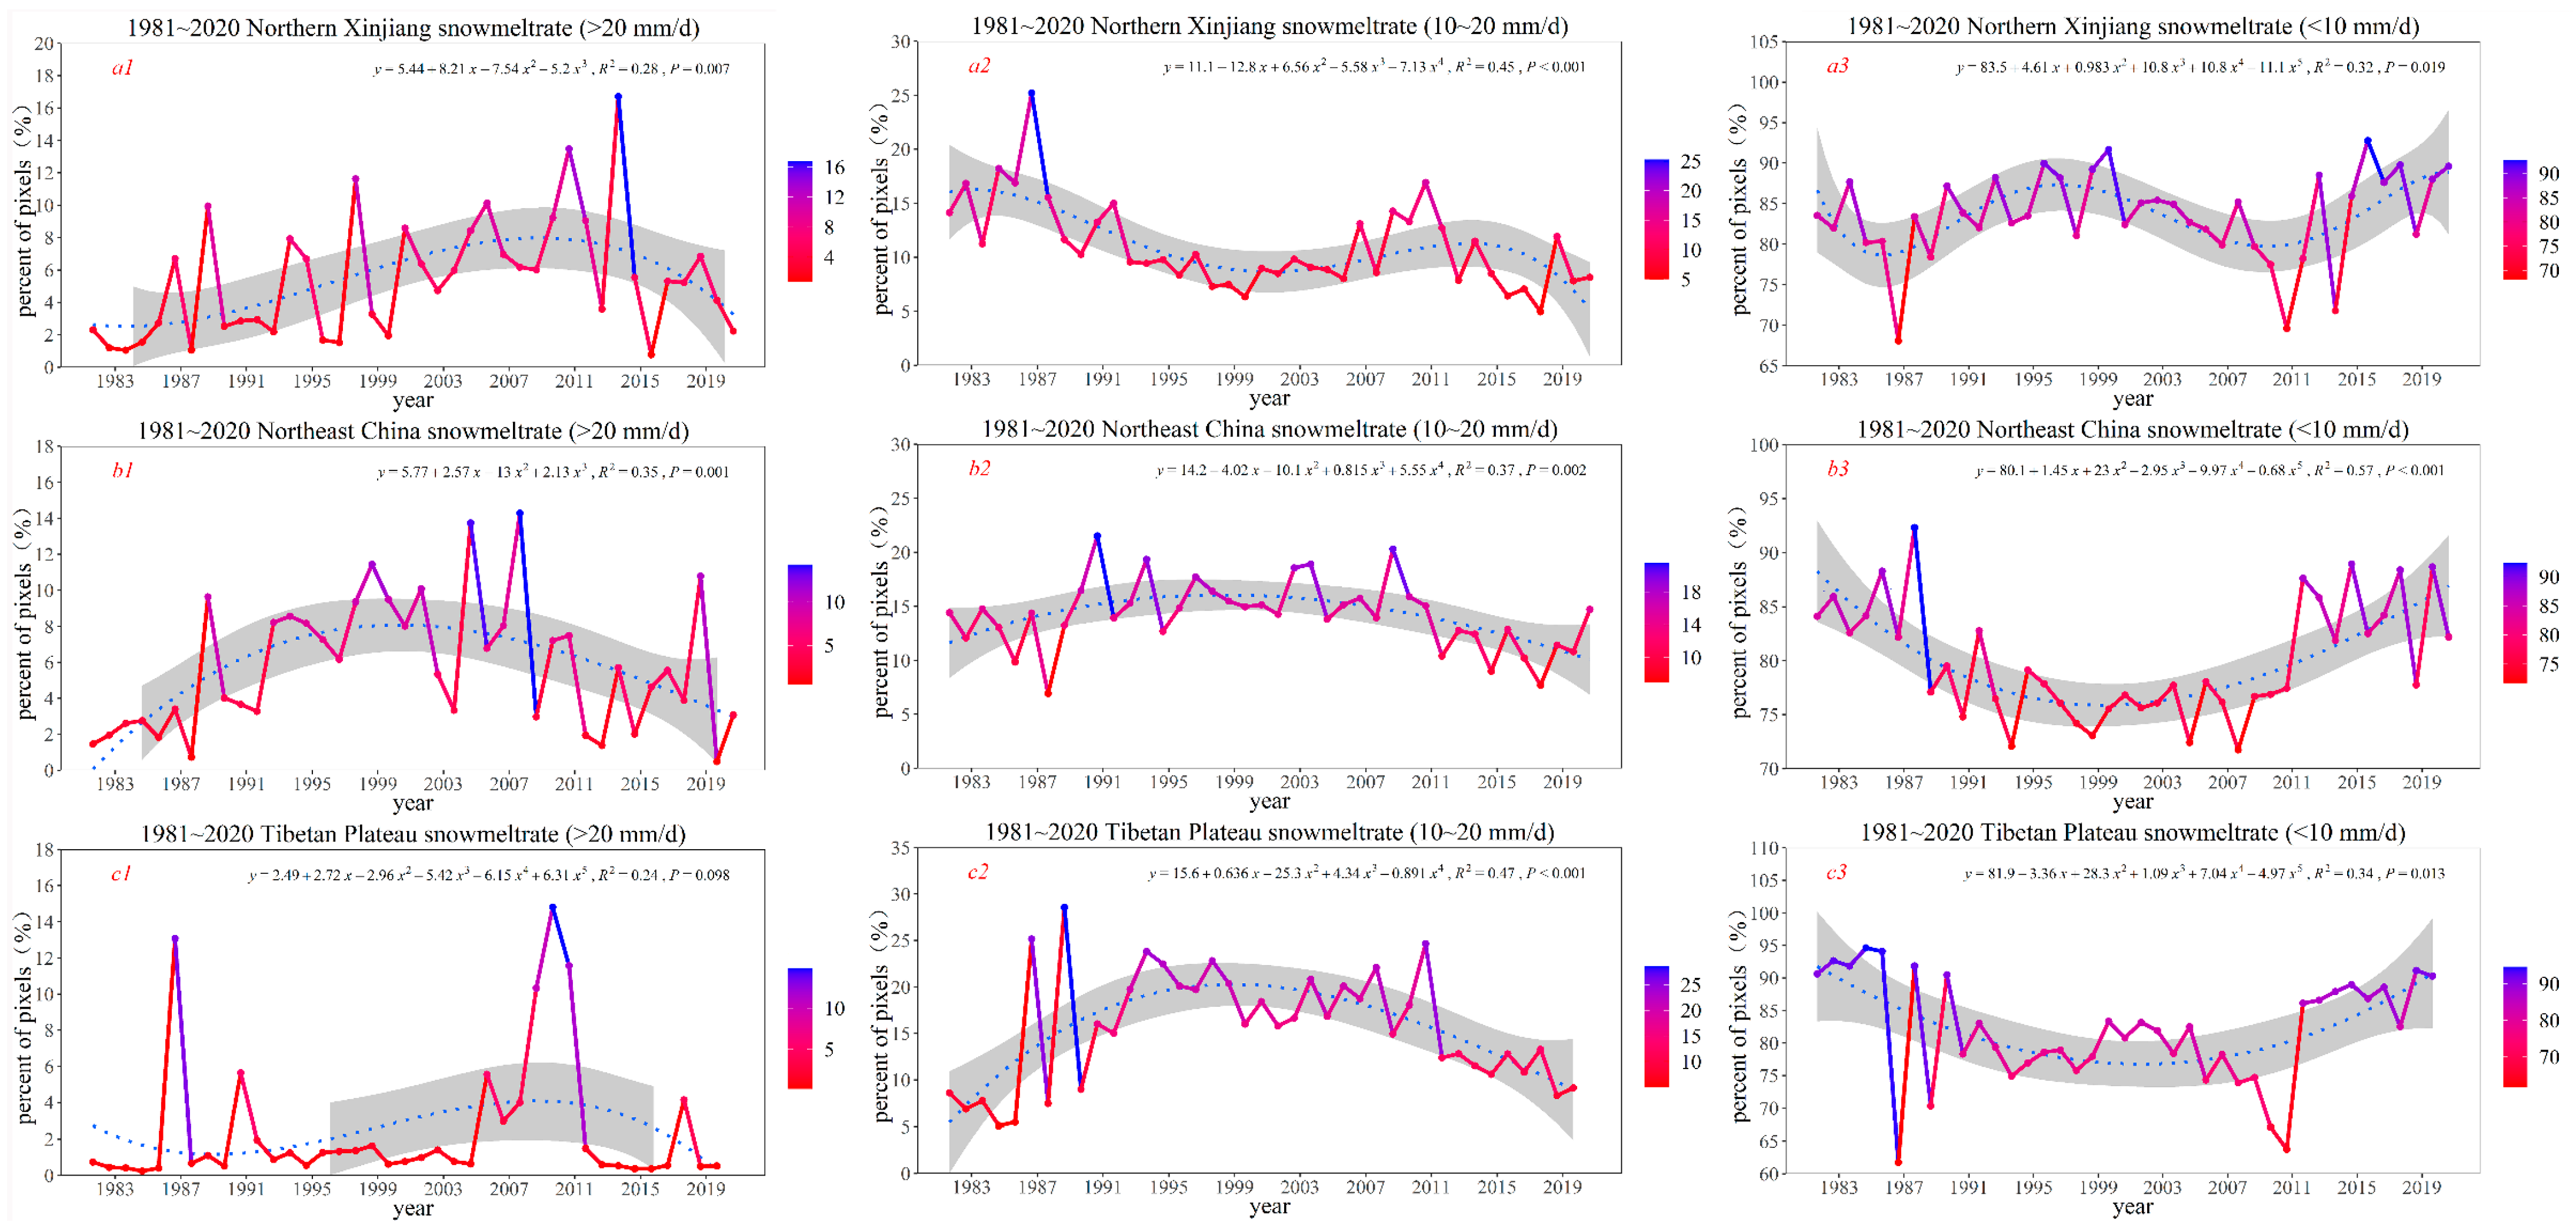
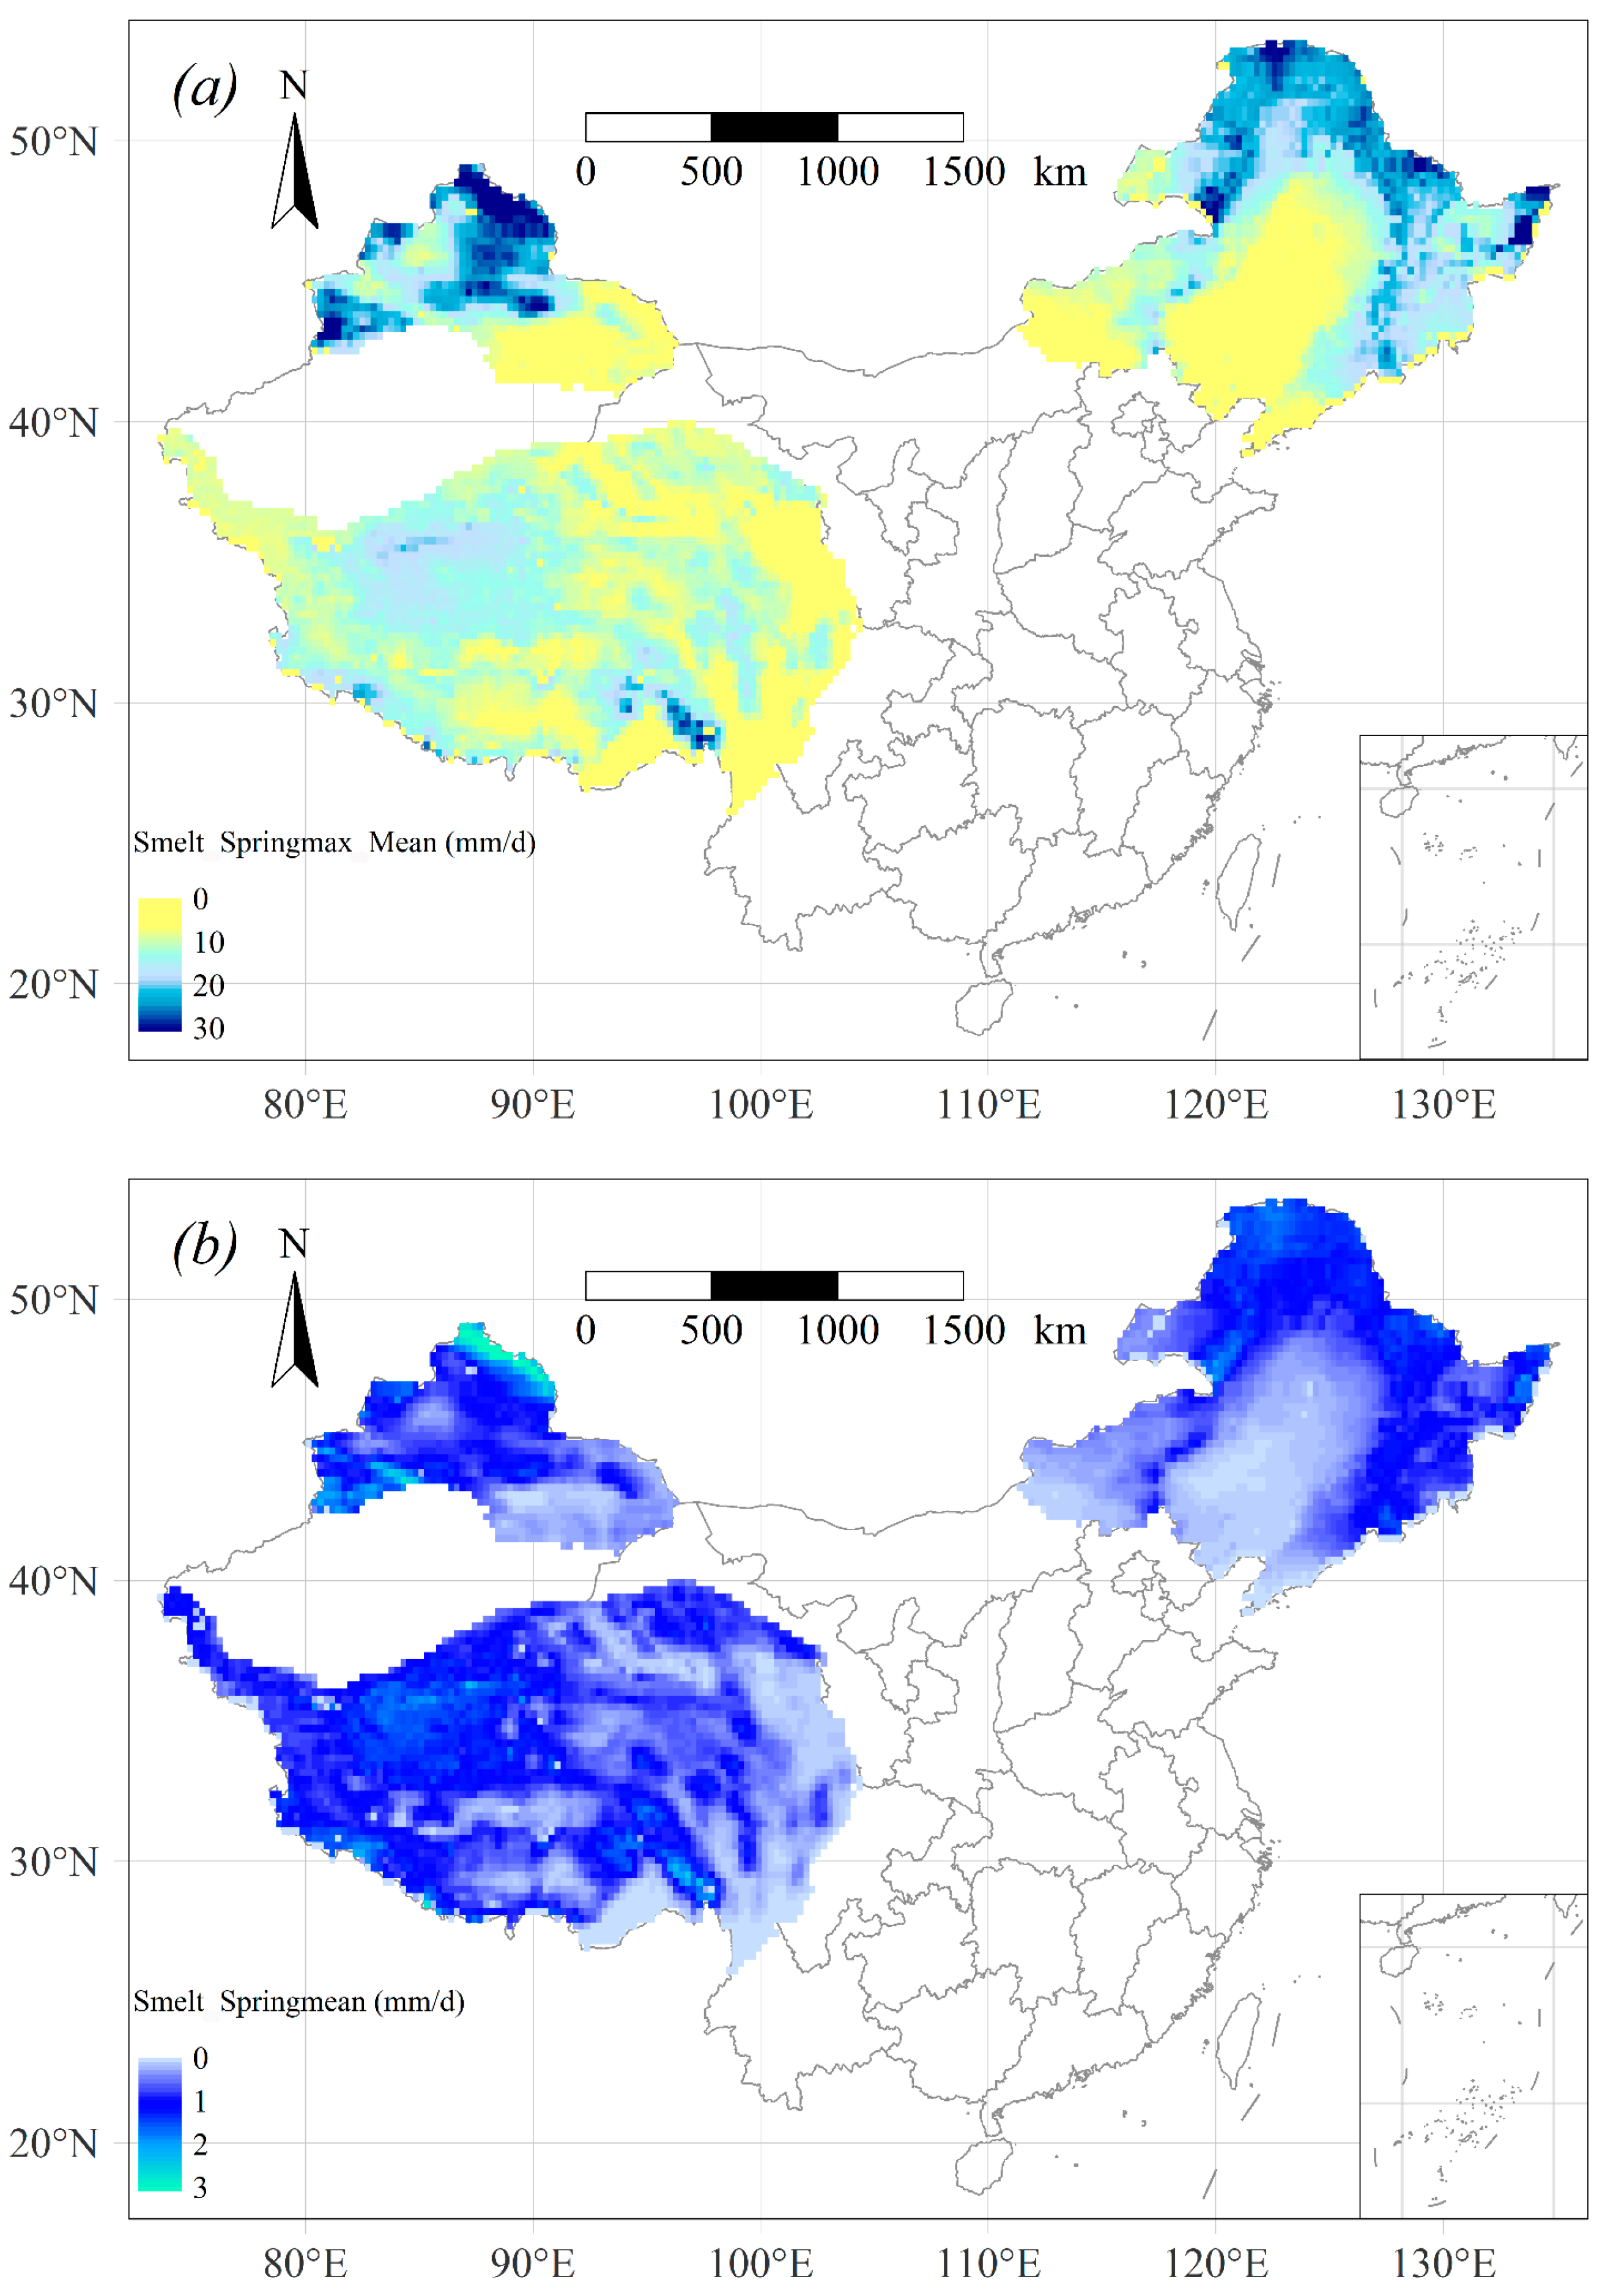
3.2. Spatiotemporal Dynamics and Trends of Snowmelt Rate in Spring

Daily snowpack depletion was derived from long-term SWE observations across the three main stable snow cover regions of China over the past 40 years. Figure 3a,b show the distributions for the annual maximum and mean snowmelt rate in spring, respectively. Evidently, high snowmelt rates were largely restricted to the Altay Mountains and Tianshan Mountains and Da and Xiao Xing’an Mountains due to the heavy snowfall that occurred there over winter. The maximum snowmelt rate was ~30 mm/day, 10-fold more than the mean snowmelt rate of ~3 mm/day. In spring, the mean value of the maximum snowmelt rate was 15 mm/day in northern Xinjiang, 13 mm/day in northeast China, and 9 mm/day in the Tibetan Plateau during the past 40 years. The areas distinguished by a low snowmelt rate are mostly concentrated in the arid part of northwest China, likely because of low local precipitation, and in Songnen Plain and Liaohe Plain in northeast China, likely because of these subregions’ high air temperatures.
In winter, the three stable snow cover regions have a low air temperature, with little snowmelt occurring in any of them. In spring, however, northern Xinjiang and northeast China are the main regions where snowmelt occurs in China. However, with further warming driven by seasonality, the Tibetan Plateau becomes the main region of snowmelt until May. In summer, snowfall is largely absent across most of China, with snowmelt occurring only in the high-elevation mountains of the Tibetan Plateau (already lying at a high altitude). The temporal trend for the snowmelt rate in spring from 1981 to 2020 varied across the three main stable snow cover regions (Figure 4). As seen in Figure 4a,b, the maximum snowmelt rate declined significantly from 1981 to 2020 in the eastern Tianshan Mountains, northern Da Xing’an Mountains, and southeastern Tibet, and western Kunlun Mountains. The reduction in this rate (i.e., slope value) over time was as great as −5 mm/decade (p < 0.001). Yet, a slight increase in the maximum snowmelt rate was discernible in the Tibetan Plateau’s center and the Songnen Plain of northeast China (p < 0.01). Concerning the mean snowmelt rate, apart from the hinterland of the Tibetan Plateau, the rates in several conspicuous alpine subregions usually covered in snow were marked by a significant reduction trend from 1981 to 2020 (Figure 4c,d) (p < 0.001), declining as fast as −0.5 mm/decade (p < 0.001) (Figure 4d). This might imply that climate warming of these alpine subregions led to their earlier onset of snowmelt. Taken together, the above results suggest probable consequences of global warming for snowmelt rates over China’s three stable snow cover regions, marked by a tendency of slower snowmelt in these mountainous regions with a warmer climate.
Overall, the percentage of pixels that changed over time in the snowmelt rate was similar across China’s three stable snow cover regions. Non-linear trends were fitted to the remotely sensed data trend, and the polynomial regressions passed the 90% significance level (Figure 5). In spring, its moderate and high snowmelt rates both showed increasing trends before ca. 2000, after which they tended to decrease, and vice versa for low snowmelt rates. This decline in the proportion of pixels with moderate and high snowmelt rates over the last 20 years could have contributed to snowmelt slowing in the three stable snow cover regions from above study result. Specifically, in northern Xinjiang, the low snowmelt rate in spring was characterized by a general trend of irregular fluctuations from 1981 to 2010; nevertheless, it did exhibit an increasing trend over the last 10 years (2010–2020). In the Tibetan Plateau, there were relatively less areas (pixels) with a high snowmelt rate than in the other two regions; hence, its variation hardly changed from 1981 to 2020. From these results of the spatiotemporal dynamics of the snowmelt rate in spring, two clear but related findings emerged. First, for 1981 through to 2020, there is a similar tendency of slower snowmelt in spring, especially declining high snowmelt rates over the three stable snow cover regions in the last two decades; second, and by contrast, low snowmelt rates became more common after 2000 in all three regions.

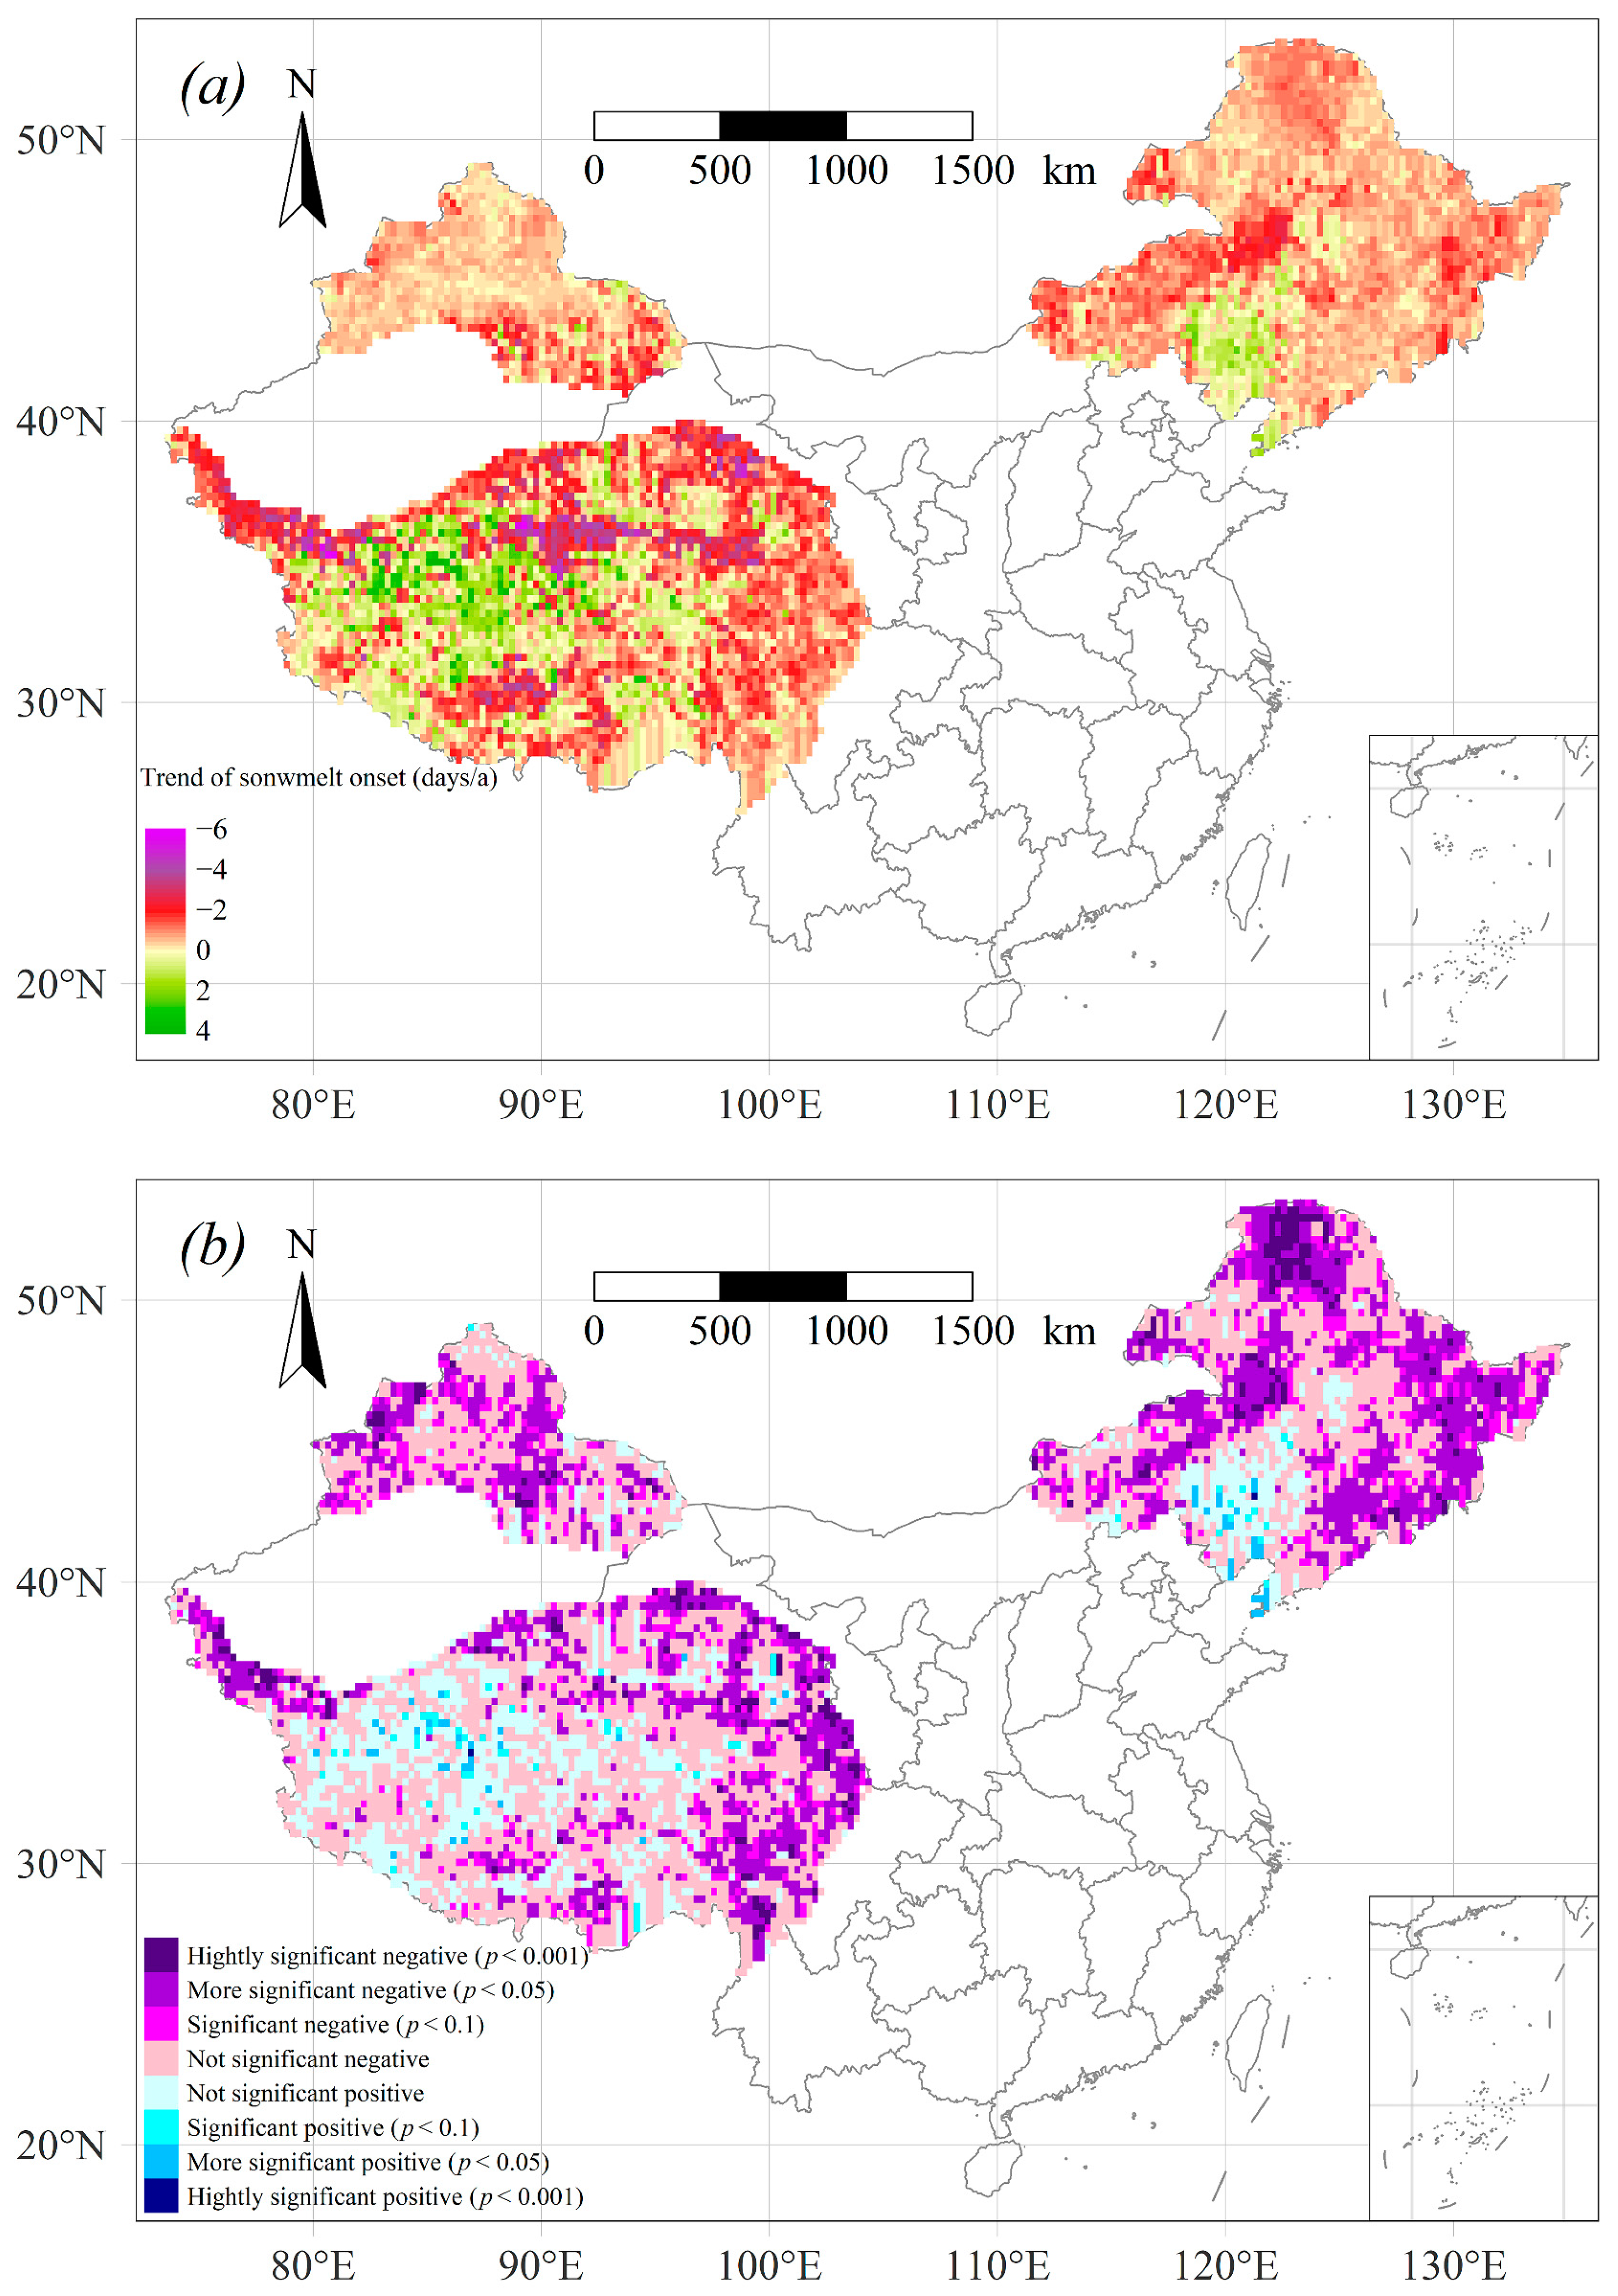
3.3. Shifts in Snowmelt Onset Day across the Three Stable Snow Cover Regions

Next, to uncover plausible causes for the declining snowmelt rates over the major mountainous subregions in China’s three stable snow cover regions, the trends of their day of snowmelt onset were examined over the past 40 years. This revealed that snowmelt started sooner under a warming climate (Figure 6), now happening 2~6 days earlier per year over most subregions of the three stable snow cover regions, excluding the central parts of the Tibetan Plateau and Songnen Plain of northeast China. Earlier snowmelt may explain the slower snowmelt rate in spring because snow rarely persists into the beginning of summer. Specifically, the mean trend of the snowmelt onset day was −0.6, −0.7, and −0.7 days/year for northern Xinjiang, northeast China, and the Tibetan Plateau, respectively. The spatial heterogeneity in the shifting phenology of snowmelt was evidently greatest in the Tibetan Plateau (Figure 6a), and, as shown in Figure 6b, highly significant trends (p < 0.001) for a shifting day of snowmelt onset (earlier or later) were widespread in all three regions but least so in the Tibetan Plateau.

4. Discussion

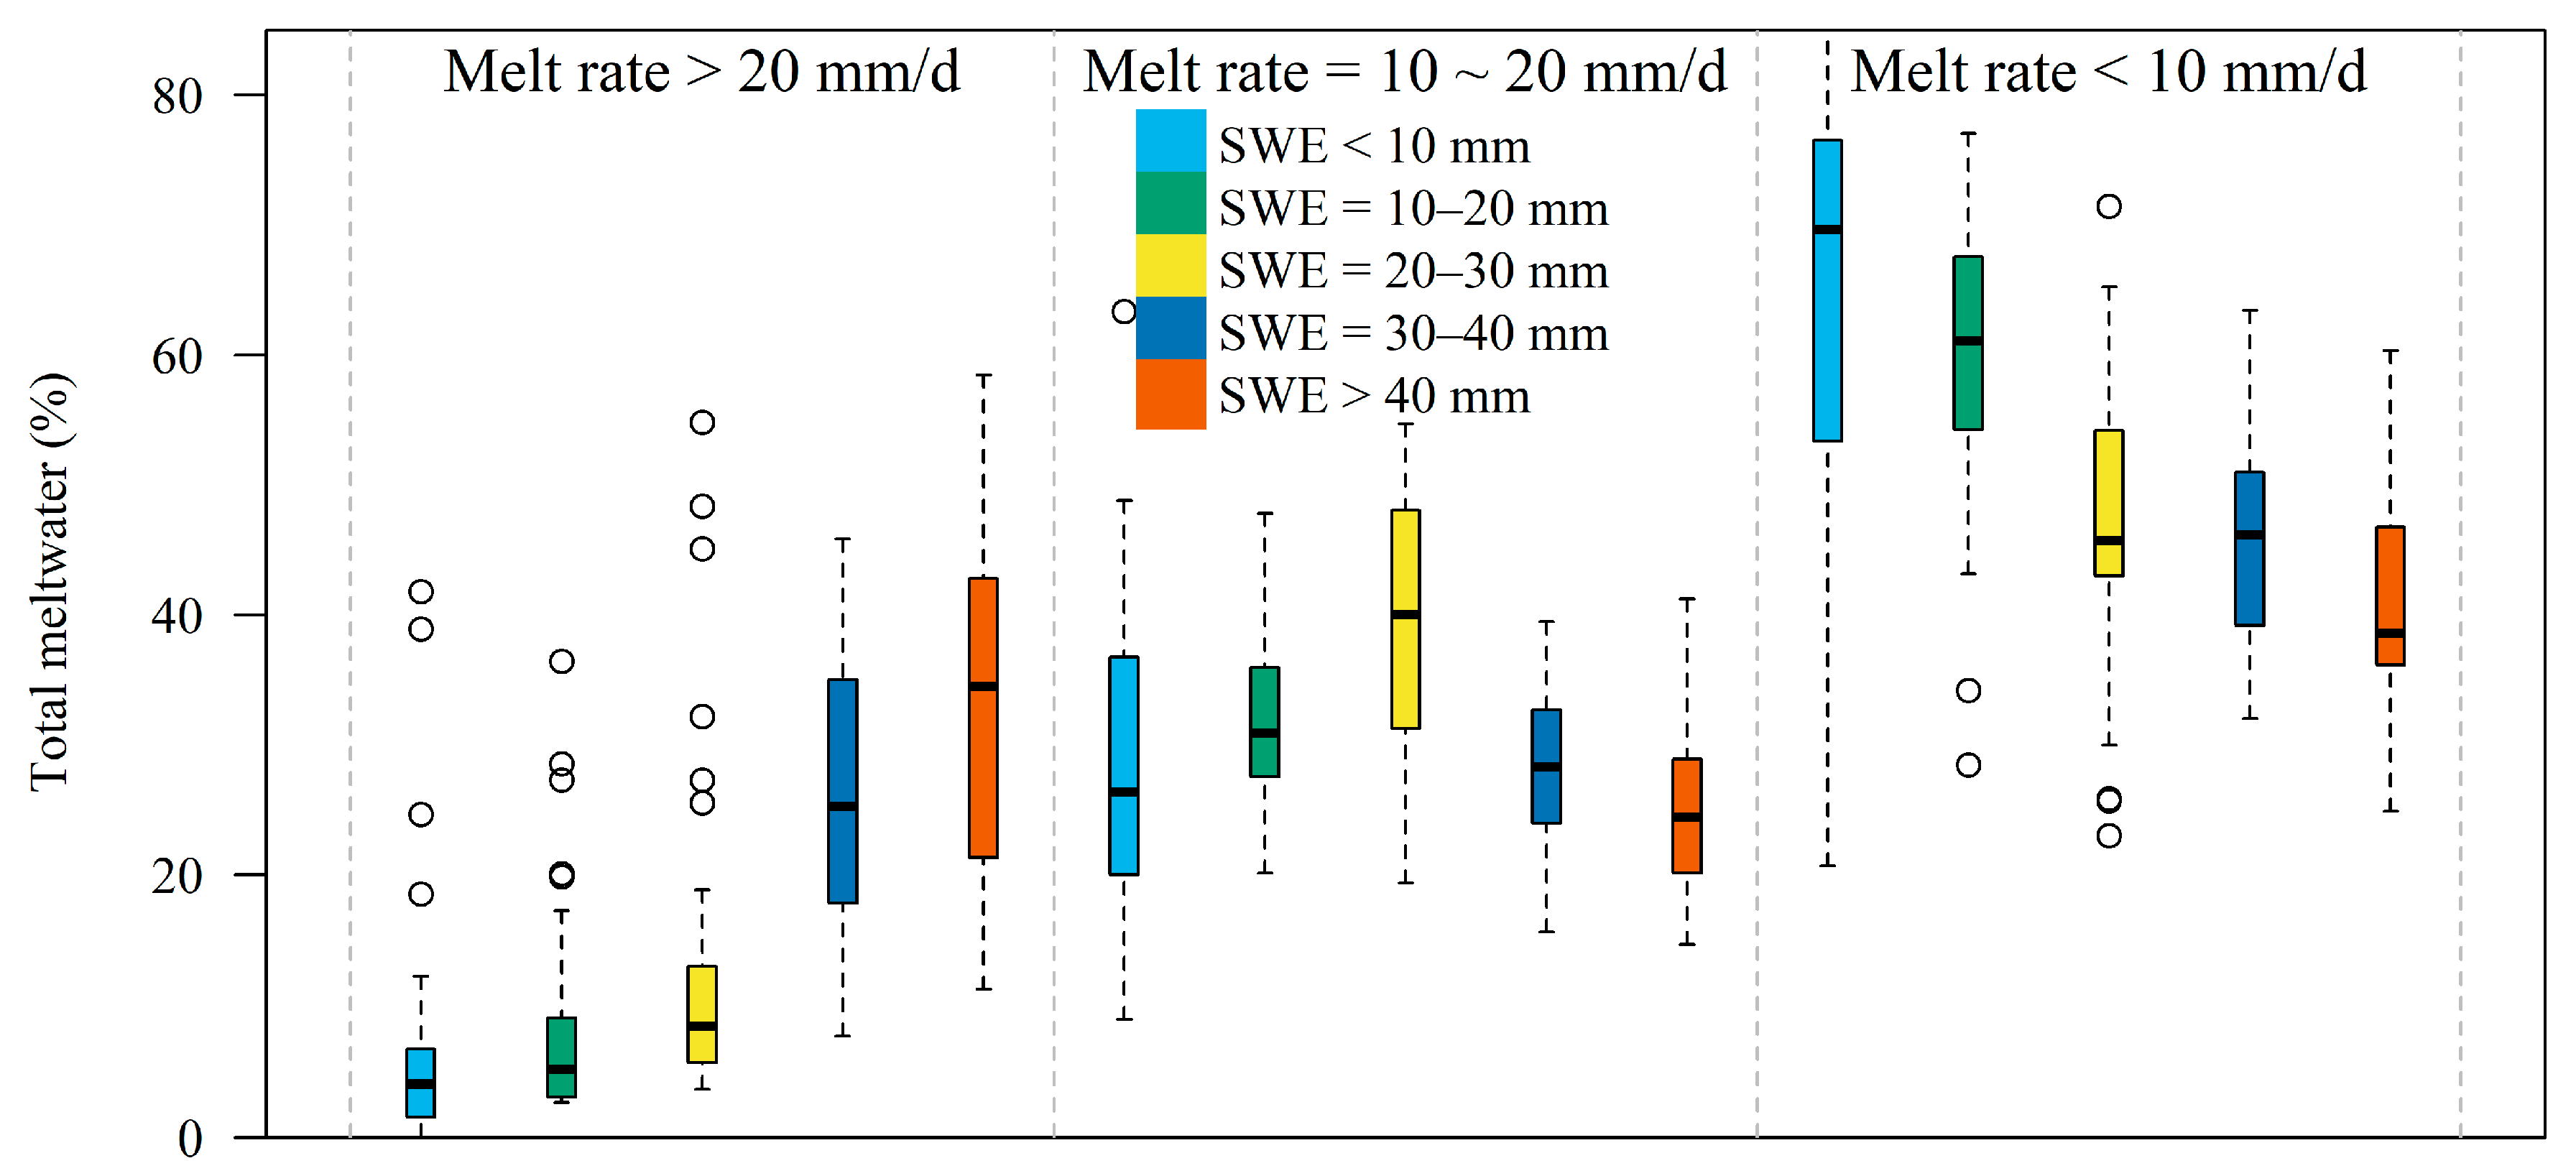
4.1. The Relationship between Snow Depth and Snowmelt Rate

Spatial correlation analysis between the snowmelt rate and snow depth showed that the ablation rates and snowpack magnitude were positively associated (Pearson’s correlation coefficient = 0.35, p < 0.05). This suggests that the declining snowmelt rate in spring over China’s three stable snow cover regions is related to the annual maximum SWE in these mountainous areas; that is, high snowmelt rates occurred in subregions with a greater SWE (i.e., depth > 40 mm). Accordingly, because the annual maximum SWE has decreased over the past 40 years (1981–2020), especially in the mountainous areas, the reduced snowmelt rate in the three snow cover subregions also became significant. To further illustrate how the snowpack depth and snowmelt rate are linked, the frequency percentages of the meltwater volume produced by differing snowmelt rates (five categories) were derived from the datasets (Figure 7). Evidently, for high snowmelt rates (>20 mm/day), a greater proportion of snowmelt volume originated in areas with a higher SWE; conversely, for low snowmelt rates (<10 mm/day), more of the snowmelt volume came from areas with a lower SWE. For medium snowmelt rates (10~20 mm/day), however, the proportions were mostly similar across the five SWE categories, perhaps peaking at 20–30 mm. These results confirm, again, that the faster snowmelt rates in spring depends on having deeper snow present (i.e., higher SWE) while slower snowmelt rates arise where the snow cover is shallow (i.e., lower SWE). These empirical relationships between the snowmelt rates and snowpack depth, as inferred from remotely sensed datasets, are consistent with analyses reported for the western United States [43] and northern hemisphere [44]. To explain the involved mechanisms, it has been hypothesized that, given an equal energy input, a deeper snowpack may melt more slowly than a shallower snowpack due to the increased energy needed to overcome the cold content and initiate snowmelt runoff [42]. Still, a deeper snowpack is more likely to persist into late spring or early summer, during which time it can readily receive more energy that is then available for faster melting. However, we found that, alongside climate warming, the snowmelt onset advanced by 2~6 days per year over the important regions of the three stable snow cover regions, thus precluding more energy for their faster melt.
Therefore, we may reasonably conclude that the trends of declining moderate and high snowmelt rates in spring from 1981 to 2020 were, to some extent, influenced by SWE reductions in mountainous areas whose snow cover is usually deep. This finding runs counter to the previous intuitive notion that snowmelt rates would likely hasten in response to a warmer climate. Rather, our study suggests that, under a warmer climate, the snowmelt rate could actually be slower over those mountainous areas characterized by a reduced SWE, an earlier onset of snowmelt, and less spring snow cover extent across the three main snow cover regions of China.

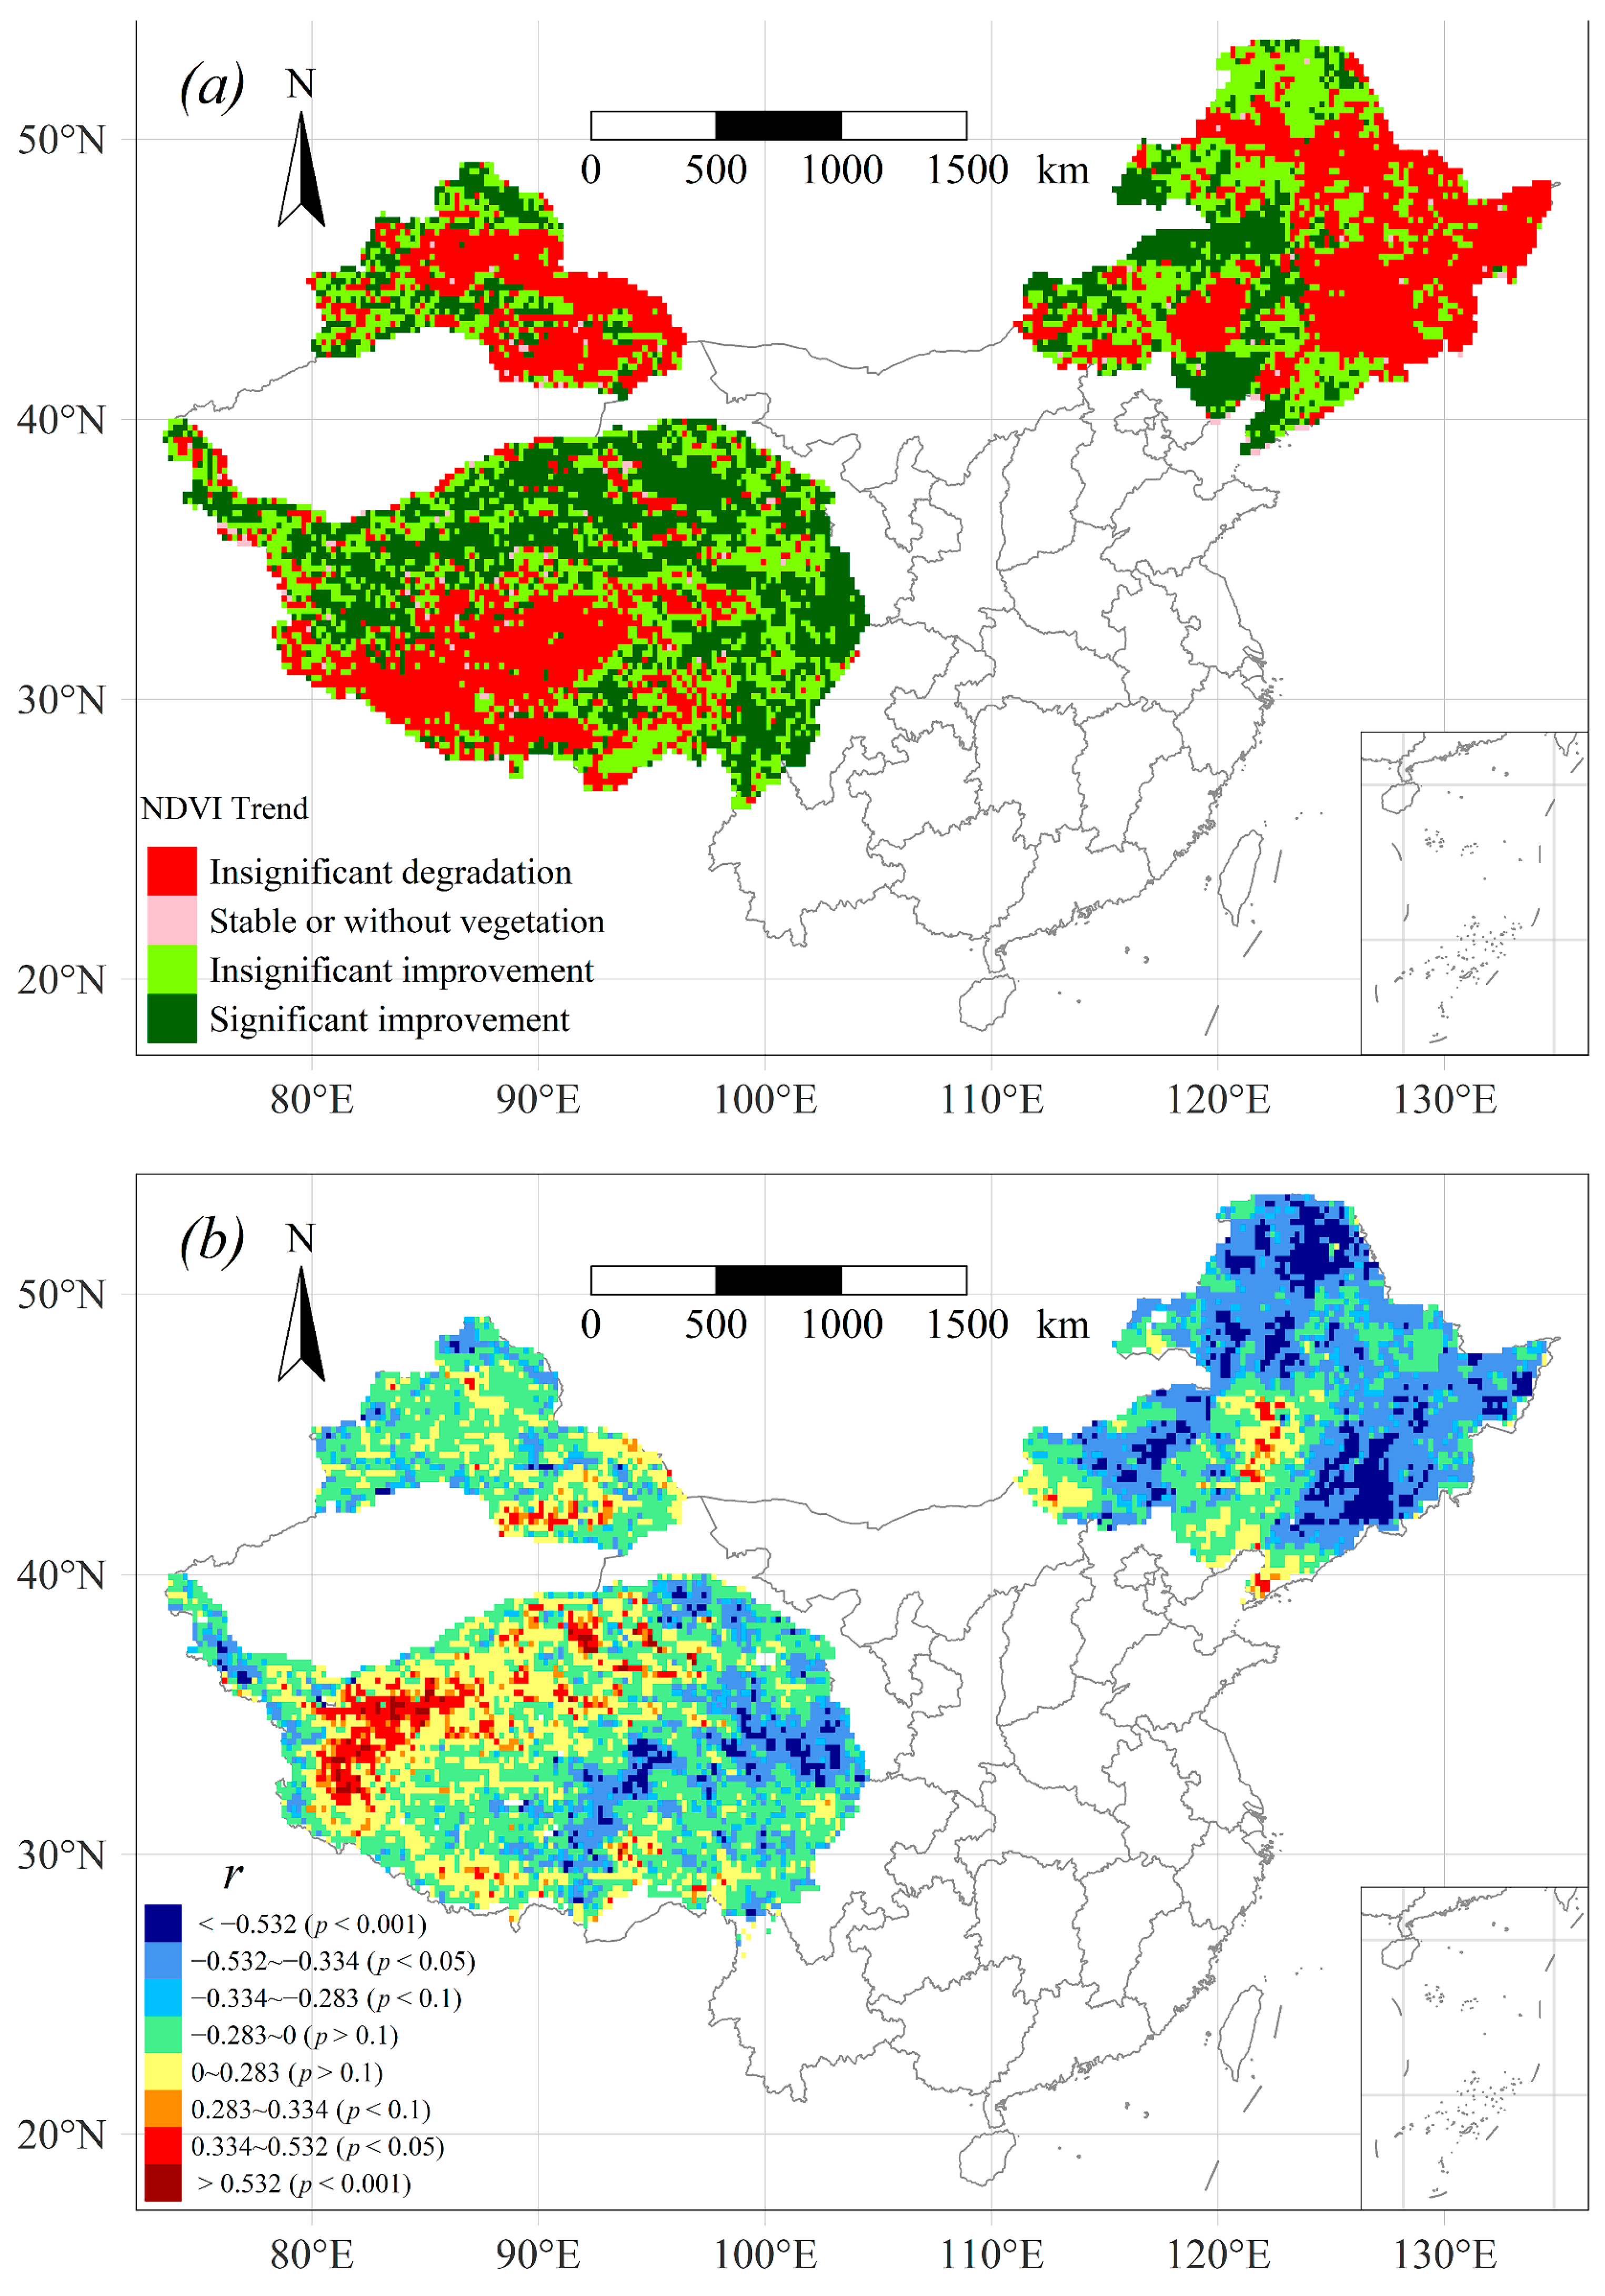
4.2. Possible Ecological and Other Environmental Impacts from a Changing SWE and Snowmelt Rate

An earlier and slower snowmelt process coupled with a reduction of SWE may influence ecological processes by altering soil moisture and evapotranspiration regimes [30,31]. However, such ecological implications under climate warming are apt to vary in tandem with the spatial heterogeneity in terms of the soil properties, vegetation types, and evapotranspiration. Figure 8a depicts the changes in the interannual NDVI in the spring season between 1982 and 2015. We detected an improvement in the vegetation in the Da and Xiao Xing’an Mountains, eastern Changbai Mountains, and southern Tibet, and these subregions correspond well to those where the snowmelt rate has decreased in China. These mountainous areas are little or negligibly disturbed by human activity due to their locations and inaccessibility. Our finding demonstrates how snowmelt can prominently drive vegetation improvement in those mountainous areas, whereas elsewhere, in most of China, rising temperatures and increased radiation are the main drivers of vegetation improvement. Meanwhile, the spatial correlation between the NDVI and snowmelt rate in spring in the three stable snow cover regions of China shows that there is a significant negative relationship between them (Figure 8b). A major consequence of slower snowmelt in spring over such mountains may be beneficial to vegetation for available water to be stored in the soil and used by vegetation in spring.
According to a previous study [29], changes in snowmelt’s timing (onset) are capable of altering streamflow production via two opposing mechanisms. (i) A greater proportion of the melting snow is partitioned to evapotranspiration (ET) than streamflow because of atmospheric warming-induced increases in the vapor pressure deficit [45]. Alternatively, (ii) an earlier occurring snowmelt can also disrupt the synchrony between the availability of water and vegetation’s demand for it, generating greater streamflow because water is delivered when vegetation is still less active or dormant. Arguably, the winter snowpack provides an efficient storage of accumulated precipitation for spring, but a site’s hydrological status depends more on the one-dimensional flux of water in or out of its soil than upon precipitation per se [46]. So, the spring snowmelt (March–April) drives a peak in the bedrock flow, in which the rate of water input to soil increases substantially, initiating its switch to a ‘wet state’ featuring widespread, fully connected lateral hillslope flow. During the snowmelt period, the soil receives more water per day than it loses to evapotranspiration, enabling the deepest soil profiles to attain field capacity [46]. Once the snowmelt event ends, the soil’s moisture content undergoes a rapid decline as evapotranspiration greatly exceeds any water it receives in the late-spring drying period. It follows that a changed snowmelt rate would alter, accordingly, the timing and rate of water input to soil in the late-spring period [47], thereby diminishing the amount of storage water available for vegetation to use in both spring and summer. Considered further, an earlier and slower snowmelt rate could threaten both the timing and the amount of snowmelt able to infiltrate into aquifers beneath soil, especially where vegetation is sparse or where there is less run-off, consequently impacting regional groundwater storage levels and dynamics [48,49].

5. Conclusions

This study investigated changes in the snowmelt rates across China’s three main stable snow cover regions over the past 40 years (1981–2020) by examining SWE datasets obtained via passive remote sensing. Firstly, the annual maximum SWE has decreased in two out of the three stable snow cover regions. Secondly, in these mountainous areas, the snowmelt rate has declined, which is a pivotal finding as it disputes the commonly held hypothesis that snowmelt rates would instead accelerate in a warmer climate and increase. Thirdly, there is now an earlier onset of snowmelt in spring across key mountain chains in the three main regions. Snowmelt rates are associated with differing depths of SWE, and the latter’s reduction in areas with a deep snowpack (i.e., mountains) likely drove the trend of moderate and high snowmelt rates decreasing after 2000. This is because snow melt rates are high in late spring and early summer where the snowpack is deeper: once it starts thawing it is quickly diminished, leading to snowmelt rate decreasing (since little if any of it persists into summer). Earlier and slower snowmelt under climate warming may risk severely degrading local vegetation and disrupting when and how much meltwater arrives downstream in a snow basin for human use. This study provides new and timely insight into the changing dynamics of the snowmelt rate change across snow-rich China, augmenting our ability to predict meltwater availability in the face of climate change. Future efforts should focus on assessing further shifts in snowmelt rates and anticipating how they impact the hydrological cycle and ecological processes in spring and how to better manage threatened snow water resources in China.

Author Contributions

Conceptualization, X.W. and W.Z.; data analysis, X.W. and R.Z.; writing—original draft preparation, X.W.; writing—review and editing, W.Z. and Y.L. All authors have read and agreed to the published version of the manuscript.

Funding

This research was supported by the National Natural Science Foundation of China (grant numbers 42071091, 41971083), the Key Special Subject of the National Key Research and Development Program of China (grant number 2019YFC1510502); the Science & Technology Department of Sichuan Province, China (Grant No. 2020YFS0356); the Self-determination Project of the State Key Laboratory of Cryospheric Sciences (grant number SKLCS-ZZ-2022); the Natural Science Foundation of Gansu Province (grant number 20JR10RA029).

Data Availability Statement

The data supporting the findings of this study is available from the first author (X.W.).

Acknowledgments

We thank National Cryosphere Desert Data Center (http://www.ncdc.ac.cn; accessed on 3 August 2022) and the data author professor Lingmei Jiang at Beijing Normal University for kindly sharing the high temporal passive microwave dataset. We thank NASA (http://glcf.umd.edu; accessed on 3 August 2022) provided long time series NDVI3g dataset.

Conflicts of Interest

The authors declare no conflict of interest.

References

  1. Barnett, T.P.; Adam, J.C.; Lettenmaier, D.P. Potential impacts of a warming climate on water availability in snow-dominated regions. Nature 2005, 438, 303–306. [Google Scholar] [CrossRef] [PubMed]
  2. Ke, C.Q.; Li, X.C.; Xie, H.; Ma, D.H.; Liu, X.; Kou, C. Variability in snow cover phenology in China from 1952 to 2010. Hydrol. Earth Syst. Sci. 2016, 20, 755–770. [Google Scholar] [CrossRef]
  3. Wu, X.; Zhang, W.; Li, H.; Long, Y.; Pan, X.; Shen, Y. Analysis of seasonal snowmelt contribution using a distributed energy balance model for a river basin in the Altai Mountains of northwestern China. Hydrol. Process. 2021, 35, e14046. [Google Scholar] [CrossRef]
  4. Chen, R.; Shen, Y.; Mao, W.; Zhang, S.; Lu, H.; Liu, Y.; Liu, Z.; Fang, S.; Zhang, W.; Chen, C.; et al. Progress and issues on key technologies in forecasting of snowmelt flood disaster in arid areas, Northwest China. Adv. Earth Sci. 2021, 36, 233–244. [Google Scholar]
  5. Kraaijenbrink, P.D.A.; Stigter, E.E.; Yao, T.; Immerzeel, W.W. Climate change decisive for Asia’s snow meltwater supply. Nat. Clim. Chang. 2021, 11, 591–597. [Google Scholar] [CrossRef]
  6. Dozier, J.; Painter, T.H. Multispectral and hyperspectral remote sensing of alpine snow properties. Annu. Rev. Earth Planet. Sci. 2004, 32, 465–494. [Google Scholar] [CrossRef]
  7. Immerzeel, W.; Droogers, P.; De Jong, S.; Bierkens, M. Large-scale monitoring of snow cover and runoff simulation in Himalayan river basins using remote sensing. Remote Sens. Environ. 2009, 113, 40–49. [Google Scholar] [CrossRef]
  8. Dai, L.; Che, T.; Xie, H.; Wu, X. Estimation of Snow Depth over the Qinghai-Tibetan Plateau Based on AMSR-E and MODIS Data. Remote Sens. 2018, 10, 1989. [Google Scholar] [CrossRef]
  9. Dai, L.; Che, T.; Wang, J.; Zhang, P. Snow depth and snow water equivalent estimation from AMSR-E data based on a priori snow characteristics in Xinjiang, China. Remote Sens. Environ. 2012, 127, 14–29. [Google Scholar] [CrossRef]
  10. Yang, J.W.; Jiang, L.M.; Lemmetyinen, J.; Luojus, K.; Takala, M.; Wu, S.L.; Pan, J.M. Validation of remotely sensed estimates of snow water equivalent using multiple reference datasets from the middle and high latitudes of China. J. Hydrol. 2020, 590, 125499. [Google Scholar] [CrossRef]
  11. Huang, X.; Deng, J.; Ma, X.; Wang, Y.; Feng, Q.; Hao, X.; Liang, T. Spatiotemporal dynamics of snow cover based on multi-source remote sensing data in China. Cryosphere 2016, 10, 2453–2463. [Google Scholar] [CrossRef] [Green Version]
  12. Xu, G.; Liu, X.; Zhang, Q.; Zhang, Q.; Hudson, A.; Trouet, V. Century-scale temperature variability and onset of industrial-era warming in the Eastern Tibetan Plateau. Clim. Dyn. 2019, 53, 4569–4590. [Google Scholar] [CrossRef]
  13. Xu, G.; Chen, T.; Liu, X.; Jin, L.; An, W.; Wang, W. Summer temperature variations recorded in tree-ring delta C-13 values on the northeastern Tibetan Plateau. Theor. Appl. Climatol. 2011, 105, 51–63. [Google Scholar] [CrossRef]
  14. Zhou, G.H.; Wan, S.Q.; Feng, G.L.; He, W.P. Effects of regional warming on extreme monthly low temperatures distribution in China. Int. J. Climatol. 2012, 32, 387–391. [Google Scholar] [CrossRef]
  15. Zhang, M.; Yuan, X.; Otkin, J.A.; Ji, P. Climate warming outweighs vegetation greening in intensifying flash droughts over China. Environ. Res. Lett. 2022, 17, 54041. [Google Scholar] [CrossRef]
  16. Qin, S.; Xiao, P.; Zhang, X. How do snow cover fraction change and respond to climate in Altai Mountains of China? Int. J. Climatol. 2022, 4, 1–15. [Google Scholar] [CrossRef]
  17. Tan, X.; Wu, Z.; Mu, X.; Gao, P.; Zhao, G.; Sun, W.; Gu, C. Spatiotemporal changes in snow cover over China during 1960–2013. Atmos. Res. 2019, 218, 183–194. [Google Scholar] [CrossRef]
  18. Zhang, Y.; Ma, N. Spatiotemporal variability of snow cover and snow water equivalent in the last three decades over Eurasia. J. Hydrol. 2018, 559, 238–251. [Google Scholar] [CrossRef]
  19. Chen, X.; Long, D.; Liang, S.; He, L.; Zeng, C.; Hao, X.; Hong, Y. Developing a composite daily snow cover extent record over the Tibetan Plateau from 1981 to 2016 using multisource data. Remote Sens. Environ. 2018, 215, 284–299. [Google Scholar] [CrossRef]
  20. Hao, X.; Huang, G.; Che, T.; Ji, W.; Sun, X.; Zhao, Q.; Hongyu, Z.; Wang, J.; Li, H.; Yang, Q. The NIEER AVHRR snow cover extent product over China—A long-term daily snow record for regional climate research. Earth Syst. Sci. Data 2021, 13, 4711–4726. [Google Scholar] [CrossRef]
  21. Wang, X.; Wu, C.; Peng, D.; Gonsamo, A.; Liu, Z. Snow cover phenology affects alpine vegetation growth dynamics on the Tibetan Plateau: Satellite observed evidence, impacts of different biomes, and climate drivers. Agric. For. Meteorol. 2018, 256, 61–74. [Google Scholar] [CrossRef]
  22. Zeng, H.; Jia, G. Impacts of snow cover on vegetation phenology in the arctic from satellite data. Adv. Atmos. Sci. 2013, 30, 1421–1432. [Google Scholar] [CrossRef]
  23. Schlogl, S.; Lehning, M.; Mott, R. How are turbulent sensible heat fluxes and snow melt rates affected by a changing snow cover fraction? Front. Earth Sci. 2018, 6, 154. [Google Scholar] [CrossRef]
  24. Chen, H.; Chen, Y.; Li, W.; Li, Z. Quantifying the contributions of snow/glacier meltwater to river runoff in the Tianshan Mountains, Central Asia. Glob. Planet. Chang. 2019, 174, 47–57. [Google Scholar] [CrossRef]
  25. Yang, Y.; Chen, R.; Liu, G.; Liu, Z.; Wang, X. Trends and variability in snowmelt in China under climate change. Hydrol. Earth Syst. Sci. 2022, 26, 305–329. [Google Scholar] [CrossRef]
  26. Li, S.; Liu, M.; Adam, J.C.; Pi, H.; Su, F.; Li, D.; Liu, Z.; Yao, Z. Contribution of Snow-Melt Water to the Streamflow over the Three-River Headwater Region, China. Remote Sens. 2021, 13, 1585. [Google Scholar] [CrossRef]
  27. Zhang, R.; Zhang, R.; Zuo, Z. Impact of Eurasian Spring Snow Decrement on East Asian Summer Precipitation. J. Clim. 2017, 30, 3421–3437. [Google Scholar] [CrossRef]
  28. Liu, F.; Hunsaker, C.; Bales, R.C. Controls of streamflow generation in small catchments across the snow-rain transition in the Southern Sierra Nevada, California. Hydrol. Process. 2013, 27, 1959–1972. [Google Scholar] [CrossRef]
  29. Barnhart, T.B.; Molotch, N.P.; Livneh, B.; Harpold, A.A.; Knowles, J.F.; Schneider, D. Snowmelt rate dictates streamflow. Geophys. Res. Lett. 2016, 43, 8006–8016. [Google Scholar] [CrossRef]
  30. Bokhorst, S.; Bjerke, J.W.; Tommervik, H.; Preece, C.; Phoenix, G.K. Ecosystem Response to Climatic Change: The Importance of the Cold Season. Ambio 2012, 41, 246–255. [Google Scholar] [CrossRef]
  31. Dunne, J.A.; Harte, J.; Taylor, K.J. Subalpine meadow flowering phenology responses to climate change: Integrating experimental and gradient methods. Ecol. Monogr. 2003, 73, 69–86. [Google Scholar] [CrossRef]
  32. Wipf, S.; Stoeckli, V.; Bebi, P. Winter climate change in alpine tundra: Plant responses to changes in snow depth and snowmelt timing. Clim. Chang. 2009, 94, 105–121. [Google Scholar] [CrossRef]
  33. Pulliainen, J.; Aurela, M.; Laurila, T.; Aalto, T.; Takala, M.; Salminen, M.; Kulmala, M.; Barr, A.; Heimann, M.; Lindroth, A.; et al. Early snowmelt significantly enhances boreal springtime carbon uptake. Proc. Natl. Acad. Sci. USA 2017, 114, 11081–11086. [Google Scholar] [CrossRef] [PubMed]
  34. Jiang, L.; Yang, J.; Cheng, Z.; Wu, S.; Li, Z.; Dai, L.; Li, X.; Qiu, Y. Daily snow water equivalent product with SMMR, SSM/I and SSMIS from 1980 to 2020 over China. Big Earth Data 2022, 2032998, 1–15. [Google Scholar] [CrossRef]
  35. Gloersen, P.; Barath, F.T. A Scanning Multichannel Microwave Radiometer for Nimbus-G and SeaSat-A. IEEE J. Ocean. Eng. 1977, 1355, 271–278. [Google Scholar]
  36. Madrid, C.R. The Nimbus 7 Users’ Guide, NASA Technical Memorandum 79969; Goddard Space Flight Center: Greenbelt, MD, USA, 1978. [Google Scholar]
  37. Hollinger, J.P.; Lo, R.; Poe, G.; Savage, R.; Peirce, J. Special Sensor Microwave/Imager User’s Guide; NRL Technical Report; Naval Research Laboratory: Washington, DC, USA, 1987. [Google Scholar]
  38. Wentz, F.J. User’s Manual for SSM/I Antenna Temperature Tapes Revision 1; Technical Report 120191; Remote Sensing Systems: Santa Rosa, CA, USA, 1991. [Google Scholar]
  39. Kunkee, D.B.; Poe, G.A.; Swadley, S.D.; Hong, Y.; Wessel, J.E.; Uliana, E.A. Design and Evaluation of the First Special Sensor Microwave Imager/Sounder. IEEE Trans. Geosci. Remote Sens. 2008, 46, 863–883. [Google Scholar] [CrossRef]
  40. Yang, J.; Jiang, L.; Wu, S.; Wang, G.; Wang, J.; Liu, X. Development of a Snow Depth Estimation Algorithm over China for the FY-3D/MWRI. Remote Sens. 2019, 11, 977. [Google Scholar] [CrossRef]
  41. Yang, J.; Jiang, L.; Wu, S.; Liu, X.; Jian, W. Improvement of snow depth estimation using SSM/I brightness temperature in China. In Proceedings of the IGARSS 2018—2018 IEEE International Geoscience and Remote Sensing Symposium, Valencia, Spain, 23–27 July 2018; pp. 5089–5092. [Google Scholar]
  42. Musselman, K.N.; Clark, M.P.; Liu, C.; Ikeda, K.; Rasmussen, R. Slower snowmelt in a warmer world. Nat. Clim. Chang. 2017, 7, 214–219. [Google Scholar] [CrossRef]
  43. Trujillo, E.; Molotch, N.P. Snowpack regimes of the Western United States. Water Resour. Res. 2014, 50, 5611–5623. [Google Scholar] [CrossRef]
  44. Wu, X.; Che, T.; Li, X.; Wang, N.; Yang, X. Slower snowmelt in spring along with climate warming across the Northern Hemisphere. Geophys. Res. Lett. 2018, 45, 12331–12339. [Google Scholar] [CrossRef]
  45. Bosson, E.; Sabel, U.; Gustafsson, L.-G.; Sassner, M.; Destouni, G. Influences of shifts in climate, landscape, and permafrost on terrestrial hydrology. J. Geophys. Res. Atmos. 2012, 117, D05120. [Google Scholar] [CrossRef]
  46. Mcnamara, J.P.; Chandler, D.; Seyfried, M.; Achet, S. Soil moisture states, lateral flow, and streamflow generation in a semi-arid, snowmelt-driven catchment. Hydrol. Process. 2005, 19, 4023–4038. [Google Scholar] [CrossRef]
  47. Miller, M.P.; Buto, S.G.; Susong, D.D.; Rumsey, C.A. The importance of base flow in sustaining surface water flow in the Upper Colorado River Basin. Water Resour. Res. 2016, 52, 3547–3562. [Google Scholar] [CrossRef]
  48. Stewart, I.T.; Cayan, D.R.; Dettinger, M.D. Changes Toward Earlier Streamflow Timing Across Western North America. J. Clim. 2010, 18, 1136–1155. [Google Scholar] [CrossRef]
  49. Jasechko, S.; Birks, S.J.; Gleeson, T.; Wada, Y.; Fawcett, P.J.; Sharp, Z.D.; Mcdonnell, J.J.; Welker, J.M. The pronounced seasonality of global groundwater recharge. Water Resour. Res. 2015, 50, 8845–8867. [Google Scholar] [CrossRef] [Green Version]
Figure 1. Study regions and their snow distributions. (a) Topographic map and main mountain chains in China’s three main stable snow cover regions. (b) Mean value of the annual maximum SWE (snow water equivalent) from 1981 to 2020.
Remotesensing 14 04176 g001
Figure 2. Spatial variation in the (a) annual maximum SWE (snow water equivalent) and (b) corresponding significance levels (t-test) for the trends over the past 40 years (1981–2020) across the three main stable snow cover regions of China. The unit mm/a refers to mm per year.
Remotesensing 14 04176 g002
Figure 3. Snowmelt rate in spring across the three main stable snow cover regions of China for the period of 1981–2020. Shown are the distributions of (a) maximum and (b) mean values. The unit mm/d refers to mm per day.
Remotesensing 14 04176 g003
Figure 4. Spatial variation in the changed snowmelt rate in spring across the three main stable snow cover regions of China between 1981 and 2020. Distributions of the trends for the (a) maximum snowmelt rate and (b) its corresponding significance levels (t-test), and for the (c) mean snowmelt rate and (d) its corresponding significance levels (t-test).
Remotesensing 14 04176 g004
Figure 5. Time-series analysis of changes in the snowmelt rates in spring over the past 40 years across China’s three stable snow cover regions, obtained from passive microwave remotely sensing datasets. Top row: northern Xinjiang. Middle row: northeast China. Bottom row: Tibetan Plateau. The gray shading is the 90% confidence interval for the fitted nonlinear regression (dotted blue line).
Remotesensing 14 04176 g005
Figure 6. Trends of the snowmelt onset day over the past 40 years (1981–2020) across China’s three stable snow cover regions. (a) Spatial distributions of the decadal trends and (b) their corresponding significance levels (deep purple and deep blue (p < 0.001), purple and blue (p < 0.05), light purple and light blue (p < 0.01)). The unit days/a refers to days per year.
Remotesensing 14 04176 g006
Figure 7. Proportions of meltwater volume produced at different snowmelt rates derived from the passive microwave remote sensing datasets. The percentage contribution to total snowmelt arising from low (<10 mm/day), moderate (10–20 mm/day), and high (>20 mm/day) melting rates was classified according to the historical snowpack depth (color coded; see legend inset). Boxplots show the minimum (lower whisker), quarter (bottom of the box), median (line), three-quarter (top of the box), and maximum (upper whisker) values for each SWE group. Circles are outliers.
Remotesensing 14 04176 g007
Figure 8. Spatial trends of the (a) NDVI in spring (significant level is p < 0.05) and (b) correlation coefficient between the interannual NDVI in spring and the snowmelt rate in spring from 1982 to 2015, across stable snow cover regions of China.
Remotesensing 14 04176 g008
Publisher’s Note: MDPI stays neutral with regard to jurisdictional claims in published maps and institutional affiliations.

