Abstract
Wind wave-induced artifact surface velocity (WASV) is an important component of the sea surface motions detected by synthetic aperture radar (SAR) systems. Understanding the characteristics of the interference of WASV on SAR current velocity estimates is necessary to improve the accuracy of retrievals. In this study, we assessed and analyzed the sensitivity of WASV in C-band along-track interferometric (ATI) SAR to radar configuration, wind field, swell field, and a wave spectrum model. Results showed that the influence of wind speed on WASV increased with the current velocity. The swell also affected WASV, especially at higher wind speeds; WASV was more strongly influenced by swell amplitude than by swell wavelength. In terms of radar configurations, results showed that VV polarization was more suitable than HH polarization in the estimation of WASV. The interference of WASV was minimal at moderate incidence angles (around 40°), and an appropriate ATI baseline selection was also given. The WASV was more strongly influenced by sea states than by the wave spectrum model or by a spreading function. The findings of this study improve our understanding of WASV and provide a reference for the design of future ATI SAR current measurement instruments and projects.
1. Introduction
Ocean currents are major seawater movements and an important focus for scientific research. Ocean currents impact weather, climate, and a variety of chemical, physical, biological, and geological processes in and over the ocean. These include the diffusion of oil spills and other pollutants, transportation and deposition of coastal sediments, and convergence of cold and warm currents and subsequent effects on fish reproductive rates [1].
Ocean currents can be measured in the field by some instruments, such as current meters and acoustic Doppler current profilers (ADCP). In situ measurements have high accuracy but are limited in spatial distribution and are often unable to meet practical and operational needs [2,3,4]. Shore-based high-frequency radars can detect total surface velocity with high accuracy, but they are sparse and limited to a few coastal areas [5].
In contrast, satellite remote sensing data have high spatial resolution and wide coverage, are relatively low in cost, and can be acquired simultaneously and rapidly. Current measurements have increasingly been acquired by satellite altimeters, Doppler scatterometers, thermal infrared sensors, and synthetic aperture radar (SAR). In satellite altimetry, the distance between the satellite and the sea surface is derived from the time between the transmission and reception of radar pulses; current velocities with low spatial resolution can be obtained by using the relationship between sea surface height and tidal or geostrophic flow. Therefore, altimetry is more suitable for the measurement of internal tides or sub-mesoscale geostrophic flows [6]. The Doppler scatterometer combines scatterometer and Doppler technologies. Current velocities can be obtained by combining the central Doppler frequency with backscattering; this method is still in development [7,8]. Thermal infrared imagery is used to trace ocean current boundaries; high-resolution sea surface temperature (SST) derived from satellite infrared imagery can also be used to estimate surface velocity, but data in cloud-covered areas are limited [9,10].
In comparison, SAR data have the advantage of being available regardless of weather and can be used to monitor sea surface movement day and night. Currently, sea surface currents are retrieved from SAR data using the Doppler centroid anomaly (DCA) method and the along-track interferometric synthetic aperture radar (ATI) technique [11].
In the DCA method, the radial current velocity is derived from the difference between the Doppler center of mass estimated from SAR data and the Doppler frequency predicted by the relative motion between the satellite and the rotating Earth [12]. The ATI technique relies on the availability of two complex SAR images of the same scene acquired separately by two antennas placed along the track and permits estimations of the radial velocity with fine, high spatial resolution to be obtained [13].
However, ATI and DCA measurements are sensitive to all surface motions, including ocean surface currents, the orbital velocity of surface gravity waves, and the phase velocity of the scatterers responsible for the backscatters. Results from numerical modeling studies show that the contribution of wind wave-induced motion to the retrieved sea surface currents is non-negligible [14]. The C-DOP model developed by Mouche et al. [15] was the first empirical model of wind wave-induced artifact surface velocity (WASV); it was derived from the Doppler shift anomaly in Envisat ASAR data and evaluated using ECMWF model winds.
Wind wave-induced artifact surface velocity was first described by Martin et al. [16]. It originates from the long-wave orbital velocity weighted by the variation of SAR backscatter amplitude and the phase velocity of the scatterers responsible for the backscatter and has been recognized as the main source of uncertainty in SAR retrievals of sea surface velocity.
Field measurements have been used to quantify WASV. In the airborne campaign Wavemill, WASV was calculated as the difference between the surface velocity measured by the airborne ATI SAR and the current velocity measured by an ADCP. There was close agreement between WASV derived from Wavemill and the empirical WASV estimated from Envisat ASAR; this represents an independent validation of the results of Mouche et al. In the same study, the dependence of azimuth and incident angle on WASV was also analyzed [16].
Recent studies have evaluated the sensitivity and influence of WASV on current retrievals using the DCA method. The DopRIM model has been used to analyze the influence of wind waves and background swells on SAR-detected surface motion under different radar configurations. Results showed that swells affected WASV by changing wind and wave characteristics. The WASV varied with wind speed and wave age and increased considerably with wind and wave development; WASV in a fully developed sea may be two to three times that of young waves [17]. Studies have shown that the variation of WASV with sea state accounts for about 10% of the wind vector [18].
The sensitivity of ATI current measurements to estimated radial velocity and WASV was also analyzed but only for a limited number of parameters [19,20,21]. For example, Romeiser et al. [21] evaluated the theoretical possibilities and limitations of ATI current measurements. They calculated the Doppler spectra for the frequencies of 1.0 GHz (L-band) and 10.0 GHz (X-band) and found that the incidence angle and the distance-to-velocity ratio are the most important parameters that determine the linearity of the imaging mechanism. The best current measurements can be expected from ATI systems operating at high frequencies and VV polarization, and the ideal wind speed for ATI current measurements should be between 5 and 10 m/s [21]. Martin et al. presented the first estimates of WASV derived from airborne SAR interferometer data. The WASV was calculated as the difference between the surface velocity measured by the ATI SAR and the current velocity measured by an ADCP. In terms of the contribution of WASV to retrieved current velocity and the dependence of WASV on azimuth and incidence angle, there was close agreement between WASV from C-DOP and Wavemill X-band data [16]. Martin et al. proposed a method to simultaneously retrieve surface currents and wind vectors from SEASTAR, which is a new Ku-band dual-beam ATI SAR system. They conducted numerical simulations to quantify the influence of various factors on WASV and analyzed the performance of the retrieved currents and wind vectors under different wind and current conditions and instrument configurations, including oblique viewing angle, incidence angle, polarization, and noise value [22].
The ATI experimental mode of China’s Gaofen-3 (GF3) C-band satellite is under development and has been used to conduct experimental observations of sea surface currents [23]. In addition, the scientific assessment of total surface current velocities’ (TSCV) retrievals from a stereo-SAR (SATRoSS) project supported by the European Space Agency aims to retrieve total surface current vectors from stereo-SAR operating in ATI mode. The S1+CS (Sentinel 1 and Companion Satellite) observation system is in C-band and its performance is still under evaluation [24].
Therefore, the study of WASV characteristics in C-band ATI SAR measurements has valuable future applications. In this study, we conducted numerical simulations to examine the relationships between WASV and different parameters of C-band satellite-based ATI SAR systems, including radar configurations, ocean conditions, wave spectrum models, and spreading functions.
Section 1 introduces the study and its background. The methods and principles supporting this study are in Section 2. Section 3 is the results, presenting the influence of radar configurations and sea states on WASV. Discussions are presented in Section 4, where the effects of different wave spectrum models and spread functions on WASV are quantified. Conclusions are in Section 5.
2. Materials and Methods
The different phases of the study are shown in Figure 1. We simulated the ocean surface using a wave spectrum model and a Gaussian swell spectrum model. The Kirchhoff approximation (KA) and a composite model proposed by Romeiser were used to simulate the specular reflection and Bragg scattering of microwave backscattering from the sea surface, respectively [25,26,27,28]. We altered the locations of the calculation areas at each sampling time along the range and azimuth directions, and the raw ATI SAR signals were used as the microwave backscattering time series. Finally, we used fast Fourier transforms to apply range and azimuth compression and obtain high-resolution SAR images [29]. The phase differences were calculated from the signals received by the antennas, which contained information on the radial velocity of the sea surface motion. The sea surface velocity was calculated using the relationship between phase difference, radial velocity, and incident angle [30].
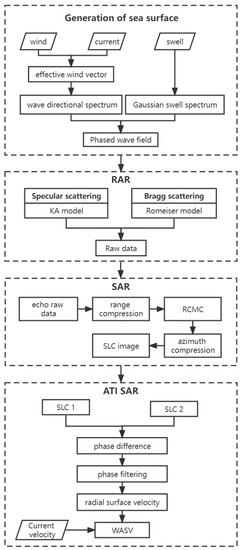
Figure 1.
The different phases of the study.
2.1. Ocean Surface Modeling
Gerstner waves were used to simulate the sea surface, which is described in terms of the motion of the individual points that are on it [31]. These points experience circular motion when they encounter waves. Assuming that a surface has a finite number (N) of plane waves, then the ith wave has an arbitrary amplitude of , wave number vector of , and random phase of ; is the independent stochastic variable and is uniformly distributed on [0, 2π). The sea surface profile at time t is described by:
where is the vertical displacement, is the horizontal displacement, and ωi is the frequency, which is related to according to the dispersion relation. The dispersion relation describes the effect of dispersion of a medium on the properties of the wave travelling through that medium; for the common case of wind-generated gravity waves [32], it is given by:
where g is gravitational acceleration and is the wave number, which is the magnitude of the wave number vector and is related to the wavelength λ. In the case of gravity–capillary waves, surface tension affects the waves and the relation is given by:
where σ is the surface tension, ρ is the water density, and h is the water depth.
The wave height field can be expressed in terms of an inverse fast Fourier transform (IFFT):
where is the wave coefficient:
Results from empirical statistical analyses of ocean waves indicated that wave height amplitudes are fluctuations that are nearly statistically stationary, independent, and Gaussian; the spatial spectrum can be represented by [26]:
where ⟨ ⟩ represents an ensemble average and is the wave directional spectrum.
The wave directional spectrum is often split into the omnidirectional spectrum, S(||k||), and the spreading function, :
Wind wave spectrum models have been the subject of many theoretical and empirical studies, which have considered the associated properties of wind as key parameters [33,34,35,36]. To take into account the influence of current speed and direction, we calculated the effective wind vector from current fields and wind fields. We multiplied the omnidirectional wave number spectrum by an angular spreading function to obtain the directional wave number spectrum. We used the unified angular spreading function developed by Elfouhaily et al. (referred to as the E spreading function) in our simulations of radar parameters and sea states [37]. The performance of other wave spectra is reported in Section 4.
The wave coefficient can be obtained by filtering normalized Gaussian white noise with the wave directional spectrum [38]:
where ξr and ξi are independent Gaussian random variables. Adding the propagation term, the surface at time t can be expressed as:
The swell was modeled as a single Gerstner wave in the space domain. Spectra of random swells were generated using complex Gaussian random variables. Each component had an amplitude and an initial phase that were drawn from a circular complex Gaussian distribution with a zero mean. The wave coefficient of the swell is:
where denotes the phased swell wave field, ωs denotes the wave frequency of the swell, and represents the wave coefficient of the swell.
Figure 2 shows an example of the results of the ocean surface scattering simulations.
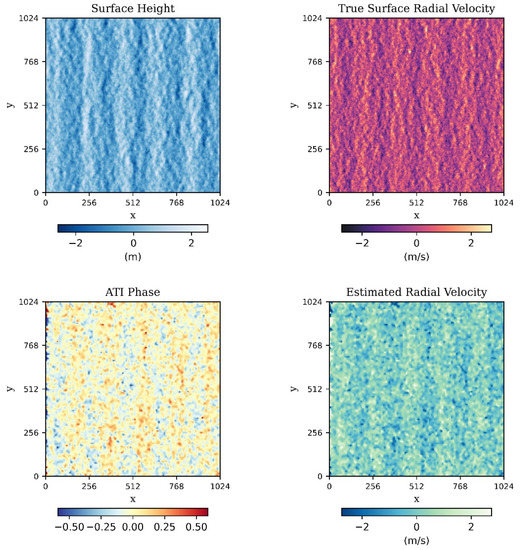
Figure 2.
An example of the results of the ocean surface scattering simulations. It includes surface height, true surface radial velocity, the ATI phase for VV polarization, and the estimated radial velocity for VV polarization. In this case, current speed was set to 0.5 m/s, wind speed was 10 m/s, wind direction was 0°, and swell amplitude was 0.5 m.
2.2. Scattering Model
Ocean surface scattering was assumed to be composed independently of specular and Bragg scattering. The normalized radar scattering cross-sectional area (NRCS; σ0) can be expressed as:
where σbr represents the Bragg scattering component and σsp represents the specular scattering component.
For specular backscattering, the KA is used for the scattered electric (Es) and magnetic (Hs) fields on the surface S. The KA assumes that the total field at a point on the surface is the sum of the incident field and the scattered field of an infinite tangent plane at that point [25,26]. The NRCS can be derived from:
where AS is the surface area, p and q refer to the polarization of the incident and scattered fields, respectively, Ei is the incident wave on the surface, Es represents the scattered electric field, and Rs is the range from the center of the illuminated area to the point of observation. Calculations for large surfaces and high resolutions are computationally intensive, and the facet approach and the stationary-phase approximation are two methods of approximation that can be implemented [39,40].
For Bragg scattering, we used a composite model proposed by Romeiser [27,28]. The wave spectrum is divided into two parts; the part that corresponds to small-scale waves is responsible for resonant scattering, and the part that corresponds to large-scale waves affects the scattering through random changes in the local incidence angle and rotation of the incidence plane. For a sufficiently large facet, which is slightly tilted with slopes sp parallel and sn normal to the radar look direction, the NRCS can be derived as follows:
where is the nominal radar wavenumber, is the Bragg wavenumber vector, is the nominal incidence angle, is the effective local incidence angle, and and are the complex scattering coefficients with pp and qq denoting HH and VV polarizations, respectively. More details can be found in [28]. Furthermore, because of the tilting of the facet, σ0 needs to be replaced by the corrected σ:
where is the nominal radar height above mean sea level and is the surface height.
The composite model is based on the Bragg scattering theory, and a Taylor expansion of the NRCS in the two-dimensional surface slope yields nonzero second-order terms, which represent a first approximation for the effect of the geometric and hydrodynamic modulation of the Bragg scattering facets by long waves. More details can be found in [27].
2.3. Retrieval of WASV from ATI SAR
In our ocean surface scattering simulations, the microwave backscattering time series consisted of raw signals of ocean surface movement. To use the simulations for ATI SAR, we expressed the scattering electric field in terms of the functions rn, tr, and ta, where rn is the position of the nth grid element and tr and ta are the sampling times corresponding to the range and azimuth directions, respectively. Assuming that Rt is the distance between the transmit antenna and a grid element and Rs is the distance between the receive antenna and a grid element, the scattering electric field of ATI SAR can be expressed as:
where , ε is the permittivity, fc is the center frequency of the transmitted chirp pulse, α is the linear chirp rate, and Rc is the distance between the antenna and the center of the transmitted pulse on the ground. For the signals of the master antenna, Rs is equal to Rt. Power density P includes the antenna beam pattern and the spreading loss of the transmitted antenna; it is defined as a function of βH and βV, which are the angles between the incident angle and a grid element:
where P0 is the magnitude of the power density, D is the length of the antenna, subscripts H and V indicate the horizontal and vertical planes, respectively, and λe is the microwave wavelength. Following Equation (16), the time series of the received signals is the sum of the scattering electric fields of all grid elements. The calculation area moves with the sampling time in the range and azimuth directions [41].
Combined with the ocean wave modulation theory and Bragg scattering theory, the backscattering coefficient of a two-dimensional rough sea surface is obtained and the complex scattering field is generated, which reflects the effect of tilt modulation and hydrodynamic modulation. High-resolution SAR images of the simulated ocean scene were obtained using the range Doppler (RD) algorithm, which consists of three main steps: range compression, residual range cell migration correction, and azimuth compression. It decomposes the radar imaging process into matched filtering processes in the range and azimuth directions. High resolutions in the range and in the azimuth were obtained by using pulse compression and the Doppler centroid frequency, respectively [29]. The velocity bunching modulation due to orbital motions of ocean waves is shown in the simulated signal. Based on the simulated complex scattering field and linear frequency modulation signal, the two-dimensional time-domain original echo signal contained the variation of oblique range caused by radial velocity, which can reflect the velocity bunching modulation. Therefore, the velocity bunching modulation effects are realized by the method of synthetic aperture.
Figure 3 is a schematic of ATI SAR geometry. Two pairs of antennas (antenna 1 and antenna 2) are spaced at a certain distance apart in the flight direction of the platform. When the two antennas image the same scene, there is a time lag between the two images, and the phase of the backscattered signal of the observed point changes as a result of the time lag.
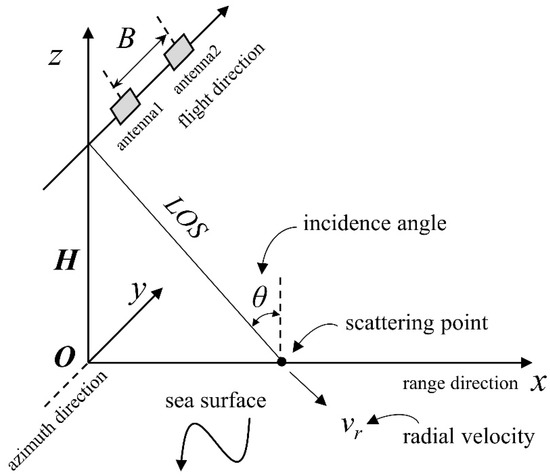
Figure 3.
The ATI SAR system. Point O is the sub-satellite point and is taken as the origin of the system. The radar flight direction is taken as the positive x axis (range direction). The y axis is perpendicular to the radar flight direction on the horizontal plane (azimuth direction), and the trajectory from O to the measured point indicates the direction of the positive y axis. The z axis is perpendicular to sea level, and the trajectory from O to the satellite indicates the direction of the positive z axis. The platform height is H. The angle of incidence is θ.
The phase difference, Δϕ, can be derived as follows:
where and represent the complex values of the ith pixel in azimuth and the jth pixel in range of the two SAR images, * represents the complex conjugate, and L and M represent the total number of pixels in the azimuth and range of the image, respectively. Because current velocity is low, the corresponding interferometric phase is also small. Phase sensitivities and signal-to-noise ratios were improved by neighborhood averaging [42,43,44].
The estimated line-of-sight (LOS) velocity, vr, of the scattering point is given by:
where is the phase difference between the transmit and receive antennas, λ is the microwave wavelength, B is the radar baseline, and V is the platform velocity.
The radial surface velocity, vrsv, is the projection of the radial LOS velocity, vr, onto the sea surface:
For water movement on the sea surface, the radial surface velocity, vrsv, is composed of the radial surface current velocity, vrsc, and WASV. Therefore, WASV can be obtained by subtracting the radial surface current velocity from the radial surface velocity:
2.4. Simulation Parameters
Figure 4 shows the flow chart for the simulation of WASV. The ocean surface was simulated using a wave directional spectrum that is a function of the current and wind fields and a swell directional spectrum that is a function of swell amplitude, direction, and wavelength. Bragg scattering and specular scattering are also affected by radar configuration parameters such as polarization, frequency, and incident angle. The microwave backscattering time series were obtained from raw ATI SAR signals. Phase differences were calculated from the signals received by the antennas and are proportional to the LOS velocity; WASV is the difference between radial surface velocity and current velocity.
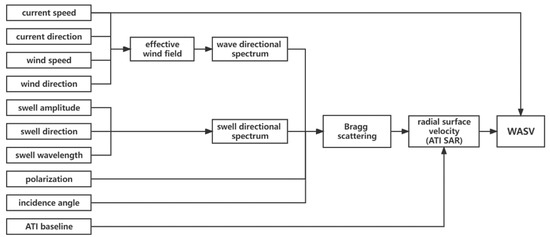
Figure 4.
Flow chart of numerical simulation of WASV.
The values of the input parameters that were used in our simulations are shown in Table 1. The current velocity was set to 0.0–1.0 m/s. The current direction was set to 0° along the range direction, which means that the current propagates towards the radar. Low to moderate wind speeds were used in the simulations; the wind speed was set to 5–15 m/s at intervals of 1 m/s. The wind direction was set to 0°–360° at intervals of 15°. The swell amplitude was set to 0.5, 1.0, or 1.5 m. A commonly used range of swell wavelength was used in the simulations; the swell wavelength was set to 150–250 m at intervals of 50 m [45,46]. The swell direction was set to 0°, except in the experiment that examined the effect of swells; in that experiment, that swell direction was set to 0°–360° at intervals of 15°. The VV and HH polarizations were considered separately. The incidence angle was set to 25°–55°. In this range, Bragg scattering is dominant and specular reflections can be assumed to be negligible; baseline was set to 10–25 m (see Section 3.1.1 and Section 3.1.2). The radar frequency was set to 5.4 GHz because we believed that C-band ATI SAR research has valuable future applications including analysis of data from the ATI experimental mode of China’s Gaofen-3 (GF3) C-band satellite and total surface current vector retrievals from stereo-SAR operating in ATI mode. We chose a platform height of 693 km, which is the altitude of Sentinel-1 and is commonly used by C-band satellite radars. The swath width of 1024 m × 1024 m and resolution of 1 m × 1 m were used.

Table 1.
Values of input parameters for the ATI SAR measurement of sea surface current velocity.
3. Results
3.1. Influence of ATI SAR Parameters on WASV
3.1.1. Incidence Angle
Because WASV interferes with SAR current velocity retrievals, the influence of current velocity on WASV should be minimized. Figure 5 shows the relationship between and incidence angle at a wind speed of 10 m/s for HH and VV polarizations; WASV was more stable at moderate than at low and high incidence angles. At moderate incidence angles of around 40°, the differences between WASV associated with different current velocities were the smallest and were below 1 m/s. However, the differences were large at low and high incidence angles; at 25°, WASV at high current velocity was about twice that at moderate velocity. At the low incidence angle of 25° and the high incidence angle of 55°, WASV was strongly influenced by wind direction, and the difference between downwind and upwind WASV was about 1.8 m/s under a current speed of 1.0 m/s. At the incidence angle of 40°, the WASV of different wind directions was almost the same. We concluded that the influence of wind direction on WASV was the smallest at moderate incidence angles and the interference of WASV on retrieved current velocity was minimal at the moderate incidence angle of 40°. Therefore, we set the incidence angle to 40° for our subsequent experimental evaluations on ocean conditions and Doppler models for WASV.

Figure 5.
The relationship between WASV and incidence angle at a wind speed of 10 m/s for HH and VV polarizations. The swell direction was 0°, amplitude was 0.5 m, and wavelength was 200 m. Other input parameters were set to the values indicated in Table 1. The magnitude of the current velocity is indicated by color: blue indicates the absence of current (0 m/s), yellow indicates moderate current velocity (0.5 m/s), and green indicates high velocity (1.0 m/s). The wind direction is indicated by line style: a solid line indicates downwind direction, a dashed line indicates crosswind direction, and a dotted line indicates upwind direction.
3.1.2. ATI SAR Baseline
Current retrievals from ATI SAR data require the appropriate selection of radar parameters such as incidence angle and time delay between image acquisitions. The time delay should be sufficiently long to produce a measurable phase difference but should be shorter than the decoherence time in the backscattered region. The lower limit of the time delay is determined by the relative contributions of the velocity of the target and instrument noise to the phase variation. The upper limit is related to the decoherence time and phase wrapping of the backscattered field.
The time delay is determined by the distance d between the two receiving antennas, the velocity V of the platform, and the data acquisition mode of the ATI SAR. If both antennas are used to transmit and receive separate signals, the time delay is d/V. If both antennas are used as receiving antennas to receive signals from one antenna, the time delay is d/2V [21]. In this study, we used the dual-transmitting and dual-receiving mode. Therefore, the time delay was d/V. The relationship between the time delay, the accuracy of the retrieved velocity (phase difference resolution), and velocity ambiguity was as follows:
where c is the speed of light, fe is the radar frequency, θ is the angle of incidence, τ is the time difference between the two image acquisitions, is the difference in radial velocity, and is the interference phase difference.
Figure 6 shows the relationship between the accuracy of the retrieved velocity and radar baseline as derived from Equation (22). For d of 10 m, the accuracy of the retrieved velocity as indicated by the ratio between velocity difference and phase difference, ΔvATI/Δφ, was about 0.07 ms−1/deg. This indicated that the velocity measurement interval of the ATI was 0.07 m/s; the phase interval was 1° and the corresponding phase-ambiguous velocity interval was 25 m/s. For d of 25 m, ΔvATI/Δφ was about 0.03 ms−1/deg. This indicates that the velocity measurement interval was 0.03 m/s, the phase interval was 1°, and the corresponding phase-ambiguous velocity interval was 11 m/s.
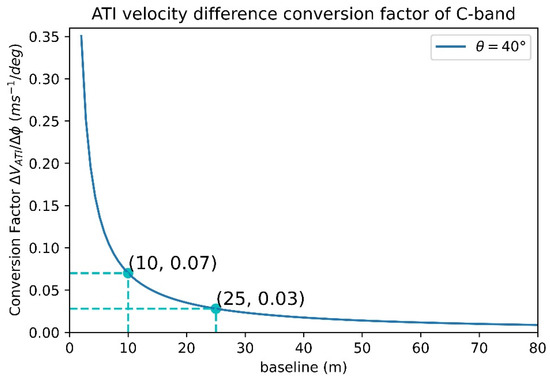
Figure 6.
The relationship between the accuracy of the retrieved velocity as indicated by the ratio between velocity difference and phase difference, ΔvATI/Δϕ, and radar baseline.
The phase difference resolution of modern ATI systems is less than 1°, which corresponds to a retrieved current velocity accuracy of usually 0.05 m/s. This accuracy also needs to include the influence of environmental conditions such as wind speed. Therefore, in this study, we used baselines of 10–25 m to retrieve current velocities with reasonable accuracy.
Figure 7 shows the relationship between WASV magnitude and baseline for HH and VV polarizations at a radar incidence angle of 40° in the downwind direction. The WASV increased with baseline in the absence of phase ambiguity and the overlapping of velocities and was also influenced by wind speed and current velocity. Variations of WASV with baseline were larger across different current velocities (represented by different colors) than across different wind speeds (represented by different line styles). This indicated that WASV was more strongly influenced by current velocity than by wind speed and can be caused by the limitations of the methods we used to derive WASV and the modulation of other marine environmental variables. The magnitude of WASV generally increases with baseline in the absence of phase ambiguity and the overlapping of velocities. The differences between WASV for different current velocities were the smallest for baselines of 10–15 m. As a result, we used a baseline of 15 m in our simulations.
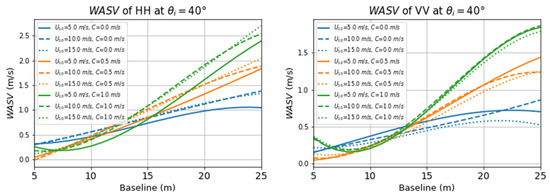
Figure 7.
The relationship between WASV magnitude and baseline at a wind speed of 10 m/s for HH and VV polarizations. The swell direction, amplitude, and wavelength were 0°, 0.5 m, and 200 m, respectively. Other input parameters were set to the values indicated in Table 1.
3.2. Influence of Sea State on WASV
3.2.1. Wind Effect
The variations of WASV with wind speed (U10) and current velocity (C) at an incident angle of 40° and for HH and VV polarizations are shown in Figure 8. The WASV varied sinusoidally with the azimuth angle. The differences between WASV for HH and VV polarizations were very small. The maximum amplitude of WASV occurred in the upwind and downwind directions; WASV near the crosswind direction was zero and was consistent with the results of [17].

Figure 8.
The relationship between WASV and wind direction at an incidence angle of 40° for HH and VV polarizations. The swell direction, amplitude, and wavelength were 0°, 0.5 m, and 200 m, respectively. Other input parameters were set to the values indicated in Table 1.
Figure 9 shows the relationship between the magnitude of WASV and wind speed at an incidence angle of 40° for HH and VV polarizations. The variations of WASV with wind speed for HH were almost the same as those for VV polarization. The WASV was more strongly influenced by wind speed than by current velocity. The magnitude of WASV was the smallest in the crosswind direction and the largest in the upwind direction. In the crosswind direction, WASV magnitude hardly changed with wind speed. In the downwind direction, WASV increased slightly with wind speed. The rate of change of WASV magnitude with wind speed in the upwind direction was about twice that in the downwind direction.

Figure 9.
The relationship between WASV magnitude and wind speed for HH and VV polarizations.
3.2.2. Swell Effect
A single wave with fixed amplitude, wavelength, and direction was used to model the swell. Swell direction, amplitude, and wavelength were set to 0°, 0.5 m, and 200 m, respectively. In Figure 10, the graphs on the top row show the results of the experiment without swell and the graphs at the bottom show the results of the experiment with swell. In the crosswind direction, WASV varied little with wind speed in the presence and absence of swell. In the downwind direction, WASV increased slightly with wind speed for HH polarization and remained almost unchanged for VV polarization. In the upwind direction, the WASV magnitude for HH was slightly higher than that for VV polarization and the superimposed swell had little influence on WASV magnitude. The magnitude of WASV varied considerably with wind speed. At a wind speed of 5 m/s, WASV magnitudes at the current velocities of 0, 0.5, and 1.0 m/s were all roughly around 0.5 m/s. At a wind speed of 15 m/s, WASV magnitudes were all roughly around 1.5 m/s. Therefore, we concluded that the magnitude of WASV increased considerably with wind speed.
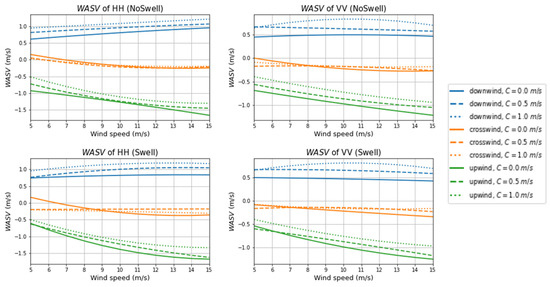
Figure 10.
The relationship between WASV and wind speed for HH and VV polarizations. Other input parameters were set to the values indicated in Table 1.
We explored the influence of wind speed increase on WASV in the upwind direction in the presence and absence of swells for different current velocities. Because WASV magnitude increased with wind speed (Figure 9), we standardized all absolute values of WASV by dividing them by the absolute WASV value at the wind speed of 5 m/s to obtain dimensionless WASV values. Figure 11 shows the relationship between dimensionless WASV and wind speed in the presence and absence of swell for different current velocities for HH and VV polarizations. Dimensionless WASV increased with wind speed and was more strongly influenced by the presence of swell at low current velocity (blue). As wind speed increased from 5 to 15 m/s, dimensionless WASV increased by about 1.7 in the absence of swell; it increased by about 2.3 times for VV and about 3.2 times for HH polarization in the presence of swell.

Figure 11.
The relationship between dimensionless WASV and wind speed for HH and VV polarizations. The swell direction, amplitude, and wavelength were 0°, 0.5 m, and 200 m, respectively. Other input parameters were set to the values indicated in Table 1. The presence and absence of swell are indicated by line style: solid line indicates no swell, dashed line indicates the presence of swell. The magnitude of the current velocity is indicated by color.
At moderate current velocity and high wind speed, swell had little effect on dimensionless WASV. The influence of wind speed on dimensionless WASV was stronger at high than at moderate current velocities. As the wind speed increased from 5 to 15 m/s, dimensionless WASV increased by about 2 times for VV and about 1.7 times for HH polarization at moderate current velocity and by about 2 times for VV and about 3 times for HH polarization at high velocity. The rate of change of dimensionless WASV with wind speed was higher for HH than for VV polarization, especially at high current velocity. As wind speed increased from 5 to 15 m/s, dimensionless WASV for HH was about 1.5 times that for VV polarization.
Swell influences WASV because it reduces the Bragg scattering by suppressing the intensity of the gravity–capillary waves. As a result, the contribution from Bragg waves decreases. The effect of swell on short waves is larger at higher wind speeds. In addition, because WASV originates from the correlation between the long-wave orbital velocity and the spatial variation of the short-wave scatterers, the effect of swells on WASV magnitude becomes more pronounced at higher wind speeds.
We also explored the influence of various swell characteristics, including amplitude, wavelength, and direction on WASV. Swell amplitude was set to 0.5, 1.0, or 1.5 m. Wavelength was set to 200 m. Swell direction was set to 0°–360° at intervals of 15°. Figure 12 shows the variation of WASV with the swell direction at a wind speed of 10 m/s in the downwind direction for different current velocities and polarizations. The results showed that WASV for HH polarization was slightly higher than that for VV polarization. For the same current velocity, variations of WASV for HH were consistent with those for VV polarization.
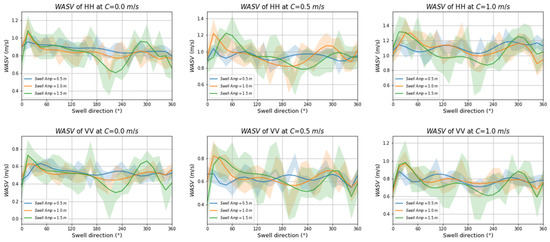
Figure 12.
The relationship between WASV and swell direction for HH and VV polarizations and for different current velocities and swell amplitudes. Wind direction and speed were 0° and 10 m/s, respectively. Swell wavelength was 200 m. Other input parameters were set to the values indicated in Table 1. The swell amplitude is indicated by color: blue indicates amplitude of 0.5 m, yellow indicates amplitude of 1.0 m, and green indicates amplitude of 1.5 m. Solid line indicates mean values. Shaded areas indicate ±1 standard deviation of the median.
The range of WASV oscillations was the largest for a swell amplitude of 1.5 m (green-shaded area) and the smallest for a swell amplitude of 0.5 m (blue-shaded area). For VV polarization and low current velocity, WASV range with a 1.5 m swell amplitude was about twice that with a 0.5 m swell amplitude. The trend was the same for other current velocities. At moderate and high current velocities, WASV ranges with a 1.5 m swell amplitude were three times those with a 0.5 m swell amplitude. Therefore, we concluded that WASV fluctuations increased with swell amplitude.
We examined the effect of swell wavelength on WASV by using a commonly used range of swell wavelength. For this experiment, swell wavelength was set to 150, 200, or 250 m. The swell amplitude was set to 0.5 m. Swell direction was set to 0°–360° at intervals of 15°. The variations of WASV with swell direction at a wind speed of 10 m/s in the downwind direction for different current velocities and polarizations are shown in Figure 13. Shaded areas indicate ±1 standard deviation of the median WASV. The differences between the areas covered by the different colors are small, which indicate small differences between WASV ranges for different swell wavelengths. At the same current velocity, the variations of WASV with swell direction for HH were basically the same as those for VV polarization. The influence of swell wavelength on WASV was very small. For example, in the case of VV polarization and moderate current velocity, one standard deviation below and above median WASV were 0.45 and 0.89 m/s (difference of 0.44 m/s) for short swell wavelength (150 m), 0.45 and 0.78 m/s (difference of 0.33 m/s) for medium wavelength (200 m), and 0.42 and 0.83 (difference of 0.41 m/s) for long wavelength (250 m). Hydrodynamic modulation of capillary waves changes sea surface roughness. Swell wavelengths are on the order of tens or a couple of hundred meters, while wavelengths of capillary waves are on the order of centimeters. The large difference in wavelength magnitude may have been the cause of the very small influence of swell wavelength on WASV.
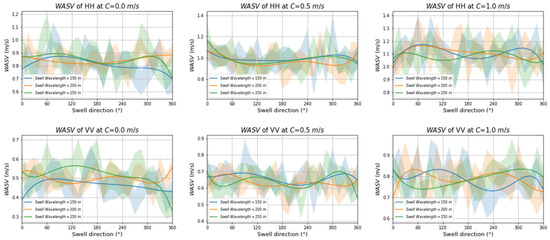
Figure 13.
The relationship between WASV and swell direction for HH and VV polarizations and for different current velocities and swell wavelengths. Wind direction and speed were 0° and 10 m/s, respectively. Swell wavelength was 0.5 m. Other input parameters were set to the values indicated in Table 1. The swell wavelength is indicated by color: blue indicates wavelength of 150 m, yellow indicates wavelength of 200 m, and green indicates wavelength of 250 m. Solid line indicates mean values. Shaded areas indicate ±1 standard deviation of the median.
Figure 12 and Figure 13 both show that WASV was more strongly influenced by swell amplitude than by swell wavelength. The variations of WASV range with swell direction were strongly influenced by swell amplitude; the range of WASV oscillations increased with swell amplitude. However, the influence of swell wavelength on the variations of WASV range with swell direction was very small. Sea surface roughness is caused by gravity–capillary waves. The large differences between swell wavelengths and the wavelengths of gravity–capillary waves may have been the cause of the insignificant differences in hydrodynamic modulation and the very small influence of swell wavelength on WASV.
4. Discussion
Wave spectra can be used to model the distribution of wave energy over wave frequencies. Wave spectra differ in terms of elevation, slope, and curvature spectra, which can be used to estimate wave shape and wave-induced motions [47]. Therefore, the investigation of the effects of different wave spectra and spreading functions on WASV contributes towards improving the accuracy of current velocity retrievals. We examined the influence of three commonly used wave spectrum models and spreading functions on WASV.
4.1. Influence of Wave Spectrum Models on WASV
Elfouhaily [37], Jonswap [48,49], and a wave spectrum proposed by Romeiser (hereafter referred to as Romeiser97) [27,28] are three typical wave spectrum models. Figure 14 shows the relationship between WASV and wind direction for different spectra and polarizations and three current velocities. The wind speed and direction were set to 10 m/s and 0° (downwind), respectively. The swell amplitude, direction, and wavelength were set to 0.5 m, 0°, and 200 m, respectively.

Figure 14.
The relationship between WASV and wind direction for different wave spectrum models and current velocities. Wind speed and direction were 10 m/s and 0°, respectively. Swell amplitude, direction, and wavelength were 0.5 m, 0°, and 200 m, respectively. The model is indicated by line style: solid line indicates Elfouhaily, dashed line indicates Jonswap, and dotted line indicates Romeiser97. The current velocity is indicated by color.
Results showed that, under the same conditions, WASV for HH exceeded that for VV polarization. In the downwind direction, the smallest WASV value from Romeiser97 exceeded the largest value from Elfouhaily by about 0.18 m/s. In the upwind direction, the largest WASV value from Romeiser97 exceeded the smallest value from Jonswap by about 0.62 m/s at high water velocities and by about 0.47 m/s at low water velocities. Therefore, we concluded that the influence of the models on WASV was the strongest in the upwind direction. The influence in the crosswind direction was small, while the influence in the downwind direction was moderate. At high current velocities, the values of WASV from Jonswap and Elfouhaily were higher than those from Jonswap and Elfouhaily. The range of WASV oscillations was the largest in Elfouhaily and the smallest in Romeiser97. Wave spectrum models have different effects on WASV according to current velocity. For current velocities of 0, 0.5, and 1.0 m/s, the maximum differences between the WASV values from the models were 0.32, 0.35, and 0.42 m/s, respectively, which corresponded to 19.86%, 20.26%, and 23.96% of WASV magnitude. Our results indicated that the influence of wave spectra on WASV increases with current velocity. The WASV was more strongly influenced by wind and swell than by wave spectrum. Compared with the influence of wind and swell on WASV, the influence of different wave spectrum models on WASV was small.
4.2. Influence of Spreading Functions on WASV
Several directional spreading functions of the wave spectra have been proposed [33,34,35,36] and we examined the influence of three spreading functions on WASV. We used the spreading functions of Elfouhaily (the E spreading function), Hasselmann (hereafter referred to as the H spreading function), and Romeiser (hereafter referred to as the R spreading function).
Figure 15 shows the relationship between WASV and wind direction for different spreading functions and three current velocities. There was consistency in the performance of the three spreading functions at different current velocities. In the downwind and upwind directions, WASV magnitudes from the E spreading function were slightly larger than those from the R spreading function and those from the H spreading function. For current velocities of 0, 0.5, and 1.0 m/s, the maximum differences between the WASV values from the spreading functions were 0.13, 0.09, and 0.08 m/s, respectively, which corresponded to 7.85%, 6.10%, and 5.23% of WASV magnitude. The WASV was more strongly influenced by wind wave effects and the omnidirectional wave spectrum than by spreading function. The influence of spreading function decreased with an increasing current velocity.
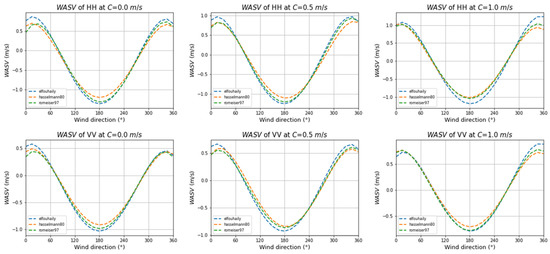
Figure 15.
The relationship between WASV and wind direction for different spreading functions and current velocities. Wind speed and direction were 10 m/s and 0°, respectively. Swell amplitude, direction, and wavelength were 0.5 m, 0°, and 200 m, respectively. The spreading function is indicated by color: blue indicates the E spreading function, yellow indicates the H spreading function, and green indicates the R spreading function. The omnidirectional wave spectrum is the typical directional function of the E spreading function.
According to above results, it was found that the effects of using different spectrums and spreading functions on WASV were much weaker than that of the effect of wind and swell as well as radar configurations.
A full validation of WASV simulation results requires the simultaneous acquisition of oceanographic and ATI SAR data, which is challenging. For this study, we could not find suitable oceanographic data to validate our results, but more ATI SAR data will become available for validation and analysis in the future.
Results in Section 3 showed that, for the same incident angle, WASV differed according to polarization. The influence of wind speed and direction on WASV also showed clear variations with polarization, while the variations of the influence of swell on WASV with polarization were smaller. Therefore, by retrieving wind speed, direction, and wave spectrum information from SAR data and considering the variations of WASV with polarization, the error in WASV estimates can be calculated to improve the accuracy of current retrieval. However, such analysis requires large amounts of data and was beyond the scope of this study. As more data become available, future studies can develop methods to systematically eliminate the influence of different factors on WASV and contribute towards improving the accuracy of current velocity retrieval.
Breaking waves are usually modeled statistically [26]. In this study, we used threshold techniques to locate breaking zones on the surface. Statistical models are not applicable to explicit surfaces, and physical models are needed for the simulation of sea surface backscattering mechanisms or evolution of the breaking zones. Despite the limitations of the study, our simulation results contribute towards improving our understanding of WASV characteristics and provide a basis for future experiments.
5. Conclusions
The ATI SAR signal is determined by the relative motion between radar and ocean surface and includes contributions from the movement of the radar platform and wind wave-induced motion in addition to the ocean surface current. In this study, we assessed the sensitivity of WASV in C-band ATI SAR to radar configuration, wind field, swell field, and wave spectrum model. The effect of wind velocity on WASV increases with current velocity. The WASV varies sinusoidally with wind direction. The amplitudes of WASV are highest in the upwind and downwind directions. The WASV is strongly influenced by swell amplitude and the effect of swell is more pronounced at higher wind speeds. For VV polarization and high current velocity, the WASV under a swell amplitude of 1.5 m is more than three times that under a swell amplitude of 0.5 m. However, the influence of swell wavelength on WASV is very small. Because sea surface roughness is caused by gravity–capillary waves, the large differences between swell wavelengths and the wavelengths of gravity–capillary waves may be the cause of insignificant differences in hydrodynamic modulation and the very small influence of swell wavelength on WASV.
Our results show that WASV estimates under HH polarization are more sensitive than those under VV polarization to variations in different parameters. Moderate incidence angles (around 40°) are suitable for the retrieval of sea surface current velocity because the interference of estimated WASV is minimal. In the absence of overlapping velocities and phase ambiguity, the ATI baseline should be selected to ensure minimal influence of current velocity on WASV.
In addition, the influence of a wave spectrum model on WASV is small, and the influence of a spreading function is even smaller, especially in the downwind and upwind directions. Although the effect of a wave spectrum model is small compared with the effects of a sea state such as wind, current, and swell, consideration needs to be given to the choice of wave spectrum model to ensure the accuracy of ocean surface currents retrieved from ATI SAR.
Knowledge of the characteristics of WASV is needed for accurate retrievals of ocean currents. The findings of this study improve our understanding of WASV and provide a reference for the evaluation of WASV and the design of future ATI SAR current measurement projects and Doppler measurement instruments. A full validation of simulation results requires simultaneous acquisition of oceanographic and ATI SAR data, which is challenging. Future studies will benefit from systematic acquisition of data and increased data availability.
Author Contributions
X.Z. proposed the idea. R.Z. and X.Z. simulated the experiment. R.Z., J.Z., X.Z. and C.C. analyzed the results and wrote the text. X.W., G.G., G.L. and M.B. supervised the work. All authors commented on the paper. All authors have read and agreed to the published version of the manuscript.
Funding
This work was supported by the National Natural Science Foundation of China (Nos. U2006207, 61971455, U2106211, and 62131019) and State Key Laboratory Foundation of CEMEE (No. CEMEE2022K0303B).
Conflicts of Interest
The authors declare no conflict of interest.
References
- Huang, W.; Carrasco, R.; Shen, C.; Gill, E.W.; Horstmann, J. Surface Current Measurements Using X-Band Marine Radar with Vertical Polarization. IEEE Trans Geosci Remote Sens. 2016, 54, 2988–2997. [Google Scholar] [CrossRef]
- Morang, A.; Gorman, L.T. Monitoring Coastal Geomorphology. In Encyclopedia of Coastal Science; Schwartz, M.L., Ed.; Springer: Dordrecht, The Netherlands, 2005; pp. 663–674. [Google Scholar]
- Feng, H.; Vandemark, D.; Levin, J.; Wilkin, J. Examining the Accuracy of GlobCurrent Upper Ocean Velocity Data Products on the Northwestern Atlantic Shelf. Remote Sens. 2018, 10, 1205. [Google Scholar] [CrossRef]
- Prandle, D.; Ryder, D.K. Measurement of surface currents in Liverpool Bay by high-frequency radar. Nature 1985, 315, 128–131. [Google Scholar] [CrossRef]
- Hammond, T.M.; Pattiaratchi, C.B.; Eccles, D.; Osborne, M.J.; Nash, L.A.; Collins, M.B. Ocean surface current radar (OSCR) vector measurements on the inner continental shelf. CSR 1987, 7, 411–431. [Google Scholar] [CrossRef]
- Quilfen, Y.; Chapron, B. Ocean Surface Wave-Current Signatures from Satellite Altimeter Measurements. Geophys. Res. Lett. 2019, 46, 253–261. [Google Scholar] [CrossRef]
- Bao, Q.; Lin, M.; Zhang, Y.; Dong, X.; Lang, S.; Gong, P. Ocean Surface Current Inversion Method for a Doppler Scatterometer. IEEE Trans. Geosci. Remote Sens. 2017, 55, 6505–6516. [Google Scholar] [CrossRef]
- Wineteer, A.; Torres, H.; Rodriguez, E. On the Surface Current Measurement Capabilities of Spaceborne Doppler Scatterometry. Geophys. Res. Lett. 2020, 47, e2020GL090116. [Google Scholar] [CrossRef]
- González-Haro, C.; Isern-Fontanet, J.; Tandeo, P.; Garello, R. Ocean Surface Currents Reconstruction: Spectral Characterization of the Transfer Function Between SST and SSH. J. Geophys. Res. Oceans 2020, 125, e2019JC015958. [Google Scholar] [CrossRef]
- Isern-Fontanet, J.; García-Ladona, E.; González-Haro, C.; Turiel, A.; Rosell-Fieschi, M.; Company, J.B.; Padial, A. High-Resolution Ocean Currents from Sea Surface Temperature Observations: The Catalan Sea (Western Mediterranean). Remote Sens. 2021, 13, 3635. [Google Scholar] [CrossRef]
- Goldstein, R.M.; Zebker, H.A. Interferometric radar measurement of ocean surface currents. Nature 1987, 328, 707–709. [Google Scholar] [CrossRef]
- Hansen, M.W.; Collard, F.; Dagestad, K.; Johannessen, J.A.; Fabry, P.; Chapron, B. Retrieval of Sea Surface Range Velocities From Envisat ASAR Doppler Centroid Measurements. IEEE Trans. Geosci. Remote Sens. 2011, 49, 3582–3592. [Google Scholar] [CrossRef]
- Romeiser, R.; Suchandt, S.; Runge, H.; Steinbrecher, U.; Grunler, S. First Analysis of TerraSAR-X Along-Track InSAR-Derived Current Fields. IEEE Trans. Geosci. Remote Sens. 2010, 48, 820–829. [Google Scholar] [CrossRef]
- Martin, A.C.H.; Gommenginger, C.P.; Jacob, B.; Staneva, J. First multi-year assessment of Sentinel-1 radial velocity products using HF radar currents in a coastal environment. Remote Sens. Environ. 2022, 268, 112758. [Google Scholar] [CrossRef]
- Mouche, A.; Collard, F.; Chapron, B.; Dagestad, K.-F.; Guitton, G.; Johannessen, J.; Kerbaol, V.; Hansen, M. On the Use of Doppler Shift for Sea Surface Wind Retrieval From SAR. IEEE Trans. Geosci. Remote Sens. 2012, 50, 2901–2909. [Google Scholar] [CrossRef]
- Martin, A.C.H.; Gommenginger, C.; Marquez, J.; Doody, S.; Navarro, V.; Buck, C. Wind-wave-induced velocity in ATI SAR ocean surface currents: First experimental evidence from an airborne campaign. J. Geophys. Res. Ocean. 2016, 121, 1640–1653. [Google Scholar] [CrossRef]
- Li, S.; Liu, B.; Shen, H.; Hou, Y.; Perrie, W. Wind Wave Effects on Remote Sensing of Sea Surface Currents From SAR. J. Geophys. Res. Ocean. 2020, 125, e2020JC016166. [Google Scholar] [CrossRef]
- Ardhuin, F.; Aksenov, Y.; Benetazzo, A.; Bertino, L.; Brandt, P.; Caubet, E.; Chapron, B.; Collard, F.; Cravatte, S.; Delouis, J.-M.; et al. Measuring currents, ice drift, and waves from space: The Sea Surface KInematics Multiscale monitoring (SKIM) concept. Ocean Sci. 2018, 14, 337–354. [Google Scholar] [CrossRef]
- Romeiser, R.; Runge, H.; Suchandt, S.; Kahle, R.; Rossi, C.; Bell, P. Quality Assessment of Surface Current Fields From TerraSAR-X and TanDEM-X Along-Track Interferometry and Doppler Centroid Analysis. IEEE Trans. Geosci. Remote Sens. 2013, 52, 2759–2772. [Google Scholar] [CrossRef]
- Ferreira, R.M.; Estefen, S.F.; Romeiser, R. Under What Conditions SAR Along-Track Interferometry is Suitable for Assessment of Tidal Energy Resource. IEEE J. Sel. Top. Appl. Earth Obs. Remote Sens. 2016, 9, 5011–5022. [Google Scholar] [CrossRef]
- Romeiser, R.; Thompson, D.R. Numerical study on the along-track interferometric radar imaging mechanism of oceanic surface currents. IEEE Trans. Geosci. Remote Sens. 2000, 38, 446–458. [Google Scholar] [CrossRef]
- Martin, A.C.H.; Gommenginger, C.P.; Quilfen, Y. Simultaneous ocean surface current and wind vectors retrieval with squinted SAR interferometry: Geophysical inversion and performance assessment. Remote Sens. Environ. 2018, 216, 798–808. [Google Scholar] [CrossRef]
- Yuan, X.; Lin, M.; Han, B.; Zhao, L.; Wang, W.; Sun, J.; Wang, W. Observing Sea Surface Current by Gaofen-3 Satellite Along-Track Interferometric SAR Experimental Mode. IEEE J. Sel. Top. Appl. Earth Obs. Remote Sens. 2021, 14, 7762–7770. [Google Scholar] [CrossRef]
- Scientific Assessment of TSCV Retrieval from Stereo-SAR: A critical Review. Available online: https://norceresearch.brage.unit.no/norceresearch-xmlui/bitstream/handle/11250/2649700/Norut_rapport_4-2018.pdf?sequence=1 (accessed on 16 March 2018).
- Stratton, J.A. Plane Waves in Unbounded, Isotropic Media. In Electromagnetic Theory; Wiley-IEEE Press: Hoboken, NJ, USA, 2015; pp. 268–348. [Google Scholar]
- Kudryavtsev, V.; Hauser, D.; Caudal, G.; Chapron, B. A semiempirical model of the normalized radar cross-section of the sea surface 1. Background model. J. Geophys. Res. Ocean. 2003, 108, FET 2-1–FET 2-24. [Google Scholar] [CrossRef]
- Romeiser, R.; Alpers, W.; Wismann, V. An improved composite surface model for the radar backscattering cross section of the ocean surface: 1. Theory of the model and optimization/validation by scatterometer data. J. Geophys. Res. Ocean. 1997, 102, 25237–25250. [Google Scholar] [CrossRef]
- Romeiser, R.; Alpers, W. An improved composite surface model for the radar backscattering cross section of the ocean surface: 2. Model response to surface roughness variations and the radar imaging of underwater bottom topography. J. Geophys. Res. Ocean. 1997, 102, 25251–25267. [Google Scholar] [CrossRef]
- Raney, R.K.; Runge, H.; Bamler, R.; Cumming, I.G.; Wong, F.H. Precision SAR processing using chirp scaling. IEEE Trans. Geosci. Remote Sens. 1994, 32, 786–799. [Google Scholar] [CrossRef]
- Yoshida, T.; Rheem, C.-K. Time-Domain Simulation of Along-Track Interferometric SAR for Moving Ocean Surfaces. Sensors 2015, 15, 13644–13659. [Google Scholar] [CrossRef]
- Stuhlmeier, R. Gerstner’s Water Wave and Mass Transport. J. Math. Fluid Mech. 2015, 17, 761–767. [Google Scholar] [CrossRef]
- Ritchie, R.H.; Marusak, A.L. The surface plasmon dispersion relation for an electron gas. Surf. Sci. 1966, 4, 234–240. [Google Scholar] [CrossRef]
- Donelan, M.A.; Hamilton, J.; Hui, W.H.; Stewart, R.W. Directional spectra of wind-generated ocean waves. Philos. Trans. R. Soc. Lond. Ser. A Math. Phys. Sci. 1985, 315, 509–562. [Google Scholar]
- Hasselmann, K.; Barnett, T.; Bouws, E.; Carlson, H.; Cartwright, D.; Enke, K.; Ewing, J.; Gienapp, H.; Hasselmann, D.; Kruseman, P.; et al. Measurements of wind-wave growth and swell decay during the Joint North Sea Wave Project (JONSWAP). Deut. Hydrogr. Z. 1973, 8, 1–95. [Google Scholar]
- Kahma, K.K. A Study of the Growth of the Wave Spectrum with Fetch. J. Phys. Oceanogr. 1981, 11, 1503–1515. [Google Scholar] [CrossRef]
- Phillips, O.M. Spectral and statistical properties of the equilibrium range in wind-generated gravity waves. J. Fluid Mech. 1985, 156, 505–531. [Google Scholar] [CrossRef]
- Elfouhaily, T.; Chapron, B.; Katsaros, K.; Vandemark, D. A unified directional spectrum for long and short wind-driven waves. J. Geophys. Res. Ocean. 1997, 102, 15781–15796. [Google Scholar] [CrossRef]
- Durden, S.; Vesecky, J. A physical radar cross-section model for a wind-driven sea with swell. IEEE J. Ocean. Eng. 1985, 10, 445–451. [Google Scholar] [CrossRef]
- Kodis, R. A note on the theory of scattering from an irregular surface. IEEE Trans. Antennas Propag. 1966, 14, 77–82. [Google Scholar] [CrossRef]
- Clarizia, M.P.; Gommenginger, C.; Bisceglie, M.D.; Galdi, C.; Srokosz, M.A. Simulation of L-Band Bistatic Returns from the Ocean Surface: A Facet Approach with Application to Ocean GNSS Reflectometry. IEEE Trans. Geosci. Remote Sens. 2012, 50, 960–971. [Google Scholar] [CrossRef]
- Yoshida, T.; Rheem, C.-K. SAR Image Simulation in the Time Domain for Moving Ocean Surfaces. Sensors 2013, 13, 4450–4467. [Google Scholar] [CrossRef]
- Wollstadt, S.; López-Dekker, P.; Zan, F.D.; Younis, M. Design Principles and Considerations for Spaceborne ATI SAR-Based Observations of Ocean Surface Velocity Vectors. IEEE Trans. Geosci. Remote Sens. 2017, 55, 4500–4519. [Google Scholar] [CrossRef]
- Elyouncha, A.; Eriksson, L.E.B.; Romeiser, R.; Ulander, L.M.H. Measurements of Sea Surface Currents in the Baltic Sea Region Using Spaceborne Along-Track InSAR. IEEE Trans. Geosci. Remote Sens. 2019, 57, 8584–8599. [Google Scholar] [CrossRef]
- Caldarella, N.; Lopez-Dekker, P.; Prats-Iraola, P.; Nouguier, F.; Chapron, B.; Zonno, M.; Rodriguez-Cassola, M. Retrieval of Wind and Total Surface Current Vectors Using Experimental Bidirectional Along-Track Interferometric TanDEM-X Data. IEEE Trans. Geosci. Remote Sens. 2022, 60, 5223412. [Google Scholar] [CrossRef]
- Zheng, C.W.; Li, C.Y.; Pan, J. Propagation Route and Speed of Swell in the Indian Ocean. J. Geophys. Res. Ocean. 2018, 123, 8–21. [Google Scholar] [CrossRef]
- Bhowmick, S.; Kumar, R.; Chaudhuri, S.; Sarkar, A. Swell Propagation over Indian Ocean Region. Int. J. Ocean Clim. Syst. 2011, 2, 87–99. [Google Scholar] [CrossRef]
- Miao, Y.; Dong, X.; Bourassa, M.A.; Zhu, D. Effects of Ocean Wave Directional Spectra on Doppler Retrievals of Ocean Surface Current. IEEE Trans. Geosci. Remote Sens. 2022, 60, 4204812. [Google Scholar] [CrossRef]
- Hasselmann, K.; Sell, W.; Ross, D.B.; Müller, P. A Parametric Wave Prediction Model. J. Phys. Oceanogr. 1976, 6, 200–228. [Google Scholar] [CrossRef]
- Hasselmann, D.E.; Dunckel, M.; Ewing, J.A. Directional Wave Spectra Observed during JONSWAP 1973. J. Phys. Oceanogr. 1980, 10, 1264–1280. [Google Scholar] [CrossRef]
Publisher’s Note: MDPI stays neutral with regard to jurisdictional claims in published maps and institutional affiliations. |
© 2022 by the authors. Licensee MDPI, Basel, Switzerland. This article is an open access article distributed under the terms and conditions of the Creative Commons Attribution (CC BY) license (https://creativecommons.org/licenses/by/4.0/).