Article

Assessing Surface Urban Heat Island Related to Land Use/Land Cover Composition and Pattern in the Temperate Mountain Valley City of Kathmandu, Nepal

by
Siri Karunaratne
1,2,*,
Darshana Athukorala
1,
Yuji Murayama
3 and
Takehiro Morimoto
3
1
Graduate School of Life and Environmental Sciences, University of Tsukuba, Tsukuba 305-8572, Japan
2
Land Use Policy Planning Department, Ministry of Lands, Colombo 00500, Sri Lanka
3
Faculty of Life and Environmental Sciences, University of Tsukuba, Tsukuba 305-8572, Japan
*
Author to whom correspondence should be addressed.
Remote Sens. 2022, 14(16), 4047; https://doi.org/10.3390/rs14164047
Submission received: 12 June 2022 / Revised: 22 July 2022 / Accepted: 15 August 2022 / Published: 19 August 2022
(This article belongs to the Special Issue Geographical Analysis and Modeling of Urban Heat Island Formation)

Abstract

:
Rapid urban growth has coincided with a substantial change in the environment, including vegetation, soil, and urban climate. The surface urban heat island (UHI) is the temperature in the lowest layers of the urban atmosphere; it is critical to the surface’s energy balance and makes it possible to determine internal climates that affect the livability of urban residents. Therefore, the surface UHI is recognized as one of the crucial global issues in the 21st century. This phenomenon affects sustainable urban planning, the health of urban residents, and the possibility of living in cities. In the context of sustainable landscapes and urban planning, more weight is given to exploring solutions for mitigating and adapting to the surface UHI effect, currently a hot topic in urban thermal environments. This study evaluated the relationship between land use/land cover (LULC) and land surface temperature (LST) formation in the temperate mountain valley city of Kathmandu, Nepal, because it is one of the megacities of South Asia, and the recent population increase has led to the rapid urbanization in the valley. Using Landsat images for 2000, 2013, and 2020, this study employed several approaches, including machine learning techniques, remote sensing (RS)-based parameter analysis, urban-rural gradient analysis, and spatial composition and pattern analysis to explore the surface UHI effect from the urban expansion and green space in the study area. The results revealed that Kathmandu’s surface UHI effect was remarkable. In 2000, the higher mean LST tended to be in the city’s core area, whereas the mean LST tended to move in the east, south, north, and west directions by 2020, which is compatible with urban expansion. Urban periphery expansion showed a continuous enlargement, and the urban core area showed a predominance of impervious surface (IS) on the basis of urban-rural gradient analysis. The city core had a lower density of green space (GS), while away from the city center, a higher density of GS predominated at the three time points, showing a lower surface UHI effect in the periphery compared to the city core area. This study reveals that landscape composition and pattern are significantly correlated with the mean LST in Kathmandu. Therefore, in discussing these findings in order to mitigate and adapt to prominent surface UHI effects, this study provides valuable information for sustainable urban planning and landscape design in mountain valley cities like Kathmandu.

Graphical Abstract

1. Introduction

Urbanization and associated LULC changes [1,2] significantly impact the urban thermal environment of cities and their neighboring areas. This can result in numerous environmental problems, such as deforestation, ecological degradation [3], air pollution [4], energy imbalance [5], and hydrological stress [6], while the most apparent environmental problem is the increase in the urban heat island (UHI) [7,8,9,10,11]. The urban heat island (UHI) refers to urban core areas with temperatures that are higher than those in surrounding rural areas. Rapid urban expansion exerts substantial pressure on the natural environment [2,3], and as a result, the area has become built-up land [12]. Built-up land is mainly covered by impervious surfaces and can modify the surface energy and hydrological balance in urban areas [13]. Due to the UHI effect, increasing temperatures in urban areas can lead to higher energy and water consumption, air pollution, and a greater health risk for urban dwellers [14,15].
UHI can be categorized as either surface UHI or atmospheric UHI [16]. Surface UHI is estimated using land surface temperature, derived from remotely sensed thermal infrared (TIR) data. Atmospheric UHI is calculated using in situ data and is often categorized into the canopy and boundary-layer UHI [16,17]. This study focuses on surface UHI to more deeply understand the processes underlying changes in land surface temperature in accordance with LULC composition and pattern. Surface UHI includes both the daytime and nighttime UHI; the daytime surface UHI is stronger than the nighttime UHI due to solar radiation [17,18].
Many studies have shown that local climate zones for urban heat island studies standardize the global exchange of urban thermal observations [19,20,21,22]. Moreover, a growing body of literature shows the advantages of satellite remote sensing (RS) for monitoring urban LULC patterns and LST [11,23,24,25]. For example, Estoque et al., 2017 [17] studied the influence of landscape composition and LST patterns in three megacities in Southeast Asia. Athukorala and Murayama 2020 [18] examined the spatial variation in land use/land cover and composition and its impact on surface urban heat islands in the tropical sub-Saharan city of Accra, Ghana. Jiang et al., 2015 [26] assessed the effects of urbanization-associated land use cover changes on land surface temperature and surface moisture in the midwestern United States. Yan et al., 2022 [27] evaluated the warming effect of urbanization and agriculture in highly developed urban agglomerations in China, considering both daytime and nighttime. These geospatial analyses provided critical insights for increasing and understanding surface UHI research in order to implement proper urban planning to reduce the surface UHI effect in many cities worldwide [11,16,17,24,28], thus improving the living conditions for urban residents [16,17].
Generally, there is a contrast between heat absorption on impervious surfaces (concrete, asphalt, and other heat-absorbing substances) and heat absorption in the natural environment in urban areas [28,29,30,31]. Many studies have shown that LST in urban areas can be reduced by increasing urban green space, because such areas produce a cooling effect and enhance humidity and emissivity [32,33,34]. Moreover, they can create a shadow effect that covers land, limiting the direct heat applied to urban land surfaces from solar radiation [13,16]. Therefore, many researchers have investigated the relationship between spatial variations in impervious surfaces and green space in urban areas and cities on a local [13,18], regional [35,36], and global scale [37], as well as the use of modeling [38,39,40] to understand this phenomenon.
Many studies have investigated the relationship between spatial variations of impervious surface and green space in many cities and in various climatic regions, including tropical [41,42], tropical mountain [13], subtropical [18,43], temperate [9,44], and hot desert [16] regions. However, a study of temperate mountain valley cities that provide a favorable climate for their residents is still lacking [45,46,47].
Kathmandu is one of the most developed cities in Nepal with respect to population and economic development, with built-up areas covering the majority of its land. Recent research has revealed that thermal comfort is a significant problem in Kathmandu [48]. For example, Maharjan et al., 2021 [49] studied urban heat islands in densely populated cities of South Asia, including Kathmandu Valley, using the normalized difference vegetation index (NDVI) and normalized difference built-up index (NDBI). Their study found an increase in surface temperature of up to 30 °C between 2015 and 2018. Therefore, our study explores the relationship between LST and the spatial variation of impervious surface and green space in the temperate mountain valley city of Kathmandu, Nepal, to provide valuable insights for urban planners and policymakers in order to achieve the proper management of Kathmandu. We used Landsat data and various geospatial approaches such as machine learning techniques, urban-rural analysis, index-based analysis, and landscape configuration analysis to deeply understand the relationship between the LST and LULC patterns of Kathmandu, Nepal.

2. Materials and Methods

2.1. Study Area

Kathmandu, the capital of Nepal, is located in the central area of Nepal (Figure 1). The study area consists of three districts: Bhaktapur, Kathmandu, and Lalitpur, which contain five municipalities: Kathmandu metropolitan, Bhaktapur, Madyapur Thimi, Lalitpur sub-metropolitan, and Kirtipur [50]. The rate of urbanization during the 1990s was 6.6% per annum, which was among the highest in the Asia Pacific region [50]. As a result, the total population of Kathmandu reached 2.5 million by 2016, of which about 1,465,254 were considered urban residents [50]. The altitude range of the area is 1026 m through 2547 m (Figure 1). Kathmandu City stretches along the Bugmathi river basin [50]. According to the Koppen classification, the study area belongs to a temperate, dry winter, hot summer climate (Cwa) [51]. The area experiences four seasons: winter (December–February), pre-monsoon (March–May), monsoon (June–September), and post-monsoon (October–November) [50,52]. The average summer and winter temperatures in Kathmandu are 29 °C and 10.1 °C, respectively [50,52]. Kathmandu is regarded as a high urban accumulated area, and is the industrial and administrative hub in Nepal. Therefore, Kathmandu Valley has accelerated in terms of both population and urban development, expanding to the outer areas. After considering the urban development process and the potential restricted effects of administrative boundaries, we defined our study area as 20 × 20 km, with a 10 km radial from the city center in Kathmandu’s central hub (Figure 1).

2.2. LULC Classifications

In assessing the relationship between LULC and LST, spatially and temporally consistent LULC maps are required. However, we could not find spatially and temporally consistent LULC maps for Kathmandu. Therefore, we used earth-observing satellite remote sensing data to classify LULC maps in 2000, 2013, and 2020, considering urbanization and data availability. We used Landsat images in this study [55]: Bands 4, 3, and 2 for Landsat 5 and bands 5, 4, and 3 for Landsat 8 were used for LULC classification. The target years were selected on the basis of the urban development of the Kathmandu Valley and previous studies [52,56]. We employed machine learning techniques—the random forest classification using R software [57]—to classify the LULC maps for the study area. Many studies have shown that the random forest classification method has higher LULC classification accuracy in many regions of the world [58,59,60]. Six land use and land cover categories were identified: impervious surface (IS), green space 1 (GS1), green space 2 (GS2), bare land (BL), water (W), and other land (OL). The IS category consists of buildings, roads, airports, schools, industrial areas, and asphalt areas. The GS1 category consists of all types of forests, and GS2 consists of croplands, grasslands, and small types of bushes. BL comprises exposure areas both natural and man-made. The water (W) category includes rivers, lakes, and sub-channels, and OL mainly contains clouds, snow, and shadows in the study area.
We used 600 sample points to evaluate the accuracy of each map in 2000, 2013, and 2020. Google Earth historical images were used for the accuracy assessment. The accuracy of the maps was determined by automatic sampling in the algorithm for each year using the software. The spatial resolution of the classified LULC maps was 30 × 30 m.

2.3. Estimation of LST

This study used Landsat collection 2 level-1 product data (one TM 5 image for 2000 and two OLI/TIRS images for 2013 and 2020) to estimate LST in Kathmandu. Captured Landsat TM 5 images in 2000 (4 April; 10:07 local solar time) and 2013, and 2020 Landsat 8 OLI/TIRS (26 March; 10:33 local solar time, and 11 April; 10:22 local solar time) images were utilized for the analysis. Before assessing the LST in the area, we pre-processed the data on the basis of methods presented in our previous studies (surface reflectance values for the multispectral bands and at-satellite brightness temperature (Tb) values for the thermal bands) [18,61]. Generally, the frequently applied process of obtaining unprocessed Landsat data requires the DN value of thermal bands (Landsat thematic mapper TM = band 6, and Landsat 8 OLI/TIRS = bands 10 and 11) [18]. First, we obtained absolute radiance values and performed the derivation of satellite brightness temperature [17,18]. We used the pre-processed bands (band 6 for Landsat 5 TM and bands 10 and 11 of Landsat 8 OLI/TIRS) and the normalized difference vegetation index (NDVI) method to estimate land surface emissivity values [17,18]. Consequently, Kelvin values of the top-of-atmosphere brightness temperature were shifted to Celsius (°C). Equation (1) [13,18] was used to estimate the LST for Kathmandu:
L S T = T b 1 + ( λ   ×   T b / ρ )   I N ε  
where Tb refers to Landsat 5 TM band 6, Landsat 8 OLI/TIRS band 10 brightness temperature, λ refers to the wavelength of emitted radiance (11.5 μm for band 6 and 10.8 μm for band 10), ρ = h × c/σ (1.438 × 10⁻² m K), σ = Boltzmann constant (1.38 × 10⁻²³ J/k), h = Planck’s constant (6.626 × 10⁻³⁴ Js), c = velocity of light (2.998 × 10⁸ m/s), IN refers to the pre-launch logarithm, and ε refers to the emissivity of the land surface.

2.4. Spatial Profile of Surface UHI in Kathmandu City

A typical UHI formation represents the temperature distribution from the urban core. The urban core area shows a heating condition and comes to the middle. It shows a decreasing trend in basins, plateaus, and valleys. Estoque and Murayama 2017 [13] introduced surface UHI profiling for the South Asian mountain city of Baguio, Philippines, considering urban-rural gradient surface UHI formation using Landsat data. Athukorala and Murayama 2020 [18] investigated the surface UHI formation in Accra, Ghana, observing cross-sectional surface UHI profiles based on Landsat data. This study also focused on surface UHI definition based on 210 × 210 m grid size because this grid size is robust for predicting methodological factors and environmental elements utilizing statistical connections in surface UHIor atmospheric UHI, and LULC categories, as well as spatial configurations and patterns (210 × 210 m grid size used based on previous studies [13,16,18]); then, a surface UHI profile of the Kathmandu was created.

2.5. Remote Sensing-Related Parameter Analysis

Geologically, a valley is considered as an extended depression on the earth’s surface that is usually surrounded by mountain ridges. The depth and natural landscape features of the valley strongly impact its local climate, and valley cities develop under these conditions. Kathmandu is a bowl-shaped temperate mountain valley city (Figure 1). Therefore, it is crucial to understand the relationship between natural parameters such as NDVI, modified normalized difference water index (MNDWI), normalized difference bareness index (NDBal), and elevation and LST. Understanding the relationship between natural parameters and LST and their interconnectivity with each variable provides valuable insights for urban planners and policymakers for the purposes of sustainable city planning. To do this, we used four remote sensing parameters: NDVI, MNDWI, NDBal, and elevation for Kathmandu City, and each variable was selected on the basis of the knowledge of the study area and previous studies [13,62,63,64,65]. Elevation (digital elevation model (DEM)) data were obtained from the Advanced Spaceborne Thermal Emission and Reflection Radiometer (ASTER) with 30 × 30 m resolution [55]. We resampled NDVI, MNDWI, and NDBal into 0 to 100 using the resample tool in the ArcGIS 10.5 software. For the final analysis, we used a 210 × 210 m grid size, as explained in Section 2.4. The multiple linear regression (MLR) model [66,67] was applied to demonstrate the relationship between remote sensing-related parameters and the mean LST using 9025 analytical grids. Some previous studies have also employed the same statistical method [13]. The objective of MLR is to model the linear relationship between response (dependent) variables and explanatory (independent) variables. Several important assumptions had to be tested during the regression analysis, including the presence of linearity between the dependent and independent variables. The R-squared was used to calculate how much of the variation in the independent variables can be attributed to the variation in the outcome.

2.6. Spatial Analysis

2.6.1. Characteristics in Surface UHI of Kathmandu

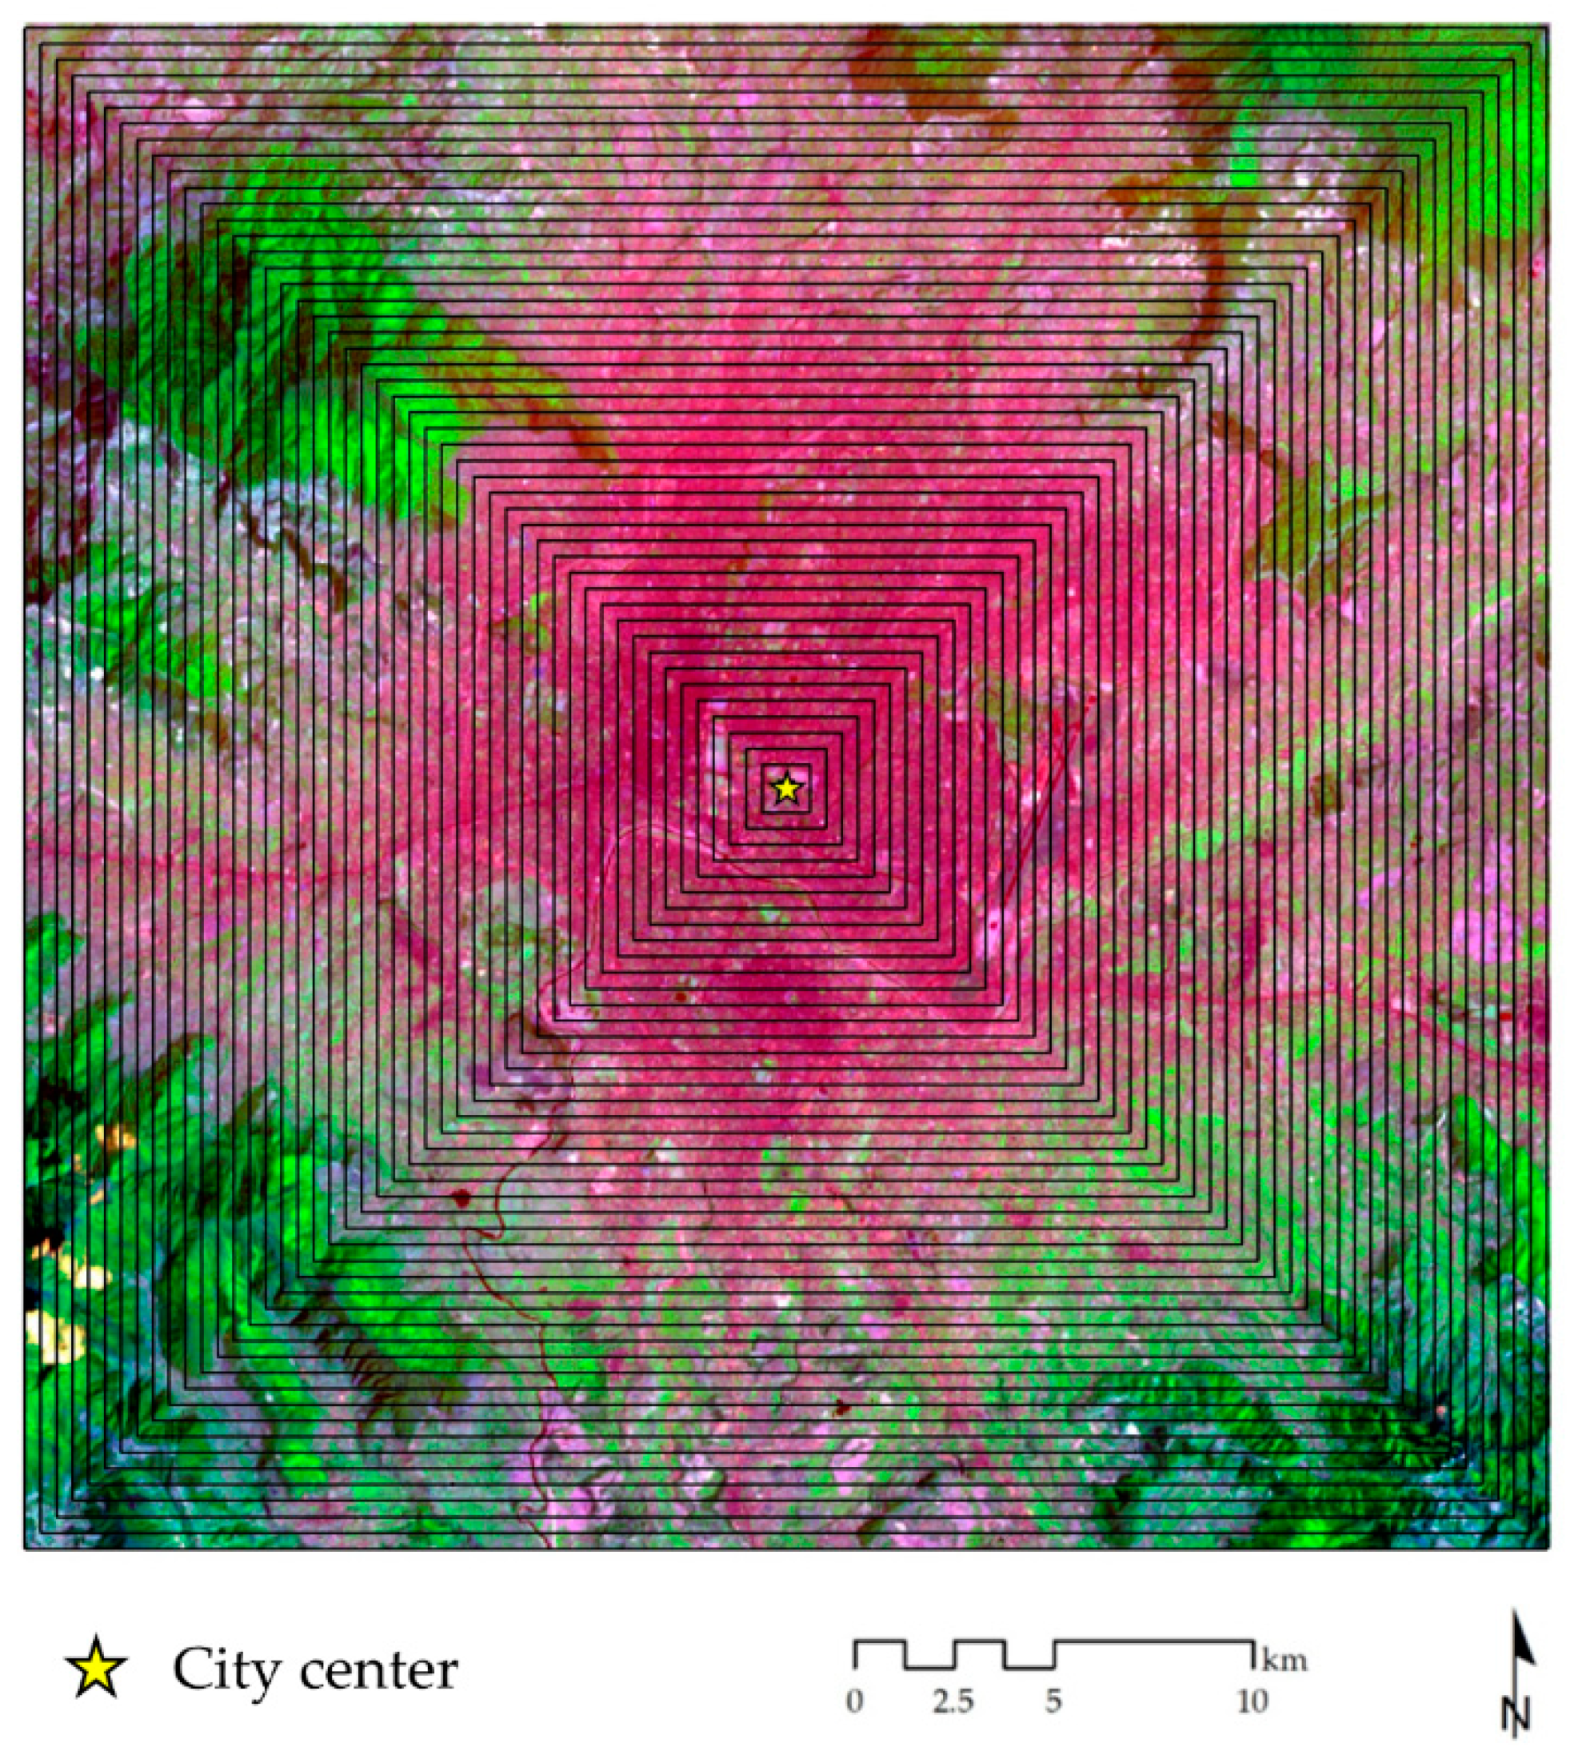
We assessed the characteristics of SUHII along the urban-rural gradient in Kathmandu to understand its formation in the temperate mountain valley condition. As described in Section 2.4, all 210 × 210 m grids were aimed in the same direction for this analysis (see Estoque and Murayama 2017 [13]). Accordingly, 48 urban-rural buffers were demarcated as urban-rural zones in this study (URZs), i.e., URZ1, URZ2, URZ3, …, URZ48 (Appendix A). The zones show the mean LST and LULC densities of IS, GS1, and GS2 (we calculated the IS, GS1, and GS2 densities along each URZs), and the formation of the remote sensing-related parameters, i.e., NDVI, MNDWI, and NDBal, ranging from 0 to 100 at 210 × 210 m intervals (see Section 2.5). The surface UHI intensity changes were estimated between URZ1 (URZ1 was recognized as a high urban intensity zone) and other URZs. We applied the same procedure for 2000, 2013, and 2020. On the basis of previous studies [16,18], we considered high-IS-density zones (URZ1) as urban zones and URZs with <15% IS density as rural zones. We excluded bare land (BL), water (W), and other land (OL) categories in this analysis, because they possess relatively low areas compared to the other LULC categories.

2.6.2. Landscape Composition and Pattern Analysis

This investigation aims to determine which spatial traits of the IS, GS1, and GS2 patches are likely to have impacted the spatial formation of LST in Kathmandu. The 210 × 210 m grid size used in Section 2.4 was inadequate for this composition and pattern analysis due to the grid size. Therefore, we used a relatively large grid size for this analysis. We applied a 4 × 4 km fishnet to divide the entire study area (20 × 20 km) into 25 sub-parts. All sub-parts were considered in this analysis. For further investigation, the LULC and LST maps were clipped with the corresponding polygon grid years 2000, 2013, and 2020.
We used five class-level spatial matrices: mean patch area (AREA_MN), number of patches (NP), largest patch index (LPI), percentage of landscape (PLANND), and cohesion (COHESION) (Table 1) (more information—Fragstats [68]). These class-level spatial metrics have been widely applied in previous UHI studies. The 8-cell neighbor rule was employed to estimate the five metrics. BL, W, and OL were excluded in this analysis due to the same conditions explained in Section 2.5. Finally, the resulting metric values were correlated with the mean LST of the LULC category of each sub-part to determine the influence of landscape composition and pattern on the mean LST in Kathmandu.

3. Results

3.1. LULC and LST Changes in Kathmandu from 2000 to 2020

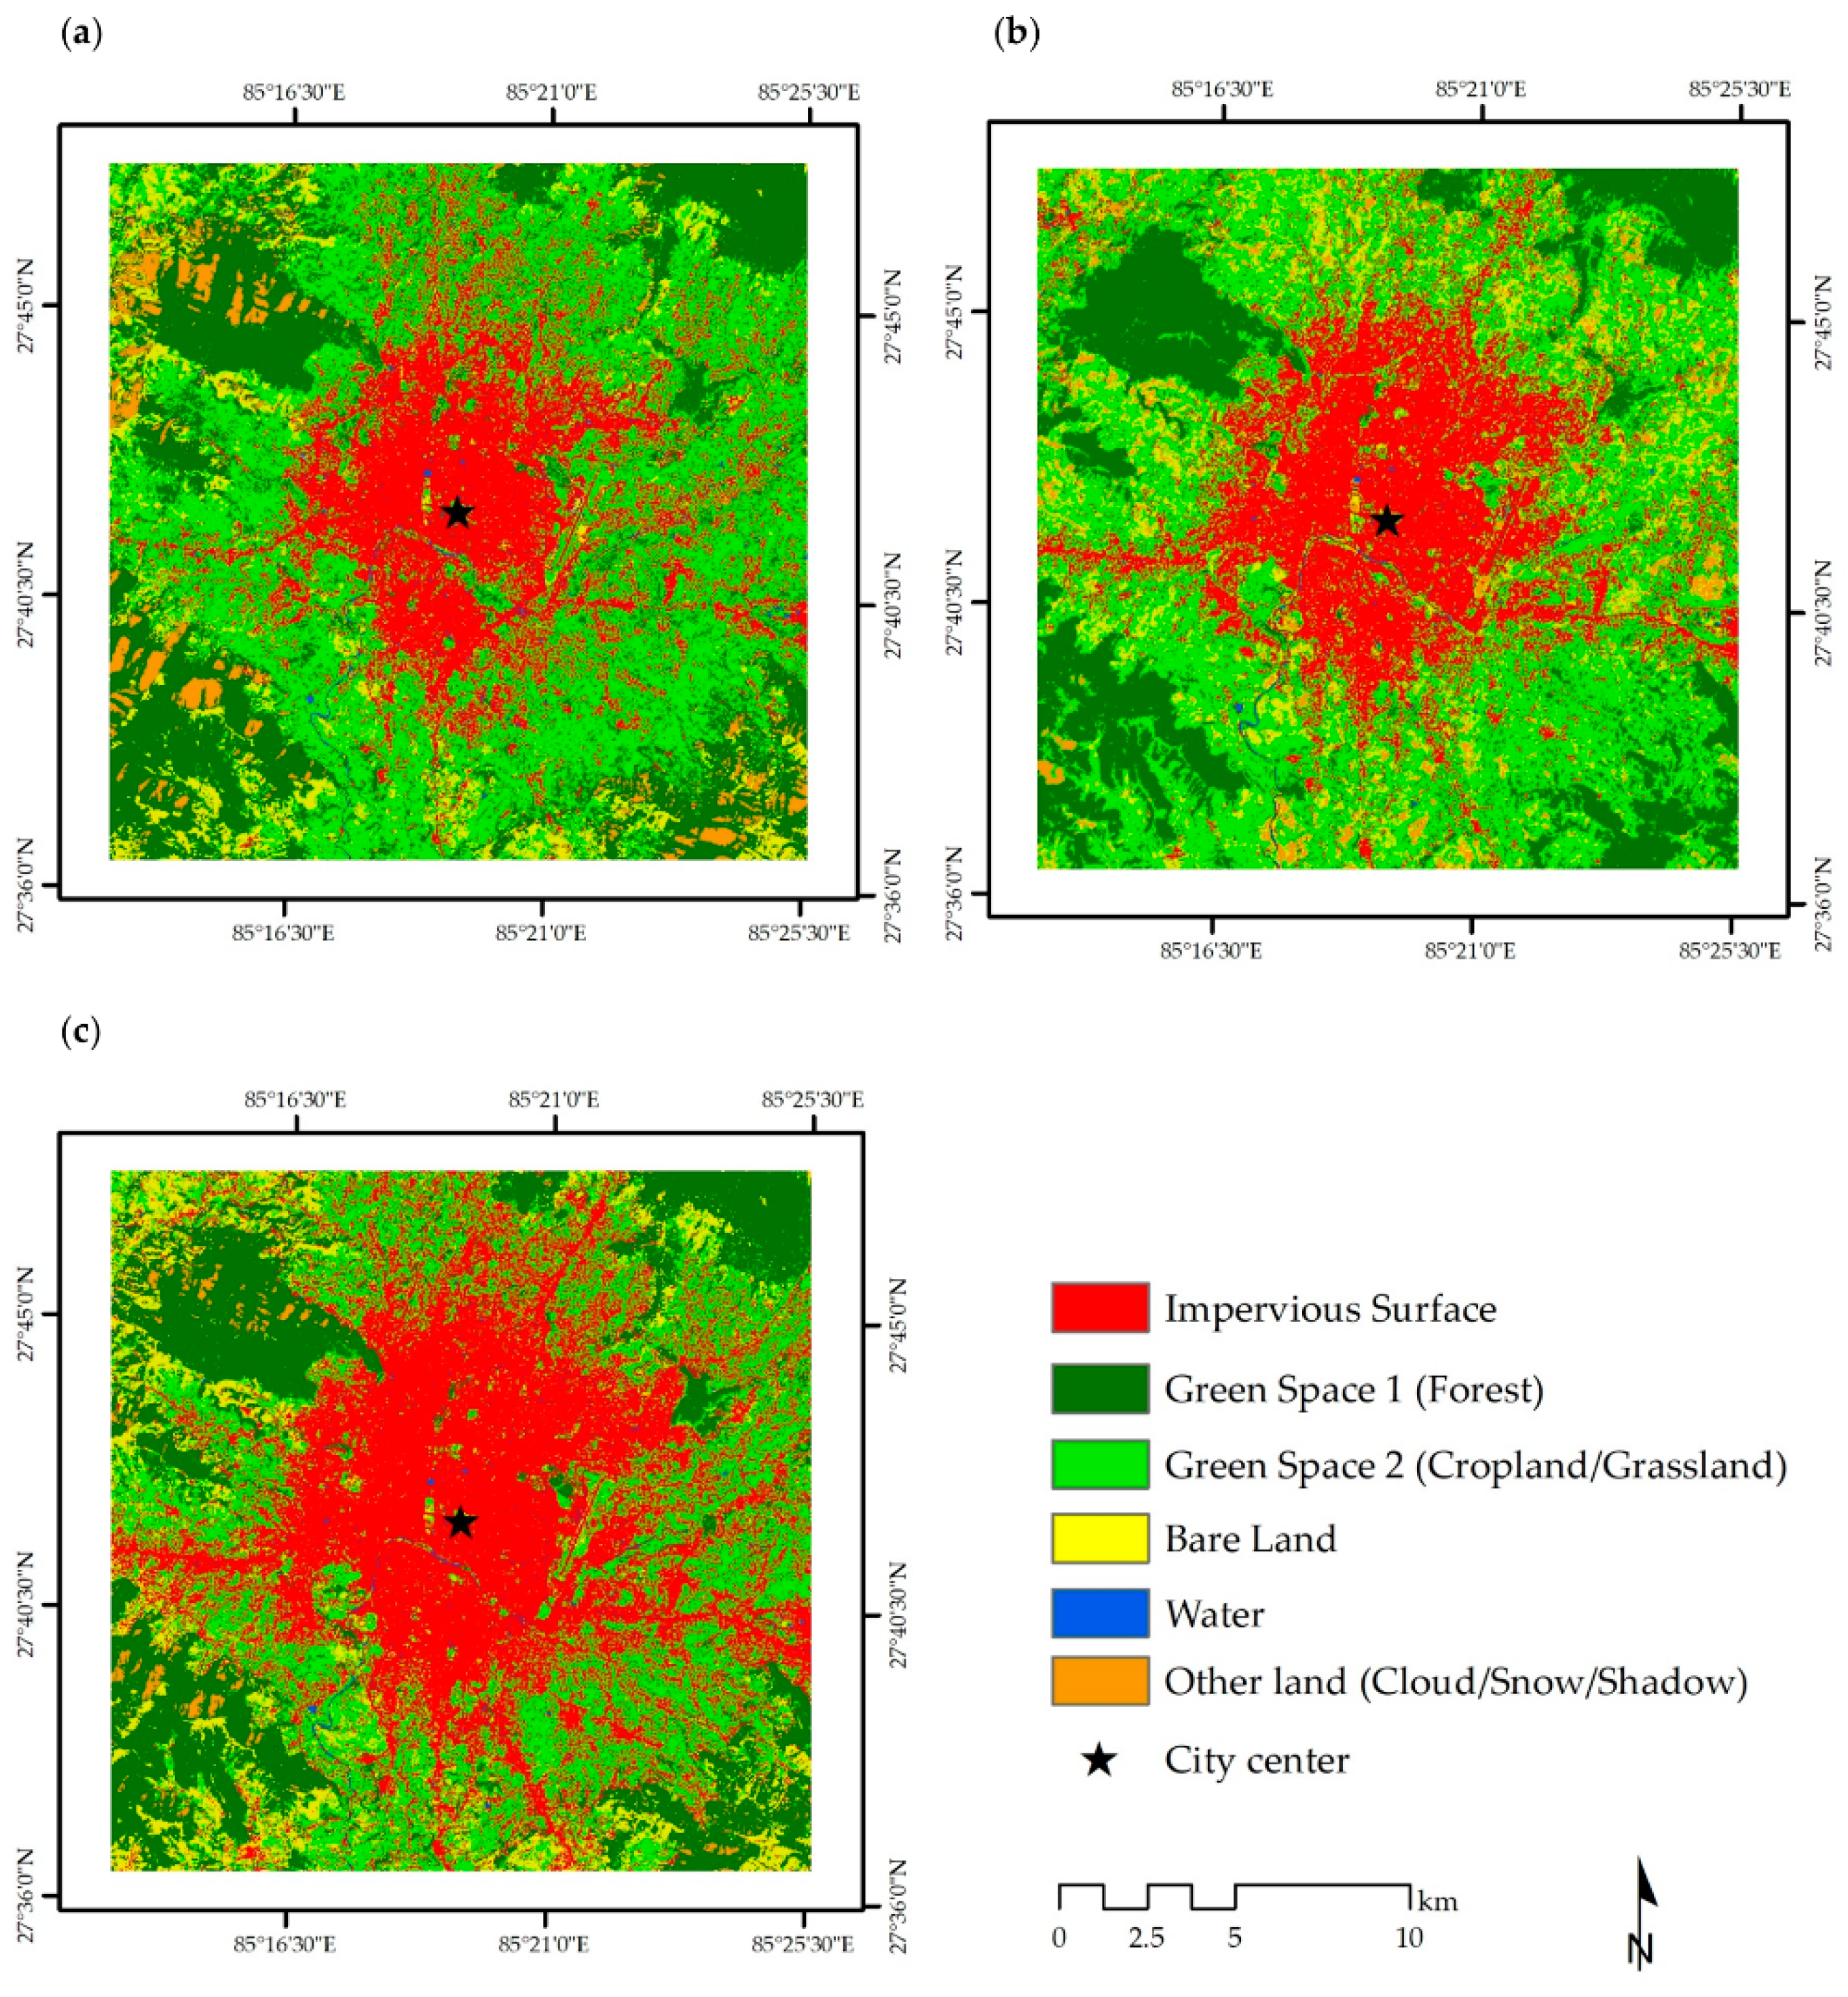
The overall accuracy of the classified LULC maps was greater than 85% (Appendix B). The classified LULC maps show that Kathmandu has undergone rapid urbanization over the last two decades (2000–2020) (Figure 2). The area of IS increased by 762 ha between 2000 and 2013, and it expanded by 4240 ha between 2013 and 2020, corresponding to a total of 5002 ha in the last 20 years (Table 2). In the visual interpretation, most of the IS area was accumulated in the central part of the study area in 2000, and it gradually increased in the outer area by 2020. The results show a total net loss of GS1 and GS2 recorded at 2807 ha and 2202 ha in the 20 years, respectively (Figure 2). We observed that most GS1 areas were located in the north-eastern, south-western, north-western, and south-eastern parts of the study area, and GS2 was mainly concentrated in the middle part of the study area.
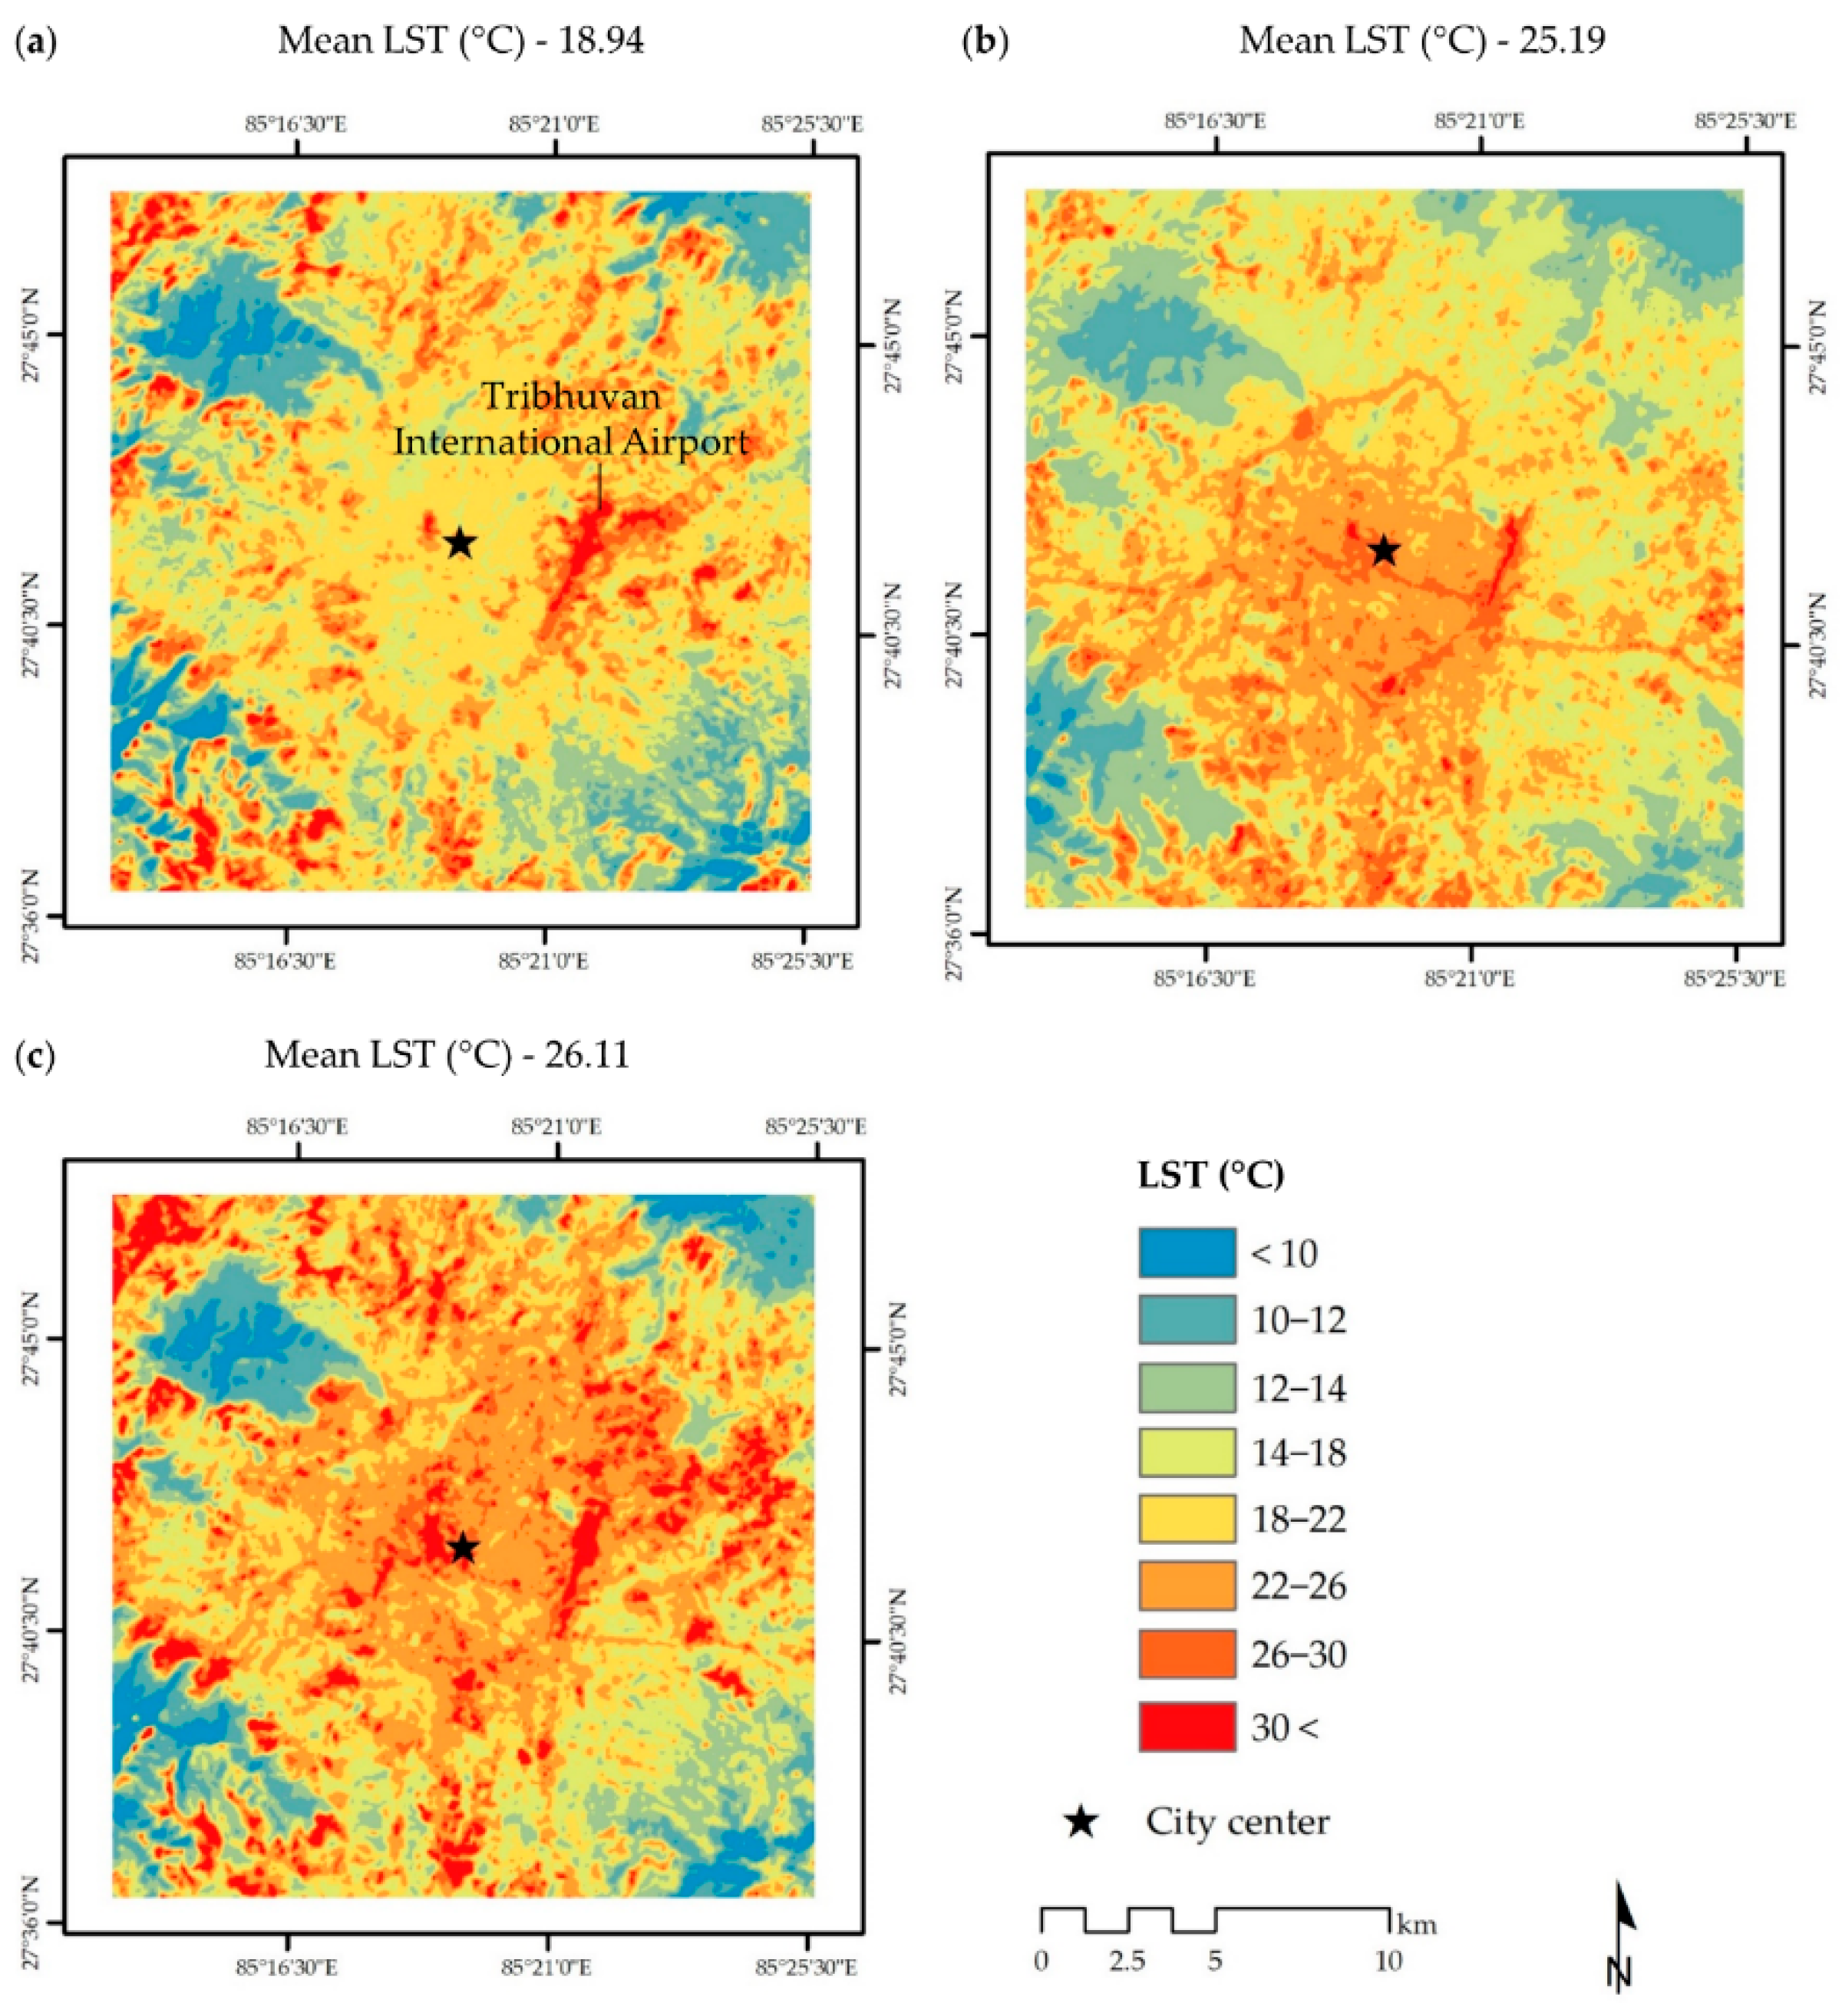
Figure 3 shows the LST distribution of Kathmandu City from 2000 to 2020. The mean LST in 2000 was 18.94 °C, and the LST was mainly concentrated in the central part, east, northeast, and the periphery of southern and north-western parts. In 2013, the mean LST was 25.19 °C and mainly accumulated in the central, south, and east parts. In 2020, the mean LST was 26.11 °C, and the overall higher LST was observed in the central, east, south, and north-western parts of the study area. In particular, we observed significantly higher LST values in the Tribhuvan International Airport in Kathmandu at each time point (mean LST was 25.11 °C in 2000, 27.43 °C in 2013, and 30.48 °C in 2020) (Figure 3).
Figure 4 shows the mean LST of each LULC category in Kathmandu. The results show that the mean LST of IS was 19.80°C in 2000, 26.52 °C in 2013, and 27.40 °C in 2020. The mean LST of GS 1 was recorded at 16.88 °C in 2000 and 22.39 °C in 2020, while GS2′s was 18.66 °C in 2000 and 24.68 °C in 2020, indicating a lower mean LST than the IS category at each time point. As mentioned before, the BL of the study area shows a relatively low area, and most areas were located in the periphery of the study area (Figure 2). The mean LST of BL was 21.49 °C in 2000, 25.82 °C in 2013, and 27.60 °C in 2020. The mean LST of the water category was recorded at 18.89 °C in 2020 and 20.03°C by 2020 over the study period.

3.2. Characteristics of RS-Based Spatial Parameters

3.2.1. Changes in NDVI, MNDWI, and NDBal

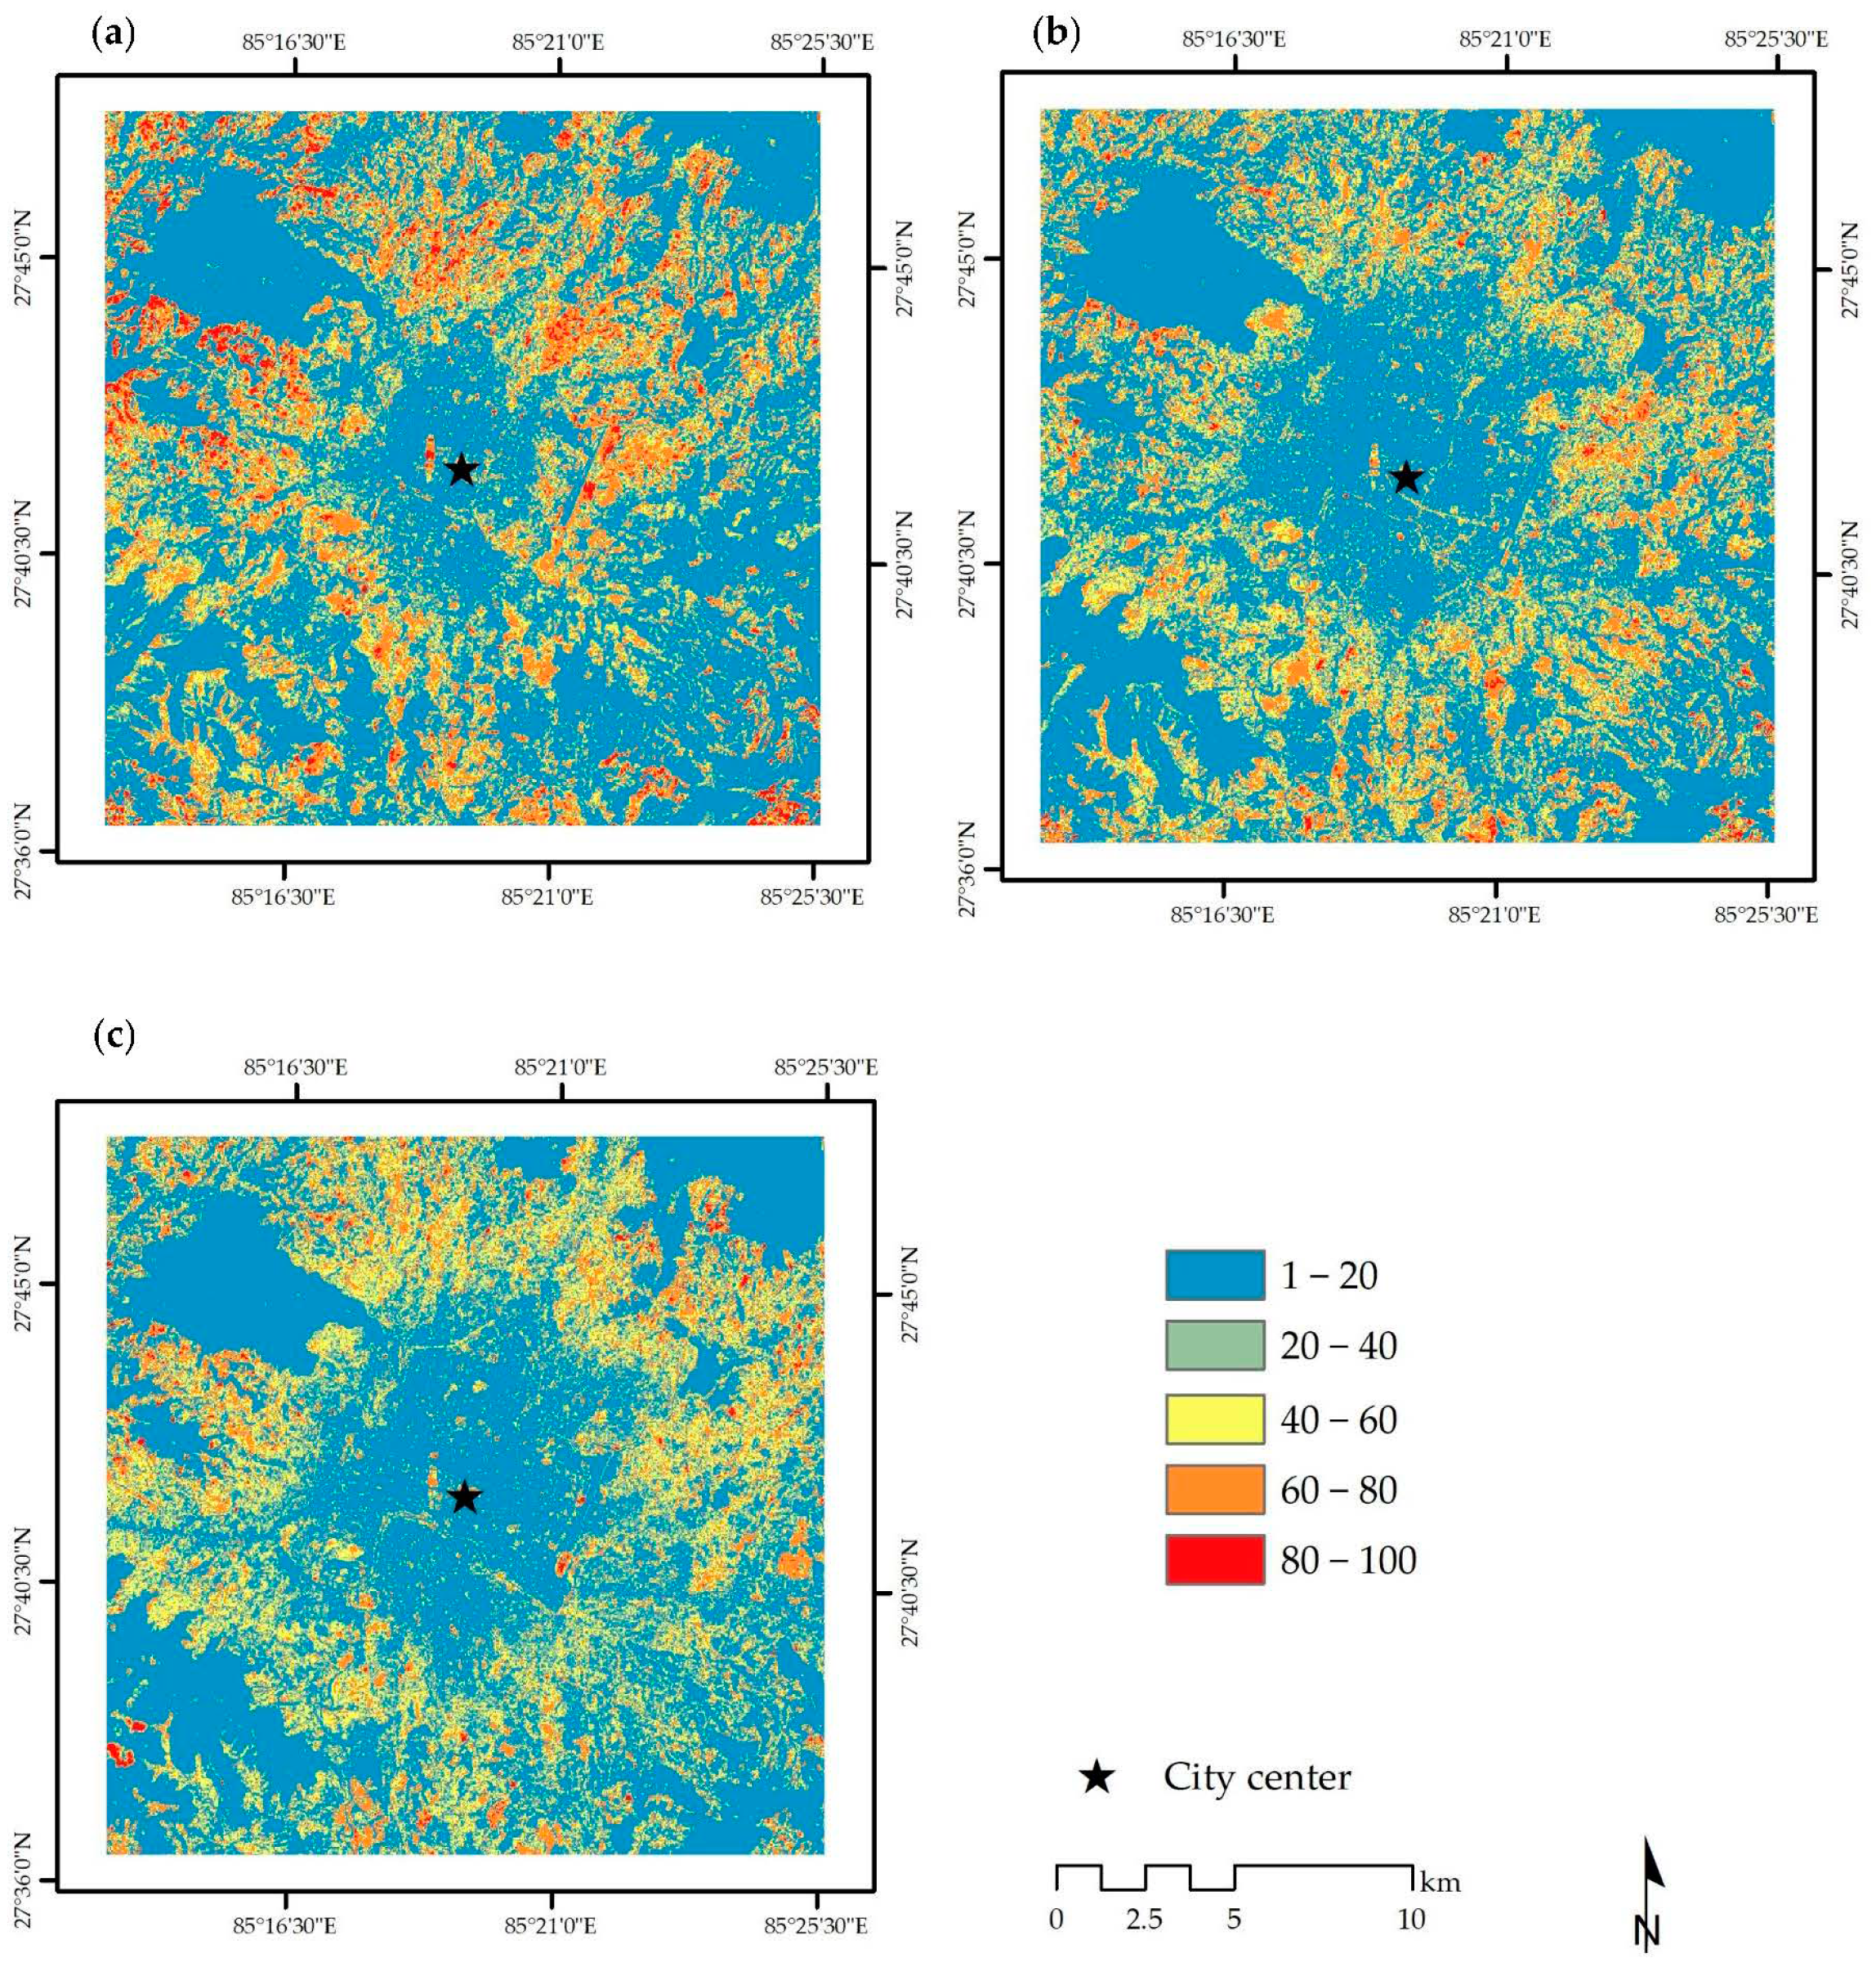
Figure 5 indicates the normalized difference vegetation index (NDVI) values in Kathmandu City in 2000, 2013, and 2020. High NDVI values were concentrated in the north-east, south-east, south-west, and north-west regions, while lower NDVI values were concentrated on a substantial portion of the study areas in 2000 and 2013. However, we observed lower NDVI values by 2020 compared to in the years 2000 and 2013, and NDVI in 2020 was mainly concentrated in the north-east, south-east, south-west, and north-west areas. The central part of Kathmandu showed lower NDVI values ranging from 1 to 20 during the study period.
Figure 6 reveals the modified normalized difference water index (MNDWI) of Kathmandu City in 2000, 2013, and 2020. The MNDWI is used extensively as the RS parameter in surface UHI studies. In 2000, higher values of MNDWI were recorded in the central, north-western, south, and south-eastern areas (Figure 6). The MNDWI was more apparent in the central, north-east, south-western, and north-east areas by 2013. Our results show the MNDWI concentration in the central part of the study area over three time points, with the effect of the Bhagmathi river basin and several tributaries (Bishnumati and Manamati) flowing through the central part of the study area. Most areas at the three time points show an MNDVI ranging between 1 and 20, indicating some water stress in the study area.
Figure 7 shows the normalized difference bareness index (NDBal) of Kathmandu in 2000, 2013, and 2020. According to the three maps (Figure 7), higher NDBal values were identified in the middle, north, east, south, and west parts of the study area. We observed that most of the NDBal values of Kathmandu were spread out and located as a ring away from and around the city center at the given time points, indicating rapid LULC change due to the urban process in the area. The three maps indicate that substantial-high NDBal values were located around the top of mountain areas compared to the city area, and the LULC maps (Figure 2) also corroborated this condition. Moreover, the three LST maps of Kathmandu show relatively high LST values related to the high NDBal around the top of mountain areas (Figure 3).

3.2.2. Relationship between Mean LST and RS-Based Parameters

The results show a relationship between the mean LST and RS-based parameters at a grid size of 210 × 210 m (Table 3). Overall, the MLR analysis results revealed that combining the RS-based parameters used in this analysis makes it possible to explain the significance of the parameters used in the mean LST during the study period. Moreover, each regression coefficient β of the RS-based parameters showed statistical significance (p < 0.001) at the three time points. For example, in 2000, the standardized regression coefficients showed that the mean NDBal had a significant positive correlation with the mean LST, indicating the heating power of the area. The mean NDVI, mean DEM, and mean MNDWI had a significant negative relationship with mean LST, indicating the cooling power of the area. In 2013 and 2020, the mean NDVI and mean elevation had the highest negative relationship with the mean LST. In contrast, the mean NDBal had the highest negative relationship with the mean LST in Kathmandu in 2013 and 2020. Our results indicate that the standardized regression coefficients between the mean NDVI, mean elevation, and mean MNDWI and the mean LST increased (negatively) during the study period. In contrast, the relationship between mean NDBal and mean LST increased in 2020; however, the mean NDBal in 2013 showed a lower value than that in the years 2000 and 2020.

3.3. Characteristics of Surface UHI in Kathamndu

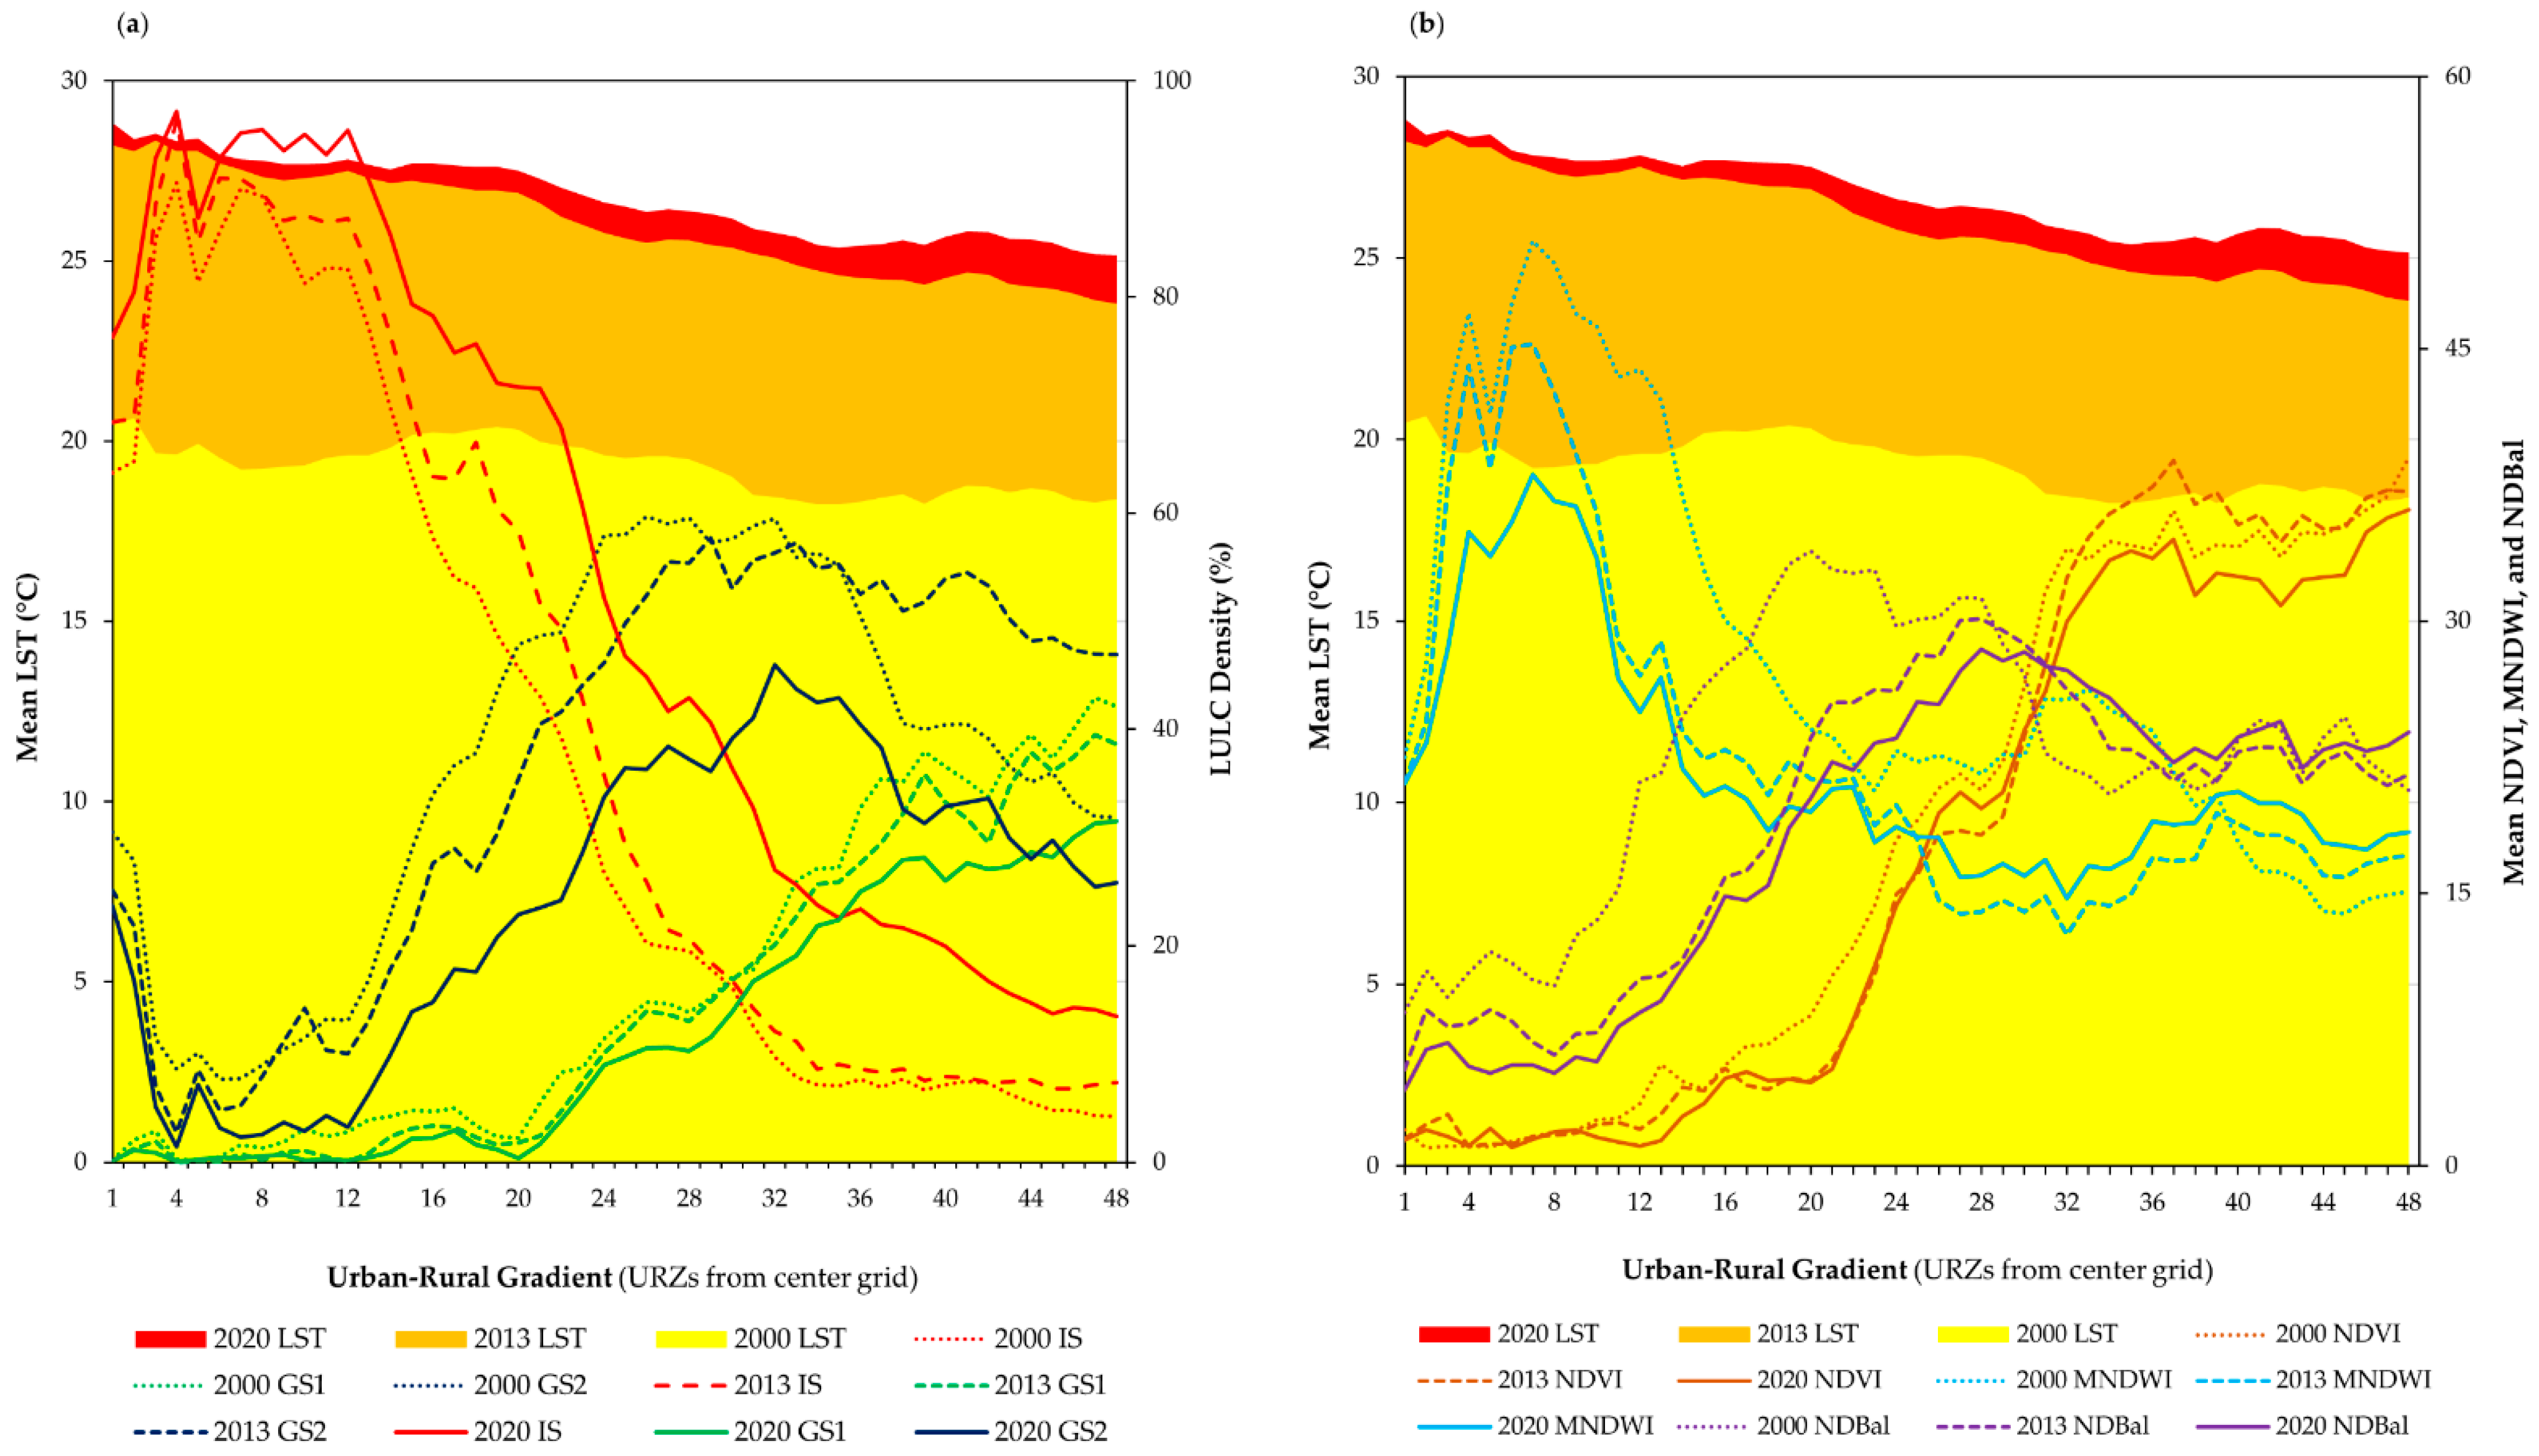
Our results reveal that the density of IS and the mean LST have regular characteristics (Figure 8a). The URZs near the central business district (CBD) exhibited the highest mean LST, which declined along the urban−rural gradient in 2000, 2013, and 2020 (Figure 8a). Conversely, the density of GS1 and GS2 indicates the lowest mean LST as being near the CBD. The density of GS1 and GS2 gradually increased from the CBD, corresponding to a large part of the rural area in the study period (Figure 8a). The density of IS increased from the center to URZ4, and a quick drop was identified from URZ4 to URZ5. This drop exhibited an ascending trend from URZ5 to URZ9, which continued until URZ12 with small fluctuations (Figure 8a). From URZ12 to URZ48, the density of IS showed a decreasing trend that is compatible with the mean LST at the three time points.
In contrast, the density of GS2 had a higher value than that of GS1 around the city center at the three time points, and it gradually declined until URZ4. From URZ4 to URZ6, the density of GS2 increased until URZ6, before again declining between URZ6 and URZ12, apart from in 2013. By 2020, the density of GS2 showed an increasing trend until URZ33, and then decreased until URZ48, indicating changes in the urban structure in the suburbs (Figure 2). The density of GS1 decreased from the center grid to URZ20, indicating that urban pressure in Kathmandu was reflected from the CBD to the suburbs. We observed that from URZ20 to URZ48, the density of GS1 increased across the three time points. Moreover, we found that the density of GS2 was higher from URZ12 to URZ42 than that of GS1, showing a significant impact on mean LST in Kathmandu (see mean LST values in each LULC at three time points) (Figure 8a).
The mean NDVI did not reveal the highest mean LST to be in the CBD. Our results revealed that the mean MNDWI had higher values near the urban core area than the mean NDVI and NDBal values because the area flourished in rivers and sub-waterways. The mean MNDWI value showed an increasing trend from the center grid to URZ8, with some fluctuations, and it gradually declined along the urban-rural gradient during the study period. We observed that the mean MNDWI values increased from URZ25 to URZ48 compared to 2013, indicating enhanced green cover (forest, cropland, and grassland) in the urban-rural transition area and the rural area in comparison to the LULC maps of the study area (Figure 2). The decrease in the mean NDVI reported around the city core area indicated rapid urban growth in the central part of Kathmandu and an abundance in the urban fringe (Figure 8b). The results revealed that mean NDVI values increased gradually from URZ29 to URZ48, indicating a greater cooling effect in these zones.
The mean NDBal of the study area showed an increasing trend until URZ26 and declined from that point until the final zone, with few fluctuations. However, we observed a slight increase in the mean NDBal between URZ25 and URZ29 (Figure 7 and Figure 8b), indicating that the BL was mostly located between the hinterland and the peripheral in the study area in 2020 (Figure 2). We observed an increase in NDBal from URZ32 to URZ48 in 2020 compared to in 2013. This enhancement may have been due to the urbanization process near hill areas and increased deforestation activities in this area, because the density of the GS1 also decreased in this area (Figure 2 and Figure 8a).
On the basis of the differences between Figure 8a,b, it can be concluded that the density of GS1 and GS2 decreased over the three time points. This pattern corresponds to the mean NDVI, MNDWI, and NDBal from URZ1 to URZ48, URZ25, and URZ31, respectively, indicating the urbanization characteristics (i.e., the density of IS) in the area influenced the formation of UHI in the area.

3.4. LULC Composition and Pattern vs. Mean LST in Kathmandu

The results indicate that IS, GS1, and GS2 had a significant relationship with mean LST in Kathmandu in 2000, 2013, and 2020 (Table 4). The correlation coefficients of IS showed a positive relationship with mean LST during the study period. Conversely, GS1 and GS2 had a negative relationship with mean LST during the study period. The values of the five IS metrics revealed the rapid expansion of IS in Kathmandu. These results correspond to our classified LULC maps for the area (Figure 2). The Area_MN, LPI, and COHESION of GS2 had a negative relationship at the three time points. The PD and PLAND of GS1 possessed lower values in 2013, but higher values in 2020. The AREA_MN, PD, LPI, and PLAND of GS2 had a negative relationship with mean LST in Kathmandu. All values were statistically significant (p < 0.001).
Overall, five matrices—AREA_MN, PD, LPI, PLAND, and COHESION, and IS, GS1, and GS2—have a confirmed potential influence on the mean LST in the temperate mountain valley city of Kathmandu. A growing body of literature indicates that widespread patches of green space can promote a cooling effect compared to the small and scattered patches of green space. We observed widespread IS patches in Kathmandu to promote the surface UHI effect. However, small and scattered patches of IS promoted a relatively lower surface UHI effect in Kathmandu.

4. Discussion

4.1. Change in Urban Structure in Kathmandu

To investigate the effect on surface UHI of urban expansion and green space distribution in Kathmandu, this study tried various approaches, including machine learning techniques, remote sensing (RS)-based parameter analysis, urban-rural gradient analysis, and spatial composition and pattern analysis. Here, we offer sustainable landscape and urban planning strategies for use by city planners and policymakers in Kathmandu to mitigate the UHI effect and improve the quality of life of city dwellers.
Our results provide strong evidence of the rapid urban growth in Kathmandu, Nepal, showing an exponential expansion of IS over a time span of 20 years (from 2000 to 2020) (Figure 2). Some studies have shown that the Kathmandu Valley is the most densely populated area, the major economic core, and one of the fastest-blooming urban agglomerations in South Asia [69,70]. This city is critical, because Kathmandu is a mountain valley city with unique geophysical characteristics in a land-locked country that has no land connected to an ocean or coastlines [71]. Kathmandu’s urbanization has primarily been driven by religion, tourism, and the city’s pleasant cool climate [72,73]. The population of Kathmandu City was 2.5 million in 2016, and is expected to increase rapidly with these impacts and drivers [52,71,72,73,74,75,76,77,78,79]. These results reveal that IS has rapidly encroached in the east, north, south, and west with increasing population and infrastructure from the urban core to the suburbs (Figure 2). This condition indicates that the central part of the Kathmandu Valley and its neighborhoods are critical determinants of its urban development.

4.2. Linking Surface SUHI Formation with LULC

In this study, we derived three remote sensing-based LST maps for 2000, 2013, and 2020, and the mean LST of Kathmandu was 18.94 °C in 2000, 25.19 °C in 2013, and 26.11 °C in 2020 (Figure 3). However, we discovered that the LST values at the three time points not only closely corresponded to LULC, but those other environmental variables, such as surface moisture, humidity, solar radiation, wind speed, precipitation, and anthropogenic heat release, may not have been temporally stable across the three time points when the thermal images were acquired.
Hence, our research focused on the temporal fluctuations of surface UHI in Kathmandu. Here, two factors are considered, i.e., surface UHI and the density of LULC difference between climate zones (between LULC categories and URZs) during the study period. This approach enables the comparison of surface urban heat intensities in Kathmandu from 2000 to 2020. The results revealed the increasing trend of surface UHI intensity between 2000 and 2020. We found that the surface UHI intensity between GS2 and GS1 increased by 1.37 °C during the study period. Considering the urban-rural gradient, an average increase in surface UHI intensity between 2000 and 2020 based on URZ1 (urban zone with the highest IS density at the three time points) and the rural zone (the first URZ with <15% IS density) generated a higher value, at 3.89 °C. Therefore, the underlying mechanisms of the increased surface UHI intensity in Kathmandu need to be understood in order to achieve sustainable city planning.
In 2000 and 2013, the proportions of the study area accounted for by IS in Kathmandu were 21.74% and 23.65%, respectively. However, during the period between 2013 and 2020, the proportion of IS was 34.25%, an increase of 10.6% compared to the 2000–2013 period. Several studies have discovered that the surface UHI intensity is positively correlated with city size [9,11,80,81,82]. Therefore, we selected a 10 km buffer to restrict the study area. We discovered that the increasing trend of surface UHI intensity in Kathmandu had been impacted by changes in the natural landscape caused by rapid urban processes arising from the considerable expansion of IS and the visible degradation of green space in the area. The natural landscape change from GS1 (forest) to GS2 (cropland/grassland) cannot be neglected, because the mean LST difference between GS2 and GS1 shows an increasing trend, as mentioned before, and this can enhance the surface UHI effect in the area. Urban landscape transformation also influences changes in the values of the RS-based parameters (NDVI, MNDWI, and NDBal) considered in this study. Therefore, future urban planning should pay more attention to this condition.
Our study found a high surface UHI value near Tribhuvan International Airport at three time points, with increasing intensity between 2000 and 2020 (Figure 3). We gave more attention to this area because the airport is the most critical place for the country from a socio-economic perspective. The results revealed that GS2 and GS1 near the airport area had declined with the rapid expansion of IS (sub-urbanization), promoting more surface UHI in this vicinity. Therefore, urban planners should pay more attention to reducing LST by means of possible and practical treatments in this area.
Along the urban-rural gradient, we observed a slightly decreased IS density between URZ4 and URZ7 and an improved GS2 density in the same area. However, the decline in IS density and increase in GS2 density did not fully correspond to the mean LST in this region (see Figure 8a). As mentioned above, the MNDWI in the URZs exhibited lower values, and NDBal showed relatively high values in these URZs. This effect might have enhanced the mean LST in these URZs. Previous studies have reported similar findings [16,18]. For instance, XIAO et al. (2007) revealed that surface UHI was not most pronounced in the CBD. Rather, it was located in the south of the central city near the 4th ring road and the dry Yongding river in the south-western part of the city, which is the biggest area of bare land in Beijing, China [83]. Estoque and Murayama studied the impact of landscape composition and pattern on land surface temperature in the three megacities of Southeast Asia [17]. They identified a significant correlation between land use categories and mean LST changes along the urban-rural gradient in Bangkok, Jakarta, and Manila. Athukorala and Murayama discovered a strong relationship between LULC density and tasseled cap transformation (TCT) and the mean LST change in the sub-Saharan city of Accra, Ghana [18]. They found that GS2 (cropland and grassland) positively contributes to enhancing surface UHI by combining the effects of the bareness index in the sub-Saharan climate.

4.3. Effect of Landscape Composition and Pattern on Surface UHI Formation

Our study shows that the five spatial metrics were significantly correlated with the mean LST in Kathmandu (the density of IS (positive) in 2000, 2013, and 2020, and the density of GS1 and GS2 (negative)) (Table 4). These findings are similar to other studies by Estoque et al. (2017) [17], Myint et al. (2013) [84], Hou and Estoque (2020) [32], Zhou et al. (2011) [66], Athukorala and Murayama (2021) [16], and Zhou et al. (2017) [85]. They revealed that the AREA_MN, PD, LPI, PLAND, and COHESION of IS and GS significantly correlate with the mean LST. However, data information, including the magnitude, significance, and angle of the influence, differed between our findings and those of prior studies. It is important to note that rapid urban growth changes natural environments into the IS, receiving more solar energy and little reflected solar radiation [16,86]. In that context, LST affects urban thermal environmental change and modifies environmental factors (humidity, evapotranspiration, and energy balance) in the urban area, influencing human health and thermal comfort.
Generally, vegetation and shadow help to reduce the surface temperature [16,87,88,89]. In Kathmandu, we observed that forest cover, high-rise building shadow, and mountain shadow mitigate surface UHI in certain areas. However, the position of this shadow effect varies with earth rotation and time. For example, many studies have investigated the surface UHI effect using Landsat data [13,17,89]. The local time of data capture was during the morning. The solar incidence angle (the angle between solar rays and the vertical direction) produces the evapotranspiration and shadow effects. However, the magnitude, location, and surface covering of areas with these effects should be fully considered for urban planning, especially the relationship between the effects of shadow and earth rotation.
Geophysically, Kathmandu City is located in a mountain valley and one of the country’s major river basins (the Bagmati river basin). Urban planners should pay more attention to these factors with respect to urban planning. Landscape composition and pattern analysis can fill this gap and provide more insights for urban planners [8,66,85,90,91]. Generally, large patches of IS produce more surface UHI, and relatively small patches have a lower surface UHI effect. On the other hand, large GS patches have a more cooling effect, and small patches have less of a cooling effect. Our study reveals that enlarged and continuous patches of GS1 (forest) and GS2 (cropland/grassland) generate a more significant cooling effect in rural areas (Shanti Danda, Chonga Ganesh temple area, Hanumante river area, Gokarna, Chanautipato, Coronation garden, Chhanui military barracks, Swayambhunath, and Shoyembhu areas) than in urban core areas. Similar results have been reported in Bangkok, Jakarta, Manila, Accra, greater Cairo, and Baguio [13,16,17,18]. However, the magnitude of the cooling effect of GS1 is higher than GS2 in Kathmandu. We discovered that the complex shape of the forest and cropland/grassland was more active in cooling LST in Kathmandu. Zhou et al. (2017) [85] revealed the same conditions in Sacramento, but in Baltimore, a simple tree crown with a small margin in the same area performed better in terms of cooling effect. Such differences have emerged in the literature between study areas with different climatic conditions. Therefore, the relationship between landscape metrics and LST should be thoroughly considered in order to achieve sustainable city planning.
Overall, for Kathmandu, it is suggested to plant suitable trees or set waterways and protect the existing tributaries (we observed that some sub-water channels were dispersed around the city core area during the study period) near roads and buildings to decrease the surrounding surface UHI. Athukorala and Murayama (2021) [16] revealed that rooftop greening provided a practical cooling effect during both daytime and nighttime in greater Cairo, Egypt. In this respect, Kathmandu is a bowl-shaped city, and reducing surface UHI remains a challenge. Moreover, the lessons learned from rooftop agriculture and vegetation in greater Cairo, Egypt [16] provide a more efficient approach to mitigating the surface UHI effect. Therefore, urban planners could rearrange the green space (trees) in Kathmandu to create adjoining patches, maximizing their cooling ability.

4.4. Implication for Surface UHI Mitigation and Urban Climate Adaptation

Kathmandu has been Nepal’s largest urban agglomeration, industrial center, and socio-economic and tourist hub in recent decades [52,71,72], during which period the extensive natural and semi-natural landscape was rapidly transformed into IS. Many researchers across the world have recently focused their attention on the relationship between the significant loss of urban green space and the increasing surface UHI effect [13,17,66]. Our findings revealed that the tremendous growth of IS and the decline of green space made the surface UHI effect more pronounced in downtown Kathmandu. Many urban agglomerations are rapidly approaching mitigation and climatic adaption to the surface UHI effect by means of sustainable city planning [8,16,17]. The growing literature shows that efficiently distributed vertical greenery [92,93,94], such as rooftop vegetation and green walls [16,95,96], makes a reliable contribution to reducing surface UHI and heat fluxes by means of moist and shading facades, thus facilitating human thermal comfort.
According to the visual interpretation, the IS in the 2000 map shows relatively high fragmentation compared to the IS in the 2020 map. However, the actual situation is that the IS in 2020 is more fragmented than the IS presented in the 2000 map because of urban development with high buildings and rapid urban structure change, resulting in greater fragmentation of IS in Kathmandu by 2020. This condition also substantially affected the increase in surface UHI in Kathmandu. In this context, the implementation of rooftop solar photovoltaic systems (SPVSs) has provided roof cover and improved indoor thermal conditions by minimizing extreme heatwaves in the urban core area [97,98,99]. Our results reveal that the urban areas in Kathmandu have expanded from the CBD to the urban periphery and suburban areas.
Urban agglomerations can effectively produce a positive cooling effect by optimizing the green space [17]. The cooling effects of PD, PLAND, COHESION, and LPI values on surface UHI were exceptional and robust in Kathmandu. Therefore, it is critical to ensure sufficient size and consistency of green space when planning green landscapes to achieve maximum surface UHI cooling by improving the interconnection between patches [16], such as establishing urban parks and green corridors and decreasing the extent of patches [100].
In response to the formation of surface UHI in Kathmandu from 2000 to 2020, we propose that Kathmandu’s urban core should be filled in with green patches with high population density and aggregated urban land, and that more green infrastructure networks, in connection with topographic features and roads, should be planned, thus further promoting cooling conditions in the urban area. Moreover, as explained previously, urban planners in Kathmandu should pay a great deal of attention to the Tribhuvan International Airport area, enhancing greenery around the airport vicinity. The link between the GS and RS parameters indicates that vegetation and blue infrastructure should be connected at micro and macro levels. Similar results and implementations have been reported in previous studies [18,101]. To reduce the heatwave effect on urban city dwellers, urban designers and planners should understand the characteristics of rapid urban growth structure change at various development levels and logically composite patterns of urban green spaces and anthropogenic activities.

5. Conclusions

This study assessed the surface UHI and related it to the LULC composition and pattern in the temperate mountain valley city of Kathmandu, Nepal, from 2000 to 2020, using Landsat images. The study area experienced rapid urban development during the study period. This indicates a substantial expansion of impervious surfaces and loss of green space in Kathmandu, and the surface UHI phenomenon is remarkable in the city. Our results revealed a significant relationship between the mean LST and urban expansion (impervious surface and green space change). The mean LST, mean NDVI, mean MNDWI, mean NDBal, and elevation were critical spatial parameters for deriving the surface UHI in the study area (the statistical relationships were R2 = 0.695 in 2000, R2 = 0.781 in 2013, and R2 = 0.729 in 2020). On the basis of various geospatial methods, this study provides valuable practical approaches for sustainable urban planning and design in Kathmandu. The results show that the surface UHI in Kathmandu has increasing characteristics. The LULC has exhibited a drastic change in Kathmandu during the past 20 years, and the city core indicated the promotion of surface UHI due to the high density of IS.
In contrast, other land covers (GS1, GS2, W, and OL) had lower surface UHI, with the exception of the bare land category. The urban periphery showed the expansion of the city into more rural areas; these land changes enhanced the surface UHI in the urban fringe. GS1 and GS2 gradually decreased in the urban core areas during the study period, showing more fragmentation and reducing the patch size gap, resulting in a reduced cooling effect in the city core. Based on the above-mentioned conclusions, in order to control the further strengthening of surface UHI, protecting vegetation cover and the urban river system, it may be helpful to increase river basin sustainability (Bagmati river basin) and enhance the ecological characteristics of urban greenery, thus mitigating and adapting to the surface UHI effect in Kathmandu in the future.

Author Contributions

S.K. and D.A. conducted the research, performed the analysis, and wrote the paper. Y.M. and T.M. provided research supervision. All authors have read and agreed to the published version of the manuscript.

Funding

This research was partly supported by the Japan Society for the Promotion of Science (JSPS) grants of 21K01027 and 18H00763.

Data Availability Statement

All data generated and analyzed in this study are included in the published article.

Conflicts of Interest

The authors declare no conflict of interest.

Appendix A

Figure A1. Urban–rural gradient. Grid order from city center to outer (i.e., URZ1, URZ2, URZ3, …, URZ48). Background image (Landsat 8, 11 April 2020 image, false color band composite bands 6, 4, and 2).
Remotesensing 14 04047 g0a1

Appendix B

Table A1. Confusion matrices of the classified LULC maps of this study.
LULC CategoryReference DataTotalUser’s
Accuracy (%)
ISGS 1GS 2BLWOL
2000
IS981451211188.29
GS 1396314611384.96
GS 2168921210188.12
BL30379018691.86
W13228119090.00
OL14145849984.85
Total107110102939296600
Producer’s accuracy (%)91.5987.2787.2584.9588.0487.50
Overall accuracy (%) = 87.83
2013
IS1032343111688.79
GS 127923369583.16
GS 2339855211684.48
BL32184259786.60
W11437248584.71
OL43323769183.52
Total116901111018894600
Producer’s accuracy (%)88.7987.7888.2983.1781.8280.85
Overall accuracy (%) = 85.33
2020
IS934251310886.11
GS 138411329489.36
GS 2129632410888.89
BL134873310186.14
W25217959484.04
OL31142849588.42
Total1039910610190101600
Producer’s accuracy (%)90.2984.8590.5786.1487.7883.17
Overall accuracy (%) = 87.16
Note: impervious surface (IS), green space 1 (GS1), green space 2 (GS2), bare land (BL), water (W), and other land (OL).

References

  1. Dewan, A.M.; Yamaguchi, Y. Land use and land cover change in Greater Dhaka, Bangladesh: Using remote sensing to promote sustainable urbanization. Appl. Geogr. 2009, 29, 390–401. [Google Scholar] [CrossRef]
  2. Athukorala, D.; Estoque, R.C.; Murayama, Y.; Matsushita, B. Ecosystem services monitoring in the Muthurajawela Marsh and Negombo lagoon, Sri Lanka, for sustainable landscape planning. Sustainability 2021, 13, 11463. [Google Scholar] [CrossRef]
  3. Athukorala, D.; Estoque, R.C.; Murayama, Y.; Matsushita, B. Impacts of urbanization on the Muthurajawela Marsh and Negombo Lagoon, Sri Lanka: Implications for landscape planning towards a sustainable urban wetland ecosystem. Remote Sens. 2021, 13, 316. [Google Scholar] [CrossRef]
  4. Huang, R.J.; Zhang, Y.; Bozzetti, C.; Ho, K.F.; Cao, J.J.; Han, Y.; Daellenbach, K.R.; Slowik, J.G.; Platt, S.M.; Canonaco, F.; et al. High secondary aerosol contribution to particulate pollution during haze events in China. Nature 2015, 514, 218–222. [Google Scholar] [CrossRef]
  5. Rizwan, A.M.; Dennis, L.Y.C.; Liu, C. A review on the generation, determination and mitigation of Urban Heat Island. J. Environ. Sci. 2008, 20, 120–128. [Google Scholar] [CrossRef]
  6. Kifle, A.B.; Mengistu, T.G.; Stoffberg, G.H.; Tadesse, T. Climate change and population growth impacts on surface water supply and demand of Addis Ababa, Ethiopia. Clim. Risk Manag. 2017, 18, 21–33. [Google Scholar] [CrossRef]
  7. Kalnay, E.; Cai, M. Impact of urbanization and land-use change on climate. Nature 2003, 425, 102. [Google Scholar] [CrossRef]
  8. Li, J.; Song, C.; Cao, L.; Zhu, F.; Meng, X.; Wu, J. Impacts of landscape structure on surface urban heat islands: A case study of Shanghai, China. Remote Sens. Environ. 2011, 115, 3249–3263. [Google Scholar] [CrossRef]
  9. Imhoff, M.L.; Zhang, P.; Wolfe, R.E.; Bounoua, L. Remote sensing of the urban heat island effect across biomes in the continental USA. Remote Sens. Environ. 2010, 114, 504–513. [Google Scholar] [CrossRef]
  10. Yuan, F.; Bauer, M.E. Comparison of impervious surface area and normalized difference vegetation index as indicators of surface urban heat island effects in Landsat imagery. Remote Sens. Environ. 2007, 106, 375–386. [Google Scholar] [CrossRef]
  11. Chen, X.L.; Zhao, H.M.; Li, P.X.; Yin, Z.Y. Remote sensing image-based analysis of the relationship between urban heat island and land use/cover changes. Remote Sens. Environ. 2006, 104, 133–146. [Google Scholar] [CrossRef]
  12. Estoque, R.C.; Murayama, Y. Landscape pattern and ecosystem service value changes: Implications for environmental sustainability planning for the rapidly urbanizing summer capital of the Philippines. Landsc. Urban Plan. 2013, 116, 60–72. [Google Scholar] [CrossRef]
  13. Estoque, R.C.; Murayama, Y. Monitoring surface urban heat island formation in a tropical mountain city using Landsat data (1987–2015). ISPRS J. Photogramm. Remote Sens. 2017, 133, 18–29. [Google Scholar] [CrossRef]
  14. Santamouris, M. Cooling the cities—A review of reflective and green roof mitigation technologies to fight heat island and improve comfort in urban environments. Sol. Energy 2014, 103, 682–703. [Google Scholar] [CrossRef]
  15. Luber, G.; McGeehin, M. Climate Change and Extreme Heat Events. Am. J. Prev. Med. 2008, 35, 429–435. [Google Scholar] [CrossRef]
  16. Athukorala, D.; Murayama, Y. Urban heat island formation in Greater Cairo: Spatio-temporal analysis of daytime and nighttime land surface temperatures along the urban-rural gradient. Remote Sens. 2021, 13, 1396. [Google Scholar] [CrossRef]
  17. Estoque, R.C.; Murayama, Y.; Myint, S.W. Effects of landscape composition and pattern on land surface temperature: An urban heat island study in the megacities of Southeast Asia. Sci. Total Environ. 2017, 577, 349–359. [Google Scholar] [CrossRef]
  18. Athukorala, D.; Murayama, Y. Spatial Variation of Land Use / Cover Composition and Impact on Surface Urban Heat Island in a Tropical Sub-Saharan City of Accra, Ghana. Sustainability 2020, 12, 7953. [Google Scholar] [CrossRef]
  19. Stewart, I.D.; Oke, T.R. Local climate zones for urban temperature studies. Bull. Am. Meteorol. Soc. 2012, 93, 1879–1900. [Google Scholar] [CrossRef]
  20. Stewart, I.D.; Oke, T.R.; Krayenhoff, E.S. Evaluation of the “local climate zone” scheme using temperature observations and model simulations. Int. J. Climatol. 2014, 34, 1062–1080. [Google Scholar] [CrossRef]
  21. Emery, J.; Pohl, B.; Crétat, J.; Richard, Y.; Pergaud, J.; Rega, M.; Zito, S.; Dudek, J.; Vairet, T.; Joly, D.; et al. How local climate zones influence urban air temperature: Measurements by bicycle in Dijon, France. Urban Clim. 2021, 40, 101017. [Google Scholar] [CrossRef]
  22. Leconte, F.; Bouyer, J.; Claverie, R.; Pétrissans, M. Using Local Climate Zone scheme for UHI assessment: Evaluation of the method using mobile measurements. Build. Environ. 2015, 83, 39–49. [Google Scholar] [CrossRef]
  23. Ibrahim, G.R.F. Urban land use land cover changes and their effect on land surface temperature: Case study using Dohuk City in the Kurdistan Region of Iraq. Climate 2017, 5, 13. [Google Scholar] [CrossRef]
  24. Bokaie, M.; Zarkesh, M.K.; Arasteh, P.D.; Hosseini, A. Assessment of Urban Heat Island based on the relationship between land surface temperature and Land Use/ Land Cover in Tehran. Sustain. Cities Soc. 2016, 23, 94–104. [Google Scholar] [CrossRef]
  25. Derdouri, A.; Wang, R.; Murayama, Y.; Osaragi, T. Understanding the links between lulc changes and suhi in cities: Insights from two-decadal studies (2001–2020). Remote Sens. 2021, 13, 3654. [Google Scholar] [CrossRef]
  26. Jiang, Y.; Fu, P.; Weng, Q. Assessing the impacts of urbanization-associated land use/cover change on land surface temperature and surface moisture: A case study in the midwestern united states. Remote Sens. 2015, 7, 4880–4898. [Google Scholar] [CrossRef]
  27. Yan, Z.; Zhou, D.; Li, Y.; Zhang, L. An integrated assessment on the warming effects of urbanization and agriculture in highly developed urban agglomerations of China. Sci. Total Environ. 2022, 804, 150119. [Google Scholar] [CrossRef]
  28. Park, J.; Kim, J.H.; Lee, D.K.; Park, C.Y.; Jeong, S.G. The influence of small green space type and structure at the street level on urban heat island mitigation. Urban For. Urban Green. 2017, 21, 203–212. [Google Scholar] [CrossRef]
  29. Qin, Y. Urban canyon albedo and its implication on the use of reflective cool pavements. Energy Build. 2015, 96, 86–94. [Google Scholar] [CrossRef]
  30. Qin, Y.; Hiller, J.E. Understanding pavement-surface energy balance and its implications on cool pavement development. Energy Build. 2014, 85, 389–399. [Google Scholar] [CrossRef]
  31. Gunawardena, K.R.; Wells, M.J.; Kershaw, T. Utilising green and bluespace to mitigate urban heat island intensity. Sci. Total Environ. 2017, 584, 1040–1055. [Google Scholar] [CrossRef] [PubMed]
  32. Hou, H.; Estoque, R.C. Detecting Cooling Effect of Landscape from Composition and Configuration: An Urban Heat Island Study on Hangzhou. Urban For. Urban Green. 2020, 53, 126719. [Google Scholar] [CrossRef]
  33. Zhang, X.; Estoque, R.C.; Murayama, Y. An urban heat island study in Nanchang City, China based on land surface temperature and social-ecological variables. Sustain. Cities Soc. 2017, 32, 557–568. [Google Scholar] [CrossRef]
  34. Zheng, Y.; Li, Y.; Hou, H.; Murayama, Y.; Wang, R.; Hu, T. Quantifying the cooling effect and scale of large inner-city lakes based on landscape patterns: A case study of Hangzhou and Nanjing. Remote Sens. 2021, 13, 1526. [Google Scholar] [CrossRef]
  35. Du, T.M.J.; Cilliers, S.S.; Dallimer, M.; Goddard, M.; Guenat, S.; Cornelius, S.F. Urban green infrastructure and ecosystem services in sub-Saharan Africa. Landsc. Urban Plan. 2018, 180, 249–261. [Google Scholar] [CrossRef]
  36. Mohan, M.; Kandya, A. Impact of urbanization and land-use/land-cover change on diurnal temperature range: A case study of tropical urban airshed of India using remote sensing data. Sci. Total Environ. 2015, 506, 453–465. [Google Scholar] [CrossRef]
  37. Fischer, E.M.; Oleson, K.W.; Lawrence, D.M. Contrasting urban and rural heat stress responses to climate change. Geophys. Res. Lett. 2012, 39, 1–8. [Google Scholar] [CrossRef]
  38. Mushore, T.D.; Odindi, J.; Dube, T.; Mutanga, O. Prediction of future urban surface temperatures using medium resolution satellite data in Harare metropolitan city, Zimbabwe. Build. Environ. 2017, 122, 397–410. [Google Scholar] [CrossRef]
  39. Kolokotroni, M.; Ren, X.; Davies, M.; Mavrogianni, A. London’s urban heat island: Impact on current and future energy consumption in office buildings. Energy Build. 2012, 47, 302–311. [Google Scholar] [CrossRef]
  40. Santamouris, M. Cooling the buildings—Past, present and future. Energy Build. 2016, 128, 617–638. [Google Scholar] [CrossRef]
  41. Singh, P.; Kikon, N.; Verma, P. Impact of land use change and urbanization on urban heat island in Lucknow city, Central India. A remote sensing based estimate. Sustain. Cities Soc. 2017, 32, 100–114. [Google Scholar] [CrossRef]
  42. Wong, N.H.; Yu, C. Study of green areas and urban heat island in a tropical city. Habitat Int. 2005, 29, 547–558. [Google Scholar] [CrossRef]
  43. Manatsa, D.; Chingombe, W.; Matarira, C.H. The impact of the positive Indian Ocean dipole on Zimbabwe droughts Tropical climate is understood to be dominated by. Int. J. Climatol. 2008, 2029, 2011–2029. [Google Scholar] [CrossRef]
  44. Tran, H.; Uchihama, D.; Ochi, S.; Yasuoka, Y. Assessment with satellite data of the urban heat island effects in Asian mega cities. Int. J. Appl. Earth Obs. Geoinf. 2006, 8, 34–48. [Google Scholar] [CrossRef]
  45. Liu, C.; Li, Y. Spatio-temporal features of urban heat island and its relationship with land use/cover in mountainous city: A case study in Chongqing. Sustainability 2018, 10, 1943. [Google Scholar] [CrossRef]
  46. Mishra, B.; Sandifer, J.; Gyawali, B.R. Urban Heat Island in Kathmandu, Nepal: Evaluating Relationship between NDVI and LST from 2000 to 2018. Int. J. Environ. 2013, 1, 9–19. [Google Scholar] [CrossRef]
  47. Sarif, M.O.; Rimal, B.; Stork, N.E. Assessment of changes in land use/land cover and land surface temperatures and their impact on surface Urban heat Island phenomena in the Kathmandu Valley (1988–2018). ISPRS Int. J. Geo-Inform. 2020, 9, 726. [Google Scholar] [CrossRef]
  48. Aryal, A.; Shakya, B.M.; Maharjan, M.; Talchabhadel, R.; Thapa, B.R. Evaluation of the Land Surface Temperature using Satellite Images in Kathmandu Valley. Nepal J. Civ. Eng. 2021, 1, 1–10. [Google Scholar] [CrossRef]
  49. Maharjan, M.; Aryal, A.; Man Shakya, B.; Talchabhadel, R.; Thapa, B.R.; Kumar, S. Evaluation of Urban Heat Island (UHI) Using Satellite Images in Densely Populated Cities of South Asia. Earth 2021, 2, 6. [Google Scholar] [CrossRef]
  50. UN HABITAT. For a Better Urban Cities and Climate Change Initiative: Kathmandu Valley, Nepal; United Nations Human Settlements Programme: Nairobi, Kenya, 2015. [Google Scholar]
  51. Karki, R.; Talchabhadel, R.; Aalto, J.; Baidya, S.K. New climatic classification of Nepal. Theor. Appl. Climatol. 2016, 125, 799–808. [Google Scholar] [CrossRef]
  52. Thapa, R.B.; Murayama, Y. Urban growth modeling of Kathmandu metropolitan region, Nepal. Comput. Environ. Urban Syst. 2011, 35, 25–34. [Google Scholar] [CrossRef]
  53. Educational Software—Maps, Learn to Read and More. Available online: http://www.yourchildlearns.com/ (accessed on 11 December 2021).
  54. DIVA-GIS. Available online: https://www.diva-gis.org/ (accessed on 11 December 2021).
  55. EarthExplorer. Available online: https://earthexplorer.usgs.gov/ (accessed on 11 December 2021).
  56. Thapa, R.B.; Murayama, Y. Examining Spatiotemporal Urbanization Patterns in Kathmandu Valley, Nepal: Remote Sensing and Spatial Metrics Approaches. Remote Sens. 2009, 1, 534–556. [Google Scholar] [CrossRef]
  57. The R Project for Statistical Computing. Available online: https://www.r-project.org/ (accessed on 11 December 2021).
  58. Rodriguez-Galiano, V.F.; Ghimire, B.; Rogan, J.; Chica-Olmo, M.; Rigol-Sanchez, J.P. An assessment of the effectiveness of a random forest classifier for land-cover classification. ISPRS J. Photogramm. Remote Sens. 2012, 67, 93–104. [Google Scholar] [CrossRef]
  59. Belgiu, M.; Drăgu, L. Random forest in remote sensing: A review of applications and future directions. ISPRS J. Photogramm. Remote Sens. 2016, 114, 24–31. [Google Scholar] [CrossRef]
  60. Pal, M. Random forest classifier for remote sensing classification. Int. J. Remote Sens. 2005, 26, 217–222. [Google Scholar] [CrossRef]
  61. Yu, K.; Chen, Y.; Wang, D.; Chen, Z.; Gong, A.; Li, J. Study of the seasonal effect of building shadows on urban land surface temperatures based on remote sensing data. Remote Sens. 2019, 11, 497. [Google Scholar] [CrossRef]
  62. Weng, Q.; Lu, D.; Schubring, J. Estimation of land surface temperature-vegetation abundance relationship for urban heat island studies. Remote Sens. Environ. 2004, 89, 467–483. [Google Scholar] [CrossRef]
  63. Shahfahad; Talukdar, S.; Rihan, M.; Hang, H.T.; Bhaskaran, S.; Rahman, A. Modelling urban heat island (UHI) and thermal field variation and their relationship with land use indices over Delhi and Mumbai metro cities. Environ. Dev. Sustain. 2021, 24, 3762–3790. [Google Scholar] [CrossRef]
  64. Sun, Q.; Wu, Z.; Tan, J. The relationship between land surface temperature and land use/land cover in Guangzhou, China. Environ. Earth Sci. 2012, 65, 1687–1694. [Google Scholar] [CrossRef]
  65. Du, J.; Xiang, X.; Zhao, B.; Zhou, H. Impact of urban expansion on land surface temperature in Fuzhou, China using Landsat imagery. Sustain. Cities Soc. 2020, 61, 102346. [Google Scholar] [CrossRef]
  66. Zhou, W.; Huang, G.; Cadenasso, M.L. Does spatial configuration matter? Understanding the effects of land cover pattern on land surface temperature in urban landscapes. Landsc. Urban Plan. 2011, 102, 54–63. [Google Scholar] [CrossRef]
  67. Asgarian, A.; Amiri, B.J.; Sakieh, Y. Assessing the effect of green cover spatial patterns on urban land surface temperature using landscape metrics approach. Urban Ecosyst. 2015, 18, 209–222. [Google Scholar] [CrossRef]
  68. McGarigal, K.; Cushman, S.A.; Ene, E. FRAGSTATS v4: Spatial Pattern Analysis Program for Categorical and Continuous Maps. Computer Software Program Produced by the Authors at the University of Massachusetts Amherst. 2012. Available online: http://www.umass.edu/landeco/research/fragstats/fragstats.html (accessed on 11 June 2022).
  69. Shrestha, K.C.S.; Ninsawat, S.; Chonwattana, S. Predicting flood events in Kathmandu Metropolitan City under climate change and urbanisation. J. Environ. Manag. 2021, 281, 111894. [Google Scholar] [CrossRef]
  70. Lamichhane, S.; Shakya, N.M. Shallow aquifer groundwater dynamics due to land use/cover change in highly urbanized basin: The case of Kathmandu Valley. J. Hydrol. Reg. Stud. 2020, 30, 100707. [Google Scholar] [CrossRef]
  71. Thapa, R.B.; Murayama, Y.; Ale, S. Kathmandu. Cities 2008, 25, 45–57. [Google Scholar] [CrossRef]
  72. Thapa, R.B.; Murayama, Y. Drivers of urban growth in the Kathmandu valley, Nepal: Examining the efficacy of the analytic hierarchy process. Appl. Geogr. 2010, 30, 70–83. [Google Scholar] [CrossRef]
  73. Luan, W.; Li, X. Rapid urbanization and its driving mechanism in the Pan-Third Pole region. Sci. Total Environ. 2021, 750, 141270. [Google Scholar] [CrossRef]
  74. Lamichhane, S.; Shakya, N.M. Alteration of groundwater recharge areas due to land use/cover change in Kathmandu Valley, Nepal. J. Hydrol. Reg. Stud. 2019, 26, 100635. [Google Scholar] [CrossRef]
  75. Mitchell, M.; Roca Iglesias, A. Urban agriculture in Kathmandu as a catalyst for the civic inclusion of migrants and the making of a greener city. Front. Arch. Res. 2019, 9, 169–190. [Google Scholar] [CrossRef]
  76. Haack, B.N.; Rafter, A. Urban growth analysis and modeling in the Kathmandu Valley, Nepal. Habitat Int. 2006, 30, 1056–1065. [Google Scholar] [CrossRef]
  77. Thapa, R.B.; Murayama, Y. Scenario based urban growth allocation in Kathmandu Valley, Nepal. Landsc. Urban Plan. 2012, 105, 140–148. [Google Scholar] [CrossRef]
  78. Prajapati, R.; Upadhyay, S.; Talchabhadel, R.; Thapa, B.R.; Ertis, B.; Silwal, P.; Davids, J.C. Investigating the nexus of groundwater levels, rainfall and land-use in the Kathmandu Valley, Nepal. Groundw. Sustain. Dev. 2021, 14, 100584. [Google Scholar] [CrossRef]
  79. Dahal, A.; Khanal, R.; Mishra, B.K. Identification of critical location for enhancing groundwater recharge in Kathmandu Valley, Nepal. Groundw. Sustain. Dev. 2019, 9, 100253. [Google Scholar] [CrossRef]
  80. Zhang, H.; Qi, Z.-F.; Ye, X.-Y.; Cai, Y.-B.; Ma, W.-C.; Chen, M.-N. Analysis of land use/land cover change, population shift, and their effects on spatiotemporal patterns of urban heat islands in metropolitan Shanghai, China. Appl. Geogr. 2013, 44, 121–133. [Google Scholar] [CrossRef]
  81. Oke, T.R. City size and the urban heat island. Atmos. Env. 1973, 7, 769–779. [Google Scholar] [CrossRef]
  82. Yeon-Hee, K.; Jong-Jin, B. Spatial and Temporal Structure of the Urban Heat Island in Seoul. J. Appl. Meteorol. 2005, 44, 591–605. [Google Scholar]
  83. Xiao, R.-B.; Ouyang, Z.-Y.; Zheng, H.; Li, W.-F.; Schienke, E.W.; Wang, X.-K. Spatial pattern of impervious surfaces and their impacts on land surface temperature in Beijing, China. J. Environ. Sci. 2007, 19, 250–256. [Google Scholar] [CrossRef]
  84. Myint, S.W.; Wentz, E.A.; Brazel, A.J.; Quattrochi, D.A. The impact of distinct anthropogenic and vegetation features on urban warming. Landsc. Ecol. 2013, 28, 959–978. [Google Scholar] [CrossRef]
  85. Zhou, W.; Wang, J.; Cadenasso, M.L. Effects of the spatial configuration of trees on urban heat mitigation: A comparative study. Remote Sens. Environ. 2017, 195, 1–12. [Google Scholar] [CrossRef]
  86. EPA (US Environmental Protection Agency). Reducing Urban Heat Islands: Com- Pendium of Strategies; US Environmental Protection Agency: Washington, DC, USA, 2008. [Google Scholar]
  87. Pérez, G.; Coma, J.; Sol, S.; Cabeza, L.F. Green facade for energy savings in buildings: The influence of leaf area index and facade orientation on the shadow effect. Appl. Energy 2017, 187, 424–437. [Google Scholar] [CrossRef]
  88. Morakinyo, T.E.; Kong, L.; Lau, K.K.L.; Yuan, C.; Ng, E. A study on the impact of shadow-cast and tree species on in-canyon and neighborhood’s thermal comfort. Build. Environ. 2017, 115, 1–17. [Google Scholar] [CrossRef]
  89. Fu, P.; Weng, Q. A time series analysis of urbanization induced land use and land cover change and its impact on land surface temperature with Landsat imagery. Remote Sens. Environ. 2016, 175, 205–214. [Google Scholar] [CrossRef]
  90. Li, X.; Zhou, W.; Ouyang, Z.; Xu, W.; Zheng, H. Spatial pattern of greenspace affects land surface temperature: Evidence from the heavily urbanized Beijing metropolitan area, China. Landsc. Ecol. 2012, 27, 887–898. [Google Scholar] [CrossRef]
  91. Maimaitiyiming, M.; Ghulam, A.; Tiyip, T.; Pla, F.; Latorre-Carmona, P.; Halik, Ü.; Sawut, M.; Caetano, M. Effects of green space spatial pattern on land surface temperature: Implications for sustainable urban planning and climate change adaptation. ISPRS J. Photogramm. Remote Sens. 2014, 89, 59–66. [Google Scholar] [CrossRef]
  92. Besir, A.B.; Cuce, E. Green roofs and facades: A comprehensive review. Renew. Sustain. Energy Rev. 2018, 82, 915–939. [Google Scholar] [CrossRef]
  93. Aflaki, A.; Mirnezhad, M.; Ghaffarianhoseini, A.; Ghaffarianhoseini, A.; Omrany, H.; Wang, Z.H.; Akbari, H. Urban heat island mitigation strategies: A state-of-the-art review on Kuala Lumpur, Singapore and Hong Kong. Cities 2017, 62, 131–145. [Google Scholar] [CrossRef]
  94. Wong, N.H.; Tan, A.Y.K.; Tan, P.Y.; Wong, N.C. Energy simulation of vertical greenery systems. Energy Build. 2009, 41, 1401–1408. [Google Scholar] [CrossRef]
  95. Bustami, R.A.; Belusko, M.; Ward, J.; Beecham, S. Vertical greenery systems: A systematic review of research trends. Build. Environ. 2018, 146, 226–237. [Google Scholar] [CrossRef]
  96. Wong, N.H.; Jusuf, S.K.; Syafii, N.I.; Chen, Y.; Hajadi, N.; Sathyanarayanan, H.; Manickavasagam, Y.V. Evaluation of the impact of the surrounding urban morphology on building energy consumption. Sol. Energy 2011, 85, 57–71. [Google Scholar] [CrossRef]
  97. Millstein, D.; Menon, S. Regional climate consequences of large-scale cool roof and photovoltaic array deployment. Environ. Res. Lett. 2011, 6, 034001. [Google Scholar] [CrossRef]
  98. Dimond, K.; Webb, A. Sustainable roof selection: Environmental and contextual factors to be considered in choosing a vegetated roof or rooftop solar photovoltaic system. Sustain. Cities Soc. 2017, 35, 241–249. [Google Scholar] [CrossRef]
  99. Kılkış, Ş.; Krajačić, G.; Duić, N.; Montorsi, L.; Wang, Q.; Rosen, M.A.; Ahmad Al-Nimr, M. Research frontiers in sustainable development of energy, water and environment systems in a time of climate crisis. Energy Convers. Manag. 2019, 199, 1–21. [Google Scholar] [CrossRef]
  100. Bowler, D.E.; Buyung-Ali, L.; Knight, T.M.; Pullin, A.S. Urban greening to cool towns and cities: A systematic review of the empirical evidence. Landsc. Urban Plan. 2010, 97, 147–155. [Google Scholar] [CrossRef]
  101. Weng, Q. Thermal infrared remote sensing for urban climate and environmental studies: Methods, applications, and trends. ISPRS J. Photogramm. Remote Sens. 2009, 64, 335–344. [Google Scholar] [CrossRef]
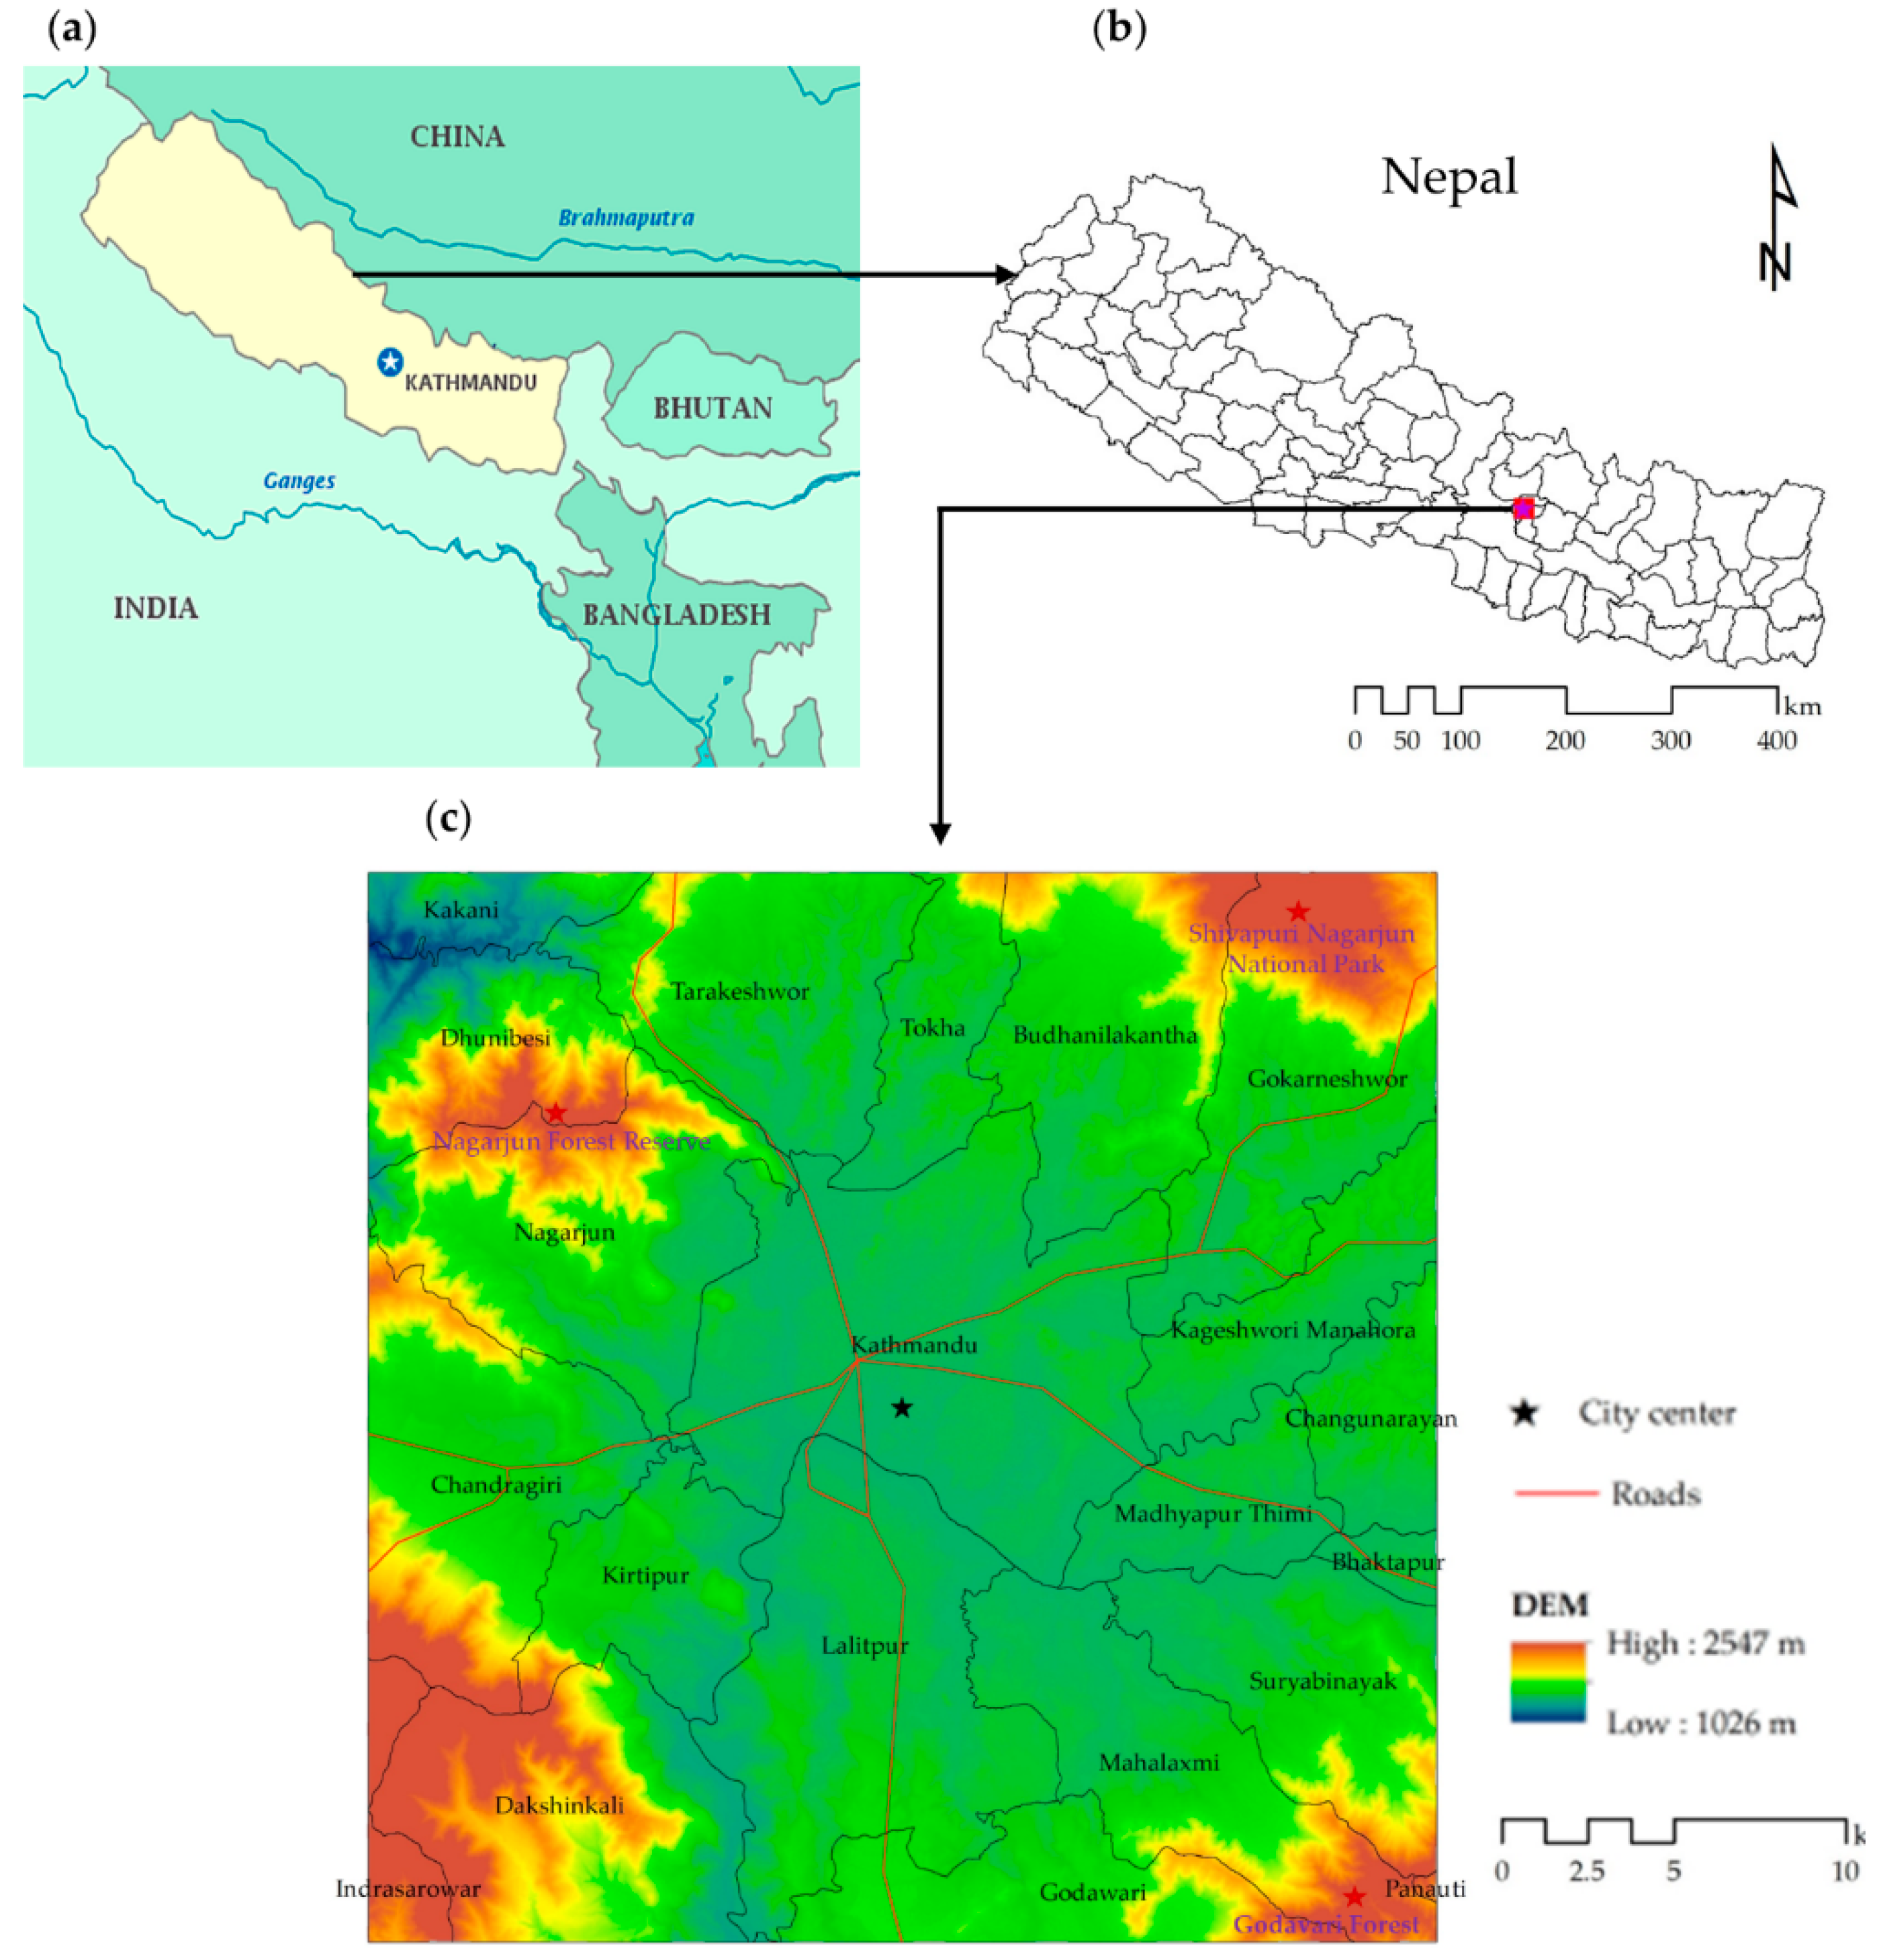
Figure 1. Location of the study area. (a) Nepal (28°23′42″N/84°7′40″E) and some other countries in South Asia [53]; (b) Kathmandu City and its immediate surrounding areas [54]; and (c) study area of 20 × 20 km with a 10 km radius.
Remotesensing 14 04047 g001
Figure 2. LULC maps of Kathmandu City, Nepal, and its surrounding areas classified using machine learning techniques (see Section 2.2): (a) LULC map in 2000; (b) LULC map in 2013; and (c) LULC map in 2020.
Remotesensing 14 04047 g002
Figure 3. LST maps of Kathmandu City, Nepal, and its surrounding areas derived from Landsat imagery: (a) LST map in 2000; (b) LST map in 2013; and (c) LST map in 2020.
Remotesensing 14 04047 g003
Figure 4. Mean LST of each LULC category in Kathmandu City, Nepal in 2000, 2013, and 2020.
Remotesensing 14 04047 g004
Figure 5. NDVI maps of Kathmandu City, Nepal: (a) NDVI in 2000; (b) NDVI in 2013; and (c) NDVI in 2020.
Remotesensing 14 04047 g005
Figure 6. MNDWI maps of Kathmandu, Nepal: (a) MNDWI in 2000; (b) MNDWI in 2013; and (c) MNDWI in 2020.
Remotesensing 14 04047 g006
Figure 7. NDBal maps of Kathmandu, Nepal: (a) NDBal in 2000; (b) NDBal in 2013; and (c) NDBal in 2020.
Remotesensing 14 04047 g007
Figure 8. Urban–rural gradient in Kathmandu City: (a) mean LST and the density of IS, GS1, and GS2 along the urban–rural gradient; and (b) mean LST and NDVI, MNDWI, and NDBal along the urban–rural gradient.
Remotesensing 14 04047 g008
Table 1. Class-level spatial metrics used in this study [68].
IndexDescriptionUnitMeasure
Mean Patch Area (AREA_MN)The average patch size of LULC classes. The spatial pattern and heterogeneity of the area.HectareComposition of each LULC class in the study area (LULC classes).
Number of Patches (NP)Derived using the total landscape area.Number of patches per hectareEstimation of the fragmentation of each LULC class.
Largest Patch Index (LPI)Quantifies the percentage of the total landscape area taken up by the largest patch at the class level. It is a simple gauge of dominance.0–100LPI has the ability
to detect the advantages
of the LULC.
Percentage of Landscape (PLANND)Sum of the LULC classes divided by the total landscape area × 100.PercentageMeasurement of the abundance of the corresponding LULC class.
Cohesion (COHESION)The physical connectivity of the corresponding patch type of the LU class increases with more clustering of the patch type in its configuration, resulting in more physical amalgamation.0–100The physical connectivity of the equivalent patches of LULC class.
Table 2. LULC area matrix of Kathmandu City from 2000 to 2020.
LULC Type2000 km2%2013 km2%2020 km2%
Impervious Surface86.9621.7494.5823.65136.9834.25
Green Space 1 (Forest)116.6929.1799.724.9388.6222.16
Green Space 2 (Cropland/Grassland)149.6637.42153.8438.46127.6431.91
Bare Land31.527.8838.649.6639.319.83
Water1.930.481.790.451.70.43
Other Land (Cloud/Snow/Shadow)13.243.3111.442.865.751.44
Table 3. Results of MLR analysis in Kathmandu (dependent variable: mean LST; 210 × 210 m grid size; and N = 9025).
RS-Based ParametersCoefficients
Unstandardized     β Std. Error Standardized   β Sig.
2000
(Constant)22.5900.144
Mean NDVI−0.0310.001−0.3190.000
Mean MNDWI−0.0170.001−0.1160.000
Mean NDBal0.0570.0010.4340.000
Mean elevation−0.0030.000−0.2180.000
R2 = 0.696; Adjusted R2 = 0.695
2013
(Constant)35.1630.124
Mean NDVI−0.0430.001−0.5060.000
Mean MNDWI−0.0240.001−0.1700.000
Mean NDBal0.0420.0010.4100.000
Mean elevation−0.0060.000−0.4530.000
R2 = 0.781; Adjusted R2 = 0.780
2020
(Constant)31.1540.112
Mean NDVI−0.0460.001−0.5160.000
Mean MNDWI−0.0450.001−0.4100.000
Mean NDBal0.0590.0010.4570.000
Mean elevation−0.0060.000−0.5060.000
R2 = 0.729; Adjusted R2 = 0.729
Table 4. Results of LULC composition vs. mean LST.
200020132020
ISGS1GS2ISGS1GS2ISGS1GS2
AREA_MN0.425−0.235−0.3570.454−0.629−0.2040.532−0.670−0.103
PD0.108−0.730−0.0870.257−0.123−0.1380.477−0.560−0.194
LPI0.127−0.464−0.0390.481−0.614−0.340.505−0.686−0.024
PLAND0.173−0.549−0.1510.351−0.800−0.1240.421−0.660−0.112
COHESION0.209−0.512−0.1960.539−0.789−0.1730.611−0.897−0.262
Note 1: Area_MN—mean patch size; PD—patch density; LPI—largest patch index; PLAND—percentage of landscape; and COHESION—cohesion. Note 2: IS—impervious surface; GS1—green space 1; and GS2—green space 2.
Publisher’s Note: MDPI stays neutral with regard to jurisdictional claims in published maps and institutional affiliations.