Article

Multi-Band and Polarization SAR Images Colorization Fusion

1
School of Optoelectronic Engineering, Xidian University, Xi’an 710071, China
2
School of Telecommunications Engineering, Xidian University, Xi’an 710071, China
3
National Lab of Radar Signal Processing, Xidian University, Xi’an 710071, China
4
State Key Laboratory of Pulsed Power Laser Technology, National University of Defense Technology, Hefei 230037, China
*
Author to whom correspondence should be addressed.
Remote Sens. 2022, 14(16), 4022; https://doi.org/10.3390/rs14164022
Submission received: 20 June 2022 / Revised: 10 August 2022 / Accepted: 13 August 2022 / Published: 18 August 2022
(This article belongs to the Special Issue Recent Progress and Applications on Multi-Dimensional SAR)

Abstract

:
The image fusion of multi-band and multi-polarization synthetic aperture radar (SAR) images can improve the efficiency of band and polarization information processing. In this paper, we introduce a fusion method that simultaneously fuses multi-band and polarization SAR images. In the method, we first use non-subsampled shearlet transform (NSST) to fuse multi-band and polarization SAR images. The sub-band images decomposed from the NSST are fused by the coefficient of variation (CV) and phase consistency (PC) weighted fusion rules. Subsequently, we extract the band and polarization difference information from the multi-band and polarization SAR images. The fusion image is finally colorized according to the band and polarization differences. In the experiments, we used Ka and S-band multi-polarization SAR images to test the fusion performance. The experiment results prove that the proposed fused images not only preserve much valuable information but also can be interpreted easily.

Graphical Abstract

1. Introduction

Synthetic aperture radar (SAR) is a high-resolution imaging technique that uses electromagnetic waves in the microwave spectrum to acquire electromagnetic scattering characteristics of the detection area [1,2,3]. Different with optical sensor, SAR is an active imaging technique, and its long-wavelength radiation can penetrate through most climatic conditions. Therefore, SAR imaging has the advantages of long imaging distance and all-day, all-weather operation [4]. However, SAR images are poor in object recognition and band information. This has motivated researchers to fuse SAR images with other remote sensing images to obtain better visual performance and additional valuable information.
SAR image fusion for enhancing visual performance has been widely studied by researchers in recent years. There are various ways to achieve the fusion [5,6,7,8,9,10,11,12,13,14]. Among them, the multi-scale decomposition methods, such as wavelet transform [5,6,7], non-subsampled contourlet transform (NSCT) [8], and non-subsampled shearlet transform (NSST) [9] have been frequently used in the fusion of SAR images because of their good fusion performance and fast implementation. There are various fields where the fused SAR image can be applied, such as searching ice cracks [5], improving the quality of urban remote sensing images [8,9], or revealing cloud-obscured areas in optical images [10]. After the fusion, the object recognition of the fused SAR image is significantly improved, thus, many researchers utilize the fused SAR image for target detection, which includes obtaining the distribution of buildings in cities [11], monitoring the damage of urban buildings after earthquakes [12], monitoring glaciers in the ocean [13], and the detection of ships in ports [14].
The fusion between SAR images has received attention from researchers in an effort to obtain more band and polarization information [15,16,17,18,19,20,21,22]. Due to the different penetration and electromagnetic characteristics of the different bands, the fusion of multi-band SAR images can be used to achieve the detection of special targets. Wu et al. used the fusion of X, C, and L-band SAR images to achieve bridge detection [17]. Guida et al. used the fusion of X and S-band SAR images to identify oil and gas [18]. Chanika et al. applied X and C-band SAR image fusion to enhance the classification accuracy of maize lands [19]. Moreover, the fusion of multi-polarization SAR images can be utilized to distinguish the regions with different surface structures. Ruan et al. fused horizontalhorizontal (HH), horizontalvertical (HV) and verticalvertical (VV) polarized SAR images to improve the classification accuracy of different areas [20]. Song et al. fused HH and HV polarized SAR images to reduce the false alarm rate of moving target detection [21]. Zhu et al. enhanced the performance of vessel detection by using the fusion of HH and VV polarized SAR images [22].
However, although the fused multi-band SAR image can be used to detect objects that vary in scattering characteristics with respect to the band, it is difficult to determine the kind of objects they are. In addition, although the fused multi-polarization SAR image can be used to distinguish the regions with different surface structures, it is difficult to find masked objects based on the information of a single band. Therefore, if we can fuse the information of multi-band and multi-polarization SAR images at the same time, we can detect the masked object and determine the kind of object it is simultaneously, which will greatly facilitate the application of the SAR images.
Unfortunately, there are few effective fusion methods for the multi-band and polarization SAR images. Traditional fusion methods compress input images into a grayscale image. This compression will result in the loss of critical band and polarization information. Furthermore, the grayscale image is hard to interpret. The objects with only a one-dimensional grayscale difference are difficult to detect and discriminate.
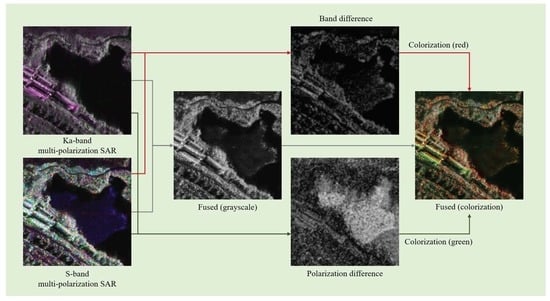
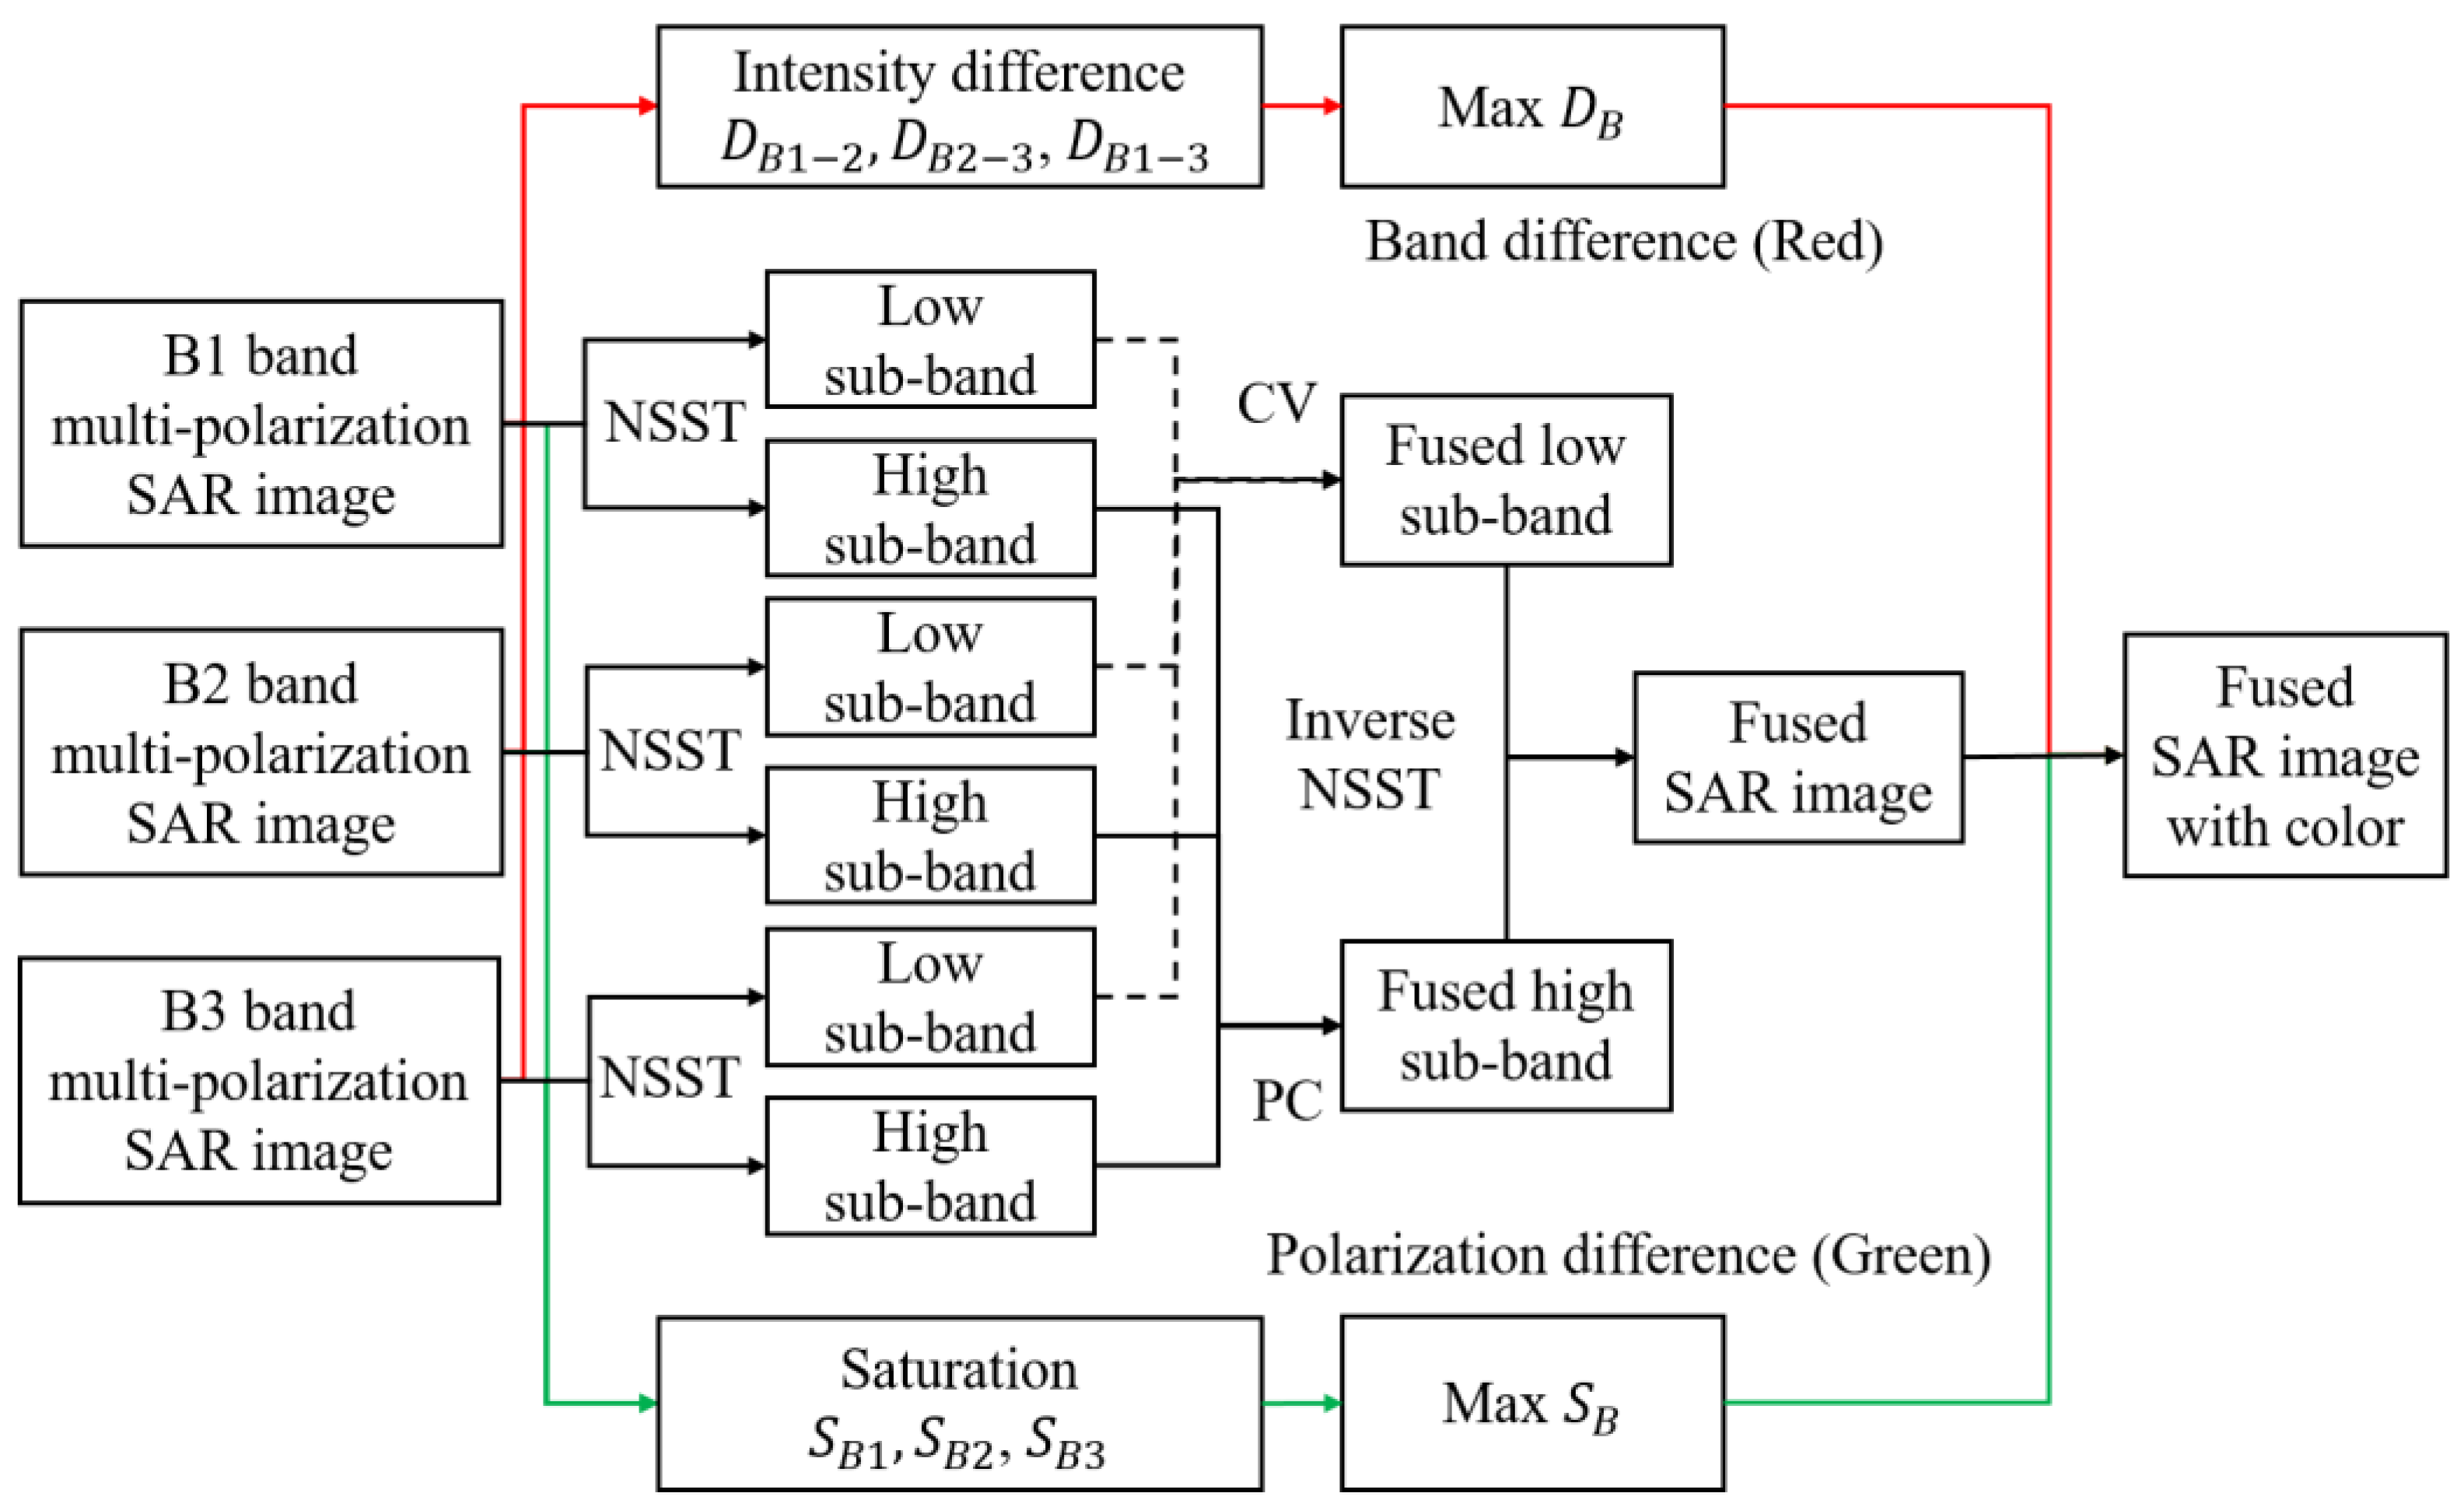
In this paper, we propose a colorization fusion method for multi-band and polarization SAR images. First, we use non-subsampled shearlet transform (NSST) to decompose and fuse multi-band and polarization SAR images. Among them, the low and high-frequency sub-band images acquired from NSST are fused using the fusion rules based on coefficient of variation (CV) and phase consistency (PC), respectively. Then, the band difference map and the polarization difference map are obtained from the multi-band and polarization SAR images through the calculation of intensity differences and color saturation, respectively. Finally, the fused image is colorized according to the difference maps. This proposed fusion method not only preserves the detail information between different bands of SAR images but also increases the fused image by the band and polarization differences information, which achieves a high visual performance.
The rest of this paper is divided into three parts. Section 2 introduces the detailed fusion rules of multi-band and polarization SAR images. Section 3 presents the results of the proposed fusion method as well as the comparison with other fusion methods. We conclude in Section 4.

2. Methodology

In this section, we first introduce the concepts of NSST. Then, we present the NSST-based image fusion rules, in which the low and high-frequency sub-band images are respectively fused according to the CV and PC. Subsequently, the coloring rules for the fused SAR image are proposed. At the end of this section, we introduce the dataset and evaluation indexes that will be used in the experiments.

2.1. Concepts of NSST

Non-subsampled shearlet transform (NSST) is a non-orthogonal transform derived from wavelet transform [23]. For a continuous wavelet, a two-dimensional affine system with composite dilations is defined as:
M A S ψ = ψ j , l , k x = det A j / 2 ψ S l A j x k : l , j Z , k Z 2
where Ψ L 2 R 2   , L 2 R 2 = { f x , y : + + f x , y 2 < + } . j, l, and k denote scale, direction, and shift parameter, respectively. A is the dilation matrix, and A j is related to the scale decomposition. S is the shear matrix, and S l is related to the direction decomposition. When A = 4 0 0 2 and   S = 1 1 0 1 , they are called the shearlet filter (SF), and this system is called the shearlet transform.
Compared with the shearlet transform, NSST utilizes the not sampling pyramid (NSP) to achieve the scale decomposition [23]. The process of NSST is described as follows: First, NSP scale decomposition is performed to obtain a low-frequency sub-band image and j-1 high-frequency sub-band images. Then, the high-frequency sub-band images are processed with SF to obtain the sub-band images in different directions. Figure 1 shows the three-level NSST image decomposition. As a multi-scale decomposition method, NSST can achieve image multi-scale and multi-directional decomposition with high speed.

2.2. Fusion Rules

After decomposing the multi-band and multi-polarization SAR images by NSST, we can acquire their low and high-frequency sub-band images. Then, we fuse the low and high-frequency sub-band images respectively, according to the individual fusion rule, as follows.

2.2.1. Low-Frequency Fusion Rule

The low-frequency sub-band image contains the approximate information as well as the majority of the energy of the original SAR image. We use the coefficient of variation (CV) [24] as the weight of the low-frequency sub-band images. The CV is calculated as follows:
C V x , y = 1 n i = 1 n I x i , y i μ 2 μ
where n represents the number of pixels in a window, I x i , y i is the neighbor pixel of the center pixel I x , y , and μ represents the mean of the pixels in the window. The calculation window of the CV is 3 × 3 in this paper.
CV can describe the degree of local variation of a pixel. If a pixel has larger CV, it will provide more useful information and should have larger weight than the corresponding pixel in the other low-frequency sub-band image. After calculating the CV for each pixel in the low-frequency sub-band image and making the CV as their weights, the fused low-frequency sub-band image is acquired as follows:
L F x , y = k m C V k x , y L k x , y k m C V k x , y
where m represents the number of the original images, and L is the low-frequency sub-band image decomposed from NSST.

2.2.2. High-Frequency Fusion Rule

The high-frequency sub-band image contains the detailed texture, contour features, as well as interfering noise. In order to preserve the detailed texture and contour features as much as possible and to minimize the effect of noise, we use the PC weighted fusion method to achieve the fusion of the high-frequency sub-band images.
Phase Congruency (PC) is an image contour extraction method. Because PC analyzes the phase information of image in the frequency domain, it is invariant to the illumination change [25] and thus, has been widely used in the SAR image registration [26,27,28].
For the phase analysis, we should first extract the multi-frequency and orientation phase information from the original SAR image. In practice, the image is convolved with multi-frequency and orientation band-pass filters to achieve the extraction as follows:
A ω , θ x , y = Re I x , y * f ω , θ x , y
φ ω , θ x , y = Im I x , y * f ω , θ x , y
where I represents the original SAR image. A ω , θ and φ ω , θ represent the amplitude and phase at the frequency ω and orientation θ , respectively. f ω , θ represents the band-pass filter in the time domain. The function denotes the convolution of two metrics. The oriented log-Gabor filter is suitable as the band-pass filter f. In the frequency domain, the oriented log-Gabor filter is defined as
f log G a b o r ω = f θ exp log ω / ω 0 2 2 log κ / ω 0
where f θ is direction filter. ω 0 is the central frequency of the log-Gabor filter, and κ is a parameter that controls the band width. Fourier transform can achieve the transformation of the oriented log-Gabor filter between the frequency domain and the time domain.
Considering the effect of image noise, the phase deviation Δ φ s , θ as well as the PC in the orientation θ are defined as:
Δ φ s , θ x , y = cos φ s , θ x , y φ ¯ θ x , y sin ( φ s , θ x , y φ ¯ θ x , y )
P C θ x , y = s W s , θ x , y A s , θ x , y Δ φ s , θ x , y T s A s , θ x , y + ε
where φ ¯ θ is mean phase angle, W s , θ is the weighting function related to the band-pass filter, T is the estimated noise threshold, and ε is a small constant that avoids division by zero. The function · denotes that the enclosed quantity is equal to itself when its value is positive, and zero otherwise. If the P C θ value of the pixel is close to 1, this pixel has good phase congruency in the orientation θ and is likely an edge pixel of the SAR image.
Furthermore, taking the orientation into account, we can distinguish the kind of edge. The maximum moment PCM and the minimum moment PCm can be obtained as follows [29,30]:
P C M = 1 2 c + a + b 2 + a c 2
P C m = 1 2 c + a b 2 + a c 2
in which the three intermediate quantities are calculated by:
a = o P C θ o cos θ o 2 b = 2 o P C θ o cos θ o P C θ o sin θ o c = o P C θ o sin θ o 2
where P C θ o denotes the PC at the orientation of θ o . PCM and PCm represent the edge and corner maps of the original SAR image, respectively. In this paper, we select PCM as the output of the PC method. To make the contours more visible, the PCM is optimized as follows:
P C M x , y = max P C M x + x , y + y , x 1 , 1 , y 1 , 1
Finally, the PCM is made as the weights of each high-frequency sub-band image, then, the fused high-frequency sub-band images can be obtained as follows:
H F j , l x , y = k m P C M k x , y H j , l , k x , y k m P C M k x , y
where m denotes the number of the original images, and H is the high-frequency sub-band image decomposed from NSST. j and l represent the scale and direction in the NSST, respectively.
So far, we have obtained the fused low-frequency sub-band image and the fused high-frequency sub-band images. Then, the NSST inversion is applied to the sub-band images to realize the fusion of the multi-band and polarization SAR images. Subsequently, we extract the band and polarization difference information from the original multi-band and polarization SAR images to colorize the fused SAR image.

2.3. Coloring Rules

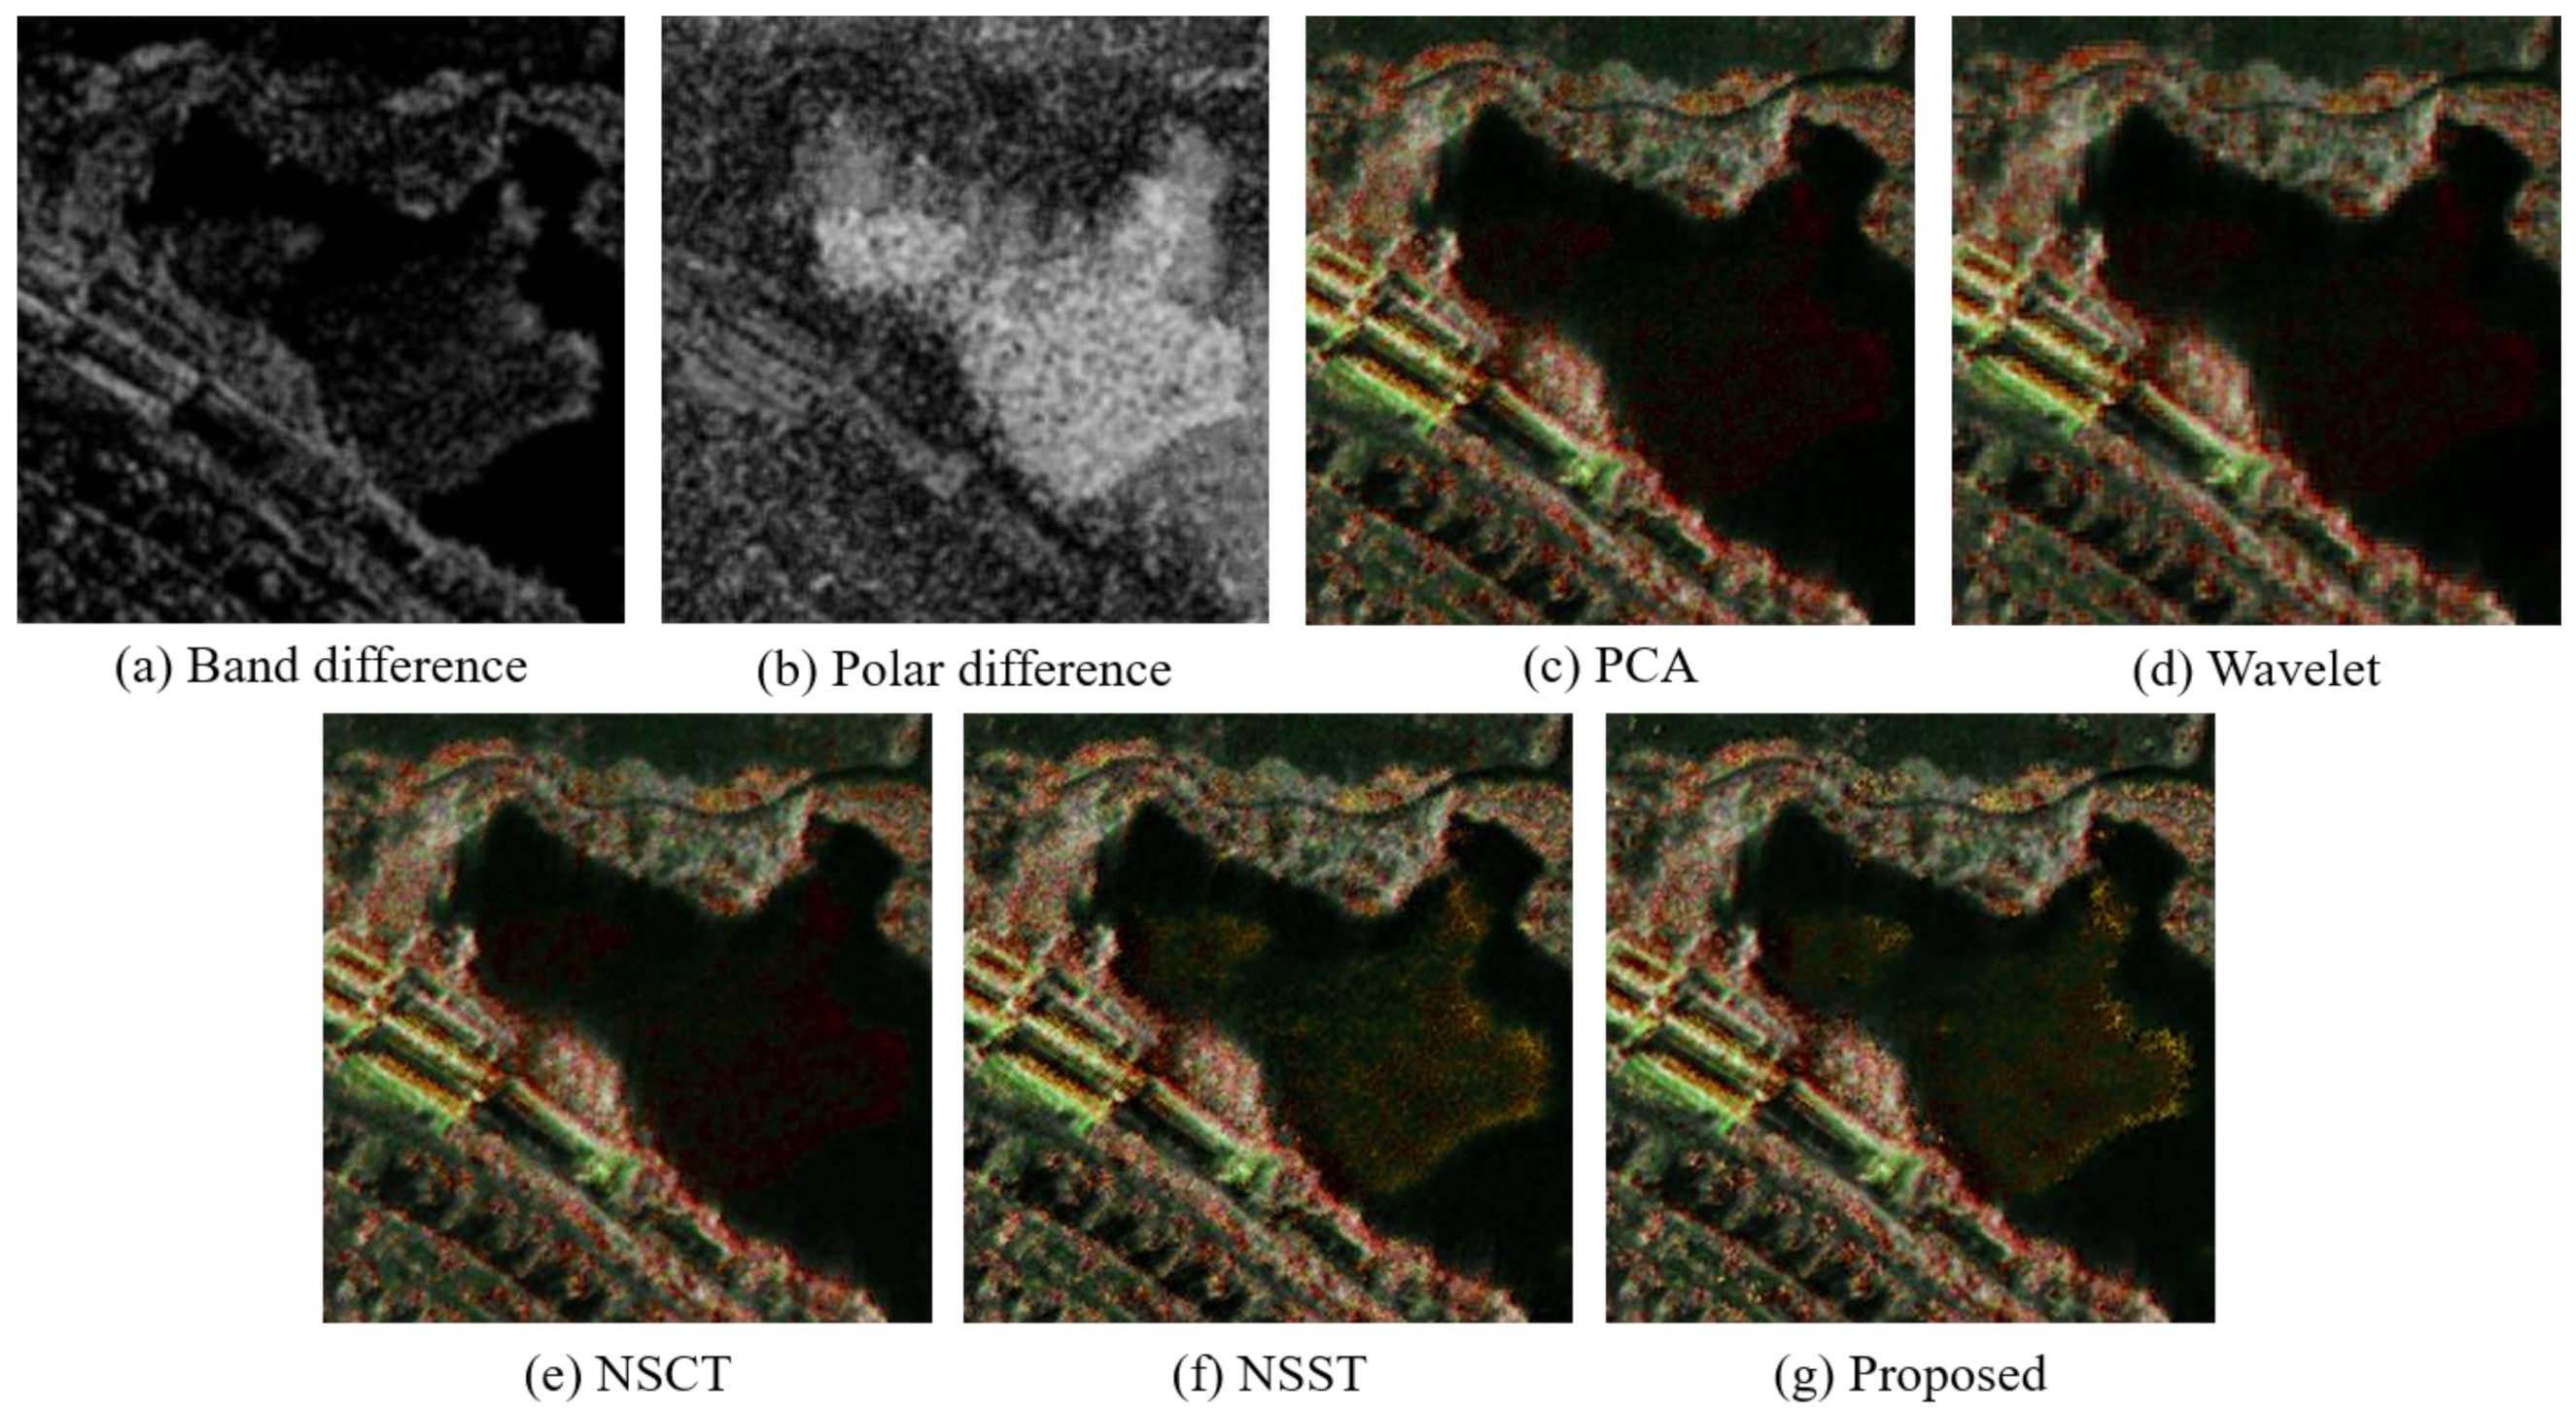
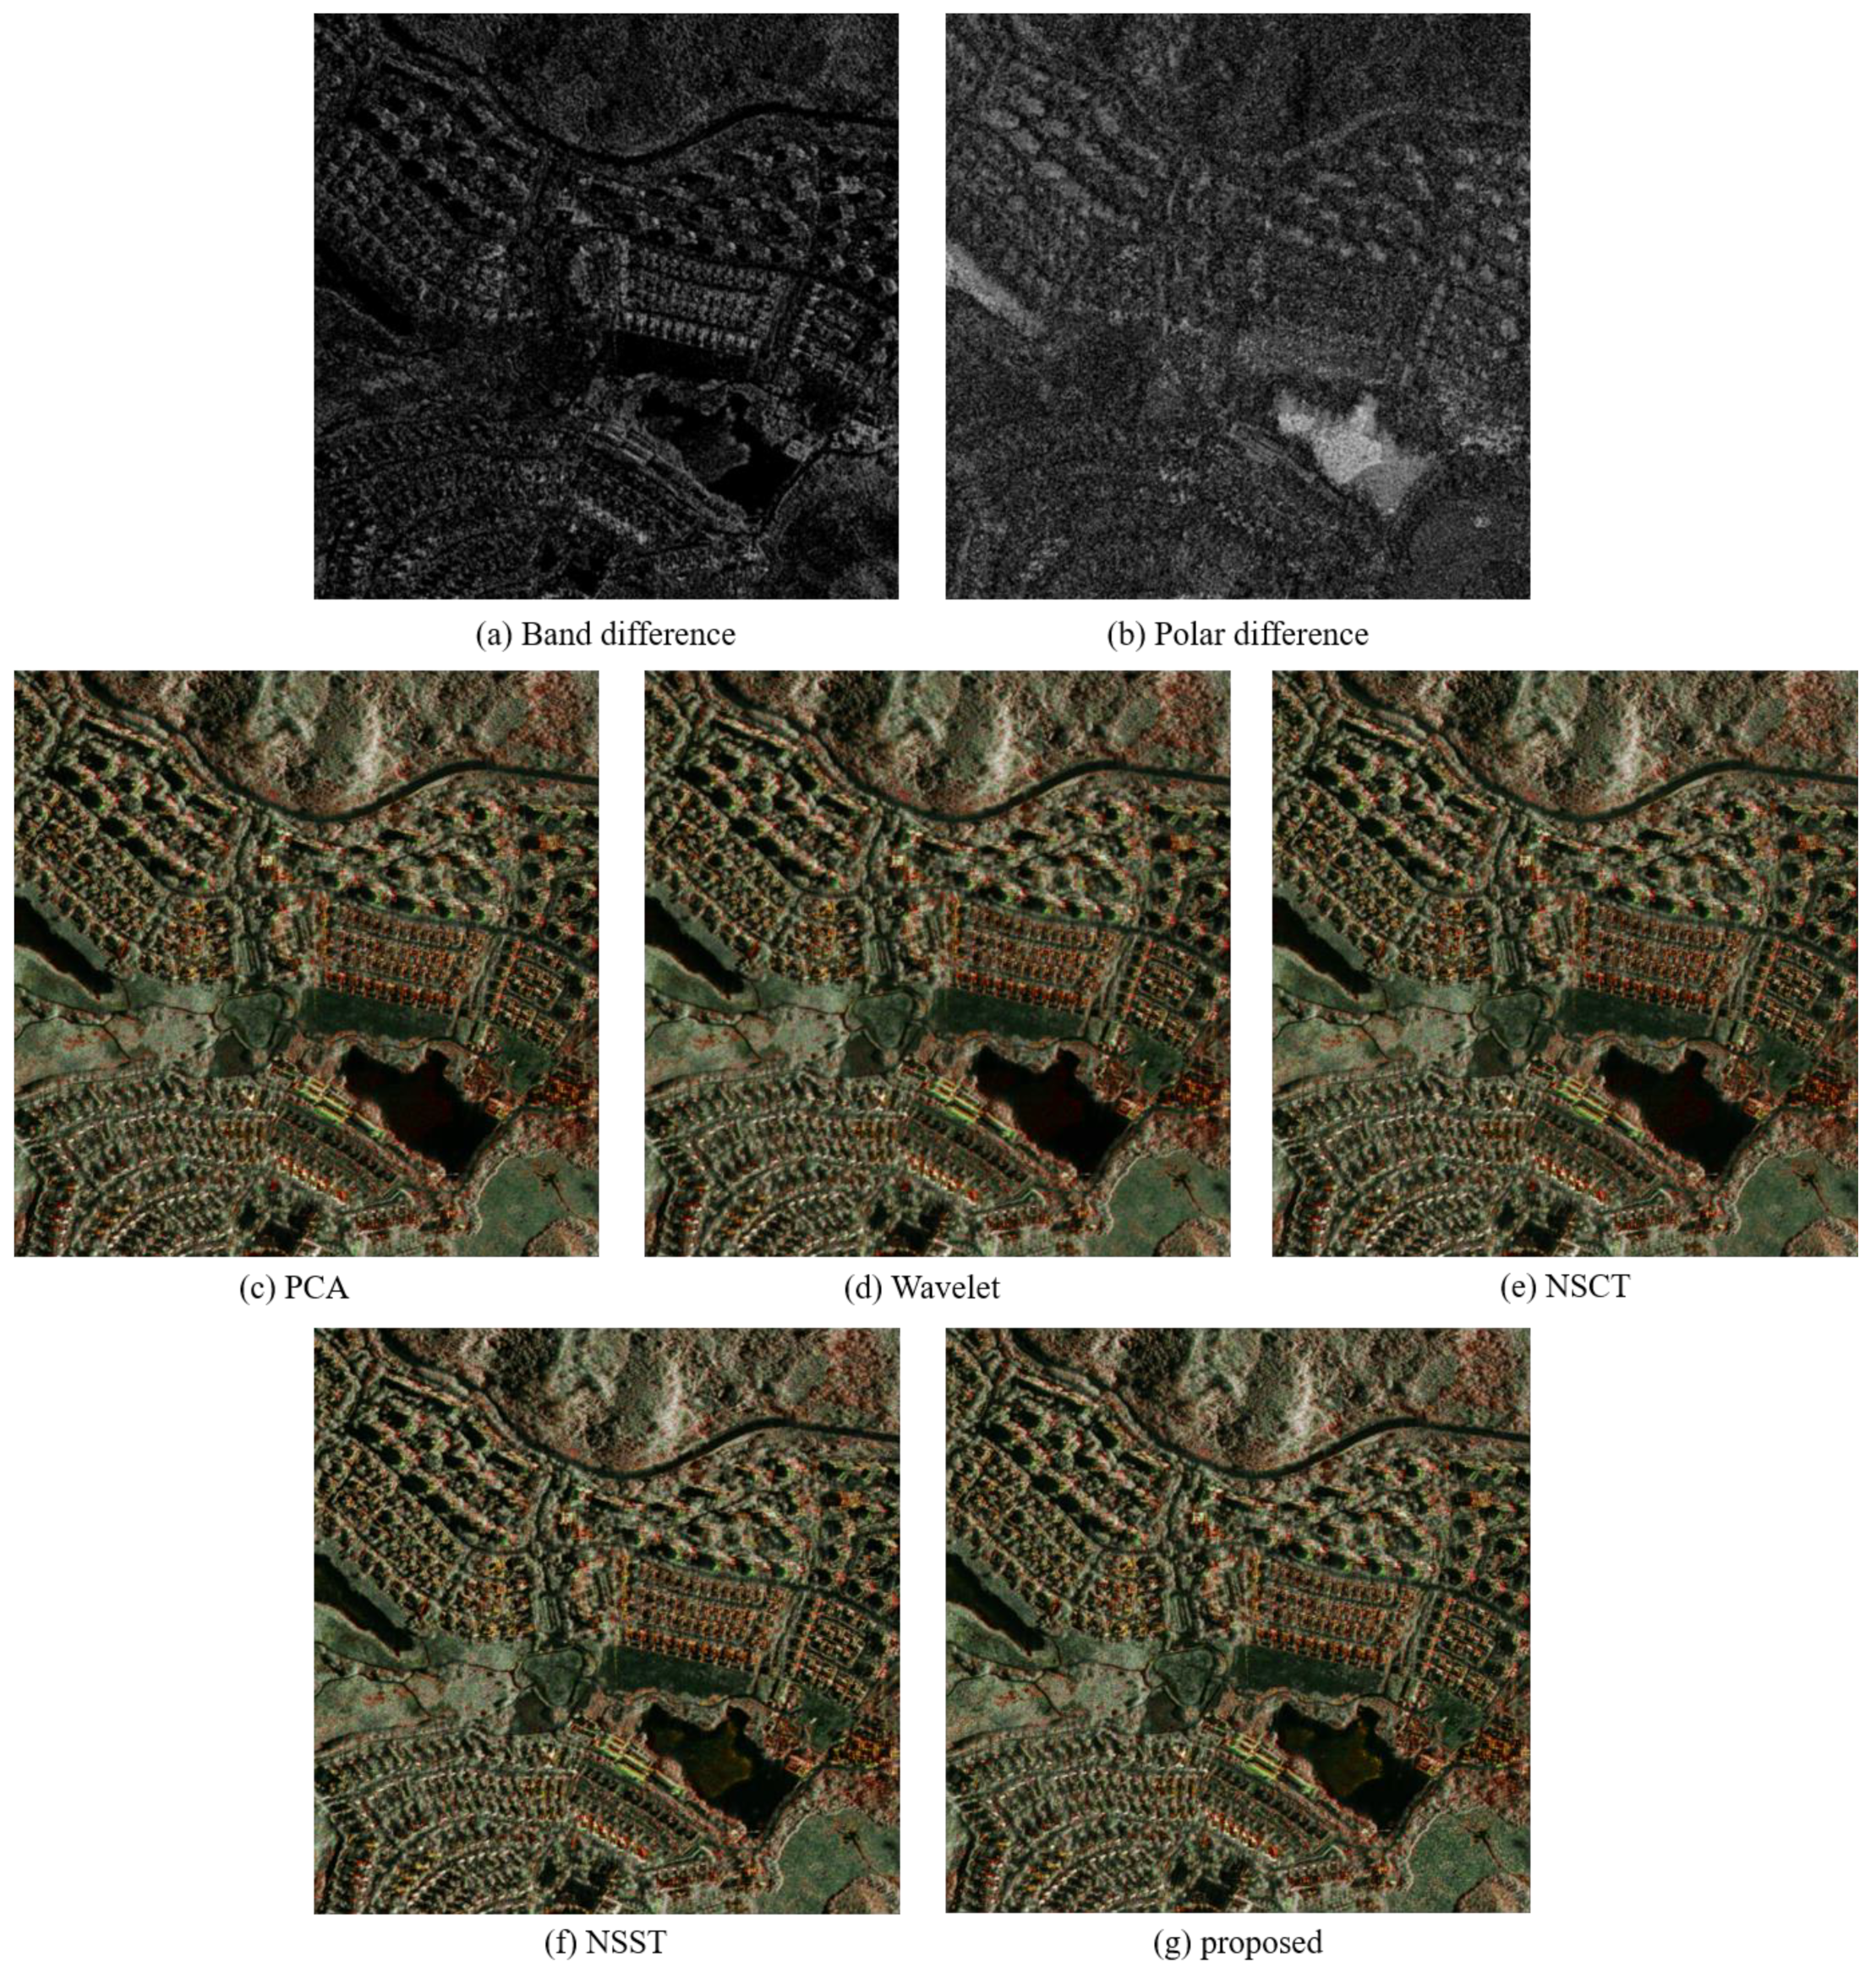
2.3.1. Band Difference Extraction

Since the penetration of the detection microwaves vary from different frequencies, the masked object will show different intensity in the multi-band SAR images. We can locate these objects by extracting the band difference map between the images. The extraction of band difference is conducted as follows:
D B 1 2 x , y = max I B 1 , P 1 x , y max I B 2 , P 2 x , y , P 1 , P 2 H H , H V , V V
in which the I B 1 , P 1 and I B 2 , P 2 represent the different band SAR images at P1 and P2 polarization, respectively. If there are more than two bands, the band differences between each band should be calculated. Then the maximum D B of pixels between each band is retained to obtain the final band difference map, as follows:
D B x , y = max D B 1 2 x , y , D B 2 3 x , y , D B 1 3 x , y
However, large amounts of noise in the SAR image is retained in the D B , which will reduce the quality of the band difference map. To reduce the impact of noise, we calculate the mean of D B in the band difference map. The values less than mean of D B in the band difference map is set to zero, then the map is convolved with 3 × 3 mean filter.

2.3.2. Polarization Difference Extraction

The regions with different surface structures will present different polarization information. Therefore, we can use the color saturation [31] to extract the polarization difference map to distinguish different regions easily.
The color saturation of each pixel in the polarization difference map is calculated as:
S B x , y = 1 3 min I B , P x , y P I B , P x , y , P H H , H V , V V
in which I B , P denotes a certain band SAR image at polarization P. If a pixel has high saturation, the intensity of the pixel varies sharply among the multi-polarization SAR images, indicating that the pixel belongs to a special region. According to the color saturation values of the pixels, we can obtain the mean of them in the polarization difference map. In order to reduce the effect of noise, the values less than mean of S B in the polarization difference map is set to zero, then the map is convolved with 3 × 3 mean filter.
Finally, the maximum S B of pixels in each band is retained to obtain the final polarization difference map, as follows:
S x , y = max S B 1 x , y , S B 2 x , y ,

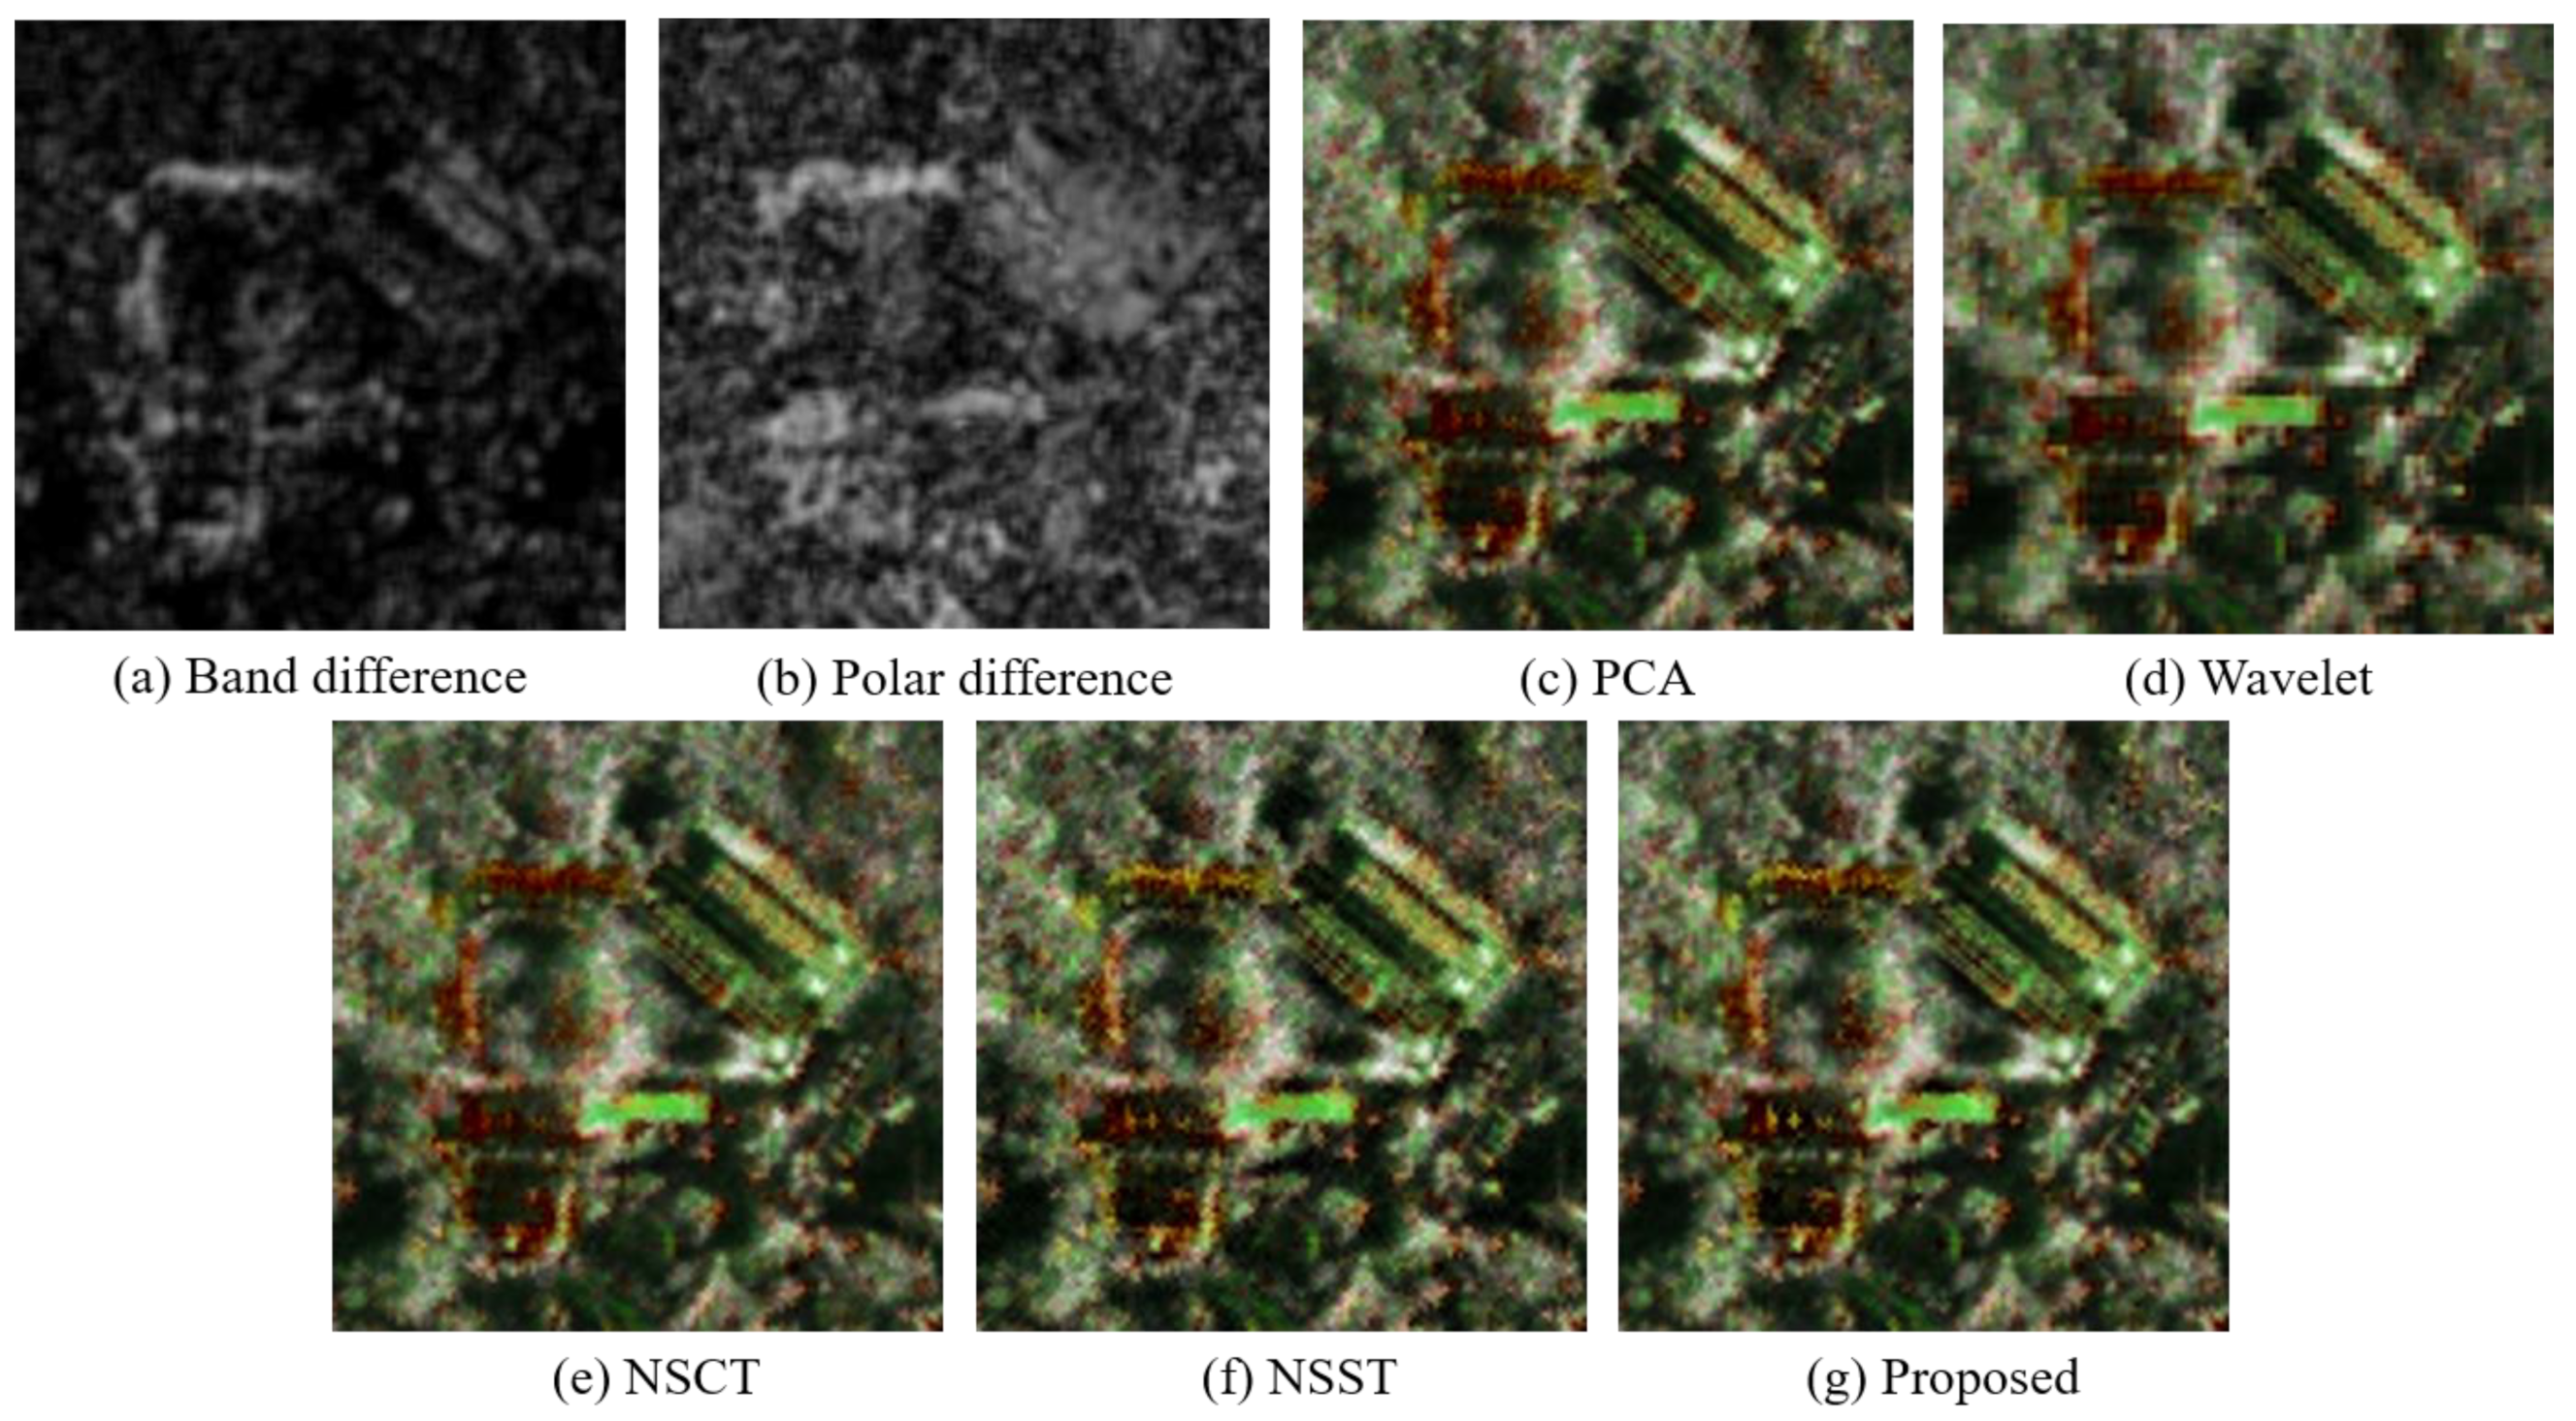
2.3.3. Coloring Rules of Difference Information

So far, we have obtained the fused SAR image, the band difference map as well as the polarization difference map from the multi-band and polarization SAR images. Next, the band and polarization difference maps are expressed on the fused SAR image by different colors.
Since the blue objects cannot be distinguished well in the human eyes because of the low brightness, we use red and green to express the band and polarization difference map, respectively. The regions with both band and polarization differences will appear yellow.
As the polarization difference map is presented as saturation, it is first transformed into the intensity difference as follows:
D P x , y = F x , y * 2 S x , y 1 + S x , y
in which the F is the fused SAR image. The intensity of each color in the fused SAR image is assigned according to the following rules:
R x , y = F x , y + D B x , y D P x , y   ,   D B x , y < D P x , y F x , y   ,   D B x , y D P x , y G x , y = F x , y   ,   D B x , y < D P x , y F x , y D B x , y + D P x , y   ,   D B x , y D P x , y B x , y = F x , y D B x , y   ,   D B x , y D P x , y F x , y D P x , y   ,   D B x , y < D P x , y
After that, we obtain the colorized fused SAR image that contains band and polarization differences information.
The specific flow chart of multi-band and polarization SAR images fusion in this paper is shown in Figure 2.

2.4. Datasets

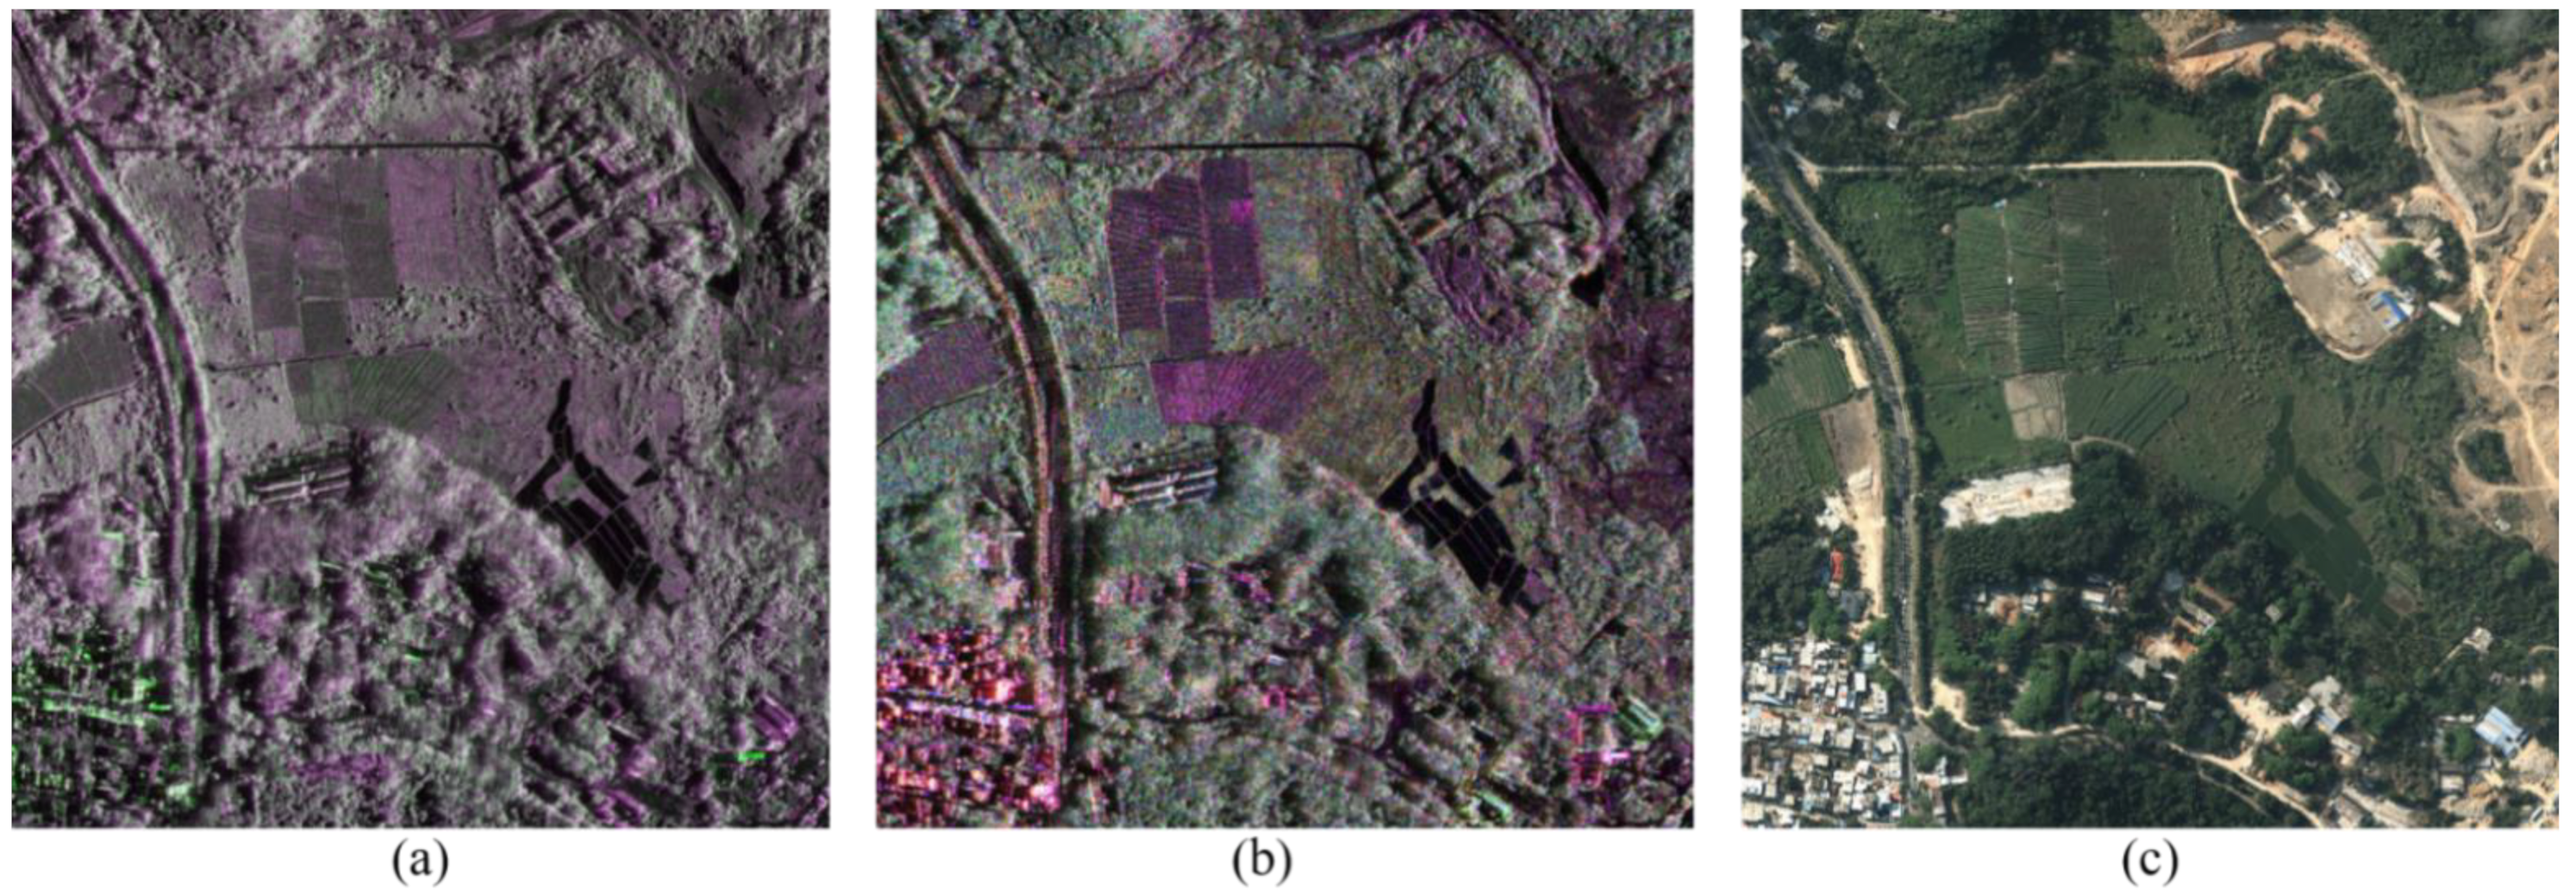
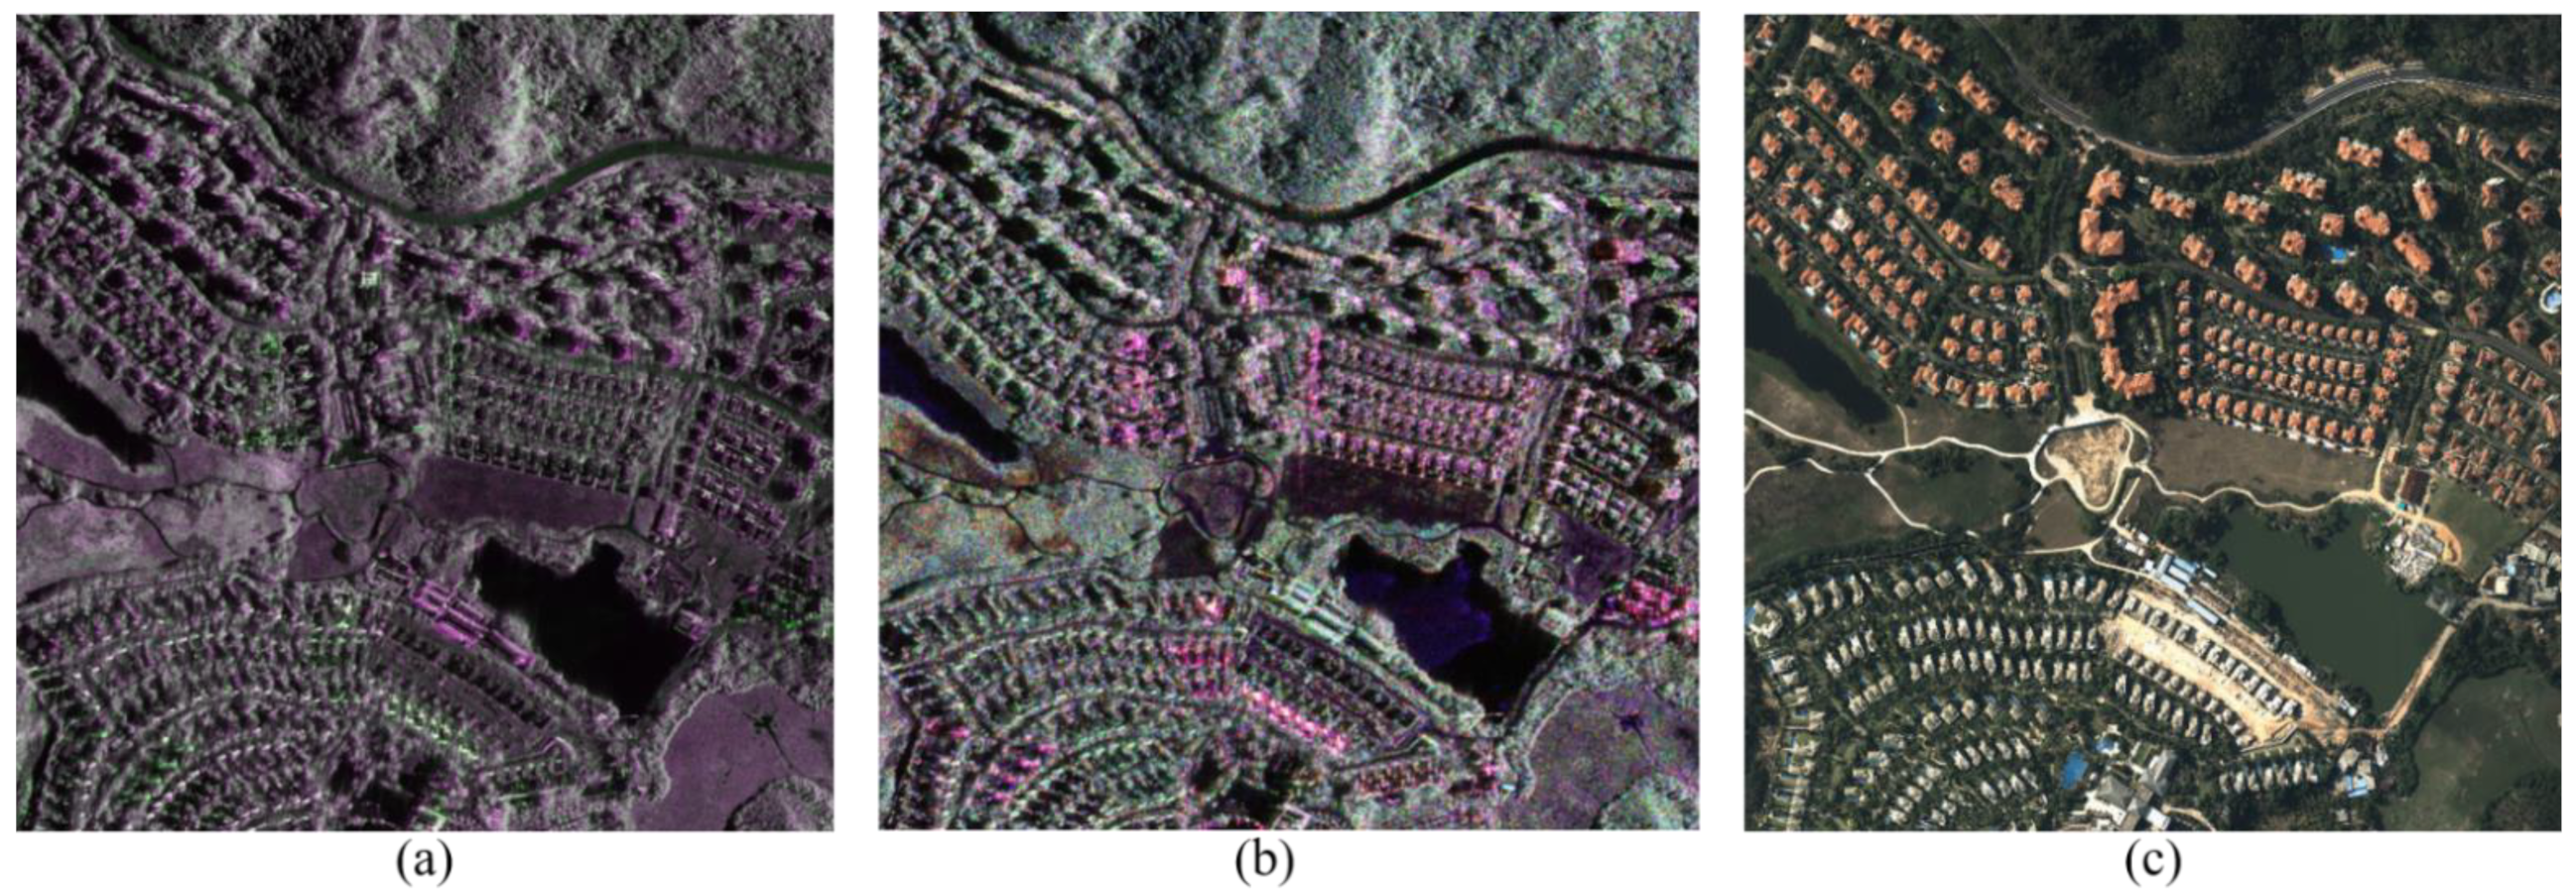
Two pairs of air-borne SAR images were selected for the fusion quality analysis. Each image pair contains two band (Ka and S-band) and three polarization (HH, HV and VV) SAR images. The polarization information is painted in different colors, in which HH is red, HV is green, and VV is blue. The resizing and registration between the multi-band SAR images was accomplished. Each SAR image had the size of 800 × 800 and the resolution of 1 m. We also provide the optical images of the same scenes as references. All images were taken during an airplane flight on 14 March 2021.
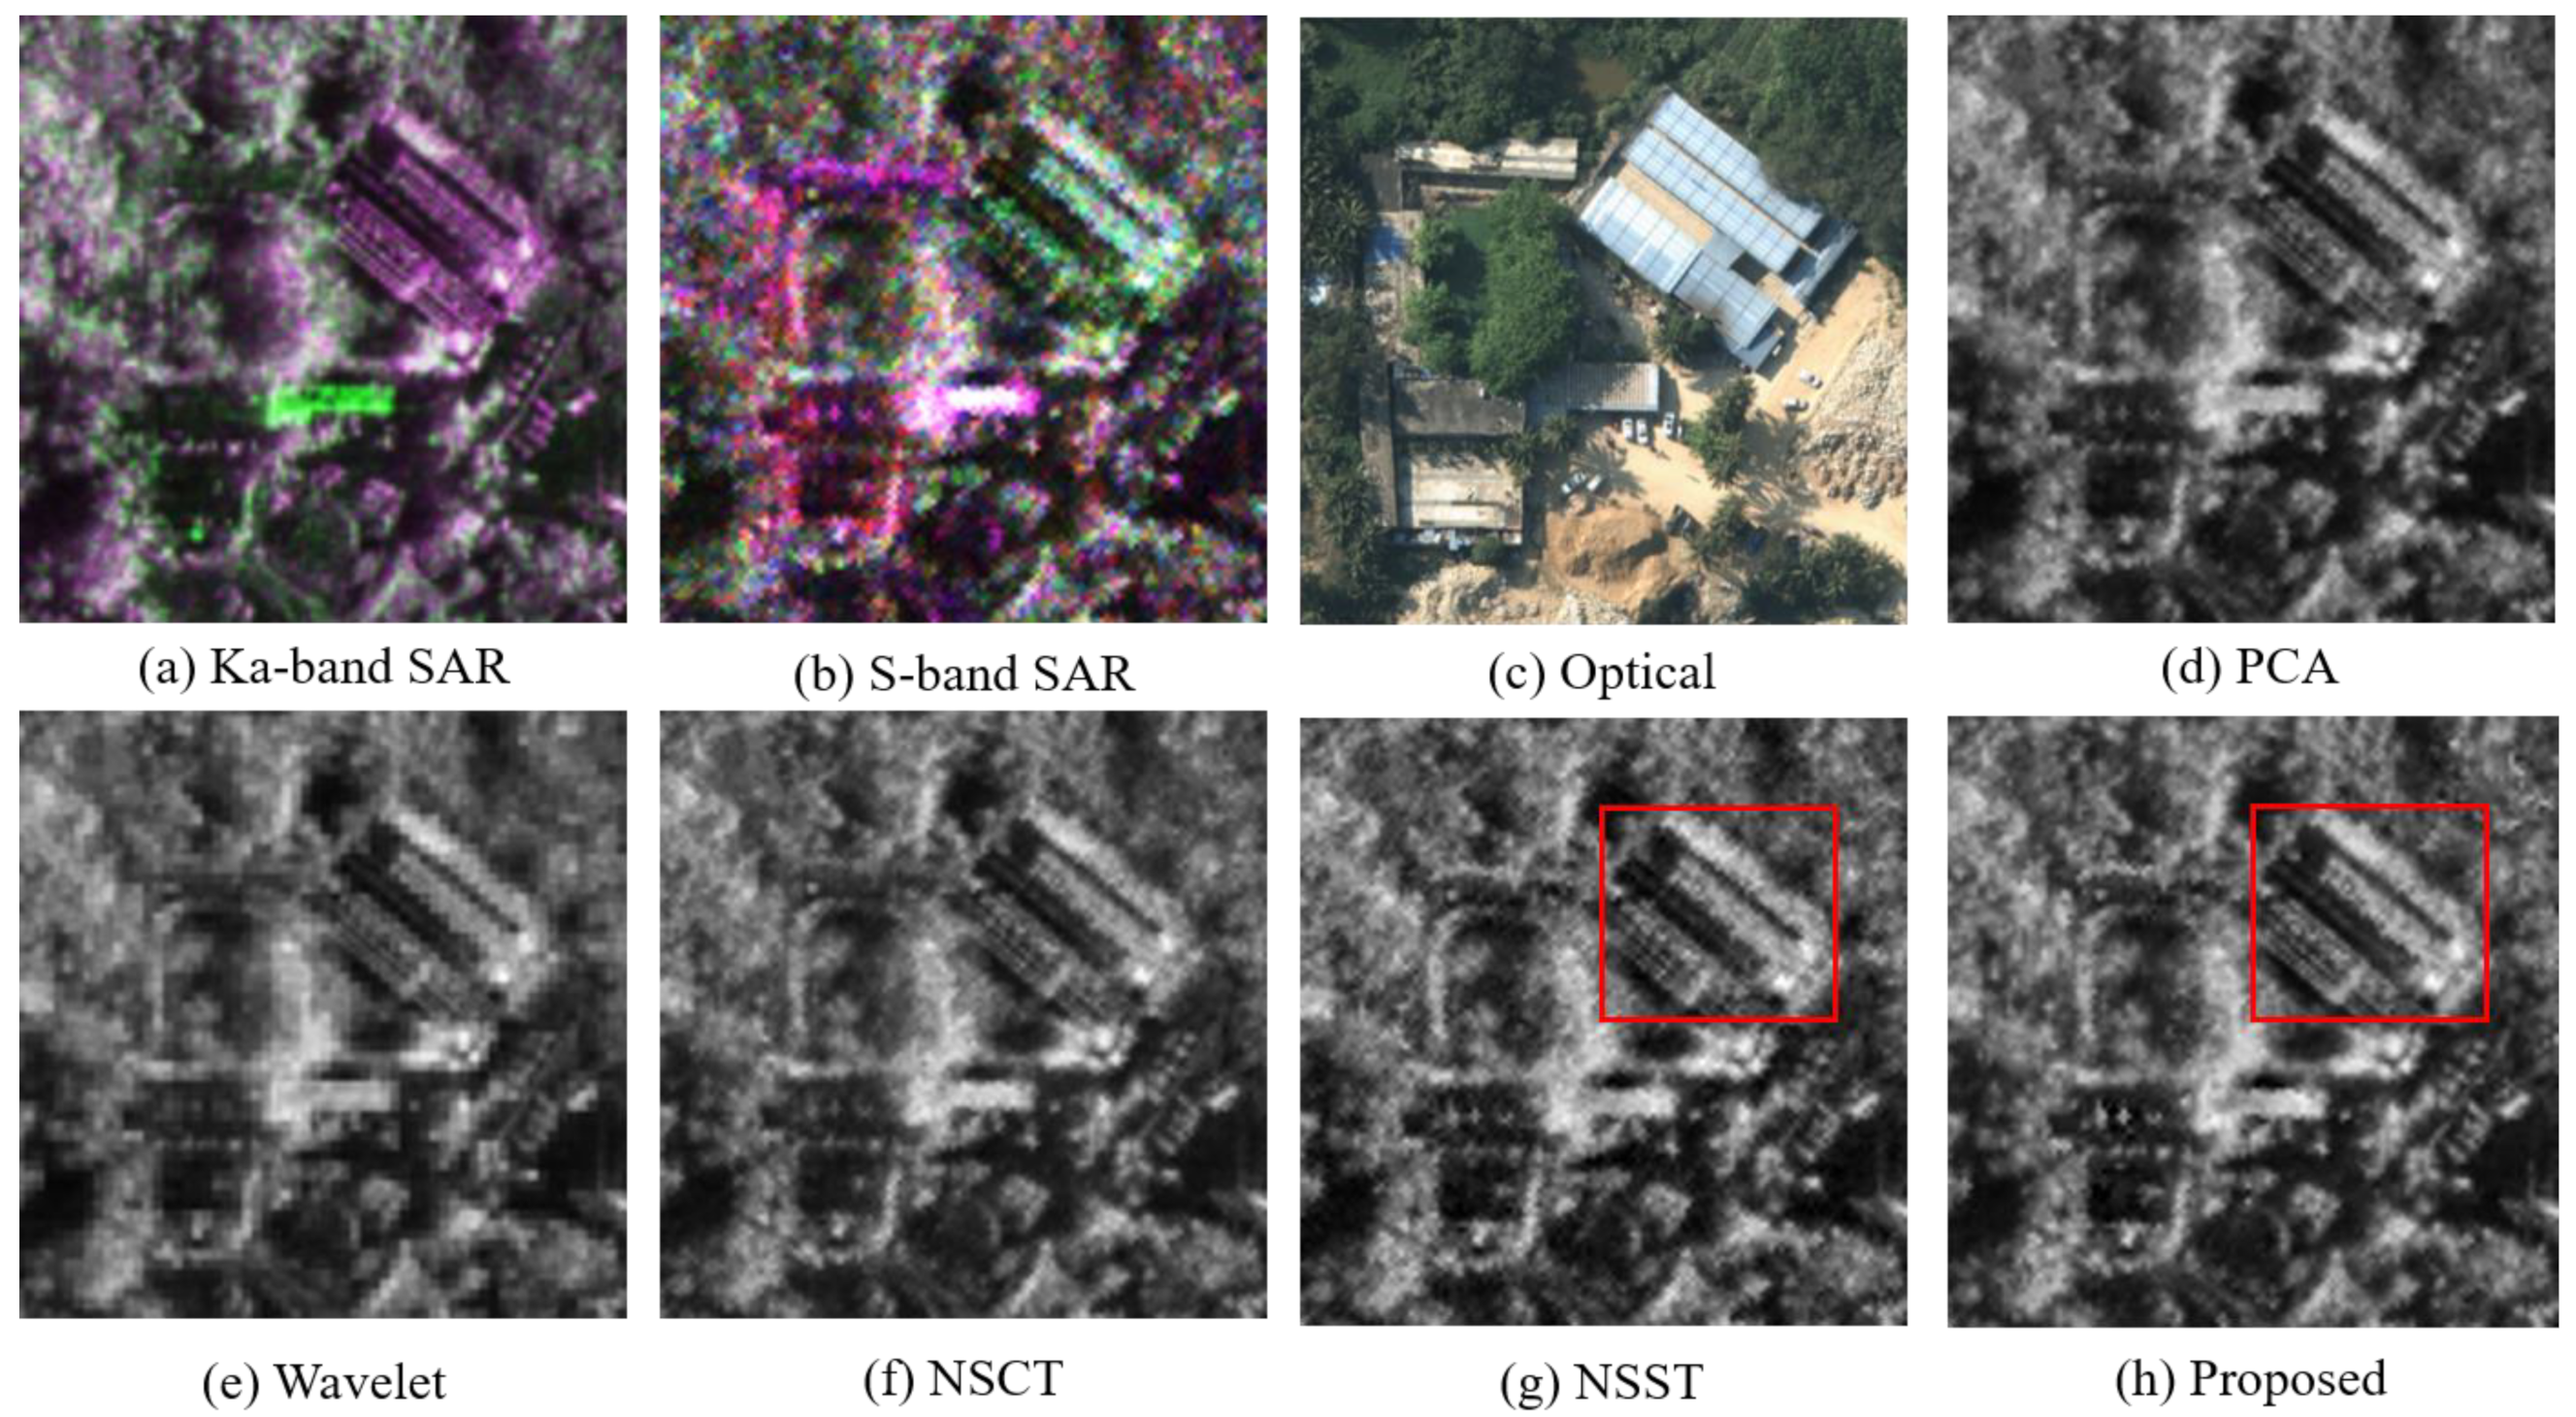
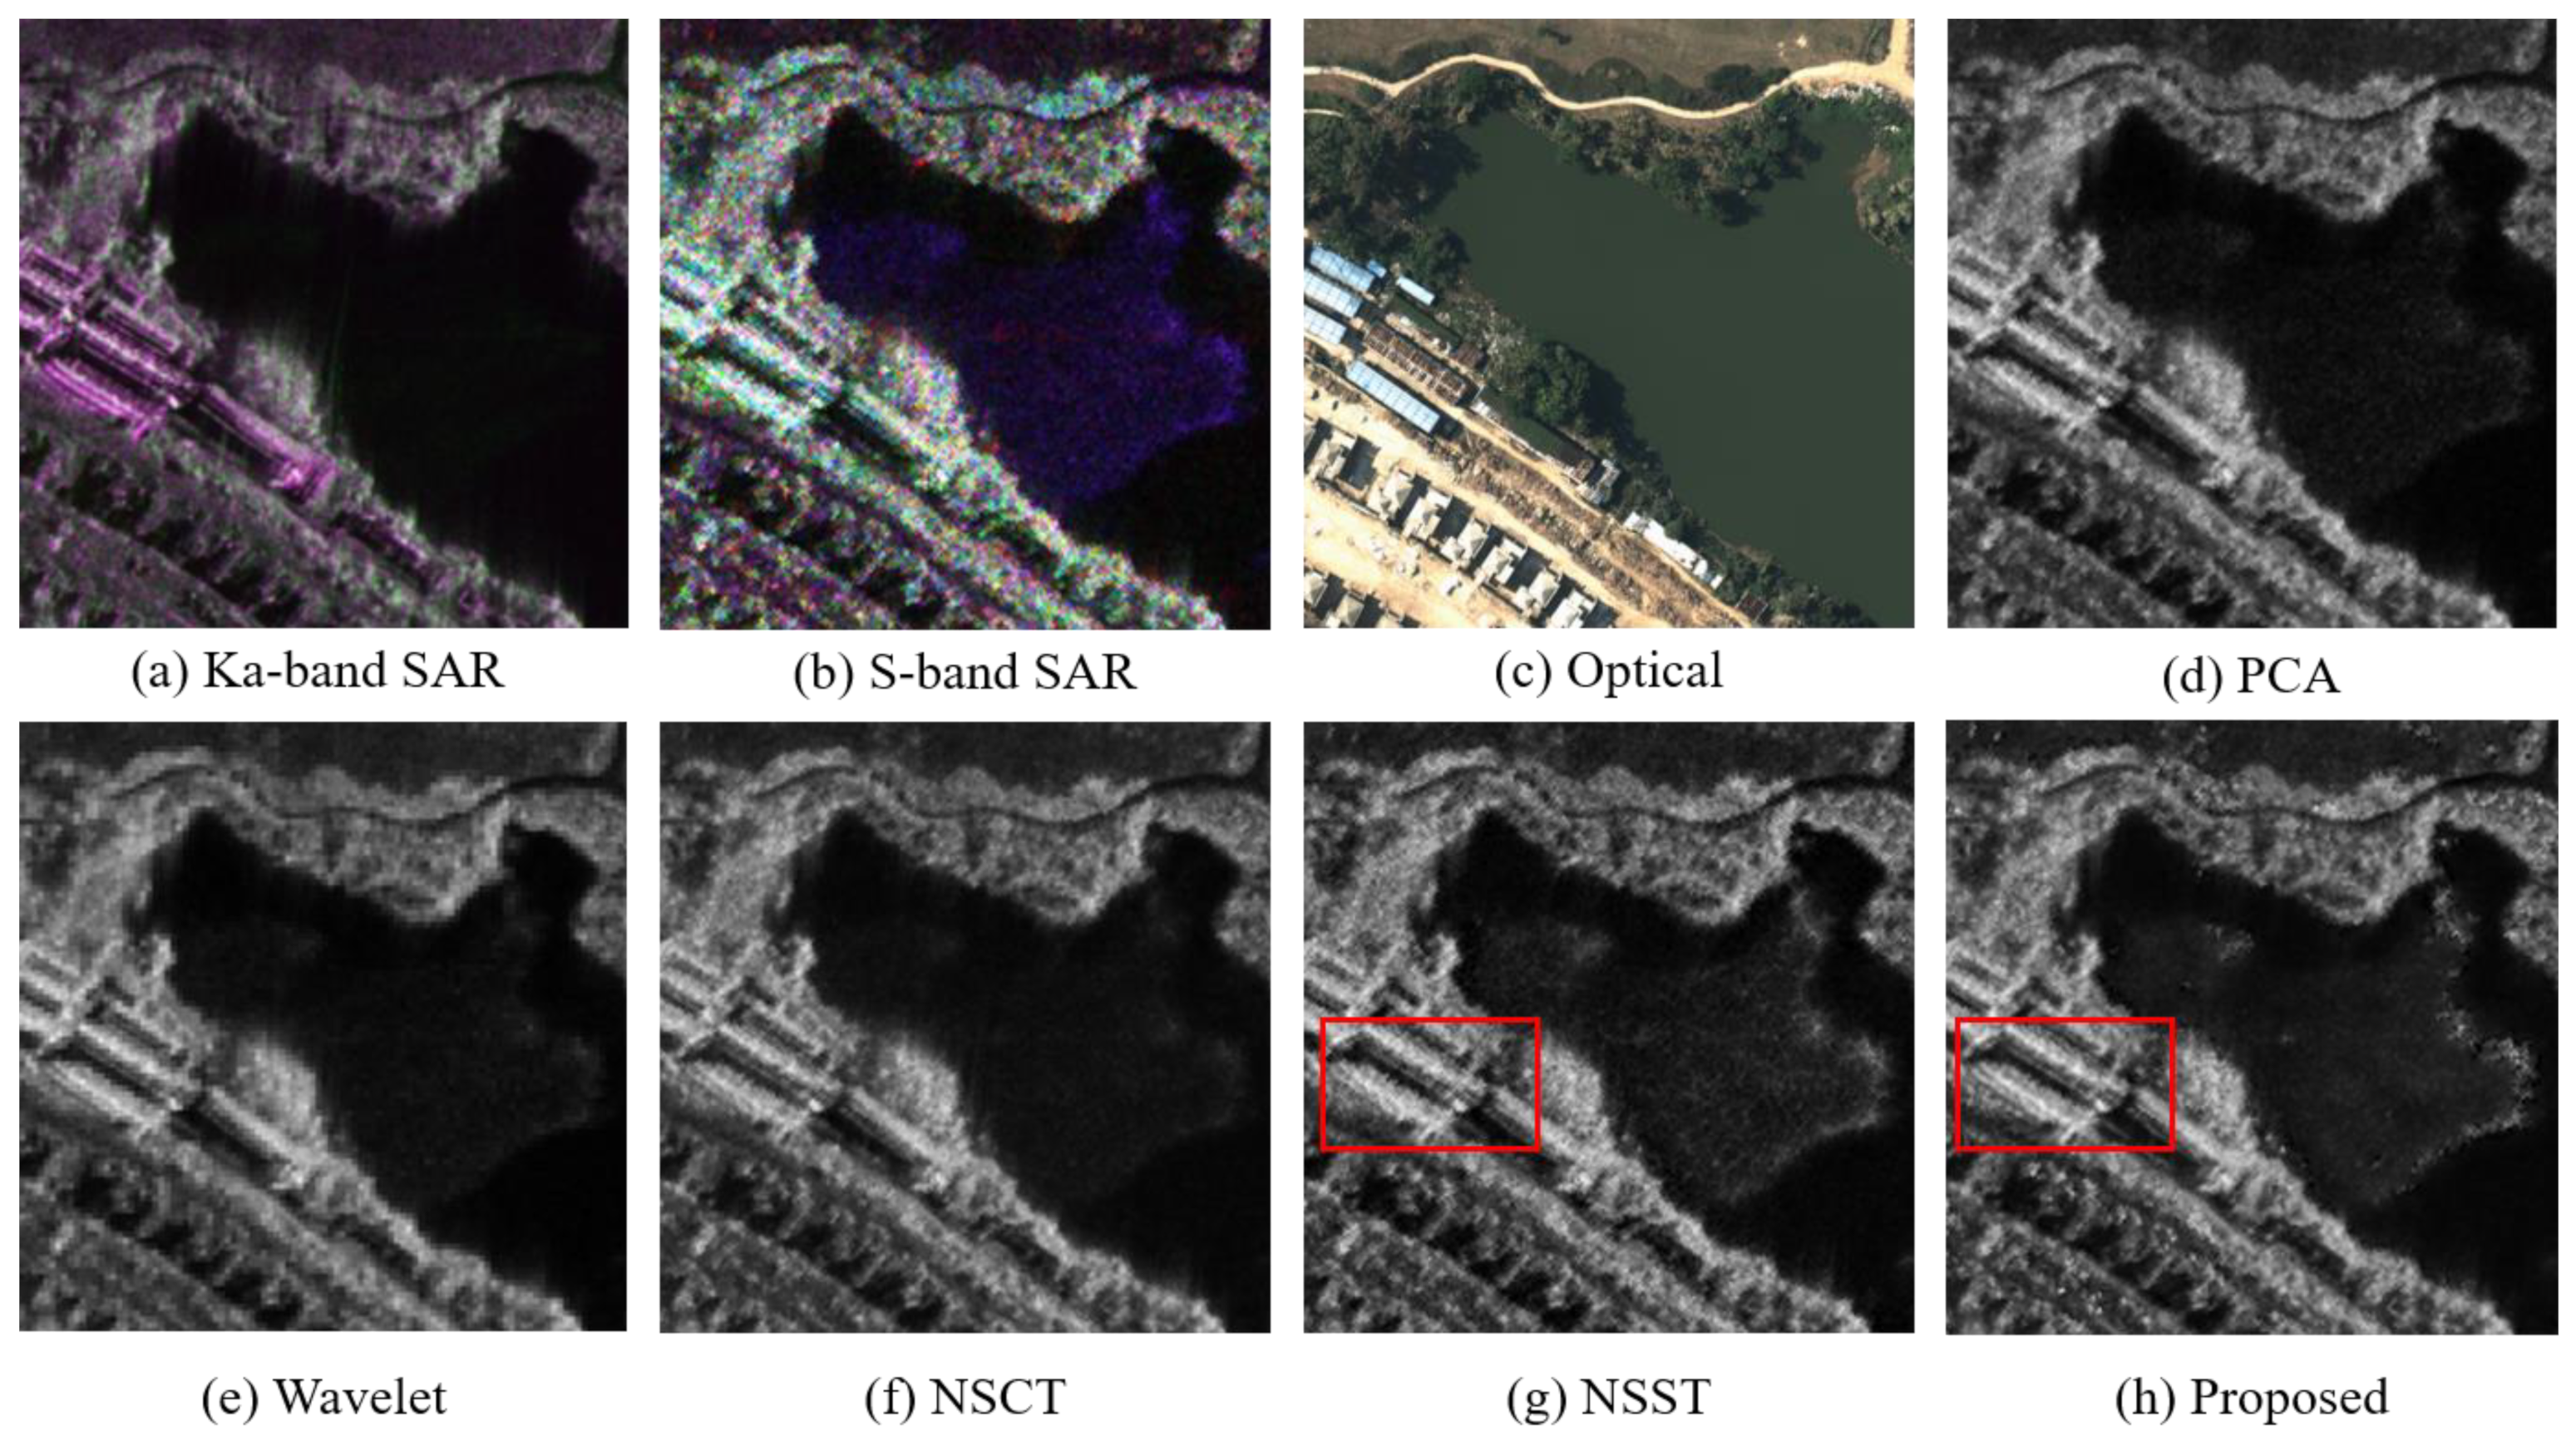
The two pairs of Ka and S-band multi-polarization SAR images are shown in the Figure 3a,b and Figure 4a,b, respectively. Since the frequency of Ka-band microwave is higher than S-band microwave, the Ka-band SAR image has a higher resolution [1,2,3]. After the resizing, the Ka-band multi-polarization SAR images appear sharper than the S-band. Moreover, because the electromagnetic scattering characteristics of objects varies with the frequencies of the detection microwaves, the detailed texture of the objects in the Ka and S-band multi-polarization SAR images is significantly different. Furthermore, the polarization information of the Ka and S-band SAR images is also inconsistent. Since different kinds of objects present different polarization information, we can easily distinguish these regions such as farmlands or buildings from the images according to their own colors.

2.5. Evaluation indexes

Several statistical indexes will be used to evaluate the fused images, which include average gradient (AG), information entropy (IE), standard deviation (STD), correlation coefficient (CC), and structural similarity index measure (SSIM) [4,9]. Their introduction and specific equations are shown as follows:
  • Average Gradient
AG represents the detail-describing ability of the fused image. It can be obtained by calculating the mean of image gradients:
A G = 1 x y x y G x , y
G x , y = 1 2 G x x , y + G y x , y
where G x and G y are the gradients of pixels in the vertical and horizontal directions, respectively. G x and G y can be acquired by convolving the image with 1 / 2 1 / 2 T and 1 / 2 1 / 2 , respectively.
  • Information Entropy
IE is the most intuitive standard for reflecting the amount of image information. The following equation is used to calculate information entropy.
I E = k = 1 L 1 p k log 2 p k
where L is the dynamic range of the image being analyzed, and p k is the probability of occurrence of k t h gray level. In the 8-bit image, L is 255.
  • Standard Deviation
STD is a measure of contrast in the fused image. High contrast in the fused image indicates information richness. Standard deviation can be calculated as follows:
S D = 1 N 1 i = 1 N F i μ 2
where μ is the mean value of the fused image, F, N is the number of the pixels in the fused image.
  • Correlation Coefficient
CC is a measure of the correlation between the reference image and the fused image. It can be calculated as follows:
C C = x y F x , y F ¯ R x , y R ¯ x y F x , y F ¯ 2 x y R x , y R ¯ 2
where F and R are fused and reference images, respectively. F ¯ and R ¯ are mean values of fused and reference images, respectively.
  • Structural Similarity Index Measure
SSIM measures structural similarity between the reference image and the fused image. It is calculated using following equation:
S S I M = 2 μ f u r + C 1 2 σ f r + C 2 μ f 2 + μ r 2 + C 1 σ f 2 + σ r 2 + C 2
where f and r represent the fused and reference images, respectively; μ f and μ r are their mean values; σ f 2 and σ f 2 are their variances; σ f r is the covariance between them; and C 1 and C 2 are small constants for stabilizing denominator with weak division.
It should be noted that if the input image is in color, the image needs to be converted to a grayscale image first.

3. Experiments

3.1. Comparison of Fusion Results

We first selected a special region in each scene to analyze the performance of the proposed fusion method. As mentioned in Section 2, these SAR images are firstly decomposed by three-level NSST, in which the number of decomposition directions is 1 , 4 , 8 . Subsequently, the low-frequency and high-frequency sub-band images obtained from the decomposition are respectively fused according to the CV and PC. Next, the inverse NSST transform of the fused sub-band images is conducted to obtain the fused SAR image. We also present the results of various image fusion methods as the comparison, which include principal component analysis (PCA) [17], wavelet transform [16], non-subsampled contourlet transform (NSCT) [32], and primary NSST [9].
Figure 5a–c show the special region in scene 1. In this region, the Ka-band SAR image possesses high sharpness and rich detail information, but it does not present complete building information. On the contrary, the S-band SAR image shows the masked building due to the high penetration of the S-band microwave, but it is filled with noise. Figure 5d–h present the results of various fusion methods of the representative region in scene 1. Among them, the wavelet-based fused image (Figure 5e) does not preserve detailed texture. The fused images of PCA and NSCT (Figure 5d,f) retain a part of detailed texture, but the masked building is not apparent enough. Both the NSST and proposed fusion images (Figure 5g,h) present clear buildings. However, as we enlarge the marked regions (Figure 6a,b), the contour of the building in the NSST fusion image is blurred by noise. In contrast, the building in the proposed fusion image is sharper.
Figure 7a–c show the special region in scene 2. The Ka-band SAR image has higher visual performance, but lacks underwater information. The S-band SAR image has underwater information, but its visual performance is poor. Figure 7d–h present the results of the fusion methods. Similar to the results of scene 1, the fused images of PCA, wavelet, and NSCT do not preserve much detailed texture. Additionally, both the NSST and the proposed method present clear underwater information. After enlarging the marked regions in the NSST and proposed fusion images (Figure 8a,b), we can observe that the texture in the NSST is covered by noise, but the texture in the proposed fusion image is presented in detail. These fusion results demonstrate that the proposed fusion method can remove much noise while retaining the detailed information of the original images, which outperforms other methods.

3.2. Comparison of Colorization Results

Although the fusion methods compress the information of the SAR images, it is difficult to distinguish different regions from the grayscale map. To facilitate the use of the fusion image, we extract the band and polarization difference information from the SAR images and then inserted the information into the fusion results according to the coloring rules.
Figure 9a,b show the band and polarization difference maps extracted from special region 1, respectively. From the difference maps we can see that all buildings in this region have unique polarization information, whereas the masked building have additional band difference. After the colorization, the visual performance of all fusion images is dramatically improved, as shown in Figure 9c–g. With the color distribution, we can easily locate the buildings. In particular, the exposed building is painted in green because of its special polarization information. In contrast, we marked the masked building in red due to its band difference. Benefiting from the fusion method, the colorized proposed fusion image reveals more completed building information and sharper contour than other colorized fusion images.
Difference extraction and colorization were also conducted on special region 2. According to the band and polarization difference maps (Figure 10a,b), the buildings are painted in green due to their special polarization information. The underwater information consists of both band and polarization differences and thus. is painted in yellow. In the colorized results (Figure 10c–g), the PCA, wavelet, and NSCT display little underwater information. Both the NSST and proposed fusion images highlight the underwater information, but the colorized proposed fusion image retains more detailed texture and less noise. These results demonstrate that the proposed fusion method is more suitable for colorization.
The complete difference maps and colorization fusion results of scenes 1 and 2 are shown in Figure 11 and Figure 12, respectively. We can see that the band and polarization difference maps mark the location of the special regions. Even at larger scales, we can still spot the buildings or farmland from the colorized fusion results at a glance. Furthermore, the special objects can be easily located according to their outstanding colors. These results prove that the colorization fusion method can not only preserve the valuable information from the multi-band and polarization SAR images, but also reduce the difficulty of interpreting the SAR images.
However, it is difficult for human eyes to compare these large-scale images. Therefore, we used various statistical evaluation indexes to complete the comparison.

3.3. Comparison of Evaluation Indexes

This section contains the analysis of various evaluation indexes for the colorized fusion images in Figure 11 and Figure 12. The evaluation indexes include average gradient (AG), information entropy (IE), standard deviation (STD), correlation coefficient (CC), and structural similarity index measure (SSIM). The Ka-band SAR image is used as the reference image in the CC and SSIM indexes.
AG, IE, and STD can reflect the abundance of the texture in the image. The more texture information in the image, the higher the value of these three indexes. As shown in Table 1 and Table 2, both the proposed methods present the highest values of the three indexes, which is consistent with the results of the visual-based analysis. The index results of the two scenes have a similar distribution. The three indexes of the PCA, wavelet, and NSCT fusion images are lower than the proposed fusion images, because these methods do not preserve much detail texture. The NSST-based fusion images retained both detail texture and noise, and thus their AG, IE and STD indexes is close to the proposed fusion images. Since the proposed fusion method preserves the detail texture while avoiding most of the noise, the AG, IE, and STD of the proposed fusion images are higher than the NSST.
CC and SSIM measure the similarity between the colorized fusion images and the Ka-band SAR images. The lower the CC and SSIM indexes are, the less information is retained from the Ka-band SAR images, i.e., the more information from the S-band SAR image. Although the S-band SAR images have less detail information than the Ka-band SAR images, they have some additional information, such as masked building and underwater information, that is worth preserving. Therefore, the indexes of CC and SSIM imply the ability of these fusion method to retain the additional information. In Table 1 and Table 2, the CC and SSIM of the wavelet fusion images are the highest, which indicates that wavelet fusion images preserve less information from the S-band SAR images. On the contrary, since the proposed fusion method makes full use of the information from the S-band SAR images, the CC and SSIM of the proposed fusion images are lowest.
We also recorded the running time of each fusion method. We can see that the computational speed of NSST is significantly faster than the NSCT. Compared with NSST, the proposed fusion method needs more time because of the additional sub-band fusion rules.
As mentioned above, compared with other fused images, the proposed fusion images have better performance. The AG, IE, and STD prove that the proposed fusion images retain more detail information, and the CC and SSIM prove that the proposed fusion images preserve more additional information from the S-band SAR images. Therefore, we can conclude that the proposed image fusion method for multi-band and polarization SAR images can achieve the SAR image information fusion with high quality.

4. Conclusions

In this paper, we proposed a multi-band and polarization SAR images colorization fusion method, in which the fusion image is improved by the band and polarization difference extracted from the SAR images. In the proposed method, the fused image is acquired from the NSST transform and the CV and PC weighted sub-band image fusion rules. Then, the fused image is colorized based on the intensity difference of the bands and the color saturation of the polarizations. We chose two representative multi-band and polarization SAR image pairs for the analysis of the fusion methods. Both the visual and quantitative evaluations prove that the proposed fusion images own more detail information and less noise. Moreover, the colorization process dramatically enhanced the visual performance of the fusion images. In the proposed fusion images, image user can easily locate the regions that are masked or have special surface structure.

Author Contributions

X.L., D.J. and Y.L. conceptualized the study and contributed to the article’s organization; X.L., L.G., L.H., Q.X., M.X. and Y.H. contributed to the discussion of the design; X.L. drafted the manuscript. All authors have read and agreed to the published version of the manuscript.

Funding

This research was funded by the National Key R&D Program of China (the foundation strengthening project) (grant number 2018YFA0701903), the National Major in High Resolution Earth Observation (grant numbers GFZX0403260313, 11-H37B02-9001-19/22 and 30-H30C01-9004-19/21), the Research Plan Project of National University of Defense Technology (grant number ZK18-01-02), the National Natural Science Foundation of China (grant number 61801345), the Fundings of Shaanxi innovation team (grant number 2019TD-002).

Data Availability Statement

The data presented in this study are available on request from the corresponding author.

Acknowledgments

The authors thank the Institute of Electrics, Chinese Academy of Sciences, for providing the multi-band and polarization SAR images.

Conflicts of Interest

The authors declare no conflict of interest.

References

  1. Franceschetti, G.; Lanari, R. Synthetic Aperture Radar Processing; CRC Press: Boca Raton, FL, USA, 2018. [Google Scholar]
  2. McDonough, R.N. Synthetic Aperture Radar: Systems and Signal Processing; Wiley: Hoboken, NJ, USA, 1991. [Google Scholar]
  3. Hovanessian, S.A. Introduction to Synthetic Array and Imaging Radars; Artech House: Dedham, MA, USA, 1980. [Google Scholar]
  4. Kulkarni, S.C.; Rege, P.P. Pixel level fusion techniques for SAR and optical images: A review. Inf. Fusion 2020, 59, 13–29. [Google Scholar] [CrossRef]
  5. Shah, E.; Jayaprasad, P.; James, M.E. Image fusion of SAR and optical images for identifying Antarctic ice features. J. Indian Soc. Remote Sens. 2019, 47, 2113–2127. [Google Scholar] [CrossRef]
  6. Byun, Y.; Choi, J.; Han, Y. An area-based image fusion scheme for the integration of SAR and optical satellite imagery. IEEE J. Sel. Top. Appl. Earth Obs. Remote Sens. 2013, 6, 2212–2220. [Google Scholar] [CrossRef]
  7. Li, W.; Jiang, N.; Ge, G. Analysis of Spectral Characteristics Based on Optical Remote Sensing and SAR Image Fusion. Agric. Sci. Technol. 2014, 15, 2035. [Google Scholar]
  8. Wu, Y.; Wang, Z. SAR and infrared image fusion in complex contourlet domain based on joint sparse representation. J. Radars 2017, 6, 349–358. [Google Scholar]
  9. Chu, T.; Tan, Y.; Liu, Q.; Bai, B. Novel fusion method for SAR and optical images based on non-subsampled shearlet transform. Int. J. Remote Sens. 2020, 41, 4590–4604. [Google Scholar] [CrossRef]
  10. Gao, J.; Yuan, Q.; Li, J.; Zhang, H.; Su, X. Cloud removal with fusion of high resolution optical and SAR images using generative adversarial networks. Remote Sens. 2020, 12, 191. [Google Scholar] [CrossRef]
  11. Teimouri, M.; Mokhtarzade, M.; Valadan Zoej, M.J. Optimal fusion of optical and SAR high-resolution images for semiautomatic building detection. GIScience Remote Sens. 2016, 53, 45–62. [Google Scholar] [CrossRef]
  12. Jiang, X.; He, Y.; Li, G.; Liu, Y.; Zhang, X.-P. Building damage detection via superpixel-based belief fusion of space-borne SAR and optical images. IEEE Sens. J. 2019, 20, 2008–2022. [Google Scholar] [CrossRef]
  13. Li, W.; Liu, L.; Zhang, J. Fusion of SAR and Optical Image for Sea Ice Extraction. J. Ocean Univ. China 2021, 20, 1440–1450. [Google Scholar] [CrossRef]
  14. Liu, J.; Chen, H.; Wang, Y. Multi-Source Remote Sensing Image Fusion for Ship Target Detection and Recognition. Remote Sens. 2021, 13, 4852. [Google Scholar] [CrossRef]
  15. Zhang, W.; Jiao, L.; Liu, F.; Yang, S.; Liu, J. Adaptive Contourlet Fusion Clustering for SAR Image Change Detection. IEEE Trans. Image Process. 2022, 31, 2295–2308. [Google Scholar] [CrossRef]
  16. Jin, Y.; Ruliang, Y.; Ruohong, H. Pixel level fusion for multiple SAR images using PCA and wavelet transform. In Proceedings of the 2006 CIE International Conference on Radar, Shanghai, China, 16–19 October 2006; pp. 1–4. [Google Scholar]
  17. Wu, T.; Ren, Q.; Chen, X.; Niu, L.; Ruan, X. Highway bridge detection based on PCA fusion in airborne multiband high resolution SAR images. In Proceedings of the 2011 International Symposium on Image and Data Fusion, Tengchong, China, 9–11 August 2011; pp. 1–3. [Google Scholar]
  18. Guida, R.; Ng, S.W.; Iervolino, P. S-and x-band sar data fusion. In Proceedings of the 2015 IEEE 5th Asia-Pacific Conference on Synthetic Aperture Radar (APSAR), Singapore, 1–4 September 2015; pp. 578–581. [Google Scholar]
  19. Sukawattanavijit, C.; Chen, J. Fusion of multi-frequency SAR data with THAICHOTE optical imagery for maize classification in Thailand. In Proceedings of the 2015 IEEE International Geoscience and Remote Sensing Symposium (IGARSS), Milan, Italy, 26–31 July 2015; pp. 617–620. [Google Scholar]
  20. Ruan, X.; Chen, X.; Wu, T.; Tan, J.; Wu, B.; Jiang, K. Performance experiment of classification using chinese airborne multi-band and multi-polar SAR data. In Proceedings of the 2011 International Symposium on Image and Data Fusion, Tengchong, China, 9–11 August 2011; pp. 1–4. [Google Scholar]
  21. Song, L.; Liu, A.; Huang, Z. A Multichannel SAR-GMTI Method Based on Multi-Polarization SAR Image Fusion. In Proceedings of the 2021 IEEE 5th Advanced Information Technology, Electronic and Automation Control Conference (IAEAC), Chongqing, China, 12–14 March 2021; Volume 5, pp. 2678–2684. [Google Scholar]
  22. Zhu, D.; Wang, X.; Cheng, Y.; Li, G. Vessel Target Detection in Spaceborne–Airborne Collaborative SAR Images via Proposal and Polarization Fusion. Remote Sens. 2021, 13, 3957. [Google Scholar] [CrossRef]
  23. Easley, G.; Labate, D.; Lim, W.Q. Sparse directional image representations using the discrete shearlet transform. Appl. Comput. Harmon. Anal. 2008, 25, 25–46. [Google Scholar] [CrossRef]
  24. Stepniak, C. Coefficient of Variation. In International Encyclopedia of Statistical Science; Springer: Berlin/Heidelberg, Germany, 2011. [Google Scholar]
  25. Morrone, M.C.; Owens, R.A. Feature detection from local energy. Pattern Recognit. Lett. 1987, 6, 303–313. [Google Scholar] [CrossRef]
  26. Ye, Y.; Shan, J.; Bruzzone, L.; Shen, L. Robust registration of multimodal remote sensing images based on structural similarity. IEEE Trans. Geosci. Remote Sens. 2017, 55, 2941–2958. [Google Scholar] [CrossRef]
  27. Wang, L.; Sun, M.; Liu, J.; Cao, L.; Ma, G. A robust algorithm based on phase congruency for optical and SAR image registration in suburban areas. Remote Sens. 2020, 12, 3339. [Google Scholar] [CrossRef]
  28. Xiang, Y.; Tao, R.; Wang, F.; You, H.; Han, B. Automatic registration of optical and sar images via improved phase congruency model. IEEE J. Sel. Top. Appl. Earth Obs. Remote Sens. 2020, 13, 5847–5861. [Google Scholar] [CrossRef]
  29. Kovesi, P. Image features from phase congruency. Videre J. Comput. Vis. Res. 1999, 1, 1–26. [Google Scholar]
  30. Kovesi, P. Phase congruency detects corners and edges. In Proceedings of the The Australian Pattern Recognition Society Conference, DICTA 2003, Sydney, Australia, 10–12 December 2003. [Google Scholar]
  31. Tu, T.M.; Su, S.C.; Shyu, H.C.; Huang, P.S. A new look at IHS-like image fusion methods. Inf. Fusion 2001, 2, 177–186. [Google Scholar] [CrossRef]
  32. Meng, F.; Song, M.; Guo, B.; Shi, R.; Shan, D. Image fusion based on object region detection and non-subsampled contourlet transform. Comput. Electr. Eng. 2017, 62, 375–383. [Google Scholar] [CrossRef]
Figure 1. Three-level NSST decomposition of source image.
Remotesensing 14 04022 g001
Figure 2. Flow chart of the proposed fusion method for multi-band and polarization SAR images.
Remotesensing 14 04022 g002
Figure 3. Scene 1. (a) Ka-band multi-polarization SAR image. (b) S-band multi-polarization SAR image. (c) Optical image.
Remotesensing 14 04022 g003
Figure 4. Scene 2. (a) Ka-band multi-polarization SAR image. (b) S-band multi-polarization SAR image. (c) Optical image.
Remotesensing 14 04022 g004
Figure 5. Representative region in scene 1 and its fusion results: (a) Ka-band SAR image; (b) S-band SAR image; (c) optical image; (d) PCA fusion; (e) wavelet fusion; (f) NSCT fusion; (g) NSST fusion and (h) proposed method fusion.
Remotesensing 14 04022 g005
Figure 6. Enlarged marked region in scene 1: (a) Enlarged marked region in the NSST fusion; and (b) enlarged marked region in the proposed method fusion.
Remotesensing 14 04022 g006
Figure 7. Representative region in scene 2 and its fusion results: (a) Ka-band SAR image; (b) S-band SAR image; (c) optical image; (d) PCA fusion; (e) wavelet fusion; (f) NSCT fusion; (g) NSST fusion; and (h) proposed method fusion.
Remotesensing 14 04022 g007
Figure 8. Enlarged marked region in scene 2: (a) Enlarged marked region in the NSST fusion and (b) enlarged marked region in the proposed method fusion.
Remotesensing 14 04022 g008
Figure 9. Band difference map, polarization difference map, and colorized fusion results of special region in scene 1: (a) Band difference map; (b) polarization difference map; (c) colorized PCA fusion; (d) colorized wavelet fusion; (e) colorized NSCT fusion; (f) colorized NSST fusion; and (g) colorized proposed method fusion.
Remotesensing 14 04022 g009
Figure 10. Band difference map, polarization difference map, and colorized fusion results of special region in scene 2: (a) Band difference map; (b) polarization difference map; (c) colorized PCA fusion; (d) colorized wavelet fusion; (e) colorized NSCT fusion; (f) colorized NSST fusion; and (g) colorized proposed method fusion.
Remotesensing 14 04022 g010
Figure 11. Complete colorization fusion results of scene 1: (a) Band difference map: (b) polarization difference map; (c) PCA fusion; (d) wavelet fusion; (e) NSCT fusion; (f) NSST fusion; and (g) proposed method fusion.
Remotesensing 14 04022 g011
Figure 12. Complete colorization fusion results of scene 2: (a) Band difference map; (b) polarization difference map; (c) PCA fusion; (d) wavelet fusion; (e) NSCT fusion; (f) NSST fusion; and (g) proposed method fusion.
Remotesensing 14 04022 g012
Table 1. Evaluation indexes of the fused images in scene 1.
AGIESTDCCSSIMTime(s)
PCA10.373 7.270 38.721 0.929 0.753 8.031
wavelet8.952 7.243 37.777 0.934 0.762 3.828
NSCT10.333 7.233 37.668 0.920 0.752 103.903
NSST10.820 7.282 39.062 0.917 0.735 16.625
proposed12.1377.31440.0750.9030.71625.233
Table 2. Evaluation indexes of the fused images in scene 2.
AGIESTDCCSSIMTime
PCA10.748 7.271 40.922 0.926 0.7238.013
wavelet9.437 7.252 39.927 0.938 0.759 3.611
NSCT10.601 7.235 39.716 0.932 0.757 103.419
NSST11.161 7.257 40.807 0.925 0.734 16.599
proposed11.9567.28741.7020.9200.72325.165
Publisher’s Note: MDPI stays neutral with regard to jurisdictional claims in published maps and institutional affiliations.

