Abstract
The estimation accuracy of plant dry matter by spectra- or remote sensing-based methods tends to decline when canopy coverage approaches closure; this is known as the saturation problem. This study aimed to enhance the estimation accuracy of plant dry matter and subsequently use the critical nitrogen dilution curve (CNDC) to diagnose N in Choy Sum by analyzing the combined information of canopy imaging and plant height. A three-year experiment with different N levels (0, 25, 50, 100, 150, and 200 kg∙ha−1) was conducted on Choy Sum. Variables of canopy coverage (CC) and plant height were used to build the dry matter and N estimation model. The results showed that the yields of N0 and N25 were significantly lower than those of high-N treatments (N50, N100, N150, and N200) for all three years. The variables of CC × Height had a significant linear relationship with dry matter, with R2 values above 0.87. The good performance of the CC × Height-based model implied that the saturation problem of dry matter prediction was well-addressed. By contrast, the relationship between dry matter and CC was best fitted by an exponential function. CNDC models built based on CC × Height information could satisfactorily differentiate groups of N deficiency and N abundance treatments, implying their feasibility in diagnosing N status. N application rates of 50–100 kgN/ha are recommended as optimal for a good yield of Choy Sum production in the study region.
1. Introduction
Choy Sum (Brassica rapa var. parachinensis) is one of the main leafy vegetables grown in Asia [1]. A rational amount and timing of N fertilization are necessary for optimal leaf growth, while excessive N application causes a series of problems, including greenhouse gas emissions and soil degradation [2]. In addition, the leaf N content of Choy Sum needs to be maintained at a medium level to achieve high market quality, as a leaf N content that is too low reduces its health quality, whereas a leaf N content that is too high reduces the shelf life [3]. Therefore, the accurate diagnosis of N nutrition status during crop growth season is a prerequisite for the N management and product quality of Choy Sum.
Studies have shown that crop N concentration decreases throughout the growth season independent of climatic conditions, species, and genotype [4], and this phenomenon persists even when crops are grown with adequate N [5]. The overall N concentration decrease is due to a more rapid biomass accumulation and a decrease in the leaf–stem ratio over the growing season [6]. The critical nitrogen dilution curve (CNDC) [7] has been used as the gold standard to diagnose the N status of different crops. The curve reflects the relationship between crop nitrogen concentration and dry matter (), from which the nitrogen nutrition index () can be derived as and used as a diagnostic indicator of plant N status [8]. However, using CNDC for N diagnosis is still challenging, as the determination of the dry matter and actual N content requires destructive sampling, which is labor-intensive and time-consuming [9,10]. With the technological development of spectroscopy and imaging analysis, the parameters of DM or in the CNDC could be substituted by canopy coverage (CC) [11,12], leaf area index (LAI) [13,14,15], and chlorophyll index [16]. However, the accuracy of estimating dry matter by field spectroscopy and imaging-based methods declines as the canopy growth approaches unity during the vigorous growth stage, especially for Choy Sum, which is characterized by remarkably rapid leaf growth. Moreover, a CNDC has not been established for Choy Sum. Therefore, a method that could potentially address the problem of saturation is needed to quantify the dry matter of Choy Sum. As plant height increases during all growth stages of Choy Sum, a method that uses plant height information as an auxiliary variable was proposed in this study to address the problem of saturation.
The objectives of this study were (1) to build a CNDC for Choy Sum for the estimation of crop N status and (2) to enhance the model accuracy of estimating dry matter by including plant height as an auxiliary variable along with canopy coverage.
2. Materials and Methods
2.1. Field Experiments
Three-year field experiments were conducted during 2020–2022 on the Qiyuan family farm (30°10′E, 119°48′N), Hangzhou city, Zhejiang Province, China. The soil had a pH of 8.72, the soil total N was 1.41 g kg−1, the soil organic matter was 22.7 g kg−1, and the soil hydrolytic N was 194 mg kg−1. The changes in temperature and precipitation are shown in Figure 1a. The crop growth season was from 13 September to 20 October in 2020, from 15 April to 24 May in 2021, and from 1 April to 25 April in 2022. The previous crops were maize, pumpkin, and sweet potato in the 2020, 2021, and 2022 seasons, respectively. Each plot was 5 m × 5 m. The plant density was 0.3 m × 0.3 m in both 2020 and 2022, and the plant density was 0.15 m × 0.15 m in 2021. Each experiment had six N treatments differentiated by N application rates (0, 25, 50, 100, 150, and 200 kg ha−1). The experimental design was a randomized complete block design, and it was designed with three replicates (Figure 1b). N fertilizer was applied at transplantation using the form of urea, and 30 kg ha−1 phosphorus (P) and 90 kg ha−1 potassium (K) were applied at transplantation. Irrigation, pest, and disease management were conducted according to local best practices.
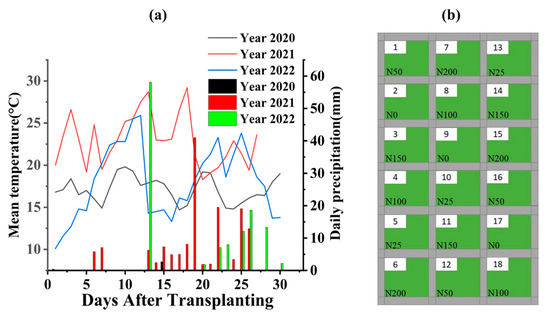
Figure 1.
The variation in temperature and precipitation during the growing season from 2020 to 2022 (a); field experimental design and plot layout (b).
2.2. Sample Collection and Data Acquisition
Samples were collected weekly, starting when the plants’ height reached about 6 cm and continuing until harvesting. A subplot of (0.5 m × 0.7 m) was delineated in each plot for sampling, and all plants within the sub-plot were cut for later analysis. Prior to destructive cutting, images were taken, and the height was retrieved within the sub-plot. All samples were dried in the oven at 105 °C for 30 min and then at 75 °C for 48 h to determine the dry matter, after which plant N concentration (N%) was measured by the Kjeldahl method.
Canopy images were taken by a digital camera (D5600, Nikon). The camera lens was held perpendicular to the horizon by hand and was maintained 1 m from the top of the canopy. A light frame of 1 m × 1 m was employed to delineate the measurement area during the photography process, and a color correction board was used for white balance (ColorChecker Classic, X-Rite Inc., Grand Rapids, MI, USA). The settings of the camera were ISO-200, f/8, auto exposure time, auto exposure compensation, and no-flash model, and the focal length was set to 18 mm. The image resolution was 4000 × 6000 pixels, and images were stored in two formats (NEF and JPG). The format of each image was converted from NEF to DNG (Adobe DNG Converter, Adobe Inc., San Jose, CA, USA). White balance profiles were generated by ColorChecker Camera Calibration (X-Rite Inc.). The balanced image was stored in JPG format after processing by Adobe Camera Raw using a white balance profile.
2.3. Calculating Canopy Coverage by Image Analysis
To calculate the canopy coverage, a Matlab (Matlab 2020a, The MathWorks, Inc., Natick, MA, USA) program was constructed to achieve the separation of the plant canopy and the background. All images were converted from RGB three-color space (red, green, and blue channels) to HSI three-color space (hue, saturation, and intensity channels). Binary images were created using thresholds of H values. Figure 2 shows the H-value distribution of a typical Choy Sum canopy image as an example. The image has three distinct peaks between 0 and 0.2 (from the soil), between 0.2 and 0.4 (from the green canopy), and between 0.5 and 0.7 (mainly from the experimental observers). Pixels that had H values of 0.2–0.4 were assigned as 1 (green canopy), while other pixels were set as 0. Then the CC was the fraction of the number of pixels with a value of 1 divided by the total number of pixels in the binary image.
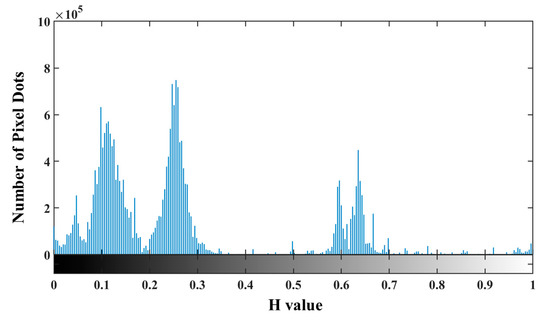
Figure 2.
H-value distribution of Choy Sum image.
2.4. Construction of Critical N Dilution Curve
The critical N dilution curve (CNDC) was built by fitting the critical N points throughout the growing season with the power function (); the general method for determining critical N point refers to Justes [17] and was modified in this study as follows: (1) analyze the plant dry matter and the corresponding N concentration data of all N treatments by ANOVA for each plant sampling day and divide them into N-limited and non-N-limited groups for each single sampling day; (2) fit the relationship between the dry matter and nitrogen concentration in the nitrogen-limited groups by linear function; (3) calculate the mean value of the dry matter in the non-nitrogen-limited groups; (4) determine the critical N point by the intersection between the vertical line corresponding to the value from step (3) and the fitted linear curve from step (2).
In this study, the CNDC model was also built in two other forms, which were and . The nitrogen nutrition index () was calculated as the ratio of the actual N concentration to the critical N concentration:
The root mean squared error () is the square root of the mean of the square of the total error. The was calculated by:
where is the number of observations, is the predicted value, and is observed value.
3. Results
3.1. Effect of N Application Rates on Plant N Accumulation, Plant Height, and Yield
The variation in plant nitrogen accumulation (PNA) at different growth stages is shown in Table 1. The PNA varied from 0.29 g∙m−2 to 1.49 g∙m−2 in 2020, varied from 0.15 g∙m−2 to 4.92 g∙m−2 in 2021, and varied from 0.15 g∙m−2 to 0.75 g∙m−2 in 2022. In 2020, no significant difference in PNA was detected 18 days after transplanting (DAT). There was a significant difference in PNA between high-N treatments (N150, N200) and low-N treatments (N0, N25) at 24 DAT and 30 DAT. In 2021, a significant difference in PNA between low-N treatments (N0 and N25) and high-N treatments (N50, N100, N150, and N200) was detected at 14, 20, and 23 DAT. A significant difference in PNA was detected among treatments at harvest in 2021; N200 had the highest PNA of 4.92 g m−2, while N0 had the lowest PNA of 0.89 g m−2. In 2022, there was a significant difference in PNA between high-N treatments (N100, N150, and N200) and low-N treatments (N0, N25) at 16, 20, and 25 DAT.

Table 1.
Plant N accumulation (PNA, g m−2) variation of Choy Sum under different N treatments in 2020–2022.
Table 2 shows the change in plant height at different growth stages over three years; plant height varied between 8.07 cm and 35.97 cm in 2020, 5.67 cm and 51.33 cm in 2021, and 10.33 cm to 29.00 cm in 2022. The results showed that plant height under high-N treatments (N100, N150, and N200) was significantly higher than that under low-N treatments (N0, N25, and N50) for all three years.

Table 2.
Plant height (cm) variation of Choy Sum under different N treatments in 2020–2022.
The yield of Choy Sum under different N treatments is shown in Table 3. The results showed that the yield varied between 0.37 kg∙m−2 and 0.62 kg∙m−2 in 2020, 0.34 kg∙m−2 to 1.43 kg∙m−2 in 2021, and 0.08 kg∙m−2 to 0.22 kg∙m−2 in 2022. The general yield in 2022 was considerably low due to air temperature fluctuations during the growing season. The significantly high yield in 2021 was partially due to smaller plant spacing. Overall, there were significant differences in yield between N0, N25, and other higher-N treatments in all three years.

Table 3.
Fresh yield of Choy Sum in 2020–2022.
3.2. Comparison of Different Dry Matter Models
Dry matter models were built by two different methods, namely CC-based and CC × Height-based models. In the three-year trial, there was an exponential relationship between DM and CC (Figure 3a). The formulas were , , and in 2020, 2021, and 2022, respectively, with R2 values of 0.92, 0.87 and 0.86 in 2020, 2021, and 2022, respectively. By contrast, the relationship between CC × Height and DM was best fitted by a linear function (Figure 3b). The formulas were , , and in 2020, 2021, and 2022, respectively, with R2 values of 0.87, 0.98, and 0.93 for 2020, 2021, and 2022, respectively.
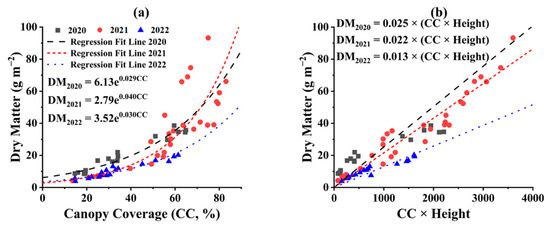
Figure 3.
The relationship between DM and CC (a), CC × Height (b) across different N treatments in 2020, 2021, and 2022.
3.3. Determination of Critical Nitrogen Dilution Curves
For each sampling date for the whole season, all treatments were divided into N restricted and non-restricted groups using the ANOVA method [17], and the critical N points (CNP, cross mark in Figure 4) were determined using the method mentioned above. Three different CNDC models were built by fitting the CNP points through an exponential function on DM, CC, and CC × Height (Figure 4, Table 4).
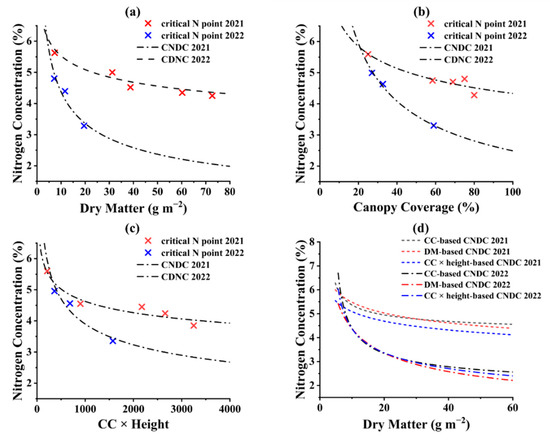
Figure 4.
Different types of critical N dilution curves derived from dry matter (a), canopy coverage (b), and CC × Height (c) in 2021 and 2022; the comparison of different critical N dilution curves in 2021 and 2022 (d).

Table 4.
Results of different types of CNDC models.
To compare the CC-based and CC × Height-based CNDC with the DM-based CDNC models, all three horizontal axes were adjusted to be based on DM. In other words, CC and CC × Height were converted to DM according to their regression relationship. The results showed that in 2021, with the accumulation of dry matter, the critical N concentration declined the most rapidly in the CC × Height-based CNDC, while the CC-based model declined the most slowly and leveled off when the DM reached 60 g m−2, corresponding to a CC of 80%, implying that it is inappropriate to use the CC-based model for N diagnosis, especially when the CC approaches 80%. In 2022, the results showed similar trends, although the N concentration declined more rapidly due to an abnormal climate during the growing season.
3.4. Nitrogen Nutrition Index () across Growth Stages under Different N Treatments
The was calculated by three different CNDC models for all treatments over the full growing seasons in 2021 and 2022 (Figure 5). In general, the increased with the N application rate. In 2021, the values calculated by DM-based CNDC ranged from 0.60 to 1.26. The values calculated by the CC-based CNDC ranged from 0.26 to 1.24, and the values calculated by the CC × Height-based CNDC ranged from 0.56 to 1.34. In 2022, the values calculated by the DM-based CNDC ranged from 0.62 to 1.13. The values calculated by the CC-based CNDC ranged from 0.57 to 1.14, and the values calculated by the CC × Height-based CNDC ranged from 0.65 to 1.10. Overall, the values of N0 and N25 were significantly lower than 1, and the values of N50, N100, N150, and N200 were always higher or close to 1.
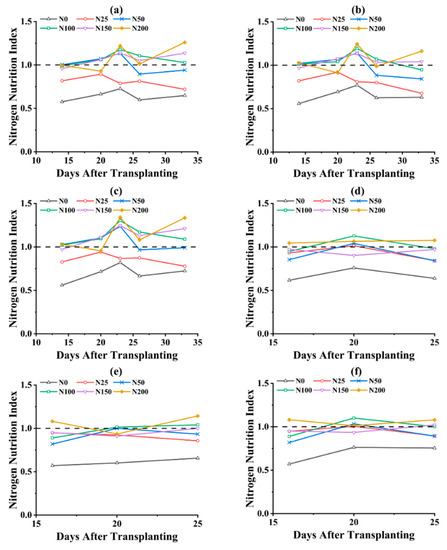
Figure 5.
The dynamics (N nutrition index) under different N treatments calculated by DM-based CNDC (a), CC-based CNDC (b), and CC × Height-based CNDC (c) in 2021; calculated by DM-based CNDC (d), CC-based CNDC (e), and CC × Height-based CNDC (f) in 2022.
4. Discussion
4.1. Address the Saturation Problem of Estimating Dry Matter by Including Plant Height
As dry matter increased disproportionally compared with canopy growth, an exponential relationship was found between DM and CC. This can be explained by the fact that the plant stem was still growing later in the season even though the canopy coverage had already approached 100%. The saturation phenomenon of CC often led to a decrease in the accuracy of the regression model on dry matter. When including plant height as an auxiliary variable, a linear relationship was found between CC × Height and DM in 2020, 2021, and 2022. Although the slope of the linear function was different due to the difference in planting density, the significantly high linear correlation indicates that CC × Height can be used to estimate DM.
4.2. Comparison of Different Types of Critical Nitrogen Dilution Curves
Canopy coverage-based CNDCs have been built for japonica rice [11] and maize [12]. Although there is currently no critical nitrogen concentration dilution curve based on Choy Sum, some studies on Choy Sum [18] have shown that the N concentration, total leaf area, and plant height of Choy Sum increase with an increase in N application. In our study, the nitrogen concentration (N%) and plant height showed the same trend. These results verify that we have the basis to establish a critical nitrogen dilution curve model for Choy Sum. In our study, the CNDC curves had different decline rates in the two years investigated (Figure 4, Table 4). This is due to the air temperature fluctuations as well as the observed drought phenomenon in 2022, causing early crop maturity and a low yield in 2022. In addition, precipitation variation between years may play a partial role in the CNDC difference between 2021 and 2022 [19].
In this experiment, different types of CNDCs had different initial values, which was due to the relatively low N demand during the early plant growth stage; canopy cover and plant height did not show differences at this stage, which led to uncertainty in the selection of critical N concentration points [20]. Our results showed that the critical N concentration of Choy Sum declined faster in the CC × Height-based CNDC than that in the CC-based one, which leveled off when the dry matter reached 60 g m−2; this corresponded to the growth stage when canopy closure occurred, implying that it is inappropriate to use the CC-based model for N diagnosis, especially when CC approaches 80%. Therefore, the CC × Height-based one could be more suitable for monitoring the N status of Choy Sum. One of the shortcomings of this study is that plant height was measured manually; with more efficient methods of plant height measurement such as ultrasonic sensor [21] or UAV [22], the feasibility of using CC × Height for CNDC model-building will be enhanced. The built model could also be extended to a large scale with a more efficient method of image capture, such as UAV.
4.3. Yield Estimates by the Value
Yield is a key indicator for evaluating field production applications [6]. There were significant differences in yield between N0 and N25 and the treatments applied with a high N rate, corroborating the finding that yields increase under low-nitrogen conditions and level off when N conditions reach an ample level [23]. values are often used to predict crop yield due to their high correlation. In this experiment, the optimal yield was obtained when the reached 1.07 (inflection point in Figure 6). Studies by Huang [24] and Zhao [6] also found inflection points of 1.03 and 0.96 for rice and maize, respectively. The calculated by the three CNDCs all showed that under N0 and N25 conditions, the plants were always under nitrogen-deficient conditions, leading to a significantly lower yield. The results showed that the CNDC model can be used to support N fertilization decision-making and yield evaluation of Choy Sum.
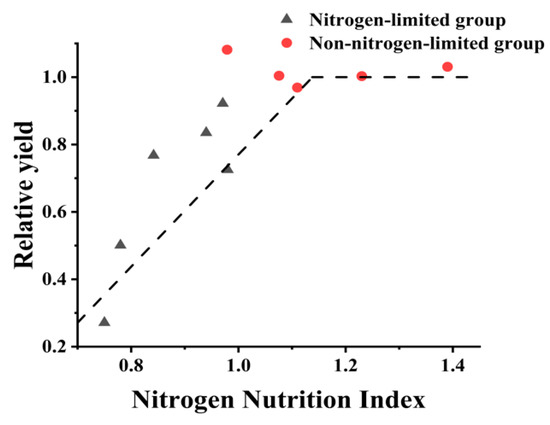
Figure 6.
Relationship between relative yield and .
5. Conclusions
The relationship between dry matter and CC × Height was best fitted by a linear function, while the relationship between dry matter and CC was best fitted by an exponential function. Compared with the critical nitrogen dilution curves based on DM and CC, the one built on CC × Height was more suitable to diagnose the N status of Choy Sum. In terms of yield production, an N application rate of 50–100 kg N/ha is recommended as the optimal level for Choy Sum production.
Author Contributions
Conceptualization, Z.W., S.S. and Z.Z.; methodology, Z.W.; software, Z.W. and J.P.; formal analysis, L.Z. (Lijun Zhu) and Y.H.; investigation, J.S., S.S., R.J. and Z.Z.; data curation, Z.Z.; writing—original draft, Z.W.; writing—review and editing, J.S., L.L., L.Z. (Lin Zhao) and Z.Z.; supervision, Z.Z.; funding acquisition, Z.Z. All authors have read and agreed to the published version of the manuscript.
Funding
This research was funded by The National Key Research and Development Program of China (2019YFE0125500-02); funding was also provided by the Science and Technology Department of Guangdong Province (2019B020216001).
Data Availability Statement
Not applicable.
Acknowledgments
We would like to thank three reviewers for their reviews which improved this paper.
Conflicts of Interest
The authors declare no conflict of interest.
References
- Kok, P.T.; Keng, H.; Avadhani, P.; Foo, J.T. Guide to Common Vegetables; Singapore Science Centre: Singapore, 1991. [Google Scholar]
- Cong, X.H.; Shi, F.Z.; Ruan, X.M.; Luo, Y.X.; Ma, T.C.; Luo, Z.X. Effects of nitrogen fertilizer application rate on nitrogen use efficiency and grain yield and quality of different rice varieties. J. Appl. Ecol. 2017, 28, 1219–1226. [Google Scholar]
- Guo, J.; Wang, Y.; Fan, T.; Chen, X.; Cui, Z. Designing corn management strategies for high yield and high nitrogen use efficiency. Agron. J. 2016, 108, 922–929. [Google Scholar] [CrossRef]
- Lemaire, G.; Plenet, D.; Grindlay, D. Leaf N content as an indicator of crop N nutrition status. In Diagnosis of the Nitrogen Status in Crops; Springer: Berlin/Heidelberg, Germany, 1997; pp. 189–199. [Google Scholar]
- Greenwood, D.; Neeteson, J.; Draycott, A. Quantitative relationships for the dependence of growth rate of arable crops on their nitrogen content, dry weight and aerial environment. In Fundamental, Ecological and Agricultural Aspects of Nitrogen Metabolism in Higher Plants; Springer: Berlin/Heidelberg, Germany, 1986; pp. 367–387. [Google Scholar]
- Lemaire, G.; Jeuffroy, M.-H.; Gastal, F. Diagnosis tool for plant and crop N status in vegetative stage: Theory and practices for crop N management. Eur. J. Agron. 2008, 28, 614–624. [Google Scholar] [CrossRef]
- Greenwood, D.; Gastal, F.; Lemaire, G.; Draycott, A.; Millard, P.; Neeteson, J. Growth rate and% N of field grown crops: Theory and experiments. Ann. Bot. 1991, 67, 181–190. [Google Scholar] [CrossRef]
- Ata-Ul-Karim, S.T.; Yao, X.; Liu, X.; Cao, W.; Zhu, Y. Development of critical nitrogen dilution curve of Japonica rice in Yangtze River Reaches. Field Crops Res. 2013, 149, 149–158. [Google Scholar] [CrossRef]
- Liang, X.-G.; Zhang, Z.-L.; Zhou, L.-L.; Shen, S.; Gao, Z.; Zhang, L.; Lin, S.; Pan, Y.-Q.; Zhou, S.-L. Localization of maize critical N curve and estimation of NNI by chlorophyll. Int. J. Plant Prod. 2018, 12, 85–94. [Google Scholar] [CrossRef]
- Du, L.; Li, Q.; Li, L.; Wu, Y.; Zhou, F.; Liu, B.; Zhao, B.; Li, X.; Liu, Q.; Kong, F. Construction of a critical nitrogen dilution curve for maize in Southwest China. Sci. Rep. 2020, 10, 13084. [Google Scholar] [CrossRef]
- Wang, Y.; Shi, P.; Zhang, G.; Ran, J.; Shi, W.; Wang, D. A critical nitrogen dilution curve for japonica rice based on canopy images. Field Crops Res. 2016, 198, 93–100. [Google Scholar] [CrossRef]
- Ranjbar, A.; Rahimikhoob, A.; Ebrahimian, H.; Varavipour, M. Determination of Critical Nitrogen Dilution Curve Based on Canopy Cover Data for Summer Maize. Commun. Soil Sci. Plant Anal. 2020, 51, 2244–2256. [Google Scholar] [CrossRef]
- Zhao, B.; Ata-Ul-Karim, S.T.; Duan, A.; Liu, Z.; Wang, X.; Xiao, J.; Liu, Z.; Qin, A.; Ning, D.; Zhang, W. Determination of critical nitrogen concentration and dilution curve based on leaf area index for summer maize. Field Crops Res. 2018, 228, 195–203. [Google Scholar] [CrossRef]
- Jia, B.; Fu, J. Critical nitrogen dilution curve of drip-irrigated maize at vegetative growth stage based on leaf area index. Nongye Gongcheng Xuebao 2020, 36, 66–73. [Google Scholar]
- Zhao, B.; Yao, X.; Tian, Y.; Liu, X.; Ata-Ul-Karim, S.T.; Ni, J.; Cao, W.; Zhu, Y. New critical nitrogen curve based on leaf area index for winter wheat. Agron. J. 2014, 106, 379–389. [Google Scholar] [CrossRef]
- Zhang, K.; Liu, X.; Ma, Y.; Wang, Y.; Cao, Q.; Zhu, Y.; Cao, W.; Tian, Y. A new canopy chlorophyll index-based paddy rice critical nitrogen dilution curve in eastern China. Field Crops Res. 2021, 266, 108139. [Google Scholar] [CrossRef]
- Justes, E.; Mary, B.; Meynard, J.-M.; Machet, J.-M.; Thelier-Huché, L. Determination of a critical nitrogen dilution curve for winter wheat crops. Ann. Bot. 1994, 74, 397–407. [Google Scholar] [CrossRef]
- Khairun, N.; Teh, C.; Hawa, Z. Simultaneous effects of water and nitrogen stress on the vegetative and yield parameters of choy sum (Brassica chinensis var. parachinensis). Pertanika J. Trop. Agric. Sci. 2016, 39, 101–116. [Google Scholar]
- Hoogmoed, M.; Sadras, V.O. Water stress scatters nitrogen dilution curves in wheat. Front. Plant Sci. 2018, 9, 406. [Google Scholar] [CrossRef]
- Ziadi, N.; Brassard, M.; Bélanger, G.; Cambouris, A.N.; Tremblay, N.; Nolin, M.C.; Claessens, A.; Parent, L.É. Critical nitrogen curve and nitrogen nutrition index for corn in eastern Canada. Agron. J. 2008, 100, 271–276. [Google Scholar] [CrossRef]
- Fricke, T.; Richter, F.; Wachendorf, M. Assessment of forage mass from grassland swards by height measurement using an ultrasonic sensor. Comput. Electron. Agric. 2011, 79, 142–152. [Google Scholar] [CrossRef]
- Batistoti, J.; Marcato Junior, J.; Ítavo, L.; Matsubara, E.; Gomes, E.; Oliveira, B.; Souza, M.; Siqueira, H.; Salgado Filho, G.; Akiyama, T. Estimating pasture biomass and canopy height in Brazilian savanna using UAV photogrammetry. Remote Sens. 2019, 11, 2447. [Google Scholar] [CrossRef]
- Hill, T. The effect of nitrogenous fertilizer and plant spacing on the yield of three Chinese vegetables—Kai lan, Tsoi sum and Pak choi. Sci. Hortic. 1990, 45, 11–20. [Google Scholar] [CrossRef]
- Huang, S.; Miao, Y.; Cao, Q.; Yao, Y.; Zhao, G.; Yu, W.; Shen, J.; Yu, K.; Bareth, G. A new critical nitrogen dilution curve for rice nitrogen status diagnosis in Northeast China. Pedosphere 2018, 28, 814–822. [Google Scholar] [CrossRef]
Publisher’s Note: MDPI stays neutral with regard to jurisdictional claims in published maps and institutional affiliations. |
© 2022 by the authors. Licensee MDPI, Basel, Switzerland. This article is an open access article distributed under the terms and conditions of the Creative Commons Attribution (CC BY) license (https://creativecommons.org/licenses/by/4.0/).