Abstract
The azimuth multichannel synthetic aperture radar (MC-SAR) is an effective means of earth observation due to its high-resolution and wide-swath (HRWS) imaging capability. Compared with the traditional MC-SAR, the two-dimensional (2D) spectrum of the squint multichannel synthetic aperture radar (SMC-SAR) is skewed, leading to the severe coupling between azimuth signals and range signals. Therefore, the traditional imaging algorithms are inapplicable to SMC-SAR. Currently, the existing imaging algorithms for SMC-SAR need interpolation or sub-aperture processing, which results in low efficiency. This paper proposes a novel imaging scheme for spaceborne SMC-SAR to handle this issue. With the squint angle known, the Doppler centroid can be compensated for by the spectrum shift function. Additionally, the frequency correlation method (FCM) is utilized to estimate the channel phase imbalance. After that, the azimuth multichannel data are reconstructed by the filter banks to eliminate the Doppler spectrum aliasing. Finally, the data are imaged based on the modified equivalent slant range model (MESRM). Both the simulation and Gaofen-3 (GF-3) data experiments demonstrate the effectiveness and efficiency of the proposed method.
1. Introduction
With the development of beam steering technology, spaceborne synthetic aperture radar (SAR) gradually has the ability to squint on the basis of the traditional side-looking mode without adjusting satellite attitude, which enables SAR to have a more flexible illumination area []. However, the single-channel SAR still has to compromise between high-resolution and wide-swath (HRWS) due to the limit of the minimum antenna area []. The azimuth multichannel SAR (MC-SAR) can resolve this contradiction by compensating the time sampling with spatial sampling to achieve HRWS imaging []. Using one channel to transmit signals and multiple channels to receive signals simultaneously, the MC-SAR can transmit signals with a lower pulse repetition frequency (PRF) for a wide-swath. The PRF can be equivalently improved by increasing spatial sampling to achieve high-resolution [,]. Furthermore, the combination of multichannel and beam steering can significantly enhance the imaging capability of the SAR but also bring new challenges to the imaging algorithms. This paper will focus on the squint multichannel SAR (SMC-SAR) imaging algorithm.
The squint angle of the SAR causes the spectrum to be skewed and expanded, leading to the severe coupling between azimuth and range, which results in the spatial variability of the range migration curve, the secondary range compression (SRC) function, and the higher-order phase functions []. Meanwhile, the PRF in the MC-SAR system generally cannot meet the displaced phase center antenna (DPCA) conditions [] in most cases. If the multichannel data are just spliced together, the final data are not uniformly sampled; in other words, the Doppler spectrum is aliased []. In addition, in the MC-SAR system, it is difficult to achieve complete consistency between different channels, and the channel imbalances will also lead to Doppler spectrum aliasing []. If the Doppler spectrum aliasing is not eliminated, false targets will appear in the focused image along the azimuth, also known as the azimuth ambiguity []. Therefore, the key to SMC-SAR imaging is to solve the two-dimension (2D) coupling problem and Doppler spectrum aliasing.
The traditional chirp scaling algorithm (CSA) does not consider the spatial variability of the SRC, so it is only suitable for the low squint angle []. A modified range-Doppler algorithm (M-RDA) for high squint SAR has been proposed in [], which introduces a fourth-order range model to achieve accurate azimuth compression, but the solution of the high-order phase term coefficients is very complicated. The nonlinear scaling algorithm (NCSA) can solve the spatial variability of the SRC by introducing the disturbance term. However, when considering the Fourier transform of the high-order phase term, it is very complicated to solve the point of stationary phase (POSP), which increases the difficulty of high-order phase compensation [,]. At present, the commonly used algorithm is to reduce the two-dimensional coupling of the signal by the linear range cell migration correction (LRCMC), to “minimize the spectrum squint,” and then use the CSA to process the range signal and the NCSA to process the azimuth signal []. This method can achieve high resolution but broadens the Doppler spectrum, leading to false targets after imaging. Zhang et al. proposed an imaging algorithm that completes the focusing through two interpolation operations after the LRCMC, which can obtain a well-focused image. Although the algorithm is robust, it is still computationally intensive []. In practice, the modified CSA based on the equivalent slant range model (ESRM) can achieve an excellent focusing effect with a low computational burden under the condition that the squint angle is not too high [].
The channel imbalance estimation and the spectrum reconstruction are vital to eliminating spectrum aliasing. In general, channel imbalances mainly include amplitude imbalances and phase imbalances [,]. The amplitude imbalance can be estimated by channel balancing technology []. This paper only focuses on the estimation method of phase imbalance in the estimation of channel imbalance. Yang et al. proposed the signal subspace comparison method (SSCM), which has high accuracy in estimating phase imbalance but requires operations such as matrix inversion and eigenvalue decomposition at the cost of extensive computation []. Liu et al. proposed the conjugation method (CM), which can efficiently estimate the phase imbalance but is only suitable for side-looking SAR []. Shang et al. proposed a novel method that simultaneously estimates the along-track baseline, phase imbalance, and range sample time imbalance. The method is based on the azimuth cross-correlation in the two-dimensional (2D) frequency domain [], with the premise of a zero Doppler centroid, which does not apply to the SMC-SAR either. There are currently a few studies on phase imbalance estimation methods for spaceborne SMC-SAR. The common reconstruction method is the Krieger filter bank [,]. However, this method can only reconstruct the signal at the baseband and is not applicable when the Doppler centroid exceeds the PRF. A modified reconstruction filter adapted to SMC-SAR has been proposed in [], where the LRCMC is performed before the reconstruction, and the wave-number algorithm is adopted for imaging, which has limited accuracy and low efficiency. Besides, a compressive sensing algorithm has also been applied to reconstruct the SAR images with much less data than required. For instance, a two-dimensional double-compressive sensing algorithm named 2-D-DCSA for SAR imaging based on the compressive sensing theory and the CSA is proposed in []. The algorithm can reconstruct images two-dimensionally with reduced data; however, due to the limitation of the CSA, the proposed algorithm is unsuitable for very high-resolution imaging and imaging with a high squint angle. In [], the MC-SAR model based on an advanced hyperbolic range equation (AHRE) is analyzed and the modified reconstruction algorithm considering the time-varying phase error based on AHRE is proposed. In the distributed SMC-SAR system, the time-varying phase error must be considered while it is small and can be ignored in a monostatic SMC-SAR system. Therefore, this algorithm is somewhat redundant for monostatic SMC-SAR imaging. Additionally, up to now, there is still no mature imaging scheme for the spaceborne monostatic SMC-SAR.
In this paper, a novel SMC-SAR imaging frame is proposed, which can achieve unambiguous HRWS imaging. First, the Doppler centroid of each channel is compensated in the 2D time domain so that the Doppler spectrum is symmetrical at zero. Additionally, the phase imbalance can be estimated using the frequency correlation method (FCM). After compensating for the phase imbalance, the data are reconstructed by the Krieger filter bank to eliminate spectrum aliasing. Nevertheless, the original equivalent slant range model (ESRM) will not suit the spectrum after Doppler centroid compensation. Therefore, the ESRM is modified in this paper to adapt to the new spectrum characteristics. Additionally, the reconstructed data are imaged based on the modified ESRM (MESRM). The effectiveness of the proposed scheme is verified by both the simulated data and the real data acquired by Gaofen-3 (GF-3).
The rest of the paper is organized as follows: A brief analysis of the SMC-SAR signal model is presented in Section 2; in Section 3, the proposed imaging scheme is illustrated in detail; then the experiments based on the simulated data and the GF-3 data are demonstrated in Section 4; moreover, Section 5 makes the discussion of the experiments and analyzes the algorithm performance; at last, Section 6 makes the conclusions.
2. Signal Model
2.1. The Geometry Model and the Analysis of the Slant Range
The observation geometry of the spaceborne SMC-SAR is briefly illustrated in Figure 1a. It is assumed that the azimuth antenna, whose length is , is evenly divided into channels, and the distance between adjacent channels is . The X-axis represents the azimuth that the SAR platform moves along at the velocity of and the azimuth coordinate of the target is marked as . The angle between the beam steering vector and the zero-Doppler plane is called the squint angle, denoted as . The is the shortest slant range between the SAR platform and the target, and the is the slant range when the beam center points to the target. To clearly analyze the slant range of each channel echo, the 2D geometry of the azimuth-range plane between the point target and the SAR platform is depicted in Figure 1b. In the signal model, the azimuth time is represented by and the range time is represented by . Moreover, the denotes the slant range history of the transmitted signal and is the slant range history of the received signal of the - channel. Taking the transmitting channel as the reference channel, the distance from the - channel to the reference channel is denoted as .
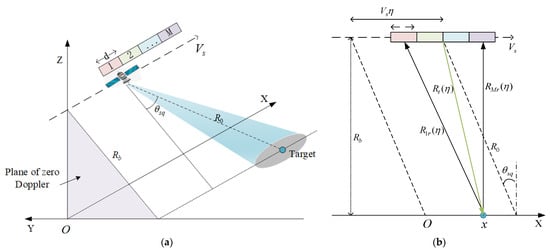
Figure 1.
The model of the spaceborne SMC-SAR. (a) The observation geometry model of the SMC-SAR; (b) The 2D geometry of the azimuth-range plane model of the SMC-SAR.
According to the above model, the slant range of the transmitted signal can be expressed as follows []:
Additionally, the second row of the above formula is the Taylor series expansion of the slant range. Similarly, the slant range history of the received echo from the target to the - channel can be calculated as follows:
Therefore, the equivalent slant range of the - channel echo can be expressed as follows:
In the spaceborne monostatic MC-SAR system, the is much smaller than , so the last term can be ignored.
2.2. The Signal Model of the SMC-SAR
According to the model described above, the echo of the - channel can be written as follows []:
where the is the echo of the reference channel, is the light speed, and is the wavelength of the radar signal. Additionally, the time delay in azimuth from the - channel to the reference channel can be denoted as It can be seen that the can be regarded as the with a specific time shift, that is, the received data of the - channel can be converted into the equivalent self-transmitting and self-receiving data at the effective phase center (EPC), and the distance from the - EPC to the reference channel is . When the , that is, the DPCA condition [], the data of channels can be regarded as the uniformly sampled single-channel data with the sampling rate of . However, due to the various factors to be considered in the design, the DPCA condition is hard to meet in the HRWS SAR system. Thus, signal reconstruction is essential to eliminate the Doppler aliasing.
The above analysis neglects the channel imbalances, but in the HRWS SAR system, the channel imbalances, such as the amplitude imbalance, the phase imbalance, etc., are inevitable and negatively impact the reconstruction filter’s effect. Since the amplitude imbalance can be estimated by the channel balancing technology, only the phase imbalance will be considered in the following analysis. Then, Equation (4) can be written as follows:
Additionally, converting the above formula to the range-Doppler domain, it can be expressed as follows:
Moreover, the Doppler centroid and the Doppler rate of the echo can be calculated as follows:
where the is the beam center crossing moment. Obviously, both and are related to the squint angle. And according to the principle of stationary phase (POSP), the 2D spectrum of the signal of the - channel can be written as follows:
where stand for the range frequency, the azimuth frequency, and the carrier frequency, respectively. The coupling of azimuth and range is reflected in the third phase term.
To widen the swath, a low is adopted in the HRWS SAR system, which can eliminate the range ambiguity at the expense of the azimuth Doppler ambiguity. Additionally, the main Doppler ambiguity number is . Thus, the echo of the - channel in the 2D frequency domain can be expressed as follows:
The above analysis shows that there is azimuth ambiguity, phase imbalance, and spectrum coupling in the SMC-SAR, which must be addressed to achieve HRWS imaging. In the next section, the methods to solve these issues will be described in detail.
3. Methods
The processing scheme of the SMC-SAR will be depicted in this section. Firstly, the data of each channel are multiplied by the spectrum shift function to compensate for the Doppler centroid. After that, the FCM can be used to estimate and compensate for the phase imbalance since the Doppler spectrum is symmetric at zero. The above two steps are collectively referred to as preprocessing. Then, the data of the channels are reconstructed by the filter bank to eliminate the spectrum aliasing. Finally, the imaging algorithm based on the MESRM is proposed according to the spectrum characteristics after Doppler centroid compensation.
3.1. Preprocessing
3.1.1. Doppler Centroid Compensation
In the spaceborne SAR system, the satellite attitude is relatively stable since there is no effect on the airflow. Therefore, the Doppler centroid can be calculated according to Equation (7) when the squint angle is known. Since the FCM can only estimate the phase imbalance around the zero frequency, and most of the existing reconstruction filters are based on the zero Doppler centroid, to facilitate subsequent processing, the Doppler centroid needs to be compensated to zero. Additionally, according to the properties of the Fourier transform, the linear phase multiplication in the time domain is equivalent to spectrum shifting in the frequency domain. At the same time, in the MC-SAR, the time delay between different channels also needs to be considered. Thus, the Doppler compensation function of the - channel in the time domain, represented by can be written as follows:
After the signal is multiplied with the Doppler centroid compensation function , it is transformed to the Doppler domain through the azimuth fast Fourier transform (FFT), which is equivalent to shifting the Doppler spectrum to be symmetrical at zero, as shown in the following:
where the stands for the azimuth FFT and the is the signal of the - channel in the range-Doppler domain after Doppler centroid compensation. In practice, the digital sampling of the signal will lead to the spectrum extending with the period of sampling frequency. The azimuth signal of SAR can be regarded as the signal sampled by the and the Doppler spectrum obtained by the azimuth FFT is the Doppler spectrum extended to . Figure 2 shows the Doppler spectrum before and after the Doppler centroid compensation. For simplicity, the spectrum aliasing due to under-sampling is ignored.
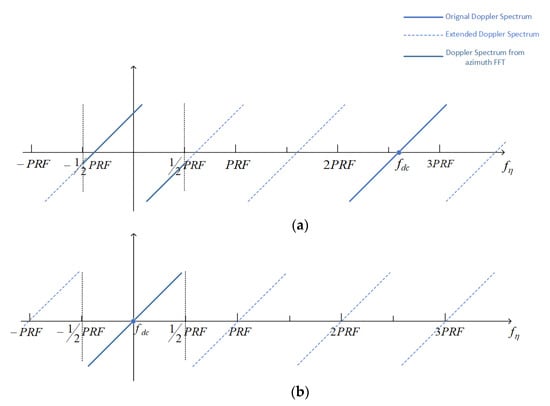
Figure 2.
The diagram of the Doppler spectrum. (a) The diagram of the Doppler spectrum before the Doppler centroid compensation; (b) The diagram of the Doppler spectrum after the Doppler centroid compensation.
3.1.2. Phase Imbalance Estimation
In the operational MC-SAR system, it is difficult for each receiving channel to be entirely consistent, so there will be a phase imbalance between the channels, which will negatively affect the performance of the reconstruction filter. Therefore, the phase imbalance must be compensated for before the reconstruction. According to Equation (6), the interference phase between the - channel and the reference channel can be expressed as follows:
where the indicates the phase of a complex value and indicates the conjugate operation. It can be seen that the phase imbalance can be estimated by correlating the data of the - channel with the data of the reference channel, which is called the FCM. In practice, in order to reduce the influence of the , the samples near the azimuth zero frequency and symmetrical about the azimuth zero frequency should be selected to estimate the .
Figure 2a shows that the original Doppler spectrum is not symmetrical at zero in the SMC-SAR. In this case, the phase imbalance estimation result will be affected by , leading to inaccurate estimation results. Additionally, the Doppler centroid compensation makes the spectrum symmetrical at zero, as shown in Figure 2b, so the samples in the middle of the Doppler spectrum can be taken to estimate the phase imbalance. Thus, only after the Doppler centroid compensation can the phase imbalance be accurately estimated by the FCM [] as follows:
where the is the statical average and the value of should be around zero. Figure 3 shows the phase imbalance estimation results of the simulated dual-channel squint SAR, where Channel 1 is the reference channel, and Channel 2 is introduced into a 10-degree phase imbalance artificially. Figure 3a is the result without Doppler centroid compensation, while Figure 3b is the result after Doppler centroid compensation. It can be seen that the estimated result before compensation deviates far from the actual phase imbalance, which verifies the previous analysis.
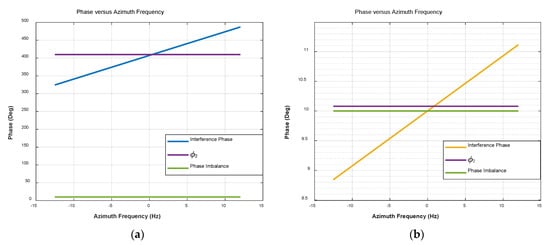
Figure 3.
The phase imbalance estimation results by FCM before and after the Doppler centroid compensation, where the green line represents the actual phase imbalance, the blue line represents the interference phase between and calculated by Equation (13), and the purple line represents the estimation result of by Equation (14). (a) The estimation results before the Doppler centroid compensation; (b) The estimation results after the Doppler centroid compensation.
3.2. Reconstruction
To suppress azimuth ambiguity caused by non-uniformly sampling, the reconstruction of the Doppler spectrum is indispensable in the MC-SAR. There are many reconstruction algorithms, and the Krieger reconstruction filter [] is adopted in this paper. In the MC-SAR, the transfer function of M channels in the range-Doppler domain can be expressed as follows:
Let and , then Equation (15) can be written as follows:
Then, according to the literature [], the reconstruction filter can be expressed as follows:
Based on the reconstruction filter matrix, the reconstruction filter of the - channel can be decomposed as follows:
In the specific implementation, the data received by channels need zero padding to first, where is each channel’s data length; then, the azimuth FFT is performed. At this point, the spectrum of each channel is periodically expanded by times. Based on Equations (17) and (18), each channel filter is obtained, and the signal of each channel passes through its corresponding filter after spectrum expansion, and the Doppler spectrum can be reconstructed without ambiguity after adding. The complete reconstruction process is shown in Figure 4.
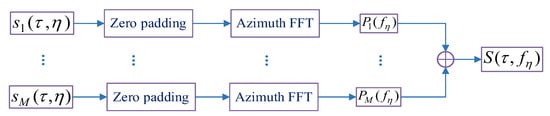
Figure 4.
The flowchart of the reconstruction.
When the Doppler centroid exceeds , the Krieger filter cannot reconstruct the Doppler spectrum unambiguously. Nevertheless, in the scheme proposed in this paper, the Doppler centroid has been compensated to zero before the phase imbalance estimation, as depicted in Section 3.1.1, so the data of the SMC-SAR can be reconstructed unambiguously using the Krieger filter.
3.3. Imaging Based on the MESRM
After reconstruction, the spectrum aliasing is eliminated, and the data of M channels can be regarded as single-channel data whose pulse repetition frequency is . At this time, the signal in the range-Doppler domain can be expressed as follows []:
where the range migration parameter . Additionally, affected by the squint angle, the original range frequency rate becomes , where .
Based on the above model, the chirp scaling function can be written as follows:
where the scaling factor is the following:
Additionally, the reference delay is as follows:
After scaling, the signal is converted to the 2D frequency domain by range FFT, then the range cell migration correction and range compression can be realized by multiplying by the following range compensation factor :
After multiplying by , the range IFFT is performed on the signal. At this time, the range processing is completed, and then the azimuth compression and phase compensation are achieved by multiplying by .
where the is the residual phase introduced by chirp scaling as follows:
The Doppler centroid compensation is performed in the preprocessing, which is equivalent to moving the spectrum to be symmetrical at zero frequency. However, the range cell migration still corresponds to the original frequency, as demonstrated in Figure 5. So, in the imaging scheme proposed in this paper, the azimuth frequency axis should be set as follows:
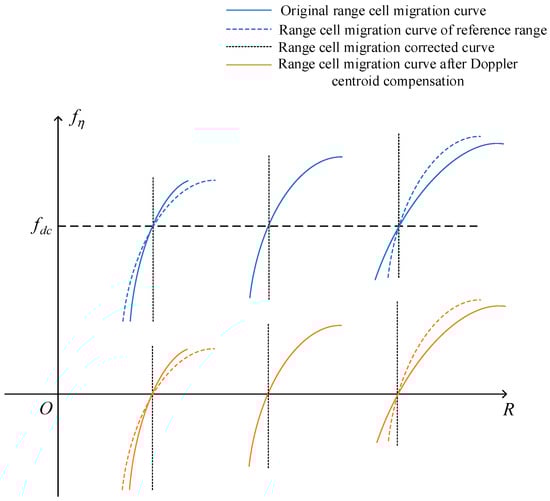
Figure 5.
The diagram of range cell migration before and after Doppler centroid compensation.
It is known that the azimuth frequency axis in the imaging algorithm must correspond to the Doppler spectrum. In ESRM and MESRM, although the range of the azimuth frequencies is the same, the setting of the azimuth frequency axis of the ESRM must consider the fractional part of the Doppler centroid since the spectrum is not symmetrical at zero while the azimuth frequency axis of the MESRM can be directly set to be symmetric at .
The SMC-SAR imaging scheme proposed in this paper is illustrated above. Additionally, the overall imaging flow is shown in Figure 6.
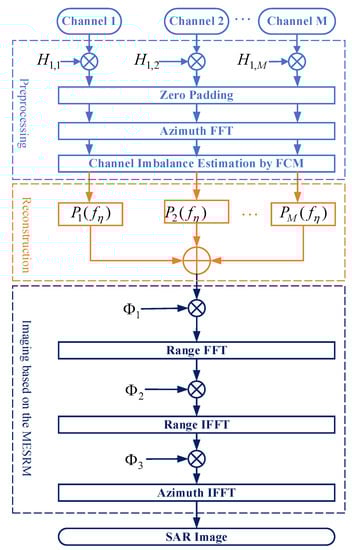
Figure 6.
The overall imaging scheme proposed in this paper.
4. Experiment Results
In this section, the squint dual-channel SAR (SDC-SAR) echo data are simulated first. Then the simulated data are used to verify the following imaging scheme proposed in this paper: one-dimensional (1D) simulation to verify the reconstruction and 2D simulation to verify the point target focusing effect. Eventually, the real data of GF-3 in SDC mode are adopted to verify the proposed scheme.
4.1. Simulation Results
4.1.1. 1D Simulation
The specific parameters of the simulation experiment are shown in Table 1. To verify the effectiveness of preprocessing and reconstruction, the 1D simulation of the SDC-SAR signal is conducted first, only considering the azimuth signal. Additionally, a 10-degree phase imbalance is introduced in the simulation.

Table 1.
The description of the simulation parameters.
If the azimuth signal is not preprocessed and reconstructed, the result after azimuth compression is shown in Figure 7a,b. It can be seen that the spectrum aliasing is severe, the main target position is shifted from the real position, whose coordinates should have been zero, and there are also obvious false targets. Then Figure 7c,d show the results of SDC-SAR after phase imbalance compensation and reconstruction using the traditional method without Doppler centroid compensation. It is apparent that there is still spectrum aliasing and false targets after reconstruction. Without Doppler centroid compensation, the phase imbalance obtained by traditional FCM is 412.48 degrees, whereas the estimated result by the FCM after the Doppler centroid compensation is 10.06 degrees. If the data have been compensated for the Doppler centroid and reconstructed but without phase imbalance compensation, the results are as shown in Figure 7e,f. The reconstruction after Doppler centroid compensation can make the main target return to the real position, but the false target cannot be totally suppressed due to the phase error. Additionally, it can be seen from Figure 7g,h that only after complete preprocessing and reconstruction can the spectrum aliasing be eliminated and the false targets be suppressed entirely.
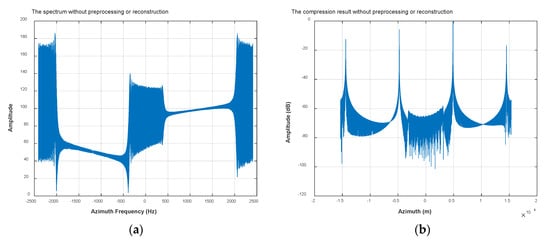
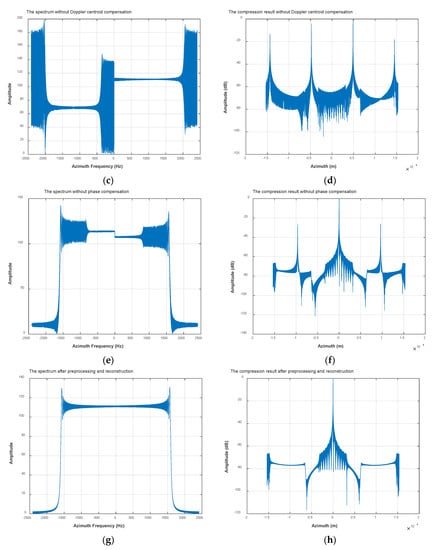
Figure 7.
The result of 1D simulation. (a) The spectrum of SMC-SAR data that are alternatively spliced without any preprocessing or reconstruction; (c) The spectrum of SMC-SAR data without Doppler centroid compensation but after phase imbalance compensation and reconstruction. (e) The spectrum of SMC-SAR signal without phase imbalance compensation but after the Doppler centroid compensation and reconstruction; (g) The spectrum of SMC-SAR signal after preprocessing and reconstruction. (b,d,f,h) correspond to the azimuth compression result of (a,c,e,g), respectively.
4.1.2. 2D Simulation
The 1D simulation experiments in the previous section have verified the effectiveness of the proposed algorithm in preprocessing and reconstruction. This section continues to demonstrate the 2D focusing effect of the proposed algorithm. The echo data of nine-point targets are simulated using the parameters in Table 1. Additionally, the distribution of the nine-point targets is shown in Figure 8a. After the simulated data are preprocessed and reconstructed, imaging is performed based on the ESRM and the MESRM, respectively, and the results are shown in Figure 8b,c. For clarity, the blue rectangle area in Figure 8c is enlarged in Figure 8d. As can be seen from Figure 8b, the point targets imaged based on the ESRM are offset from the true position and defocused, and there are apparent false targets. Additionally, there is no azimuth ambiguity in the imaging result based on the MESRM, as shown in Figure 8c. It can also be seen from Figure 8d that the point targets are well focused. A detailed point-target imaging quality analysis will be performed below.
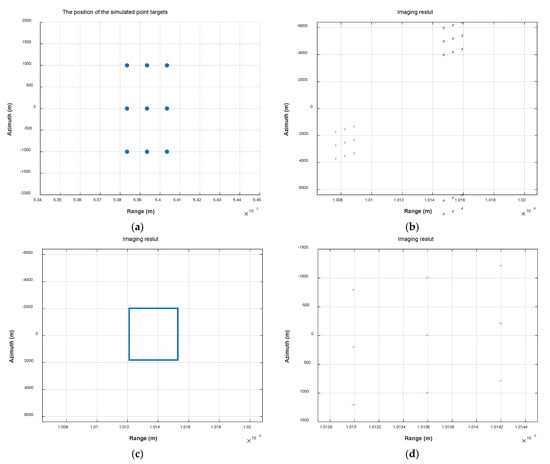
Figure 8.
The simulation results imaging based on the ESRM and the MERM. (a) The position of the simulated point targets; (b) The imaging results based on the ESRM; (c) The imaging result based on the MESRM; (d) The enlarged view of the blue rectangle in the (c).
The dual-channel SAR echo data at the squint angles of 0, 10, and 20 degrees are simulated, respectively, and the data are processed according to the flow shown in Figure 6. The imaging results are shown in Figure 9. The focusing effects in azimuth and range directions of these point targets are analyzed. Additionally, the results are shown in Table 2, where and represent the theoretical range resolution and the theoretical azimuth resolution, respectively, and the and are the actual range resolution and azimuth resolution, respectively, and the PSLR and ISLR denote the peak side-lobe ratio and the integrated side-lobe ratio, respectively.
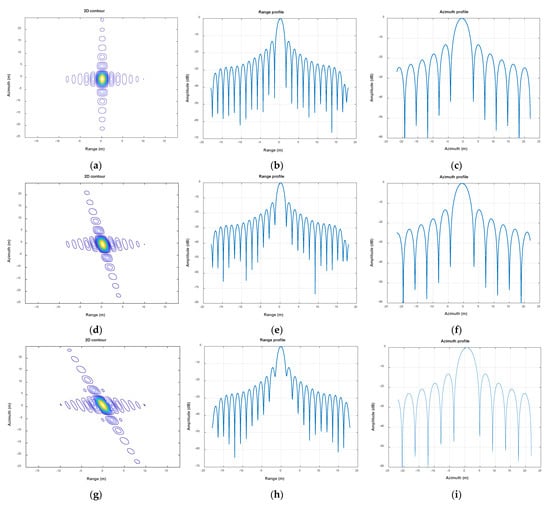
Figure 9.
The 2D simulation results. (a,d,g) are the results with the squint angle of 0, 10, and 20 degrees, respectively; (b,e,h) correspond to the range profiles of (a,d,g), respectively, while (c,f,i) correspond to the azimuth profiles.
Table 2.
The analysis of the point target imaging quality.
It can be seen from the analysis that the proposed algorithm can achieve the theoretical resolution in both azimuth and range directions. With the increase in the squint angle, the azimuth focusing quality is not degraded. However, the range focusing quality decreases, which is manifested by the rise of the side lobe peak and the reduction of main lobe energy. The reason for the deterioration in the range is that the coupling between azimuth and range is enhanced with the increase in the squint angle, and the phase terms higher than third-order are not considered during imaging. Therefore, the focusing effect of the range has deteriorated. However, in the existing spaceborne SMC-SAR system, the squint angle has not exceeded 10 degrees yet, so the scheme proposed in this paper can meet the application requirements.
4.2. GF-3 SDC Mode Data
In this section, the real data of GF-3 in SDC mode are adopted to validate the proposed SMC-SAR imaging scheme. The GF-3 experimented with the dual-channel spotlight mode on 20 June 2019, with an orbit ID of 15062. Before the scanning of the azimuth antenna, it obtained the data for 3.49 s at the 1.89-degree squint angle, that is, the data processed in this paper. It is known that the of the data is 1948.045 Hz, and the carrier frequency and the equivalent flight velocity of the SAR platform are the same as those in Table 1. Therefore, the Doppler centroid of the data can be calculated according to Equation (7) as 8444.2 Hz.
The original azimuth spectrums of the data from the two channels are shown in Figure 10a. Obviously, the azimuth spectrums are not symmetrical at zero due to the squint angle, and there is an amplitude imbalance between the two channels. After the Doppler centroid compensation, the azimuth spectrum can be symmetrical, as shown in Figure 10b. Additionally, the interferometric phase imbalance versus frequency obtained by the FCM is shown in Figure 10c. Besides, the valid samples used to estimate the phase imbalance and the estimation results are also marked in Figure 10c. After the preprocessing and reconstruction, the azimuth spectrum of the data is shown in Figure 10d. It can be seen that after the Doppler centroid compensation, phase imbalance compensation, and reconstruction, the azimuth spectrum has no aliasing and is symmetrical at about zero.
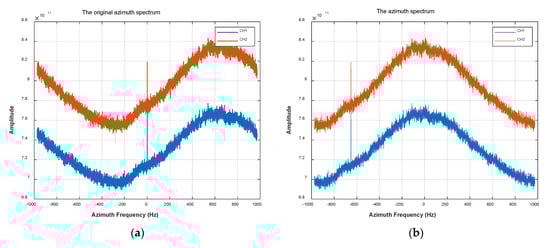
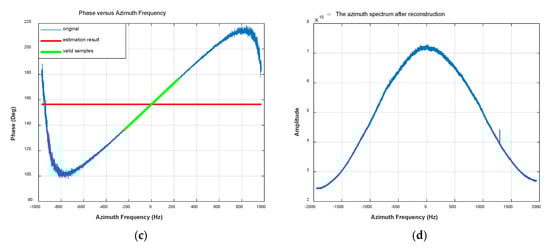
Figure 10.
The azimuth spectrum analysis of the GF-3 data. (a) The original azimuth spectrums of the GF-3 data, where the blue line and red line correspond to the first channel and second channel, respectively. (b) The azimuth spectrum after the Doppler centroid compensation. (c) The phase versus azimuth frequency and the estimation result of phase imbalance by FCM. (d) The azimuth spectrum of the GF-3 data after preprocessing and reconstruction.
If the GF-3 echo data is reconstructed by the traditional Krieger filter and then imaged based on ESRM without Doppler centroid compensation, the result is as shown in Figure 11a, where there is apparent ambiguity and defocus in azimuth. Additionally, the imaging result based on ESRM after preprocessing and reconstruction is shown in Figure 11b. Compared with Figure 11a, the image quality of Figure 11b has been dramatically improved, but some azimuth ambiguity still has not been completely suppressed, such as the parts marked by the yellow boxes. Figure 11c is the imaging result processed according to the scheme proposed in this paper. It can be seen that the azimuth ambiguity in the yellow boxes has been significantly suppressed.
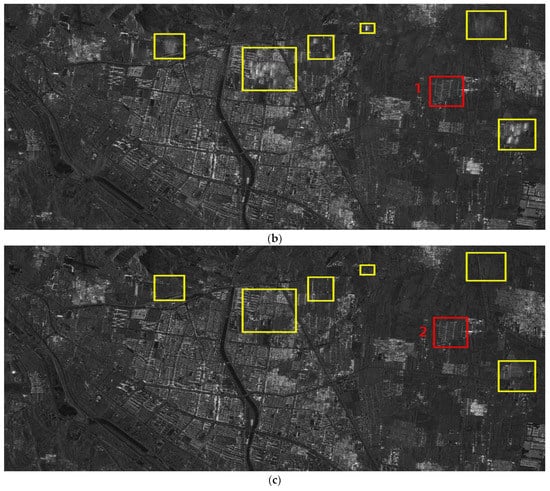
Figure 11.
The imaging results of GF-3 data in SDC mode. (a) is the imaging result based on ESRM without Doppler centroid compensation; (b) is the imaging result based on ESRM after preprocessing and reconstruction; (c) The imaging result using the scheme proposed in this paper.
To show the focusing effect of the image more clearly, the enlarged views of Area 1 and Area 2 marked by the red boxes in Figure 11 are shown in Figure 12a,b. It can be seen that the point targets in Figure 12a are defocused while the point-target resolution in Figure 12b is well focused. Additionally, the specific quantitative analysis will be discussed in Section 5. When comparing the two figures, it is evident that the imaging scheme proposed in this paper can achieve a better azimuth focusing effect.
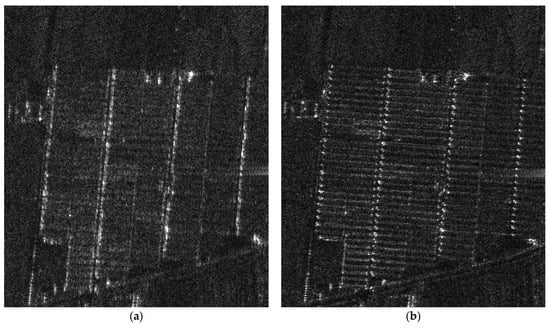
Figure 12.
The enlarged views of Area 1 and Area 2 in Figure 11. (a) The enlarged view of Area 1; (b) The enlarged view of Area 2.
In conclusion, both the simulation experiments and the imaging results of GF-3 data have proved that the imaging scheme proposed in this paper can achieve unambitious imaging of the SMC-SAR.
5. Discussion
The method proposed by this paper has been confirmed by processing the simulation and real data in Section 4. From the visual effect, it can be seen that the method proposed in this paper can significantly improve imaging quality. In order to better reflect the novelty of the method, the results of Figure 8 and Figure 12 are quantitatively analyzed in Table 3, which compares the experiment results of the method based on the MESRM proposed in this paper with the traditional method based on the ESRM.
Table 3.
The statistical analysis of the imaging quality.
First, the main target and false target amplitudes in Figure 8b,d are analyzed. The maximum amplitude of the main target in Figure 8b based on the ESRM is 65.133 dB, whereas in Figure 8d based on the MESRM it is 89.066 dB. The maximum amplitude of the false target in Figure 8b is 55.291 dB, and there is no false target in Figure 8d. Thus, the azimuth ambiguity-to-signal ratios (AASR) of the two figures are 9.842 dB and 89.066 dB, respectively. The method based on the MESRM can better suppress false targets in the SMC-SAR. Then the azimuth focusing effect of Figure 12a,b is discussed. The following two metrics are adopted to measure the focusing effect: signal-to-noise ratio (SNR) and entropy. The higher the SNR and the lower the entropy, the better the image is focused. As can be seen from Table 3, the method based on the MESRM is able to achieve lower entropy and higher SNR, so the focusing effect is better.
Through analysis, it can be known that compared with the traditional method based on ESRM, the method in this paper can not only better suppress false targets but also achieve better focusing, which can be proved by both quantitative analysis and visual effects. However, since the imaging algorithm does not consider the phase term above the third order, the imaging quality in the range direction decreases with the increase in the squint angle. As shown in Figure 13, when the squint angle is 35 degrees, although there is no apparent change in the azimuth profile, the in the range direction deteriorates to −7.417 dB and is only −5.375 dB, which means the defocus in the range direction. Therefore, the imaging algorithm of SMC-SAR with the high squint angle still needs to be improved.
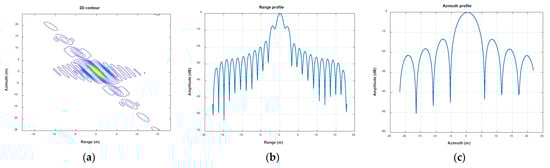
Figure 13.
The 2D simulation results with the squint angle of 35 degrees. (a) is the 2D contour of the point target; (b) is the range profile and (c) is the azimuth profile.
6. Conclusions
A novel overall imaging scheme for the SMC-SAR has been proposed in this paper, and the specific methods have been illustrated in detail in Section 3, which includes the following three parts: preprocessing, reconstruction, and imaging based on the MESRM. The preprocessing part first performs Doppler centroid compensation on the echo to avoid the influence of the Doppler centroid on the phase imbalance estimation and reconstruction. The phase imbalance is estimated by FCM. Furthermore, the Krieger filters are utilized to reconstruct the data to remove the Doppler spectrum aliasing caused by the non-uniform sampling. Since the Doppler centroid compensation causes the entire spectrum to shift, the azimuth frequency axis setting of the traditional imaging algorithm based on the ESRM should also be modified, which is analyzed in Section 3.3. Then an algorithm based on the MESRM is proposed to image the reconstructed data. Finally, in Section 4, both the simulated data and the real data of GF-3 in SDC mode are adopted to verify the effectiveness of the proposed algorithm. The scheme proposed in this paper has the advantages of simplicity and high efficiency and has been verified by the real data acquired by GF-3. However, since the coupling phase term above third-order is not considered, the method in this paper cannot achieve an ideal range, focusing on the case of a high squint angle. In the future, we will study the imaging algorithm of the SMC-SAR with the higher squint angle to realize the stitching of images under different angles of view and further obtain the image with a broader swath.
Author Contributions
Conceptualization, Y.L. and M.S.; Methodology, Y.L., M.S. and L.Z.; Software, Y.L. and M.S.; Validation, Y.L., M.S., L.Z., X.Q. and C.D.; Resources, M.S. and L.Z.; Writing—original draft preparation, Y.L.; Writing—review and editing, M.S., L.Z., X.Q. and C.D.; Supervision, C.D.; Funding acquisition, X.Q. All authors have read and agreed to the published version of the manuscript.
Funding
This research was funded by National Science Foundation of China under Grant, No. 62022082 and National Key R&D Program of China, No.2018YFA0701903.
Acknowledgments
The authors wish to acknowledge the support of the Gaofen-3 mission, especially the China Centre for Resources Satellite Data and Application, which provides the products of GF-3.
Conflicts of Interest
The authors declare no conflict of interest.
References
- Meta, A.; Mittermayer, J.; Prats, P.; Scheiber, R.; Steinbrecher, U. TOPS Imaging With TerraSAR-X: Mode Design and Performance Analysis. IEEE Trans. Geosci. Remote Sens. 2010, 48, 759–769. [Google Scholar] [CrossRef]
- Suess, M.; Grafmueller, B.; Zahn, R. A novel high resolution, wide swath SAR system. IGARSS 2001. Scanning the Present and Resolving the Future. Proceedings. In Proceedings of the IEEE 2001 International Geoscience and Remote Sensing Symposium (Cat. No.01CH37217), Sydney, Australia, 9–13 July 2001; Volume 1013, pp. 1013–1015. [Google Scholar]
- Currie, A. Wide-swath SAR imaging with multiple azimuth beams. In Proceedings of the IEE Colloquium on Synthetic Aperture Radar, London, UK, 29 November 1989; pp. 1–4. [Google Scholar]
- Krieger, G.; Gebert, N.; Moreira, A. SAR Signal Reconstruction from Non-Uniform Displaced Phase Centre Sampling. In Proceedings of the IGARSS 2004. 2004 IEEE International Geoscience and Remote Sensing Symposium, Anchorage, AK, USA, 20–24 September 2004; pp. 1763–1766. [Google Scholar]
- Krieger, G.; Gebert, N.; Moreira, A. Unambiguous SAR Signal Reconstruction From Nonuniform Displaced Phase Center Sampling. IEEE Geosci. Remote Sens. Lett. 2004, 1, 260–264. [Google Scholar] [CrossRef]
- Moreira, A.; Huang, Y. Airborne SAR processing of highly squinted data using a chirp scaling approach with integrated motion compensation. IEEE Trans. Geosci. Remote Sens. 1994, 32, 1029–1040. [Google Scholar] [CrossRef]
- Gebert, N.; Krieger, G.; Moreira, A. Multi-Channel ScanSAR for High-Resolution Ultra-Wide-Swath Imaging. In Proceedings of the 7th European Conference on Synthetic Aperture Radar, Boston, MA, USA, 2–5 June 2008; pp. 1–4. [Google Scholar]
- Li, S.; Yang, R. Error Analysis of Displaced Phase Centers Multiple Azimuth Beam Synthetic Aperture Radar. Acta Electron. Sin. 2004, 32, 1436–1440. [Google Scholar]
- Liu, G.; Wang, Y.; Lin, Y. Unambiguous reconstruction and imaging of nonuniform sampling SAR signals. In Proceedings of the 2007 1st Asian and Pacific Conference on Synthetic Aperture Radar, Huangshan, China, 5–9 November 2007; pp. 253–256. [Google Scholar]
- Raney, R.K.; Runge, H.; Bamler, R.; Cumming, I.G.; Wong, F.H. Precision SAR processing using chirp scaling. IEEE Trans. Geosci. Remote Sens. 1994, 32, 786–799. [Google Scholar] [CrossRef]
- Fan, W.; Zhang, M.; Li, J.; Wei, P. Modified Range-Doppler Algorithm for High Squint SAR Echo Processing. IEEE Geosci. Remote Sens. Lett. 2019, 16, 422–426. [Google Scholar] [CrossRef]
- Davidson, G.W.; Cumming, I.G.; Ito, M.R. A chirp scaling approach for processing squint mode SAR data. IEEE Trans. Aerosp. Electron. Syst. 1996, 32, 121–133. [Google Scholar] [CrossRef]
- Sun, G.; Jiang, X.; Xing, M. Focus Improvement of Highly Squinted Data Based on Azimuth Nonlinear Scaling. IEEE Trans. Geosci. Remote Sens. 2011, 49, 2308–2322. [Google Scholar] [CrossRef]
- Zhang, S.; Xing, M.; Xia, X.; Li, J.; Guo, R.; Bao, Z. A Robust Imaging Algorithm for Squint Mode Multi-Channel High-Resolution and Wide-Swath SAR With Hybrid Baseline and Fluctuant Terrain. IEEE J. Sel. Top. Signal Processing 2015, 9, 1583–1598. [Google Scholar] [CrossRef]
- Guo, Y.; Wang, P.; Chen, J.; Men, Z.; Cui, L.; Zhuang, L. A Novel Imaging Algorithm for High-Resolution Wide-Swath Space-Borne SAR Based on a Spatial-Variant Equivalent Squint Range Model. Remote Sens. 2022, 14, 368. [Google Scholar] [CrossRef]
- Shang, M.; Qiu, X.; Han, B.; Ding, C.; Hu, Y. Channel Imbalances and Along-Track Baseline Estimation for the GF-3 Azimuth Multichannel Mode. Remote Sens. 2019, 11, 1297. [Google Scholar] [CrossRef]
- Yang, J.; Qiu, X.; Shang, M.; Zhong, L.; Ding, C. Phase Imbalance Estimation for Azimuth Multi-Channel ScanSAR system. IEEE J. Sel. Top. Appl. Earth Observ. Remote Sens. 2021, 14, 3875–3886. [Google Scholar] [CrossRef]
- Kim, J.-H.; Younis, M.; Prats-Iraola, P.; Gabele, M.; Krieger, G. First Spaceborne Demonstration of Digital Beamforming for Azimuth Ambiguity Suppression. IEEE Trans. Geosci. Remote Sens. 2013, 51, 579–590. [Google Scholar] [CrossRef]
- Yang, T.; Li, Z.; Liu, Y.; Bao, Z. Channel error estimation methods for multi-channel HRWS SAR systems. In Proceedings of the 2013 IEEE International Geoscience and Remote Sensing Symposium—IGARSS, Melbourne, Australia, 21–26 July 2013; pp. 4507–4510. [Google Scholar]
- Liu, A.; Liao, G.; Ma, L.; Xu, Q. An Array Error Estimation Method for Constellation SAR Systems. IEEE Geosci. Remote Sens. Lett. 2010, 7, 731–735. [Google Scholar] [CrossRef]
- Zhu, Y.; Chen, J.; Zeng, H.; Kuang, H.; Wang, P.; Yang, W.; Yu, Z. Modified reconstruction method of squinted multi-channel SAR sigal. In Proceedings of the 2014 IEEE Geoscience and Remote Sensing Symposium, Quebec City, QC, Canada, 13–18 July 2014; pp. 632–635. [Google Scholar]
- Dong, X.; Zhang, Y. A Novel Compressive Sensing Algorithm for SAR Imaging. IEEE J. Sel. Top. Appl. Earth Observ. Remote Sens. 2014, 7, 708–720. [Google Scholar] [CrossRef]
- Xu, W.; Li, R.; Fang, C.; Huang, P.; Tan, W.; Qi, Y. Azimuth Multichannel Reconstruction Based on Advanced Hyperbolic Range Equation. Remote Sens. 2021, 13, 4705. [Google Scholar] [CrossRef]
- Lv, Y.; Zhong, L.; Qiu, X.; Yuan, X.; Yang, J.; Hu, Y.; Ding, C. Improving the Image Quality of Moving Ships for GF-3NG Based on Simultaneous AIS Information. Remote Sens. 2021, 13, 1951. [Google Scholar] [CrossRef]
- Huang, Y.; Li, C.; Chen, J.; Zhou, Y. Refined Chirp Scaling Algorithm for High Resolution Spaceborne SAR Imaging. Acta Electron. Sin. 2000, 28, 35–38. [Google Scholar]
Publisher’s Note: MDPI stays neutral with regard to jurisdictional claims in published maps and institutional affiliations. |
© 2022 by the authors. Licensee MDPI, Basel, Switzerland. This article is an open access article distributed under the terms and conditions of the Creative Commons Attribution (CC BY) license (https://creativecommons.org/licenses/by/4.0/).