2.1. Recent Literature Advances in Nowcasting, Based on Radar Data Prediction
Various classical ML and DL models have been introduced in the literature for weather nowcasting. In the following section, we summarize the nowcasting techniques that are based on radar data that have been proposed recently.
Prudden et al. [
20] reviewed the existing forecasting methods for precipitation prediction that are based on radar data and the machine learning techniques that are applicable for radar-based precipitation nowcasting. Four classes of methods for precipitation nowcasting were mentioned by the authors: persistence-based methods, probabilistic and stochastic methods, nowcasting convective development and ML-based approaches. The study emphasized the performance improvements that could be obtained by applying deep neural networks combined with domain knowledge about the physical system that was being modeled. The authors also highlighted the potential of generative adversarial networks, which are able to capture data uncertainty and generate new data that follow the same distribution patterns as the input data.
Han et al. [
21] used support vector machines (SVMs) for radar data nowcasting, which was modeled as a binary classification task. The model was trained to identify whether the radar would detect a radar echo >35 dBZ in the following 30 min. The features that characterized the input data included temporal and spatial information. The experiments revealed a probability of detection (POD) of around 0.61, a critical success index (CSI) of 0.36 and a false alarm rate (FAR) of about 0.52.
Ji [
22] employed artificial neural networks for short-term precipitation prediction using radar observations that were collected from China from 2010 to 2012. The reflectivity values were extracted from the raw data, then interpolated into 3D data and used to train the predictive model. The minimum and maximum values that were obtained for the root mean square error (RMSE) were 0.97 and 4.7, respectively [
22].
A convolutional neural network (CNN) model was proposed by Han et al. [
16] for predicting convective storms in the near future using radar data. The model was designed as a binary classification model to predict whether radar echo values would be higher than 35 dBZ in the next 30 min. The input radar data were represented by 3D images and the output was also a 3D image, in which each point of the image was "1" when the radar echo was predicted to be higher than 35 dBZ in the next 30 min and "0" when it was not. The experiments produced a CSI value of 0.44.
Socaci et al. [
19] proposed an adaptation of the Xception deep learning model, which they named
, for the short-term prediction of radar data. Experiments were performed using radar data that were provided by the Romanian National Meteorological Administration and an average
normalized root mean square error of less than 3% was obtained.
The U-Net convolutional architecture has been employed in multiple studies on weather nowcasting using radar data [
23,
24]. Agrawal et al. [
23] proposed a U-Net model for precipitation nowcasting. Their proposed model surpassed several baselines of other methods in terms of short-term prediction (up to 1 h), namely the persistence model and an optical flow algorithm, as well as the high-resolution rapid refresh (HRRR) system, but was outperformed by the HRRR model in terms of forecasts for up to 5 h. The RainNet model, which was proposed by Ayzel et al. [
25], is a U-Net model that was trained using a logcosh objective function. Trebing et al. [
24] introduced a lightweight U-Net model that used depth-wise separable convolutions. Their model achieved a similar performance to that of the classical U-Net while only having a quarter of its parameters.
Ciurlionis and Lukosevicius [
26] used a CNN model to forecast future precipitation using current precipitation data. They used precipitation data that were estimated using a radar and trained the model with four time steps as the inputs and the next step as the output (i.e., when
t was the current step, the input data were
and
t and the model predicted data for
). To predict further in the future, they used consecutive predictions (using the predicted data from the previous step as the input for the next step). They compared their approach to four basic numerical algorithms: the persistence model, a basic translation algorithm, a step translation algorithm and a sequence translation algorithm. They measured whether the models correctly predicted zero or non-zero values (i.e., they transformed the task into a classification problem). When predicting one time step, both the CNN and the sequence translation algorithm had a CSI of 0.81, while the others had CSI values of under 0.8. For predictions further in the future, the CNN had a better performance than the sequence translation algorithm; for example, at 60 min, the CNN model had a CSI of 0.71 while the numerical algorithm had a CSI of 0.65.
Differentiating from the general trend of using deep learning for machine learning models, Mao and Sorteberg [
27] proposed a model that was based on a random forest (RF) for precipitation nowcasting. The random forest was trained to predict precipitation data. The inputs for the model were multiple types of data, with the main ones being precipitation data that were estimated using a radar, AROME numerical model predictions and other various data from ground weather stations, such as air pressure, air temperature and/or wind speed. To evaluate the model, the predictions were transformed into two classes: below 0.1 and above or equal to 0.1. They obtained a CSI of 0.49 for the proposed model, while the automatic radar nowcasting had a CSI of 0.42 and a baseline numerical model had a CSI of 0.33.
Bonnet et al. [
28] used a video prediction model named PredRNN++, which was based on ConvLSTM combined with gradient highway units (GHUs), to predict radar reflectivity and had radar reflectivity as the input. They only used the reflectivity from the lowest elevation angle, which was collected every 5 min. The input data consisted of 10 time steps and the model predicted 10 time steps into the future. In order to measure the performance of the model, they also transformed the predictions into classifications using the thresholds of 10 dBZ for predictions and 20 dBZ for observations. In terms of metrics, they used CSI and the equitable threat score (ETS), which is an improvement on CSI that also takes true negatives into consideration. Their model obtained a CSI of 0.52 and an ETS of 0.46 for prediction at 15 min and outperformed ENCAST, which is the model that is currently used in São Paulo, Brazil, based on the extrapolation of the data that were collected from the radar.
While the majority of nowcasting models that have been proposed so far have been based on a single machine learning model, Xiang et al. [
29] proposed a model that combined two types of neural networks in order to improve the nowcasting results: decision trees and numerical methods. The goal of their model was to predict the amount of precipitation at a single point 1–2 h in the future (they targeted points where there were weather stations so they were able to compare the predictions to the ground truth values that were obtained by the stations). The dataset was processed so it only contained time steps with meteorological activity. Their model worked in three steps: first, they used a numerical model for trajectory tracking to compute the trajectory of the meteorological phenomenon (e.g., storm, clouds, etc.); then, there was a feature extraction phase, in which the best features were selected (some were just general features that were provided by the weather station and some were dependent on the previous phase, such as cropping images depending on the computed trajectory); the final phase consisted of using three models to separately predict the amount of precipitation. Each model used a different set of features from the features that were extracted in the second phase. For the final output, these three values were summed up with different weights. They tested the model using different features that were extracted in the second phase. The best results were 4.035 for the RMSE and 246.52 for the mean absolute percentage error (MAPE).
One of the main problems with using convolutional neural networks that were trained with conventional loss functions to predict images is that the predictions tend to be blurry or smoothed out. Hu et al. [
30] proposed an improvement for nowcasting models by adding generative adversarial networks (GANs) as a second step after the usual predictive model. They proposed two types of GANs: a spatial GAN (acting on the actual image) and a spectral GAN (acting on the spectrum of the image following a fast Fourier transform). A masked-style loss function was introduced to improve the sharpness of the generated images. In addition, a new metric (the power spectral density score (PSDS)) was proposed, which was computed based on the spectrum of the images. In order to evaluate the quality of the predictions, another metric (the learned perceptual image patch similarity (LPIPS)) was used, which was measured according to the perceptual similarity between the observations and the predictions. The CSI metric was employed to measure the performance of the model using binarized values. In their experiments, U-Net and ConvLSTM were used as base models. The results that were obtained using both types of GANs were better than those that were obtained using only the spatial GAN, except when measuring CSI at the lowest threshold. Adding the mask-style loss yielded better results in most cases. As mentioned before, the original models yielded better results than the GANs for CSI at the lowest threshold, but this changed at higher thresholds. The GANs produced better LPIPS scores, which were even better when using the mask-style loss function (0.412 for the original ConvLSTM and 0.27 for the ConvLSM with both GANs and the loss function). The PSDS scores were significantly improved when using the GANs and the loss function (0.78 for the original ConvLSTM and 0.16 for the ConvLSTM with both GANs and the loss function).
Choi and Kim [
31] also used GANs to improve the performance of U-Net models. Their goal was to predict radar reflectivity using radar reflectivity as the input data. The authors proposed a precipitation nowcasting model (Rad-cGAN) that was based on a conditional generative adversarial network (cGAN). To evaluate their model, they compared their estimated precipitation values using the ZR model to the observed ground truth precipitation values that were gathered at several dams. They obtained a Pearson correlation coefficient of 0.86, an RMSE of 0.42, a Nash–Sutcliffe efficiency (NSE) of 0.73 and a CSI of 0.81.
2.2. Case Studies
In the following section, we describe the case studies that were used to evaluate the proposed
NeXtNow model. The two case studies were conducted using datasets from Romania (provided by the NMA) and Norway (provided by the MET), which were selected because they belonged to different geographical/climatic areas and contained different radar measurements (as further highlighted in
Table 1), thus allowing us to test the performance of the
NeXtNow model more thoroughly.
2.2.1. First Case Study (NMA Data)
The NMA dataset that was used in our first case study was collected by a Doppler single-polarization radar that is located in central Romania. During a full volume scan, which is completed every 6 min, the radar outputs many different products that are related to the location, intensity and movement of precipitating clouds and their associated meteorological phenomena. For the experiments, we used the base reflectivity (R) product and the base velocity (V) product. The radar collects these base products at nine elevation angles, effectively gathering nine sets of velocity and reflectivity data at each time step. For both products, we used the data from the lowest four elevation angles, which resulted in eight products in total: R01, R02, R03, R04, V01, V02, V03 and V04. The reflectivity and Doppler radial velocity were used for the NMA case study as these are the first products that are analyzed by forecasters to identify weather features. The use of velocity fields can be theoretically useful because they can introduce the effects of convergence zones into the model for the prediction of the initiation and evolution of convective storms. The experiments that are presented in
Section 3 empirically sustained this hypothesis.
To train, validate and test the model, 20 summer days with heavy rain, wind and hail and without any meteorological events were extracted from the observations, which corresponded to events that were observed in June 2010 (2nd, 10th, 12th, 13th, 14th, 19th, 20th, 22nd, 23rd and 24th), June 2017 (from 3rd to 7th) and June 2018 (11th, 13th, 15th, 16th and 21st). The study area was the central Romania region (central Transylvania) as the radar is located near the village of Bobohalma. The month of June was selected for the NMA case study as, in Romania, it is the month that the most convective storms and convective systems develop in the Carpathian basin. The dataset included days both with and without severe meteorological events and thus, a diverse dataset was obtained. Out of the entire area that is scanned by the radar, we focused on a central square with a size of 256 × 256 cells (the radar is located in the middle of this square).
2.2.2. Second Case Study (MET Data)
The MET radar dataset that was used in our second case study consisted of composite reflectivity values that were obtained from the MET Norway Thredds Data Server [
32]. The data, which are available at [
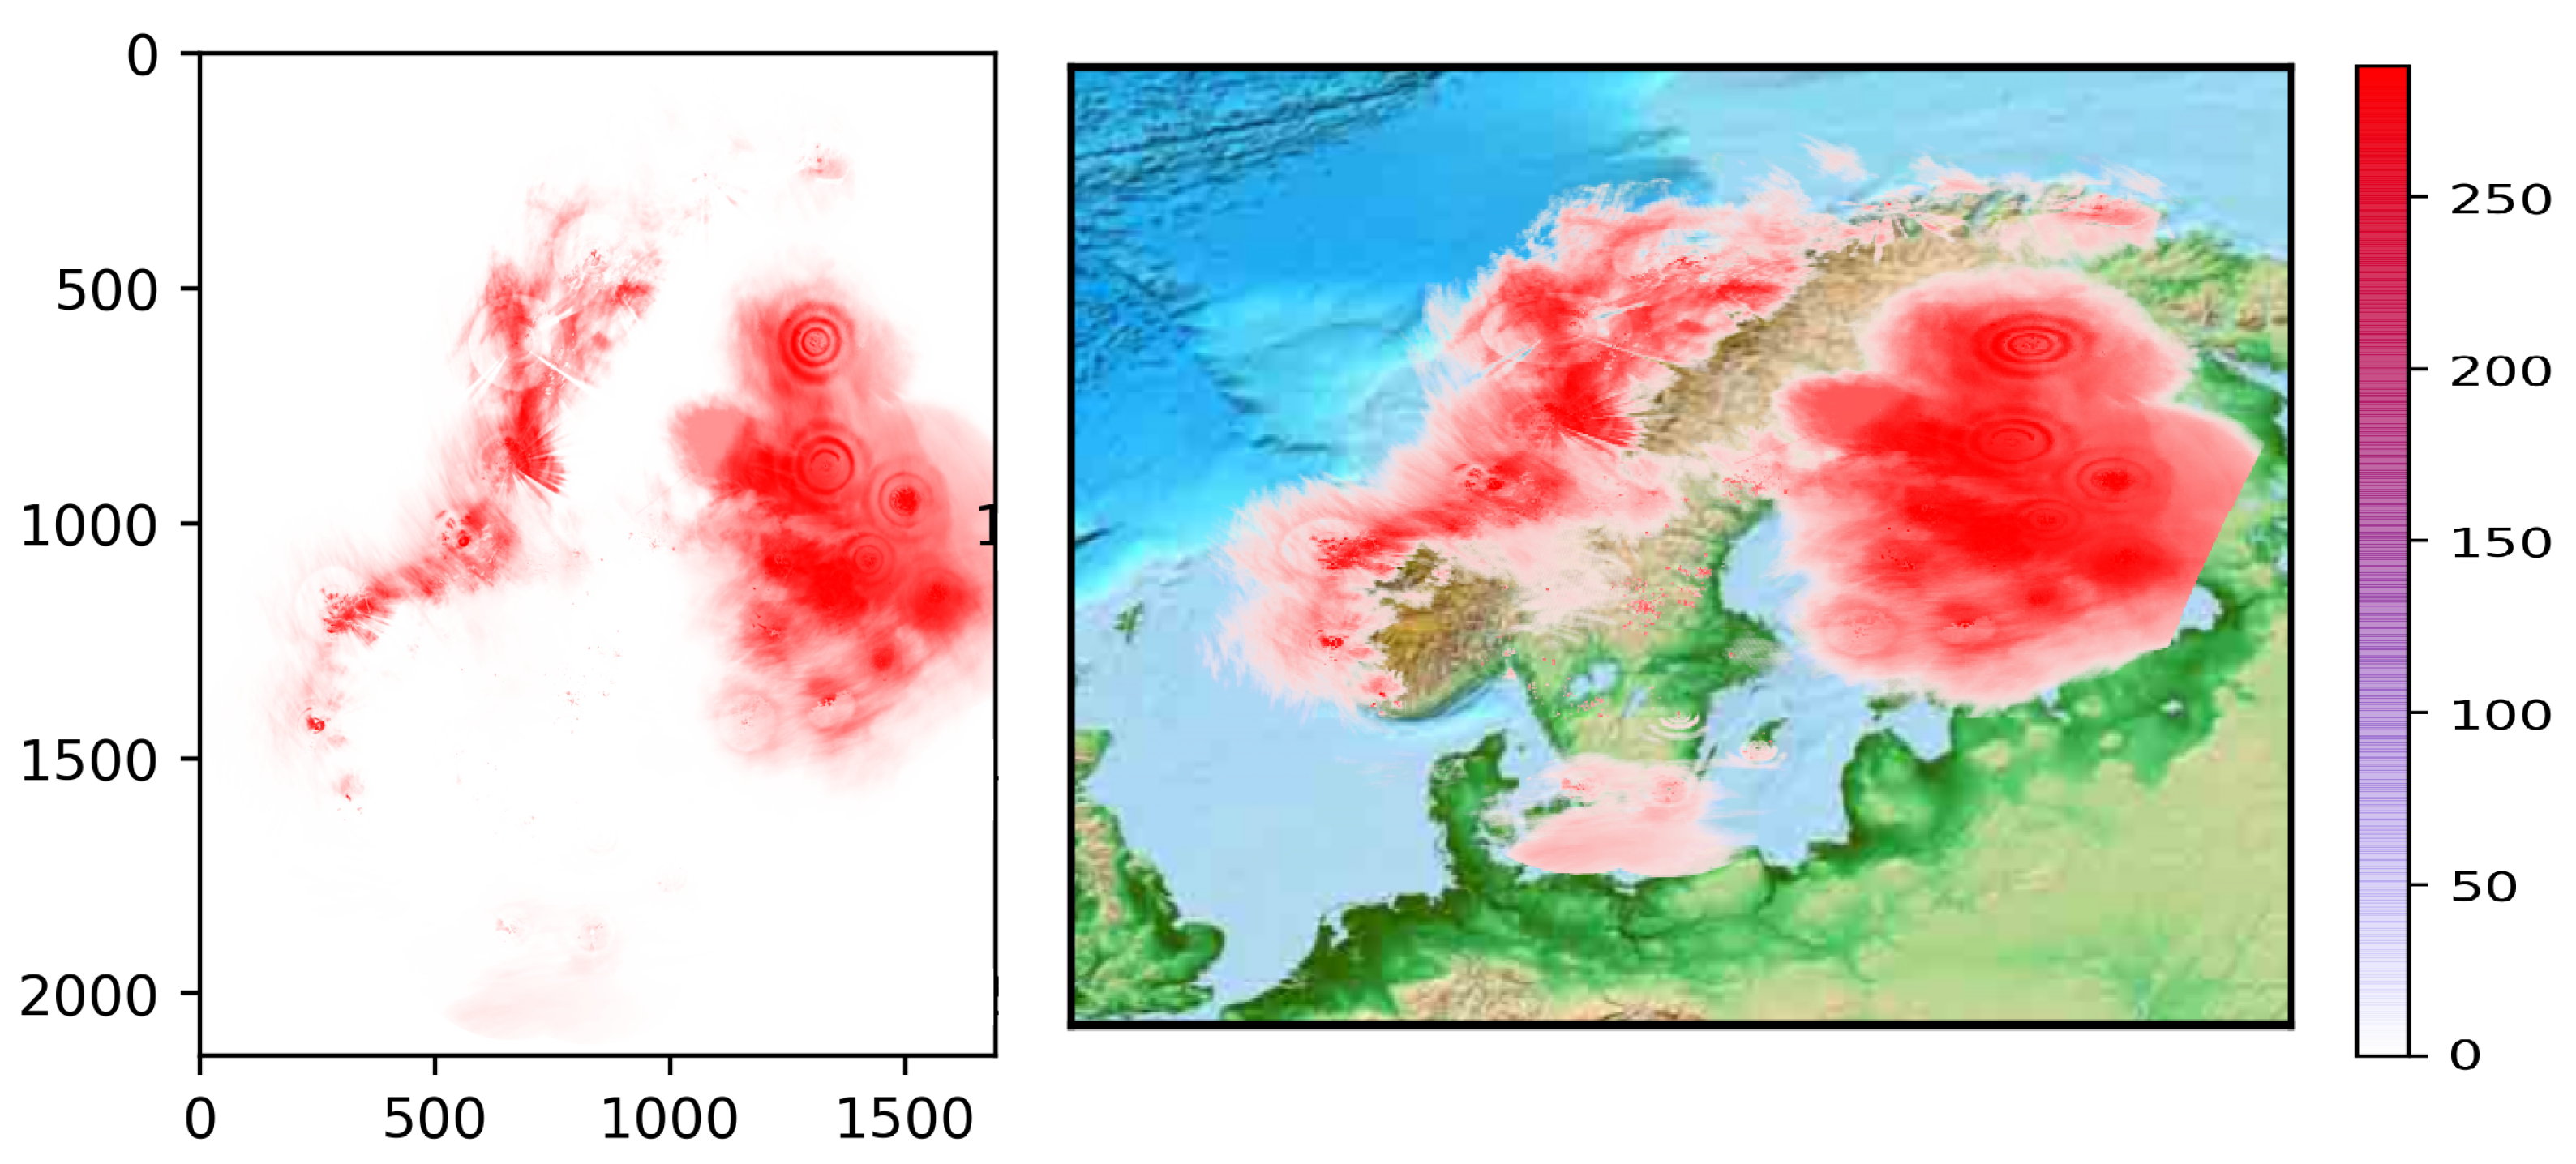
33], were obtained by processing the raw reflectivity measurements that were retrieved from multiple radars. Thus, the reflectivity product that is stored at the MET Norway is a composite map that is obtained from all elevations and tilts by taking into account the radar scans that have the best quality and not the strongest reflectivity across the elevations. This composite reflectivity product is obtained by applying an interpolation procedure and using different weights for the various radars, depending on their quality and other meteorological or non-meteorological factors that can alter the radar measurements. The reflectivity values that were used in our experiments were collected at intervals of 5 min.
To train, validate and test the model, days with and without meteorological events were selected from December 2020 (23rd, 25th, 26th and 27th), January 2021 (17th and 18th), March 2021 (3rd and 4th), April 2021 (12th and 13th), June 2021 (the entire month) and January 2022 (1st–25th). The days were selected so as to obtain a diverse dataset that contained days both with and without severe meteorological events and included both summer and winter months. The analyzed geographical area was a region surrounding Oslo. From the entire map, a square of 256 × 256 pixels was selected.
Table 1 describes the datasets that were used in our case studies. The second column in the table indicates the radar products of interest and the last column shows the number of days on which the radar data that were used in each case study were collected.
2.3. Methodology
With the goal of answering our first research question (RQ1), we developed and evaluated our
NeXtNow deep learning model, which was customized for the short-term prediction of weather radar products.
NeXtNow was adapted for radar data prediction from the ResNeXt [
17] architecture, which is mainly used for image processing. To the best of our knowledge, no other architecture that is based on ResNeXt has been proposed for weather nowcasting or spatiotemporal prediction problems. While several works have proposed fully convolutional or convolutional–recurrent neural networks for weather forecasting, they have employed simple and causal 2D or 3D convolutional architectures [
34] and architectures that were inspired by U-Net [
24] or the Xception model [
19]. The basic details of the ResNeXt deep learning model are presented in
Section 2.3.1, then
Section 2.3.2 introduces the model that was used in our approach. Our
NeXtNow learning model is introduced in
Section 2.3.3, while the testing stage of
NeXtNow and the methodology that was employed for the performance evaluation is discussed in
Section 2.3.4.
2.3.1. ResNeXt Architecture
The ResNeXt architecture was proposed by Xie et al. [
17] as an improved version of the
model [
35]. The
architecture [
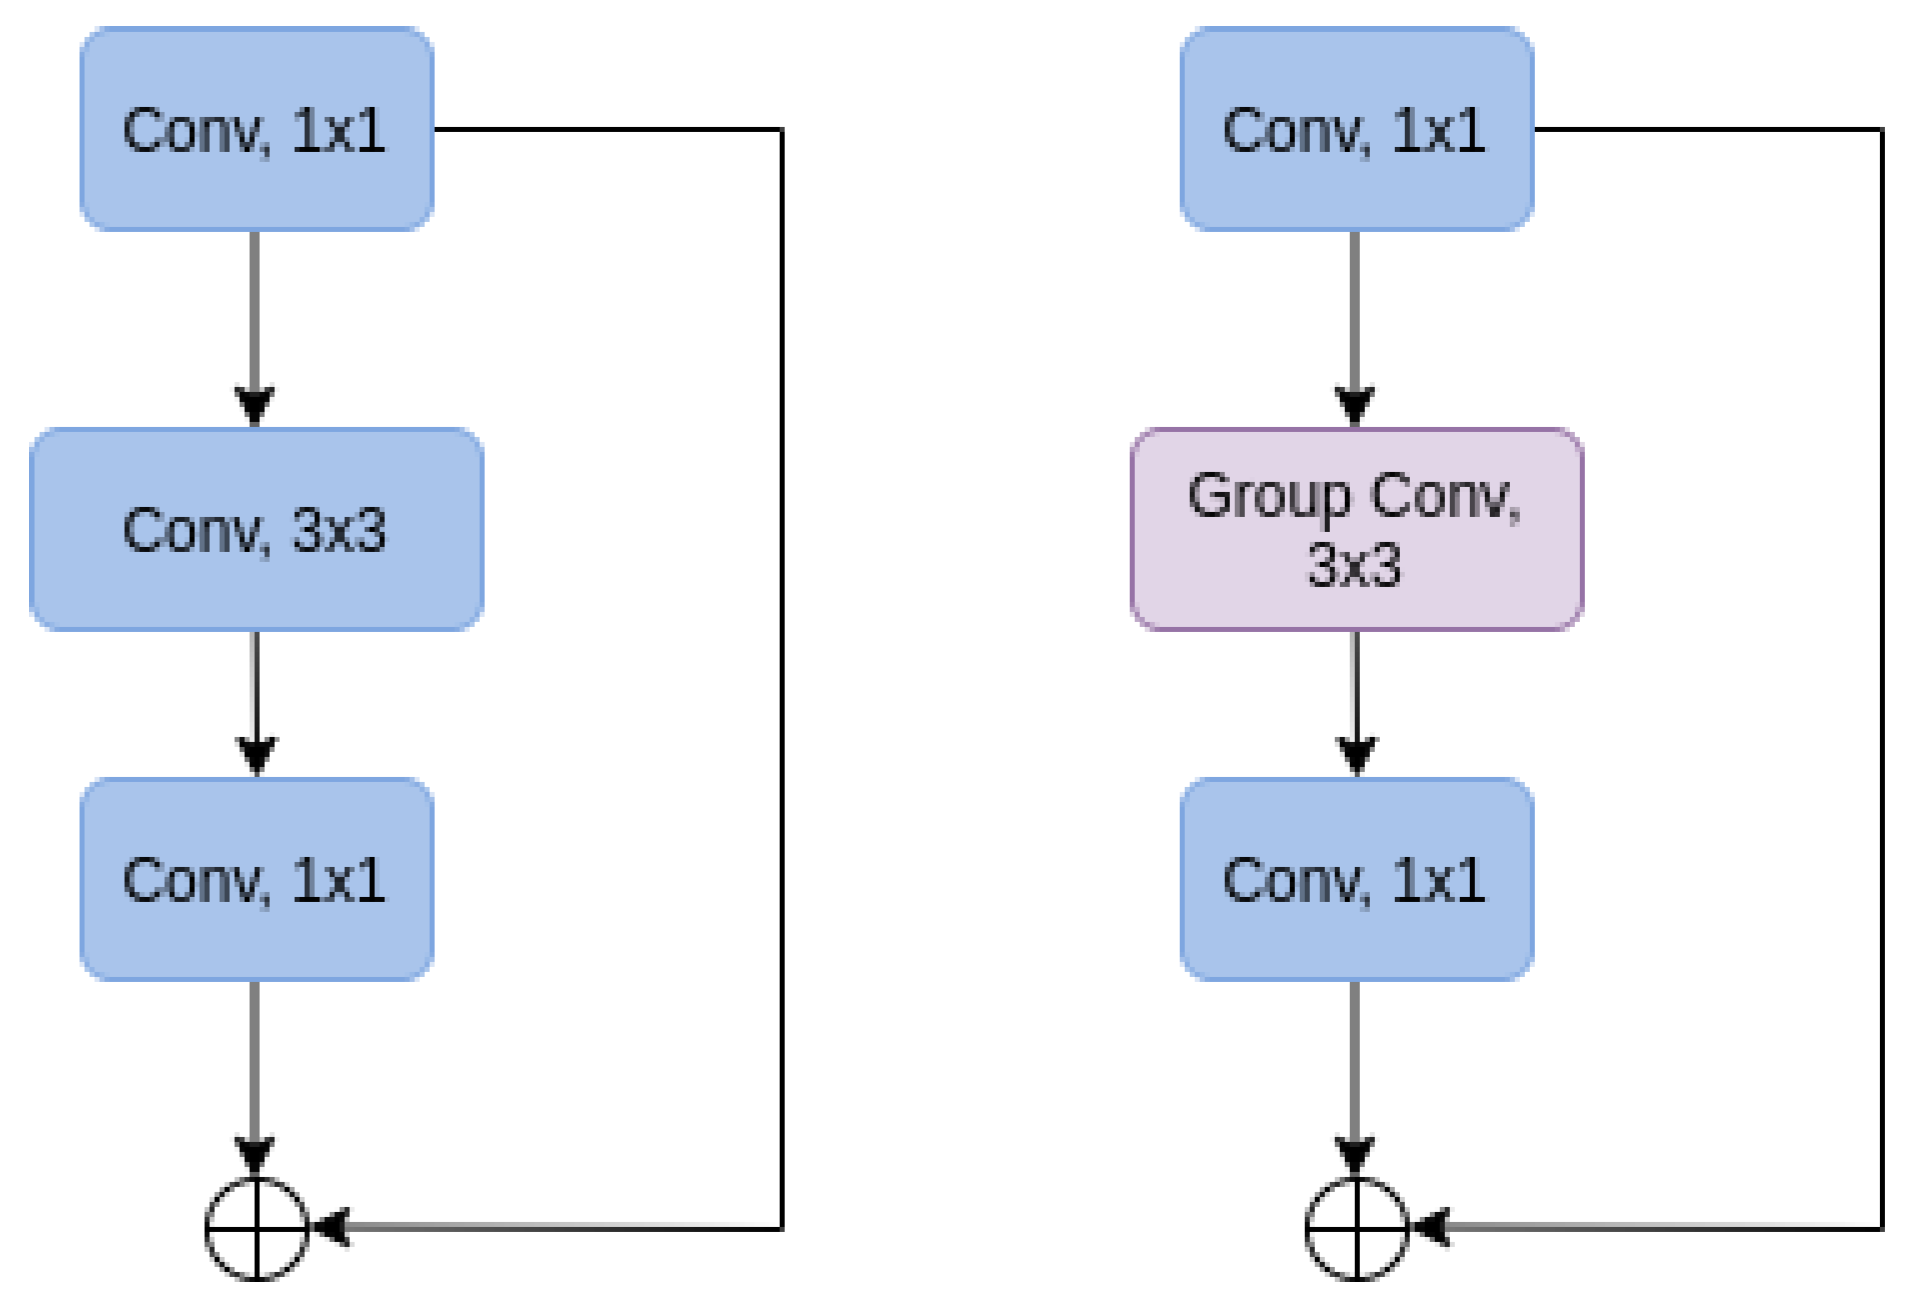
35] addresses the difficulty in training very deep neural networks by introducing shortcut connections, a technique in which the input of an architectural block is added to its output in order to obtain the final output. By passing information from earlier layers to deeper layers, the network can optimize residual mappings, thus making it possible to efficiently train very deep architectures. This process can be viewed as a form of feature fusion, in which features at different levels of depth are combined using an addition operation [
36]. Multiple residual blocks are stacked to form deep networks [
35].
ResNeXt further builds on this architectural blueprint by using grouped convolutions instead of plain convolutions inside the residual blocks. Grouped convolutions are a type of convolutional layer in which the input is split channel-wise into multiple groups, with each group being processed individually by convolutions and concatenated at the end to obtain the final result. This construction has been shown to be equivalent to applying a set of aggregated transformations, which can be formalized as follows.
Given an input
x and a hyperparameter that is called
cardinality C, an aggregated transformation can be obtained from a set of transformations
as:
Following the strategy in
, the aggregated transformation is a residual connection, which leads to the following computation for the output:
Figure 1 shows a schematic representation of the two types of blocks that are used in the
and ResNeXt architectures. It has been shown experimentally that tuning the hyperparameter
C can lead to significant performance improvements in image classification tasks [
17].
As in the case of
, the ResNeXt architecture is composed of a succession of blocks [
17].
2.3.2. Formalization, Data Modeling and Preprocessing
We denoted the radar products of interest by
, where
n is the dimensionality of
P (the number of radar products that were used). For our case studies that were described in
Section 2.2, we obtained the following values for
P and
n:
For the first case study (NMA dataset), and ;
For the second case study (MET dataset), and .
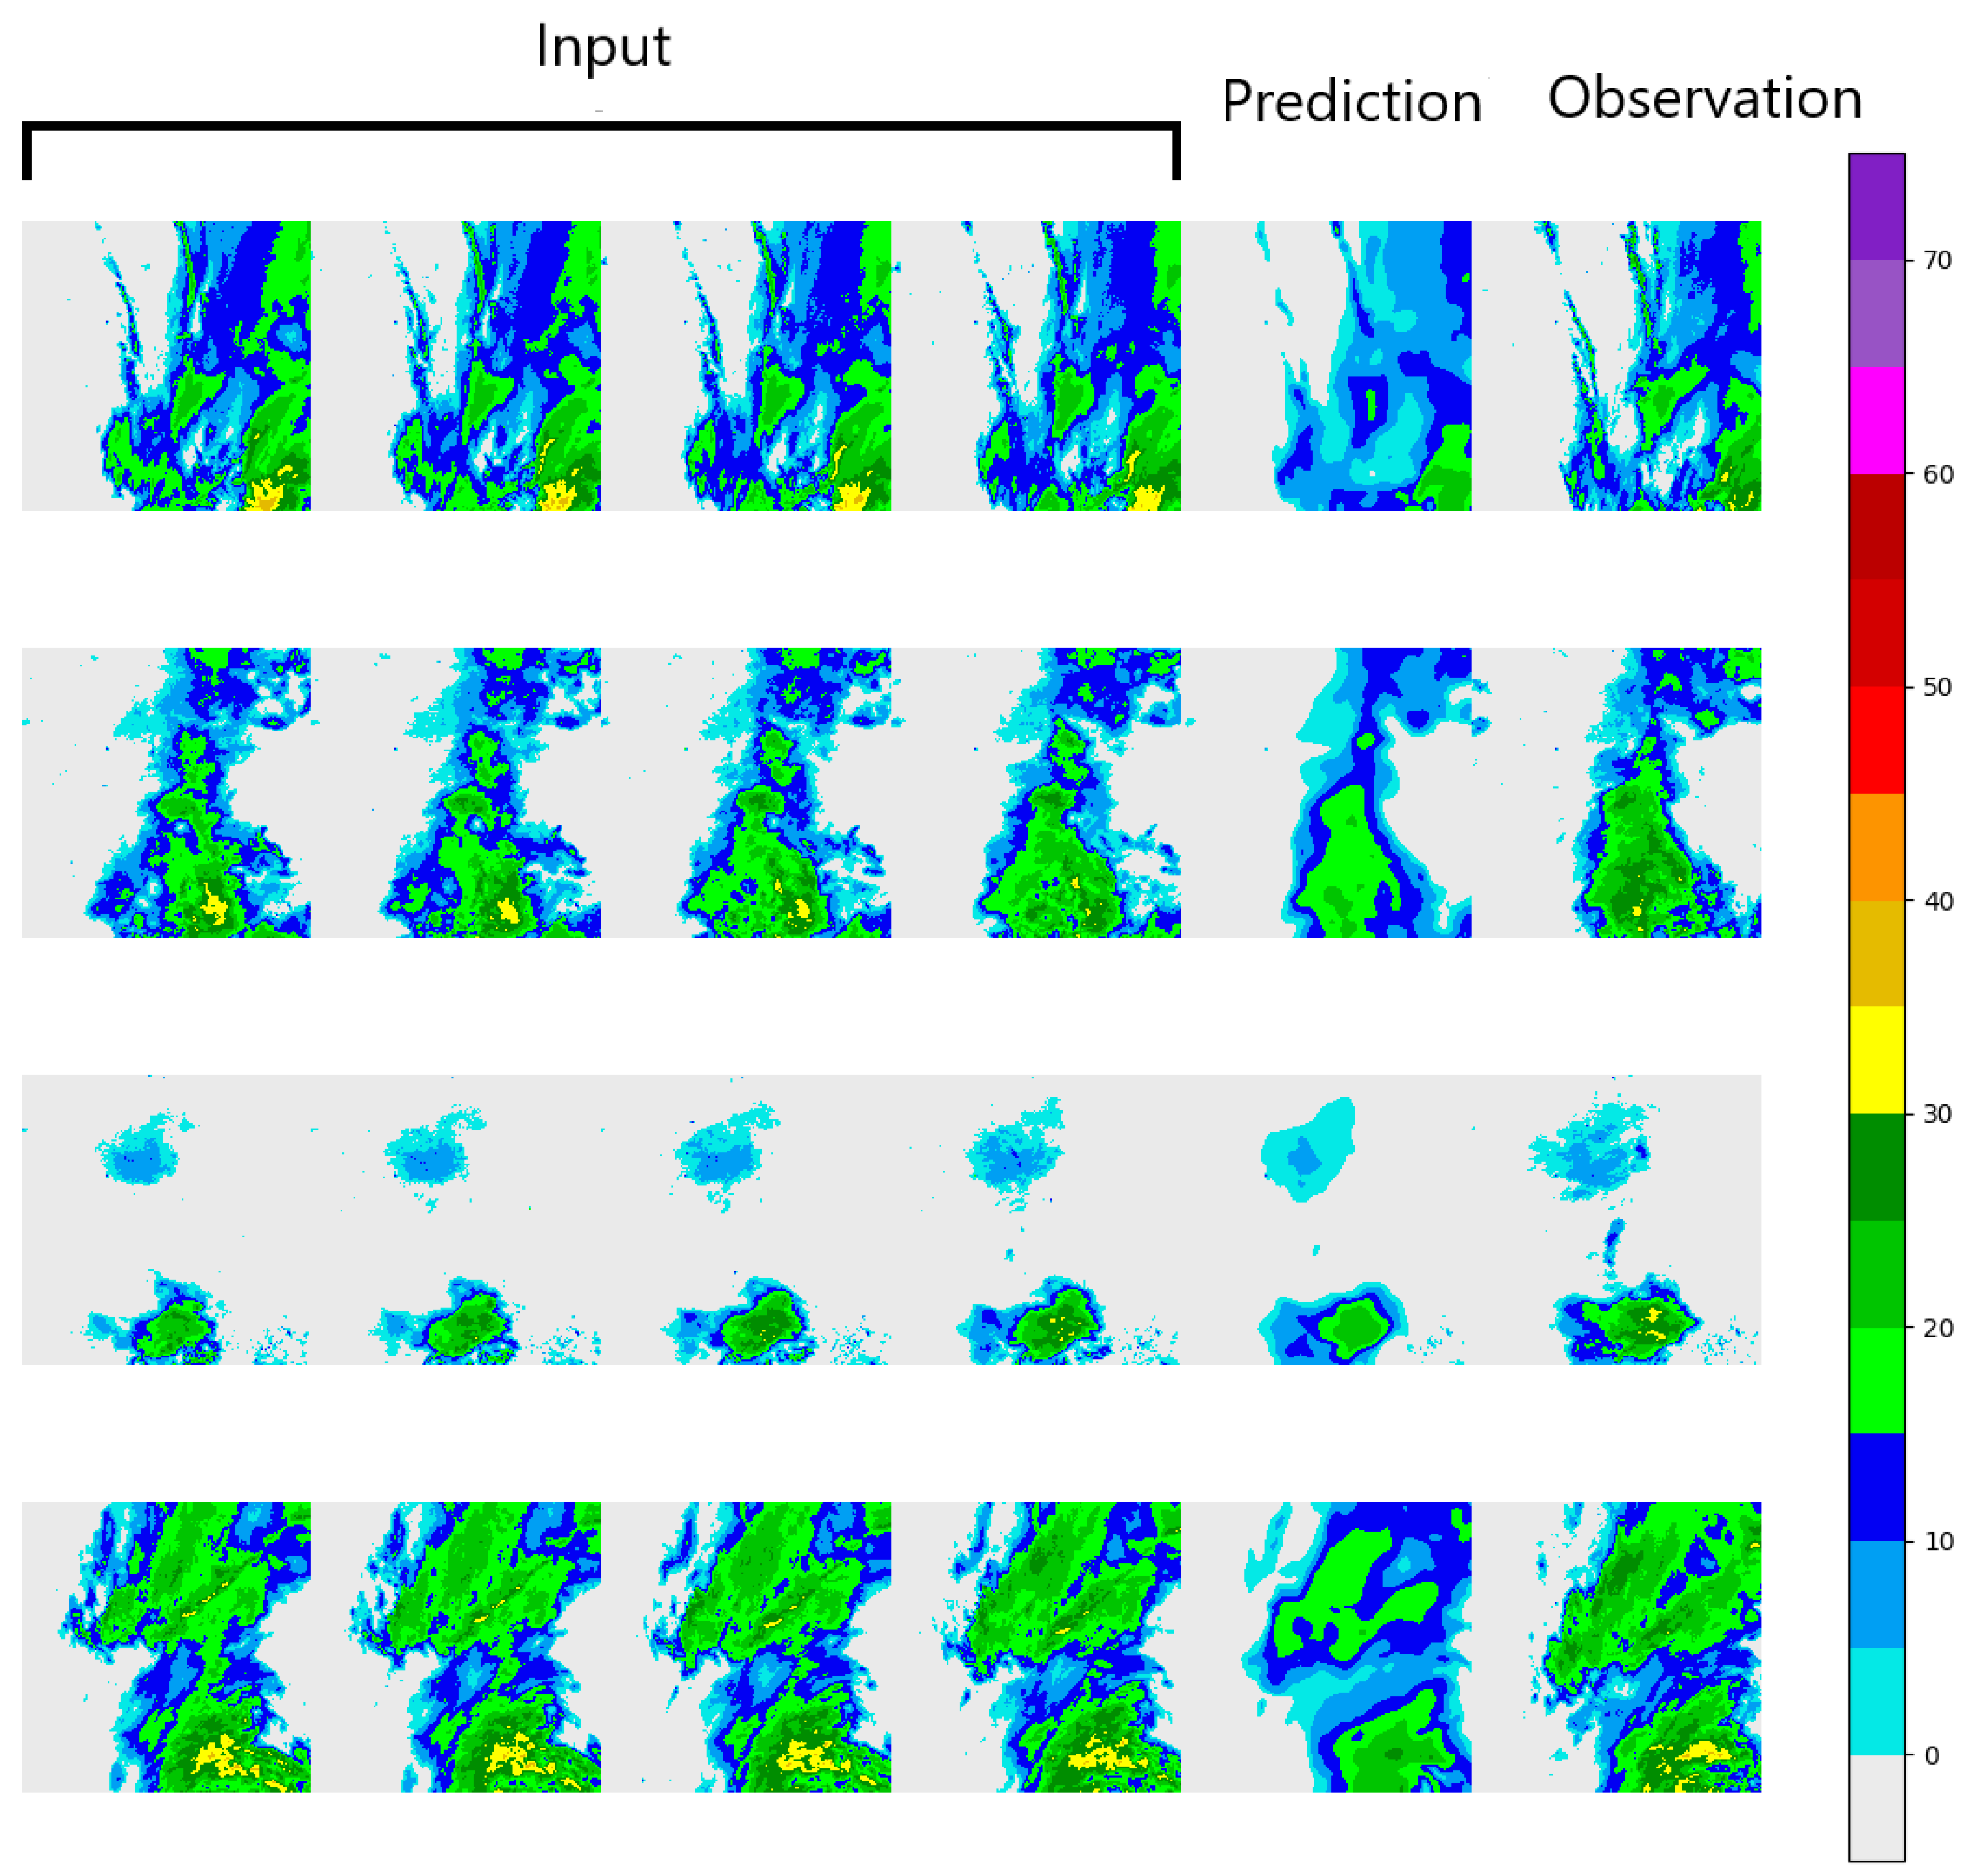
The radar data that were input at a certain time moment t were denoted by and were modeled as 3D images with n channels (corresponding to the available radar products), with the i-th channel representing the value of the radar product at time t. More specifically, the OX and OY axes represented the longitudinal and latitudinal values of the geographical area and the OZ axis represented the channels (i.e., the values of the radar products P at time moment t).
A sample 4-channel 3D image (with
products) is shown in
Figure 2.
Given a certain step k, the goal of our learning problem was to predict the 3D image at time moment t from the 3D images that were collected at the time moments . In our model, the output was also an n-channel 3D image, in which the value of a point on the i-th channel of the image was the value that was predicted for the radar product at time t. We noted that one time step (i.e., the time period between two consecutive time moments and t) represented the time resolution between two consecutive radar scans. More specifically, a time step was 6 min for the NMA case study and 5 min for the MET case study.
We denoted the sequence of 3D images that represented the radar data that were collected at time moments by . In this context, the target function of our learning problem was a function M that mapped the k-length sequence of n-channel 3D images () onto another n-channel 3D image (), i.e., . The NeXtNow deep learning model learned hypothesis h, which was an approximation of M (), i.e., . Thus, for a sequence of images (), NeXtNow provided a multi-channel 3D image that contained the estimation of the values of the radar products at time t.
A sequence of 3D images that contained radar data that were collected at different time moments t was available. A dataset was created from sequences in the form of , i.e., a sequence of n-channel 3D images that represented radar data that were collected at time moments . For each instance, the from the ground truth (i.e., the n-channel 3D image that contained the values of the radar products at time t) was available and was used to train the model.
Before building the
NeXtNow deep learning model, a preprocessing step was applied to the 3D images
to correct any possible errors that existed in the radar data. For the NMA dataset, two different preprocessing methods were used, depending on the product. For R, the only preprocessing that was carried out was to replace the “No Data” (NaN) values with “0”. For the V product, there was a more complex preprocessing step. The issue with V was that it was a very noisy product because it represented the velocity
relative to the radar, so there were some cases in which the radar could not properly estimate the direction or the speed, thus producing invalid values. These invalid values appeared often enough that they could interfere with the model learning [
37]. We addressed this problem by introducing a cleaning step, which replaced the invalid values with valid values. The new values were computed as the weighted average of the values in the neighborhood surrounding the invalid value. The weight of a value in the neighborhood was inverse proportional to the difference between that value and the invalid value.
The raw MET data were preprocessed as follows. Since the raw data had negative reflectivity values, which were not important for nowcasting, these values were all replaced with a constant value of −1. Additionally, the NaN values that corresponded to missing radar measurements were replaced with values that were outside the domain of valid reflectivity values, i.e., −5, in order to be able to distinguish them from the negative values and the reflectivity values that were of interest (i.e., the positive values).
As well as the previous preprocessing steps, the data were normalized using the classical min-max normalization method. For the min-max normalization, we used the minimum and maximum values from the domain of the radar products instead of the minimum and maximum values from the training dataset. This way, we made sure that the same values in different datasets were assigned the same normalized values. In the case of the MET dataset, the minimum value that was used for normalization was −5, which corresponded to the missing radar measurements.
2.3.3. Building the NeXtNow Model
The predictive model NeXtNow was built using a training dataset that consisted of training samples in the form of (, ), where ) represented the ground truth (the 3D image that consisted of the real values of the radar products at time t) that was used to train the instance .
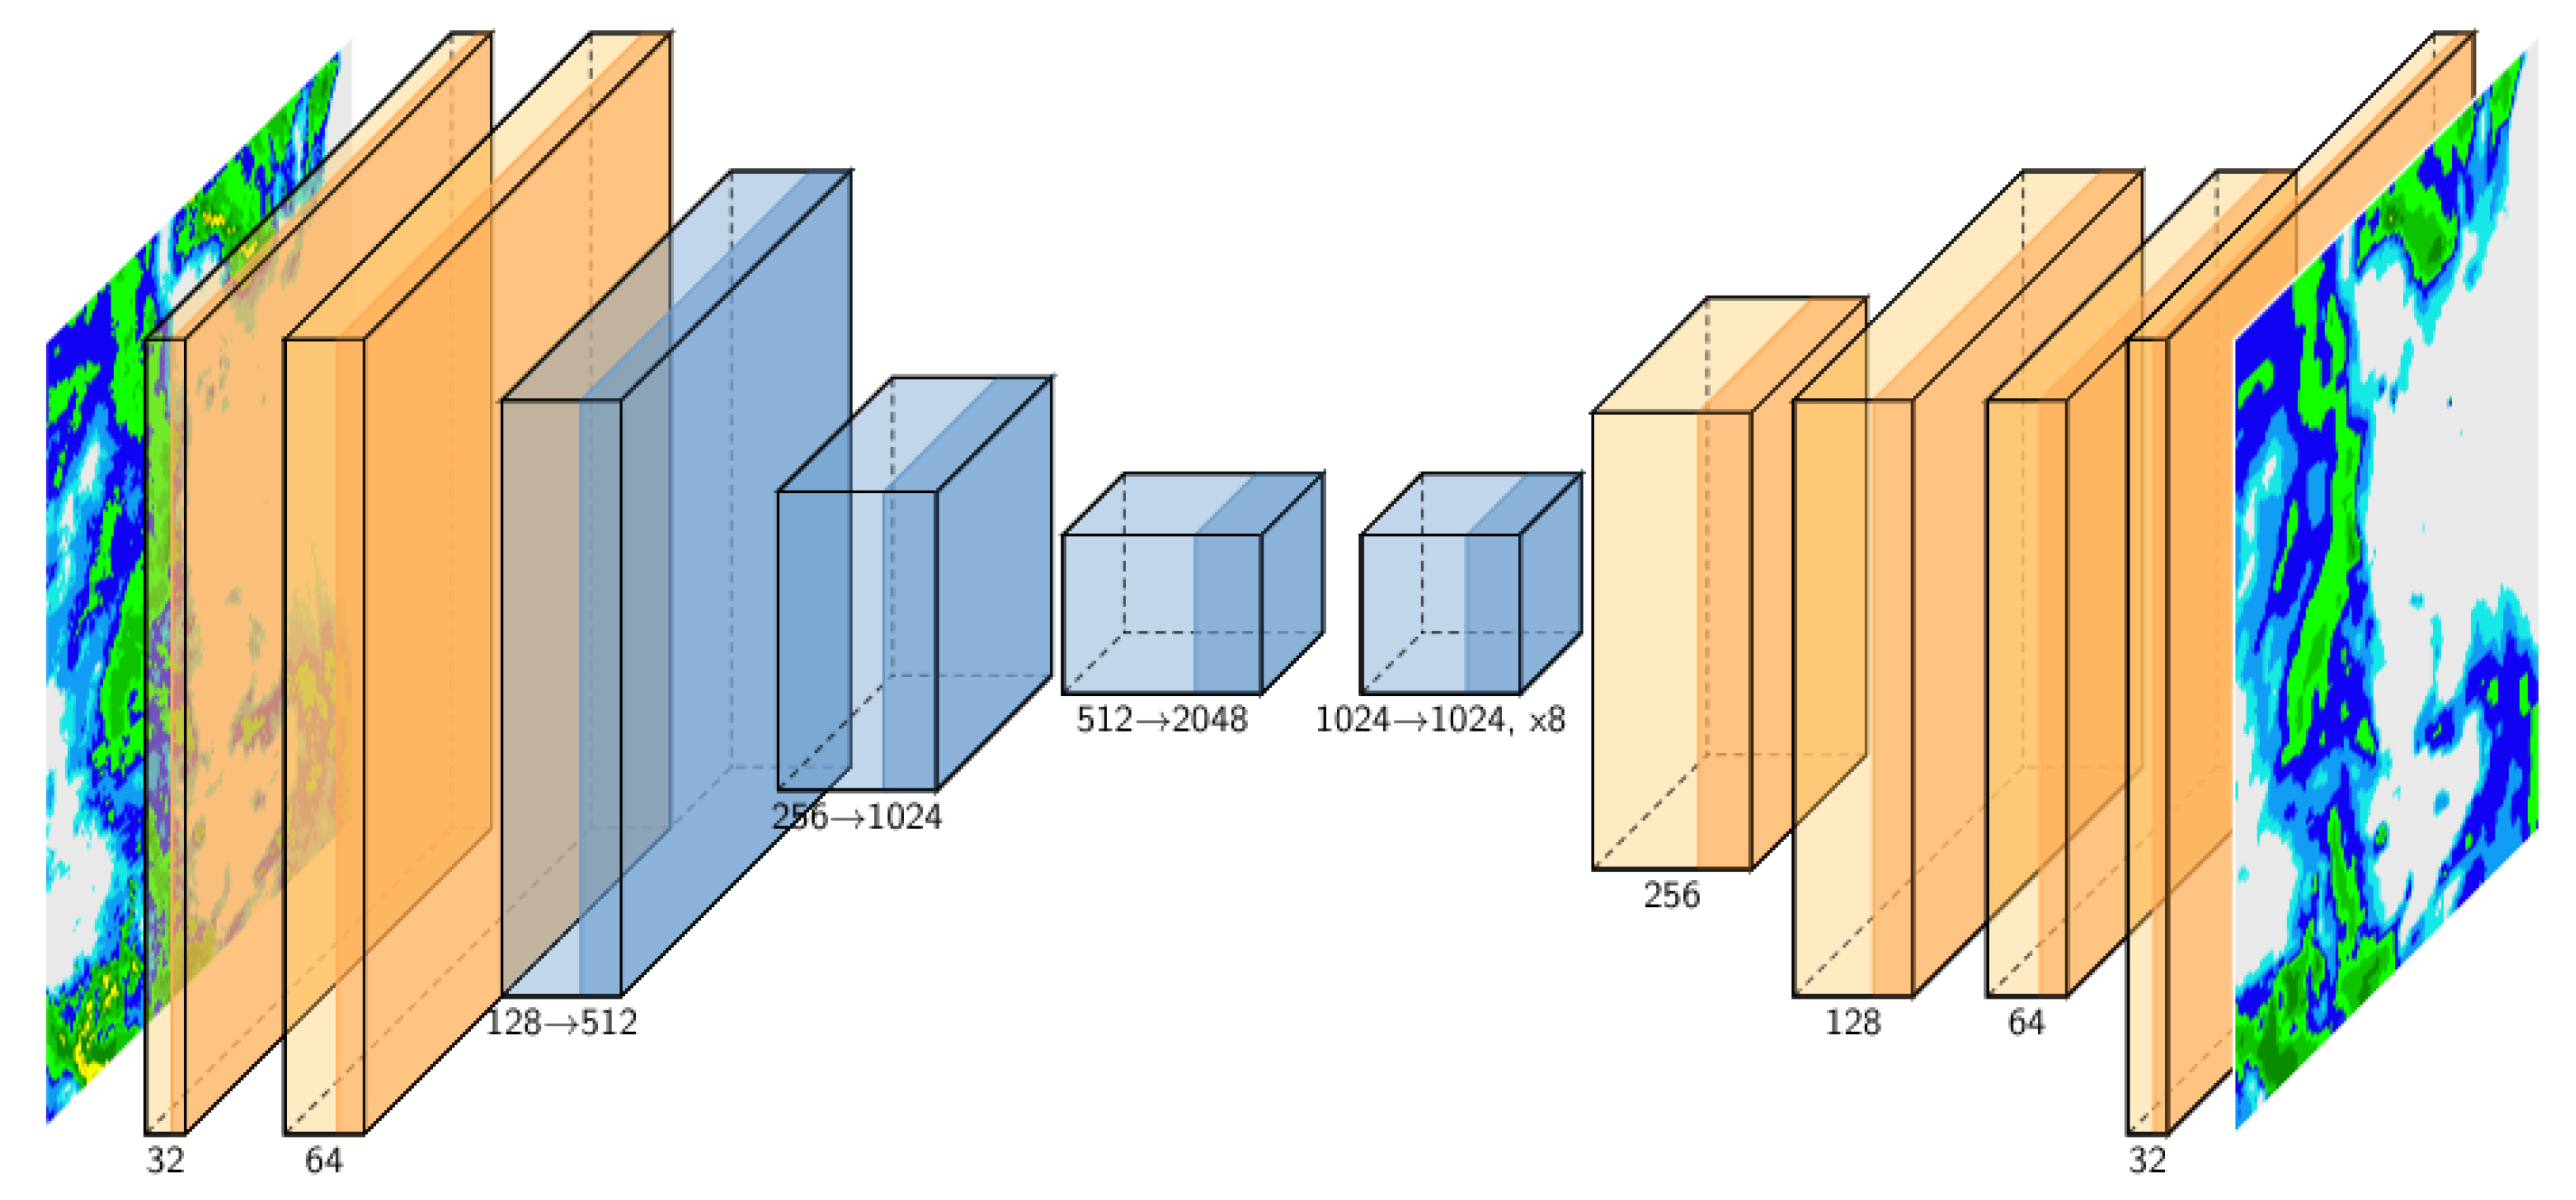
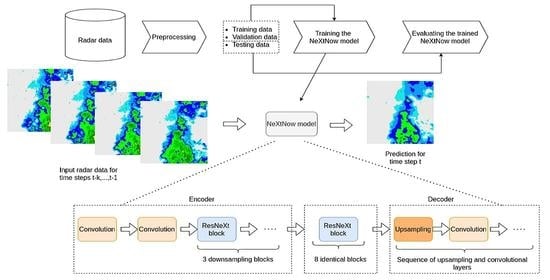
The proposed model had a fully convolutional encoder–decoder architecture, which was formed of three main components. The first component was an encoder, which was inspired by the ResNeXt architecture.
The encoder consisted of two classical convolutions, which had the role of providing multiple feature maps for the inputs, followed by three ResNeXt blocks. The blocks were constructed according to the original ResNeXt paper [
17], as presented in
Section 2.3.1. The final convolution in the block multiplied the filter size by four, while the group convolution downsampled the input image by a factor of two. Each convolution in the block was followed by a batch normalization layer and the ReLU activation function. The convolutions that were used in the encoder had a kernel size of 3 × 3.
The second component was a series of eight identical ResNeXt blocks, with 1024 filters each. In contrast to the blocks that were used in the encoder, the blocks that were included in this component did not change the resolution or number of filters of their inputs, but they did have the aim of obtaining refined representations for the feature maps that were retrieved from the encoder. Empirically, we found that the addition of these additional blocks was beneficial to the model’s overall performance.
While the first two components benefited from the use of ResNeXt blocks, we opted for a succession of simple convolutional layers for the decoder as experimenting with more complex architectural components did not lead to a better performance for the forecasting model. Therefore, in our proposed model, the decoder consisted of a series of upsampling layers, followed by convolutions. Following a standard approach to designing architectures for image-to-image tasks, the number of filters was progressively increased in the encoder and decreased in the decoder.
A schematic representation of the
architecture is shown in
Figure 3.
The proposed architecture represented a new purely convolutional approach to weather nowcasting. The main advantage of our model was the simplicity and flexibility of the architecture, which allowed it to be easily adapted for other spatiotemporal prediction tasks with few hyperparameters that needed to be tuned. A limitation of our approach was that it did not incorporate a recurrent component for modeling the time dimension, relying instead on a simple concatenation operation for the time steps. Our model could be extended, however, by including modules from our architecture in recurrent architectures as feature extractors.
The datasets for both case studies (NMA and MET) were split into train, validation and testing subsets from the total number of days that were available (i.e., 20 days for the NMA dataset and 65 days for the MET dataset): 80% for training, 10% for model validation and the remaining of 10% for testing. From each subset (training/validation/testing), the complete days (with no missing time steps) were used.
2.3.4. Performance Evaluation and Testing Methodology
As shown in
Section 2.3.3, after the
NeXtNow model was trained, it was evaluated using 10% of the instances from the datasets
, which were unseen during the training stage.
Various performance metrics were computed to assess the performance of NeXtNow using a testing subset. The experiments were repeated three times using three different training–validation–testing splits and the values for each of the performance metrics were averaged over the three runs.
Depending on the type of the input data that was used in the forecasting problem, there were three types of verification methods that were used for the performance evaluation: categorical, continuous (real values) or probabilistic approaches. Our experiments used the continuous approach since we modeled the problem as a regression task and used continuous input data that were mapped onto a continuous output.
The first set of evaluation metrics that we considered used the continuous ground truth data and the continuous forecasts that were made by the
NeXtNow model. Given a testing dataset with
n ground truth data samples in which each sample was an image containing
m points, we denoted the ground truth (observation) value for the
i-th point in the
t-th testing instance by
and the prediction (forecast) value for the
i-th point in the
t-th testing instance by
. The following evaluation metrics that have been used in the regression literature were computed for each testing sample [
39]:
The values that were obtained for all of the testing samples were averaged in order to obtain the final evaluation metrics for the testing subset: , , and .
For a thorough assessment of NeXtNow’s performance, we discretized its continuous output by applying a threshold in order to evaluate the performance of our model using additional evaluation metrics. For meteorologists, the classes of the values of the radar products are particularly relevant, for example, for stratiform and convective rainfall classification. By applying a threshold to the continuous output values that were provided by NeXtNow, the set of evaluation metrics was enlarged with the performance metrics that were used for binary classification: values that were higher than could be considered as belonging to the positive class, while values that were lower than belonged to the negative class.
For the testing dataset, after computing the confusion matrix that corresponded to the binary classification task (, number of true positives; , number of false positives; , number of true negatives; , number of false negatives), the evaluation metrics that are described below were calculated:
Critical success index (), which was obtained as ;
False alarm rate (), which was computed as ;
Probability of detection (), which represented the recall of the classifier and was computed as ;
Bias (), which was used for categorical forecasts and was equal to the total number of events that were positively predicted divided by the total number of actual positive events, i.e., .
We note that the , , and metrics have been widely used for performance assessment in the forecasting literature. , and ranged between [0, 1], while the domain of was [0, ∞). Higher values of and and lower values were expected for better predictions, while values of closer to 1 were expected for better forecasting models.
