
Performance Evaluation of Six Gridded Precipitation Products throughout Iran Using Ground Observations over the Last Two Decades (2000–2020)


Abstract
:1. Introduction
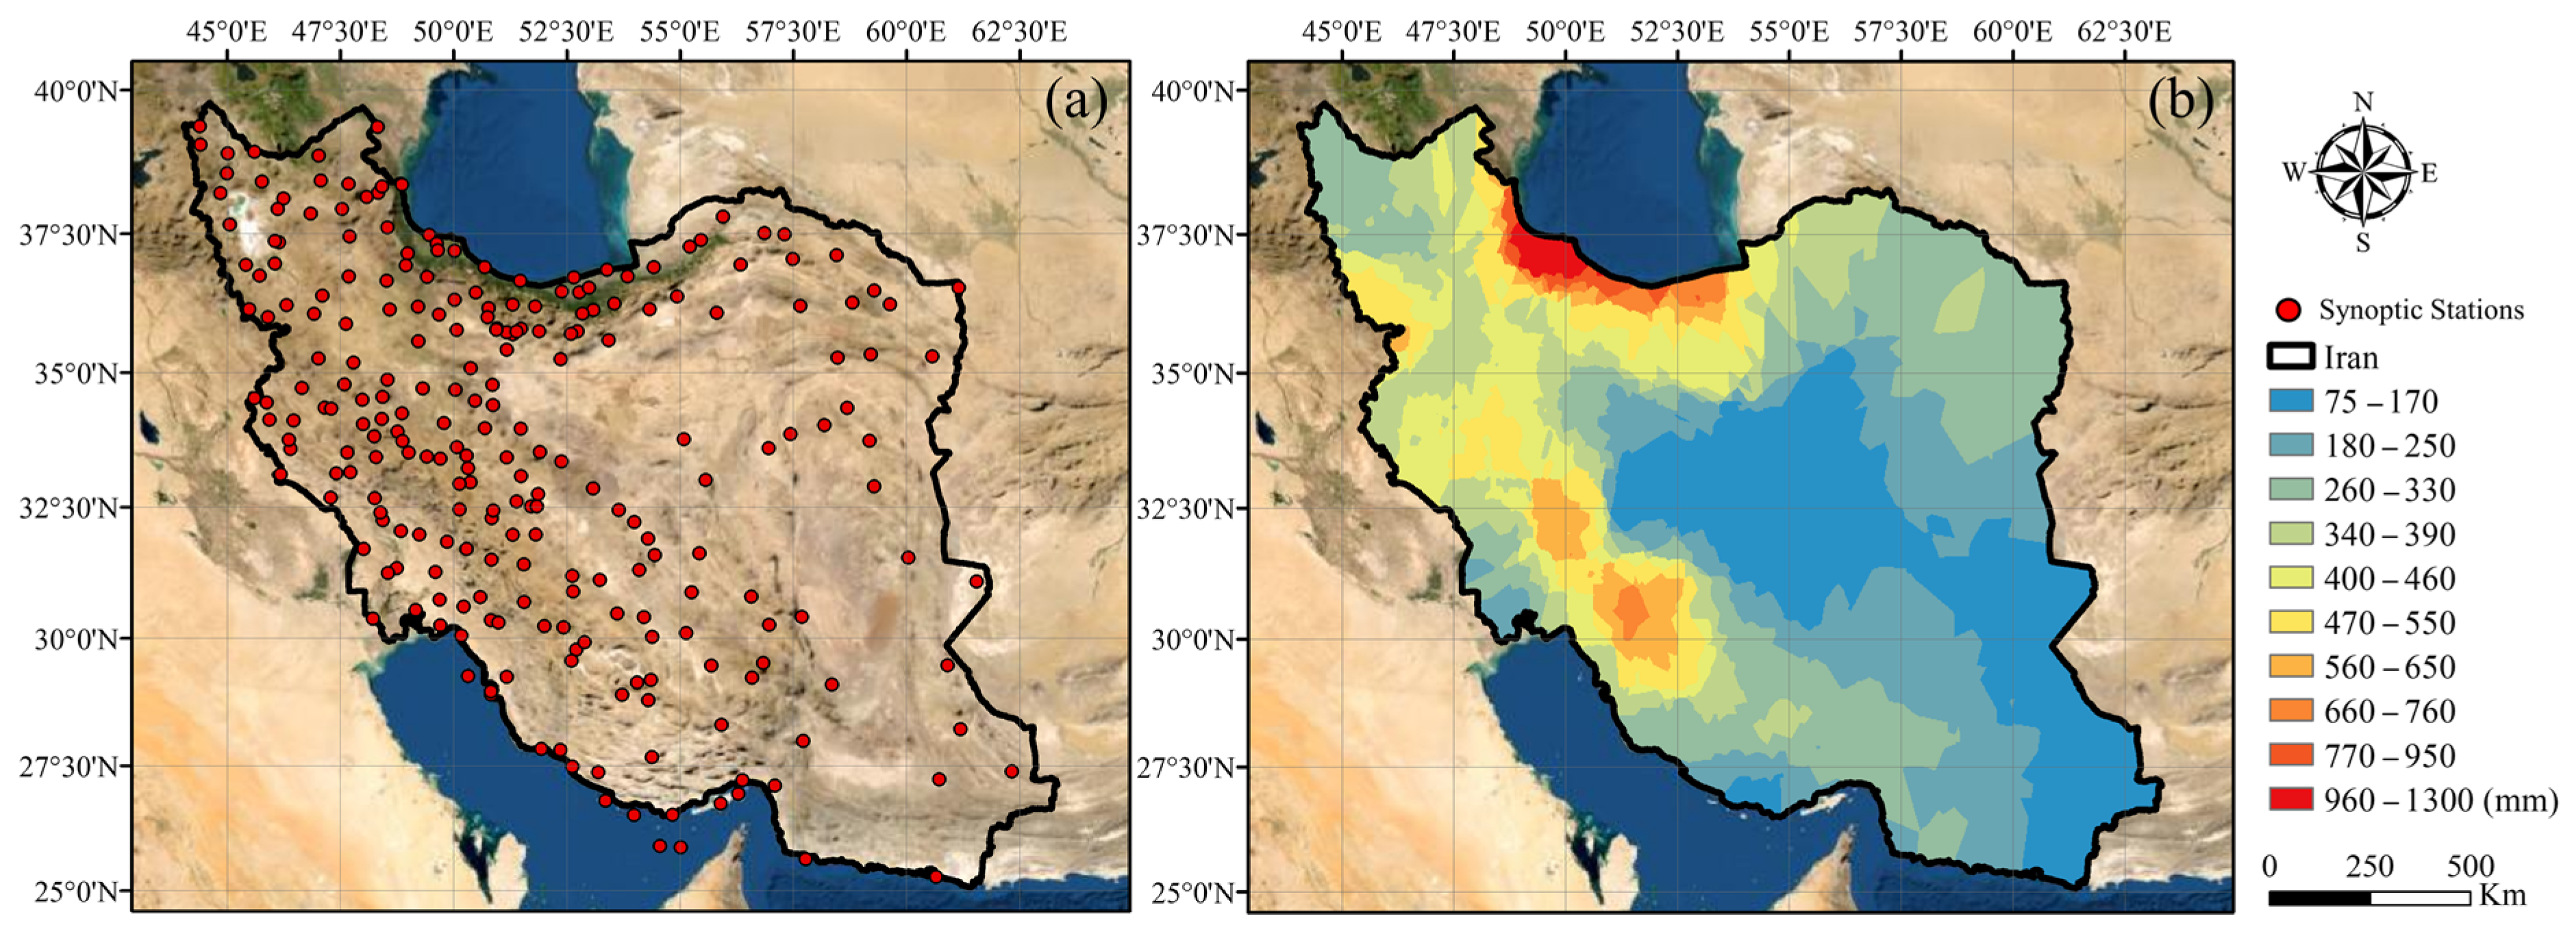
2. Study Area
3. Datasets
3.1. Gridded Precipitation Products (GPPs)
3.1.1. Tropical Rainfall-Measuring Mission Multi-Satellite Precipitation Analysis (TMPA)
3.1.2. Climate Hazard Group Infrared Precipitation with Stations (CHIRPS)
3.1.3. Precipitation Estimation from Remotely-Sensed Information Using Artificial Neural Networks (PERSIANN)
3.1.4. Global Satellite Mapping of Precipitation (GSMaP)
3.1.5. Integrated Multi-Satellite Retrieval for GPM (IMERG)
3.1.6. Fifth Generation of ECMWF Reanalysis Precipitation Products (ERA5)
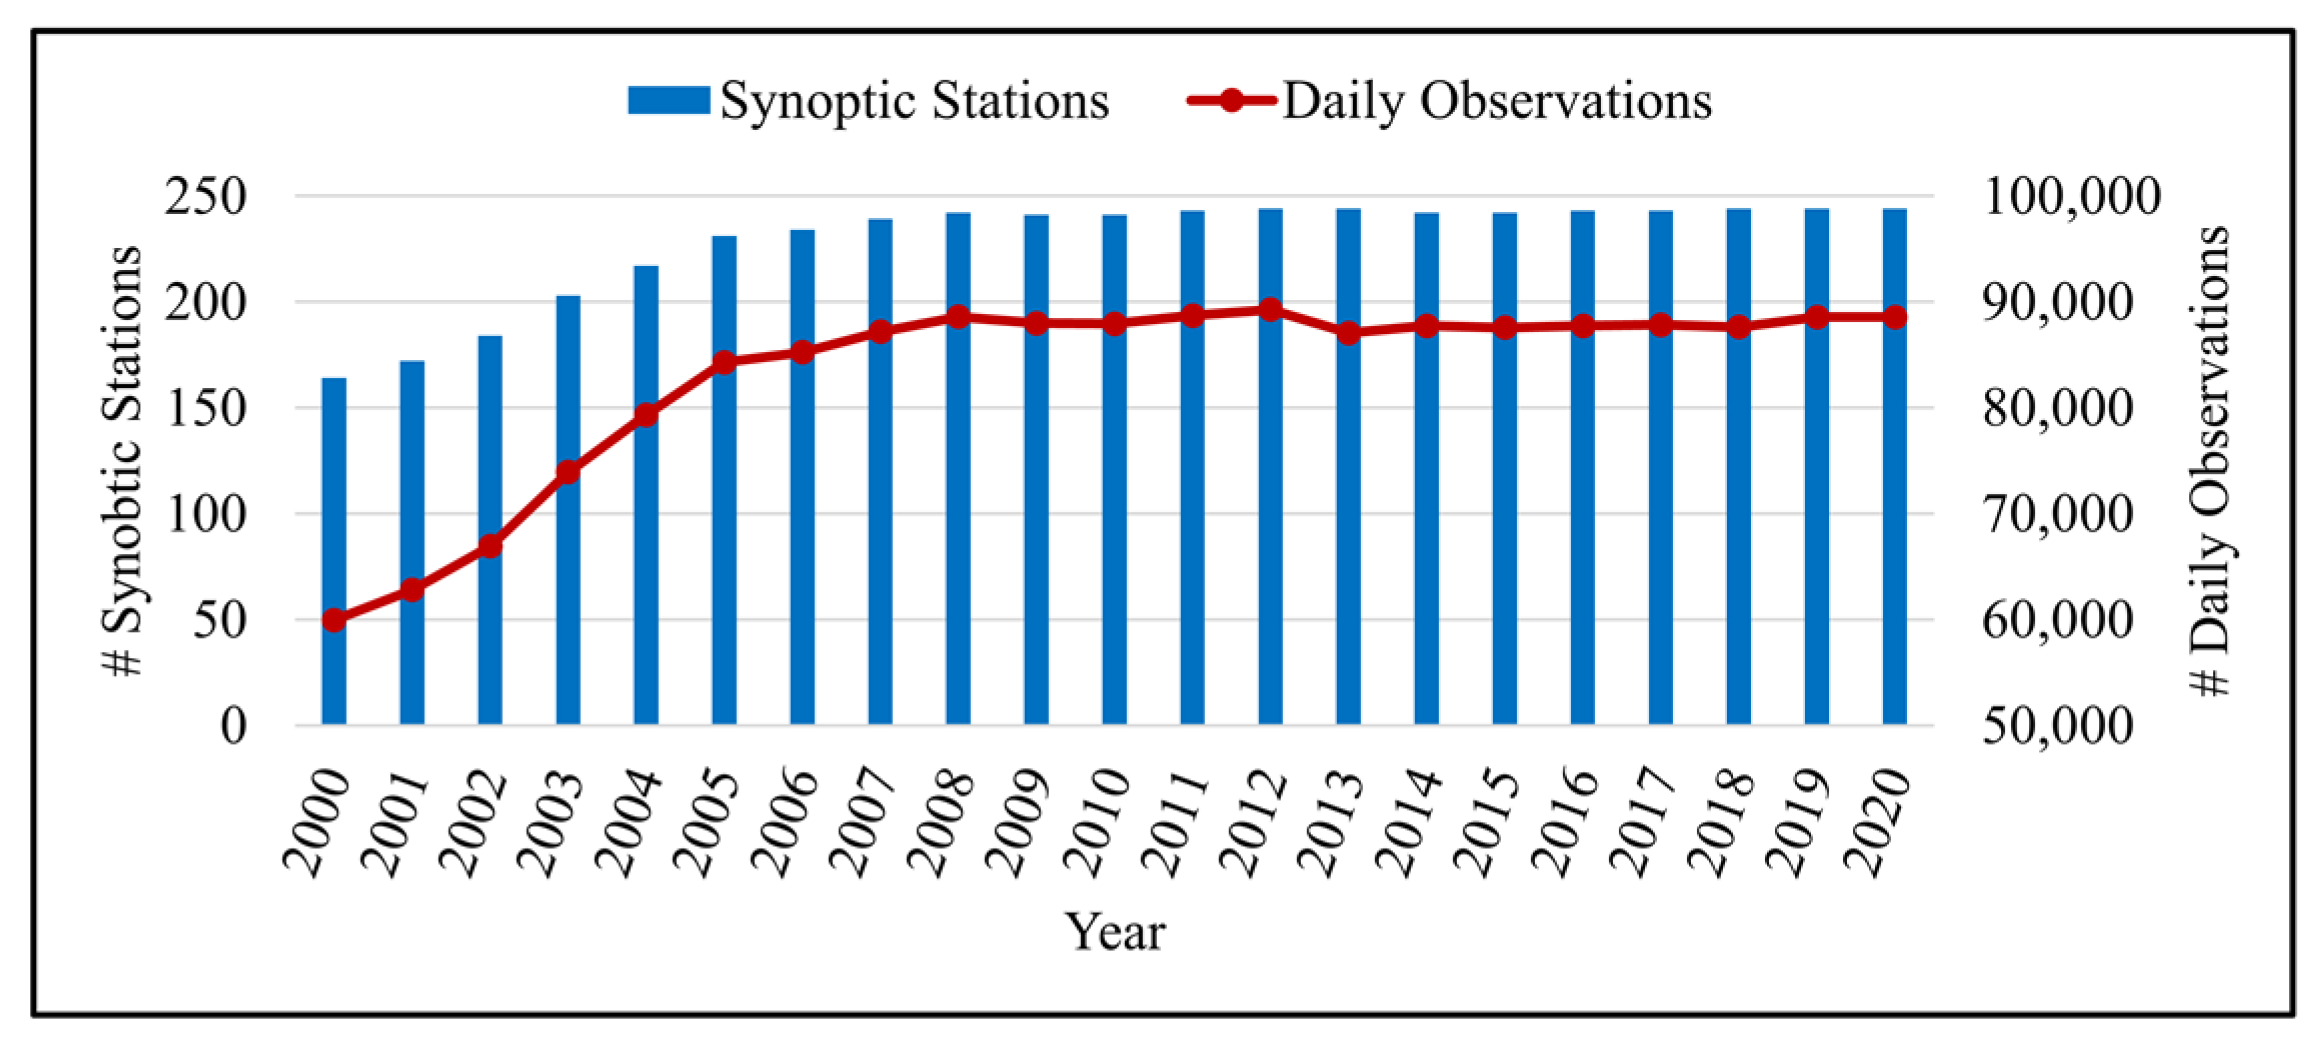
3.2. Synoptic Stations
4. Evaluation Methods
5. Results
5.1. Evaluation Using Daily Observations from 2000 to 2020
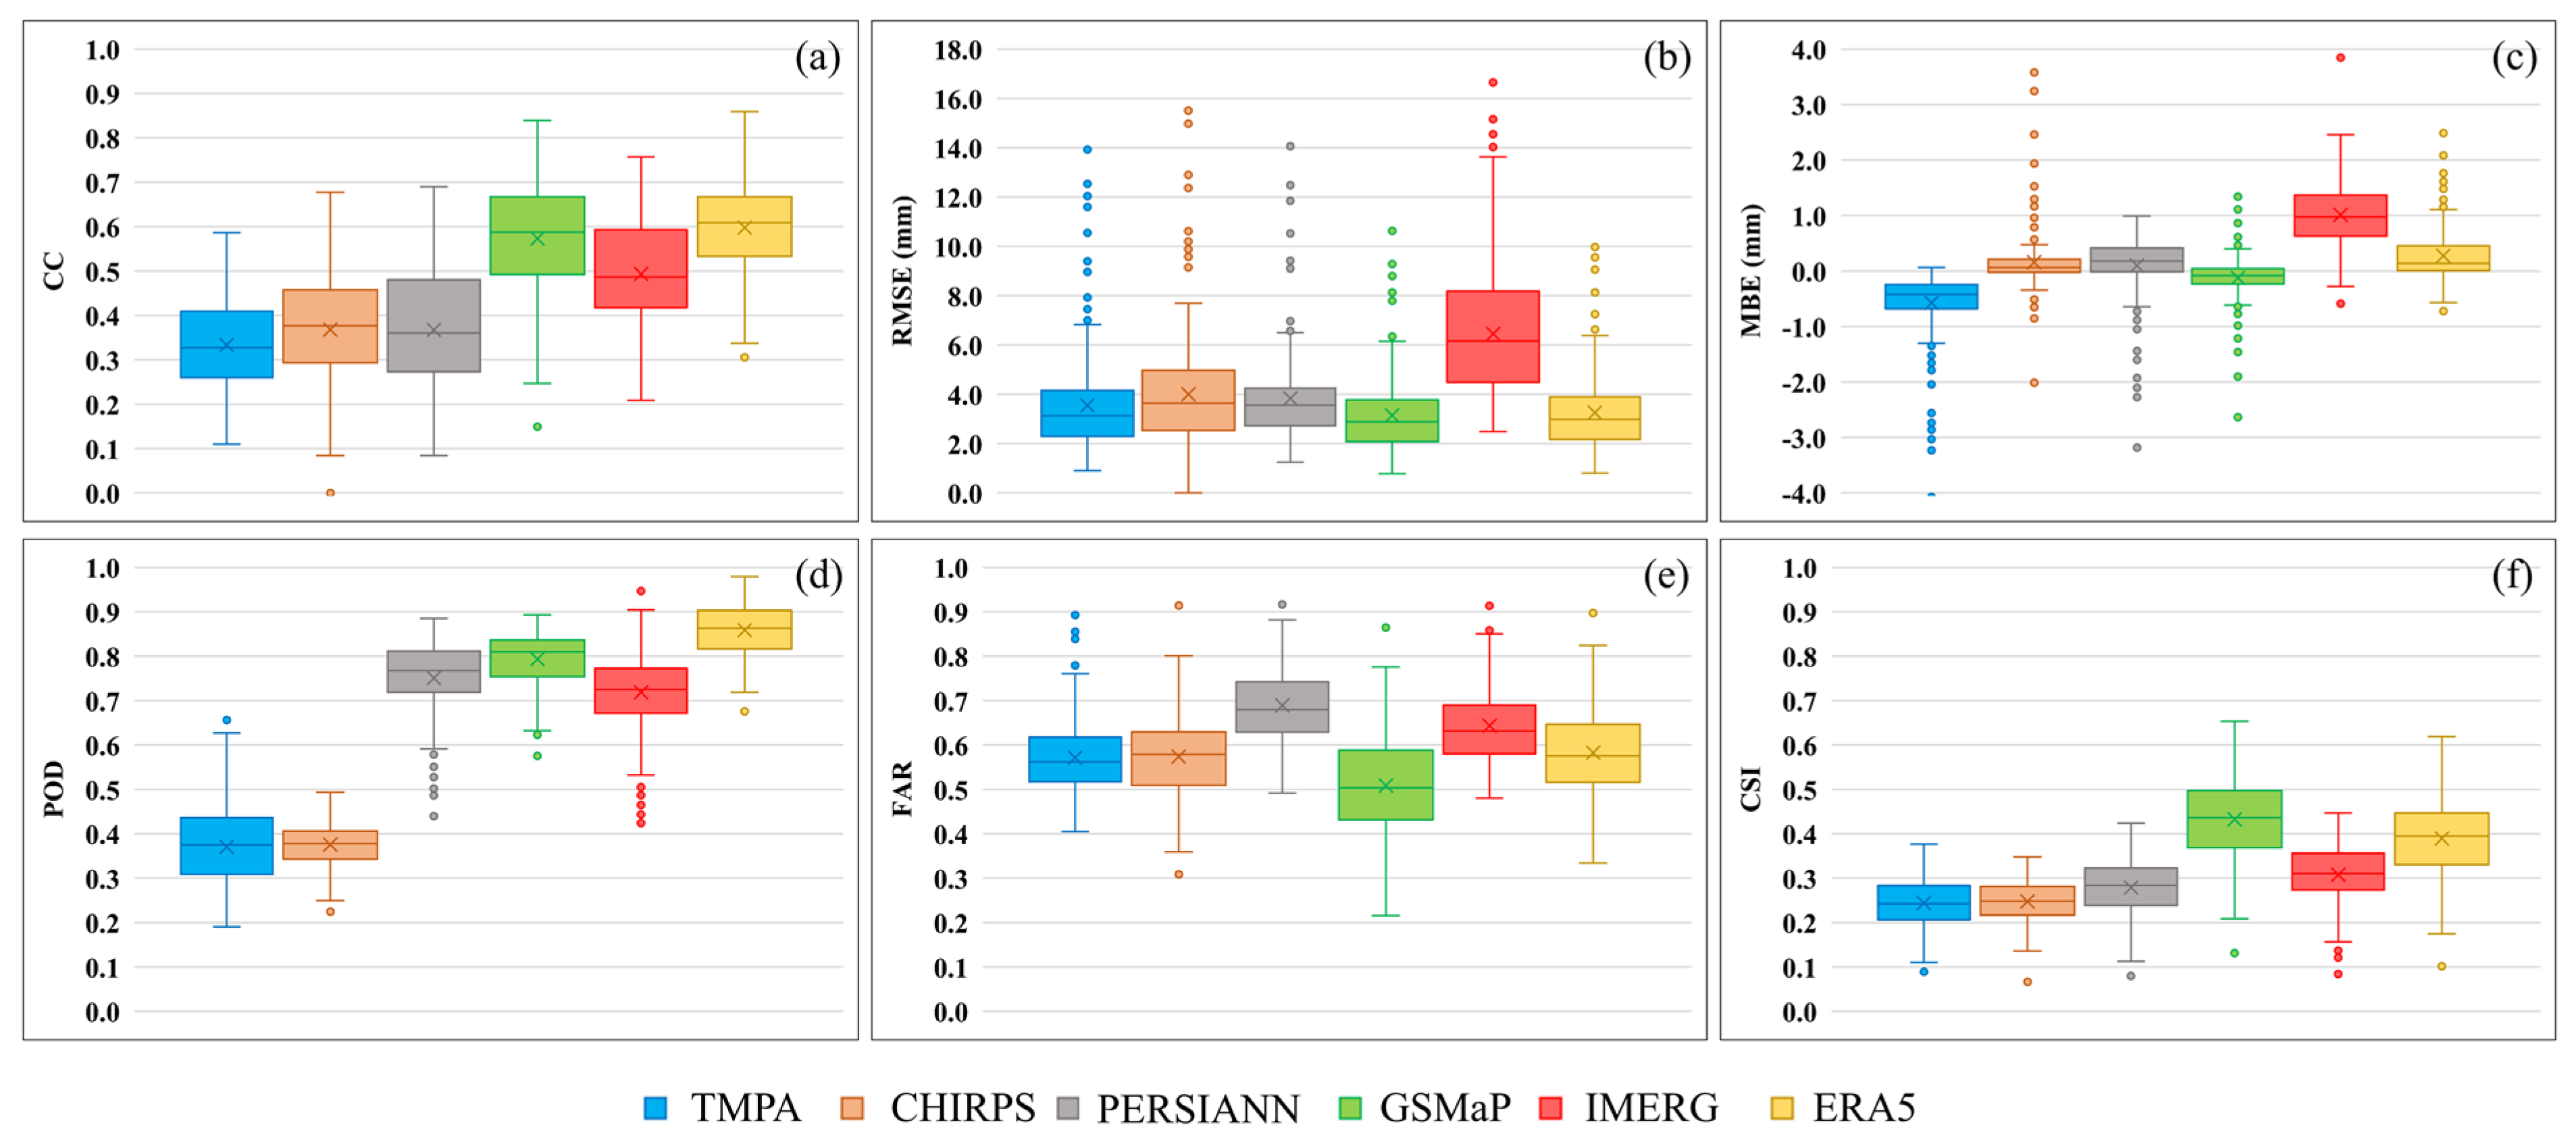
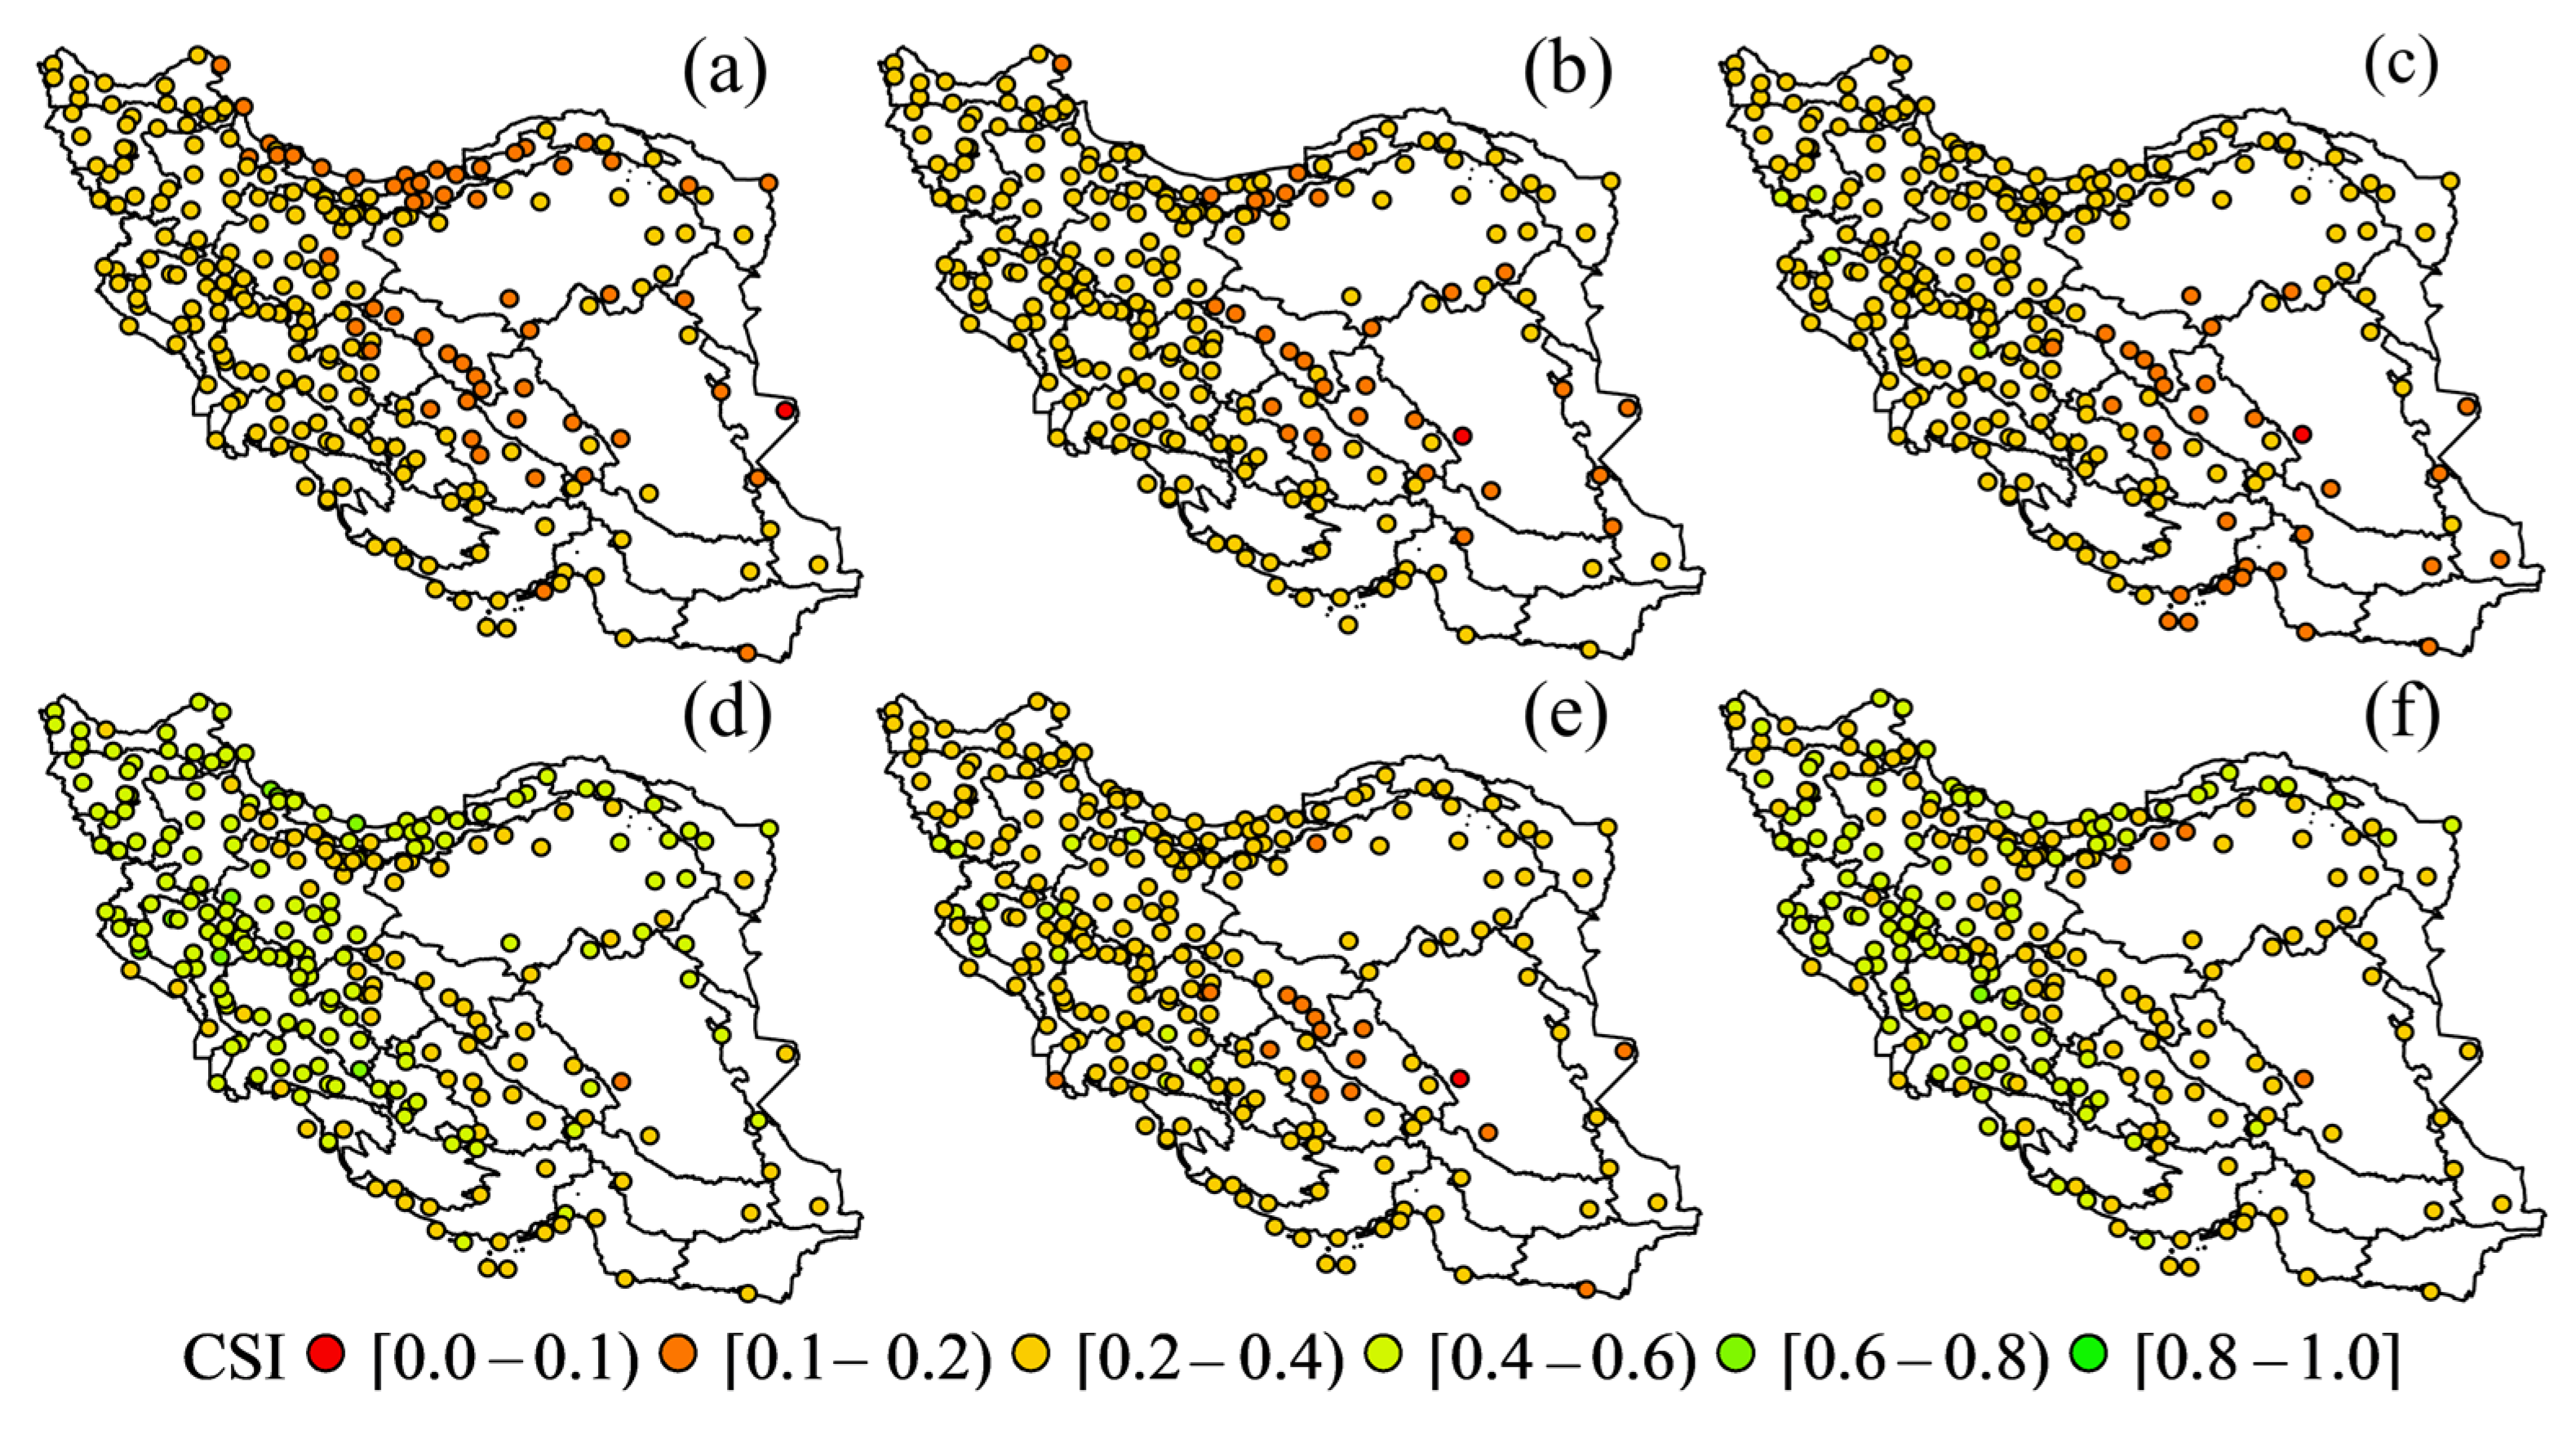
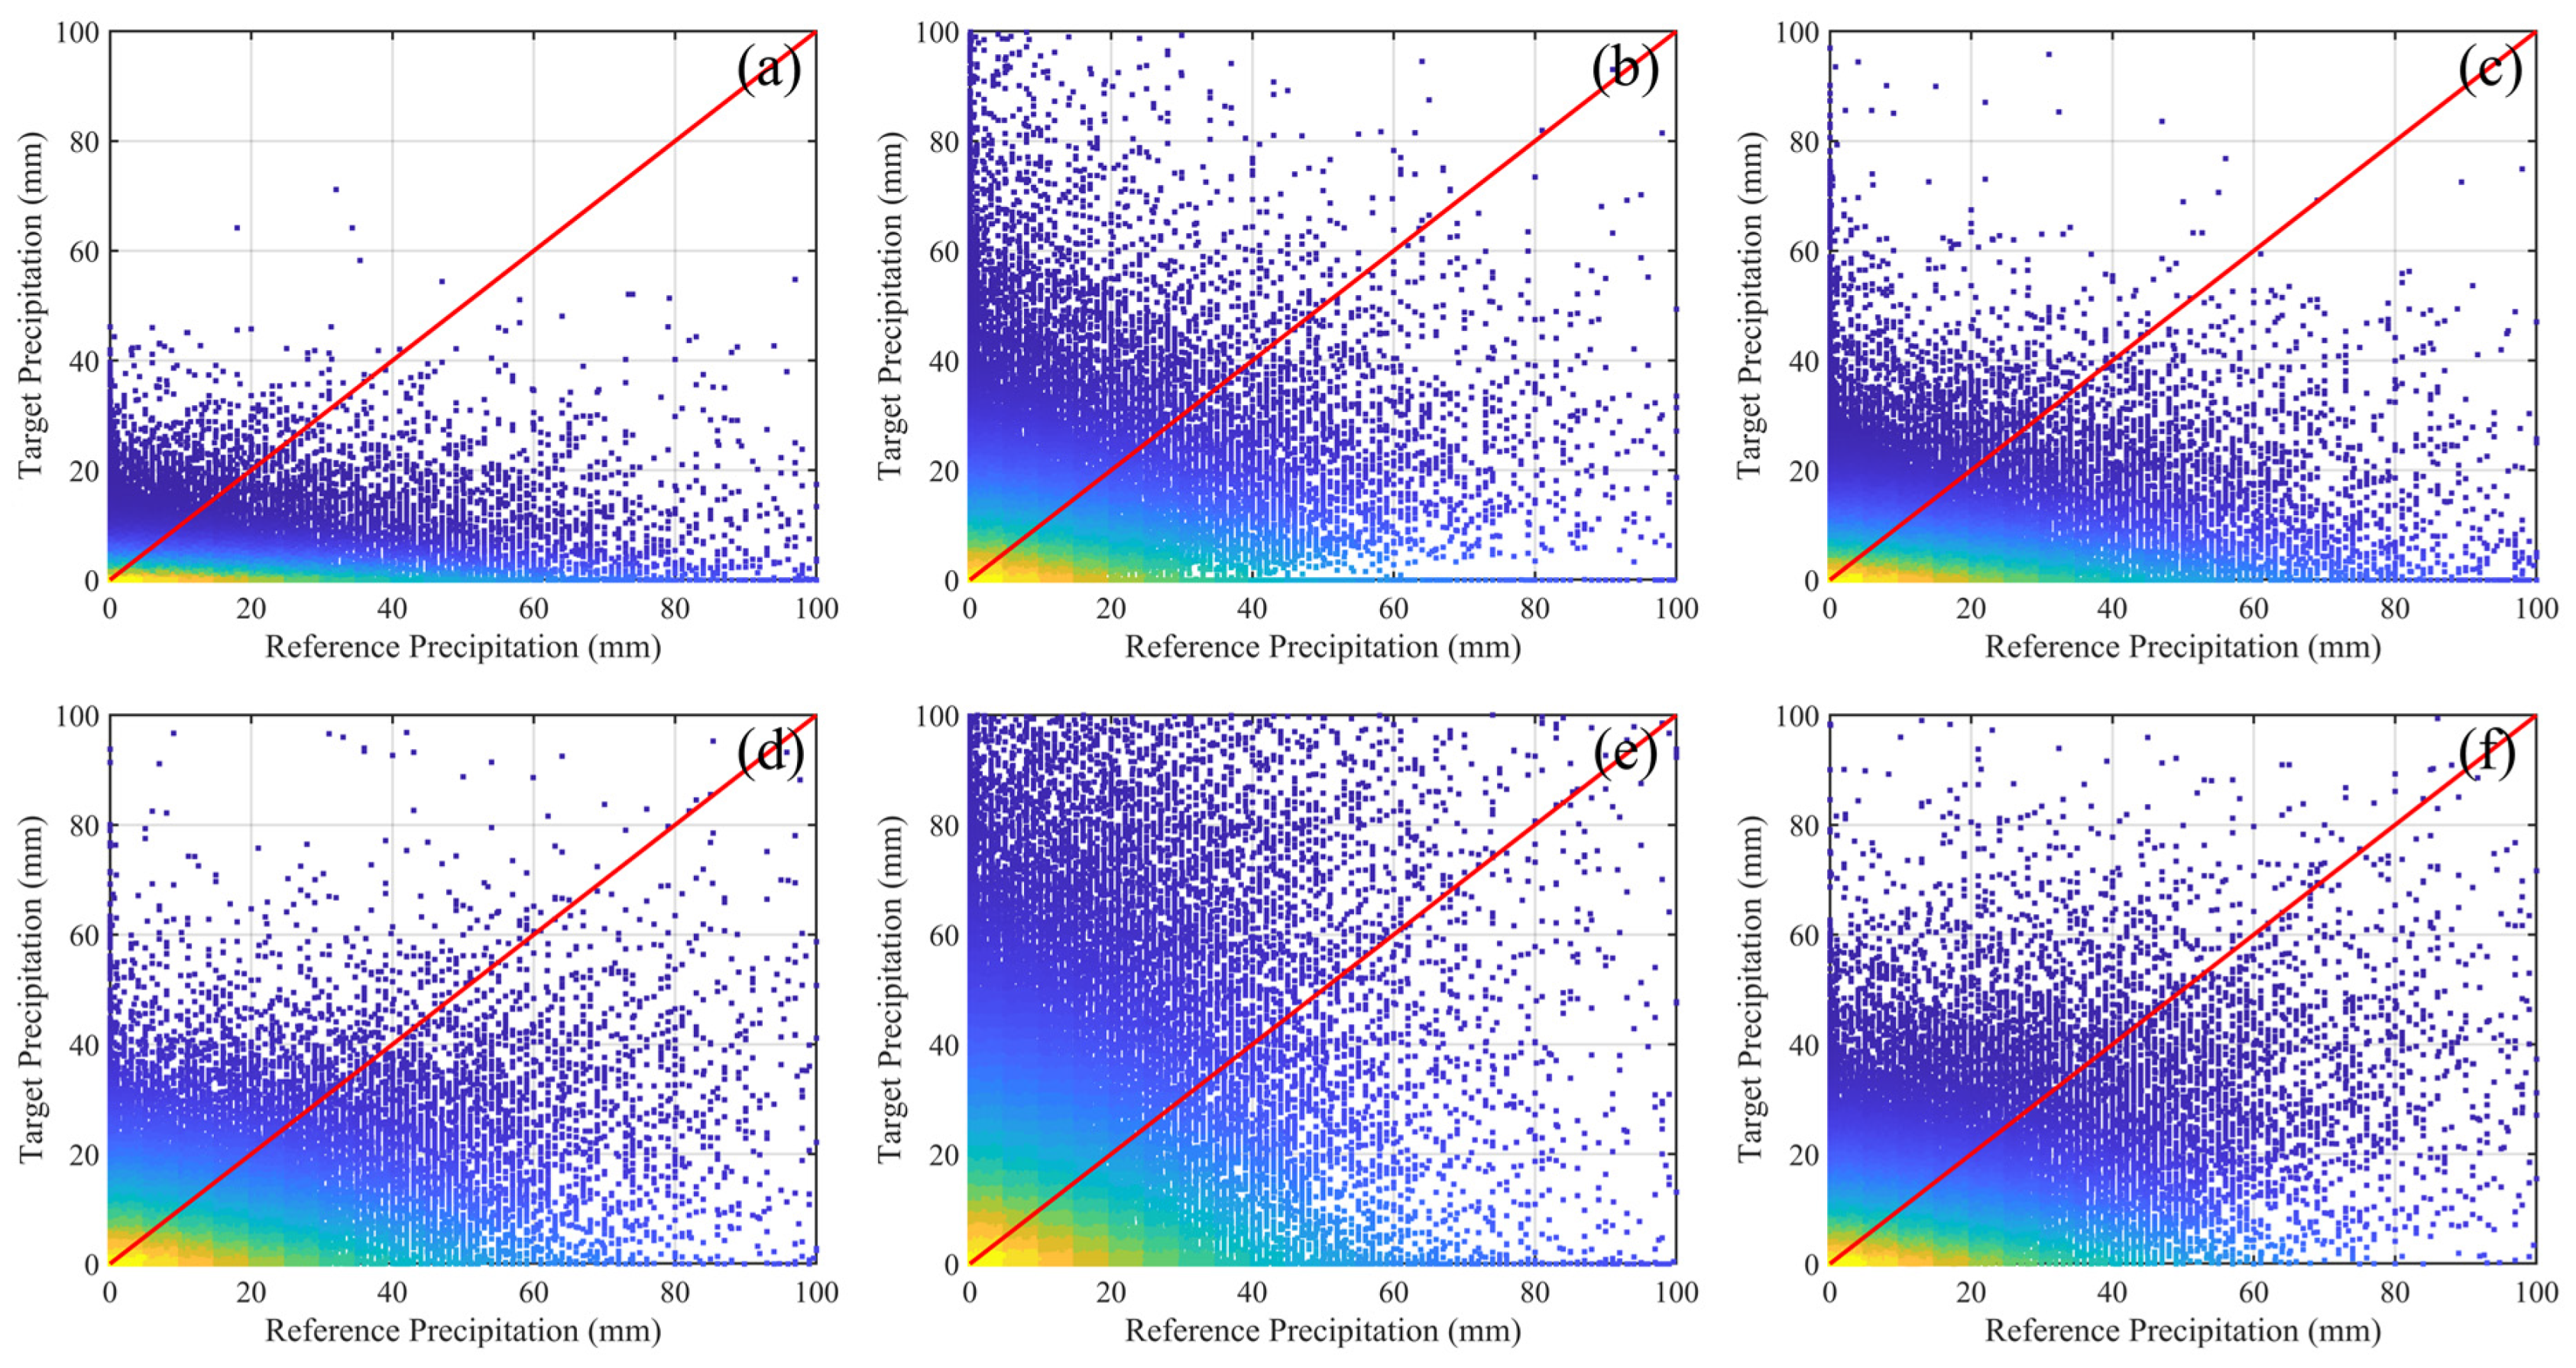
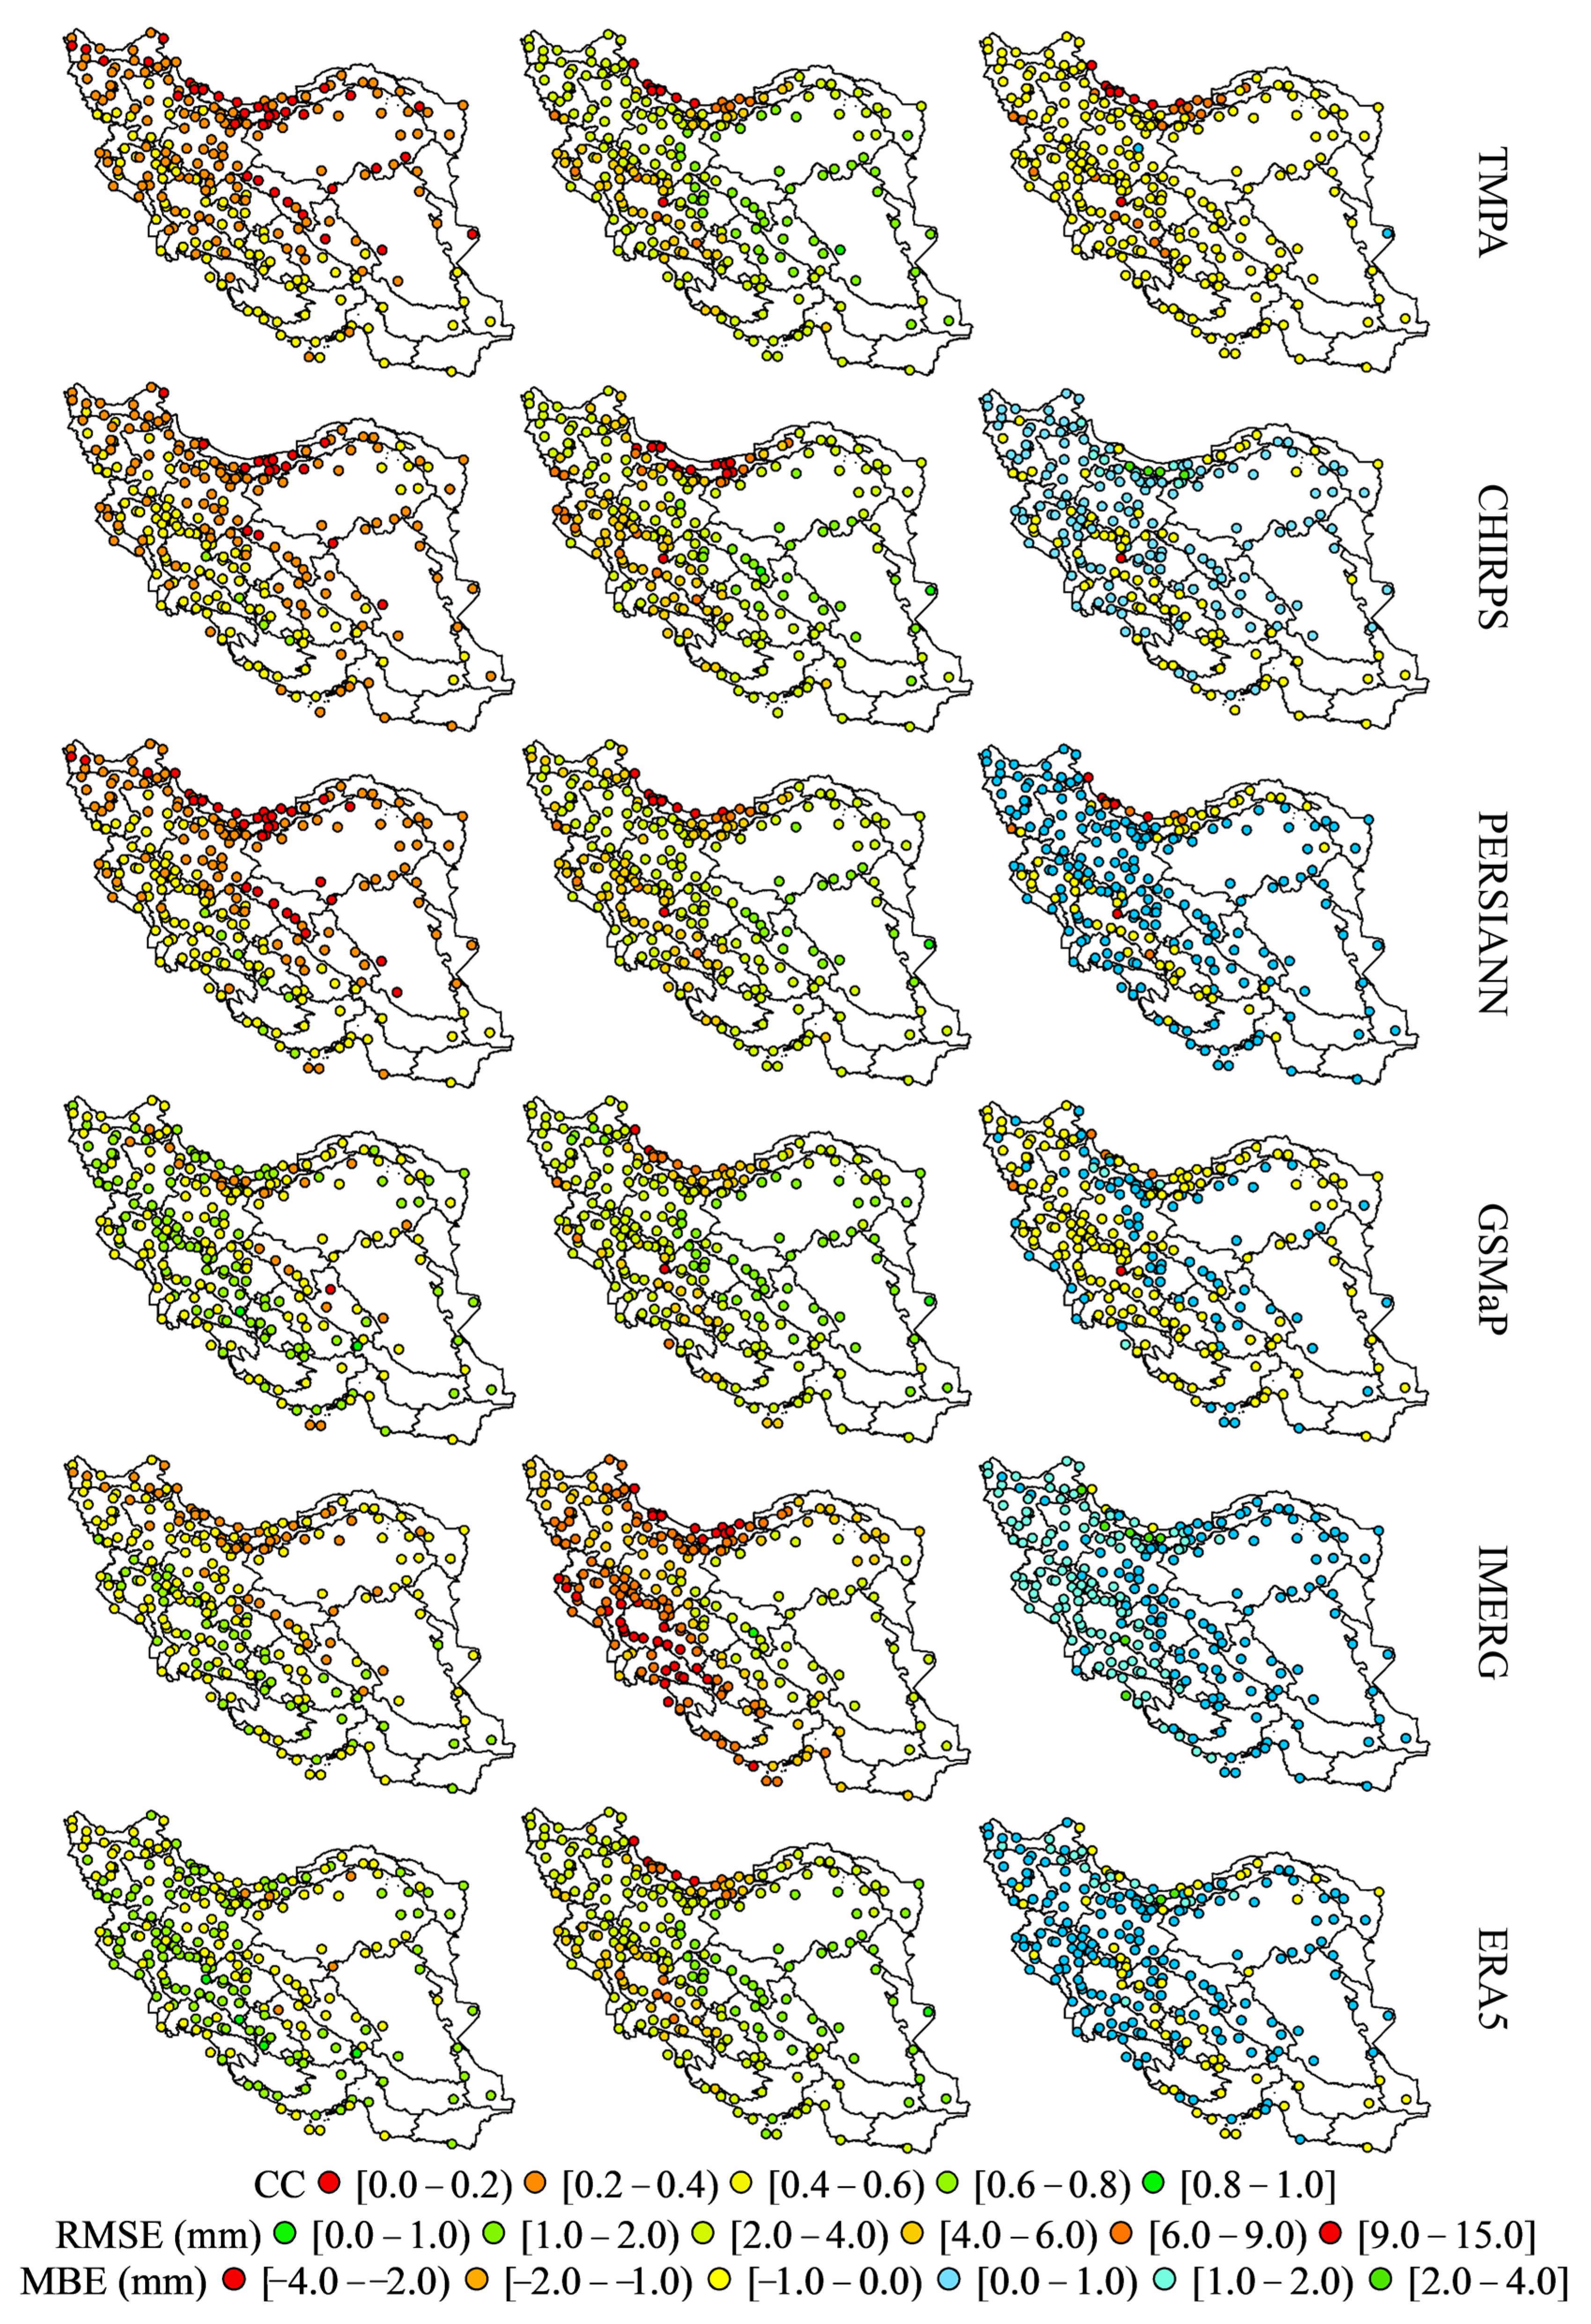
5.1.1. Daily Time Scale
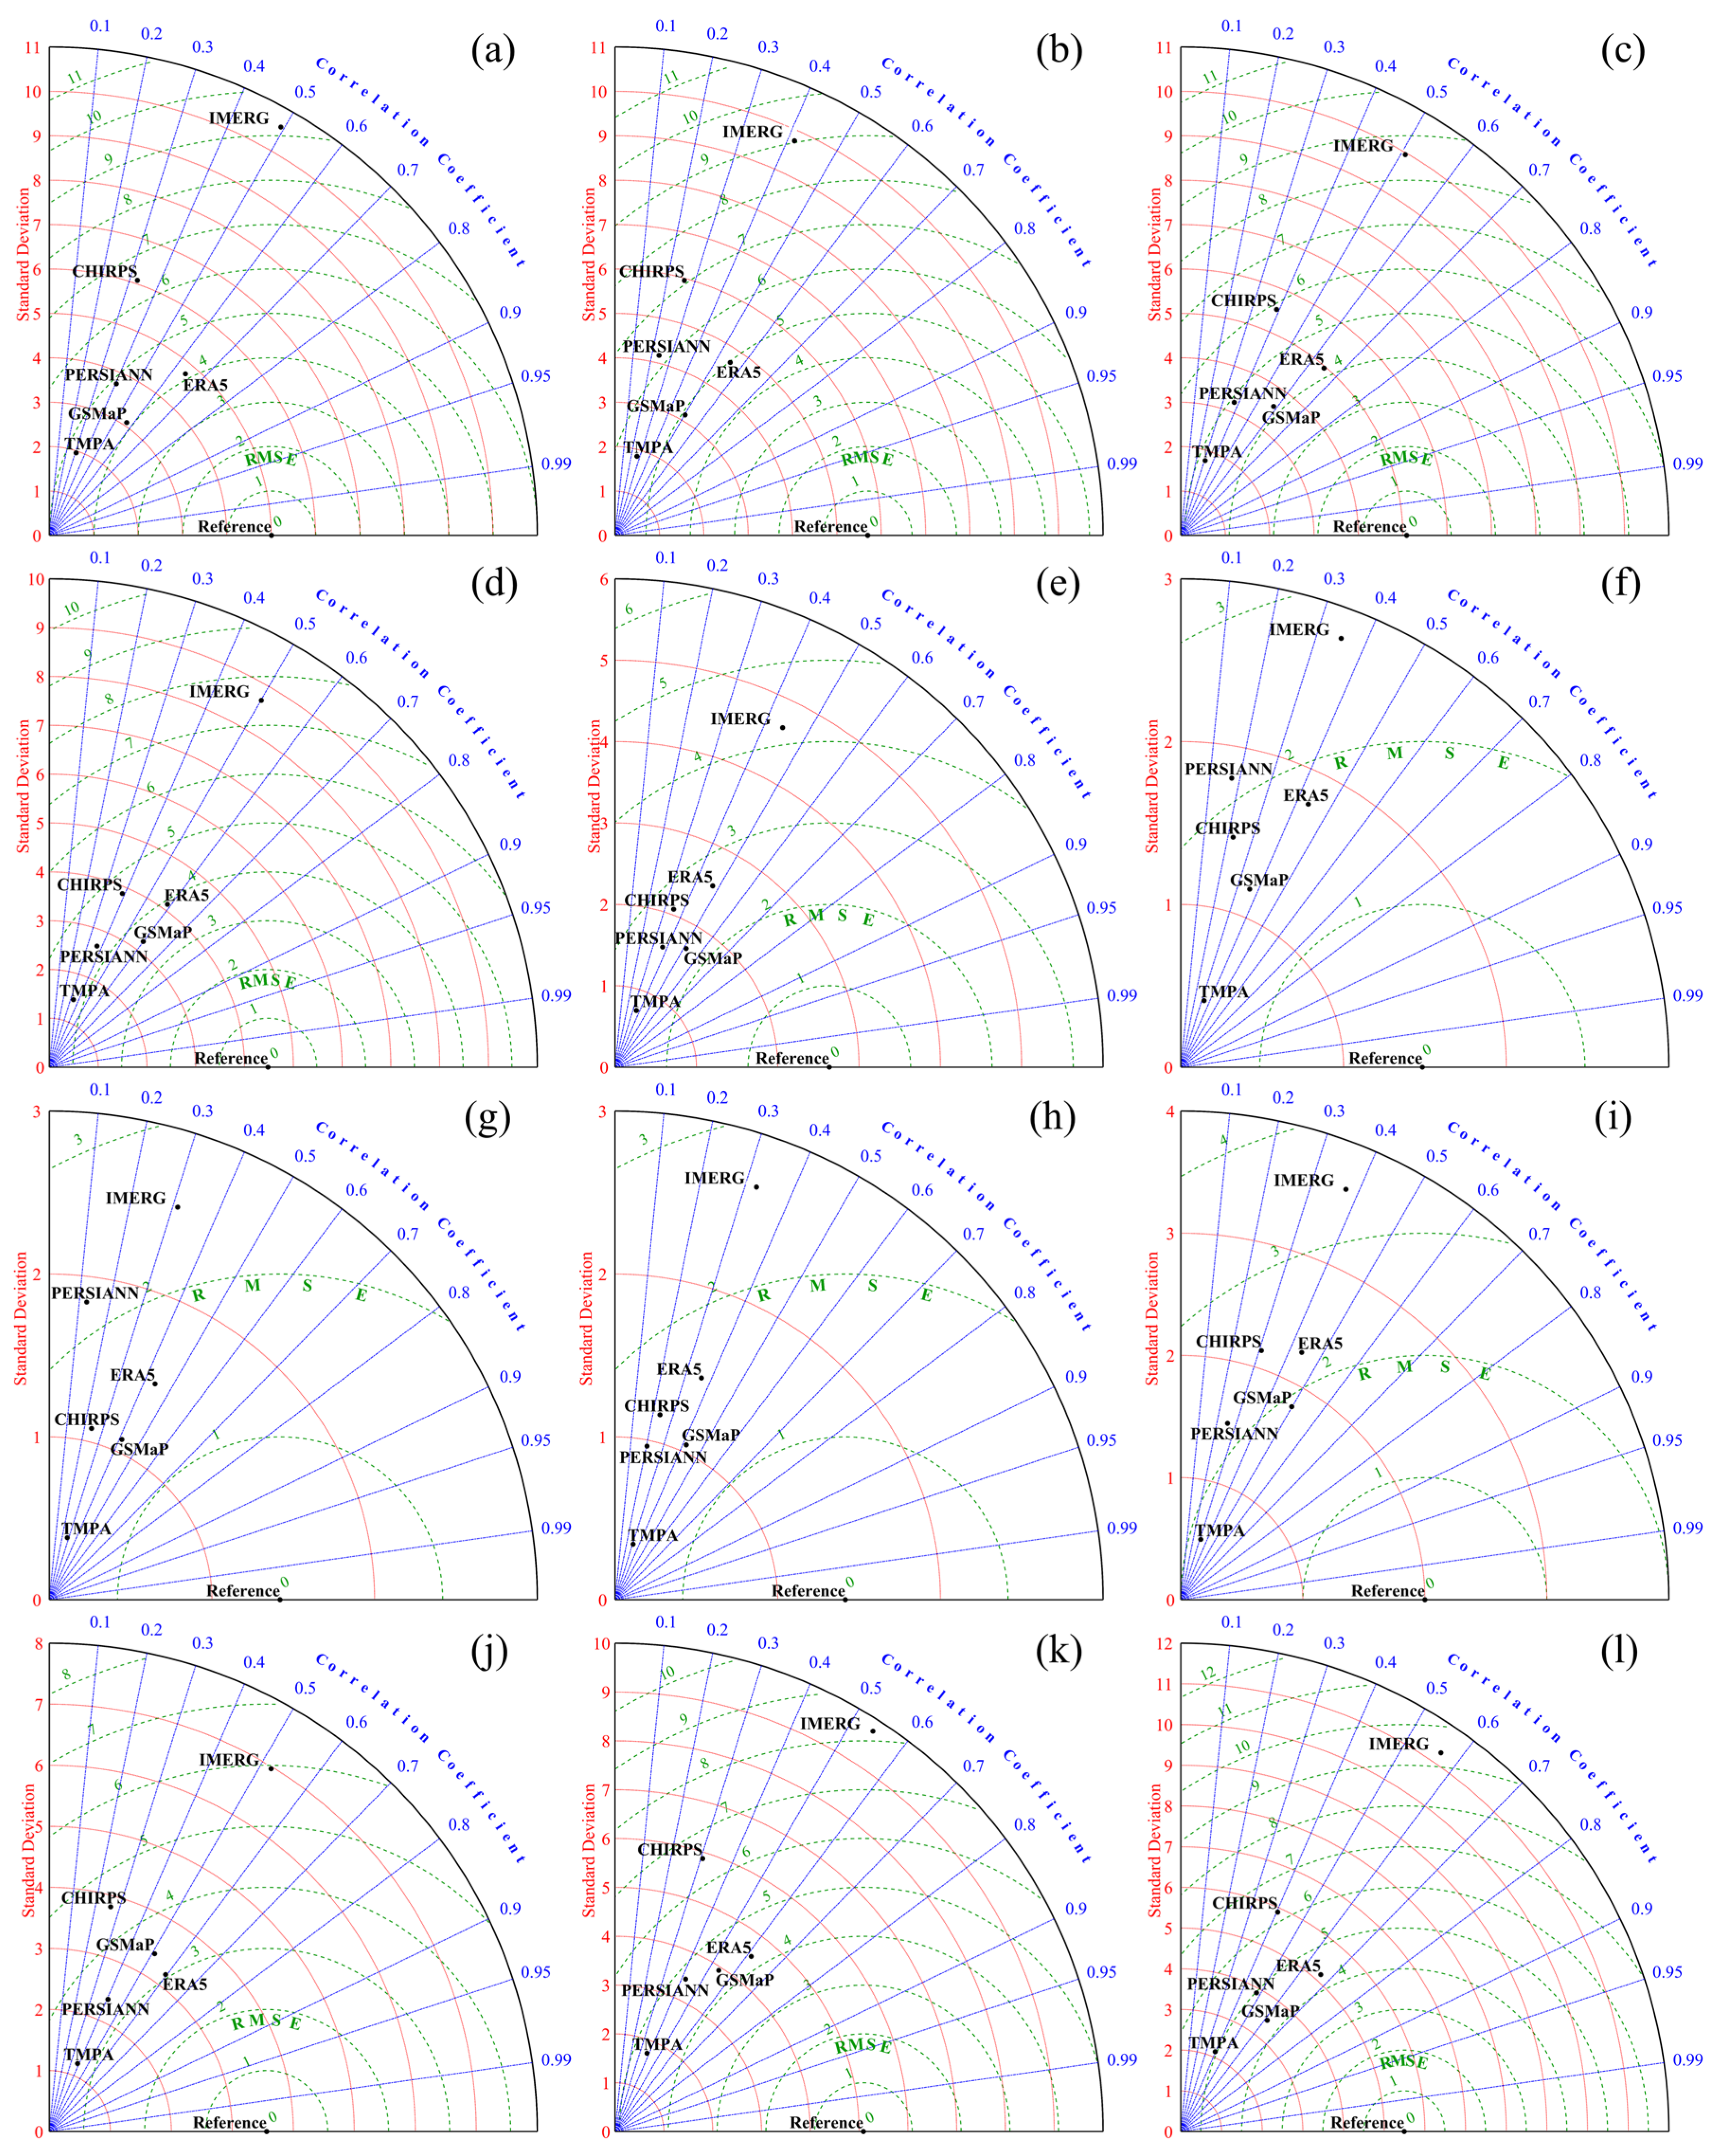
5.1.2. Monthly Time Scale
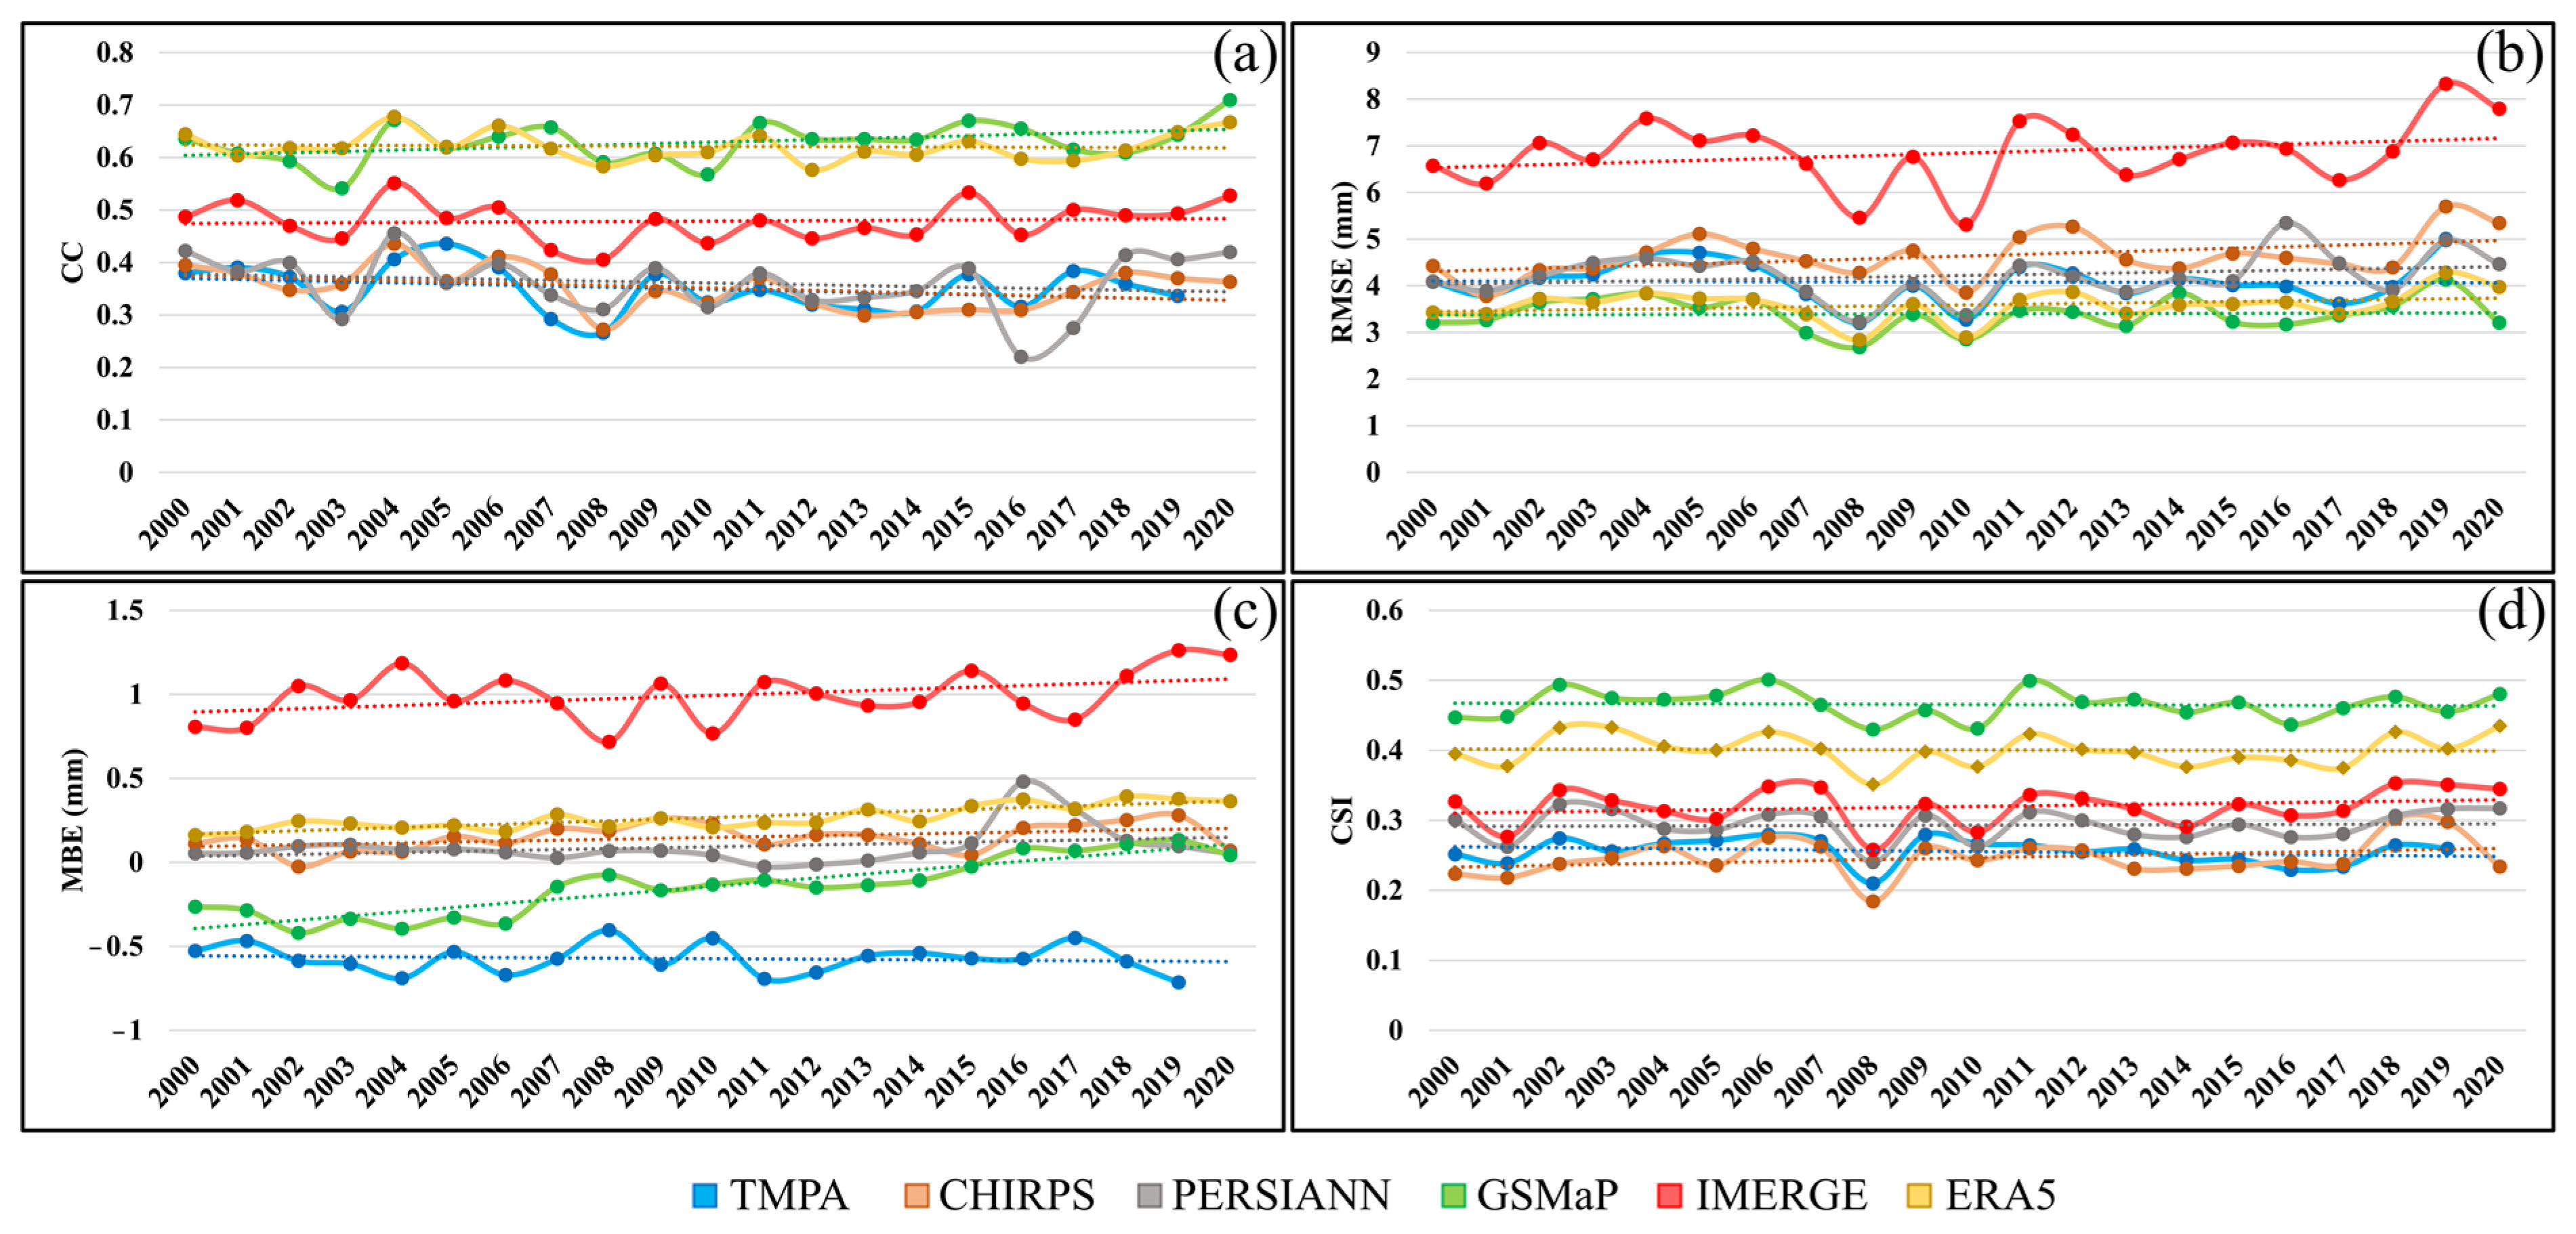
5.1.3. Yearly Time Scale
5.2. Evaluation Using Monthly Observations from 2000 to 2020
5.3. Evaluation Using Yearly Observations from 2000 to 2020
6. Discussion
6.1. General Remarks
6.2. Discussing and Comparing the Results
6.3. Sources of Uncertainties
6.4. Criteria beyond Accuracy
6.5. Current State and Future Perspectives
7. Conclusions
Author Contributions
Funding
Data Availability Statement
Acknowledgments
Conflicts of Interest
References
- Kidd, C.; Huffman, G. Global Precipitation Measurement. Meteorol. Appl. 2011, 18, 334–353. [Google Scholar] [CrossRef]
- Alazzy, A.A.; Lü, H.; Chen, R.; Ali, A.B.; Zhu, Y.; Su, J. Evaluation of Satellite Precipitation Products and Their Potential Influence on Hydrological Modeling over the Ganzi River Basin of the Tibetan Plateau. Adv. Meteorol. 2017, 2017, 3695285. [Google Scholar] [CrossRef] [Green Version]
- Try, S.; Tanaka, S.; Tanaka, K.; Sayama, T.; Oeurng, C.; Uk, S.; Takara, K.; Hu, M.; Han, D. Comparison of Gridded Precipitation Datasets for Rainfall-Runoff and Inundation Modeling in the Mekong River Basin. PLoS ONE 2020, 15, e0226814. [Google Scholar] [CrossRef] [PubMed] [Green Version]
- Romero, P.E.; González, M.H.; Rolla, A.L.; Losano, F. Forecasting Annual Precipitation to Improve the Operation of Dams in the Comahue Region, Argentina. Hydrol. Sci. J. 2020, 65, 1974–1983. [Google Scholar] [CrossRef]
- Wei, L.; Jiang, S.; Ren, L.; Wang, M.; Zhang, L.; Liu, Y.; Yuan, F.; Yang, X. Evaluation of Seventeen Satellite-, Reanalysis-, and Gauge-Based Precipitation Products for Drought Monitoring across Mainland China. Atmos. Res. 2021, 263, 105813. [Google Scholar] [CrossRef]
- Boluwade, A. Remote Sensed-Based Rainfall Estimations over the East and West Africa Regions for Disaster Risk Management. ISPRS J. Photogramm. Remote Sens. 2020, 167, 305–320. [Google Scholar] [CrossRef]
- Amekudzi, L.K.; Yamba, E.I.; Preko, K.; Asare, E.O.; Aryee, J.; Baidu, M.; Codjoe, S.N.A. Variabilities in Rainfall Onset, Cessation and Length of Rainy Season for the Various Agro-Ecological Zones of Ghana. Climate 2015, 3, 416–434. [Google Scholar] [CrossRef]
- Atiah, W.A.; Tsidu, G.M.; Amekudzi, L.K. Investigating the Merits of Gauge and Satellite Rainfall Data at Local Scales in Ghana, West Africa. Weather Clim. Extrem. 2020, 30, 100292. [Google Scholar] [CrossRef]
- Yu, C.; Hu, D.; Liu, M.; Wang, S.; Di, Y. Spatio-Temporal Accuracy Evaluation of Three High-Resolution Satellite Precipitation Products in China Area. Atmos. Res. 2020, 241, 104952. [Google Scholar] [CrossRef]
- Wang, N.; Liu, W.; Sun, F.; Yao, Z.; Wang, H.; Liu, W. Evaluating Satellite-Based and Reanalysis Precipitation Datasets with Gauge-Observed Data and Hydrological Modeling in the Xihe River Basin, China. Atmos. Res. 2020, 234, 104746. [Google Scholar] [CrossRef]
- Duan, Z.; Liu, J.; Tuo, Y.; Chiogna, G.; Disse, M. Evaluation of Eight High Spatial Resolution Gridded Precipitation Products in Adige Basin (Italy) at Multiple Temporal and Spatial Scales. Sci. Total Environ. 2016, 573, 1536–1553. [Google Scholar] [CrossRef] [Green Version]
- Faridzad, M.; Yang, T.; Hsu, K.; Sorooshian, S.; Xiao, C. Rainfall Frequency Analysis for Ungauged Regions Using Remotely Sensed Precipitation Information. J. Hydrol. 2018, 563, 123–142. [Google Scholar] [CrossRef] [Green Version]
- Sun, Q.; Miao, C.; Duan, Q.; Ashouri, H.; Sorooshian, S.; Hsu, K.-L. A Review of Global Precipitation Data Sets: Data Sources, Estimation, and Intercomparisons. Rev. Geophys. 2018, 56, 79–107. [Google Scholar] [CrossRef] [Green Version]
- Huffman, G.J.; Bolvin, D.T.; Nelkin, E.J.; Wolff, D.B.; Adler, R.F.; Gu, G.; Hong, Y.; Bowman, K.P.; Stocker, E.F. The TRMM Multisatellite Precipitation Analysis (TMPA): Quasi-Global, Multiyear, Combined-Sensor Precipitation Estimates at Fine Scales. J. Hydrometeorol. 2007, 8, 38–55. [Google Scholar] [CrossRef]
- Kubota, T.; Shige, S.; Hashizume, H.; Aonashi, K.; Takahashi, N.; Seto, S.; Hirose, M.; Takayabu, Y.N.; Ushio, T.; Nakagawa, K.; et al. Global Precipitation Map Using Satellite-Borne Microwave Radiometers by the GSMaP Project: Production and Validation. IEEE Trans. Geosci. Remote Sens. 2007, 45, 2259–2275. [Google Scholar] [CrossRef]
- Ashouri, H.; Hsu, K.-L.; Sorooshian, S.; Braithwaite, D.K.; Knapp, K.R.; Cecil, L.D.; Nelson, B.R.; Prat, O.P. PERSIANN-CDR: Daily Precipitation Climate Data Record from Multisatellite Observations for Hydrological and Climate Studies. Bull. Am. Meteorol. Soc. 2015, 96, 69–83. [Google Scholar] [CrossRef] [Green Version]
- Hersbach, H.; Bell, B.; Berrisford, P.; Hirahara, S.; Horányi, A.; Muñoz-Sabater, J.; Nicolas, J.; Peubey, C.; Radu, R.; Schepers, D.; et al. The ERA5 Global Reanalysis. Q. J. R. Meteorol. Soc. 2020, 146, 1999–2049. [Google Scholar] [CrossRef]
- Fujii, Y.; Ishibashi, T.; Yasuda, T.; Takaya, Y.; Kobayashi, C.; Ishikawa, I. Improvements in Tropical Precipitation and Sea Surface Air Temperature Fields in a Coupled Atmosphere—Ocean Data Assimilation System. Q. J. R. Meteorol. Soc. 2021, 147, 1317–1343. [Google Scholar] [CrossRef]
- Mega, T.; Ushio, T.; Takahiro, M.; Kubota, T.; Kachi, M.; Oki, R. Gauge-Adjusted Global Satellite Mapping of Precipitation. IEEE Trans. Geosci. Remote Sens. 2018, 57, 1928–1935. [Google Scholar] [CrossRef]
- Raimonet, M.; Oudin, L.; Thieu, V.; Silvestre, M.; Vautard, R.; Rabouille, C.; Le Moigne, P. Evaluation of Gridded Meteorological Datasets for Hydrological Modeling. J. Hydrometeorol. 2017, 18, 3027–3041. [Google Scholar] [CrossRef]
- Salman, S.A.; Shahid, S.; Ismail, T.; Al-Abadi, A.M.; Wang, X.; Chung, E.-S. Selection of Gridded Precipitation Data for Iraq Using Compromise Programming. Measurement 2019, 132, 87–98. [Google Scholar] [CrossRef]
- Serrat-Capdevila, A.; Valdes, J.B.; Stakhiv, E.Z. Water Management Applications for Satellite Precipitation Products: Synthesis and Recommendations. JAWRA J. Am. Water Resour. Assoc. 2014, 50, 509–525. [Google Scholar] [CrossRef]
- Bai, X.; Shen, W.; Wu, X.; Wang, P. Applicability of Long-Term Satellite-Based Precipitation Products for Drought Indices Considering Global Warming. J. Environ. Manag. 2020, 255, 109846. [Google Scholar] [CrossRef]
- Kazemzadeh, M.; Noori, Z.; Alipour, H.; Jamali, S.; Akbari, J.; Ghorbanian, A.; Duan, Z. Detecting Drought Events over Iran during 1983–2017 Using Satellite and Ground-Based Precipitation Observations. Atmos. Res. 2022, 269, 106052. [Google Scholar] [CrossRef]
- Mekonnen, K.; Melesse, A.M.; Woldesenbet, T.A. Merging Satellite Rainfall Estimates and Daily Rain Gauge Observations for Improved Flood Simulation in MelkaKuntire Catchment, Upper Awash Basin, Ethiopia. Remote Sens. Appl. Soc. Environ. 2022, 25, 100701. [Google Scholar] [CrossRef]
- Omonge, P.; Feigl, M.; Olang, L.; Schulz, K.; Herrnegger, M. Evaluation of Satellite Precipitation Products for Water Allocation Studies in the Sio-Malaba-Malakisi River Basin of East Africa. J. Hydrol. Reg. Stud. 2022, 39, 100983. [Google Scholar] [CrossRef]
- Wang, Q.; Xia, J.; She, D.; Zhang, X.; Liu, J.; Zhang, Y. Assessment of Four Latest Long-Term Satellite-Based Precipitation Products in Capturing the Extreme Precipitation and Streamflow across a Humid Region of Southern China. Atmos. Res. 2021, 257, 105554. [Google Scholar] [CrossRef]
- Mokhtari, S.; Sharafati, A.; Raziei, T. Satellite-Based Streamflow Simulation Using CHIRPS Satellite Precipitation Product in Shah Bahram Basin, Iran. Acta Geophys. 2022, 70, 385–398. [Google Scholar] [CrossRef]
- Kazemzadeh, M.; Hashemi, H.; Jamali, S.; Uvo, C.B.; Berndtsson, R.; Huffman, G.J. Linear and Nonlinear Trend Analyzes in Global Satellite-Based Precipitation, 1998–2017. Earth’s Future 2021, 9, e2020EF001835. [Google Scholar] [CrossRef]
- Toride, K.; Cawthorne, D.L.; Ishida, K.; Kavvas, M.L.; Anderson, M.L. Long-Term Trend Analysis on Total and Extreme Precipitation over Shasta Dam Watershed. Sci. Total Environ. 2018, 626, 244–254. [Google Scholar] [CrossRef]
- An, Y.; Zhao, W.; Li, C.; Liu, Y. Evaluation of Six Satellite and Reanalysis Precipitation Products Using Gauge Observations over the Yellow River Basin, China. Atmosphere 2020, 11, 1223. [Google Scholar] [CrossRef]
- Tan, M.L.; Santo, H. Comparison of GPM IMERG, TMPA 3B42 and PERSIANN-CDR Satellite Precipitation Products over Malaysia. Atmos. Res. 2018, 202, 63–76. [Google Scholar] [CrossRef]
- Zhou, Z.; Guo, B.; Xing, W.; Zhou, J.; Xu, F.; Xu, Y. Comprehensive Evaluation of Latest GPM Era IMERG and GSMaP Precipitation Products over Mainland China. Atmos. Res. 2020, 246, 105132. [Google Scholar] [CrossRef]
- Satgé, F.; Ruelland, D.; Bonnet, M.-P.; Molina, J.; Pillco, R. Consistency of Satellite-Based Precipitation Products in Space and over Time Compared with Gauge Observations and Snow-Hydrological Modelling in the Lake Titicaca Region. Hydrol. Earth Syst. Sci. 2019, 23, 595–619. [Google Scholar] [CrossRef] [Green Version]
- Tang, G.; Clark, M.P.; Papalexiou, S.M.; Ma, Z.; Hong, Y. Have Satellite Precipitation Products Improved over Last Two Decades? A Comprehensive Comparison of GPM IMERG with Nine Satellite and Reanalysis Datasets. Remote Sens. Environ. 2020, 240, 111697. [Google Scholar] [CrossRef]
- Navarro, A.; García-Ortega, E.; Merino, A.; Sánchez, J.L.; Kummerow, C.; Tapiador, F.J. Assessment of IMERG Precipitation Estimates over Europe. Remote Sens. 2019, 11, 2470. [Google Scholar] [CrossRef] [Green Version]
- Chua, Z.-W.; Kuleshov, Y.; Watkins, A. Evaluation of Satellite Precipitation Estimates over Australia. Remote Sens. 2020, 12, 678. [Google Scholar] [CrossRef] [Green Version]
- Yuan, F.; Zhang, L.; Soe, K.M.W.; Ren, L.; Zhao, C.; Zhu, Y.; Jiang, S.; Liu, Y. Applications of TRMM-and GPM-Era Multiple-Satellite Precipitation Products for Flood Simulations at Sub-Daily Scales in a Sparsely Gauged Watershed in Myanmar. Remote Sens. 2019, 11, 140. [Google Scholar] [CrossRef] [Green Version]
- Nguyen, P.; Ombadi, M.; Sorooshian, S.; Hsu, K.; AghaKouchak, A.; Braithwaite, D.; Ashouri, H.; Thorstensen, A.R. The PERSIANN Family of Global Satellite Precipitation Data: A Review and Evaluation of Products. Hydrol. Earth Syst. Sci. 2018, 22, 5801–5816. [Google Scholar] [CrossRef] [Green Version]
- Sharma, S.; Chen, Y.; Zhou, X.; Yang, K.; Li, X.; Niu, X.; Hu, X.; Khadka, N. Evaluation of GPM-Era Satellite Precipitation Products on the Southern Slopes of the Central Himalayas against Rain Gauge Data. Remote Sens. 2020, 12, 1836. [Google Scholar] [CrossRef]
- Abdelmoneim, H.; Soliman, M.R.; Moghazy, H.M. Evaluation of TRMM 3B42V7 and CHIRPS Satellite Precipitation Products as an Input for Hydrological Model over Eastern Nile Basin. Earth Syst. Environ. 2020, 4, 685–698. [Google Scholar] [CrossRef]
- Baez-Villanueva, O.M.; Zambrano-Bigiarini, M.; Ribbe, L.; Nauditt, A.; Giraldo-Osorio, J.D.; Thinh, N.X. Temporal and Spatial Evaluation of Satellite Rainfall Estimates over Different Regions in Latin-America. Atmos. Res. 2018, 213, 34–50. [Google Scholar] [CrossRef]
- Shayeghi, A.; Azizian, A.; Brocca, L. Reliability of Reanalysis and Remotely Sensed Precipitation Products for Hydrological Simulation over the Sefidrood River Basin, Iran. Hydrol. Sci. J. 2020, 65, 296–310. [Google Scholar] [CrossRef]
- Aminyavari, S.; Saghafian, B.; Sharifi, E. Assessment of Precipitation Estimation from the NWP Models and Satellite Products for the Spring 2019 Severe Floods in Iran. Remote Sens. 2019, 11, 2741. [Google Scholar] [CrossRef] [Green Version]
- Kiany, M.S.K.; Masoodian, S.A.; Balling, R.C., Jr.; Montazeri, M. Evaluation of the TRMM 3B42 Product for Extreme Precipitation Analysis over Southwestern Iran. Adv. Space Res. 2020, 66, 2094–2112. [Google Scholar] [CrossRef]
- Mohseni, F.; Sadr, M.K.; Eslamian, S.; Areffian, A.; Khoshfetrat, A. Spatial and Temporal Monitoring of Drought Conditions Using the Satellite Rainfall Estimates and Remote Sensing Optical and Thermal Measurements. Adv. Space Res. 2021, 67, 3942–3959. [Google Scholar] [CrossRef]
- Sharifi, E.; Steinacker, R.; Saghafian, B. Assessment of GPM-IMERG and Other Precipitation Products against Gauge Data under Different Topographic and Climatic Conditions in Iran: Preliminary Results. Remote Sens. 2016, 8, 135. [Google Scholar] [CrossRef] [Green Version]
- Aslami, F.; Ghorbani, A.; Sobhani, B.; Esmali, A. Comprehensive Comparison of Daily IMERG and GSMaP Satellite Precipitation Products in Ardabil Province, Iran. Int. J. Remote Sens. 2019, 40, 3139–3153. [Google Scholar] [CrossRef]
- Shobeiri, S.; Sharafati, A.; Neshat, A. Evaluation of Different Gridded Precipitation Products in Trend Analysis of Precipitation Features over Iran. Acta Geophys. 2021, 69, 959–974. [Google Scholar] [CrossRef]
- Ghajarnia, N.; Liaghat, A.; Arasteh, P.D. Comparison and Evaluation of High Resolution Precipitation Estimation Products in Urmia Basin-Iran. Atmos. Res. 2015, 158, 50–65. [Google Scholar] [CrossRef]
- Darand, M.; Siavashi, Z. An Evaluation of Global Satellite Mapping of Precipitation (GSMaP) Datasets over Iran. Meteorol. Atmos. Phys. 2021, 133, 911–923. [Google Scholar] [CrossRef]
- Ghozat, A.; Sharafati, A.; Hosseini, S.A. Long-Term Spatiotemporal Evaluation of CHIRPS Satellite Precipitation Product over Different Climatic Regions of Iran. Theor. Appl. Climatol. 2021, 143, 211–225. [Google Scholar] [CrossRef]
- Taghizadeh, E.; Ahmadi-Givi, F.; Brocca, L.; Sharifi, E. Evaluation of Satellite/Reanalysis Precipitation Products over Iran. Int. J. Remote Sens. 2021, 42, 3474–3497. [Google Scholar] [CrossRef]
- Fallah, A.; Rakhshandehroo, G.R.; Berg, P.O.S.; Orth, R. Evaluation of Precipitation Datasets against Local Observations in Southwestern Iran. Int. J. Climatol. 2020, 40, 4102–4116. [Google Scholar] [CrossRef] [Green Version]
- Maghsood, F.F.; Hashemi, H.; Hosseini, S.H.; Berndtsson, R. Ground Validation of GPM IMERG Precipitation Products over Iran. Remote Sens. 2019, 12, 48. [Google Scholar] [CrossRef] [Green Version]
- Eini, M.R.; Olyaei, M.A.; Kamyab, T.; Teymoori, J.; Brocca, L.; Piniewski, M. Evaluating Three Non-Gauge-Corrected Satellite Precipitation Estimates by a Regional Gauge Interpolated Dataset over Iran. J. Hydrol. Reg. Stud. 2021, 38, 100942. [Google Scholar] [CrossRef]
- Moazami, S.; Golian, S.; Hong, Y.; Sheng, C.; Kavianpour, M.R. Comprehensive Evaluation of Four High-Resolution Satellite Precipitation Products under Diverse Climate Conditions in Iran. Hydrol. Sci. J. 2016, 61, 420–440. [Google Scholar] [CrossRef]
- Mosaffa, H.; Shirvani, A.; Khalili, D.; Nguyen, P.; Sorooshian, S. Post and near Real-Time Satellite Precipitation Products Skill over Karkheh River Basin in Iran. Int. J. Remote Sens. 2020, 41, 6484–6502. [Google Scholar] [CrossRef]
- Ghorbanian, A.; Kakooei, M.; Amani, M.; Mahdavi, S.; Mohammadzadeh, A.; Hasanlou, M. Improved Land Cover Map of Iran Using Sentinel Imagery within Google Earth Engine and a Novel Automatic Workflow for Land Cover Classification Using Migrated Training Samples. ISPRS J. Photogramm. Remote Sens. 2020, 167, 276–288. [Google Scholar] [CrossRef]
- Rahimi, J.; Ebrahimpour, M.; Khalili, A. Spatial Changes of Extended De Martonne Climatic Zones Affected by Climate Change in Iran. Theor. Appl. Climatol. 2013, 112, 409–418. [Google Scholar] [CrossRef]
- Fallah, B.; Sodoudi, S.; Russo, E.; Kirchner, I.; Cubasch, U. Towards Modeling the Regional Rainfall Changes over Iran Due to the Climate Forcing of the Past 6000 Years. Quat. Int. 2017, 429, 119–128. [Google Scholar] [CrossRef] [Green Version]
- Daneshvar, M.R.M.; Ebrahimi, M.; Nejadsoleymani, H. An Overview of Climate Change in Iran: Facts and Statistics. Environ. Syst. Res. 2019, 8, 7. [Google Scholar] [CrossRef] [Green Version]
- Razmi, R.; Balyani, S.; Mansouri Daneshvar, M.R. Geo-Statistical Modeling of Mean Annual Rainfall over the Iran Using ECMWF Database. Spat. Inf. Res. 2017, 25, 219–227. [Google Scholar] [CrossRef]
- Ghasemi, A.R.; Khalili, D. The Association between Regional and Global Atmospheric Patterns and Winter Precipitation in Iran. Atmos. Res. 2008, 88, 116–133. [Google Scholar] [CrossRef]
- Modarres, R.; Sarhadi, A.; Burn, D.H. Changes of Extreme Drought and Flood Events in Iran. Glob. Planet. Chang. 2016, 144, 67–81. [Google Scholar] [CrossRef]
- Gorelick, N.; Hancher, M.; Dixon, M.; Ilyushchenko, S.; Thau, D.; Moore, R. Google Earth Engine: Planetary-Scale Geospatial Analysis for Everyone. Remote Sens. Environ. 2017, 202, 18–27. [Google Scholar] [CrossRef]
- Amani, M.; Ghorbanian, A.; Ahmadi, S.A.; Kakooei, M.; Moghimi, A.; Mirmazloumi, S.M.; Moghaddam, S.H.A.; Mahdavi, S.; Ghahremanloo, M.; Parsian, S.; et al. Google Earth Engine Cloud Computing Platform for Remote Sensing Big Data Applications: A Comprehensive Review. IEEE J. Sel. Top. Appl. Earth Obs. Remote Sens. 2020, 13, 5326–5350. [Google Scholar] [CrossRef]
- Milewski, A.; Elkadiri, R.; Durham, M. Assessment and Comparison of TMPA Satellite Precipitation Products in Varying Climatic and Topographic Regimes in Morocco. Remote Sens. 2015, 7, 5697–5717. [Google Scholar] [CrossRef] [Green Version]
- Kim, K.; Park, J.; Baik, J.; Choi, M. Evaluation of Topographical and Seasonal Feature Using GPM IMERG and TRMM 3B42 over Far-East Asia. Atmos. Res. 2017, 187, 95–105. [Google Scholar] [CrossRef]
- Funk, C.; Peterson, P.; Landsfeld, M.; Pedreros, D.; Verdin, J.; Shukla, S.; Husak, G.; Rowland, J.; Harrison, L.; Hoell, A.; et al. The Climate Hazards Infrared Precipitation with Stations—A New Environmental Record for Monitoring Extremes. Sci. Data 2015, 2, 150066. [Google Scholar] [CrossRef] [Green Version]
- Menne, M.J.; Durre, I.; Vose, R.S.; Gleason, B.E.; Houston, T.G. An Overview of the Global Historical Climatology Network-Daily Database. J. Atmos. Ocean. Technol. 2012, 29, 897–910. [Google Scholar] [CrossRef]
- Peterson, T.C.; Vose, R.S. An Overview of the Global Historical Climatology Network Temperature Database. Bull. Am. Meteorol. Soc. 1997, 78, 2837–2850. [Google Scholar] [CrossRef] [Green Version]
- Dinku, T.; Funk, C.; Peterson, P.; Maidment, R.; Tadesse, T.; Gadain, H.; Ceccato, P. Validation of the CHIRPS Satellite Rainfall Estimates over Eastern Africa. Q. J. R. Meteorol. Soc. 2018, 144, 292–312. [Google Scholar] [CrossRef] [Green Version]
- Hsu, K.; Gao, X.; Sorooshian, S.; Gupta, H.V. Precipitation Estimation from Remotely Sensed Information Using Artificial Neural Networks. J. Appl. Meteorol. 1997, 36, 1176–1190. [Google Scholar] [CrossRef]
- Knapp, K.R.; Ansari, S.; Bain, C.L.; Bourassa, M.A.; Dickinson, M.J.; Funk, C.; Helms, C.N.; Hennon, C.C.; Holmes, C.D.; Huffman, G.J.; et al. Globally Gridded Satellite Observations for Climate Studies. Bull. Am. Meteorol. Soc. 2011, 92, 893–907. [Google Scholar] [CrossRef]
- Ushio, T.; Sasashige, K.; Kubota, T.; Shige, S.; Okamoto, K.; Aonashi, K.; Inoue, T.; Takahashi, N.; Iguchi, T.; Kachi, M.; et al. A Kalman Filter Approach to the Global Satellite Mapping of Precipitation (GSMaP) from Combined Passive Microwave and Infrared Radiometric Data. J. Meteorol. Soc. Japan Ser. II 2009, 87, 137–151. [Google Scholar] [CrossRef] [Green Version]
- Huffman, G.J.; Bolvin, D.T.; Braithwaite, D.; Hsu, K.; Joyce, R.; Xie, P.; Yoo, S.-H. NASA Global Precipitation Measurement (GPM) Integrated Multi-Satellite Retrievals for GPM (IMERG). Algorithm Theor. Basis Doc. 2015, 4, 26. [Google Scholar]
- Tan, J.; Huffman, G.J.; Bolvin, D.T.; Nelkin, E.J. IMERG V06: Changes to the Morphing Algorithm. J. Atmos. Ocean. Technol. 2019, 36, 2471–2482. [Google Scholar] [CrossRef]
- Joyce, R.J.; Xie, P. Kalman Filter—Based CMORPH. J. Hydrometeorol. 2011, 12, 1547–1563. [Google Scholar] [CrossRef]
- Jiang, Q.; Li, W.; Fan, Z.; He, X.; Sun, W.; Chen, S.; Wen, J.; Gao, J.; Wang, J. Evaluation of the ERA5 Reanalysis Precipitation Dataset over Chinese Mainland. J. Hydrol. 2021, 595, 125660. [Google Scholar] [CrossRef]
- Yuan, F.; Wang, B.; Shi, C.; Cui, W.; Zhao, C.; Liu, Y.; Ren, L.; Zhang, L.; Zhu, Y.; Chen, T.; et al. Evaluation of Hydrological Utility of IMERG Final Run V05 and TMPA 3B42V7 Satellite Precipitation Products in the Yellow River Source Region, China. J. Hydrol. 2018, 567, 696–711. [Google Scholar] [CrossRef]
- Mantas, V.M.; Liu, Z.; Caro, C.; Pereira, A. Validation of TRMM Multi-Satellite Precipitation Analysis (TMPA) Products in the Peruvian Andes. Atmos. Res. 2015, 163, 132–145. [Google Scholar] [CrossRef]
- Islam, M.A. Statistical Comparison of Satellite-Retrieved Precipitation Products with Rain Gauge Observations over Bangladesh. Int. J. Remote Sens. 2018, 39, 2906–2936. [Google Scholar] [CrossRef] [Green Version]
- Rivera, J.A.; Marianetti, G.; Hinrichs, S. Validation of CHIRPS Precipitation Dataset along the Central Andes of Argentina. Atmos. Res. 2018, 213, 437–449. [Google Scholar] [CrossRef]
- Peng, F.; Zhao, S.; Chen, C.; Cong, D.; Wang, Y.; Ouyang, H. Evaluation and Comparison of the Precipitation Detection Ability of Multiple Satellite Products in a Typical Agriculture Area of China. Atmos. Res. 2020, 236, 104814. [Google Scholar] [CrossRef]
- Taylor, K.E. Summarizing Multiple Aspects of Model Performance in a Single Diagram. J. Geophys. Res. Atmos. 2001, 106, 7183–7192. [Google Scholar] [CrossRef]
- Roebber, P.J. Visualizing Multiple Measures of Forecast Quality. Weather Forecast. 2009, 24, 601–608. [Google Scholar] [CrossRef] [Green Version]
- Brocca, L.; Massari, C.; Pellarin, T.; Filippucci, P.; Ciabatta, L.; Camici, S.; Kerr, Y.H.; Fernández-Prieto, D. River Flow Prediction in Data Scarce Regions: Soil Moisture Integrated Satellite Rainfall Products Outperform Rain Gauge Observations in West Africa. Sci. Rep. 2020, 10, 12517. [Google Scholar] [CrossRef]
- Bitew, M.M.; Gebremichael, M.; Ghebremichael, L.T.; Bayissa, Y.A. Evaluation of High-Resolution Satellite Rainfall Products through Streamflow Simulation in a Hydrological Modeling of a Small Mountainous Watershed in Ethiopia. J. Hydrometeorol. 2012, 13, 338–350. [Google Scholar] [CrossRef]
- Nikolopoulos, E.I.; Anagnostou, E.N.; Hossain, F.; Gebremichael, M.; Borga, M. Understanding the Scale Relationships of Uncertainty Propagation of Satellite Rainfall through a Distributed Hydrologic Model. J. Hydrometeorol. 2010, 11, 520–532. [Google Scholar] [CrossRef]
- Furl, C.; Ghebreyesus, D.; Sharif, H.O. Assessment of the Performance of Satellite-Based Precipitation Products for Flood Events across Diverse Spatial Scales Using GSSHA Modeling System. Geosciences 2018, 8, 191. [Google Scholar] [CrossRef] [Green Version]
- Gumindoga, W.; Rientjes, T.H.M.; Haile, A.T.; Reggiani, P.; Makurira, H. Propagation of CMORPH Rainfall Errors to REW Streamflow Simulation Mismatch in the Upper Zambezi Basin. J. Hydrol. Reg. Stud. 2021, 38, 100966. [Google Scholar] [CrossRef]
- Alemu, M.L.; Worqlul, A.W.; Zimale, F.A.; Tilahun, S.A.; Steenhuis, T.S. Water Balance for a Tropical Lake in the Volcanic Highlands: Lake Tana, Ethiopia. Water 2020, 12, 2737. [Google Scholar] [CrossRef]
- Chen, F.; Yuan, H.; Sun, R.; Yang, C. Streamflow Simulations Using Error Correction Ensembles of Satellite Rainfall Products over the Huaihe River Basin. J. Hydrol. 2020, 589, 125179. [Google Scholar] [CrossRef]
- Gavahi, K.; Abbaszadeh, P.; Moradkhani, H. How Does Precipitation Data Influence the Land Surface Data Assimilation for Drought Monitoring? Sci. Total Environ. 2022, 831, 154916. [Google Scholar] [CrossRef]
- Camici, S.; Massari, C.; Ciabatta, L.; Marchesini, I.; Brocca, L. Which Rainfall Score Is More Informative about the Performance in River Discharge Simulation? A Comprehensive Assessment on 1318 Basins over Europe. Hydrol. Earth Syst. Sci. 2020, 24, 4869–4885. [Google Scholar] [CrossRef]
- Jing, X.; Suzuki, K.; Guo, H.; Goto, D.; Ogura, T.; Koshiro, T.; Mülmenstädt, J. A Multimodel Study on Warm Precipitation Biases in Global Models Compared to Satellite Observations. J. Geophys. Res. Atmos. 2017, 122, 11–806. [Google Scholar] [CrossRef] [Green Version]
- Xiao, S.; Zou, L.; Xia, J.; Yang, Z.; Yao, T. Bias Correction Framework for Satellite Precipitation Products Using a Rain/No Rain Discriminative Model. Sci. Total Environ. 2022, 818, 151679. [Google Scholar] [CrossRef] [PubMed]
- Zhu, B.; Huang, Y.; Zhang, Z.; Kong, R.; Tian, J.; Zhou, Y.; Chen, S.; Duan, Z. Evaluation of TMPA Satellite Precipitation in Driving VIC Hydrological Model over the Upper Yangtze River Basin. Water 2020, 12, 3230. [Google Scholar] [CrossRef]
- Habib, E.; ElSaadani, M.; Haile, A.T. Climatology-Focused Evaluation of CMORPH and TMPA Satellite Rainfall Products over the Nile Basin. J. Appl. Meteorol. Climatol. 2012, 51, 2105–2121. [Google Scholar] [CrossRef] [Green Version]
- Malayeri, A.K.; Saghafian, B.; Raziei, T. Performance Evaluation of ERA5 Precipitation Estimates across Iran. Arab. J. Geosci. 2021, 14, 2676. [Google Scholar] [CrossRef]
- Amjad, M.; Yilmaz, M.T.; Yucel, I.; Yilmaz, K.K. Performance Evaluation of Satellite-and Model-Based Precipitation Products over Varying Climate and Complex Topography. J. Hydrol. 2020, 584, 124707. [Google Scholar] [CrossRef]
- Salmani-Dehaghi, N.; Samani, N. Spatiotemporal Assessment of the PERSIANN Family of Satellite Precipitation Data over Fars Province, Iran. Theor. Appl. Climatol. 2019, 138, 1333–1357. [Google Scholar] [CrossRef]
- Rahman, K.U.; Shang, S.; Shahid, M.; Li, J. Developing an Ensemble Precipitation Algorithm from Satellite Products and Its Topographical and Seasonal Evaluations over Pakistan. Remote Sens. 2018, 10, 1835. [Google Scholar] [CrossRef] [Green Version]
- Bhuiyan, M.A.E.; Yang, F.; Biswas, N.K.; Rahat, S.H.; Neelam, T.J. Machine Learning-Based Error Modeling to Improve GPM IMERG Precipitation Product over the Brahmaputra River Basin. Forecasting 2020, 2, 248–266. [Google Scholar] [CrossRef]
- Zhang, L.; Li, X.; Zheng, D.; Zhang, K.; Ma, Q.; Zhao, Y.; Ge, Y. Merging Multiple Satellite-Based Precipitation Products and Gauge Observations Using a Novel Double Machine Learning Approach. J. Hydrol. 2021, 594, 125969. [Google Scholar] [CrossRef]
- Prakash, S.; Seshadri, A.; Srinivasan, J.; Pai, D.S. A New Parameter to Assess Impact of Rain Gauge Density on Uncertainty in the Estimate of Monthly Rainfall over India. J. Hydrometeorol. 2019, 20, 821–832. [Google Scholar] [CrossRef]
- Merino, A.; García-Ortega, E.; Navarro, A.; Fernández-González, S.; Tapiador, F.J.; Sánchez, J.L. Evaluation of Gridded Rain-Gauge-Based Precipitation Datasets: Impact of Station Density, Spatial Resolution, Altitude Gradient and Climate. Int. J. Climatol. 2021, 41, 3027–3043. [Google Scholar] [CrossRef]
- Satgé, F.; Defrance, D.; Sultan, B.; Bonnet, M.-P.; Seyler, F.; Rouche, N.; Pierron, F.; Paturel, J.-E. Evaluation of 23 Gridded Precipitation Datasets across West Africa. J. Hydrol. 2020, 581, 124412. [Google Scholar] [CrossRef] [Green Version]
- Bai, P.; Liu, X. Evaluation of Five Satellite-Based Precipitation Products in Two Gauge-Scarce Basins on the Tibetan Plateau. Remote Sens. 2018, 10, 1316. [Google Scholar] [CrossRef] [Green Version]
- AghaKouchak, A.; Behrangi, A.; Sorooshian, S.; Hsu, K.; Amitai, E. Evaluation of Satellite-Retrieved Extreme Precipitation Rates across the Central United States. J. Geophys. Res. Atmos. 2011, 116, D2. [Google Scholar] [CrossRef]
- Zhang, M.; de Leon, C.; Migliaccio, K. Evaluation and Comparison of Interpolated Gauge Rainfall Data and Gridded Rainfall Data in Florida, USA. Hydrol. Sci. J. 2018, 63, 561–582. [Google Scholar] [CrossRef]
- Golian, S.; Javadian, M.; Behrangi, A. On the Use of Satellite, Gauge, and Reanalysis Precipitation Products for Drought Studies. Environ. Res. Lett. 2019, 14, 75005. [Google Scholar] [CrossRef]
- Ma, Z.; Xu, J.; He, K.; Han, X.; Ji, Q.; Wang, T.; Xiong, W.; Hong, Y. An Updated Moving Window Algorithm for Hourly-Scale Satellite Precipitation Downscaling: A Case Study in the Southeast Coast of China. J. Hydrol. 2020, 581, 124378. [Google Scholar] [CrossRef]
- Sharifi, E.; Saghafian, B.; Steinacker, R. Downscaling Satellite Precipitation Estimates with Multiple Linear Regression, Artificial Neural Networks, and Spline Interpolation Techniques. J. Geophys. Res. Atmos. 2019, 124, 789–805. [Google Scholar] [CrossRef] [Green Version]
- Madani, K.; AghaKouchak, A.; Mirchi, A. Iran’s Socio-Economic Drought: Challenges of a Water-Bankrupt Nation. Iran. Stud. 2016, 49, 997–1016. [Google Scholar] [CrossRef]
- Noori, R.; Maghrebi, M.; Mirchi, A.; Tang, Q.; Bhattarai, R.; Sadegh, M.; Noury, M.; Haghighi, A.T.; Kløve, B.; Madani, K. Anthropogenic Depletion of Iran’s Aquifers. Proc. Natl. Acad. Sci. USA 2021, 118, e2024221118. [Google Scholar] [CrossRef]
- Seyama, E.S.; Masocha, M.; Dube, T. Evaluation of TAMSAT Satellite Rainfall Estimates for Southern Africa: A Comparative Approach. Phys. Chem. Earth Parts A/B/C 2019, 112, 141–153. [Google Scholar] [CrossRef]
- Friesen, B.; Boluwade, A.; Rasmussen, P.F.; Fortin, V. Assimilation of Satellite-Based Rainfall Estimations in the Canadian Precipitation Analysis. J. Hydrol. Eng. 2017, 22, 4017049. [Google Scholar] [CrossRef]


| Grided Precipitation Product (GPP) | Synoptic Station | |
|---|---|---|
| Yes | No | |
| Yes | Hit | False |
| No | Miss | Correct Negative |
| Precipitation Product | CC | RMSE (mm) | MBE (mm) | MAE (mm) | POD | FAR | CSI |
|---|---|---|---|---|---|---|---|
| TMPA | 0.330 | 4.10 | −0.574 | 0.913 | 0.368 | 0.564 | 0.249 |
| CHIRPS | 0.353 | 4.68 | 0.152 | 1.220 | 0.369 | 0.564 | 0.250 |
| PERSIANN | 0.356 | 4.25 | 0.094 | 1.262 | 0.742 | 0.668 | 0.297 |
| GSMaP | 0.599 | 3.48 | −0.132 | 0.834 | 0.784 | 0.480 | 0.454 |
| IMERG | 0.483 | 6.89 | 1.001 | 1.791 | 0.693 | 0.621 | 0.324 |
| ERA5 | 0.623 | 3.59 | 0.268 | 1.027 | 0.867 | 0.568 | 0.405 |
| GPPs | Continuous Metrics | ||
|---|---|---|---|
| CC | MBE (mm) | RMSE (mm) | |
| TMPA | 0.794 ± 0.0101 | −17.34 ± 17.65 | 30.01 ± 24.09 |
| CHIRPS | 0.768 ± 0.116 | 4.94 ± 17.41 | 24.43 ± 21.24 |
| PERSIANN | 0.752 ± 0.122 | 2.84 ± 17.43 | 26.76 ± 18.19 |
| GSMaP | 0.767 ± 0.137 | −3.73 ± 11.73 | 22.73 ± 15.87 |
| IMERG | 0.857 ± 0.094 | 30.34 ± 15.87 | 50.89 ± 22.06 |
| ERA5 | 0.827 ± 0.095 | 8.28 ± 13.99 | 23.78 ± 15.06 |
| GPPs | Continuous Metrics | ||
|---|---|---|---|
| CC | MBE (mm) | RMSE (mm) | |
| TMPA | 0.792 ± 0.0102 | −0.58 ± 0.58 | 1.01 ± 0.80 |
| CHIRPS | 0.766 ± 0.116 | 0.16 ± 0.58 | 0.83 ± 0.71 |
| PERSIANN | 0.749 ± 0.122 | 0.09 ± 0.58 | 0.90 ± 0.60 |
| GSMaP | 0.771 ± 0.138 | −0.13 ± 0.40 | 0.78 ± 0.55 |
| IMERG | 0.855 ± 0.095 | 1.01 ± 0.53 | 1.70 ± 0.75 |
| ERA5 | 0.823 ± 0.097 | 0.28 ± 0.46 | 0.81 ± 0.51 |
| GPPs | Continuous Metrics | ||
|---|---|---|---|
| CC | MBE (mm) | RMSE (mm) | |
| TMPA | 0.703 ± 0.166 | −209.20 ± 211.57 | 223.23 ± 215.04 |
| CHIRPS | 0.660 ± 0.187 | 59.44 ± 208.95 | 137.78 ± 187.35 |
| PERSIANN | 0.581 ± 0.253 | 34.79 ± 209.54 | 173.25 ± 153.11 |
| GSMaP | 0.580 ± 0.212 | −44.23 ± 140.09 | 139.06 ± 123.73 |
| IMERG | 0.797 ± 0.146 | 362.66 ± 188.97 | 389.29 ± 183.38 |
| ERA5 | 0.733 ± 0.139 | 97.47 ± 164.13 | 151.28 ± 141.79 |
| GPPs | Continuous Metrics | ||
|---|---|---|---|
| CC | MBE (mm) | RMSE (mm) | |
| TMPA | 0.706 ± 0.171 | −0.58 ± 0.58 | 0.63 ± 0.59 |
| CHIRPS | 0.662 ± 0.204 | 0.16 ± 0.57 | 0.39 ± 0.52 |
| PERSIANN | 0.582 ± 0.264 | 0.09 ± 0.58 | 0.48 ± 0.42 |
| GSMaP | 0.571 ± 0.238 | −0.13 ± 0.40 | 0.40 ± 0.37 |
| IMERG | 0.781 ± 0.161 | 1.01 ± 0.53 | 1.11 ± 0.56 |
| ERA5 | 0.762 ± 0.168 | 0.28 ± 0.46 | 0.44 ± 0.39 |
Publisher’s Note: MDPI stays neutral with regard to jurisdictional claims in published maps and institutional affiliations. |
© 2022 by the authors. Licensee MDPI, Basel, Switzerland. This article is an open access article distributed under the terms and conditions of the Creative Commons Attribution (CC BY) license (https://creativecommons.org/licenses/by/4.0/).
Share and Cite
Ghorbanian, A.; Mohammadzadeh, A.; Jamali, S.; Duan, Z. Performance Evaluation of Six Gridded Precipitation Products throughout Iran Using Ground Observations over the Last Two Decades (2000–2020). Remote Sens. 2022, 14, 3783. https://doi.org/10.3390/rs14153783
Ghorbanian A, Mohammadzadeh A, Jamali S, Duan Z. Performance Evaluation of Six Gridded Precipitation Products throughout Iran Using Ground Observations over the Last Two Decades (2000–2020). Remote Sensing. 2022; 14(15):3783. https://doi.org/10.3390/rs14153783
Chicago/Turabian StyleGhorbanian, Arsalan, Ali Mohammadzadeh, Sadegh Jamali, and Zheng Duan. 2022. "Performance Evaluation of Six Gridded Precipitation Products throughout Iran Using Ground Observations over the Last Two Decades (2000–2020)" Remote Sensing 14, no. 15: 3783. https://doi.org/10.3390/rs14153783
APA StyleGhorbanian, A., Mohammadzadeh, A., Jamali, S., & Duan, Z. (2022). Performance Evaluation of Six Gridded Precipitation Products throughout Iran Using Ground Observations over the Last Two Decades (2000–2020). Remote Sensing, 14(15), 3783. https://doi.org/10.3390/rs14153783