Review

A Review of Earth Observation-Based Drought Studies in Southeast Asia

1
Institute of Geography and Geology, University of Wuerzburg, 97047 Wuerzburg, Germany
2
German Remote Sensing Data Center (DFD), German Aerospace Center (DLR), Oberpfaffenhofen, 82234 Wessling, Germany
3
Faculty of Natural Resources Management, Thai Nguyen University of Agriculture and Forestry, Mo Bach St, Thai Nguyen 25000, Vietnam
*
Author to whom correspondence should be addressed.
Remote Sens. 2022, 14(15), 3763; https://doi.org/10.3390/rs14153763
Submission received: 24 June 2022 / Revised: 25 July 2022 / Accepted: 3 August 2022 / Published: 5 August 2022

Abstract

:
Drought is a recurring natural climatic hazard event over terrestrial land; it poses devastating threats to human health, the economy, and the environment. Given the increasing climate crisis, it is likely that extreme drought phenomena will become more frequent, and their impacts will probably be more devastating. Drought observations from space, therefore, play a key role in dissimilating timely and accurate information to support early warning drought management and mitigation planning, particularly in sparse in-situ data regions. In this paper, we reviewed drought-related studies based on Earth observation (EO) products in Southeast Asia between 2000 and 2021. The results of this review indicated that drought publications in the region are on the increase, with a majority (70%) of the studies being undertaken in Vietnam, Thailand, Malaysia and Indonesia. These countries also accounted for nearly 97% of the economic losses due to drought extremes. Vegetation indices from multispectral optical remote sensing sensors remained a primary source of data for drought monitoring in the region. Many studies (~21%) did not provide accuracy assessment on drought mapping products, while precipitation was the main data source for validation. We observed a positive association between spatial extent and spatial resolution, suggesting that nearly 81% of the articles focused on the local and national scales. Although there was an increase in drought research interest in the region, challenges remain regarding large-area and long time-series drought measurements, the combined drought approach, machine learning-based drought prediction, and the integration of multi-sensor remote sensing products (e.g., Landsat and Sentinel-2). Satellite EO data could be a substantial part of the future efforts that are necessary for mitigating drought-related challenges, ensuring food security, establishing a more sustainable economy, and the preservation of the natural environment in the region.

1. Introduction

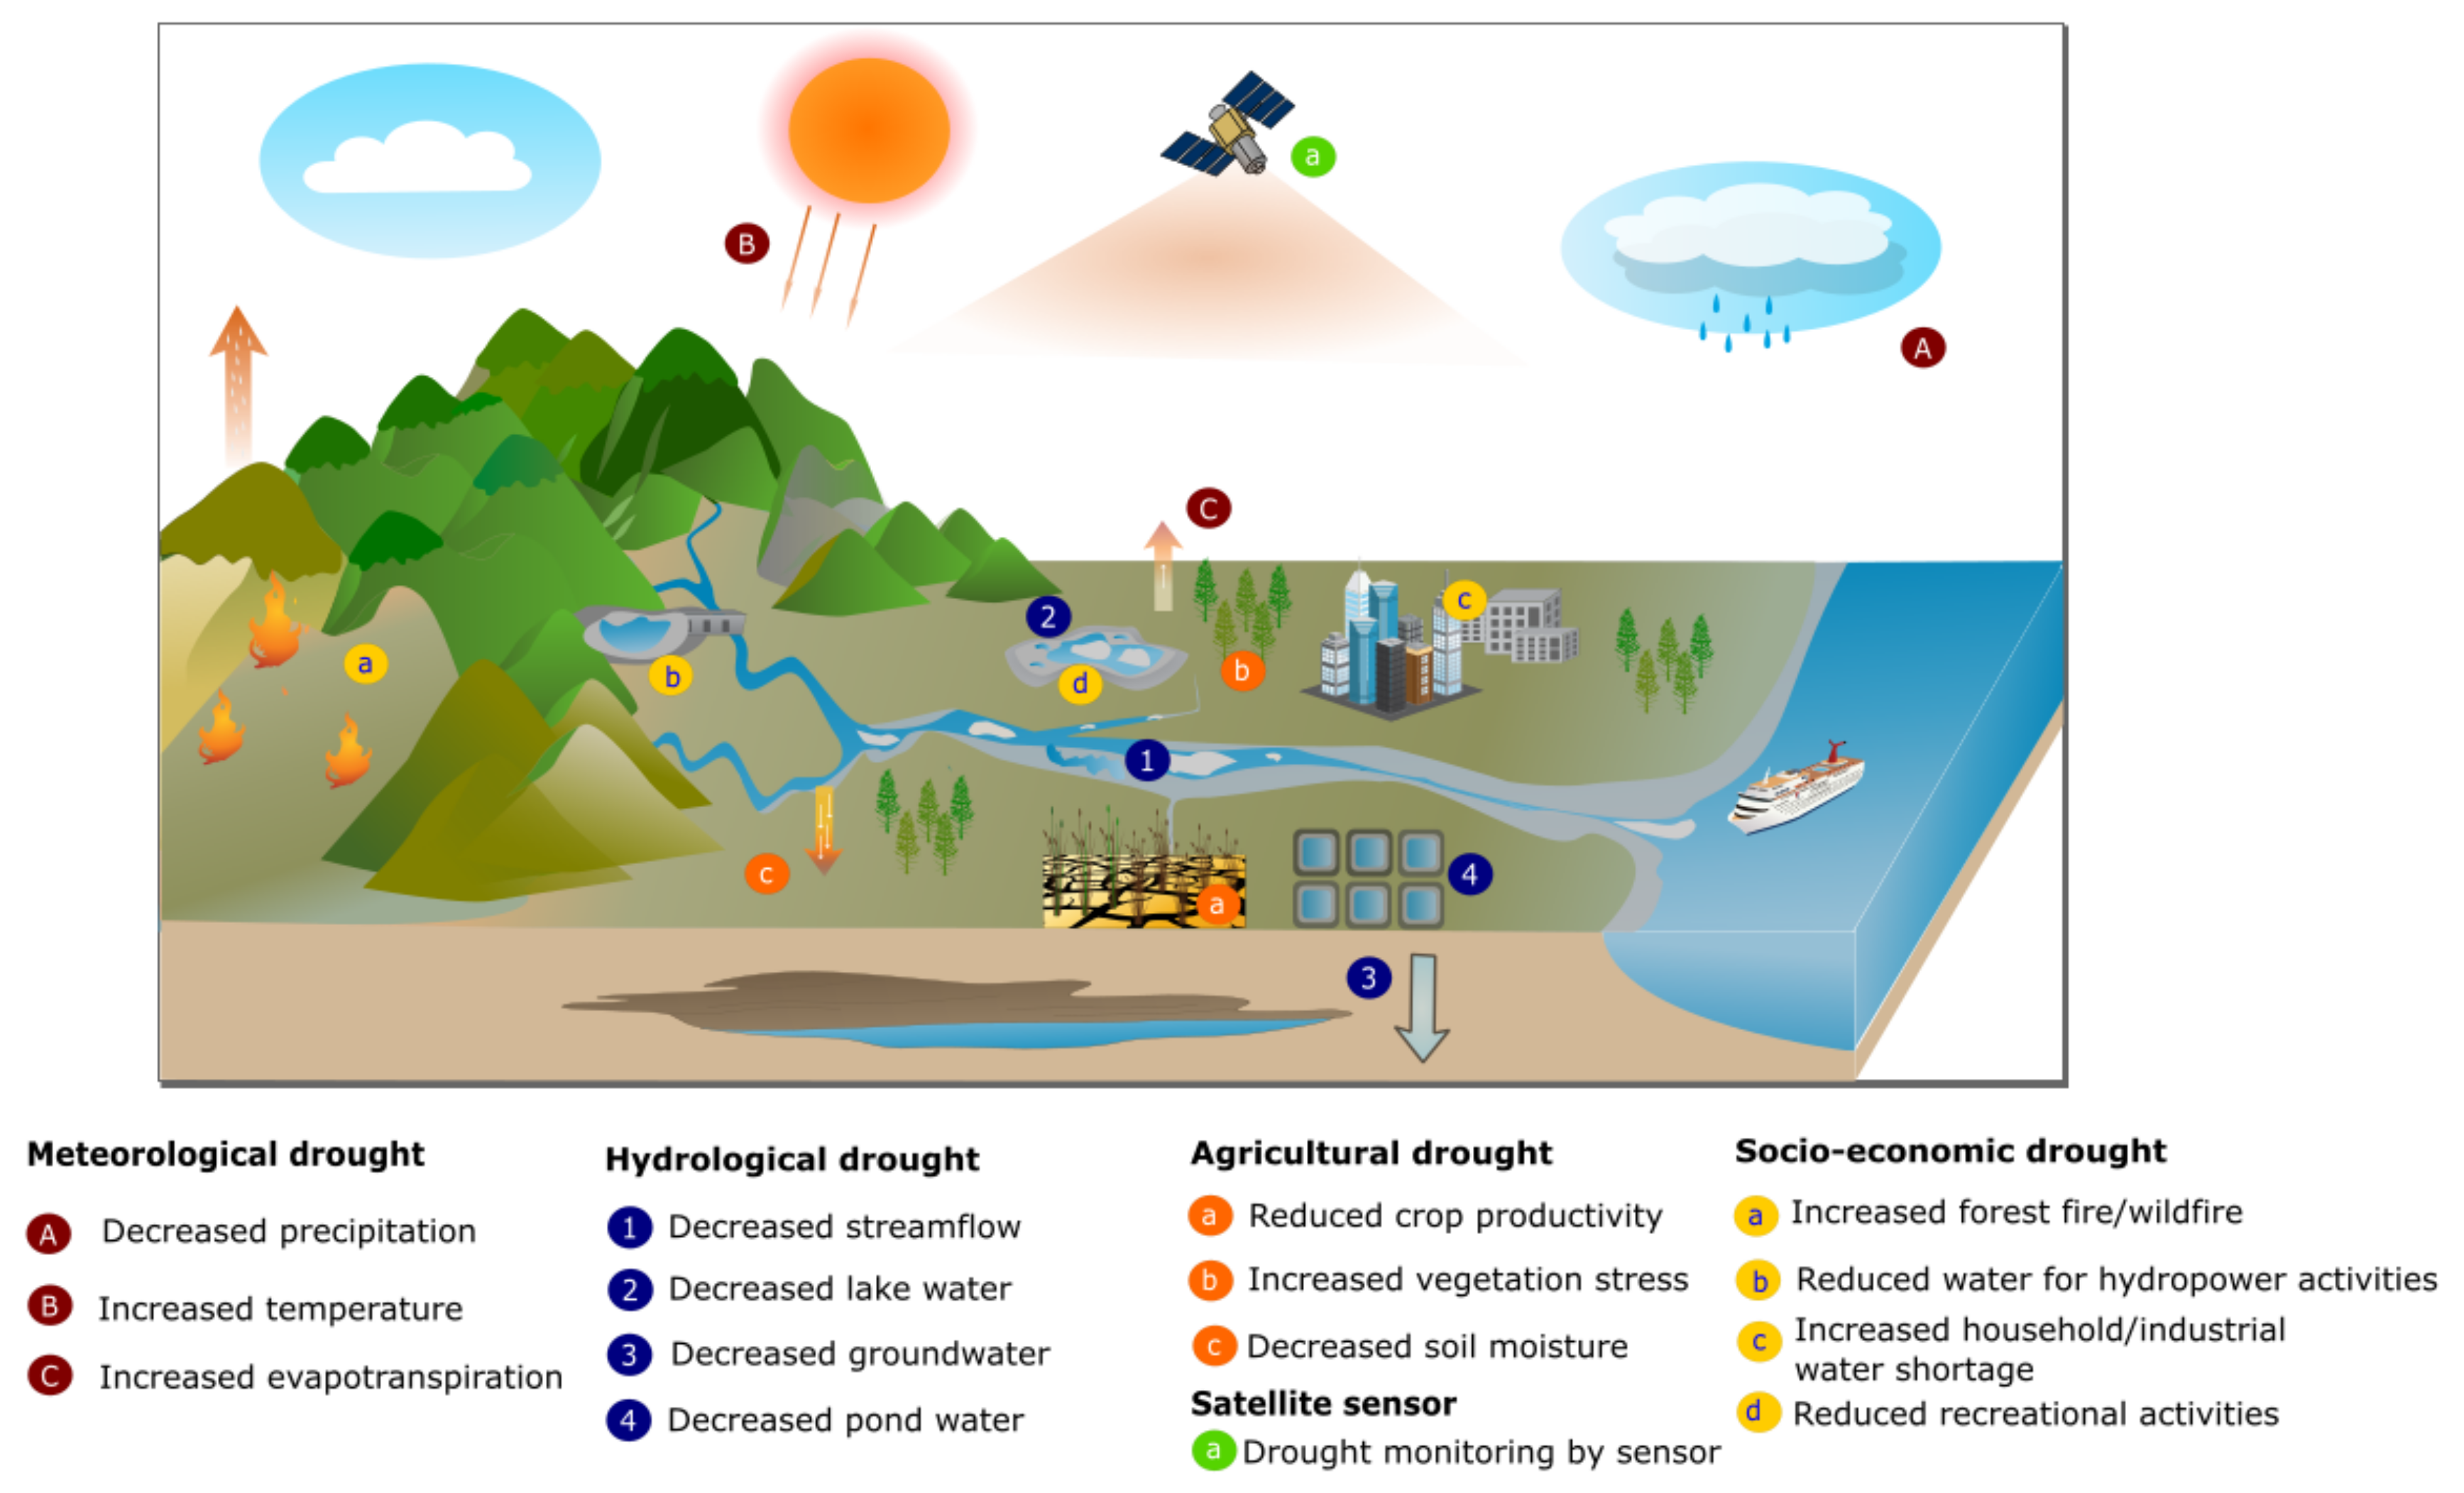
1.1. Drought Relevance

Drought is a recurring natural climatic hazard event over terrestrial land; it poses devastating threats to the community, the economy, and the environment. It can occur in nearly all climatic regions, and has a complex, evolving nature with varying levels of severity, frequency, spatial extent and impacts. Although drought accounted for 7.3% of natural disasters, its impact was by far considered to be the most widespread and damaging [1]. Agriculture is the first and most affected sector, accounting for 80% of all direct impacts when drought occurs. The updated statistics from the Special Report on Drought of the United Nations Office for Disaster Risk Reduction (UNDRR) estimated that the United States loses USD 6.4 billion in agriculture every year, while Europe suffers from USD 9 billion due to agricultural drought hazards [2]. In Africa, drought hazard has exaggerated the food crisis (e.g., the maize price increased by 25% in 2011) and left millions of farmers dependent on global humanitarian assistance [3]. The Intergovernmental Panel on Climate Change’s sixth report indicated that many parts of the world will continue to suffer from serious droughts in the near future because of climate change and human activities [4].
In Asia, over the past three decades, multiple extreme and severe droughts have occurred (e.g., drought events in 1997–1998, 2005–2006, 2015–2016, and 2018–2020), and drought has become one of the costliest natural hazards in China [5,6], Southeast Asia [7,8] and Central Asia [9,10]. The most recent drought event, which occurred in 2018–2020, caused an economic loss of USD 240 million in Yunnan, China, whereas in Southeast Asia there was a USD 840 million loss in Thailand. In addition, droughts are frequently reported in the least-developed Asian countries, with devastating agricultural impacts. Miyan et al., 2015 [11], analyzed drought impacts on the 14 least-developed Asian countries, and their findings indicated that Cambodia, Bangladesh, and Nepal frequently suffered from severe droughts. For example, in Nepal the severe droughts that took place from 2013 to 2017 imposed an intervention cost of USD 5.2 million from the government. It is believed that economic loss due to droughts in Asia will likely increase in the near future because of global warming. Recent studies projected that severe droughts are expected to occur more frequently in Southeast Asia [12,13], South Asia [14], and China [15].
Drought is one of the most complex phenomena because it starts slowly and its impacts often accumulate over a considerable period of time to cause a visible loss. Hence, the exact onset and end of a drought event are challenging to measure. As their characteristics are complex in nature, there has been no universally accepted drought definition; in fact, in the early 1980s Wilhite and Glantz, 1985 [16], reported more than 150 drought definitions worldwide. In an effort from the World Meteorological Organization (WMO), drought is defined as “a prolonged dry period in the natural climate cycle that can occur anywhere in the world and caused by a lack of precipitation” [17]. More recently, the special report on drought 2021 by the United Nations Office for Disaster Risk Reduction (UNDRR) defined drought as “abnormally dry weather or an exceptional lack of water compared with normal conditions constitute the hazard” [2].
Despite the diversity of drought definitions, it can be broadly classified into four main types, including meteorological, agricultural, hydrological, and socioeconomic drought [18,19]. Meteorological drought refers to precipitation below the long-term average condition (e.g., 30 years) over a specific location for a period of time, from which other drought types originate. Agricultural drought relates to a deficiency of the soil moisture content in the plant root zone that can cause a susceptibility to and/or a reduction in crop/vegetation productivity, or even crop failure. Depending on the prior condition of the soil moisture layer, the onset of agricultural drought usually lags by weeks to three months from meteorological drought [20,21]. Hydrological drought is also associated with a lack of precipitation, but over a longer period of time, which causes a reduced water level and streamflow in surface water bodies (e.g., lakes and reservoirs) and groundwater. Socioeconomic drought associated with drought impacts the supply and demand of goods and services. River cruise ships, for example, cannot provide tourism services and other recreational activities. Recently a new form of drought, ecological drought, was defined as the deficiency of available water in the natural ecosystem that is beyond the thresholds of vulnerability, which threatens plants, animals and ecosystem services [22]. Although each drought type has its characteristics and impacts, they are closely interconnected, and originate from a lack of precipitation. Figure 1 provides an overview of the different drought types and their associated triggers and impacts.
Given the various drought types, a vast number of drought indicators and indices have been developed to measure the quantitative conditions of droughts and describe their physical characteristics (e.g., severity, duration, spatial extent, and frequency). The benefit of these indices is that they provide a numerical representation of drought severity, and they are primarily grouped as meteorological, hydrological, and agricultural drought indices. Such indices can be derived from different sources of in-situ and remote sensing-based data, such as temperature and precipitation. In practice, users can employ a single drought index, multiple indices, or composite/combined indices depending on the drought characteristics and needs. To some extent, one single drought index can be used to characterize various drought types, for example in the case of the Standardized Precipitation Index (SPI). The SPI can be used to monitor meteorological drought [19,23] and agricultural drought [24,25]. A recent handbook of drought indicators and indices from the WMO and the UNDRR provides an overview of the commonly used drought indices and describes their use in detail [2,19].

1.2. Impacts of Drought in Southeast Asia

In Southeast Asia agriculture and food are key sectors, and this region is considered to be one of the largest agricultural producers worldwide. Rice, for example, is the most critical crop, and is a staple food source in the region [26]. The crop is of great significance to the local and regional economy [27]. However, the increasing climate crisis makes this crop more vulnerable to drought than ever before. An updated estimate of the Economic and Social Commission for Asia and the Pacific revealed that, in recent years, the average annual loss of agriculture in the region reached nearly USD 410 billion [28].
Due to its climatic geography (e.g., oceanic and atmospheric factors [29]), Southeast Asia has suffered from diverse impacts of drought, ranging from human death to economic and environmental losses. Table 1 offers an overview of drought impacts across Southeast Asian countries from 1960 to 2021. Overall, nearly 97% of economic loss due to droughts in Southeast Asia was observed in Vietnam, Thailand and Indonesia, whereas the highest numbers of people affected by droughts were identified in Cambodia and Thailand. Table 1 shows that there were 84 reported drought events with more than ten thousand deaths, nearly 82 million affected people, and approximately USD 31.6 billion economic loss in the region over the past decades. Indonesia was the most affected country in terms of deaths (9790 people) and economic damage (~17.5 USD billion), whereas Thailand had the highest number of affected people (~43 million). The Philippines ranked second in terms of deaths (371 people), and Thailand ranked third (77 deaths). Interestingly, there were no reported deaths in Vietnam, Cambodia, Laos, Brunei and Timor-Leste, although these countries often suffer from droughts, except for Brunei and Timor-Leste. There was a total of 23,000 people from Myanmar and Malaysia who left their homes due to drought between 1960 and 2021, while other countries have reported no homelessness associated with droughts. Wildfire, famine and pollution are frequently observed in the region as the aftershock of droughts.

1.3. The Potential of the EO-Based Analysis of Droughts

Remote sensing products have been used to monitor drought-related phenomenon and assess their impacts on the community, the economy, and the environment. In the drought domain, multispectral, thermal, and microwave remote sensing observations are primarily employed to retrieve drought information. There are a large number of sensors and remotely-sensed datasets that can be used to characterize drought conditions. However, some sensors may receive greater attention than others in drought monitoring due to their superior spatiotemporal characteristics. The success of the Landsat satellite program has led to a series of new satellite EO missions in 1980s and 1990s, such as the Advanced Very High Resolution Radiometer mission (AVHRR) in 1981, the Tropical Rainfall Measuring Mission (TRMM) 1987, and the Moderate Resolution Imaging Spectroradiometer (MODIS) in 1999. The launch of these missions provided an unprecedented amount of remote sensing data to unlock regional and global drought monitoring and characterization from various perspectives (e.g., meteorological, hydrological, agricultural and ecological droughts).
In recent years, the number of newer satellite-based EO missions has substantially increased, which offers numerous opportunities for drought monitoring and assessment. The advantages of recent satellite missions, such as higher spatial and temporal resolution, have provided an uninterrupted flow of drought observations. The Sentinel-2 mission, for example, consists of two multispectral satellites, including Sentinel-2A and Sentinel-2B. The Sentinel-2A satellite was launched in June 2015, and Sentinel-2B was in orbit in March 2017. Together, these two satellites have an operational capability to deliver highly spatial, spectral, and temporal observations of the global land surface temperature and vegetation from 2 to 5 days (at the mid-latitudes and the equator, respectively) under cloud-free conditions. In addition, the recent launch of Landsat 9 in September 2021 continued the legacy of 50 years of observing the Earth. The combined Landsat 8 and Landsat 9 satellites can provide high-spatial-resolution (30 m) data at a revisit time of around 8 days for drought monitoring anywhere on Earth.
Apart from multispectral and thermal remote sensing satellites, microwave satellite sensors play an important role in drought monitoring and assessment. Soil moisture active and passive (SMAP), a mission led by the National Aeronautics and Space Administration (NASA), was launched in 2015; it provides high temporal observations of terrestrial surface soil moistures with near real-time global coverage in 2–3 days. In addition, based on the successor of the TRMM, the Global Precipitation Measurement Mission (GPM) was launched in 2014 by NASA and its partners to provide globally available precipitation measurements every 30 min. With recent advancement in space technologies and open data policies, more drought remote sensing datasets will be expected to be available to the public. Jiao et al., 2021 [30], offered a comprehensive list of satellite-based datasets for drought monitoring and assessment.
The traditional approach to drought monitoring and assessment relies on in-situ observations of precipitation, temperature or soil moisture, which are constrained by large-scale and frequent monitoring. With the unprecedented volume of different remote sensing datasets, the shift from ground-based observations to satellite-based sensors provides near real-time measurements, global coverage, and consistent and improved spatial resolution data records for the monitoring of droughts from a wide array of perspectives, such as agricultural and meteorological droughts [31,32]. In addition, the launch of Google Earth Engine (GEE), a big data cloud-based processing platform, in 2010 enabled users to access vast satellite datasets, and makes it possible to process such data for drought characterization and assessment [33,34,35,36,37]. Apart from the repeated observation capacity of the land surface, remote sensing sensors can provide measurements in regions that are either inaccessible or lack in-situ monitoring facilities for drought assessment [30].

1.4. Scope and Purpose of the Review

Remote sensing data have been increasingly available to support various aspects of drought mapping and assessment worldwide. These efforts have led to a significant increase in scientific literature and databases on droughts. There have been several reviews summarizing the global progress of remote sensing satellite-based drought studies [30,31,38], whereas there are only a few reviews dedicated to specific regions, including South Asia [39], the Middle-East, Southwest Asia [40], and East Asia [41]. In Southeast Asia, however, a review assessing remote sensing of drought events is still missing. To our knowledge, this is the first review of EO-based drought studies in the region. This review aims to provide a summary of recent progress in drought studies based on EO products over Southeast Asia. More specifically, we survey the aspects of drought indices, uncertainty and validation strategies for EO products, and thematic drought applications. In this regard, we consider only satellite EO products, and not airborne and drone remote sensing platforms, as the latter suffer from limited spatial and/or temporal coverage.
We structured the review into five sections. The Section 1 introduces the topic, drought impacts and potential of EO products in the region, whereas Section 2 concerns the materials and review method. We present the results in Section 3, providing an overview of the progress of drought remote sensing in the region (e.g., the spatial distribution of the publications, satellite sensors, drought indices, and thematic drought applications). Finally, we discuss the challenges and opportunities of drought remote sensing in the region, before providing a summary of the main findings.

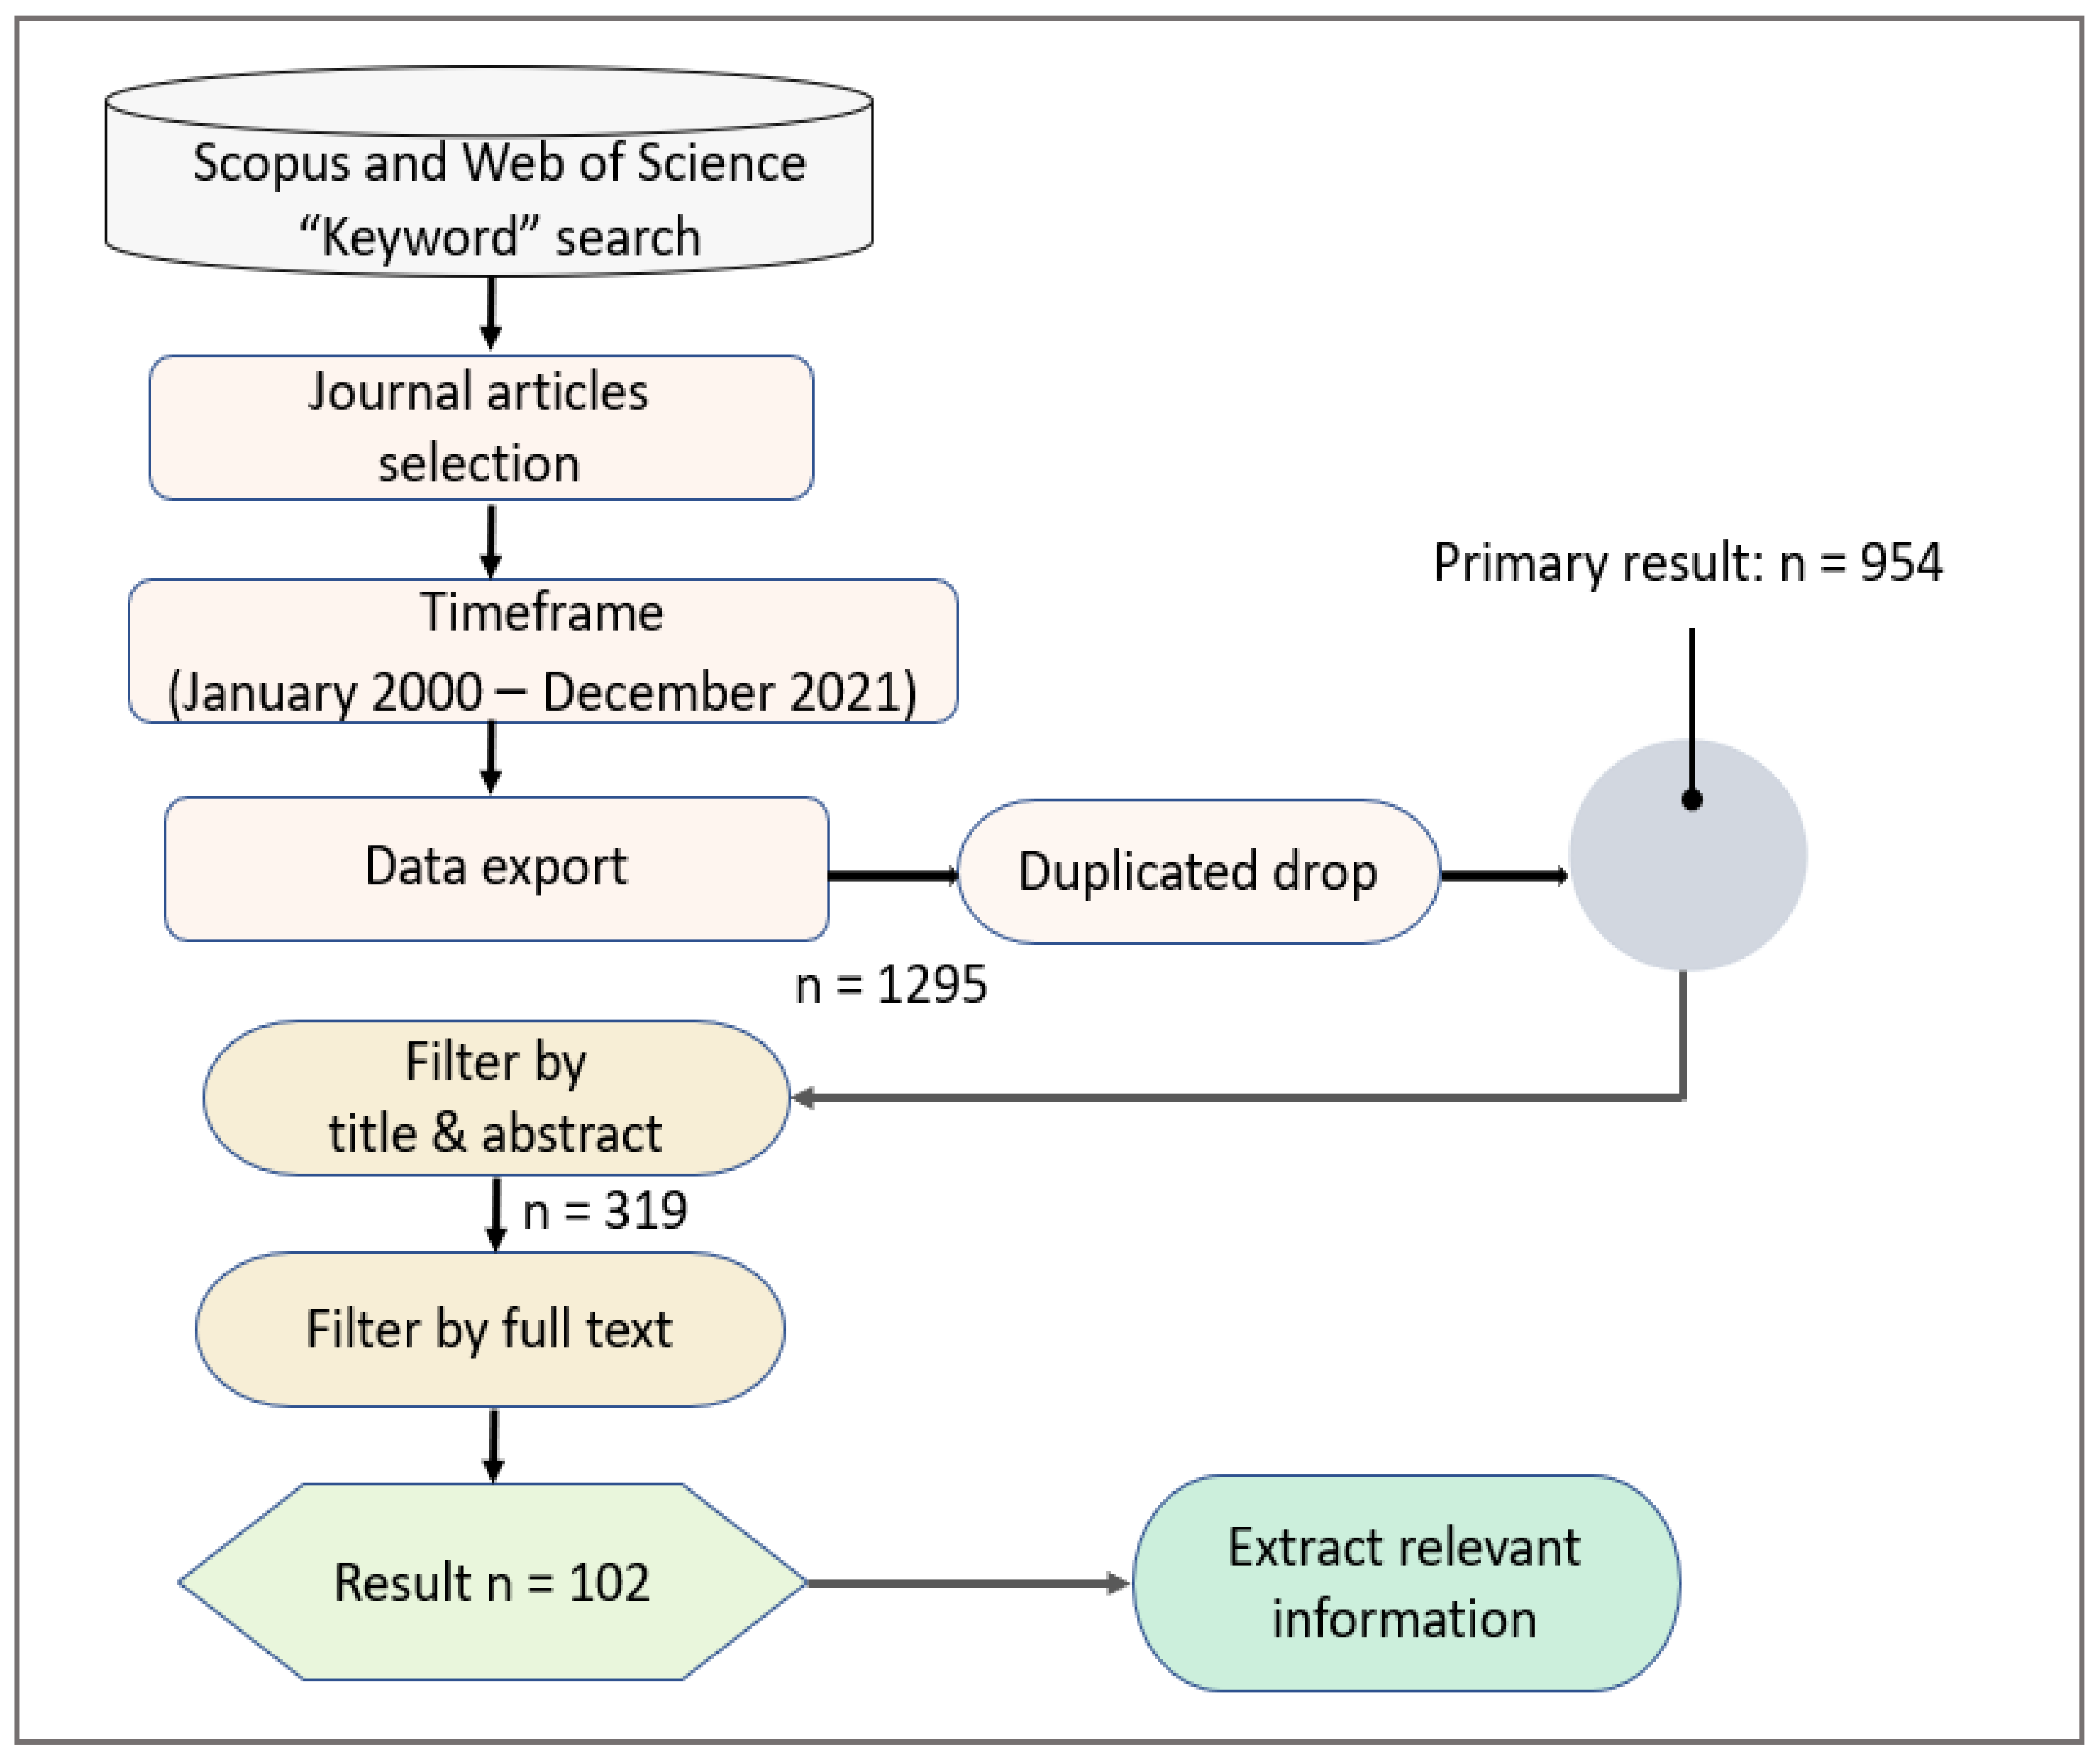
2. Materials and Methods

A systematic review was performed to assess the progress of drought studies in Southeast Asia from an EO perspective. For this review, a comprehensive literature search was conducted to identify drought-related papers over Southeast Asia, with the main focus on the use of EO satellite-based products. More specifically, we conducted a literature search within two major academic database platforms, Web of Science and Scopus, from January 2000 to December 2021 (last accessed 25 December 2021). The choice of the two databases was due to the fact that they are two world-leading academic platforms, and offer more comprehensive cover than any other journal ranking lists [42]. Furthermore, we only considered the search timeframe from 2000 onwards, as there has been little research in drought monitoring using the EO measurements before 2000. Our trial search found no papers related to the remote sensing of drought in the last century over the region. The search queries considered peer-reviewed journal articles published in English, whereas the selected papers restricted countries and/or subregions within the Southeast Asia region. Figure 2 provides an overview diagram of the review approach, from the search process to article selection.
Drought is a complex phenomenon and can be detected by various satellite sensors, ranging from microwave to optical/thermal remote sensing. Thus, the search terms used in this study contain various keyword arguments. Firstly, “drought” or “dry” or “wildfire” are included in the search, whereas various “remote sensing” terms are defined, including “earth observation”, “satellite” and “remotely sensed data”. Next, we specify countries in Southeast Asia, including Myanmar, Thailand, Laos, Cambodia, Vietnam, Malaysia, Indonesia, Singapore, Brunei, East Timor, and the Philippines. In addition, the Mekong is considered an important river basin with the largest area of rice crop in the region and received great attention from the local and global science communities for drought monitoring and assessment. As such, this term—together with Southeast Asia—was also included in the search expression. The final search structure is presented as follows:
TS = (“drought*” OR “dry*” OR “wildfire”) AND (“remote* sens*” OR “earth observation” OR “satellite*”) AND (“Vietnam*” OR “Thailand” OR “Myanmar” OR “Lao*” OR “Cambodia*” OR “Malaysia*” OR “Singapore*” OR “Indonesia*” OR “Philippines” OR “Brunei” OR “Timor” OR “Mekong” OR “Southeast Asia*”)
Here, TS means “topic”, such that keywords appear in the titles, abstracts and/or keywords of a given paper. The “*” means the inclusion of everything after, such as Vietnam or Vietnamese, whereas OR and AND are Boolean conditions to navigate the search. We used the same keyword search expression in both Scopus and Web of Science, with a two-step process. Firstly, we searched for all of the articles that matched our keywords, and this search query returned a large number of research articles associated with the topic from the two databases, for a total of 1295 articles. It is observed that many of the papers appeared in both databases; as such, we removed all duplicated articles, and this resulted in a total of 954 remaining papers. Finally, we manually filtered each article and selected papers that focused on remote sensing-based drought monitoring.
More specifically, we skimmed all of the article titles and abstracts, and excluded irrelevant articles (e.g., cropland classification) from the formal analysis. We observed that many drought articles are based only on non-satellite data such as in-situ precipitation measurements, and these studies were also excluded. Although there is a large number of forest fire studies, we only considered studies with forest-fire-related drought. In detail, the selection of review articles ensured the following criteria: (1) the study characterized and assessed drought-related topics with a primary focus on satellite-based EO products; (2) the study area is located within Southeast Asian countries; (3) the study addressed droughts mainly associated with meteorology, hydrology, agriculture, and socioeconomic and ecological impacts; (4) the study concerned drought monitoring and assessment on terrestrial land and water ecosystems, excluding ocean and earth-atmospheric interaction studies.
Each article was carefully examined and considered to satisfy the criteria. Consequently, a total of 102 research articles were finally analyzed to serve the review. Given the diversity of drought indicators/indices for drought characterization and assessment in Southeast Asia, this review considered the available droughts in the four main types of droughts—meteorological, hydrological, agricultural and ecological/wildfire-induced droughts—with further subcategories, namely vegetation stress, surface water/groundwater and streamflow variability, drought-related forest fires, drought-induced land use change, and soil moisture drought. In order to facilitate a systematic review, we then extracted a list of the relevant variables to produce the graphs and tables presented in the Section 3. Table 2 displays a list of 25 relevant variables for this review.

3. Results

3.1. Current Progress and Trends of Drought Studies in Southeast Asia

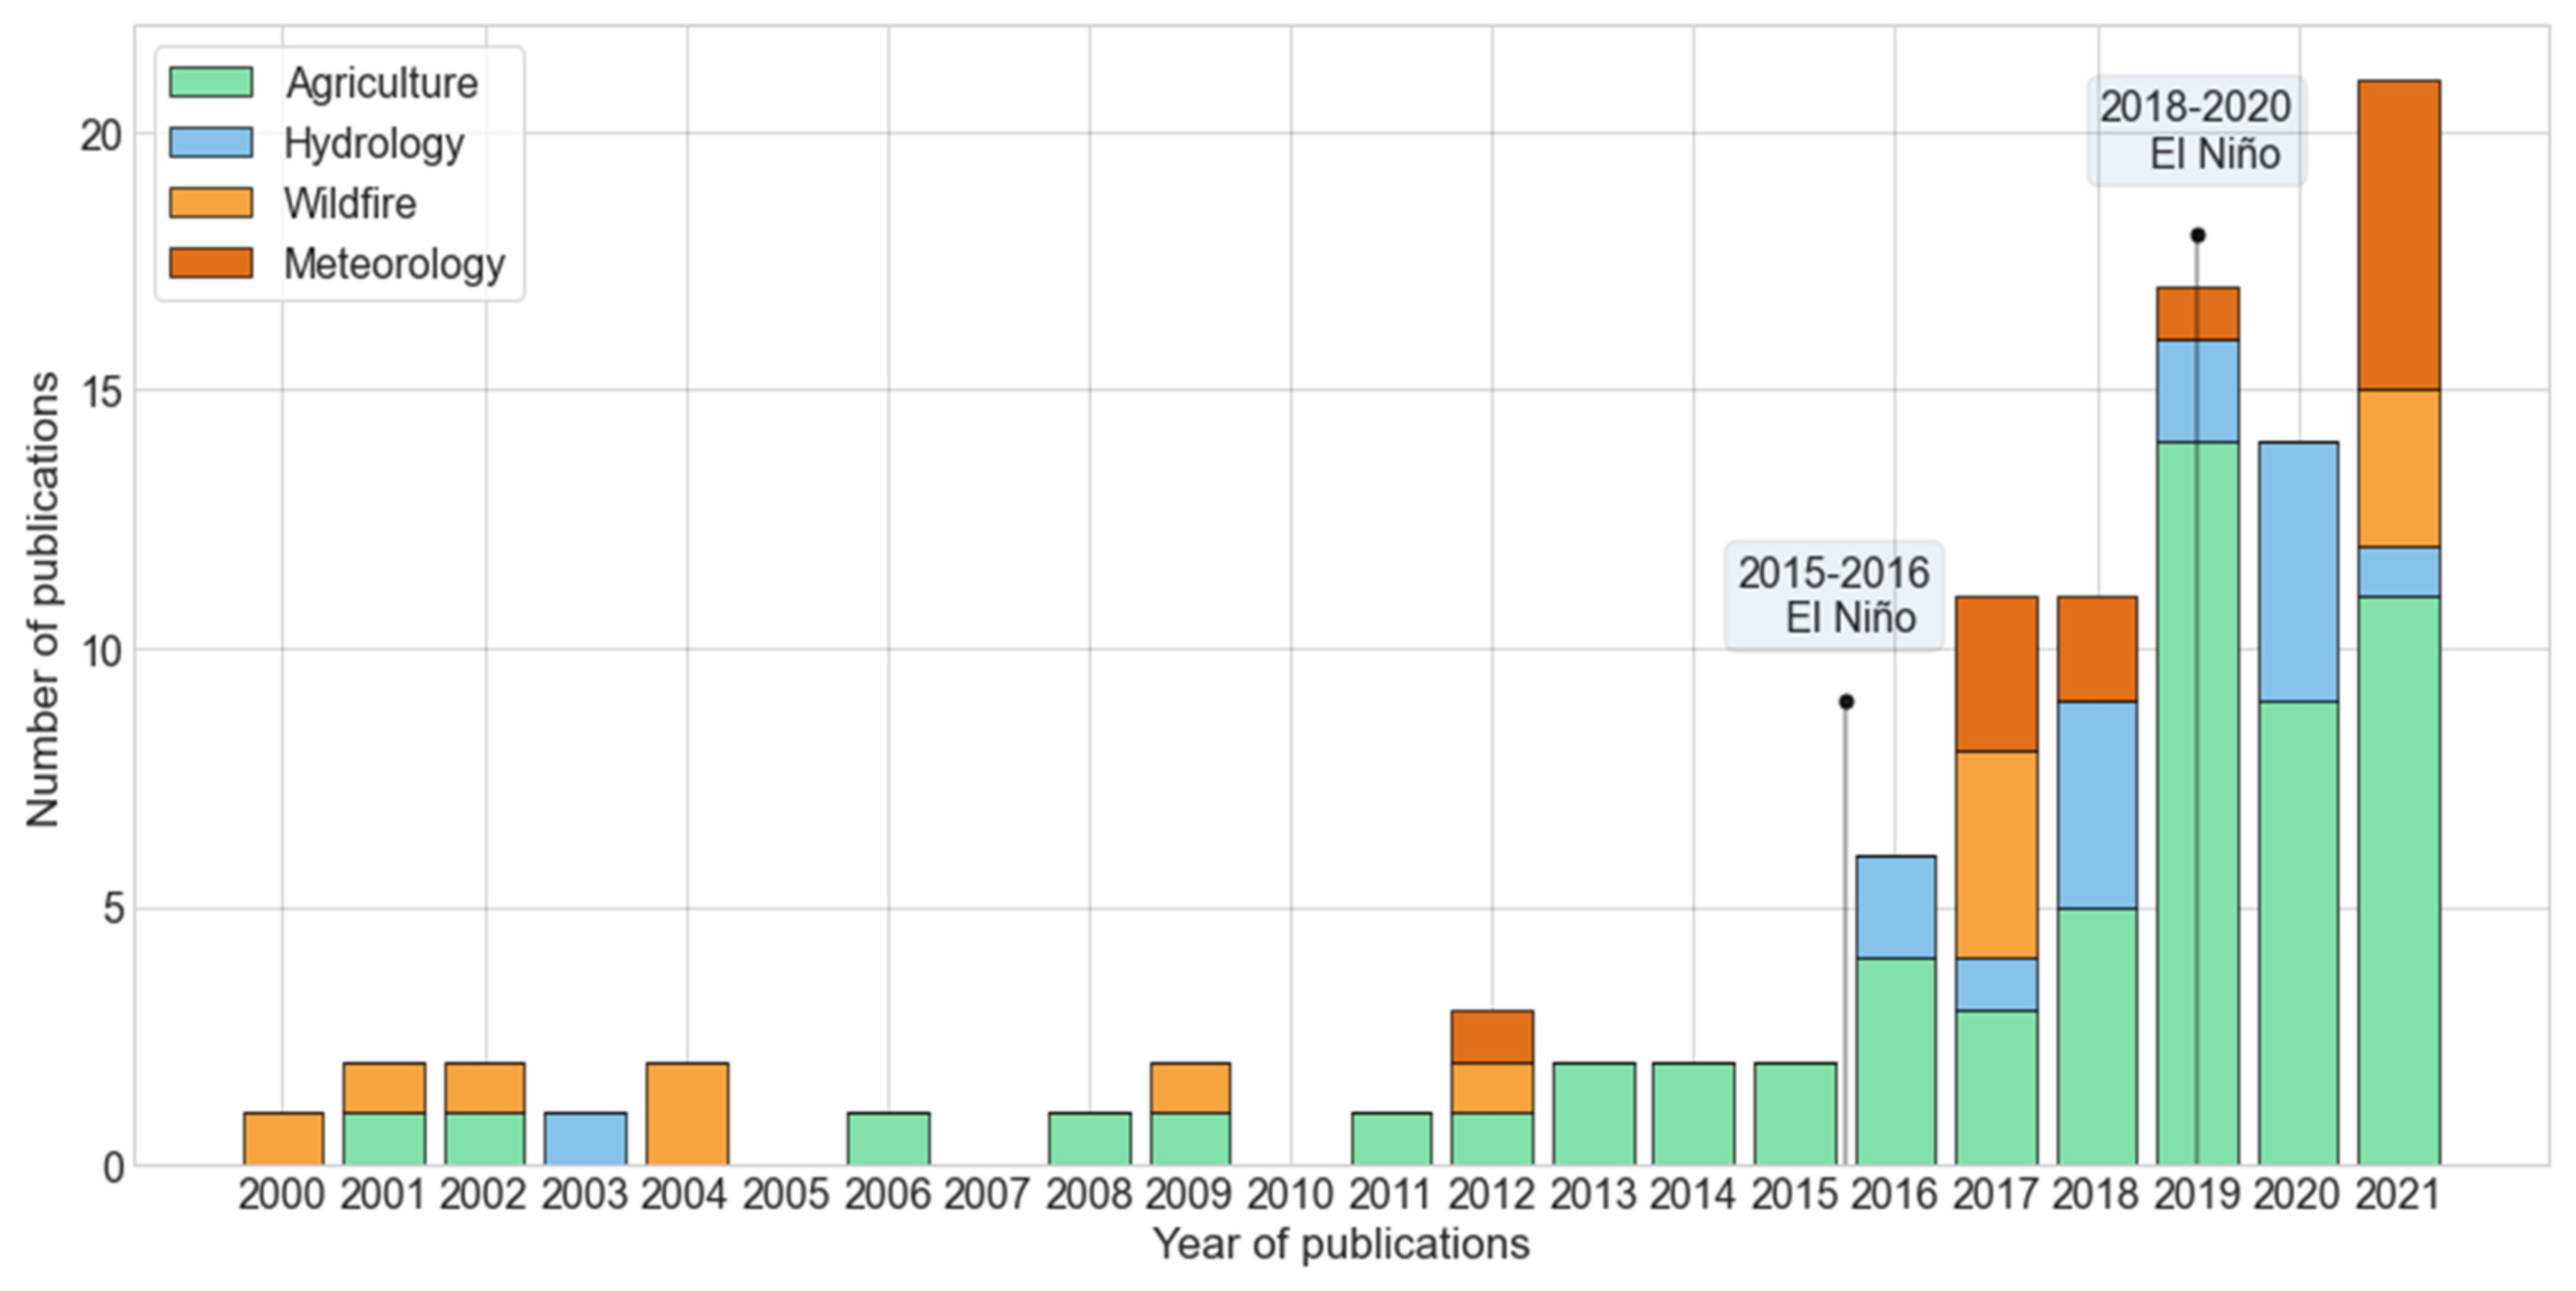
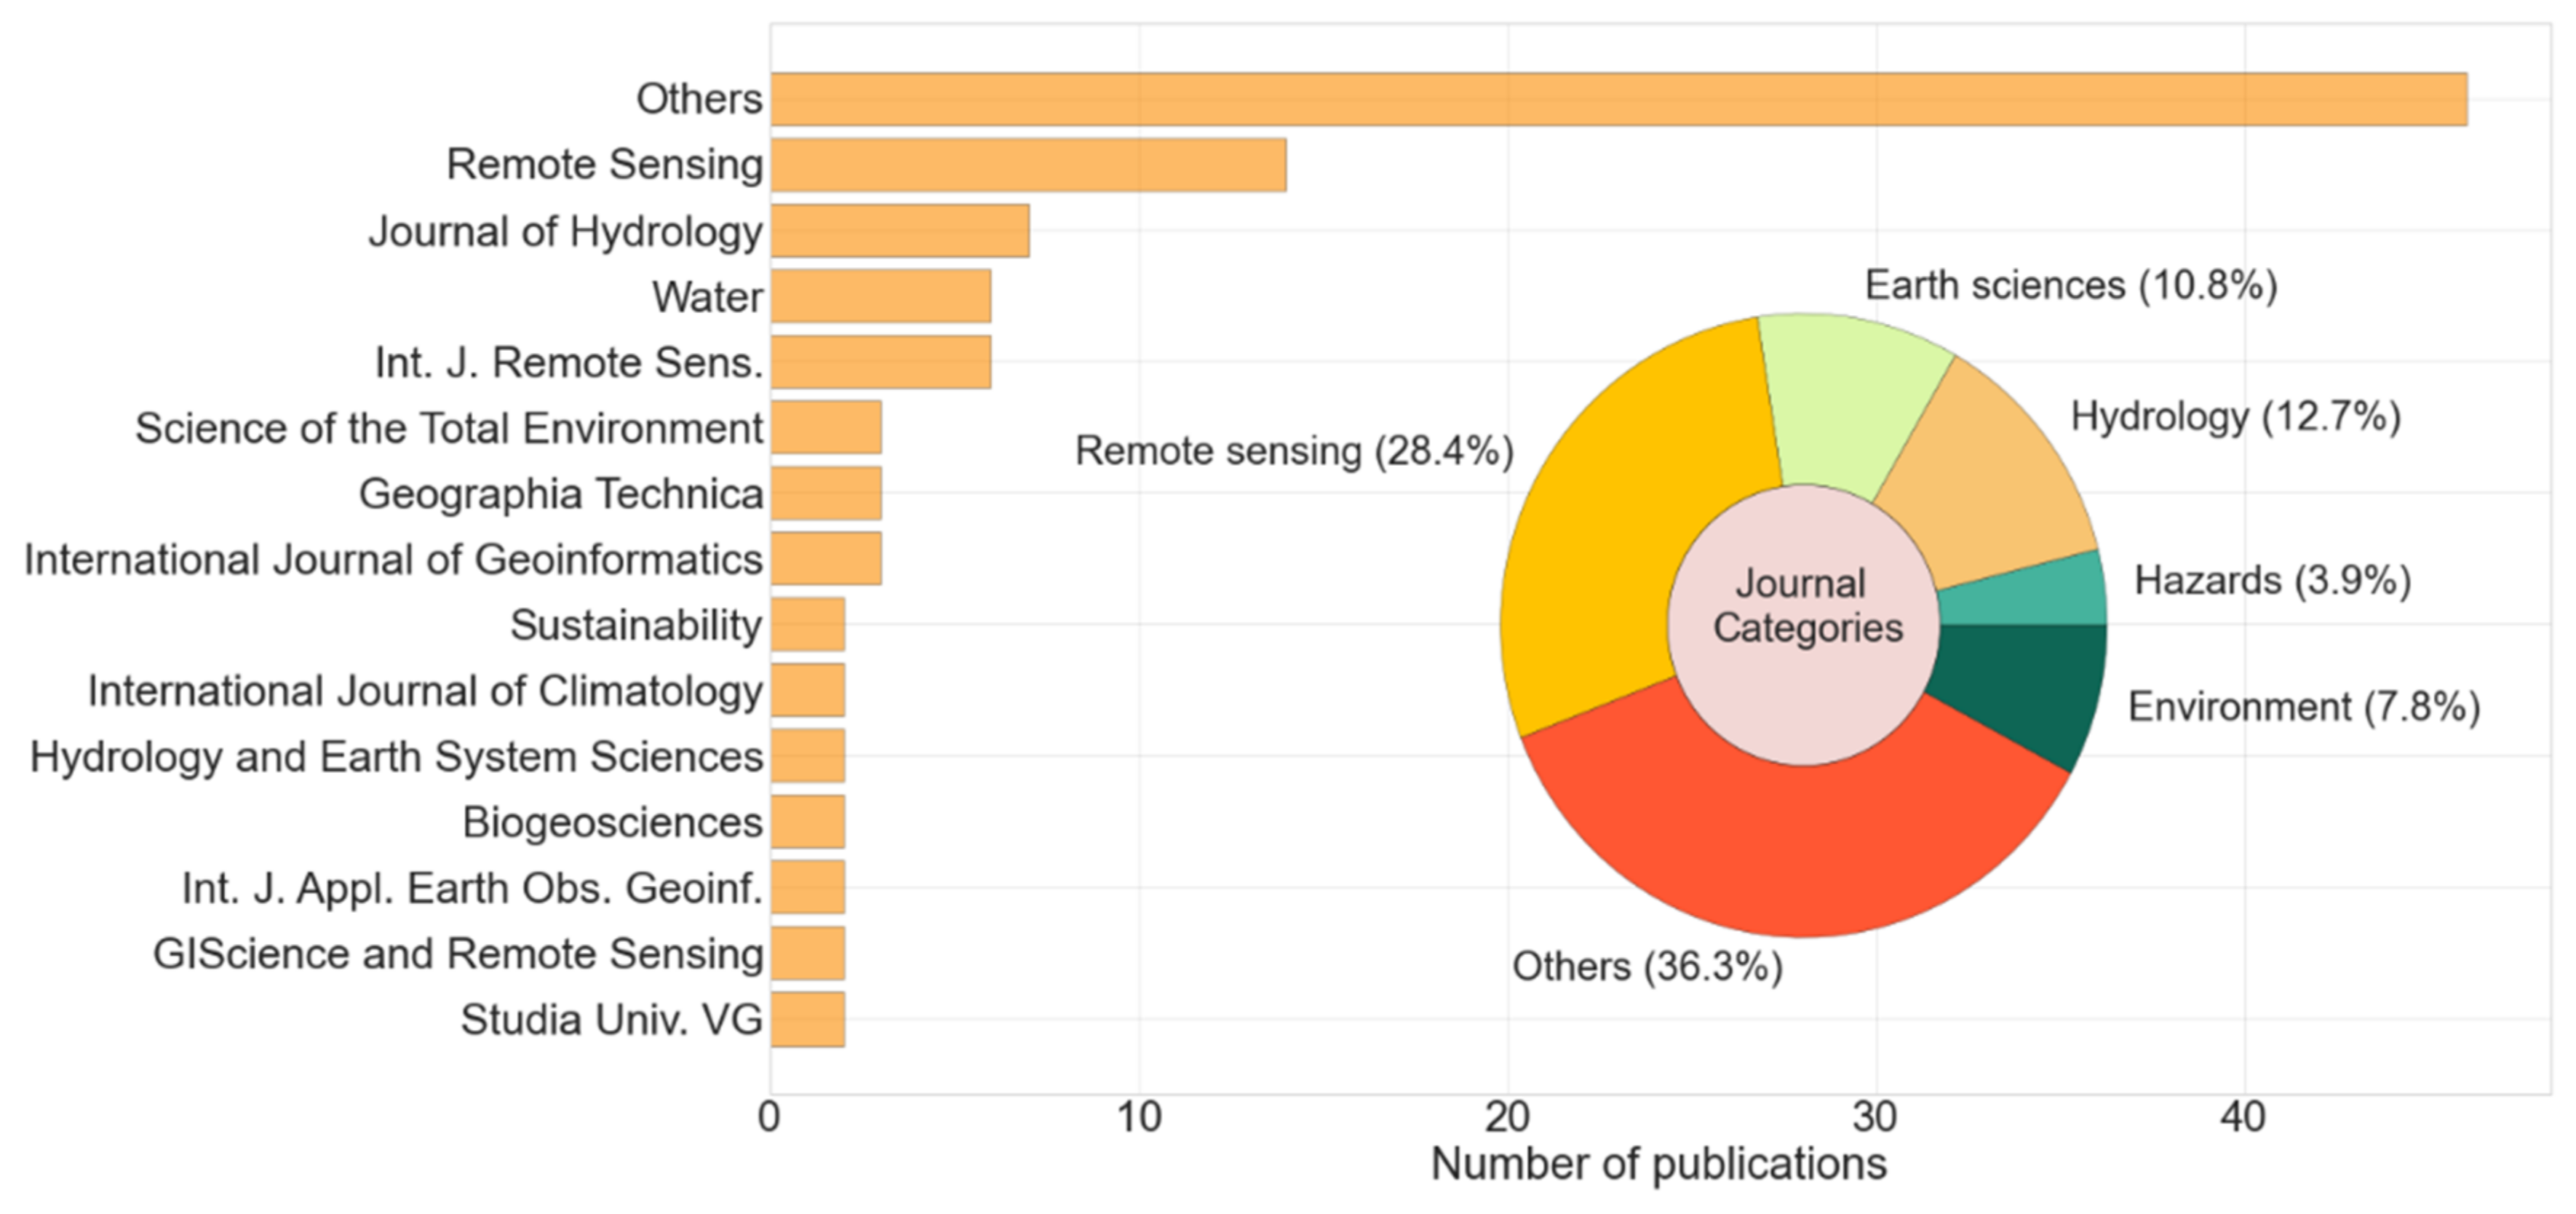
3.1.1. Temporal Progress and the Journal of Drought Publications

Southeast Asia is a subregion of Asia, and is home to nearly 680 million people. The majority of its population depend on agriculture and fishing, and with its prominent tropical climatic zones the region is one of the largest rice producers worldwide [43]. However, the region has experienced more frequent droughts in recent decades due to climate change and the ENSO (El Niño-Southern Oscillation) phenomenon [29], threatening its socioeconomic development, food security and the environment. Consequently, there has been a recent growing interest in drought research and impact assessment from national governments and academic institutions. Figure 3 shows the annual number of research articles dedicated to various drought monitoring methods and assessments in Southeast Asia over the past two decades. It is noteworthy that the majority of the studies were published within the last 5 years, accounting for nearly 80%.
Before the El Niño 2015–2016 event, there was a small number of drought articles reported, less than five articles per year, and some years were even observed with an absence of drought publications (e.g., 2005, 2007, 2010). However, drought studies has witnessed a substantial growth since 2016; the largest number of drought articles was reported in 2021, with 21 articles. It was observed that the El Niño 2018–2020 event caused the worst drought in the past two decades [44]. Most of the examined studies focused on agricultural droughts, followed by meteorological droughts. The year 2019 had the largest number of agricultural drought publications (14 articles), while meteorological droughts were the most reported in 2021 (Figure 3). Hydrological drought and forest-related fire drought received less attention, especially in the first 15 years of the 21st century.
Drought publications in Southeast Asia have been reported in 60 journals over the past two decades. Figure 4 presents the number of journals and their categories which are relevant to drought topics. The Remote Sensing journal had the highest number of drought publications from Southeast Asia, with 14 articles. The Journal of Hydrology was ranked second, with seven articles, while there were six articles each from Water and International Journal of Remote Sensing. The “others” with only one article per journal (e.g., Remote Sensing of Environment) had 46 publications, and the remaining journals reported two to three drought publications from Southeast Asia (Figure 4). In addition, we classified all of the reported journals into six categories, as shown in the pie chart (Figure 4). There were about 28.5% and 10.8% of the journals in the remote sensing and Earth science categories, respectively, whereas the hazard and environment journal categories were the least reported. The category “others” in the pie chart indicates journals with only one or two publications, and its scope lies outside of the pre-defined categories. Nearly 36.5% of the journals are reported in the “others” category. Overall, the majority of the drought articles in Southeast Asia were published in non-remote sensing journals and categories between 2000 and 2021.

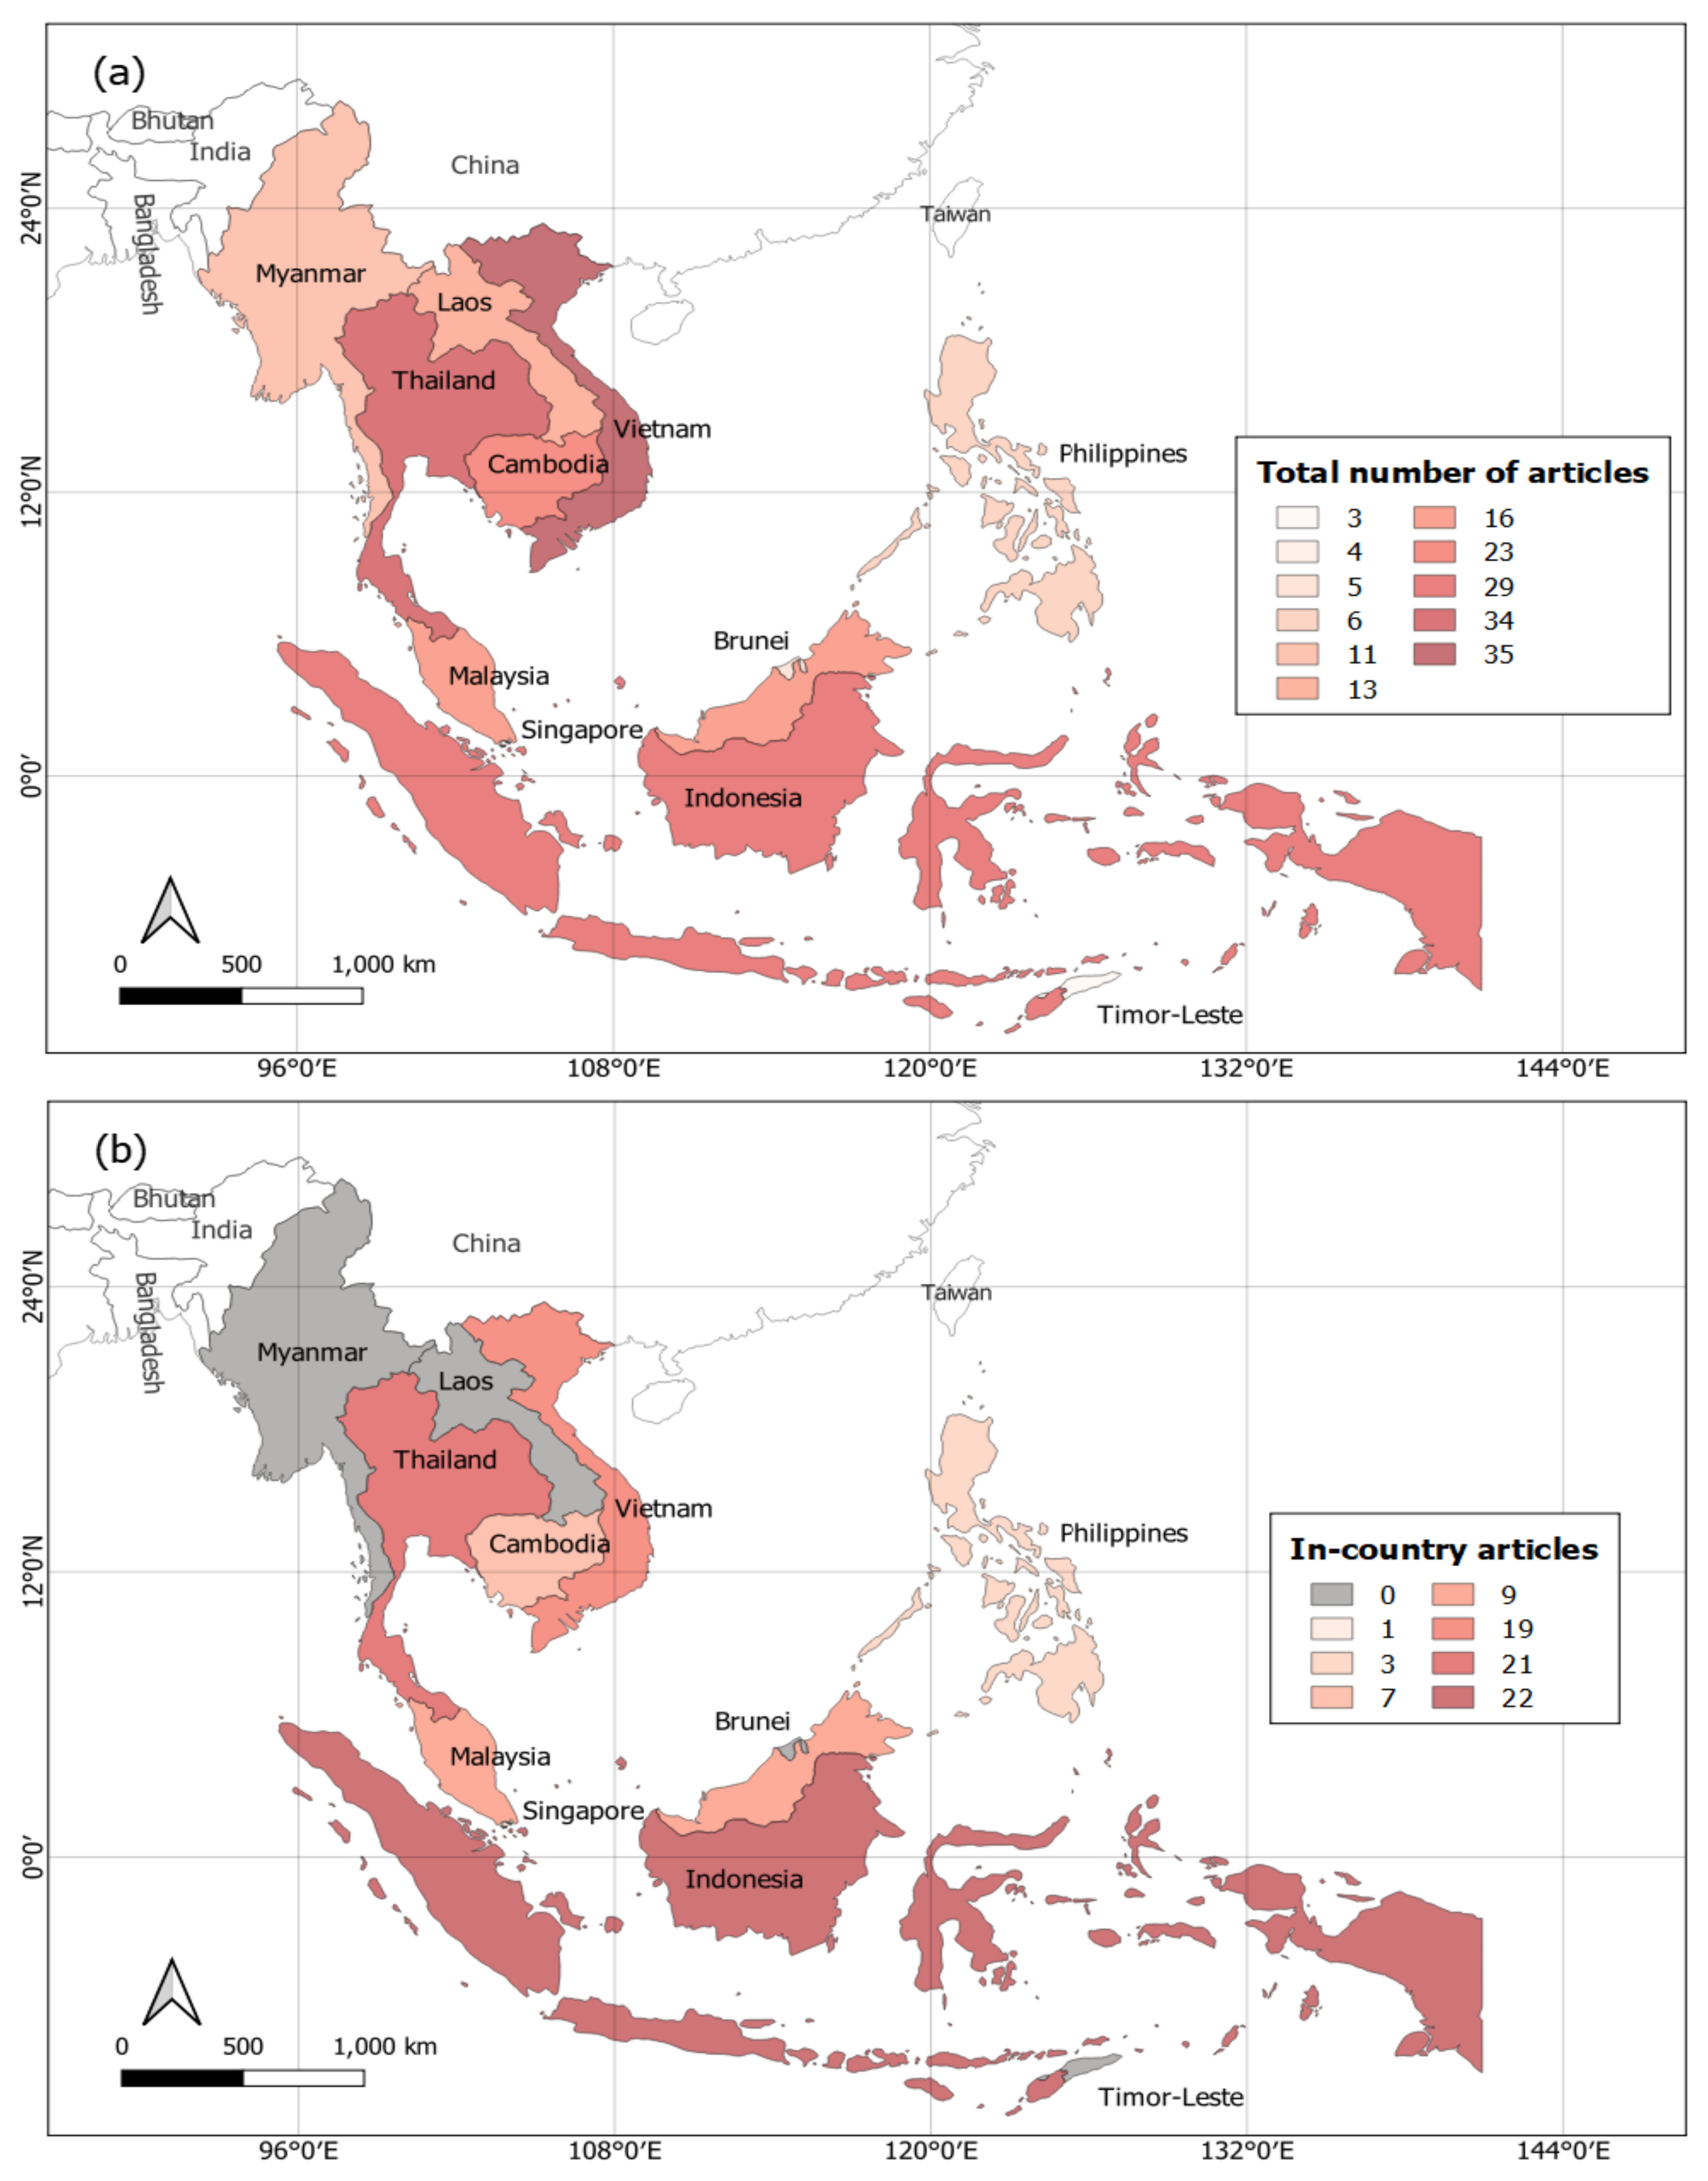
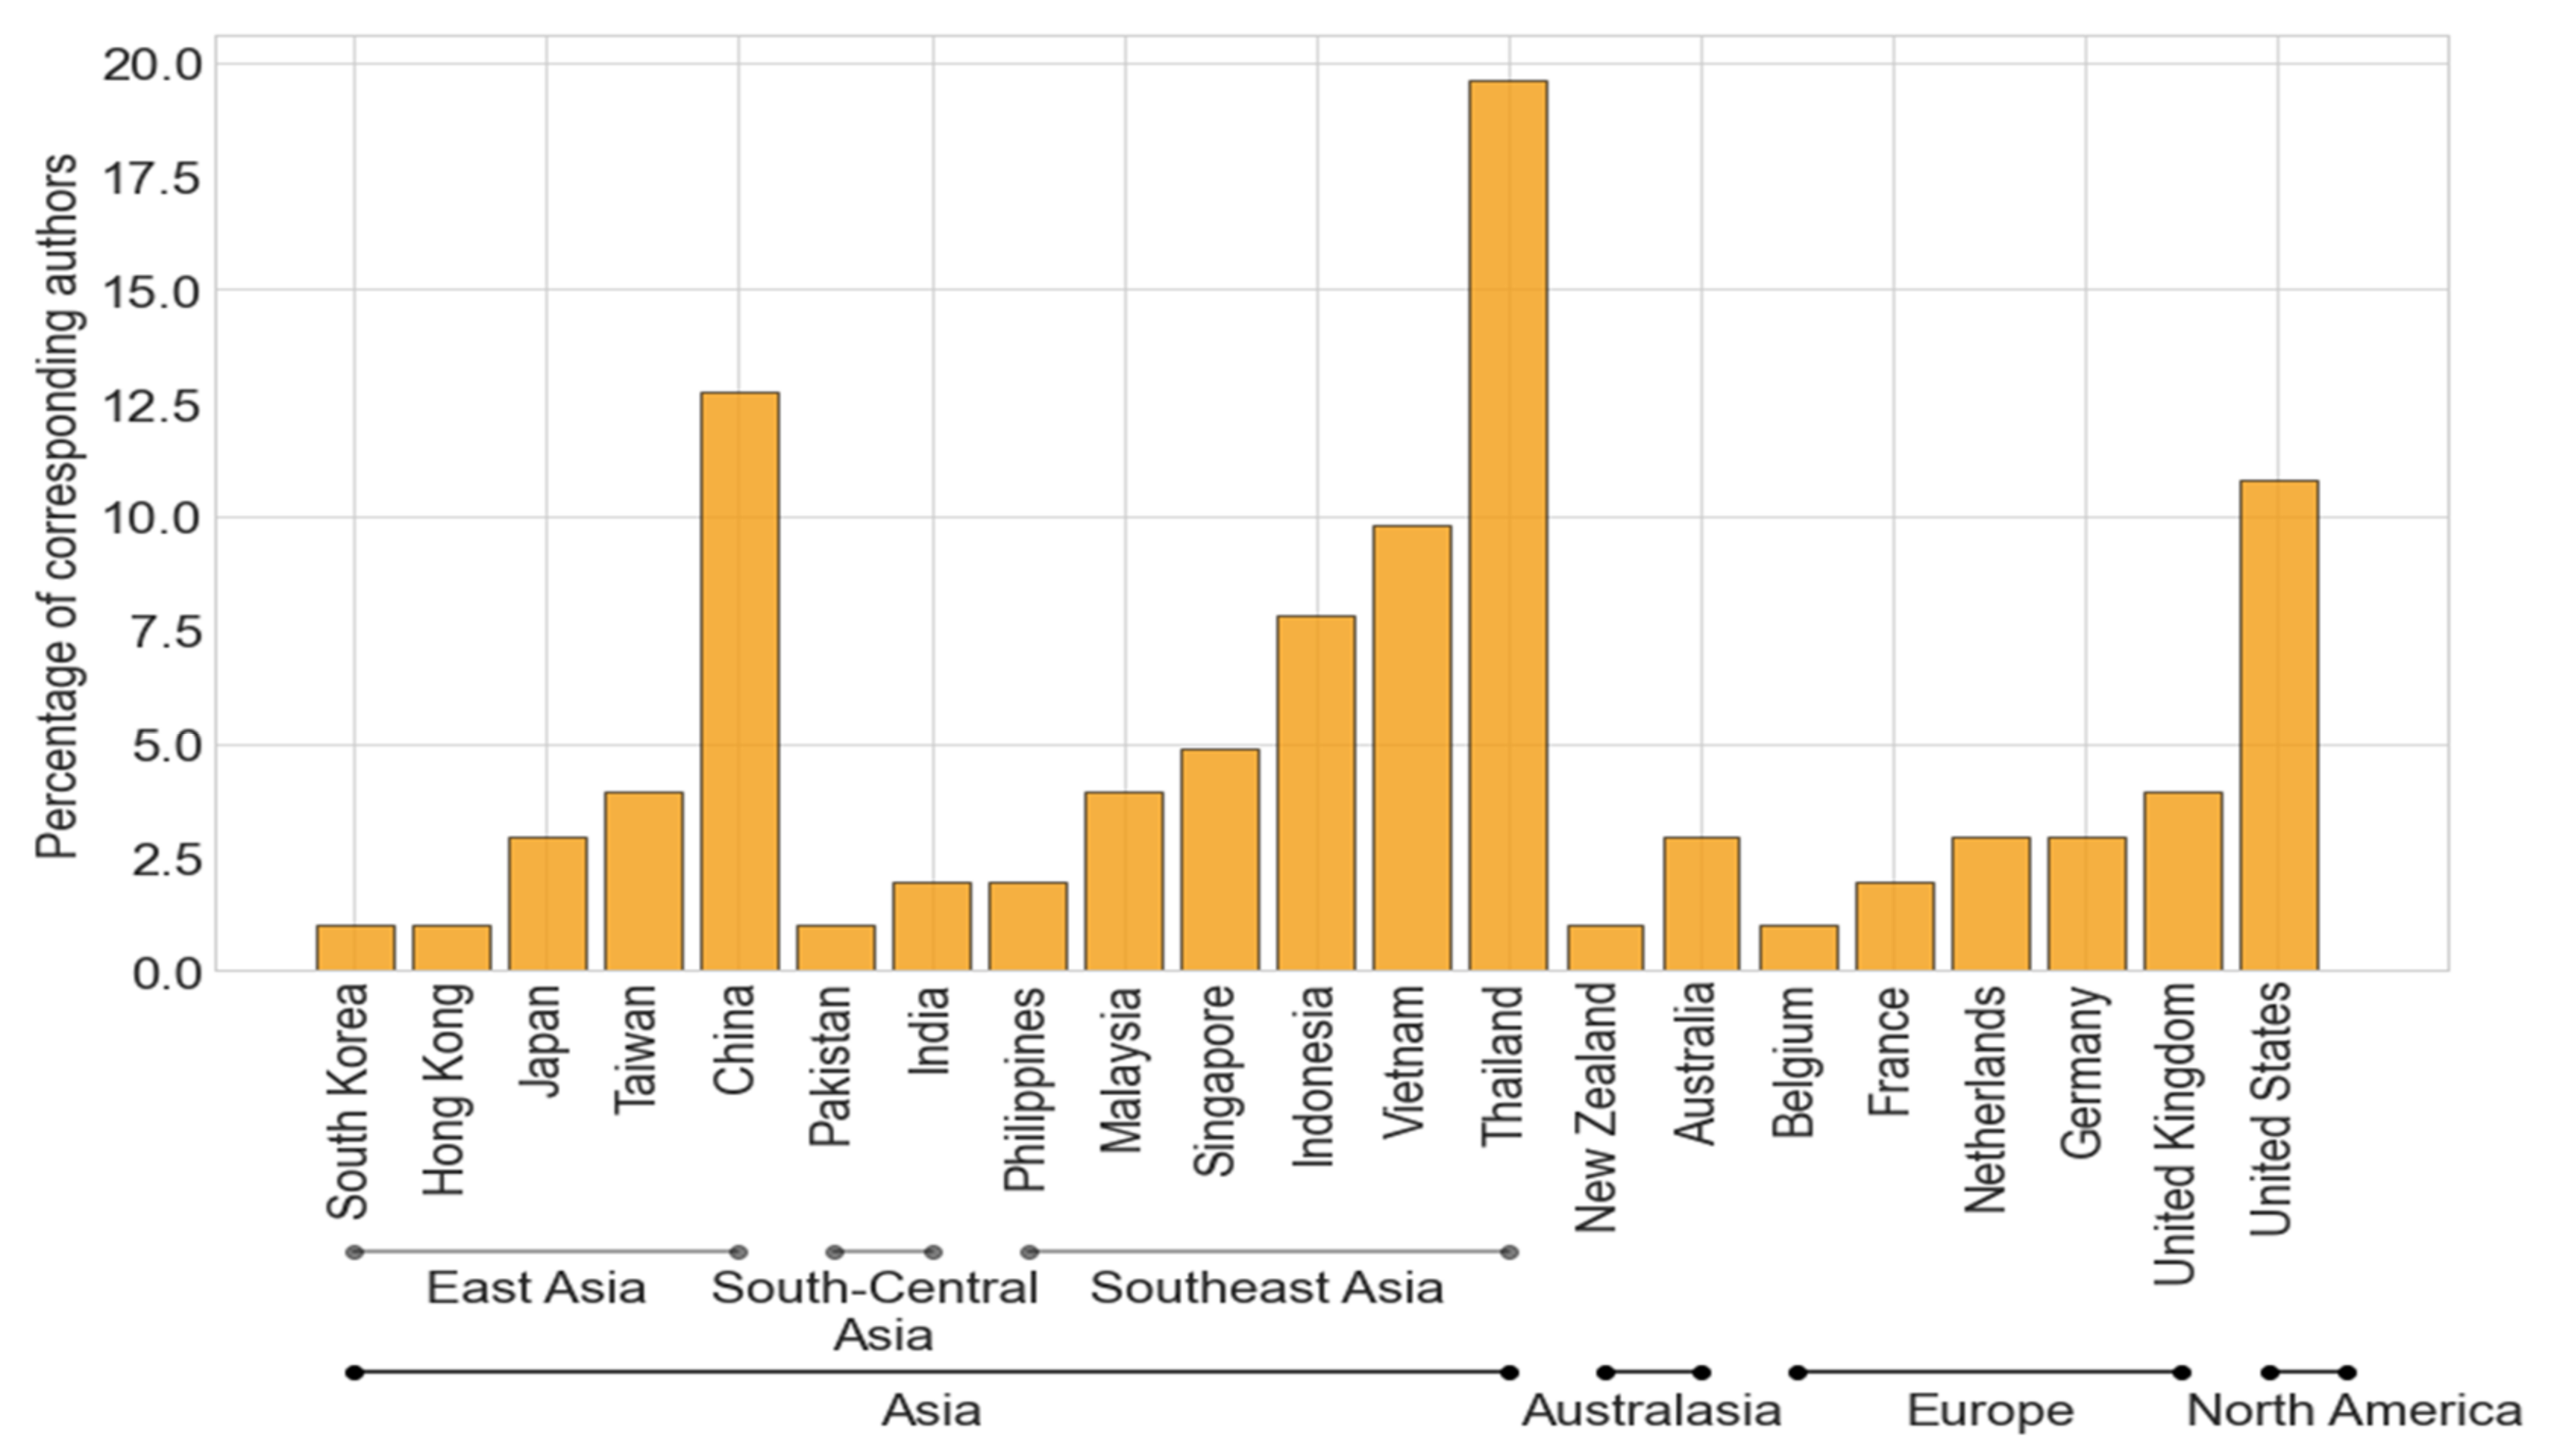
3.1.2. Spatial Distribution and Authorship of the Drought Publications

Droughts in Southeast Asia have been monitored and assessed at various spatial scales depending upon their characteristics and impact levels (e.g., drought severity and duration). This review considered the examined studies at two different spatial scales, namely within-country and transnational studies. The within-country/local studies were concerned with drought monitoring and/or assessment within the local administrative boundary of a country (e.g., provincial and national studies), while the transnational scale refers to the studies undertaken in two or more countries within the region (e.g., studies conducted in Vietnam and Thailand or mainland Southeast Asia). Figure 5 presents the number of drought publications produced within the boundary of a country and across countries.
Southeast Asia has been observed to have discrepancies in drought publications among countries and subregions. Figure 5a shows that the majority of drought studies were undertaken in mainland Southeast Asia, accounting for nearly 65%. Vietnam has become the most active destination of remote sensing-based drought studies, with 35 papers, and Thailand is ranked second (34 articles), whereas Brunei, Singapore, and Timor-Leste had the lowest number of drought studies over the past two decades. Without considering transnational studies, Indonesia had the highest number of drought studies (22 papers), followed by Thailand (21 articles). Vietnam is ranked third, with 19 articles (Figure 5b). Noticeably, there were no local or national drought publications based on EO products found in Myanmar, Laos, East Timor, and Brunei from the literature search over the given period (Figure 5b). Other countries, such as the Philippines and Cambodia, published less than eight articles, although they experienced several severe droughts of which the impact strongly damaged crops [34,45,46]. Overall, nearly 40% of drought studies were conducted in Vietnam and Thailand, including local and transboundary studies.
In this framework, the institutional affiliation of the study’s corresponding authors was taken into consideration, as this information can provide critical insights into remote sensing satellite-based drought research capacity in the region. Figure 6 illustrates that the highest percentage of corresponding authors came from Thailand (19.23%). Although mainland Southeast Asia had the largest number of drought articles, there have been no corresponding authors associated with institutions from Myanmar, Laos and Cambodia. Interestingly, nearly 24% of the corresponding authors who published drought articles in Southeast Asia had affiliations with academic institutions from China and the United States of America. Furthermore, nearly 13% of the corresponding authors who contributed to Southeast Asian drought publications were from European institutions. In short, it was observed that more than half the drought publications (~52%) in Southeast Asia were undertaken by corresponding authors from foreign research/academic institutions.

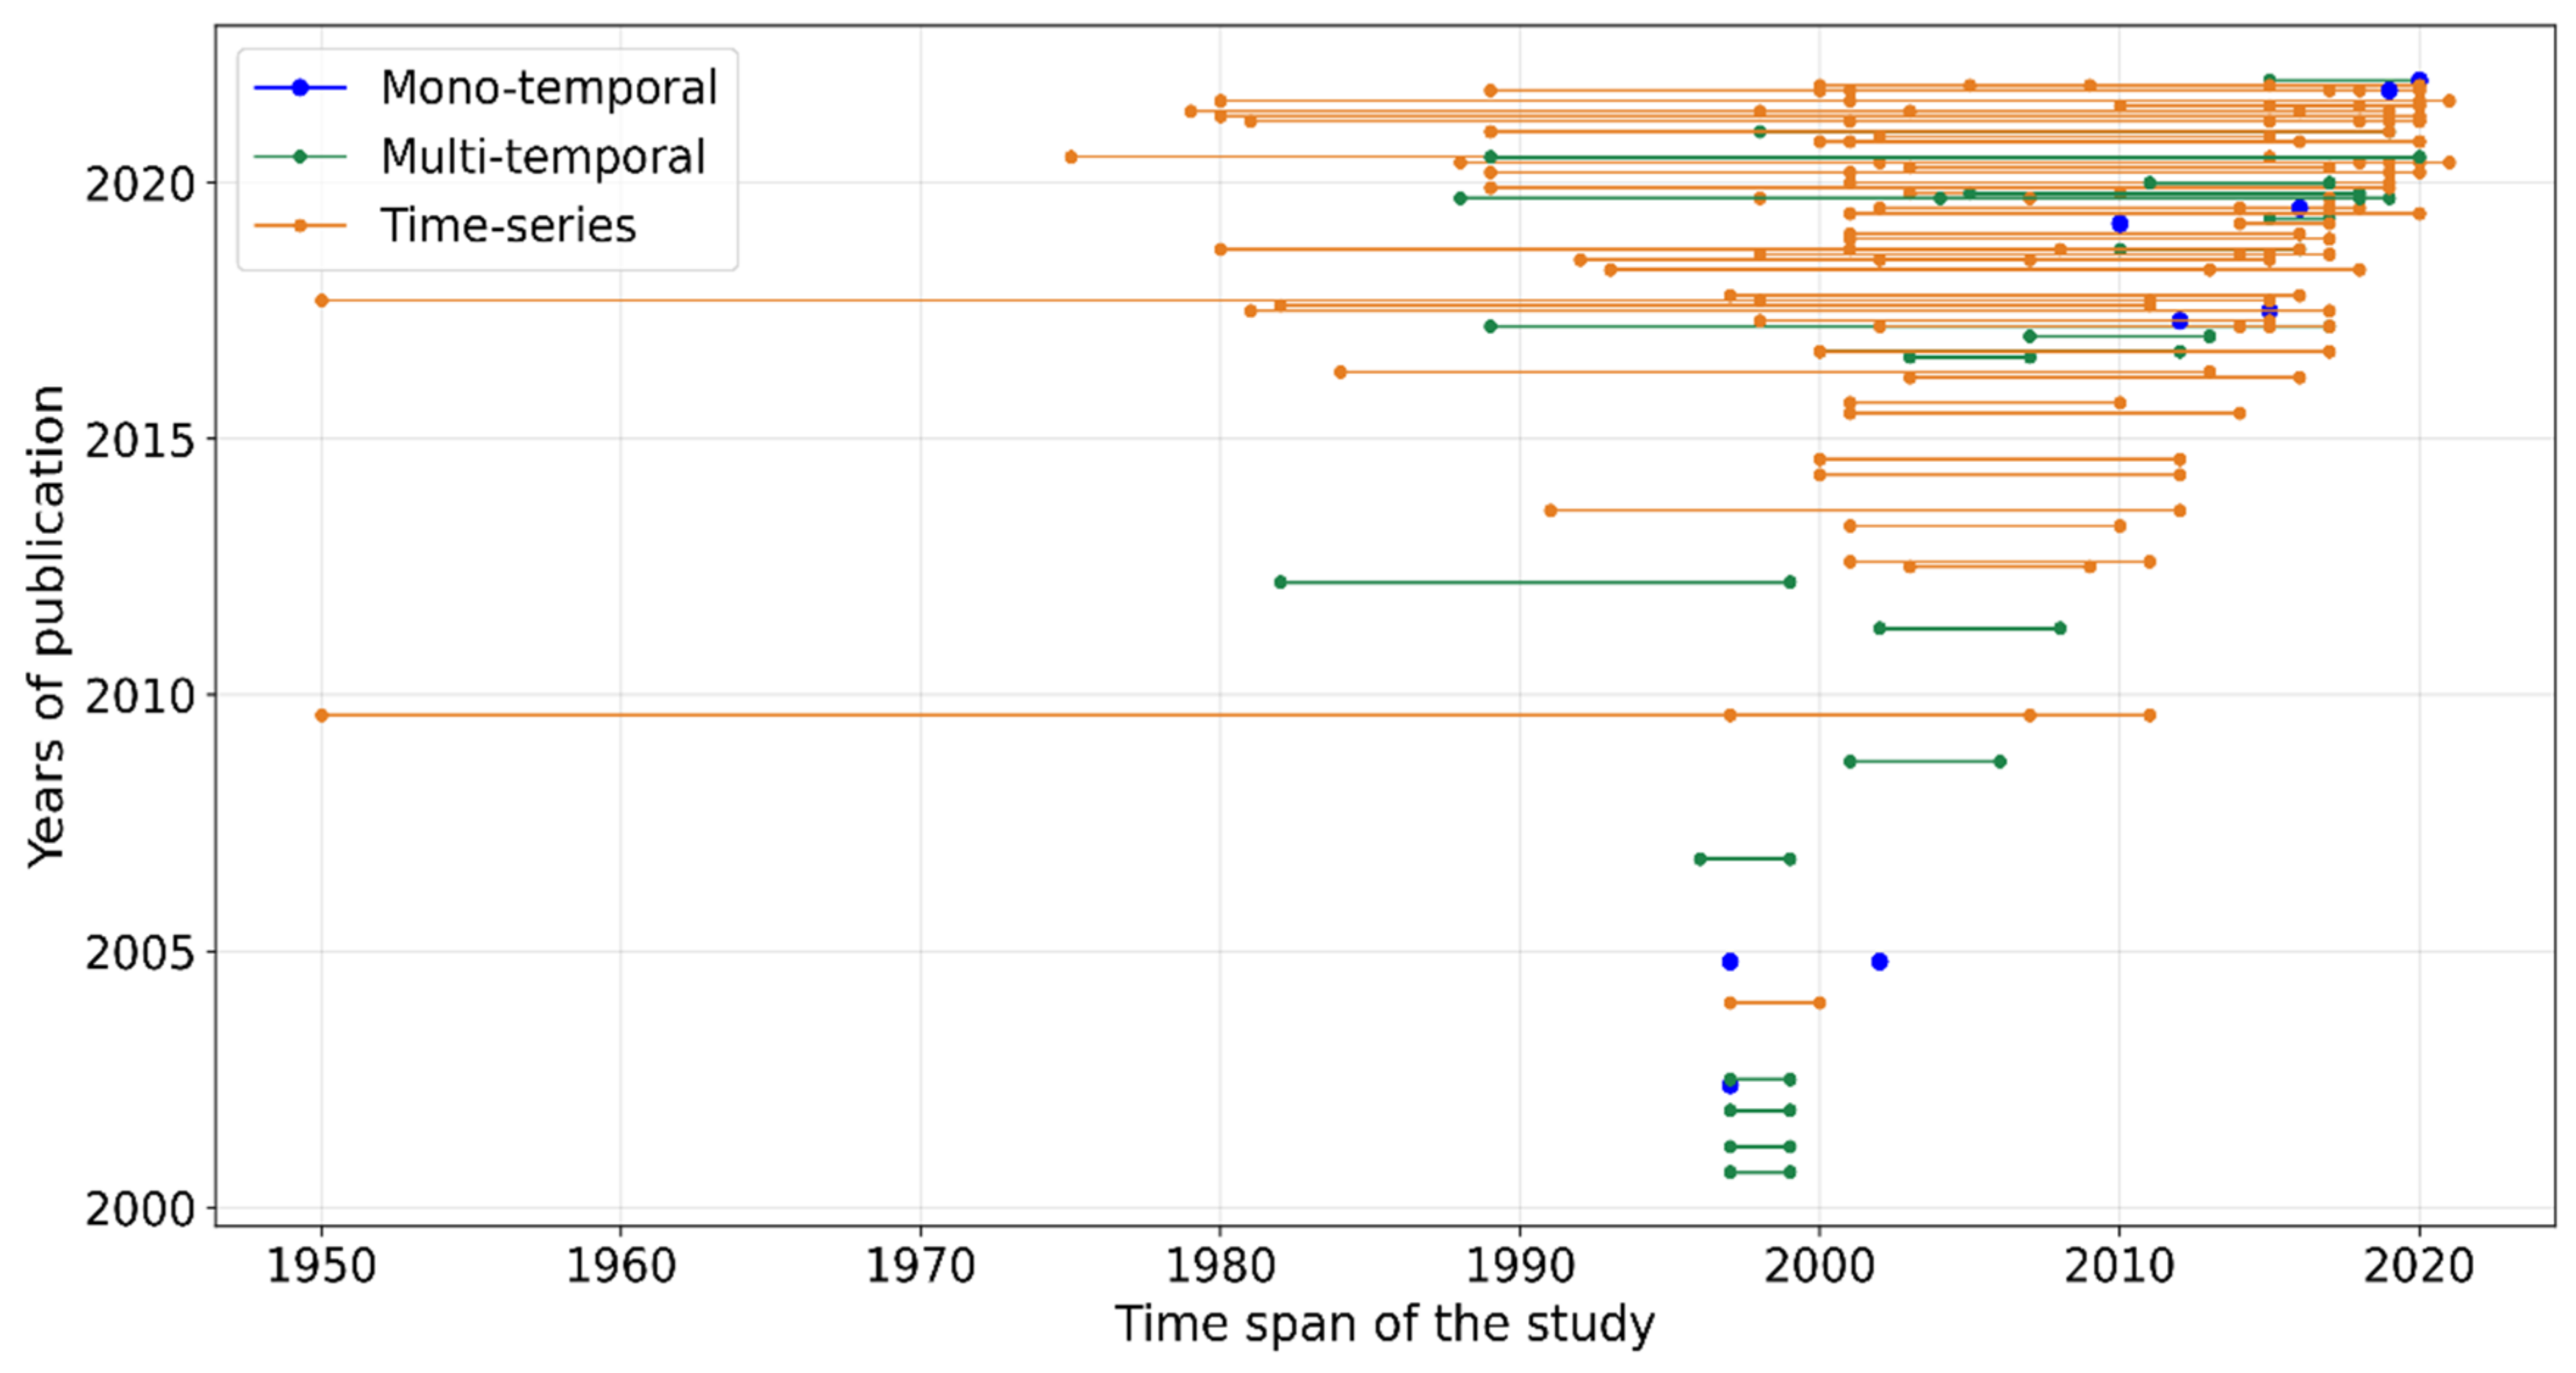
3.1.3. Temporal Resolution of the Drought Publications

The satellite missions started in the 1970s (e.g., the Landsat program), and today remote sensing data are increasingly accessible in drought research, especially through the availability of multi-sensor products [30,47,48]. However, there is little information on the temporal resolution of drought studies over the past two decades in Southeast Asia. Here, we classified the examined studies into one of the three categories (mono-temporal, multi-temporal, and time-series). The mono-temporal resolution includes studies performing single-date drought analysis, time-series means regular intervals over time, while the multi-temporal category considers studies performing drought analysis at several timesteps (e.g., multiple irregular years).
Figure 7 illustrates the frequency of drought publications regarding their duration. The majority of the past drought studies in Southeast Asia employed multi-temporal and time-series remote sensing data, whereas single-date analysis was the least reported, accounting for 8.8% over the past two decades. It is remarkable that there were only two time-series drought studies before 2010, and this figure increased significantly in recent years. For example, the past 5 years have seen considerable growth in the number of time-series drought articles, an increase of 10.7%. The time-series drought publications were the most reported in 2021 (25%), and the multi-temporal analysis was primarily published in 2019, accounting for nearly 24%. By contrast, the mono-temporal analysis dropped by 2.9% over the past 5 years. With the increasing availability of multi-sensor remote sensing data, time-series drought publications are likely to continue to dominate the region.
The EO satellite-based time-series duration is another key factor in understanding drought trends and patterns. This review investigated the duration of the remote sensing data used in drought studies across Southeast Asia. Although there has been growing interest in time-series drought monitoring and assessment in the region, the number of long-term drought studies (e.g., greater than 30 years) was limited. The results showed that nearly 90% of the drought studies harnessed geospatial data over less than 30 years (Figure 7). The mean duration of time-series drought studies was 18 years, while this figure for the multi-temporal analysis was less than 7 years. Noticeably, there were two studies investigating drought conditions over more than 50 years [49,50]. Overall, recent years have witnessed an increase in the number of drought studies with longer periods of time, as well as denser time-series data (Figure 7).

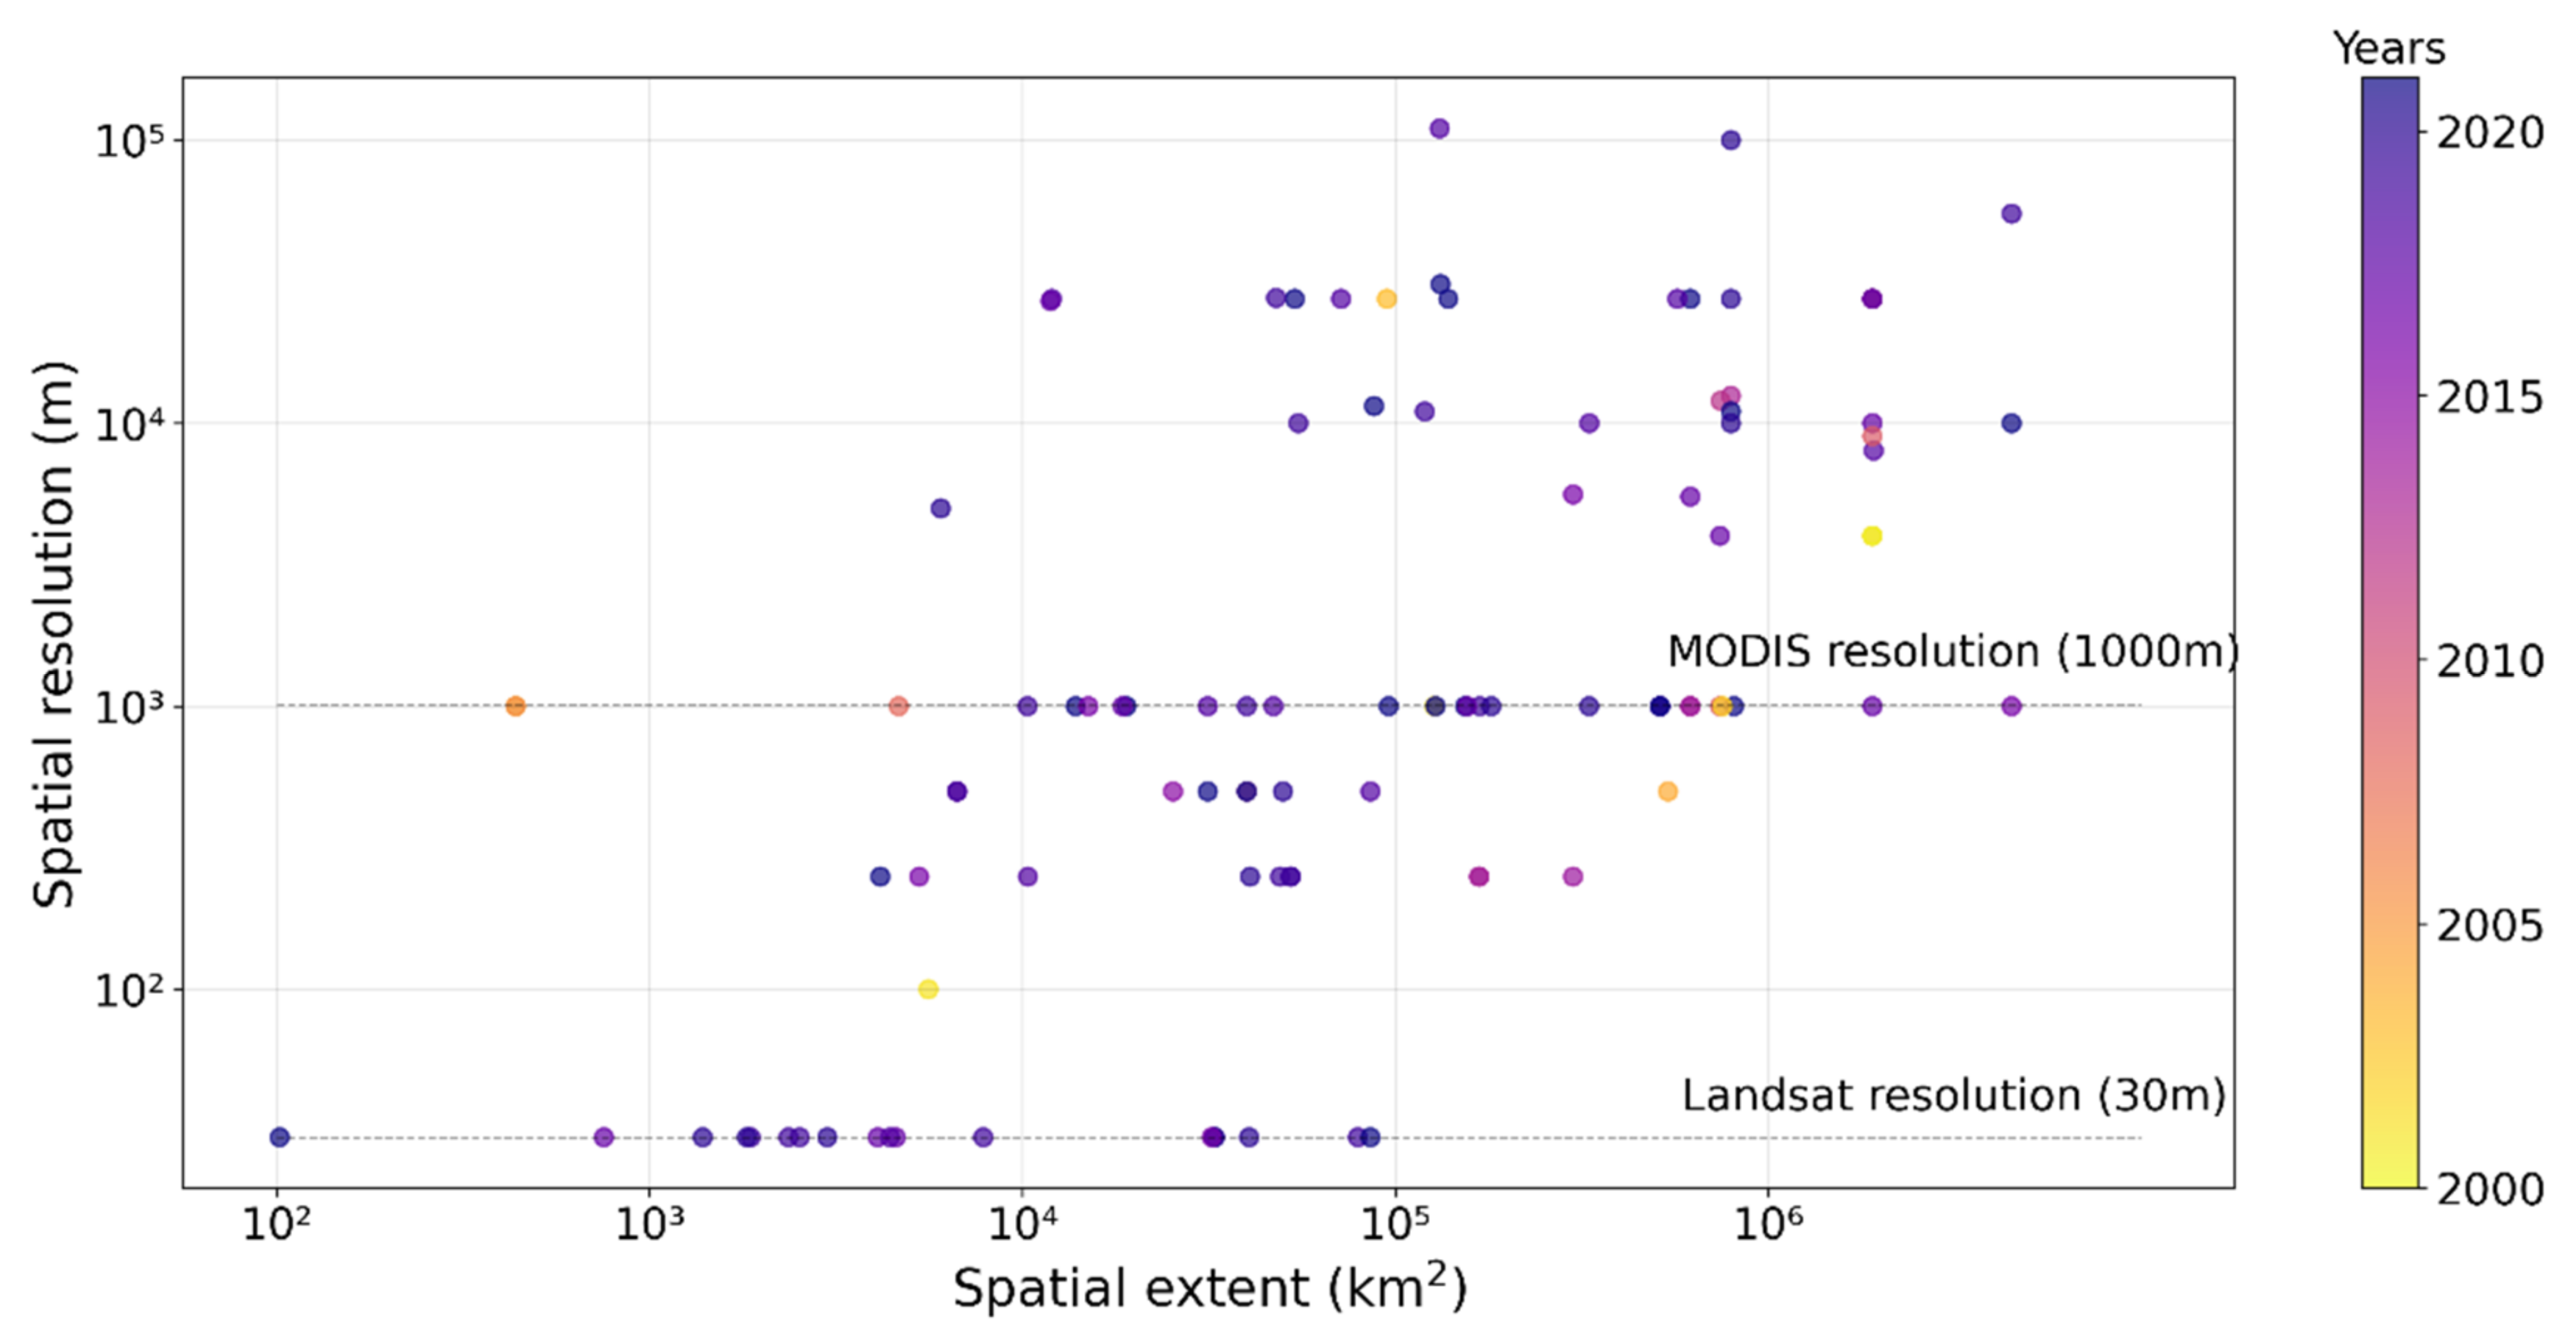
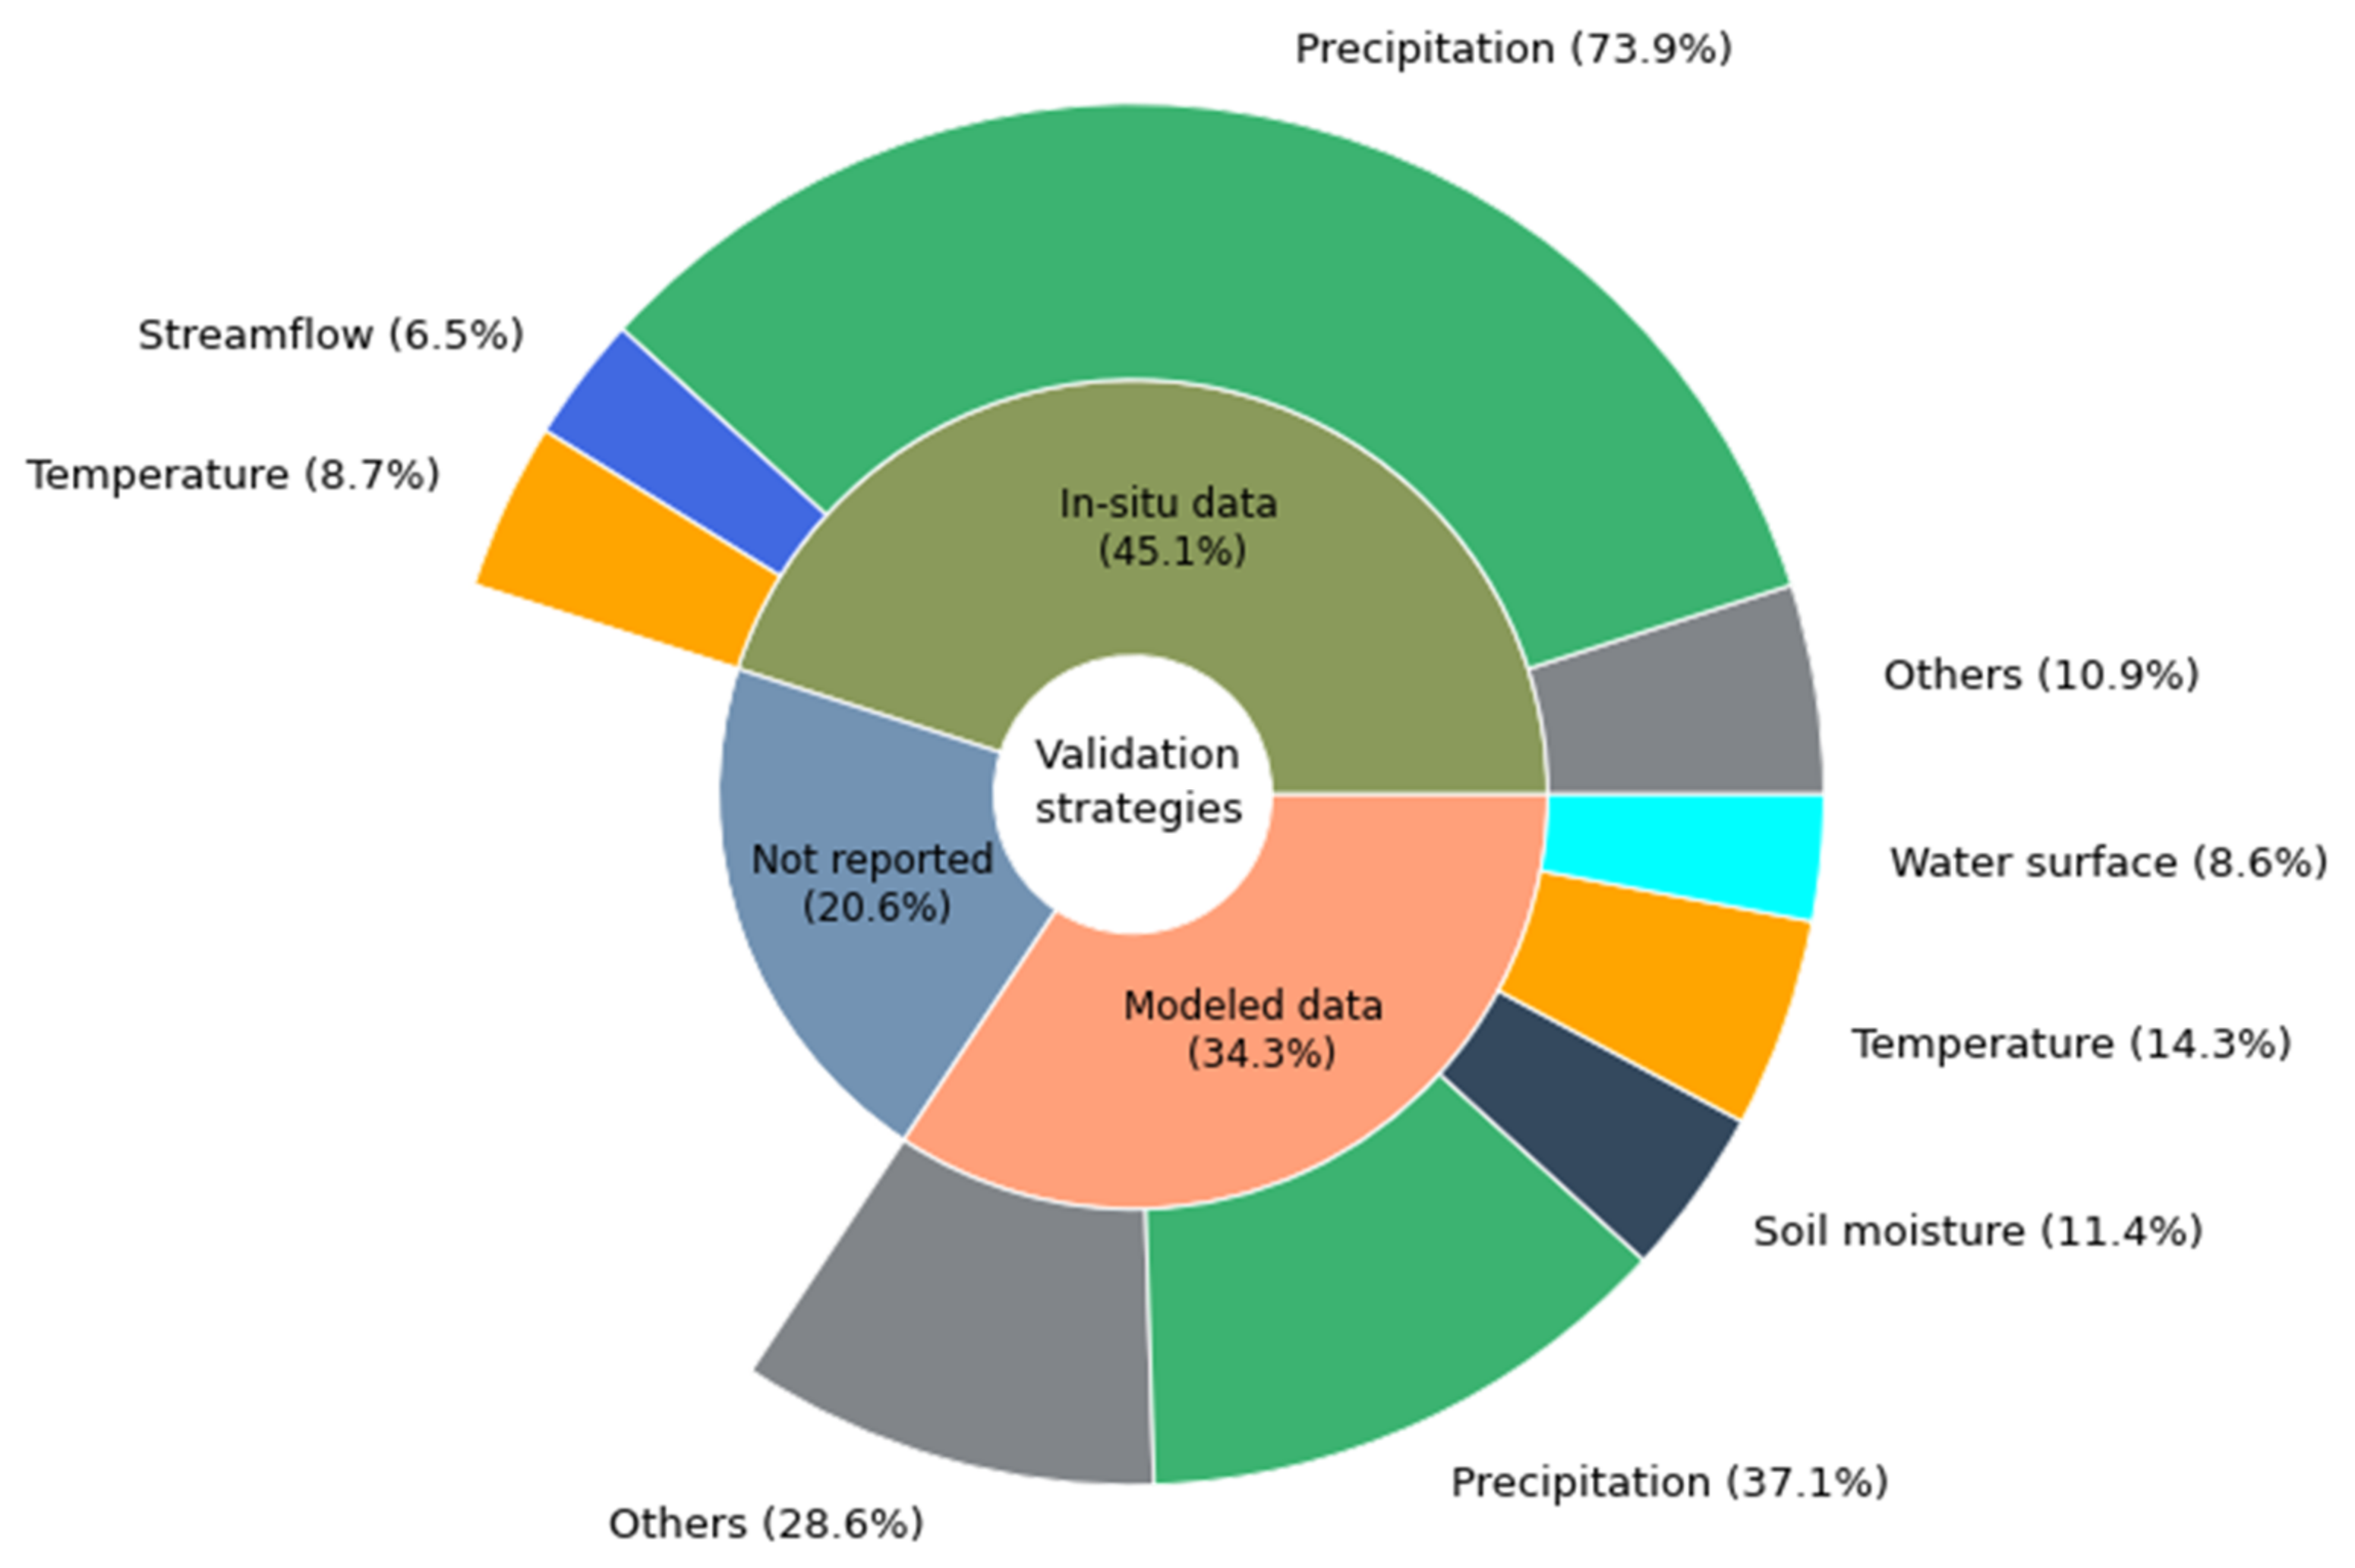
3.1.4. Spatial Scale, Resolution and Drought Validations

Drought monitoring and assessment products in Southeast Asia have been produced at different spatial extents and resolutions. Figure 8 demonstrates the relationship between the spatial extent and its spatial mapping resolution. The spatial extent varies greatly, from 100 km2 (at local scale) to more than 4 million km2 (at regional scale), while the map spatial resolution ranged from 30 m to approximately 110 km. Because drought events usually impact large areas, a coarser resolution is a choice of interest. It can be observed that there is a positive tendency between the produced map resolution and spatial extent. The larger the study area is, the coarser the spatial resolution of the map produced (Figure 8).
Over the past two decades, the majority of the drought studies in Southeast Asia employed a relatively coarse spatial resolution. For example, nearly 64% of the drought digital maps were produced at a spatial resolution of 1 km and above, whereas only 20% of the publications had a spatial resolution of less than 100 m. It can be observed that more recent articles surveyed drought conditions at both low and high spatial resolutions, but the publications published up until 2010 mainly employed coarser spatial resolutions. Noticeably, there were two studies investigating droughts at a very low spatial resolution of ~111 km between 2018 and 2020, and they employed the Gravity Recovery and Climate Experiment (GRACE), a joint mission between NASA and the German Aerospace Center (DLR).
For the spatial extent, more than half of the publications were conducted in an area of above 100 thousand km2. However, considering regional and sub-regional extents, there were no publications reported to cover the whole region or mainland Southeast Asia at a spatial resolution of less than 500 m. In addition, most of the Southeast Asian countries’ areas range from 200 thousand to ~800 thousand km2, as can be seen from Figure 8: more than half of the drought publications were conducted at the local and national levels. There are only three publications covering every Southeast Asian country and four articles for the entire mainland Southeast Asian territory.
Another important aspect of the drought monitoring is the validation and uncertainty estimation report. These statistics provide a measure of reliability and accuracy in drought remote sensing mapping products. Figure 9 presents the various validation strategies and data sources to evaluate the map accuracy. As can be seen from Figure 9, most of the publications validated their drought products while nearly 21% did not report the accuracy assessment. More specifically, using in-situ data was the most frequent validation strategy to evaluate the drought products, accounting for 45.1%, while approximately 34.3% of the studies employed other/modeled strategies (e.g., available global and regional remote sensing-derived datasets) for validation. The choice of validated data varies greatly in the Southeast Asian drought studies, but primarily included precipitation, soil moisture, temperature, water surface extent, streamflow and others (e.g., fire events/areas and evapotranspiration). Among the reported data, precipitation was the most commonly used, accounting for 73.9% and 37.1% of the in-situ and modeled data respectively. Streamflow and soil moisture were the least-often used to validate the mapping products. The remaining validated data varied between 8% and 28%.

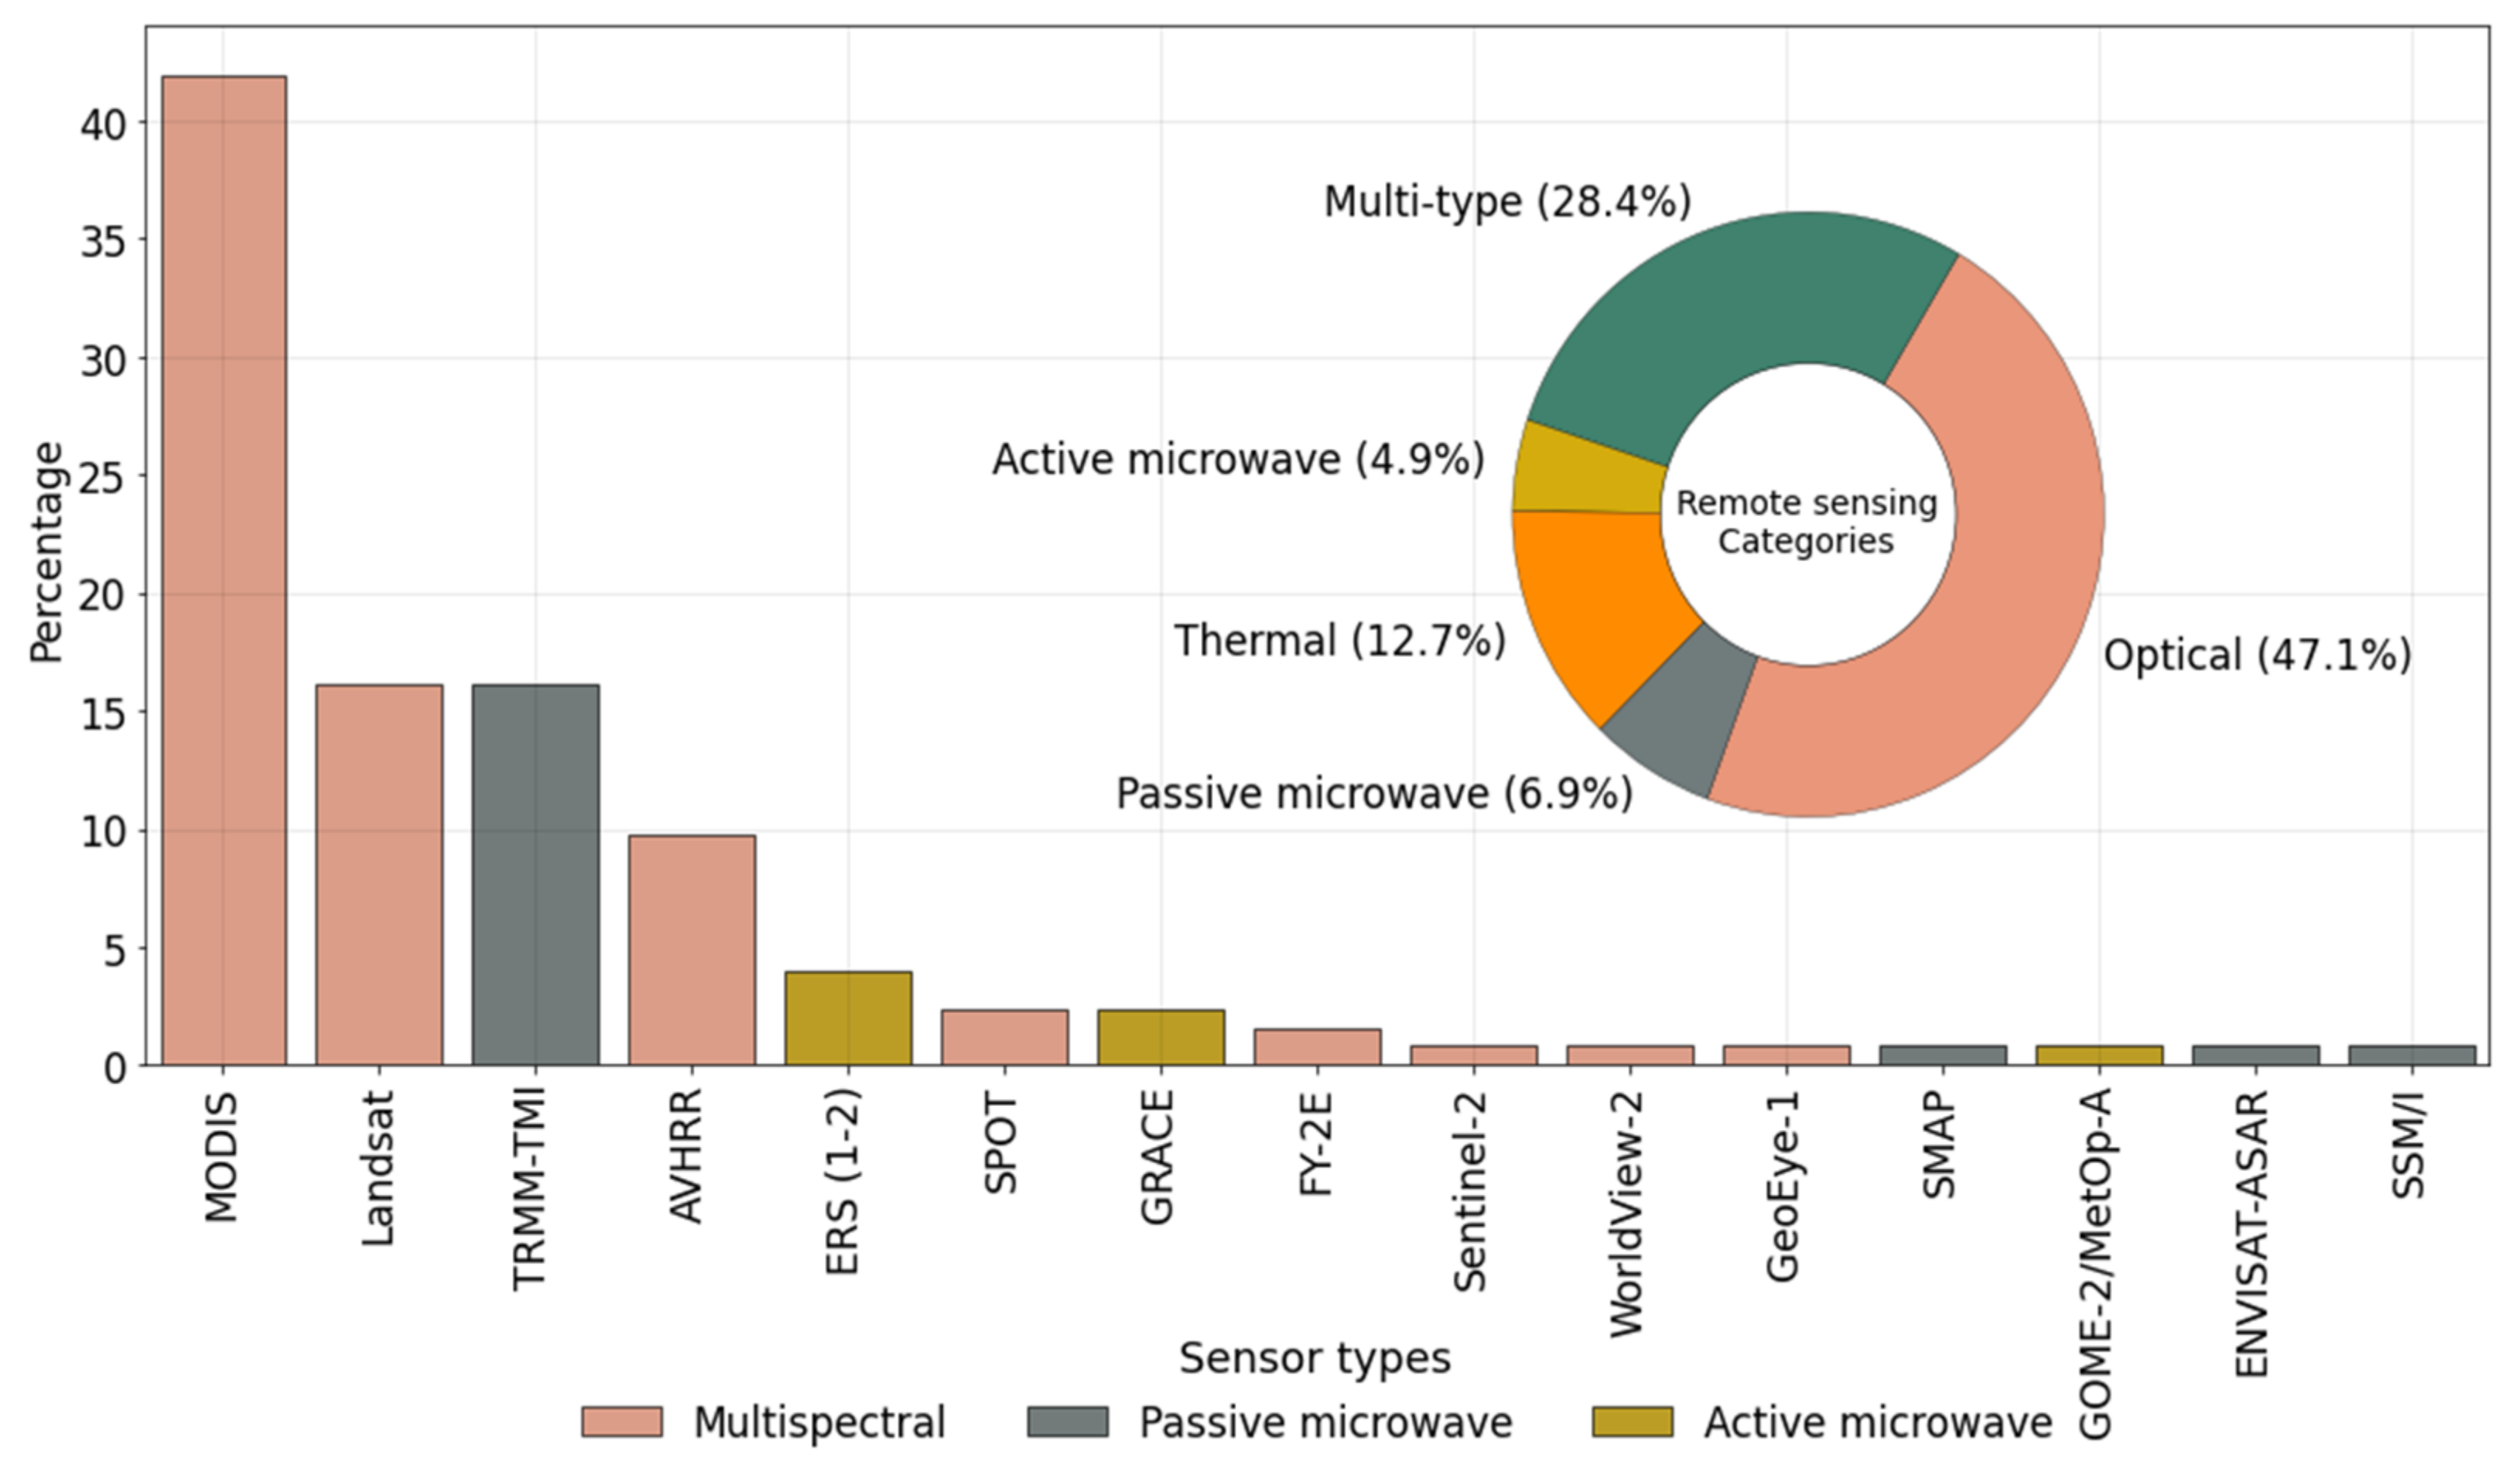
3.1.5. Satellite Sensors and Categories

Satellite remote sensing data have been increasingly available to support drought monitoring and assessment at various scales, from local to global. Over the past 21 years, many drought studies in Southeast Asia have employed various satellite sensors, including active microwave, passive microwave and optical satellites. In this review, we divided remote sensing sensors into three types, and further divided them into five remote sensing categories. Figure 10 presents the percentage of the employed sensors and remote sensing categories for drought mapping in the region. Overall, there were 15 satellite sensors reported with five different remote sensing categories. It is noted that although the SMAP is an active and passive microwave mission, we considered it a passive sensor, as its active counterpart malfunctioned in 2015 [51].
Among the reported sensor types, multispectral sensors were by far the most frequently use for drought monitoring and assessment in the region, and accounted for nearly 75%, whereas active microwave sensors were the least often used, at only 8.8% (Figure 10). The MODIS was the most reported sensor for characterizing and monitoring droughts (~42%), followed by Landsat (16.3%) and AVHRR (~10%). SPOT is ranked as the fourth sensor, with nearly 2.5%. The remaining multispectral sensors, including FY-2E (Feng-Yun -2E), Sentinel-2, WorldView-2, and GeoEye-1 were less often reported, at less than 2% each (Figure 10). Against the multispectral sensors, the frequency of active and passive microwave sensors for drought mappings in Southeast Asia was limited (less than 4%), save for TRMM (Figure 10).
Apart from the statistics of the individual satellite sensors and their types, this review considered five primary drought remote sensing categories. The pie chart from Figure 10 indicated that the optical remote sensing was the most frequently used source of data for characterizing and assessing drought conditions in Southeast Asia (47%), whereas passive and active microwave satellite products were reported as less than 7%. Multi-sensor remote sensing has gained popularity in recent years for the identification of drought-related phenomena [30]. In Southeast Asia, about 29% of the drought publications reported the use of a multi-sensor remote sensing approach. Thermal is another frequently used remote sensing category for drought characterization in Southeast Asia, accounting for nearly 13%. Together, multi-sensor and optical remote sensing made up three-quarters of the reported EO satellite categories in the region.

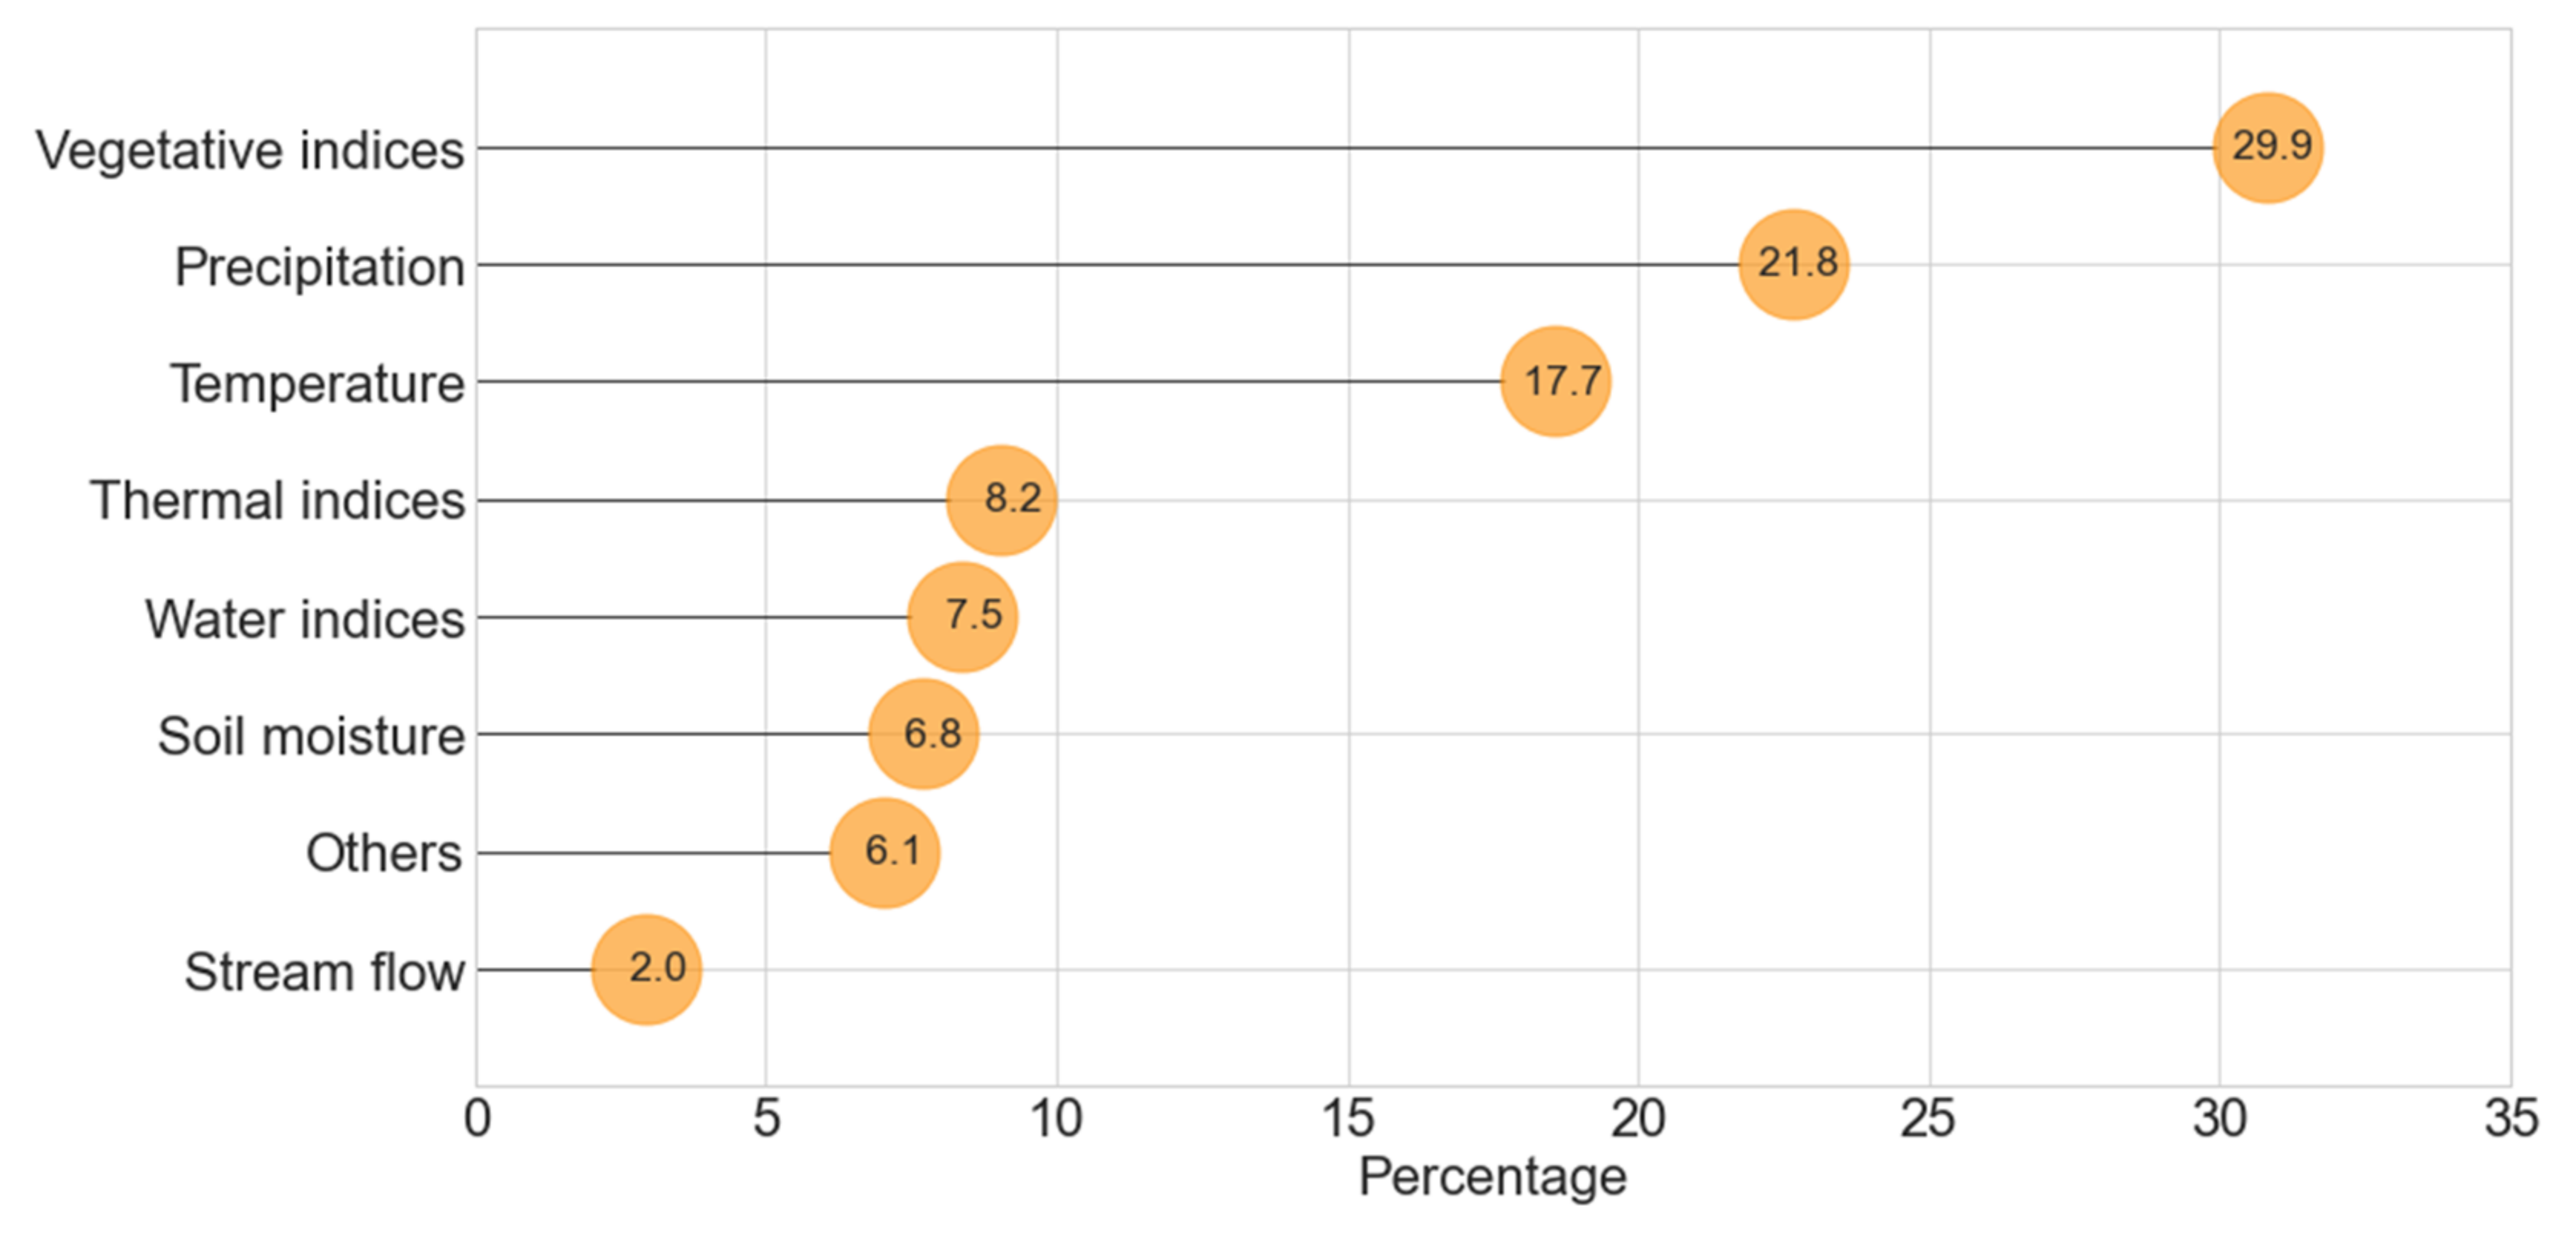
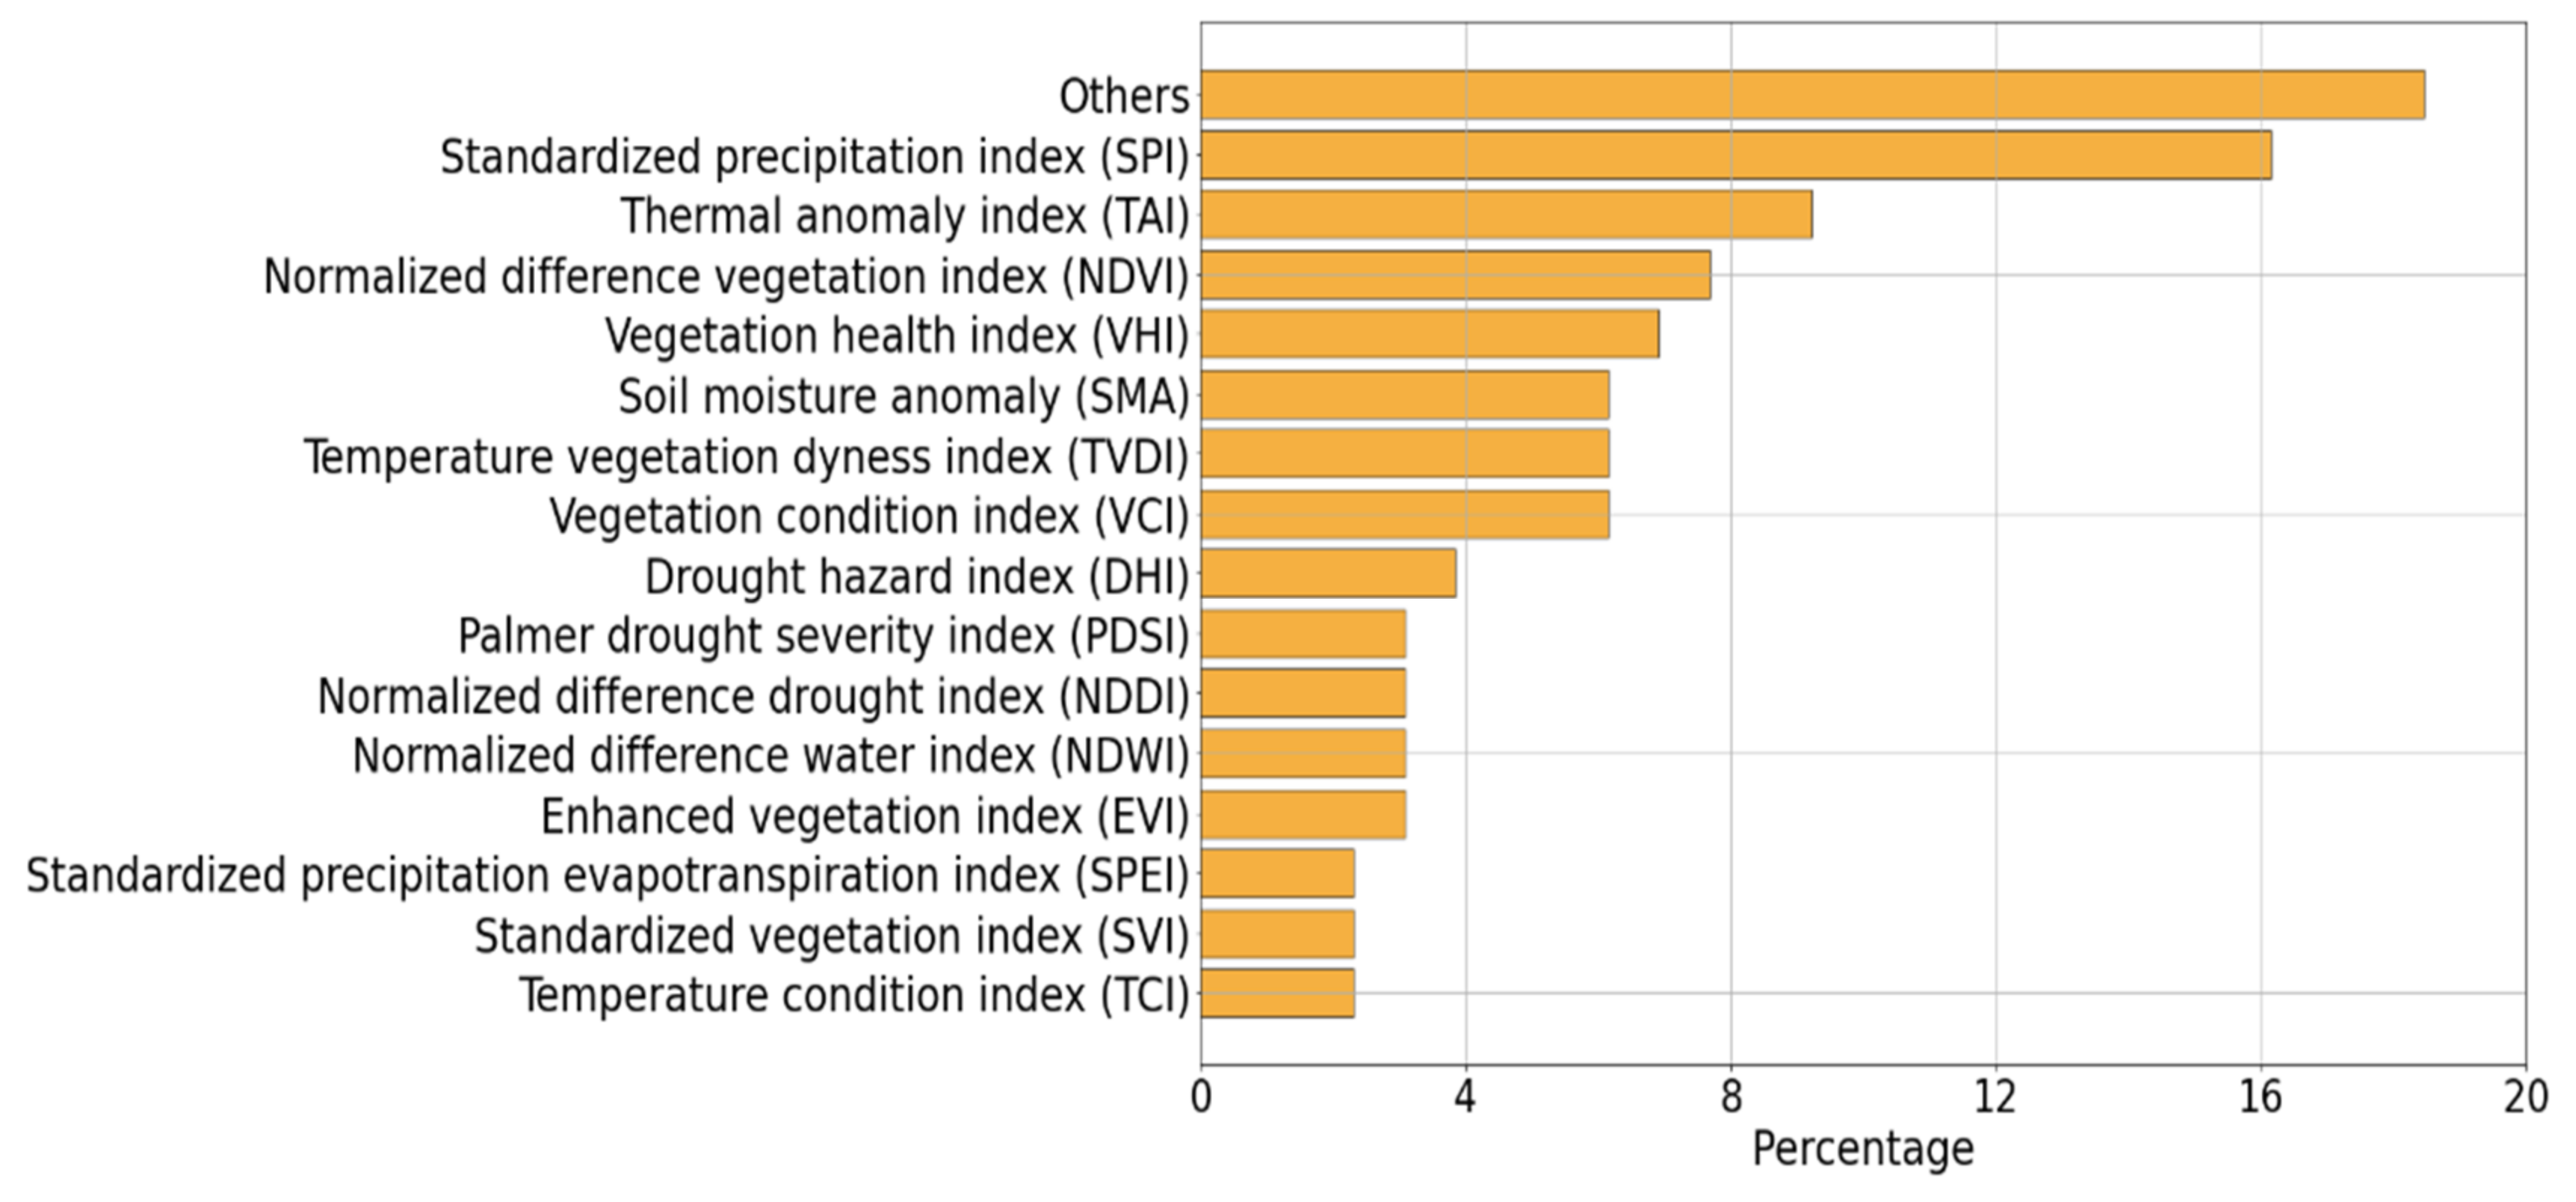
3.1.6. Remote Sensing-Derived Input Variables and Drought Indices

Given the diversity of remote sensing sensors and categories, drought information can be derived from a wide array of input variables. In this review, various remote sensing inputs and indices were taken into consideration. We categorized all of the derived remote sensing-based input variables into one of eight pre-defined groups, such as vegetative indices, precipitation, temperature, water indices, and thermal indices. Figure 11 presents the different input variables extracted from remote sensing measurements for drought monitoring and assessment in Southeast Asia over the past 21 years. Together, vegetation, temperature and precipitation accounted for nearly 70% of the input extracted variables for drought characterization and assessment.
Vegetation-related indices were most frequently used as drought indicators or inputs for the calculation drought indicators, accounting for nearly 30%, whereas streamflow-based indices received the least attention (2.1%). Precipitation and temperature play an important role in forming drought phenomena; hence, these input data have been frequently reported, at ~22% and 17.7%, respectively. Thermal indices ranked fourth among the input variables, with 8.2%. In addition, water indices and soil moisture contributed to drought mapping products by less than 8% each. The remaining input variables referred to as “others” (e.g., evapotranspiration and burnt area) in the pie chart accounted for 6.1% of the drought remote sensing in the region.
Based on remote sensing data, various drought indicators/indices have been developed and/or applied to characterize drought patterns and assess their impacts. Figure 12 presents the various drought indicators/indices used for drought studies in Southeast Asia. Among the reported individual drought indices, the SPI was by far the most commonly used index to detect drought severity in the region, followed by the Thermal Anomaly Index (TAI), which accounted for 16.1% and 9.2%, respectively. The Normalized Difference Vegetation Index (NDVI) ranked third, with nearly 8%. The “others” included drought indices/spectral information with a frequency of less than three, accounting for more than 18% of the reported indices. The remaining frequently used indices are reported as less than 7% each over the observed period (Figure 12).

3.2. The EO Applications in Drought Analysis

Remote sensing satellite data have become increasingly available, and provide rich information for understanding drought conditions and their impacts. In Southeast Asia, there has been a growing interest in drought remote sensing, and several drought-related topics have been explored. In this section, we classified droughts into one of the four categories, and then further categorized them into specific applications. For example, studies considered the characterization and assessment of droughts in relation to agriculture referred to “agricultural application”, but this broad application is further divided into multiple subcategories such as vegetation stress, soil moisture, land use change, crop stress and others. Vegetation can be broad, e.g., forest or grassland vegetation, but we group it into vegetation stress due to drought. Many studies use vegetation indices as a drought indicator to examine vegetation or forest drought, and we also consider them as vegetation stress. Figure 13 presents an overview of drought remote sensing applications and their subcategories in Southeast Asia over the past 21 years. From a broad application perspective, agricultural droughts accounted for the largest percentage, at nearly 58% of the reported applications, whereas wildfire-related and meteorological droughts were the least reported, with less than roughly 14% each. Hydrological droughts ranked second, with nearly 16%.
Given the diversity of drought applications in Southeast Asia, we considered the investigation of six thematic applications which cover the reported drought studies. They included soil moisture and crop stress, vegetation stress due to drought, drought-induced land-use/land cover changes, streamflow and water surface variability, forest-fired droughts, and meteorological droughts. The selection of thematic applications lies in the publications’ objectives and analysis. Some studies were found to characterize drought conditions on multiple thematic applications; hence, they considered various corresponding thematic topics. The following sections discuss the details of these thematic applications.

3.2.1. Soil Moisture and Crop Stress

Soil moisture drought (also known as agricultural drought) is the lack of moisture contents in soil, primarily because of precipitation deficit. The deficiency of moisture content in root zone layers can cause significant impacts to crops, and in the long run can reduce crop productivity or even lead to crop failure. Given the severe impacts of soil moisture deficiencies on crops, there have been several studies investigating agricultural droughts in Southeast Asia. Over the past years, nearly 18% of applications in the region have been devoted to the soil moisture droughts and crop stress impacts. Most of these studies were conducted in lower Mekong countries such as Thailand, Vietnam and Cambodia [36,52,53,54,55,56,57,58,59,60,61,62].
Remote sensing-based drought products have become a primary source of information to better understand the soil moisture variability in space and time, and its impacts on crops. In Southeast Asia, multispectral vegetation datasets were the most frequently used for soil moisture drought. In recent studies, MODIS time-series vegetation and land surface temperature were used to detect agricultural droughts and assess their impacts [52,53,54,57,63,64], whereas some other studies employed Landsat and/or Sentinel-2 time-series data [36,62,65]. Microwave sensors are the least often reported for soil moisture drought detection, and in fact there was only one study retrieving soil moisture information for potential drought evaluation [66].
Although there are some key crops (e.g., rice and maize) in Southeast Asia, rice is probably the most important crop. Hence, there were six studies devoted to the monitoring and assessment of rice droughts and/or their productivity [54,55,59,62,64,67]. For example, Son et al., 2020 [54] evaluated the drought conditions over Cambodian rice cropland from 2000 to 2019 based on the MODIS time-series vegetation health index (VHI), a drought composite indicator derived from a combination of the vegetation condition index (VCI) and temperature condition index (TCI). Their findings indicated that droughts in Cambodia had a higher probability of occurrence in lowland areas around Tonle Sap Lake, and in 2016 nearly 32% of the rice cropland suffered from severe drought conditions. In the Philippines, rice productivity witnessed a decrease in drought in years 2001 and 2005 [67], but this was not clear in Cambodia [59]. Other studies reported rice cropping patterns and yield prediction relationships with drought conditions in the Vietnamese Mekong region and Thailand [55,62].
Vegetation-temperature indices and their combinations derived from remote sensing measurements are the main method of soil moisture drought mapping. The drought composite/multispectral indices approaches (e.g., VHI, VCI) have been reported in several studies [54,55,57,63,64,65]. These indices are easy to use, and provide various perspectives on drought impacts and conditions. In addition, simulated crop models have been developed to associate the relationship between crop productivity and drought conditions [59,62]. Although machine learning has been massively developed and applied in various research domains [68], little research has been conducted in this area. Perez Macapagal et al., 2016 [63], used machine learning algorithms (e.g., an artificial neural network and a vector autoregressive model) to forecast drought occurrence in the Philippines. In short, most of the soil moisture and crop stress drought studies are based on well-established multispectral indices such as VHI and VCI.

3.2.2. Vegetation Stress

Drought has posed a significant concern to ecological ecosystems, and vegetation is a key response indicator to drought conditions because it reflects the growth and status of plant healthiness. In Southeast Asia, there has been a substantial number of publications dedicated to this topic. Among the reported applications, vegetation drought was by far the most investigated topic over the past 21 years, accounting for nearly 31%. Most of the vegetation drought publications were investigated in Thailand (28%), followed by Vietnam (14%). Malaysia and Indonesia shared 11.5% each, and the remaining countries were less reported, ranging from 3 to 6%. In addition, local/national vegetation drought publications were more frequently reported than transboundary studies. Nearly 88% of these articles focused on local and/or national spatial scales, whereas just about 12% aimed to investigate the transnational variability in vegetation health due to drought impacts [69,70,71,72].
Vegetation remote sensing is the primary source of data to monitor and assess the drought impacts on vegetation in the region. Variations in green vegetation and canopy structures can be captured by certain wavelengths, especially red and the near infrared spectrum. One of the most well-established approaches to vegetation stress monitoring is based on time-series NDVI products. The NDVI observations reflect the state of plant greenness because healthy vegetation strongly absorbs visible red light, but reflects in the near-infrared wavelength [30,31,73]. When drought occurs, it reduces the vegetation greenness and hence reflects less near-infrared light. Several studies in the region employed the NDVI to monitor and assess vegetation droughts [74,75,76,77], whereas other forms of vegetation indices based on the NDVI gained popularity in recent studies [78,79,80,81,82,83,84].
Several drought indicators have been developed and/or applied to investigate vegetation drought variability in the region. The time-series MODIS-based vegetative drought indices were mostly observed from studies in Thailand [74,75,76,79,80,82,83,84,85] whereas drought indices derived from the Landsat were undertaken in Vietnam [86,87,88]. Droughts have been reported to impact forests and vegetation over the past two decades. For example, Zhang et al., 2014 [72], investigated the vegetation productivity variations using the Palmer drought severity index (PDSI). The results of this study indicated that the Mekong region suffered from severe droughts, reducing vegetation net productivity products (NPP) in 2005 and 2010. The widespread decline in vegetation was also observed in the 2015–2016 drought event [69]. In addition, in the lower Vietnamese Mekong region, drought and salinity reduced vegetated perennial croplands [88]. Other studies also reported reduced vegetation greenness in drought years such as 1997–1998 and 2005–2006 [46,70,89,90].
Although most of the vegetation drought studies in the region utilized multispectral remote sensing data available from the providers without reconstruction and enhancement, Xie et al., 2021 [71] applied various methods (e.g., Fourier-based harmonic analysis of time series [HANTS], the Savitzky-Golay filter [SG], and a Whittaker smoother [WS]) to reconstruct MODIS time-series NDVI, enhanced vegetation index (EVI), and land surface temperature (LST) products. They showed that drought indicators derived from reconstructed remote sensing data outperformed others; among the reported approaches, the HANTS method was superior. Furthermore, Mohd Razali et al., 2016 [91], developed a drought classification system, Malaysian Southwest Monsoon (M-SWM), to monitor and assess natural and planted vegetation. Apart from the traditional vegetation-based approach, microwave remote sensing and machine learning also have been explored for vegetation droughts [92,93,94]. Although multi-sensor remote sensing provides higher temporal and spatial resolutions for drought characterization and assessment, there are few studies integrating multi-sensor vegetation droughts. Recent examples of such multi-sensor remote sensing vegetation droughts have been undertaken in Indonesia [95] and Southeast Asia [70]. In short, vegetation droughts in the region are mainly derived from the MODIS-based vegetation time-series indices, whereas the multi-sensor remote sensing of droughts and machine learning are the least explored.

3.2.3. Drought-Related Forest Fires

Drought is one of the key factors in the increasing frequencies of wildfire/forest fires, and their consequences on the ecosystem environment and human beings are tremendous [30]. In Southeast Asia, drought-induced forest fire caused the loss of biodiversity and increased greenhouse gas emissions, among other effects [96,97,98], all of which can lead to more intense global warming. In response to such emerging issues, there have been several publications devoted to forest-related droughts in the region. Among the reported applications, drought-related forest fires accounted for 14%, with various foci, including fire mapping, forest fire risk assessment, and hotspot analysis (Figure 12). Indonesia was the most frequently reported, with drought-induced forest fires accounting for nearly 70%, followed by Malaysia (21%). The remaining other countries have made little progress in drought-related fire research, even though these countries often suffer from forest fires [96].
Given the unique distinction of forest fires, thermal remote sensing is probably the most frequently used technique to detect forest droughts. In the Southeast Asian region, the majority of the publications investigating drought-induced wildfires used the thermal MODIS and/or AVHRR time-series products [99,100,101,102,103,104], as these two sensors can provide a higher temporal resolution and hence capture more clear-sky imagery. Over the past two decades, it can be observed that forest fire droughts were primarily investigated in El Niño years [99,102,105,106,107,108]. For example, Fuller et al., 2004 [98], reported a loss of nearly 3 million hectares of forest in relation to the El Niño drought years 1997–1998 in Kalimantan, Indonesia. A more recent example was the study of Miettinen et al., 2017 [100]; they detected nearly 107,000 fire hotspots during El Niño year 2015 in Peninsular Malaysia and Indonesia. Droughts occurred more often in undeveloped peatlands and oil palms (e.g., uncertified oil palm) then other land cover types [100,105,108,109].
The multi-sensor remote sensing approach has been employed to detect forest fire hotspots [102,105,110]. The detected fires based on multi-sensor measurements varied in time and space. Fanin et al., 2017 [110], reported that the MODIS time-series thermal anomaly products detected nearly four times more fires than the Along Track Scanning Radiometer (ATSR) of European Remote Sensing (ERS) from 2001 to 2012. In comparison with the diverse vegetation indices for agricultural droughts, in the forest-related fire droughts thermal anomaly/burnt products are the most often reported indicator in the region. Burned area mapping is another common approach to gain insights on forest fires in relation to drought. Lohberger et al., 2018 [109], employed Sentinel-1 SAR remote sensing, together with other datasets, to detect more than 4 million hectares of burnt forests during drought years.

3.2.4. Variability in the Terrestrial Water Storage and Streamflow

The reduction of groundwater and surface water (e.g., lakes, streamflow) is referred to as hydrological drought. This process is associated with the deficiency of precipitation over a longer period of time, such as months or even years. Unlike agricultural droughts, hydrological droughts usually take a long time to recover and have broader impacts on other economic sectors (e.g., recreational activities and the energy sector). For example, the reduced level of streamflow not only impacts agricultural irrigation but also threatens hydroelectric power production. In Southeast Asia, several recent studies indicated that streamflow and surface water storage suffer from great temporal variations [111,112,113,114,115]. Noticeably, parts of the lower Mekong region witnessed a downward trend of surface water based on the MODIS time-series observations from 2001 to 2017 [114].
With increasing remote sensing observations from different sensor platforms, the time-series characterization of streamflow and water surface variability can provide great insights into hydrological droughts. In Cambodia, the low surface water storage around Tonle Sap Lake was observed to be associated with the dry seasons and the El Niño drought years [113,116,117]. In addition, Erban and Gorelick, 2016 [118], estimated that 96% of Cambodian rice cropland remains fallow in dry seasons due to a lack of surface water. In this region, it can be observed that multispectral remote sensing has been used to gain an understanding of the patterns of surface water and streamflow [114,116,118,119]. The multi-sensor remote sensing approach also gained more attention in more recent years, but this approach was seen more often in the combination of the MODIS, TRMM, GRACE, and ENVISAT sensors [111,113,115,120]. Pham-Duc et al., 2019 [115], employed the MODIS time series, GRACE, and ENVISAT datasets to provide insights into monthly variations of surface and subsurface water in the lower Mekong region. Other studies combined drought indices (correlation analysis) such as the Palmer drought severity index (PDSI) and the El Niño Southern Oscillation index (ENSO), for example in the analysis of surface water changes associated with El Niño years [121].
Although there are numerous available remote sensing datasets that can be used for hydrological-related droughts, their accuracy and spatiotemporal resolutions vary, and may be a challenge for domain researchers and scientists. Le et al., 2020 [122], evaluated eight publicly available satellite-based precipitation products, and their conclusion indicated that the GPM Integrated Multi-satellite Retrievals (IMERG) and Climate Hazards Group Infrared Precipitation (CHIRPS) datasets outperformed other products, with regard to the potential for hydrological drought analysis in Vietnam. In addition, the GRACE dataset showed the potential of streamflow and surface water storage monitoring in the region. Due to their unique characteristics, such as measurements of subsurface conditions, GRACE data have been applied in the analysis of subsurface and surface water variability in the region [115,123].

3.2.5. Drought-Induced Land-Use Change

Land-use and land cover change are closely associated with droughts and other human activities. Drought and its impacts not only reduce crop productivity but may also drive land degradation, turning fertile soil into degraded/non-productive fields [124]. Given the increasing climate crisis, warmer temperatures are being observed in many parts of the world; consequently, droughts are expected to increase in frequency, severity and duration [12,125,126]. Such changing climate conditions can lead to a faster rate of land degradation and desertification, which in turn can result in land use/landcover changes.
Among the reported applications, land-use-related droughts accounted for nearly 9.5%, and most of these studies were undertaken in Vietnam [88,127,128,129,130,131,132,133] and Indonesia [126]. Multi-spectral remote sensing products from the MODIS and Landsat sensors dominated, whereas the multi-sensor approach has been limited in few recent studies [128,132]. Pham et al., 2021 [128] combined Landsat and MODIS time-series products, and their findings indicated that droughts, among other drivers, are closely related to the land-use/land cover change pattern. In the coastal Vietnam, droughts reduced rice cropland and aquaculture in drought years [129], and exaggerated the desertification [127]. Land use change associated with droughts is also predicted to occur in parts of Indonesia [126].

3.2.6. Meteorological Droughts

In this section, meteorological drought refers to the articles that cover general drought monitoring or precipitation-based drought comparison without a focus on one of the pre-defined subcategories. Indonesia had the highest percentage of meteorological drought studies, with 30%, followed by Thailand and Vietnam, with 15% each. It is also observed that nearly 70% of these studies were undertaken in mainland Southeast Asian countries.
Precipitation is probably the most fundamental element in identifying meteorological droughts [30,134]. Given its importance, there are numerous remote sensing precipitation datasets from various sensors platforms in addition to climatic reanalysis products available covering the entire globe. These datasets offer various spatial and temporal resolution characteristics, whereas their accuracy has been inconsistent across the globe [135,136]. In Southeast Asia, several studies validated satellite-based precipitation products for local and regional drought detection. There have been uncertainties among satellite-based precipitation products in the region, but higher overall accuracy was observed for Global Precipitation Climatology Center (GPCC) data in Vietnam [137], for the combined use of Modern-Era Retrospective Analysis for Research and Applications (MERRA-2) and the TRMM in Indonesia [138,139], and for the TRMM in Singapore [140] and Malaysia [141,142].
Computing precipitation-based drought indices is the main approach for detecting meteorological droughts in the region. The SPI was the most often reported drought index for drought monitoring and characterization. The standardized precipitation evapotranspiration index (SPEI) ranked second, in addition to the dry spell index (DSI). Although satellite-derived precipitation observations can provide an accurate estimation of droughts and a cost-efficient approach for large-scale monitoring, they present major limitations. The coarse spatial resolution measurements such as CHIRPS (~6 km) and TRMM (~28 km) may not be sufficiently reliable to characterize local droughts where crop farms require more spatial details, especially in small and fragmented agriculture. In addition, satellite-derived rainfall products present uncertainties, as they are produced from multiple sensors or in combination with in-situ observations [135]. A recent study developed method strategies to enhance the spatial resolution of satellite-based precipitation products in the region [143], but more efforts are needed in order to address the issues for more accurate and detailed drought monitoring.

4. Discussion

4.1. Discrepancy of Drought Publications among Southeast Asian Countries

We observed an increase in the number of drought publications in the region over time (Section 3.1.1). This increase can be observed to be significant since 2016, and reached a peak in 2021, which is likely to partially linked to the El Niño events 2015–2016 and 2018–2020, which were the most damaging drought events in the last two decades. It is also observed that nearly 70% of the drought studies were undertaken in Vietnam, Thailand, Indonesia and Malaysia. The more frequent drought-related events which occurred in these countries may explain the trend (Table 1).
Although the region witnessed an increase in drought studies, more than 50% of the corresponding authors are associated with foreign institutions. Seven drought studies were conducted in Cambodia over the past two decades, but there were no corresponding authors affiliate, with Cambodian academic institutions. This reliance may be due to external research funding and expertise resources. Gerke and Evers, 2006 [144], revealed that the region experienced an increasing dependence for science and research on foreign institutions. It is also expected that these dependent links enable close collaborations among academic institutions in capacity training and research, and consequently may lead to more drought publications in the coming years. With the rise of extreme climate events, a recent initiative on the Strengthening of Drought Adaptation by the Association of Southeast Asian Nations (ASEAN) was also expected to boost drought research in the region [145], especially drought mapping products. We also expect that these endeavors will lead to the development of new drought indicators and indices in the region. Currently, there has been little progress in developing and/or employing combined drought indices. Cammalleri et al., 2021 [146], recently reviewed the combined drought indices, and suggested that they had a high potential for agricultural drought monitoring. The combined drought indices have also been successfully applied for agricultural droughts in Spain [147], Ethiopia [148], and European countries [149].
Discrepancy is also observed in drought applications. Agriculture received the greatest attention in terms of drought monitoring, partially because of the prominent agriculture-based economy in the region. However, many of the studies focused on general vegetation stress, while soil moisture and specific-crop droughts are not frequently reported. It is likely that vegetation indices have been well established, and had a long history of data. Another reason may be attributed to a lack of in-situ soil moisture measurements or the limited sharing of data in the region. In addition, other types of drought are understudied, although they are key to the community and the environment, such that sufficient attention should be given. For example, reduced water in lakes and rivers can have long-term impacts on the economy and human activities, such as a shortage of drinking water, in addition to groundwater monitoring. Recently, flash drought has been frequently reported, and has gained great attention in the United States of America [150], but there were no studies found on it in Southeast Asia. Given its rapid development and intensification, flash drought can cause tremendous impacts on agriculture and ecosystems. Hence, future effort for the monitoring of flash drought is necessary in order to mitigate its impact in the region.

4.2. Evaluation of Drought Products and Mapping Duration

The reporting of map uncertainties is probably the most fundamental statistic in the drought remote sensing products. The produced drought maps and their associated uncertainties can provide decision-makers with a level of confidence and reliability in their drought planning and mitigation programs [151]. Nearly 21% of the reviewed studies did not report accuracy assessment (Section 3.1.4). There may be various factors influencing the decision of map validation, but the lack of in-situ data is likely a main concern [152]. This problem is also observed in other remote sensing-derived products, such as biomass products [153] and soil mapping [154]. Currently, there is no standard framework for validating drought mapping products in the region. The commonly used approaches for validating a drought remote sensing-based product are simple temporal and spatial comparisons with precipitation, reported drought events, and/or well-established drought indices (e.g., SPI, SPEI). A more standard framework of drought mapping product accuracy assessment is needed in order to ensure the reliability and certainties in local and regional drought planning and mitigation strategies.
Apart from map uncertainties, long time-series, large-scale drought monitoring and characterization are still limited in the region. Given the nature of climatic studies, long-term historical monitoring is required in order to better understand and characterize the evolving patterns of droughts and their impacts [155]. Nearly 92% of drought studies conducted in Southeast Asia had less than 30 years of history (Section 3.1.4), and this short time span may not be sufficient to understand the regionwide historical droughts. These limitations may be due to the insufficient data storage infrastructure and computing resources to deal with a large volume of remote sensing datasets. With increasing digital literacy and open-source cloud computing platforms (e.g., Google Earth Engine), there is the potential to address this grand challenge in the region.

4.3. A Need for Higher Spatial and Temporal Resolutions

Drought phenomena are complex, and their impacts vary in space and time. Agriculture droughts can harm crops if the water supply is insufficient for a few days to a few weeks, but it may return to normal after rain. Furthermore, crop fields in Southeast Asia are small in size and fragmented. Thus, the key challenges in drought remote sensing are associated with temporal and spatial resolutions. Although there have been several high spatiotemporal EO missions, such as the Landsat and Sentinel sensors, it is still challenging to acquire cloud-free monthly composites covering the entire region or the national scale for drought monitoring [156]. This issue is likely to remain in the near future, with single sensors in tropical regions such as Southeast Asia.
While the generation of high-spatial-resolution, weekly or sub-monthly drought monitoring products may not be feasible with a single-sensor platform at the regional and national scale, the combined use of multi-sensor platforms and downscaled products from microwave and optical observations offers high potential to produce high-spatiotemporal-resolution drought products. In addition, the recent technological advancements and launch of new sensors offer high potential to address the limitations of previous studies. Harmonizing the Sentinel-2 multispectral sensor and Landsat, for example, can provide high spatial and temporal observations of the surface of the Earth. Nguyen et al., 2020 [157], demonstrated the combined use of Landsat and Sentinel-2 data for mapping cropland in drought-prone areas of Vietnam and Lebanon. Although there were some uncertainties in Landsat and Sentinel-2 image co-registration, they greatly enhanced the spectral temporal information. Given the rise of the Copernicus Sentinel missions and long history Landsat, most research acknowledged the role of these missions for future drought monitoring [31]. Unfortunately, there has been little effort in the region to explore the potential of such missions for drought and risk assessment.
With the advantages of daily and/or sub-weekly revisits of coarse soil moisture sensors such as SMAP, this dataset offers new opportunities for agricultural drought monitoring. However, this dataset and its downscaling approach have not yet been fully explored in the region. A recent study by Dandridge et al., 2019 [51], demonstrated the downscaling of SMAP soil moisture data from 9 km to 1 km, and they concluded that the downscaled soil moisture products had the potential to enhance agricultural drought monitoring. Given the extensive agricultural region (e.g., Mekong), the SMAP soil moisture and its downscaled products will play a key role for local crop drought monitoring. Apart from the massive publicly available datasets, satellite products from private companies are expected to unlock drought monitoring at daily and sub-daily temporal resolutions. Planet, one of the leading commercial EO data providers, offers free access at up to 5 thousand km2 monthly for educational purposes. These resources will play an important role in drought-prone regions where frequent and high spatial drought products are required as key input information in land-use planning and drought mitigation strategies.

5. Conclusions

In this paper, the results of a review on drought-related studies based on remote sensing products in Southeast Asia from 2000 to 2021 were analyzed. The review primarily covered the spatiotemporal distribution of the publications, EO satellite sensors, spatial and temporal resolution, remote sensing-based input variables, drought indicators and indices, drought validation strategies, and relevant drought-specific applications. This review offers the following insights:
(1)
The number of drought publications has increased over the past 21 years, with a total of 102 articles, and especially in the last 5 years (which accounted for 80%). However, nearly 65% of the articles were conducted in mainland Southeast Asia, and Vietnam is the most active destination of drought studies (35 articles). In addition, more than 50% of the corresponding authors are affiliated with non-Southeast Asian academic institutions. we expect that these collaboration links may boost drought research capacity and lead to more publications in the coming years.
(2)
Nearly 50% of the articles employed optical remote sensing, whereas the microwave remote sensing of drought received the fewest applications. The combined use of Landsat and Sentinel data has not yet been explored for drought monitoring. Newer satellite missions such as SMAP and its downscaling products should be investigated in the region because of their high spatiotemporal resolution for soil moisture drought.
(3)
Most of the studies focused on single vegetation-based and/or precipitation-based drought indices (~53%). There are new opportunities for developing combined drought approaches. In addition, machine learning has been rarely applied in drought detection. Further efforts are needed in order to enhance drought prediction for early warning and mitigation planning.
(4)
Several articles did not report the accuracy information on drought mapping products (~22%), whereas precipitation was the main source of data for validating drought maps (46%). In addition, time-series drought remote sensing witnessed an increase in recent years, but longer time-series drought measurements (e.g., >30 years) are limited (~90%). Future endeavors on multi-sensor data fusion/reconstruction are necessary in order to produce longer time-series drought observations.
(5)
There is an associated relationship between the spatial resolution and the study area extent. The larger the study area is, the coarser the spatial resolution of the map produced. It can also be observed that more than half of the articles focused on drought monitoring at a local scale, and 64% of digital drought maps were produced at a spatial resolution of 1 km and above. Given the increasing cloud-based computing platforms (e.g., Google Earth Engine), there will be more opportunities for regional and transboundary drought assessment.
(6)
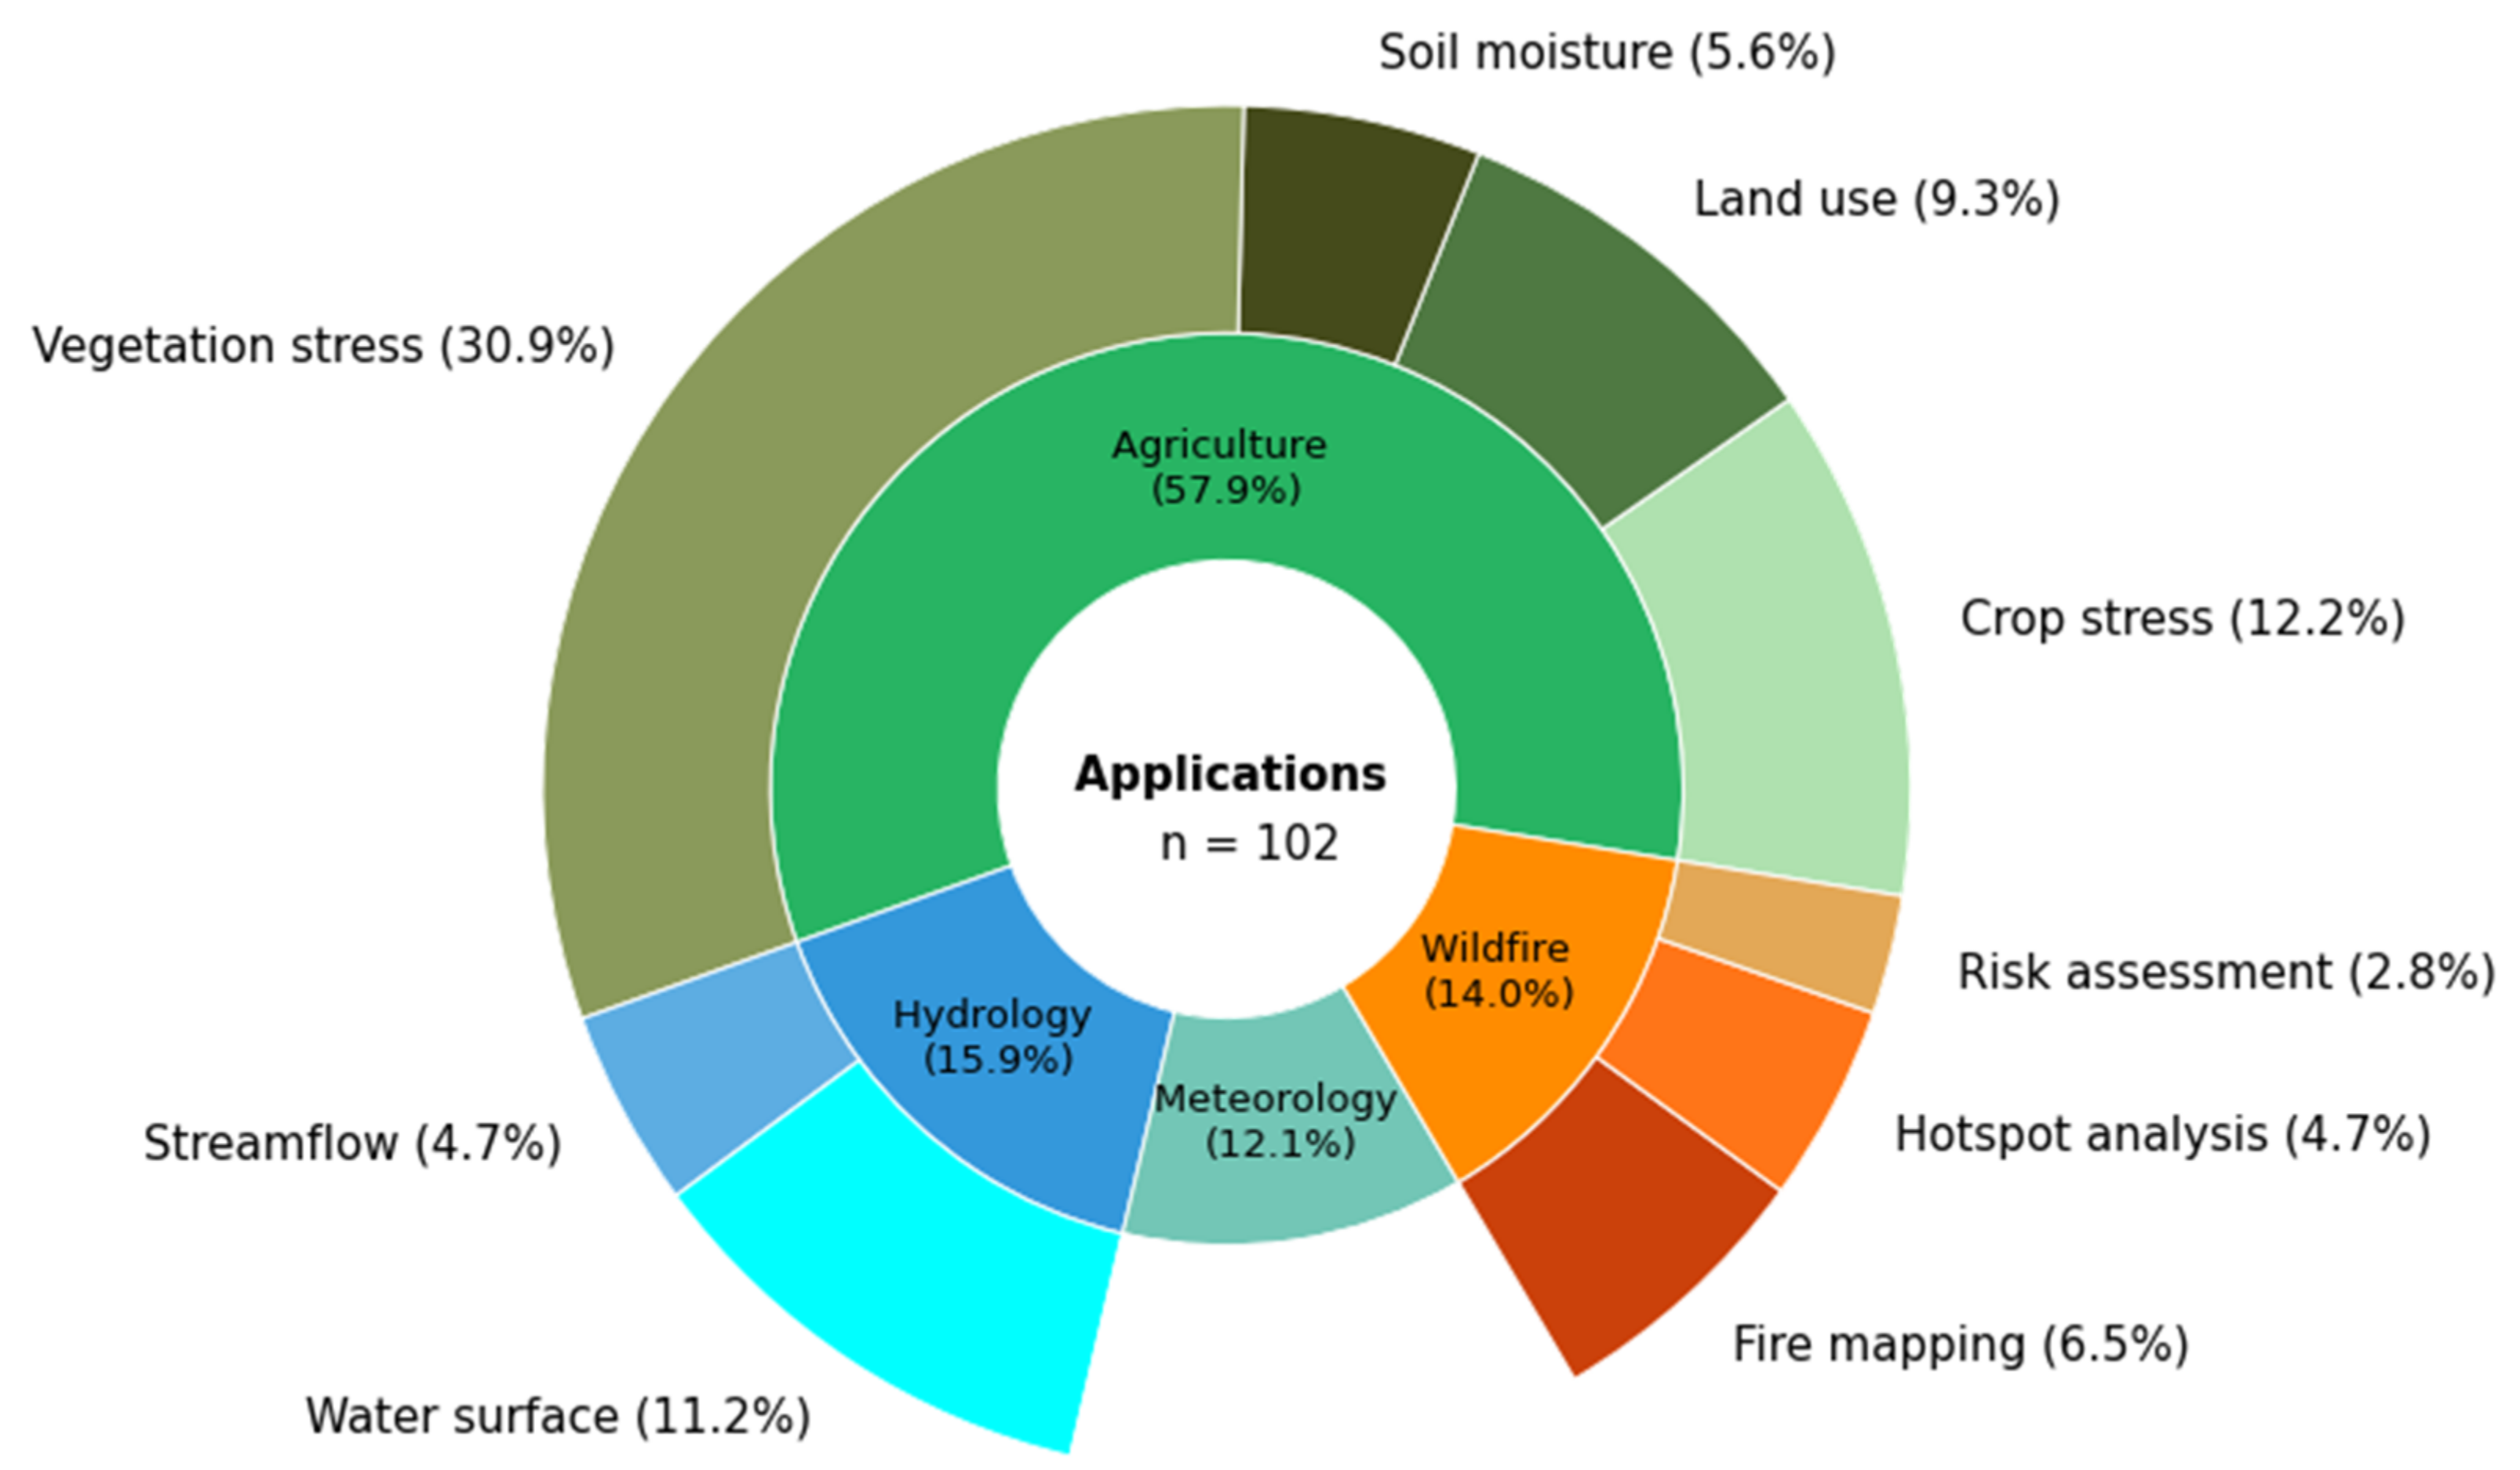
There are large discrepancies among drought-specific applications in the region. Although agricultural drought was the most frequently reported application (~58%), soil moisture and crop-specific drought monitoring are still limited. Because Southeast Asia is one of the biggest agricultural producers worldwide, we call for more attention to soil moisture and crop-specific drought assessment, in addition to hydrological and meteorological observations.
In conclusion, this review, for the first time, provided great insights into drought studies based on EO data in Southeast Asia. The region witnessed significant progress in drought publications over time. However, challenges remain, especially in large-area and long time-series drought measurements, combined drought approaches, and the integration of multi-sensor remote sensing products (e.g., Landsat and Sentinel-2). Thus, future efforts are necessary in order to solve these challenges and ensure regional and global food security, a more sustainable economy, and the preservation of the natural environment.

Author Contributions

Conceptualization, T.V.H. and C.K.; methodology, T.V.H.; formal analysis, T.V.H.; data curation, T.V.H.; writing—original draft preparation, T.V.H.; review and editing, T.V.H., J.H., F.B. and C.K.; visualization, T.V.H. and J.H.; supervision, C.K. and J.H. All authors have read and agreed to the published version of the manuscript.

Funding

This research was conducted within the Drought-ADAPT project funded by the German Federal Ministry of Education and Research (Grant No. 01LZ2002A). The corresponding author acknowledged the DAAD Doctoral Grant (No. 91794761).

Data Availability Statement

The data that support the findings of this study are available from the corresponding author upon reasonable request.

Conflicts of Interest

The authors declare no conflict of interest.

References

  1. Esfahanian, E.; Nejadhashemi, A.P.; Abouali, M.; Adhikari, U.; Zhang, Z.; Daneshvar, F.; Herman, M.R. Development and evaluation of a comprehensive drought index. J. Environ. Manag. 2017, 185, 31–43. [Google Scholar] [CrossRef] [Green Version]
  2. Erian, W.; Pulwarty, R.; Vogt, J.; AbuZeid, K.; Bert, F.; Bruntrup, M.; El-Askary, H.; de Estrada, M.; Gaupp, F.; Grundy, M. GAR Special Report on Drought 2021; United Nations Office for Disaster Risk Reduction: Geneva, Switzerland, 2021. [Google Scholar]
  3. FAO. Food Price Monitoring and Analysis Bulletin; FAO: Rome, Italy, 2017. [Google Scholar]
  4. IPCC. Climate Change 2022: Impacts, Adaptation, and Vulnerability; Contribution of Working Group II to the Sixth Assessment Report of the Intergovernmental Panel on Climate Change; Pörtner, H., Roberts, D., Tignor, M., Poloczanska, E., Mintenbeck, K., Alegría, A., Craig, M., Langsdorf, S., Löschke, S., Rama, B., et al., Eds.; Cambridge University Press: Cambridge, UK, 2022; in press; Available online: https://www.ipcc.ch/report/ar6/wg2 (accessed on 25 July 2022).
  5. Zhao, J.; Zhang, Q.; Zhu, X.; Shen, Z.; Yu, H. Drought risk assessment in China: Evaluation framework and influencing factors. Geogr. Sustain. 2020, 1, 220–228. [Google Scholar] [CrossRef]
  6. Shi, J.; Cui, L.; Tian, Z. Spatial and temporal distribution and trend in flood and drought disasters in East China. Environ. Res. 2020, 185, 109406. [Google Scholar] [CrossRef] [PubMed]
  7. Samphantharak, K. Natural disasters and the economy: Some recent experiences from Southeast Asia. Asian-Pac. Econ. Lit. 2014, 28, 33–51. [Google Scholar] [CrossRef]
  8. Chen, X.; Liu, H.; Mu, X. Summary of Flood and Drought in Mekong River Basin, in Flood Prevention and Drought Relief in Mekong River Basin; Springer: Berlin/Heidelberg, Germany, 2020; pp. 27–54. [Google Scholar]
  9. Thurman, M. Natural Disaster Risks in Central Asia: A Synthesis; United Nations Development Programme: Bratislava, Slovakia, 2011. [Google Scholar]
  10. Pollner, J.; Kryspin-Watson, J.; Nieuwejaar, S. Disaster Risk Management and Climate Change Adaptation in Europe and Central Asia; World Bank: Washington, DC, USA, 2010. [Google Scholar]
  11. Miyan, M.A. Droughts in Asian least developed countries: Vulnerability and sustainability. Weather Clim. Extrem. 2015, 7, 8–23. [Google Scholar] [CrossRef] [Green Version]
  12. Amnuaylojaroen, T.; Chanvichit, P. Projection of near-future climate change and agricultural drought in Mainland Southeast Asia under RCP8.5. Clim. Change 2019, 155, 175–193. [Google Scholar] [CrossRef]
  13. IPCC. 2022: Summary for Policymakers. In Climate Change 2022: Impacts, Adaptation, and Vulnerability; Contribution of Working Group II to the Sixth Assessment Report of the Intergovernmental Panel on Climate Change; Pörtner, H., Roberts, D., Tignor, M., Poloczanska, E., Mintenbeck, K., Alegría, A., Craig, M., Langsdorf, S., Löschke, S., Rama, B., et al., Eds.; Cambridge University Press: Cambridge, UK, 2022. [Google Scholar]
  14. Prodhan, F.A.; Zhang, J.; Sharma, T.P.P.; Nanzad, L.; Zhang, D.; Seka, A.M.; Ahmed, N.; Hasan, S.S.; Hoque, M.Z.; Mohana, H.P. Projection of future drought and its impact on simulated crop yield over South Asia using ensemble machine learning approach. Sci. Total Environ. 2022, 807, 151029. [Google Scholar] [CrossRef] [PubMed]
  15. Chen, L.; Wang, G.; Miao, L.; Gnyawali, K.R.; Li, S.; Amankwah, S.O.Y.; Huang, J.; Lu, J.; Zhan, M. Future drought in CMIP6 projections and the socioeconomic impacts in China. Int. J. Climatol. 2021, 41, 4151–4170. [Google Scholar] [CrossRef]
  16. Wilhite, A.D.; Glantz, M.H. Understanding: The drought phenomenon: The role of definitions. Water Int. 1985, 10, 111–120. [Google Scholar] [CrossRef] [Green Version]
  17. Wilhite, D. Drought Monitoring and Early Warning: Concepts, Progress and Future Challenges; WMO No. 1006; World Meteorological Organization (WMO): Geneva, Switzerland, 2006. [Google Scholar]
  18. Dracup, J.A.; Lee, K.S.; Paulson, E.G., Jr. On the definition of droughts. Water Resour. Res. 1980, 16, 297–302. [Google Scholar] [CrossRef]
  19. Svoboda, D.M.; Fuchs, B.A. Handbook of Drought Indicators and Indices; World Meteorological Organization: Geneva, Switzerland, 2016. [Google Scholar]
  20. Zhou, K.; Li, J.; Zhang, T.; Kang, A. The use of combined soil moisture data to characterize agricultural drought conditions and the relationship among different drought types in China. Agric. Water Manag. 2021, 243, 106479. [Google Scholar] [CrossRef]
  21. Hao, Z.; Singh, V.P. Drought characterization from a multivariate perspective: A review. J. Hydrol. 2015, 527, 668–678. [Google Scholar] [CrossRef]
  22. Crausbay, S.D.; Ramirez, A.R.; Carter, S.L.; Cross, M.S.; Hall, K.R.; Bathke, D.J.; Betancourt, J.L.; Colt, S.; Cravens, A.E.; Dalton, M.S.; et al. Defining ecological drought for the twenty-first century. Bull. Am. Meteorol. Soc. 2017, 98, 2543–2550. [Google Scholar] [CrossRef]
  23. Patel, N.; Chopra, P.; Dadhwal, V. Analyzing spatial patterns of meteorological drought using standardized precipitation index. Meteorol. Appl. J. Forecast. Pract. Appl. Train. Tech. Model. 2007, 14, 329–336. [Google Scholar] [CrossRef]
  24. Łabędzki, L. Estimation of local drought frequency in central Poland using the standardized precipitation index SPI. Irrig. Drain. J. Int. Comm. Irrig. Drain. 2007, 56, 67–77. [Google Scholar] [CrossRef]
  25. Manatsa, D.; Mukwada, G.; Siziba, E.; Chinyanganya, T. Analysis of multidimensional aspects of agricultural droughts in Zimbabwe using the Standardized Precipitation Index (SPI). Theor. Appl. Climatol. 2010, 102, 287–305. [Google Scholar] [CrossRef]
  26. Mutert, E.; Fairhurst, T. Developments in rice production in Southeast Asia. Better Crops Int. 2002, 15, 12–17. [Google Scholar]
  27. Van der Eng, P. Productivity and comparative advantage in rice agriculture in South-East Asia since 1870. Asian Econ. J. 2004, 18, 345–370. [Google Scholar] [CrossRef] [Green Version]
  28. UNESCAP. Asia-Pacific Disaster Report 2019; UNESCAP: Bangkok, Thailand, 2019. [Google Scholar]
  29. Phan-Van, T.; Nguyen-Ngoc-Bich, P.; Ngo-Duc, T.; Vu-Minh, T.; Le, P.V.; Trinh-Tuan, L.; Nguyen-Thi, T.; Pham-Thanh, H.; Tran-Quang, D. Drought over Southeast Asia and its association with large-scale drivers. J. Clim. 2022, 35, 4959–4978. [Google Scholar] [CrossRef]
  30. Jiao, W.; Wang, L.; McCabe, M.F. Multi-sensor remote sensing for drought characterization: Current status, opportunities and a roadmap for the future. Remote Sens. Environ. 2021, 256, 112313. [Google Scholar] [CrossRef]
  31. AghaKouchak, A.; Farahmand, A.; Melton, F.; Teixeira, J.; Anderson, M.; Wardlow, B.D.; Hain, C. Remote sensing of drought: Progress, challenges and opportunities. Rev. Geophys. 2015, 53, 452–480. [Google Scholar] [CrossRef] [Green Version]
  32. Heumann, B.W. Satellite remote sensing of mangrove forests: Recent advances and future opportunities. Prog. Phys. Geogr. 2011, 35, 87–108. [Google Scholar] [CrossRef]
  33. Sazib, N.; Mladenova, I.; Bolten, J. Leveraging the google earth engine for drought assessment using global soil moisture data. Remote Sens. 2018, 10, 1265. [Google Scholar] [CrossRef] [Green Version]
  34. Venkatappa, M.; Sasaki, N.; Han, P.; Abe, I. Impacts of droughts and floods on croplands and crop production in Southeast Asia–An application of Google Earth Engine. Sci. Total Environ. 2021, 795, 148829. [Google Scholar] [CrossRef]
  35. Khan, R.; Gilani, H. Global drought monitoring with drought severity index (DSI) using Google Earth Engine. Theor. Appl. Climatol. 2021, 146, 411–427. [Google Scholar] [CrossRef]
  36. Tran, T.; Tran, D.; Huynh, P.; Dao, H.; Vo, T.; Trinh, H.; Tran, X. Analysing Drought Intensity in the Mekong River Delta using Time Series Analysis and Google Earth Engine. Int. J. Geoinform. 2020, 16, 1–7. [Google Scholar]
  37. Zhao, X.; Xia, H.; Pan, L.; Song, H.; Niu, W.; Wang, R.; Li, R.; Bian, X.; Guo, Y.; Qin, Y. Drought monitoring over Yellow River basin from 2003–2019 using reconstructed MODIS land surface temperature in Google Earth Engine. Remote Sens. 2021, 13, 3748. [Google Scholar] [CrossRef]
  38. West, H.; Quinn, N.; Horswell, M. Remote sensing for drought monitoring & impact assessment: Progress, past challenges and future opportunities. Remote Sens. Environ. 2019, 232, 111291. [Google Scholar]
  39. Chandrasekara, S.S.; Kwon, H.-H.; Vithanage, M.; Obeysekera, J.; Kim, T.-W. Drought in South Asia: A review of drought assessment and prediction in South Asian countries. Atmosphere 2021, 12, 369. [Google Scholar] [CrossRef]
  40. Barlow, M.; Zaitchik, B.; Paz, S.; Black, E.; Evans, J.; Hoell, A. A review of drought in the Middle East and southwest Asia. J. Clim. 2016, 29, 8547–8574. [Google Scholar] [CrossRef]
  41. Zhang, L.; Zhou, T. Drought over East Asia: A review. J. Clim. 2015, 28, 3375–3399. [Google Scholar] [CrossRef]
  42. Zhu, J.; Liu, W.J.S. A tale of two databases: The use of Web of Science and Scopus in academic papers. Scientometrics 2020, 123, 321–335. [Google Scholar] [CrossRef] [Green Version]
  43. Clauss, K.; Ottinger, M.; Leinenkugel, P.; Kuenzer, C. Estimating rice production in the Mekong Delta, Vietnam, utilizing time series of Sentinel-1 SAR data. Int. J. Appl. Earth Obs. Geoinform. 2018, 73, 574–585. [Google Scholar] [CrossRef]
  44. UNESCAP. Ready for the Dry Years: Building Resilience to Drought in South-East Asia; UNESCAP: Bangkok, Thailand, 2021. [Google Scholar]
  45. Tsubo, M.; Fukai, S.; Basnayake, J.; Ouk, M. Frequency of occurrence of various drought types and its impact on performance of photoperiod-sensitive and insensitive rice genotypes in rainfed lowland conditions in Cambodia. Field Crops Res. 2009, 113, 287–296. [Google Scholar] [CrossRef]
  46. Perez, P.G.J.; Comiso, J.C. Seasonal and interannual variabilities of Philippine vegetation as seen from space. Philipp. J. Sci. 2014, 143, 147–155. [Google Scholar]
  47. Inoubli, R.; Abbes, A.B.; Farah, I.R.; Singh, V.; Tadesse, T.; Sattari, M.T. A Review of Drought Monitoring Using Remote Sensing and Data Mining Methods. In Proceedings of the 2020 5th International Conference on Advanced Technologies for Signal and Image Processing (ATSIP), Sousse, Tunisia, 2–5 September 2020; IEEE: New York, NY, USA, 2020. [Google Scholar]
  48. Liu, P. A survey of remote-sensing big data. Front. Environ. Sci. 2015, 3, 45. [Google Scholar] [CrossRef] [Green Version]
  49. Setiawan, A.M.; Lee, W.S.; Rhee, J. Spatio-temporal characteristics of Indonesian drought related to El Niño events and its predictability using the multi-model ensemble. Int. J. Climatol. 2017, 37, 4700–4719. [Google Scholar] [CrossRef]
  50. Erasmi, S.; Propastin, P.; Kappas, M.; Panferov, O. Spatial patterns of NDVI variation over Indonesia and their relationship to ENSO warm events during the period 1982–2006. J. Clim. 2009, 22, 6612–6623. [Google Scholar] [CrossRef]
  51. Dandridge, C.; Fang, B.; Lakshmi, V. Downscaling of SMAP soil moisture in the lower mekong river basin. Water 2019, 12, 56. [Google Scholar] [CrossRef] [Green Version]
  52. Sriwongsitanon, N.; Gao, H.; Savenije, H.; Maekan, E.; Saengsawan, S.; Thianpopirug, S. The Normalized Difference Infrared Index (NDII) as a proxy for soil moisture storage in hydrological modelling. Hydrol. Earth Syst. Sci. Discuss. 2015, 12, 8419–8457. [Google Scholar]
  53. Raksapatcharawong, M.; Veerakachen, W. Development of drought risk analysis platform using multiple satellite sensors. GEOMATE J. 2019, 17, 62–69. [Google Scholar] [CrossRef]
  54. Son, T.N.; Thanh, B.X. Remotely sensed drought evaluation over rice cultivated areas in Cambodia during 2000 to 2019. Geocarto Int. 2020, 37, 1237–1255. [Google Scholar] [CrossRef]
  55. Chen, C.-F.; Son, N.-T.; Chang, L.-Y.; Chen, C.-C. Monitoring of soil moisture variability in relation to rice cropping systems in the Vietnamese Mekong Delta using MODIS data. Appl. Geogr. 2011, 31, 463–475. [Google Scholar] [CrossRef]
  56. Son, N.T.; Chen, C.; Chen, C.; Chang, L.; Minh, V.Q. Monitoring agricultural drought in the Lower Mekong Basin using MODIS NDVI and land surface temperature data. Int. J. Appl. Earth Obs. Geoinform. 2012, 18, 417–427. [Google Scholar] [CrossRef]
  57. Du, T.L.T.; Bui, D.D.; Nguyen, M.D.; Lee, H. Satellite-based, multi-indices for evaluation of agricultural droughts in a highly dynamic tropical catchment, Central Vietnam. Water 2018, 10, 659. [Google Scholar] [CrossRef] [Green Version]
  58. Luong, N.D.; Hiep, N.H.; Bui, T.H. Investigating the Spatio-Temporal Variation of Soil Moisture and Agricultural Drought towards Supporting Water Resources Management in the Red River Basin of Vietnam. Sustainability 2021, 13, 4926. [Google Scholar] [CrossRef]
  59. Abhishek, A.; Das, N.N.; Ines, A.V.; Andreadis, K.M.; Jayasinghe, S.; Granger, S.; Ellenburg, W.L.; Dutta, R.; Quyen, N.H.; Markert, A.M.; et al. Evaluating the impacts of drought on rice productivity over Cambodia in the Lower Mekong Basin. J. Hydrol. 2021, 599, 126291. [Google Scholar] [CrossRef]
  60. Zheng, C.; Jia, L.; Hu, G.; Lu, J. Earth observations-based evapotranspiration in Northeastern Thailand. Remote Sens. 2019, 11, 138. [Google Scholar] [CrossRef] [Green Version]
  61. Sa-Nguansilp, C.; Wijitkosum, S.; Sriprachote, A. Agricultural drought risk assessment in Lam Ta Kong watershed, Thailand. Int. J. Geoinform. 2017, 13, 37–43. [Google Scholar]
  62. Raksapatcharawong, M.; Veerakachen, W.; Homma, K.; Maki, M.; Oki, K. Satellite-based drought impact assessment on rice yield in Thailand with SIMRIW–RS. Remote Sens. 2020, 12, 2099. [Google Scholar] [CrossRef]
  63. Perez, G.; Macapagal, M.; Olivares, R.; Macapagal, E.; Comiso, J. Forecasting and Monitoring Agricultural Drought in the Philippines. Int. Arch. Photogramm. Remote Sens. Spat. Inf. Sci. 2016, 41, 1263–1269. [Google Scholar] [CrossRef] [Green Version]
  64. Amalo, L.F.; Hidayat, R.; Sulma, S. Analysis of agricultural drought in east java using vegetation health index. AGRIVITA J. Agric. Sci. 2017, 40, 63–73. [Google Scholar] [CrossRef] [Green Version]
  65. Shashikant, V.; Shariff, A.R.M.; Wayayok, A.; Kamal, M.R.; Lee, Y.P.; Takeuchi, W. Utilizing TVDI and NDWI to Classify Severity of Agricultural Drought in Chuping, Malaysia. Agronomy 2021, 11, 1243. [Google Scholar] [CrossRef]
  66. Naeimi, V.; Leinenkugel, P.; Sabel, D.; Wagner, W.; Apel, H.; Kuenzer, C. Evaluation of soil moisture retrieval from the ERS and Metop scatterometers in the lower Mekong Basin. Remote Sens. 2013, 5, 1603–1623. [Google Scholar] [CrossRef] [Green Version]
  67. Parida, B.; Collado, W.; Borah, R.; Hazarika, M.; Samarakoon, L. Detecting drought-prone areas of rice agriculture using a MODIS-derived soil moisture index. GISci. Remote Sens. 2008, 45, 109–129. [Google Scholar] [CrossRef]
  68. Jordan, I.M.; Mitchell, T.M. Machine learning: Trends, perspectives, and prospects. Science 2015, 349, 255–260. [Google Scholar] [CrossRef]
  69. Qian, X.; Qiu, B.; Zhang, Y. Widespread decline in vegetation photosynthesis in Southeast Asia due to the prolonged drought during the 2015/2016 El Niño. Remote Sens. 2019, 11, 910. [Google Scholar] [CrossRef] [Green Version]
  70. Zhang, Y.; Zhu, Z.; Liu, Z.; Zeng, Z.; Ciais, P.; Huang, M.; Liu, Y.; Piao, S. Seasonal and interannual changes in vegetation activity of tropical forests in Southeast Asia. Agric. For. Meteorol. 2016, 224, 1–10. [Google Scholar] [CrossRef]
  71. Xie, F.; Fan, H. Deriving drought indices from MODIS vegetation indices (NDVI/EVI) and Land Surface Temperature (LST): Is data reconstruction necessary? Int. J. Appl. Earth Obs. Geoinform. 2021, 101, 102352. [Google Scholar] [CrossRef]
  72. Zhang, B.; Zhang, L.; Guo, H.; Leinenkugel, P.; Zhou, Y.; Li, L.; Shen, Q. Drought impact on vegetation productivity in the Lower Mekong Basin. Int. J. Remote Sens. 2014, 35, 2835–2856. [Google Scholar] [CrossRef]
  73. Karnieli, A.; Agam, N.; Pinker, R.T.; Anderson, M.; Imhoff, M.L.; Gutman, G.G.; Panov, N.; Goldberg, A. Use of NDVI and land surface temperature for drought assessment: Merits and limitations. J. Clim. 2010, 23, 618–633. [Google Scholar] [CrossRef]
  74. Laosuwan, T.; Sangpradid, S.; Gomasathit, T.; Rotjanakusol, T. Application of remote sensing technology for drought monitoring in Mahasarakham Province, Thailand. Int. J. Geoinform. 2016, 12, 17–25. [Google Scholar]
  75. Rotjanakusol, T.; Laosuwan, T. Remote Sensing Based Drought Monitoring in the Middle-Part of Northeast Region of Thailand. Studia Univ. Vasile Goldis Arad Ser. Stiintele Vietii 2018, 28, 14–21. [Google Scholar]
  76. Thavorntam, W.; Tantemsapya, N. Vegetation greenness modeling in response to climate change for Northeast. Thailand. J. Geogr. Sci. 2013, 23, 1052–1068. [Google Scholar] [CrossRef]
  77. Khampeera, A.; Yongchalermchai, C.; Techato, K. Drought monitoring using drought indices and GIS techniques in Kuan Kreng peat swamp, Southern Thailand. Walailak J. Sci. Technol. (WJST) 2018, 15, 357–370. [Google Scholar] [CrossRef]
  78. Uttaruk, Y.; Laosuwan, T. Drought detection by application of remote sensing technology and vegetation phenology. J. Ecol. Eng. 2017, 18, 115–121. [Google Scholar] [CrossRef]
  79. Rotjanakusol, T.; Laosuwan, T. An Investigation of Drought around Chi Watershed During Ten-Year Period Using Terra/Modis Data. Geogr. Tech. 2019, 14, 74–83. [Google Scholar] [CrossRef] [Green Version]
  80. Uttaruk, Y.; Laosuwan, T. Drought Analysis Using Satellite-Based Data and Spectral Index in Upper Northeastern Thailand. Pol. J. Environ. Stud. 2019, 28, 4447–4454. [Google Scholar] [CrossRef]
  81. Chokkuea, W. Spatial-temporal Change of Land Surface Temperature using Satellite Remote Sensing Data. Studia Univ. Vasile Goldis Arad Ser. Stiintele Vietii (Life Sci. Ser.) 2019, 29, 65–69. [Google Scholar]
  82. Sangpradid, S.; Uttaruk, Y.; Rotjanakusol, T.; Laosuwan, T. Forecasting Time Series Change of the Average Enhanced Vegetation Index to Monitoring Drought Condition by Using Terra/Modis Data. Poljopr. Sumar. 2021, 67, 115–129. [Google Scholar] [CrossRef]
  83. Jomsrekrayom, N.; Meena, P.; Laosuwan, T. Spatiotemporal Analysis of Vegetation Drought Variability in the Middle of the Northeast Region of Thailand Using Terra/Modis Satellite Data. Geogr. Tech. 2021, 16, 70–81. [Google Scholar] [CrossRef]
  84. Rotjanakusol, T.; Laosuwan, T. Drought Evaluation with Ndvi-Based Standardized Vegetation Index in Lower Northeastern Region of Thailand. Geogr. Tech. 2019, 14, 118–130. [Google Scholar] [CrossRef]
  85. Thavorntam, W.; Tantemsapya, N.; Armstrong, L. A combination of meteorological and satellite-based drought indices in a better drought assessment and forecasting in Northeast Thailand. Nat. Hazards 2015, 77, 1453–1474. [Google Scholar] [CrossRef]
  86. Tran, H.T.; Campbell, J.B.; Tran, T.D.; Tran, H.T. Monitoring drought vulnerability using multispectral indices observed from sequential remote sensing (Case Study: Tuy Phong, Binh Thuan, Vietnam). GISci. Remote Sens. 2017, 54, 167–184. [Google Scholar] [CrossRef] [Green Version]
  87. Dang, T.; Yue, P.; Bachofer, F.; Wang, M.; Zhang, M. Monitoring Land Surface Temperature Change with Landsat Images during Dry Seasons in Bac Binh, Vietnam. Remote Sens. 2020, 12, 4067. [Google Scholar] [CrossRef]
  88. Tran, T.V.; Tran, D.X.; Myint, S.W.; Huang, C.-y.; Pham, H.V.; Luu, T.H.; Vo, T.M. Examining spatiotemporal salinity dynamics in the Mekong River Delta using Landsat time series imagery and a spatial regression approach. Sci. Total Environ. 2019, 687, 1087–1097. [Google Scholar] [CrossRef]
  89. Boyd, D.; Phipps, P.; Foody, G.; Walsh, R. Exploring the utility of NOAA AVHRR middle infrared reflectance to monitor the impacts of ENSO-induced drought stress on Sabah rainforests. Int. J. Remote Sens. 2002, 23, 5141–5147. [Google Scholar] [CrossRef]
  90. Boyd, D.; Foody, G.; Phipps, P. Dynamics of ENSO drought events on Sabah rainforests observed by NOAA AVHRR. Int. J. Remote Sens. 2006, 27, 2197–2219. [Google Scholar] [CrossRef]
  91. Razali, S.M.; Atucha, A.A.M.; Nuruddin, A.A.; Hamid, H.A.; Shafri, H.Z.M. Monitoring vegetation drought using MODIS remote sensing indices for natural forest and plantation areas. J. Spat. Sci. 2016, 61, 157–172. [Google Scholar] [CrossRef]
  92. Couturier, S.; Taylor, D.; Siegert, F.; Hoffmann, A.; Bao, M. ERS SAR backscatter: A potential real-time indicator of the proneness of modified rainforests to fire. Remote Sens. Environ. 2001, 76, 410–417. [Google Scholar] [CrossRef]
  93. Prasetyo, S.Y.J.; Hartomo, K.D.; Paseleng, M.C. Satellite imagery and machine learning for identification of aridity risk in central Java Indonesia. PeerJ Comput. Sci. 2021, 7, e415. [Google Scholar] [CrossRef]
  94. Prasetyo, S.Y.J.; Hartomo, K.D.; Paseleng, M.C.; Chandra, D.W.; Winarko, E. Satellite imagery and machine learning for aridity disaster classification using vegetation indices. Bull. Electr. Eng. Inform. 2020, 9, 1149–1158. [Google Scholar] [CrossRef] [Green Version]
  95. Arjasakusuma, S.; Yamaguchi, Y.; Hirano, Y.; Zhou, X. ENSO-and rainfall-sensitive vegetation regions in Indonesia as identified from multi-sensor remote sensing data. ISPRS Int. J. Geo-Inf. 2018, 7, 103. [Google Scholar] [CrossRef] [Green Version]
  96. Vadrevu, K.P.; Lasko, K.; Giglio, L.; Schroeder, W.; Biswas, S.; Justice, C. Trends in vegetation fires in south and southeast Asian countries. Sci. Rep. 2019, 9, 7422. [Google Scholar] [CrossRef]
  97. Sastry, N. Forest fires, air pollution, and mortality in Southeast Asia. Demography 2002, 39, 1–23. [Google Scholar] [CrossRef]
  98. Fuller, D.O.; Jessup, T.C.; Salim, A. Loss of forest cover in Kalimantan, Indonesia, since the 1997–1998 El Nino. Conserv. Biol. 2004, 18, 249–254. [Google Scholar] [CrossRef]
  99. Gutman, G.; Csiszar, I.; Romanov, P. Using NOAA/AVHRR products to monitor El Nino impacts: Focus on Indonesia in 1997–1998. Bull. Am. Meteorol. Soc. 2000, 81, 1189–1206. [Google Scholar] [CrossRef]
  100. Miettinen, J.; Shi, C.; Liew, S.C. Fire distribution in Peninsular Malaysia, Sumatra and Borneo in 2015 with special emphasis on peatland fires. Environ. Manag. 2017, 60, 747–757. [Google Scholar] [CrossRef]
  101. Langner, A.; Siegert, F. Spatiotemporal fire occurrence in Borneo over a period of 10 years. Glob. Change Biol. 2009, 15, 48–62. [Google Scholar] [CrossRef]
  102. Parameswaran, K.; Nair, S.K.; Rajeev, K. Impact of Indonesian forest fires during the 1997 El Nino on the aerosol distribution over the Indian Ocean. Adv. Space Res. 2004, 33, 1098–1103. [Google Scholar] [CrossRef]
  103. Chart-asa, C. Spatial-temporal patterns of MODIS active fire/hotspots in Chiang Rai, upper northern Thailand and the greater mekong subregion countries during 2003–2015. Appl. Environ. Res. 2021, 43, 121–131. [Google Scholar] [CrossRef]
  104. Nurhayati, A.D.; Saharjo, B.H.; Sundawati, L.; Syartinilia, S.; Cochrane, M.A. Forest and Peatland Fire Dynamics in South Sumatra Province. For. Soc. 2021, 5, 591–603. [Google Scholar] [CrossRef]
  105. Noojipady, P.; Morton, D.C.; Schroeder, W.; Carlson, K.M.; Huang, C.; Gibbs, H.K.; Burns, D.; Walker, N.F.; Prince, S.D. Managing fire risk during drought: The influence of certification and El Niño on fire-driven forest conversion for oil palm in Southeast Asia. Earth Syst. Dyn. 2017, 8, 749–771. [Google Scholar] [CrossRef] [Green Version]
  106. Siegert, F.; Ruecker, G.; Hinrichs, A.; Hoffmann, A. Increased damage from fires in logged forests during droughts caused by El Nino. Nature 2001, 414, 437–440. [Google Scholar] [CrossRef]
  107. Wooster, M.; Perry, G.; Zoumas, A. Fire, drought and El Niño relationships on Borneo (Southeast Asia) in the pre-MODIS era (1980–2000). Biogeosciences 2012, 9, 317–340. [Google Scholar] [CrossRef] [Green Version]
  108. Sloan, S.; Locatelli, B.; Wooster, M.J.; Gaveau, D.L. Fire activity in Borneo driven by industrial land conversion and drought during El Niño periods, 1982–2010. Glob. Environ. Change 2017, 47, 95–109. [Google Scholar] [CrossRef] [Green Version]
  109. Lohberger, S.; Stängel, M.; Atwood, E.C.; Siegert, F. Spatial evaluation of Indonesia’s 2015 fire-affected area and estimated carbon emissions using Sentinel-1. Glob. Change Biol. 2018, 24, 644–654. [Google Scholar] [CrossRef]
  110. Fanin, T.; van der Werf, G.R. Precipitation—Fire linkages in Indonesia (1997–2015). Biogeosciences 2017, 14, 3995–4008. [Google Scholar] [CrossRef] [Green Version]
  111. Hidayat, H.; Teuling, A.J.; Vermeulen, B.; Taufik, M.; Kastner, K.; Geertsema, T.J.; Bol, D.C.; Hoekman, D.H.; Haryani, G.S.; Van Lanen, H.A.; et al. Hydrology of inland tropical lowlands: The Kapuas and Mahakam wetlands. Hydrol. Earth Syst. Sci. 2017, 21, 2579–2594. [Google Scholar] [CrossRef] [Green Version]
  112. Mohammed, I.N.; Bolten, J.D.; Srinivasan, R.; Lakshmi, V. Satellite observations and modeling to understand the Lower Mekong River Basin streamflow variability. J. Hydrol. 2018, 564, 559–573. [Google Scholar] [CrossRef]
  113. Frappart, F.; Biancamaria, S.; Normandin, C.; Blarel, F.; Bourrel, L.; Aumont, M.; Azemar, P.; Vu, P.-L.; Le Toan, T.; Lubac, B.; et al. Influence of recent climatic events on the surface water storage of the Tonle Sap Lake. Sci. Total Environ. 2018, 636, 1520–1533. [Google Scholar] [CrossRef] [Green Version]
  114. Aires, F.; Venot, J.-P.; Massuel, S.; Gratiot, N.; Pham-Duc, B.; Prigent, C. Surface water evolution (2001–2017) at the Cambodia/Vietnam border in the upper mekong delta using satellite MODIS observations. Remote Sens. 2020, 12, 800. [Google Scholar] [CrossRef] [Green Version]
  115. Pham-Duc, B.; Papa, F.; Prigent, C.; Aires, F.; Biancamaria, S.; Frappart, F. Variations of surface and subsurface water storage in the Lower Mekong Basin (Vietnam and Cambodia) from multisatellite observations. Water 2019, 11, 75. [Google Scholar] [CrossRef] [Green Version]
  116. Soulard, C.E.; Walker, J.J.; Petrakis, R.E. Implementation of a surface water extent model in Cambodia using cloud-based remote sensing. Remote Sens. 2020, 12, 984. [Google Scholar] [CrossRef] [Green Version]
  117. Tanaka, M.; Sugimura, T.; Tanaka, S.; Tamai, N. Flood–drought cycle of Tonle Sap and Mekong Delta area observed by DMSP-SSM/I. Int. J. Remote Sens. 2003, 24, 1487–1504. [Google Scholar] [CrossRef]
  118. Erban, E.L.; Gorelick, S.M. Closing the irrigation deficit in Cambodia: Implications for transboundary impacts on groundwater and Mekong River flow. J. Hydrol. 2016, 535, 85–92. [Google Scholar] [CrossRef] [Green Version]
  119. Gu, Z.; Zhang, Y.; Fan, H. Mapping inter-and intra-annual dynamics in water surface area of the Tonle Sap Lake with Landsat time-series and water level data. J. Hydrol. 2021, 601, 126644. [Google Scholar] [CrossRef]
  120. Hashim, M.; Reba, N.M.; Nadzri, M.I.; Pour, A.B.; Mahmud, M.R.; Yusoff, A.R.M.; Ali, M.I.; Jaw, S.; Hossain, M.S. Satellite-based run-off model for monitoring drought in Peninsular Malaysia. Remote Sens. 2016, 8, 633. [Google Scholar] [CrossRef] [Green Version]
  121. Fok, H.S.; He, Q.; Chun, K.P.; Zhou, Z.; Chu, T. Application of ENSO and drought indices for water level reconstruction and prediction: A case study in the lower Mekong River estuary. Water 2018, 10, 58. [Google Scholar] [CrossRef] [Green Version]
  122. Le, M.-H.; Lakshmi, V.; Bolten, J.; Du Bui, D. Adequacy of satellite-derived precipitation estimate for hydrological modeling in Vietnam Basins. J. Hydrol. 2020, 586, 124820. [Google Scholar] [CrossRef]
  123. Jing, W.; Zhao, X.; Yao, L.; Jiang, H.; Xu, J.; Yang, J.; Li, Y. Variations in terrestrial water storage in the Lancang-Mekong river basin from GRACE solutions and land surface model. J. Hydrol. 2020, 580, 124258. [Google Scholar] [CrossRef]
  124. Mariano, D.A.; dos Santos, C.A.; Wardlow, B.D.; Anderson, M.C.; Schiltmeyer, A.V.; Tadesse, T.; Svoboda, M.D. Use of remote sensing indicators to assess effects of drought and human-induced land degradation on ecosystem health in Northeastern Brazil. Remote Sens. Environ. 2018, 213, 129–143. [Google Scholar] [CrossRef]
  125. Tangang, F.; Juneng, L.; Cruz, F.; Chung, J.X.; Ngai, S.T.; Salimun, E.; Mohd, M.S.F.; Santisirisomboon, J.; Singhruck, P.; PhanVan, T.; et al. Multi-model projections of precipitation extremes in Southeast Asia based on CORDEX-Southeast Asia simulations. Environ. Res. 2020, 184, 109350. [Google Scholar]
  126. Nita, I.; Putra, A.N.; Fibrianingtyas, A. Analysis of drought hazards in agricultural land in Pacitan Regency, Indonesia. SAINS TANAH-J. Soil Sci. Agroclimatol. 2020, 17, 7–15. [Google Scholar] [CrossRef]
  127. Hien, L.T.T.; Gobin, A.; Huong, P.T.T. Spatial indicators for desertification in southeast Vietnam. Nat. Hazards Earth Syst. Sci. 2019, 19, 2325–2337. [Google Scholar] [CrossRef] [Green Version]
  128. Thy, P.T.M.; Ngoc, T.H.T.; Truong, T.N.K.; Nguyen, L.-D.; Nguyen-Huy, T. Specifying the relationship between land use/land cover change and dryness in central Vietnam from 2000 to 2019 using Google Earth Engine. J. Appl. Remote Sens. 2021, 15, 024503. [Google Scholar]
  129. Tran, H.T.; Campbell, J.B.; Wynne, R.H.; Shao, Y.; Phan, S.V. Drought and human impacts on land use and land cover change in a Vietnamese coastal area. Remote Sens. 2019, 11, 333. [Google Scholar] [CrossRef] [Green Version]
  130. Phan, V.H.; Dinh, V.T.; Su, Z. Trends in long-term drought changes in the mekong river delta of Vietnam. Remote Sens. 2020, 12, 2974. [Google Scholar] [CrossRef]
  131. Tran, T.V.; Tran, D.X.; Myint, S.W.; Latorre-Carmona, P.; Ho, D.D.; Tran, P.H.; Dao, H.N. Assessing spatiotemporal drought dynamics and its related environmental issues in the mekong river delta. Remote Sens. 2019, 11, 2742. [Google Scholar] [CrossRef] [Green Version]
  132. Le, T.; Sun, C.; Choy, S.; Kuleshov, Y. Regional drought risk assessment in the Central Highlands and the South of Vietnam. Geomat. Nat. Hazards Risk 2021, 12, 3140–3159. [Google Scholar] [CrossRef]
  133. Le, M.-H.; Kim, H.; Moon, H.; Zhang, R.; Lakshmi, V.; Nguyen, L.-B. Assessment of drought conditions over Vietnam using standardized precipitation evapotranspiration index, MERRA-2 re-analysis, and dynamic land cover. J. Hydrol. Reg. Stud. 2020, 32, 100767. [Google Scholar] [CrossRef]
  134. Palmer, W.C. Meteorological Drought; US Department of Commerce, Weather Bureau: Washington, DC, USA, 1965; Volume 30.
  135. Tian, Y.; Peters-Lidard, C.D. A global map of uncertainties in satellite-based precipitation measurements. Geophys. Res. Lett. 2010, 37, L24407. [Google Scholar] [CrossRef]
  136. Sun, Q.; Miao, C.; Duan, Q.; Ashouri, H.; Sorooshian, S.; Hsu, K.L. A review of global precipitation data sets: Data sources, estimation, and intercomparisons. Rev. Geophys. 2018, 56, 79–107. [Google Scholar] [CrossRef] [Green Version]
  137. Vu, T.M.; Raghavan, S.V.; Liong, S.Y.; Mishra, A.K. Uncertainties of gridded precipitation observations in characterizing spatio-temporal drought and wetness over Vietnam. Int. J. Climatol. 2018, 38, 2067–2081. [Google Scholar] [CrossRef]
  138. Kuswanto, H.; Naufal, A. Evaluation of performance of drought prediction in Indonesia based on TRMM and MERRA-2 using machine learning methods. MethodsX 2019, 6, 1238–1251. [Google Scholar] [CrossRef]
  139. Vernimmen, R.; Hooijer, A.; Aldrian, E.; Van Dijk, A. Evaluation and bias correction of satellite rainfall data for drought monitoring in Indonesia. Hydrol. Earth Syst. Sci. 2012, 16, 133–146. [Google Scholar] [CrossRef] [Green Version]
  140. Tan, M.L.; Chua, V.P.; Tan, K.C.; Brindha, K. Evaluation of TMPA 3B43 and NCEP-CFSR precipitation products in drought monitoring over Singapore. Int. J. Remote Sens. 2018, 39, 2089–2104. [Google Scholar] [CrossRef]
  141. Tan, M.L.; Tan, K.C.; Chua, V.P.; Chan, N.W. Evaluation of TRMM product for monitoring drought in the Kelantan River Basin, Malaysia. Water 2017, 9, 57. [Google Scholar] [CrossRef] [Green Version]
  142. Zad, S.N.M.; Zulkafli, Z.; Muharram, F.M. Satellite rainfall (TRMM 3B42-V7) performance assessment and adjustment over Pahang River Basin, Malaysia. Remote Sens. 2018, 10, 388. [Google Scholar]
  143. Chu, H.-J.; Wijayanti, R.F.; Jaelani, L.M.; Tsai, H.-P. Time Varying Spatial Downscaling of Satellite-Based Drought Index. Remote Sens. 2021, 13, 3693. [Google Scholar] [CrossRef]
  144. Gerke, S.; Evers, H.-D. Globalizing local knowledge: Social science research on Southeast Asia, 1970–2000. SOJOURN—J. Soc. Issues Southeast Asia 2006, 21, 1–21. [Google Scholar] [CrossRef]
  145. UNESCAP. ASEAN Regional Plan of Action for Adaptation to Drought 2021–2025; UNESCAP: Bangkok, Thailand, 2021. [Google Scholar]
  146. Cammalleri, C.; Arias-Muñoz, C.; Barbosa, P.; de Jager, A.; Magni, D.; Masante, D.; Mazzeschi, M.; McCormick, N.; Naumann, G.; Spinoni, J.; et al. A revision of the Combined Drought Indicator (CDI) used in the European Drought Observatory (EDO). Nat. Hazards Earth Syst. Sci. 2021, 21, 481–495. [Google Scholar] [CrossRef]
  147. Del Pilar Jiménez-Donaire, M.; Tarquis, A.; Giráldez, J.V. Evaluation of a combined drought indicator and its potential for agricultural drought prediction in southern Spain. Nat. Hazards Earth Syst. Sci. 2020, 20, 21–33. [Google Scholar] [CrossRef] [Green Version]
  148. Bayissa, Y.A.; Tadesse, T.; Svoboda, M.; Wardlow, B.; Poulsen, C.; Swigart, J.; Van Andel, S.J. Developing a satellite-based combined drought indicator to monitor agricultural drought: A case study for Ethiopia. GISci. Remote Sens. 2019, 56, 718–748. [Google Scholar] [CrossRef]
  149. Sepulcre-Canto, G.; Horion, S.; Singleton, A.; Carrao, H.; Vogt, J. Development of a Combined Drought Indicator to detect agricultural drought in Europe. Nat. Hazards Earth Syst. Sci. 2012, 12, 3519–3531. [Google Scholar] [CrossRef] [Green Version]
  150. Otkin, J.A.; Svoboda, M.; Hunt, E.D.; Ford, T.W.; Anderson, M.C.; Hain, C.; Basara, J.B. Flash droughts: A review and assessment of the challenges imposed by rapid-onset droughts in the United States. Bull. Am. Meteorol. Soc. 2018, 99, 911–919. [Google Scholar] [CrossRef]
  151. Lu, J.; Jia, L.; Menenti, M.; Yan, Y.; Zheng, C.; Zhou, J. Performance of the standardized precipitation index based on the TMPA and CMORPH precipitation products for drought monitoring in China. IEEE J. Sel. Top. Appl. Earth Obs. Remote Sens. 2018, 11, 1387–1396. [Google Scholar] [CrossRef]
  152. Vrieling, A. Satellite remote sensing for water erosion assessment: A review. Catena 2006, 65, 2–18. [Google Scholar] [CrossRef]
  153. Avitabile, V.; Herold, M.; Henry, M.; Schmullius, C. Mapping biomass with remote sensing: A comparison of methods for the case study of Uganda. Carbon Balance Manag. 2011, 6, 7. [Google Scholar] [CrossRef] [Green Version]
  154. Priya, S.; Shibasaki, R. National spatial crop yield simulation using GIS-based crop production model. Ecol. Model. 2001, 136, 113–129. [Google Scholar] [CrossRef]
  155. Lai, C.; Zhong, R.; Wang, Z.; Wu, X.; Chen, X.; Wang, P.; Lian, Y. Monitoring hydrological drought using long-term satellite-based precipitation data. Sci. Total Environ. 2019, 649, 1198–1208. [Google Scholar] [CrossRef] [PubMed]
  156. Li, P.; Feng, Z.; Xiao, C. Acquisition probability differences in cloud coverage of the available Landsat observations over mainland Southeast Asia from 1986 to 2015. Int. J. Digit. Earth 2018, 11, 437–450. [Google Scholar] [CrossRef]
  157. Nguyen, M.D.; Baez-Villanueva, O.M.; Bui, D.D.; Nguyen, P.T.; Ribbe, L. Harmonization of landsat and sentinel 2 for crop monitoring in drought prone areas: Case studies of Ninh Thuan (Vietnam) and Bekaa (Lebanon). Remote Sens. 2020, 12, 281. [Google Scholar] [CrossRef] [Green Version]
Figure 1. An overview of the drought types and their associated factors and impacts on land features, such as increased crop failure and vegetation stress. This figure is intended to provide a general overview of the main drought types, impacts and responses, as drought conditions may vary from place to place; consequently, their impacts and responses vary. Most of symbols were extracted from the University of Maryland (https://ian.umces.edu/, last accessed on 5 May 2022).
Remotesensing 14 03763 g001
Figure 2. The simplified diagram describes the process from the keyword search to the final article selection. The details of the keyword and article selection are presented in the text.
Remotesensing 14 03763 g002
Figure 3. The bar plot shows the growing number of drought studies in Southeast Asia from 2000 to 2021. Agricultural drought had the largest number of publications, while hydrology and forest-related drought received the least attention.
Remotesensing 14 03763 g003
Figure 4. The number of journals and categories that reported drought publications in Southeast Asia between 2000 and 2021. The “others” in the horizontal bar plot represents journals with only one article, whereas the category “others” in the pie chart contains journals with broad topics that fall outside of the pre-defined categories (e.g., agriculture and forestry). Some of the journal abbreviations used in this figure follow the list compiled by the Swiss Federal Institute for Forest, Snow and Landscape Research (https://www.wsl.ch/, accessed on 25 March 2022).
Remotesensing 14 03763 g004
Figure 5. The map shows the spatial distribution of drought publications in Southeast Asian countries. The color codes indicate the total number of reported drought articles, including local and transboundary studies (a) and the number of reported local and national drought publications (b). The maps used in this figure were obtained from GADM (https://gadm.ogr, last accessed on 25 February 2022).
Remotesensing 14 03763 g005
Figure 6. The contribution of corresponding authors to drought publications over the past two decades. Among the Southeast Asian countries, Thailand and Vietnam had the highest percentage of corresponding authors, whereas China and the United States of America contributed significantly to the remote sensing-based drought studies of Southeast Asia.
Remotesensing 14 03763 g006
Figure 7. The articles in drought remote sensing, along with the reported investigated timeframe. The various colors represent mono-temporal (blue), multi-temporal (green), and time-series (dark yellow) studies, respectively.
Remotesensing 14 03763 g007
Figure 8. The relationship between the spatial extent and mapping resolution among all of the drought remote sensing articles in Southeast Asia from 2000 to 2021. The color bar represents the years of publications.
Remotesensing 14 03763 g008
Figure 9. The validation strategies and data used in the corresponding strategies. The inner chart presents validation strategies, whereas the outer chart depicts the specific data used to validate the produced drought products. This review considered the major validated data, but it is admitted that few studies are reported to use more than one data type for validation.
Remotesensing 14 03763 g009
Figure 10. Various sensors used for drought monitoring and assessment. The color codes represent the types of sensors in the bar plots, while the pie chart indicates the percentage of articles associated with each remote sensing category.
Remotesensing 14 03763 g010
Figure 11. The input variables derived from remote sensing used for drought analysis. Vegetation indices were by far the most common extracted variable for assessing and monitoring droughts in Southeast Asia. The “others” indicate the remaining reported input variables, such as evapotranspiration, spectral bands, and burnt areas. Some studies employed multiple input variables.
Remotesensing 14 03763 g011
Figure 12. Drought indicators and indices used for characterizing and assessing drought conditions and their impacts in Southeast Asia over the past 21 years. The “others” indicate drought indicators/indices with a frequency of less than three. Many studies employed more than one drought indicator/index.
Remotesensing 14 03763 g012
Figure 13. The summary of drought applications in four major domains with ten subcategories, including crop stress, land use change, soil moisture, vegetation stress, streamflow and water surface variability, fire mapping, fire hotspot analysis, fire risk assessment and other-related droughts.
Remotesensing 14 03763 g013
Table 1. Summary of drought impacts in Southeast Asia from 1960 to 2021.
CountryDrought YearAssociated ConsequencesNo. of DeathsNo. of Affected PeopleNo. of HomelessCost
(×103 USD)
No. of Events
Indonesia1966, 1972, 1978, 1982, 1984, 1986, 1987, 1991, 1994, 1997, 1998, 1999, 2000, 2002, 2003, 2005, 2006, 2015, 2019Epidemic, Wildfire, Cold wave, Storm, Famine, Pollution97908,246,535017,468,12422
Laos1977, 1987, 1988, 1991, 1999, 2019-04,250,000019906
Philippines1978, 1980, 1983, 1985, 1987, 1990, 1998, 2000, 2002, 2007, 2015, 2019-3715,749,0940299,89914
Myanmar1979, 1981, 2018-2558,58820 00041,0703
Cambodia1987, 1994, 2001, 2002, 2005, 2016-09,050,0000240,0546
Vietnam1987, 1997, 1999, 2002, 2005, 2015, 2019Food shortage, Water shortage08,545,55808,763,7288
Malaysia1993, 1995, 1997, 1998, 2005, 2014Pollution722,205,0003000509,7587
Thailand1991, 1993, 1999, 2002, 2005, 2008, 2010, 2011, 2012, 2014, 2015, 2016, 2019Pollution7742,982,60204,364,11315
Brunei1998-00033251
Timor-Leste2007, 2016-0120,000002
Total 1033581,207,37723,00031,622,06184
Source: EM-DAT, The International Disasters Database https://www.emdat.be (accessed on 29 December 2021).
Table 2. A list of relevant variables used to derive the systematic plots and tables in this review.
Variables Recorded
Article code; Authors; Article title; Publication year; Journals; Journal categories;
Corresponding authors’ country; Study country; Spatial scale a; Spatial extent (km2); Spatial resolution (m); Validation strategies b; Validation data; Drought indices;
Remote sensing-derived input variable categories; Drought types c;
Drought applications; Satellite sensors; Remote sensing categories d; Datasets;
Temporal resolution e; Starting year of investigation, Ending year of investigation; Length of study; Notes.
a Transboundary, local, and national; b in-situ source, modeled source, and not reported; c meteorological, hydrological, agricultural, and wildfire-related droughts; d passive microwave, active microwave, thermal, optical, and multi-type remote sensing; e mono-temporal, multi-temporal, and time-series.
Publisher’s Note: MDPI stays neutral with regard to jurisdictional claims in published maps and institutional affiliations.

