Article

Deriving Urban Boundaries of Henan Province, China, Based on Sentinel-2 and Deep Learning Methods

1
The College of Geography and Environment Science, Henan University, Kaifeng 475004, China
2
Key Laboratory of Geospatial Technology for Middle and Lower Yellow River Regions, Ministry of Education, Kaifeng 475004, China
3
Henan Industrial Technology Academy of Spatio-Temporal Big Data, Henan University, Kaifeng 475004, China
4
Institute of Urban Big Data, Henan University, Kaifeng 475004, China
*
Author to whom correspondence should be addressed.
Remote Sens. 2022, 14(15), 3752; https://doi.org/10.3390/rs14153752
Submission received: 9 May 2022 / Revised: 25 July 2022 / Accepted: 27 July 2022 / Published: 5 August 2022

Abstract

:
Accurate urban boundary data can directly reflect the expansion of urban space, help us accurately grasp the scale and form of urban space, and play a vital role in urban land development and policy-making. However, the lack of reliable multiscale and high-precision urban boundary data products and relevant training datasets has become one of the major factors hindering their application. The purpose of this study is to combine Sentinel-2 remote-sensing images and supplementary geographic data to generate a reliable high-precision urban boundary dataset for Henan Province (called HNUB2018). First, this study puts forward a clear definition of “urban boundary”. Using this concept as its basis, it proposes a set of operable urban boundary delimitation rules and technical processes. Then, based on Sentinel-2 remote-sensing images and supplementary geographic data, the urban boundaries of Henan Province are delimited by a visual interpretation method. Finally, the applicability of the dataset is verified by using a classical semantic segmentation deep learning model. The results show that (1) HNUB2018 has clear and rich detailed features as well as a detailed spatial structure of urban boundaries. The overall accuracy of HNUB2018 is 92.82% and the kappa coefficient reaches 0.8553, which is better than GUB (Henan) in overall accuracy. (2) HNUB2018 is well suited for deep learning, with excellent reliability and scientific validity. The research results of this paper can provide data support for studies of urban sprawl monitoring and territorial spatial planning, and will support the development of reliable datasets for fields such as intelligent mapping of urban boundaries, showing prospects and possibilities for wide application in urban research.

Graphical Abstract

1. Introduction

Urban boundaries are basic information for understanding and studying urbanization, and they are also an important basis for land-use control and urban–rural development planning [1]. With the acceleration of population growth and urbanization, the rapid expansion of urban areas and the conversion of large areas of nonurban land into urban [2] have brought about problems such as wasted land resources, the disorderly spread of cities, and the destruction of the ecological environment [3], which have seriously affected the sustainable development of social economies. In order to realize the fine control of urban development and land use, it is becoming more and more important to carry out dynamic monitoring and extraction of urban boundaries.
Traditional approaches to urban boundary extraction have adopted traditional geographic information system (GIS) spatial analyses and mapping methods. These may be combined with multisource remote-sensing data and basic geographic information, such as population, social economy, digital elevation models [4], urban infrastructure lines [5] and hydro-climatic factors [6]. Urban boundaries have been delimited through multielement fusion [7] and kernel density analysis [8]. Although these methods are easy to operate, they have diverse sources of spatial data, the evaluation systems are inconsistent with delimitation standards, and they are difficult to use for obtaining spatially unified scaled data, which reduces their applicability.
In recent years, with the increasing enrichment of medium- and high-resolution and hyperspectral remote-sensing data [9], scholars have increasingly used remote-sensing information indices and feature extraction to divide urban boundaries, based on different multisource remote-sensing images. Such features include spatial properties, such as marginal density and texture features [10], and remote-sensing information indices, such as NDVI, NDBI, MNDWI, etc. [11,12].
The remote sensing data sources used include MODIS [13,14], the Landsat series [15,16,17,18], and DMSP/OLS nighttime light data [19,20,21,22], but the spatial resolution of these remote sensing products is relatively low. High-resolution remote sensing data sources include QuickBird, IKONOS, and Gaofen2 [23,24,25]; these products are very expensive, and Sentinel-2, which is free and has high resolution, has therefore become the data source of choice for many studies [26]. By processing remote-sensing images and extracting remote-sensing information and features, the boundaries of built-up urban areas can be better extracted [10]. Although previous studies have proved that interference factors such as clouds, spatial resolution, and noise brought by the topographic effects in satellite images can be attenuated by the spectral similarity between visible and near-infrared bands, these continue to reduce the urban boundary extraction accuracy to some extent [11]. With the development of artificial intelligence technology, more and more scholars have begun to using machine-learning and deep-learning technology for remote-sensing classification, to reduce the influence of the above factors. For example, random forest [7], deep belief network [27], deep convolution neural network [28,29,30,31], and other methods have gradually shown improved accuracy in the tasks of classification, information extraction, change monitoring, among other functions [32]. The combination of deep learning and remote sensing has greatly improved classification efficiency and has achieved remarkable results in the field of urban remote-sensing classification.
However, in the field of deep-learning image segmentation, there remain several unsolved fundamental problems, including effective learning, full integration and utilization of multiscale remote-sensing features, accurate extraction of high-level spatial semantic information, and a lack of sufficient and reliable data sets. In particular, there is a lack of reliable high-precision urban boundary data products and training datasets for the intelligent remote-sensing mapping of urban boundaries [10,11,12,13,14,15,16,17,18,19,20,21,22,23]. As a result, in terms of remote-sensing classification and urban boundary delimitation, the resulting divisions are generally not fine enough, their accuracy is not high, and the degree of automation is comparatively low [10,33], all of which greatly reduce the effect and implementation efficiency of urban boundary classification.
In summary, Henan Province in China was used as the study area in this paper because its climate and landscape are to some extent typical of provinces in China. Based on Sentinel-2 remote-sensing images and visual interpretation, an urban boundary dataset for Henan Province (2018) was produced. The reliability of this dataset was proved by comparing it with other urban boundary datasets, and the applicability of the dataset was verified by using the classical deep learning model and the K-fold cross-validation method. This study not only contributes to the promotion of urban boundary research in Henan Province and China, but also provides a practical research case study applicable to other regions around the world. Meanwhile, the study provides reliable data support for urban studies including urban sprawl monitoring and territorial spatial planning, and helps to improve the refinement and automation of urban boundary mapping.

2. Data Sources and Preprocessing

2.1. Study Area

Henan Province is located in central China (see Figure 1). Its geographical location is between 31°23′ to 36°22′N and 110°21′ to 116°39′E; it spans the Yangtze River, Huaihe River, Yellow River, and Haihe River. The total area of the province is 167,000 square kilometers, ranking 17th among all provinces, autonomous regions, and cities in China, and accounting for 1.73% of the total area of the country. Henan Province governs 17 prefecture-level cities, namely Zhengzhou, Kaifeng, Luoyang, Pingdingshan, Anyang, Hebi, Xinxiang, Jiaozuo, Puyang, Xuchang, Luohe, Sanmenxia, Shangqiu, Zhoukou, Zhumadian, Nanyang, and Xinyang, and one county-level city, Jiyuan, under direct central governance.
Henan Province is located in the interior of the Asian continent, between subtropical and warm temperate zones. It has a typical continental monsoon climate. There are four distinct seasons in the province, with associated rain and temperature patterns. The west and northwest of Henan Province are mountainous and hilly, and the terrain in the centre, east, and south is flat, consisting of mostly plains and basins. Due to its special geographical location and complex climate characteristics, Henan Province is prone to natural disasters such as floods, droughts, diseases and pests, and earthquakes. Henan Province is located in the hinterland of the Central Plains, and has crisscrossing road networks which play a role in connecting the east and west, and provide north–south transit networks across the country. Zhengzhou, the provincial capital, is located to the north of the center of Henan Province; it has a developed transportation system and is an important transportation hub within China. According to the seventh National Census Report [34], Henan has an urban population of 55.07 million and a rural population of 44.28 million, with an urbanization rate of 55.43%.

2.2. Research Data

The data used in this study were Sentinel-2 remote-sensing images and auxiliary geospatial data (see Table 1 and Table 2). Sentinel-2 is a high-resolution multispectral imaging satellite, which can obtain optical images with a wide coverage and short revisit cycle. Its data can be used for research into land-cover status, land monitoring, and environmental change. It uses 13 bands in total, and different bands have different resolutions. Among these, bands 2, 3, and 4 are visible bands, corresponding to the blue, green, and red bands, respectively, with a resolution of 10 m. The Sentinel-2 data in this study were downloaded from the website of the United States Geological Survey (USGS; http://glovis.usgs.gov/; accessed on January 2019); from which we selected images from 2018 covering the whole of Henan Province and which contained less than 5% cloud cover. We also consulted Google Maps to assist in the interpretation of ground features.
The administrative division map of Henan province comes from the 2018 geographic situation monitoring cloud platform (http://www.dsac.cn/; accessed on January 2019). BIGEMAP is an online mapping GIS software system based in China, providing data editing, data processing, data sharing, data cloud, data visualization, and other functions. The point data for the Henan Administrative Region were downloaded with the BIGEMAP software (version 25.5.0.1).

2.3. Data Preprocessing

Sentinel-2 images from September to October 2018 were selected. At this time, the image cloud coverage was low, the definition and contrast were high, and the visual conditions were good. All remote-sensing images in this study covered the whole of Henan Province. We selected remote-sensing images with high definition, bright color, strong contrast, high visibility, and similar temporal phases, and excluded imaging data blocked and blurred by ground objects due to weather, cloud coverage, or other reasons. The 2, 3, and 4 bands were used to synthesize the true color images, and were consistent with the colors of real ground objects. The image resolution was set to 10 m, which was conducive for visual interpretation. Each remote-sensing image was divided into 18 remote-sensing image data units according to the municipal administrative region, which allowed us to delimit the urban boundaries.

3. Methods and Technical Route

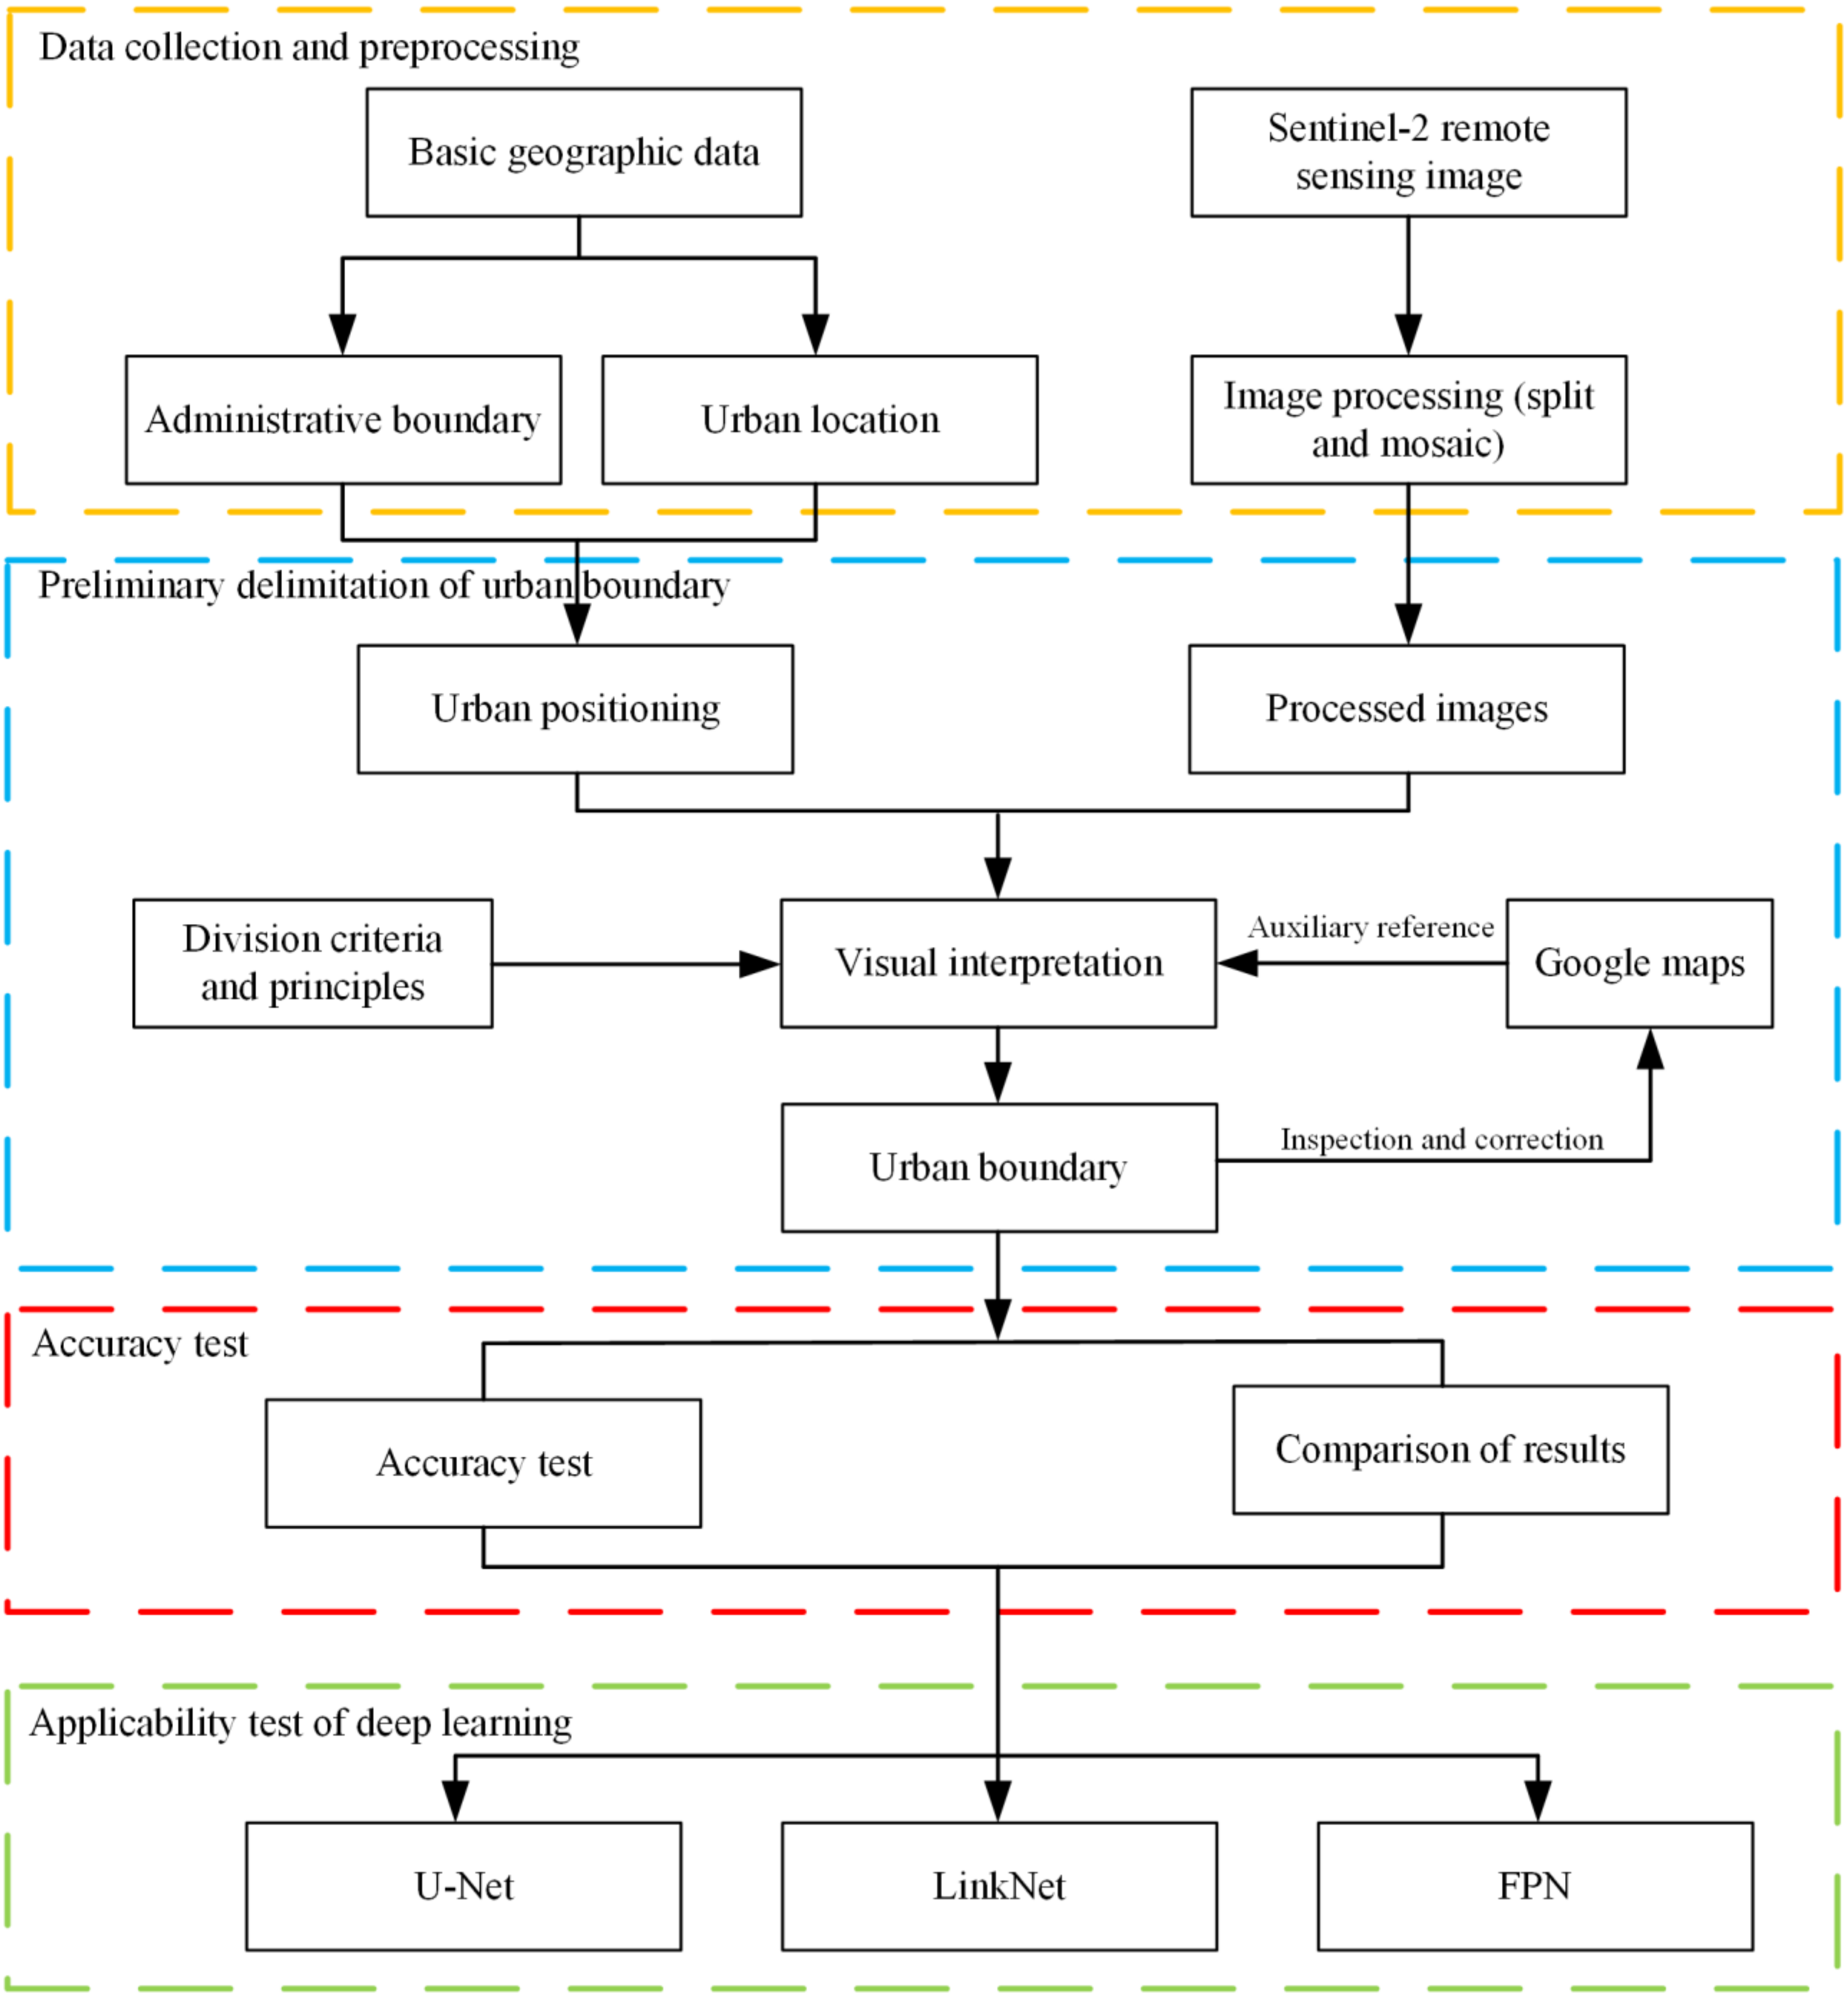
The research framework flow of this paper is shown in Figure 2. It included four sections: data collection and preprocessing, preliminary delimitation of urban boundaries, accuracy testing, and applicability testing of the deep learning. First, we collected the research data, including the Sentinel-2 remote-sensing images and basic geographic information data for Henan Province, and preprocessed the data. The main software used for preprocessing was ENVI 5.3. Secondly, according to our division standards and principles, the urban boundaries were delimited on the basis of the data preprocessing, where the delimitation process was assisted by consulting Google Maps. Then, the accuracy of the verified urban boundary data was verified by sampling, which was compared with the public dataset for the same period. Finally, the deep learning applicability of the verified data set was tested and analyzed using three classical network models on the PyTorch framework: U-Net [35], LINKnet [36], and FPN [37].

3.1. Defining City Boundaries

A clear definition of “urban boundary” is of great significance for their accurate delimitation. However, at present, there is no unified standard concept of “urban boundary” [38]. Referring to existing concepts and division standards of urban boundaries, this paper defines an urban boundary as follows: “an urban boundary refers to the obvious boundary between urban areas and nonurban areas in the process of urban growth, which not only includes current built-up urban areas, but also meets the urban development scale and trend in a certain period into the future”.

3.2. Determination and Delimitation of Objectives

The research scope of this paper covers 18 municipal administrative regions of Henan Province (including one county-level city). The extracted urban areas contained urban areas above the county level, including prefecture-level urban areas and county-level urban areas. If it was determined that an urban area was larger than the smallest county-level city in the administrative unit, it was included as an extraction target. The objectives for extraction included basic built-up areas and potential development areas.
A basic built-up area is an area where the government organization of the city is located; that is, an area that has actually been developed and constructed in sections and has municipal public facilities [39]. Specifically, this means urban lands with urban landscapes and urban functions, including residential areas, streets, hospitals, schools, public green spaces, urban water bodies, office buildings, commercial stores, squares, parks, and other public facilities. A potential development area refers to an urban area closely connected with the central urban area, which has an imperfect urban infrastructure or is under construction; examples include urban development zones and villages in a city. Whether the marginal urban–rural fringe belongs to the urban scope was comprehensively determined according to its distance and connectivity with the urban center, and the accessibility of urban infrastructure services. Outside the urban boundary is nonurban land, including rural residential areas, large tracts of farmland, mountains, woodlands, unused land, etc.

3.3. Principles of Urban Boundary Delimitation

On the basis of referring to the five principles of urban boundary extraction proposed by [2], combined with the spatial distribution characteristics of urban and rural provincial areas, this paper puts forward seven delimitation principles as follows:
(1)
The principle of administrative divisions. The intention was to delimit urban boundaries within each administrative region.
(2)
The principle of urban boundary direction. When sketching an urban boundary, priority was given to sketching linear features such as roads and rivers, and it was forbidden to cross houses, residential areas, large structures, parks, green spaces, sites under construction, farmland, forest land, or other large features. This involved drawing along the boundary of block features in areas without obvious linear features.
(3)
The principle of centralized connection. As a whole, the concentrated contiguous area was divided into the interior of the urban boundary. Where the block features were separated by small areas of agricultural land or non-construction land, this part of the partition plot was included in the interior of the urban area to keep the whole city a centralized and contiguous area.
(4)
The principle of judging urban landscape. The aim was to judge whether ground objects belonged to the urban area according to the urban landscape. The urban landscape within the urban boundary mainly included housing construction areas, structures, urban roads, urban squares, parks, parking lots, stadiums, urban green spaces, urban waters, etc. [40,41].
(5)
The principle of judging the enclaved urban area. In the process of urbanization, urban plots may have become spatially disconnected from the central urban area but remain functionally connected with the central city. Their characteristics are (a) they are connected with the urban regional center through trunk roads; (b) they have obvious urban landscape characteristics; and (c) the administrative departments, residential areas, large communities, colleges and universities, scientific research institutions, high-tech development zones, industrial and mining land, and other special areas are located in large, concentrated areas.
(6)
The principle of connecting adjacent urban areas. Where urban spatial integration was observed to connect adjacent cities, it was divided between the two main urban areas along lines according to the connectivity of roads, urban buildings, and rivers and water bodies.
(7)
The principle of farmland differentiation. A large area of regular farmland can be used as an important marker to distinguish urban and nonurban areas. Generally, the internal promotion was carried out with a piece of regular farmland as the bottom line to find the urban boundary line. No urban landscape within 50 hectares of regular farmland boundary was divided into nonurban areas.

3.4. Urban Boundary Delimitation Steps

3.4.1. Determination of Urban Points and Delimitation of Urban Units

The point of interest (POI) data was used for extracting the administrative center above the county level and determining the location of the target city. Taking Henan Province as an example, the research area was divided into 18 extraction units. The urban boundaries were delimited according to the extracted administrative units. The initial target urban area was determined according to the county-level administrative center, and the urban image in the extraction unit was preliminarily interpreted. If it was found that there was an urban area larger than the smallest county-level city in the unit, the town was also included in the division target of the urban boundary. Finally, the point distribution of all target cities in the study area was obtained, as shown in Figure 3.

3.4.2. Initial Delimitation of Urban Boundaries

According to the scope of an urban outline, our delimitation process involved moving along an urban trunk road to the urban boundary zone, and then to any non-trunk road; this point was then taken as the starting point. The choice of boundary roads could only be non-trunk roads within the city, and all trunk roads were included in the urban area. Boundaries were then drawn from the starting point along the direction of the observable urban edges. Boundaries were drawn in strict accordance with the seven principles of the urban boundary delimitation standard, described in Section 3.2. The starting point was also used as the end point, and the final closed area was drawn as the urban area, with the line used as the urban boundary. In the process of delimitation, if the pixels were blurred and the ground objects were difficult to determine, we referred to Google Maps for auxiliary visual interpretation.

3.4.3. Urban Boundary Inspection and Correction

Based on the initial results of the urban boundary delimitation, according to the principles of boundary delimitation, the results were checked by sampling inspection and topological space according to the extraction unit, and the errors were corrected.

3.4.4. Accuracy Evaluation and Applicability Analysis

At the completion of data division, an accuracy evaluation and applicability analysis of the final correction results were carried out. A total of 2380 random sample points in Henan Province were selected by the stratified random sampling method. The accuracy was verified based on the resulting confusion matrix and kappa coefficient. After the accuracy test, a certain proportion of the data was extracted and input into the deep-learning model for training and testing, to test the applicability the deep-learning model for delimiting the urban boundaries.

4. Results and Discussion

4.1. City Boundary Delimitation Results

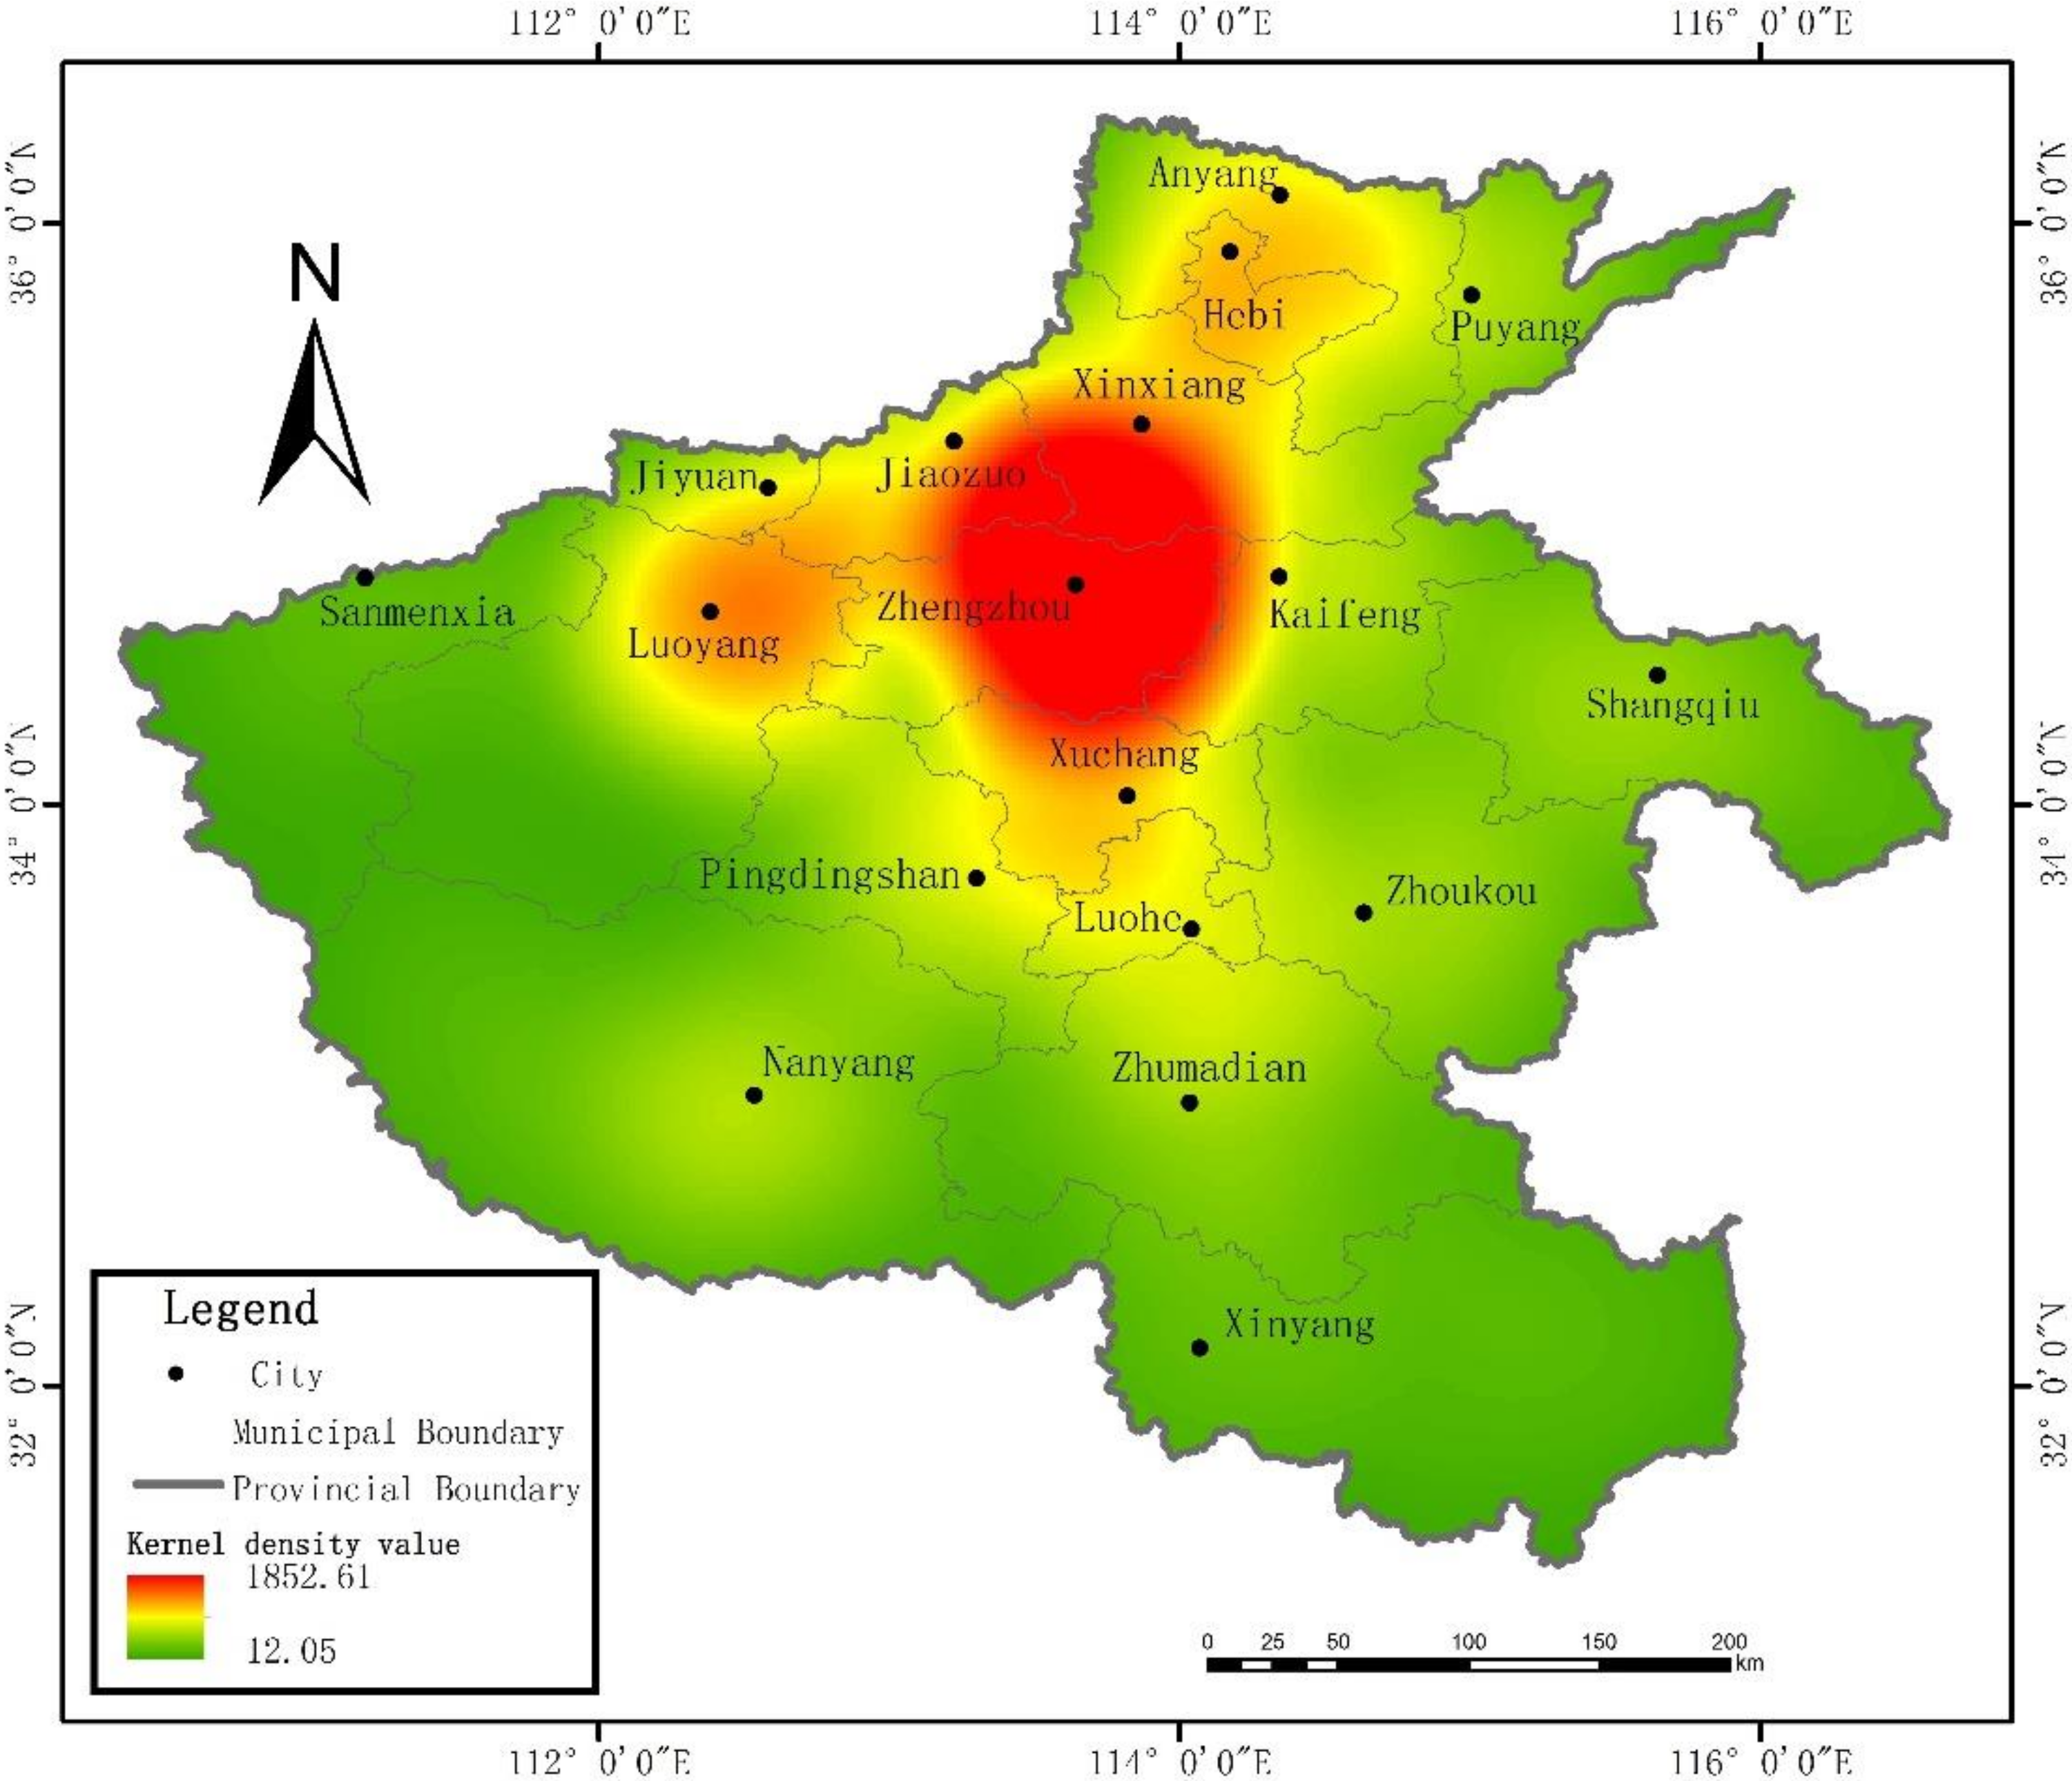
Figure 4 shows the results of urban boundary delimitation in this study (Henan Urban Boundary 2018; aka, HNUB2018). Overall, Henan province includes the Zhengzhou and Luoyang metropolitan areas as the main and secondary cores of urban boundary growth, respectively. The urban boundary as a whole showed the spatial distribution characteristics of multipoint divergence. Figure 5 shows a thermal map of the urban boundary of Henan Province. From the nuclear density analysis of the urban boundary area of Zhengzhou, it can be seen that, except for Zhengzhou, Luoyang, Hebi, Anyang, and Luohe, all other areas are low-density urban areas. The current situation of urban spatial development in Henan Province thus shows obvious spatial differentiation.

4.2. Precision Evaluation and Comparison of the Urban Boundary Results

The accuracy of the ascertained urban and nonurban areas in Henan Province was verified by stratified random sampling. A total of 1380 sample points were randomly selected from the urban areas, and 1000 sample points are randomly selected from the nonurban areas. The verification results are shown in Table 3, in which the user’s accuracy (UA) of urban type is shown to have been 98.4%, the producer’s accuracy (PA) was 89.06%, the UA of nonurban type was 86.65%, and the PA was 98.00%. The overall accuracy of HNUB2018 was 92.82% and the kappa coefficient was 0.8553, indicating that the HNUB2018 dataset has high classification accuracy. The GUB (Henan) [42] dataset is a global urban boundary dataset based on Gaia [43] published by Xuecao Li, Peng Gong. The accuracy of GUB (Henan) data was verified by the above methods and samples. We found an overall accuracy of 83.40% and a kappa coefficient of 0.6732 (see Table 3).
Next, we compared HNUB2018 with GUB (Henan) to verify the consistency of our dataset. We extracted data for Henan Province in 2018 from GUB to obtain the GUB (Henan) dataset, and we removed the urban boundary data at township level and below, to bring the GUB (Henan) dataset to consistency with the delimitation level in HNUB2018. The correlation analysis of the HNUB2018 and GUB (Henan) datasets shows that the correlation coefficient of the two groups of data was 95.6%, indicating a significant correlation between them. The regression simulation R2 statistic reached 0.915, and the performance of the two datasets was very consistent.
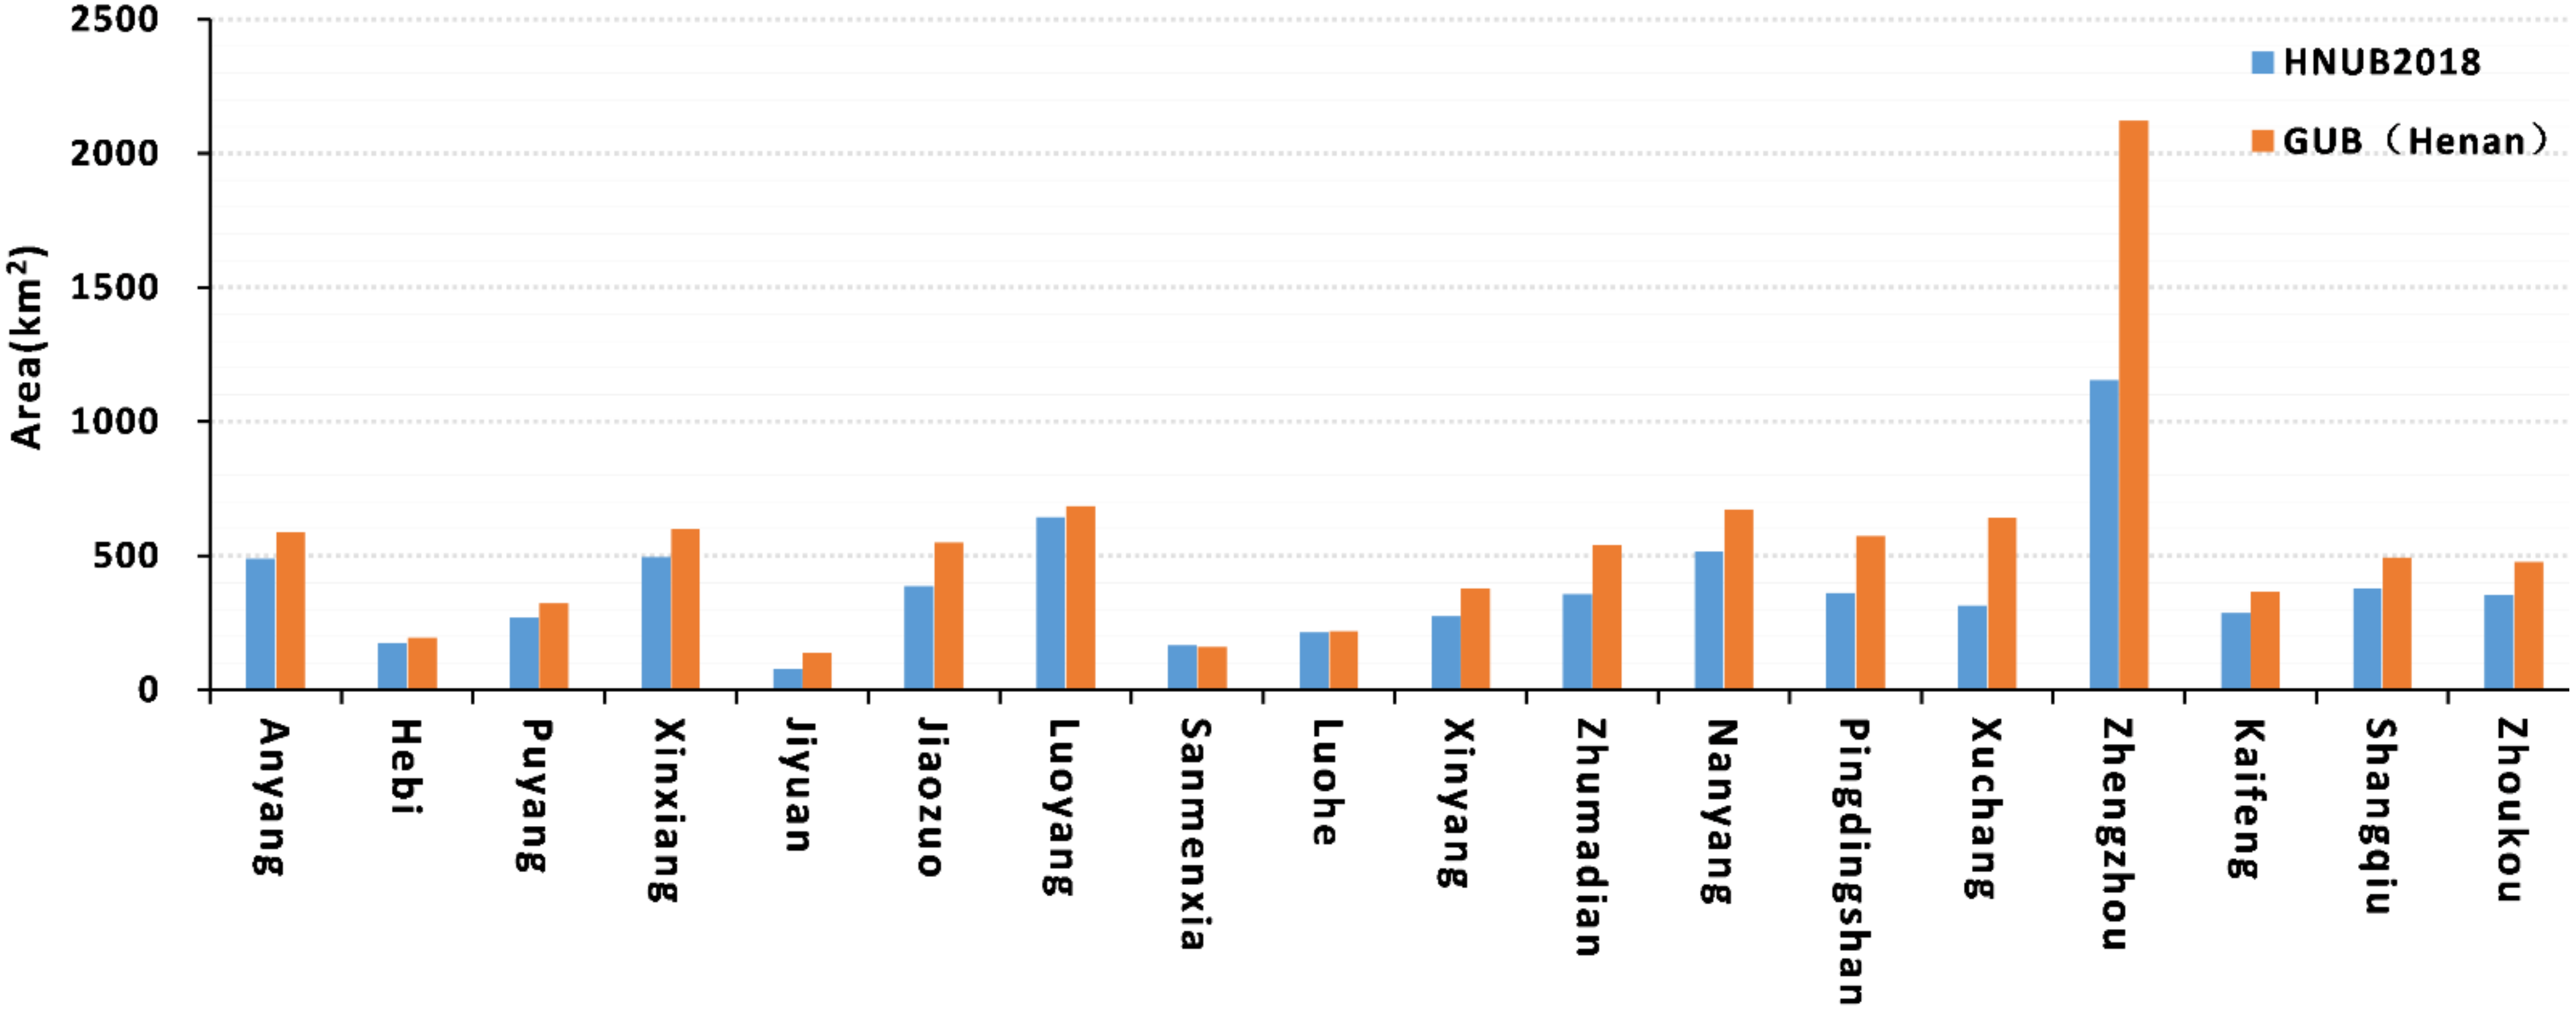
Figure 6 shows a comparison of the delimitated areas in the HNUB2018 and 2018 GUB (Henan) datasets. As can be seen from Figure 6, the urban area of the GUB (Henan) dataset was generally larger than that of the HNUB2018 data set. In 2018, the average urban area of GUB (Henan) was 540.05 km2, with a total area of 9720.94 km2; in the HNUB2018 dataset, the average urban area of Henan Province in 2018 was 384.00 km2, with a total area of 6912.08 km2. The average area difference between the two was 156.05 km2, and the total area difference was 2808.86 km2. The area with the largest difference was Zhengzhou, with a difference of 966.40 km2. This shows that the spatial range of GUB (Henan) was generally overestimated, which may indicate an important relationship with the machine-learning sample set from which the dataset was extracted.
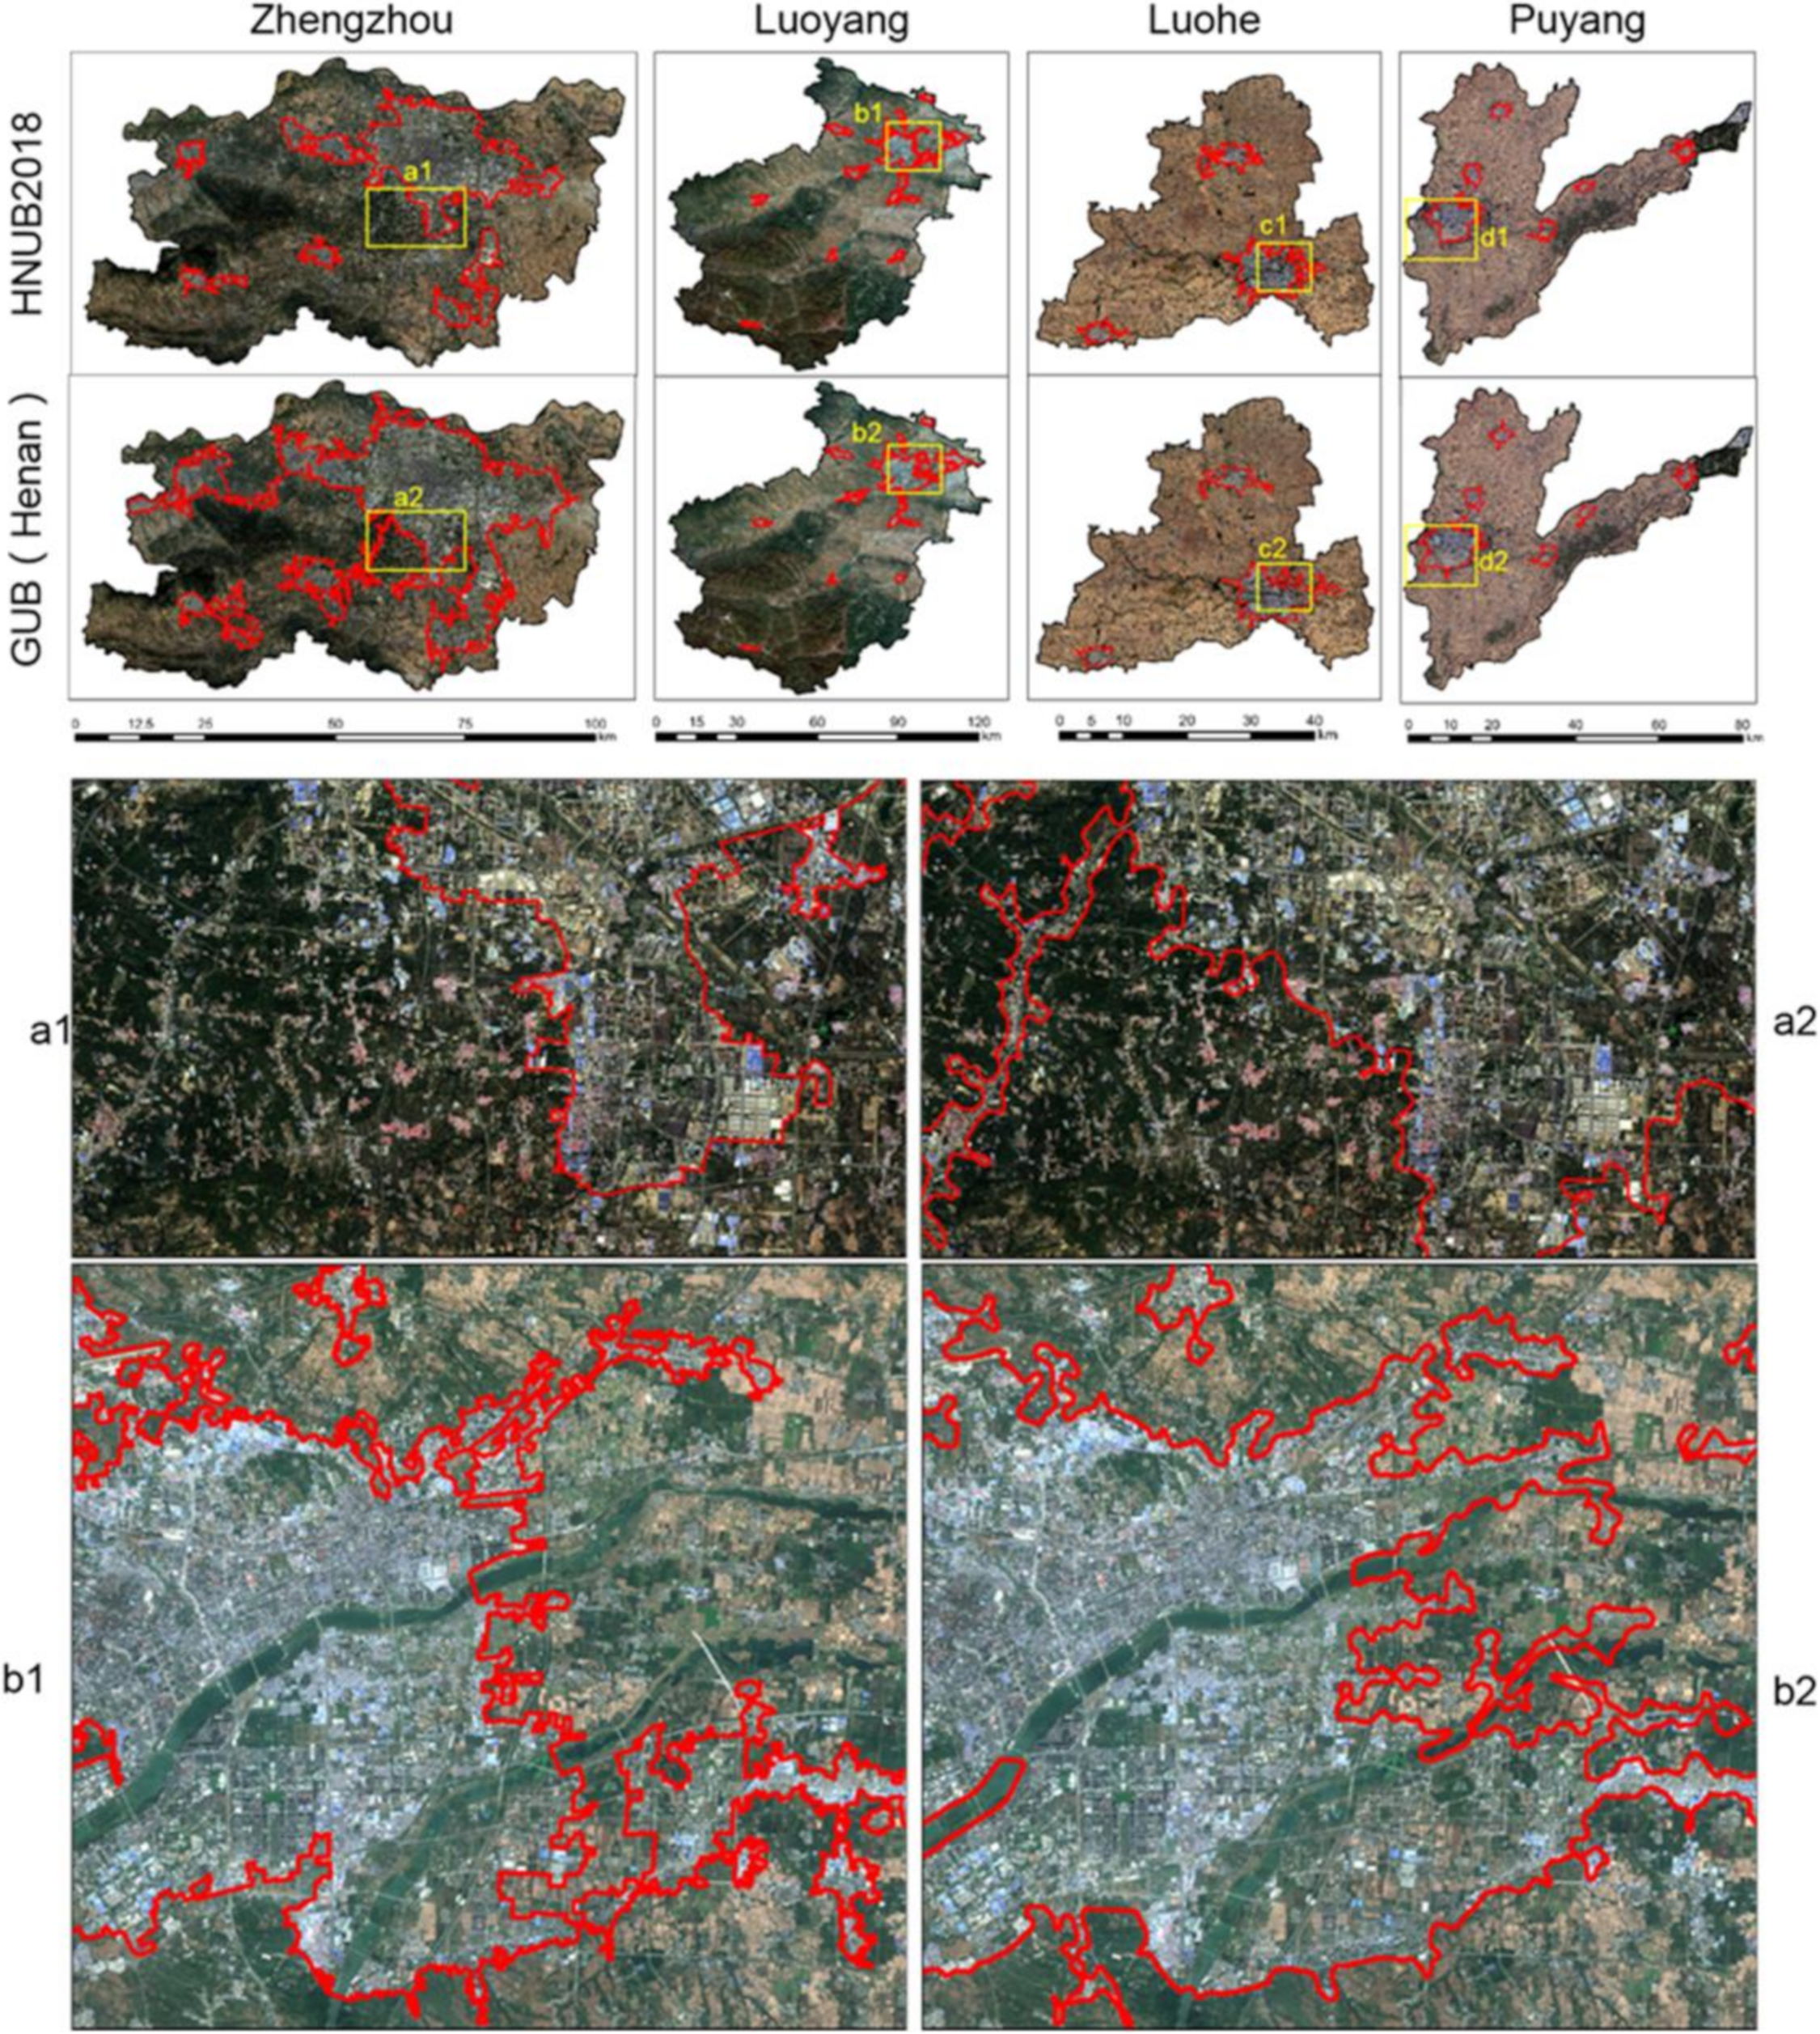
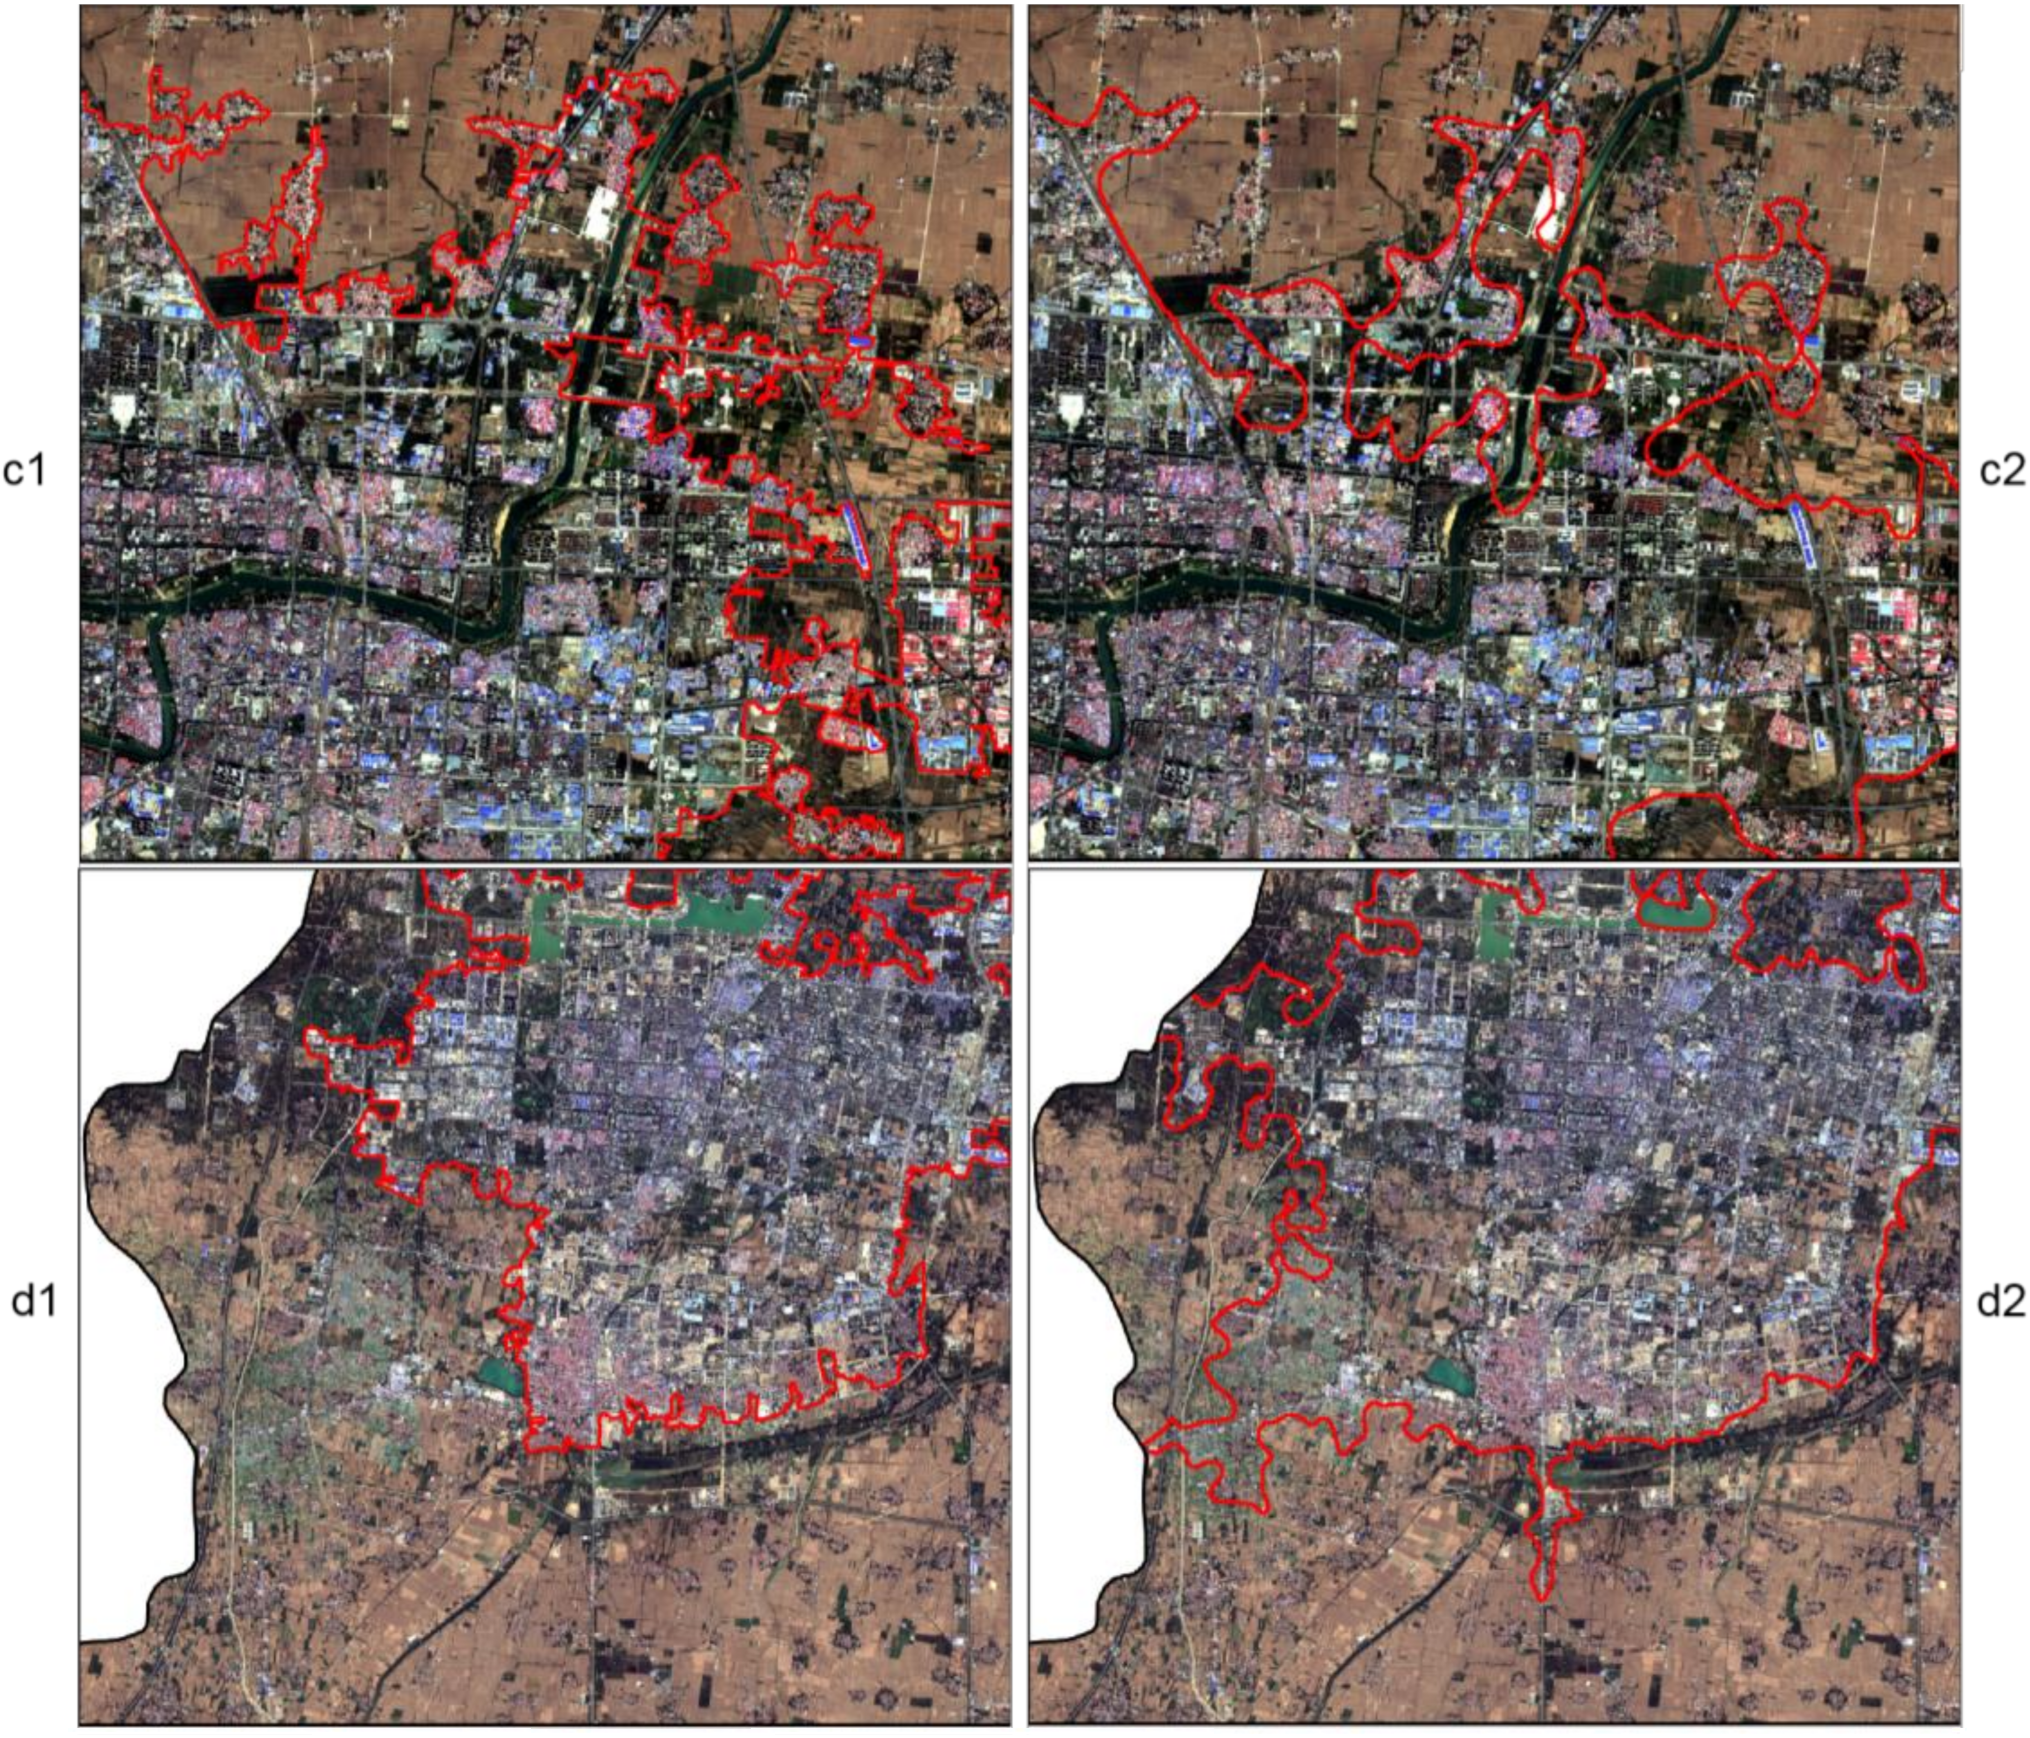
In order to further study the specific differences between the two datasets, local comparison diagrams of the central cities Zhengzhou and Luoyang, which showed large area differences, and cities Luohe and Puyang, which showed small area differences, were selected for comparative analysis (Figure 7). It can be seen that the HNUB2018 dataset was more inclined to express the spatial consistency and integrity of urban boundaries, and the area delimited by the urban boundary was smaller than that of the GUB (Henan) dataset. Especially in the detailed expression of urban boundaries, the HNUB2018 dataset could express the spatial structure details of urban boundaries in more detail.

4.3. Discussion of Urban Boundary Datasets

In the current process of intelligent remote-sensing mapping of urban boundaries, reliable high-precision urban boundary data products and their training datasets are still very scarce. To solve this problem, this study proposes a set of delineation rules and methods based on a large quantity of literature and definitions of urban boundaries, and reports the production of the HNUB2018 dataset based on visual interpretation using Sentinel-2. The overall accuracy of HNUB2018 can reach 92.82% and the kappa coefficient reached 0.8533, as shown through experiments.
Zhou obtained urban boundary data based on annual observations of DMSP NTL data. Compared with the HNUB2018 urban boundary dataset reported in this paper, the overall urban boundary effect and the spatial details around the boundary were not so well represented. The main reason is that the spatial resolution of the nighttime lighting data was much lower than that of Sentinel-2, so the HNUB2018 dataset was able to provide more detailed features of the urban fringe areas.
The GUB (Henan) dataset is a global large-scale urban boundary dataset, which is principally focused on built-up areas of cities, however, non-built-up areas may also exist within cities. Compared with the GUB (Henan) dataset product, the urban boundary extraction accuracy of Henan Province reported in this paper was higher, and there were no obvious misclassifications nor missing points. The urban boundary results of the HNUB2018 dataset can accurately distinguish urban and nonurban areas, especially the more complex urban and rural fringe areas, with more accuracy and reasonable spatial detail expression. The reason is that cerrtain specific measures were adopted: (1) by comparing with Google Maps images, the classification of ground objects was accurately interpreted, and the phenomenon of unclear boundaries caused by mixed pixels was reduced by using artificial intelligence for visual interpretation; and (2) according to the principles proposed in this paper (Section 3.2), the misclassification phenomenon affecting patches, such as undeveloped bare land and rural residential areas located at the urban–rural fringe, was greatly reduced.
However, the most obvious drawback of HNUB2018 compared with the above two datasets is its smaller scale range. In addition, because HNUB2018 has a higher degree of refinement and richer detail features, it invokes a relatively larger labor cost. Therefore, we can aim to improve the data scale range of HNUB2018 while considering the generation of high-precision Chinese as well as global city boundary datasets. At the same time, migration learning and other methods can be used to reduce the cost of urban boundary extraction.

4.4. Applicability of the Data Sets in Deep-Learning Classification

In addition to providing an accurate data source for urban research, the HNUB2018 dataset can also be used as a sample dataset for urban boundary classification by deep-learning algorithms. In order to verify the applicability of the HNUB2018 dataset, points were randomly sampled, with Anyang, Hebi, Zhengzhou, Nanyang, and Zhoukou selected as the training areas, and other administrative regions used as the test sets. Three classical semantic segmentation network models, LINKnet, FPN, and U-Net, were selected for training. These three models were implemented based on the PyTorch framework. The CPU was Intel(R) Xeon(R) Gold 5218, the graphics card was NVIDIA GeForceRTX 2080TI, and programming language was Python 3.6. The test results are shown in Table 4.
It can be seen from Table 4 that the classification accuracies of FPN, U-Net, and LINKnet were 96.5%, 95%, and 90.8%, respectively. In terms of their F1-scores, FPN, U-Net, and LINKnet yielded 98.1%, 97.2%, and 94.6%, respectively. It can be seen that, based on the HNUB2018 dataset, these classical deep learning image segmentation algorithms could achieve good classification results and have good applicability.
In addition, to further demonstrate the reliability of this dataset, 10-fold cross-validation was used in this study [44]. Of the 18 city boundary samples, 90% were used to train the model and 10% were used for testing. The model was a U-Net network and the environment configuration was maintained as above.
As seen in Table 5, the dataset was able to maintain a classification accuracy of around 90% in different cases, and the F1-score reached above 90% in all cases. Validating the dataset in this way reduced randomness, and the results increase the credibility of HNUB2018.
In summary, the HNUB2018 dataset can be used as a sample database of high-resolution remote-sensing images of urban boundaries, to provide reliable data support for the training of intelligent classification models of urban boundaries.

5. Conclusions

Based on Sentinel-2 satellite remote-sensing images and visual interpretation by artificial intelligence, this paper produced an urban boundary dataset for Henan Province called HNUB2018. First, we proposed a set of operable rules and processes for urban boundary delimitation. Then, we delimitated urban boundaries based on the Sentinel-2 remote-sensing images, basic geographic information data, and Google Maps data. Finally, the classification accuracy and applicability of three deep learning methods were verified using the HNUB2018 urban boundary dataset. The results showed that the HNUB2018 dataset proposed in this paper performed better in terms of urban boundary details, describing a more detailed spatial structure of urban boundaries. Moreover, it was shown to have reliable applicability to deep learning applications.
This dataset can provide data support for monitoring urban sprawl and for territorial spatial planning, showing prospects and possibilities for its wide application in various disciplines of urban studies. However, the dataset remains relatively small in scale, and the research and application of the dataset are not yet deep enough. In future research, we will continue to produce larger and more accurate urban boundary datasets based on artificial intelligence technology. At the same time, we will develop a more interpretable deep neural network semantic segmentation model to further improve the level of automatic classification and the mapping of urban boundaries. This dataset can be accessed for free by contacting [email protected], and we will also develop a website to publish relevant results.

Author Contributions

Conceptualization, X.L.; methodology, H.W., X.L. and K.Z.; validation, X.L., H.W. and K.Z.; formal analysis, H.W.; investigation, X.L. and F.Q.; resources, X.L.; data curation, X.L. and K.Z.; writing—original draft preparation, X.L.; writing—review and editing, H.W., K.Z. and C.Z.; visualization, X.L., K.Z. and C.Z.; supervision, H.W. and F.Q.; project administration, F.Q.; funding acquisition, H.W. and F.Q. All authors have read and agreed to the published version of the manuscript.

Funding

The authors gratefully acknowledge support by Young Key Teacher Training Plan of Henan (Grant Number: 2020GGJS028), Natural Resources Science and Technology Innovation Project of Henan Province (Grant Number: 202016511), Key Scientific Research Project Plans of Higher Education Institutions of Henan (Grant Number: 21A170008), and Technology Development Plan Project of Kaifeng (Grant Number: 2003009).

Data Availability Statement

The urban boundary dataset produced in this study (HNUB2018) can be obtained from [email protected].

Acknowledgments

We thank Xuecao Li, Peng Gong, and Yuyu Zhou for providing the open and free global urban boundaries dataset.

Conflicts of Interest

The authors declare no conflict of interest.

References

  1. Xu, Z.; Gao, X. Boundary Recognition Method of Urban Built-up Area Based on Interest Points of Electronic Map. J. Geogr. 2016, 71, 928–939. [Google Scholar]
  2. Zhang, H.; Ning, X.; Wang, H.; Shao, Z. High Precision Expansion Monitoring and Analysis of Chinese Provincial Capital Cities from 2000 to 2015 Based on High-Resolution Remote Sensing Images. J. Geogr. 2018, 73, 2345–2363. [Google Scholar]
  3. Xu, K.; Wu, S.; Chen, D.; Dai, L.; Zhou, S. Determination of Urban Growth Boundary Based on Hydrological Effect—A Case Study of Xinminzhou, Zhenjiang. Geoscience 2013, 33, 979–985. [Google Scholar]
  4. Liang, X.; Liu, X.; Li, X.; Chen, Y.; Tian, H.; Yao, Y. Delineating Multi-Scenario Urban Growth Boundaries with a CA-Based FLUS Model and Morphological Method. Landsc. Urban Plan. 2018, 177, 47–63. [Google Scholar] [CrossRef]
  5. Li, X.; Cong, X.; Tong, L.; Cheng, Z. The Defining Method and Application of Urban Boundary. Urban Probl. 2017, 2, 46–51. [Google Scholar]
  6. Chow, W.T.L. The Impact of Weather Extremes on Urban Resilience to Hydro-Climate Hazards: A Singapore Case Study. Int. J. Water Resour. Dev. 2018, 34, 510–524. [Google Scholar] [CrossRef] [Green Version]
  7. Xia, N.; Cheng, L.; Li, M.C. Mapping Urban Areas Using a Combination of Remote Sensing and Geolocation Data. Remote Sens. 2019, 11, 1470. [Google Scholar] [CrossRef] [Green Version]
  8. Duan, Y.; Liu, Y.; Liu, X. Wang Honglei Multi Center Identification of Chongqing Main Urban Area Based on POI Big Data. J. Nat. Resour. 2018, 33, 788–800. [Google Scholar]
  9. Xiao, C.; Zhang, L. Research on Comparison and Selection Methods of Remote Sensing Data Sources for Geographic National Conditions Monitoring. Bull. Surv. Mapp. 2019, 8, 116–120. [Google Scholar]
  10. Li, H.; Liu, Y.; Tan, R.; Qiu, L. A New Algorithm of Urban Built-up Area Boundary Extraction Based on High-Resolution Panchromatic Image. Bull. Surv. Mapp. 2015, 7, 36–41. [Google Scholar]
  11. Wu, X.; Zhang, P. Urban Boundary Extraction Based on Dmsp-Ols and Landsat Images. J. Appl. Sci. 2016, 34, 67–74. [Google Scholar]
  12. Kumari, N.; Srivastava, A.; Dumka, U.C. A Long-Term Spatiotemporal Analysis of Vegetation Greenness over the Himalayan Region Using Google Earth Engine. Climate 2021, 9, 109. [Google Scholar] [CrossRef]
  13. Friedl, M.; Mciver, D.; Hodges, J. Global Land Cover Mapping from MODIS: Algorithms and Early Results. Remote Sens. Environ. 2002, 83, 287–302. [Google Scholar] [CrossRef]
  14. Wan, B.; Guo, Q.; Fang, F. Mapping US Urban Extents from MODIS Data Using One-Class Classification Method. Remote Sens. 2015, 7, 10143–10163. [Google Scholar] [CrossRef] [Green Version]
  15. Bagan, H.; Yamagata, Y. Landsat Analysis of Urban Growth: How Tokyo Became the World’s Largest Megacity during the Last 40 Years. Remote Sens. Environ. 2012, 127, 210–222. [Google Scholar] [CrossRef]
  16. Guindon, B.; Zhang, Y.; Dillabaugh, C. Landsat Urban Mapping Based on a Combined Spectral-Spatial Methodology. Remote Sens. Environ. 2004, 92, 218–232. [Google Scholar] [CrossRef]
  17. Gao, F.; De Colstoun, E.B.; Ma, R. Mapping Impervious Surface Expansion Using Medium-Resolution Satellite Image Time Series: A Case Study in the Yangtze River Delta, China. Int. J. Remote Sens. 2012, 33, 7609–7628. [Google Scholar] [CrossRef]
  18. Sun, Z.; Wang, C.; Guo, H. A Modified Normalized Difference Impervious Surface Index (MNDISI) for Automatic Urban Mapping from Landsat Imagery. Remote Sens. 2017, 9, 942. [Google Scholar] [CrossRef] [Green Version]
  19. Zhou, Y.; Smith, S.; Zhao, K. A Global Map of Urban Extent from Nightlights. Environ. Res. Lett. 2015, 10, 054011. [Google Scholar] [CrossRef]
  20. Huang, X.; Schneider, A.; Friedl, M. Mapping Sub-Pixel Urban Expansion in China Using MODIS and DMSP/OLS Nighttime Lights. Remote Sens. Environ. 2016, 175, 92–108. [Google Scholar] [CrossRef]
  21. Imhoff, M.; Lawrence, W.; Stutzer, D. A Technique for Using Composite DMSP/OLS “City Lights” Satellite Data to Map Urban Area. Remote Sens. Environ. 1997, 61, 361–370. [Google Scholar] [CrossRef]
  22. Li, J.; Gong, J.; Yang, J. Urban Spatial Pattern Evolution of Wuhan City Based on Night Light. Remote Sens. Inf. 2017, 32, 133–141. [Google Scholar]
  23. Guo, Z.; Du, S.; Zhang, F. Extraction of Urban Construction Area Based on High-Resolution Remote Sensing Image. J. Peking Univ. Nat. Sci. Ed. 2013, 635–642. [Google Scholar] [CrossRef]
  24. Hofmann, P. Detecting informal settlements from IKONOS image data using methods of object oriented image analysis—An example from Cape Town (South Africa). In Remote Sensing of Urban Areas/Fernerkundung in Urbanen Räumen; 2001; Available online: https://intranet.ifs.ifsuldeminas.edu.br/joao.tavares/Material_Cadastro_e_Loteamento/CadastroTecnicoMultifinalitario%20-%209EAC/Material%20auxiliar/kapstadt%5B1%5D.pdf (accessed on 8 May 2022).
  25. Zheng, K.; Wang, H.; Qin, F.; Han, Z. A Land Use Classification Model Based on Conditional Random Fields and Attention Mechanism Convolutional Networks. Remote Sens. 2022, 14, 2688. [Google Scholar] [CrossRef]
  26. Wang, Z.; Wang, H.; Qin, F.; Han, Z.; Miao, C. Mapping an Urban Boundary Based on Multi-Temporal Sentinel-2 and POI Data: A Case Study of Zhengzhou City. Remote Sens. 2020, 12, 4103. [Google Scholar] [CrossRef]
  27. Mnih, V.; Hinton, G. Learning to Detect Roads in High-Resolution Aerial Images. In Computer Vision—ECCV 2010. Lecture Notes in Computer Science; Daniilidis, K., Maragos, P., Paragios, N., Eds.; Springer: Berlin, Germany, 2010; Volume 6316. [Google Scholar]
  28. Meng, X.; Zhang, S.; Zang, S. Remote Sensing Classification of Wetland Community Based on Convolutional Neural Network and High-Resolution Image—Taking Honghe Wetland as an Example. Geogr. Sci. 2018, 38, 1914–1923. [Google Scholar]
  29. Cao, L.; Li, H.; Han, Y. Application of Convolution Neural Network in High Score Remote Sensing Image Classification. Surv. Mapp. Sci. 2016, 41, 170–175. [Google Scholar]
  30. Luo, J.; Li, M.; Zheng, Z. Hyperspectral Remote Sensing Image Classification Based on Depth Convolution Neural Network. J. Xihua Univ. Nat. Sci. Ed. 2017, 36, 13–20. [Google Scholar]
  31. Zhang, C.; Pan, X.; Li, H.; Gardiner, A.; Sargent, I.; Hare, J.; Atkinson, P.M. A hybrid MLP-CNN Classi- Fier for Very Fine Resolution Remotely Sensed Image Classification. ISPRS J. Photogramm. Remote Sens. 2017, 7, 139–149. [Google Scholar]
  32. Feng, L. Research on Construction Land Information Extraction from High-Resolution Remote Sensing Images Based on Deep Learning Technology. Master’s Thesis, Zhejiang University, Hangzhou, China, 2017. [Google Scholar]
  33. Wang, H.; Liu, Y.; Ning, X.; Zhang, H. Research Progress of Remote Sensing Extraction of Urban Boundary. Surv. Mapp. Sci. 2019, 44, 159–165. [Google Scholar]
  34. National Bureau of Statistics of China. Bulletin of the Seventh National Census (No. 7)—Urban and Rural Population and Floating Population. China Natl. Bur. Stat. 2021, 5, 13. [Google Scholar]
  35. Ronneberger, O.; Fischer, P.; Brox, T. U-Net: Convolutional Networks for Biomedical Image Segmentation. In Medical Image Computing and Computer-Assisted Intervention—MICCAI 2015. Lecture Notes in Computer Science; Navab, N., Hornegger, J., Wells, W., Frangi, A., Eds.; Springer: Cham, Switzerland, 2015; Volume 9351. [Google Scholar]
  36. Chaurasia, A.; Culurciello, E.L. Exploiting encoder representations for efficient semantic segmentation. In Proceedings of the 2017 IEEE Visual Communications and Image Processing (VCIP), St. Petersburg, FL, USA, 10–13 December 2017; pp. 1–4. [Google Scholar]
  37. Lin, T.; Dollar, P.; Girshick, R. Feature Pyramid Networks for Object Detection. In Proceedings of the IEEE Conference on Computer Vision and Pattern Recognition (CVPR), Honolulu, HI, USA, 21–26 July 2017; pp. 936–944. [Google Scholar]
  38. Schneider, A.; Friedl, M.; Potere, D. A New Map of Global Urban Extent from MODIS Satellite Data. Environ. Res. Lett. 2009, 4, 44003–44011. [Google Scholar] [CrossRef] [Green Version]
  39. Wang, L.; Li, C.; Ying, Q.; Cheng, X.; Wang, X.; Li, X.; Hu, M.; Liang, L.; Yu, L.; Huang, H.; et al. Satellite Remote Sensing Mapping of Urban Expansion in China from 1990 to 2010. Sci. Bull. 2012, 57, 1388–1403. [Google Scholar]
  40. Gong, P.; Howarth, P. Land-Use Classification of SPOT HRV Data Using a Cover-Frequency Method. Int. J. Remote Sens. 1992, 13, 1459–1471. [Google Scholar] [CrossRef]
  41. Lu, D.; Weng, Q. A Survey of Image Classification Methods and Techniques for Improving Classification Performance. Int. J. Remote Sens. 2007, 28, 823–870. [Google Scholar] [CrossRef]
  42. Li, X.; Gong, P.; Zhou, Y. Mapping Global Urban Boundaries from the Global Artificial Impervious Area (GAIA) Data. Environ. Res. Lett. 2020, 15, 094044. [Google Scholar] [CrossRef]
  43. Gong, P.; Li, X.; Wang, J. Annual Maps of Global Artificial Impervious Area (GAIA) between 1985 and 2018. Remote Sens. Environ. 2020, 236, 111510. [Google Scholar] [CrossRef]
  44. Osco, L.P.; Junior, J.M.; Ramos, A.P.M.; Furuya, D.E.G.; Santana, D.C.; Teodoro, L.P.R.; Gonçalves, W.N.; Baio, F.H.R.; Pistori, H.; Junior, C.A.D.S.; et al. Leaf Nitrogen Concentration and Plant Height Prediction for Maize Using UAV-Based Multispectral Imagery and Machine Learning Techniques. Remote Sens. 2020, 12, 3237. [Google Scholar] [CrossRef]
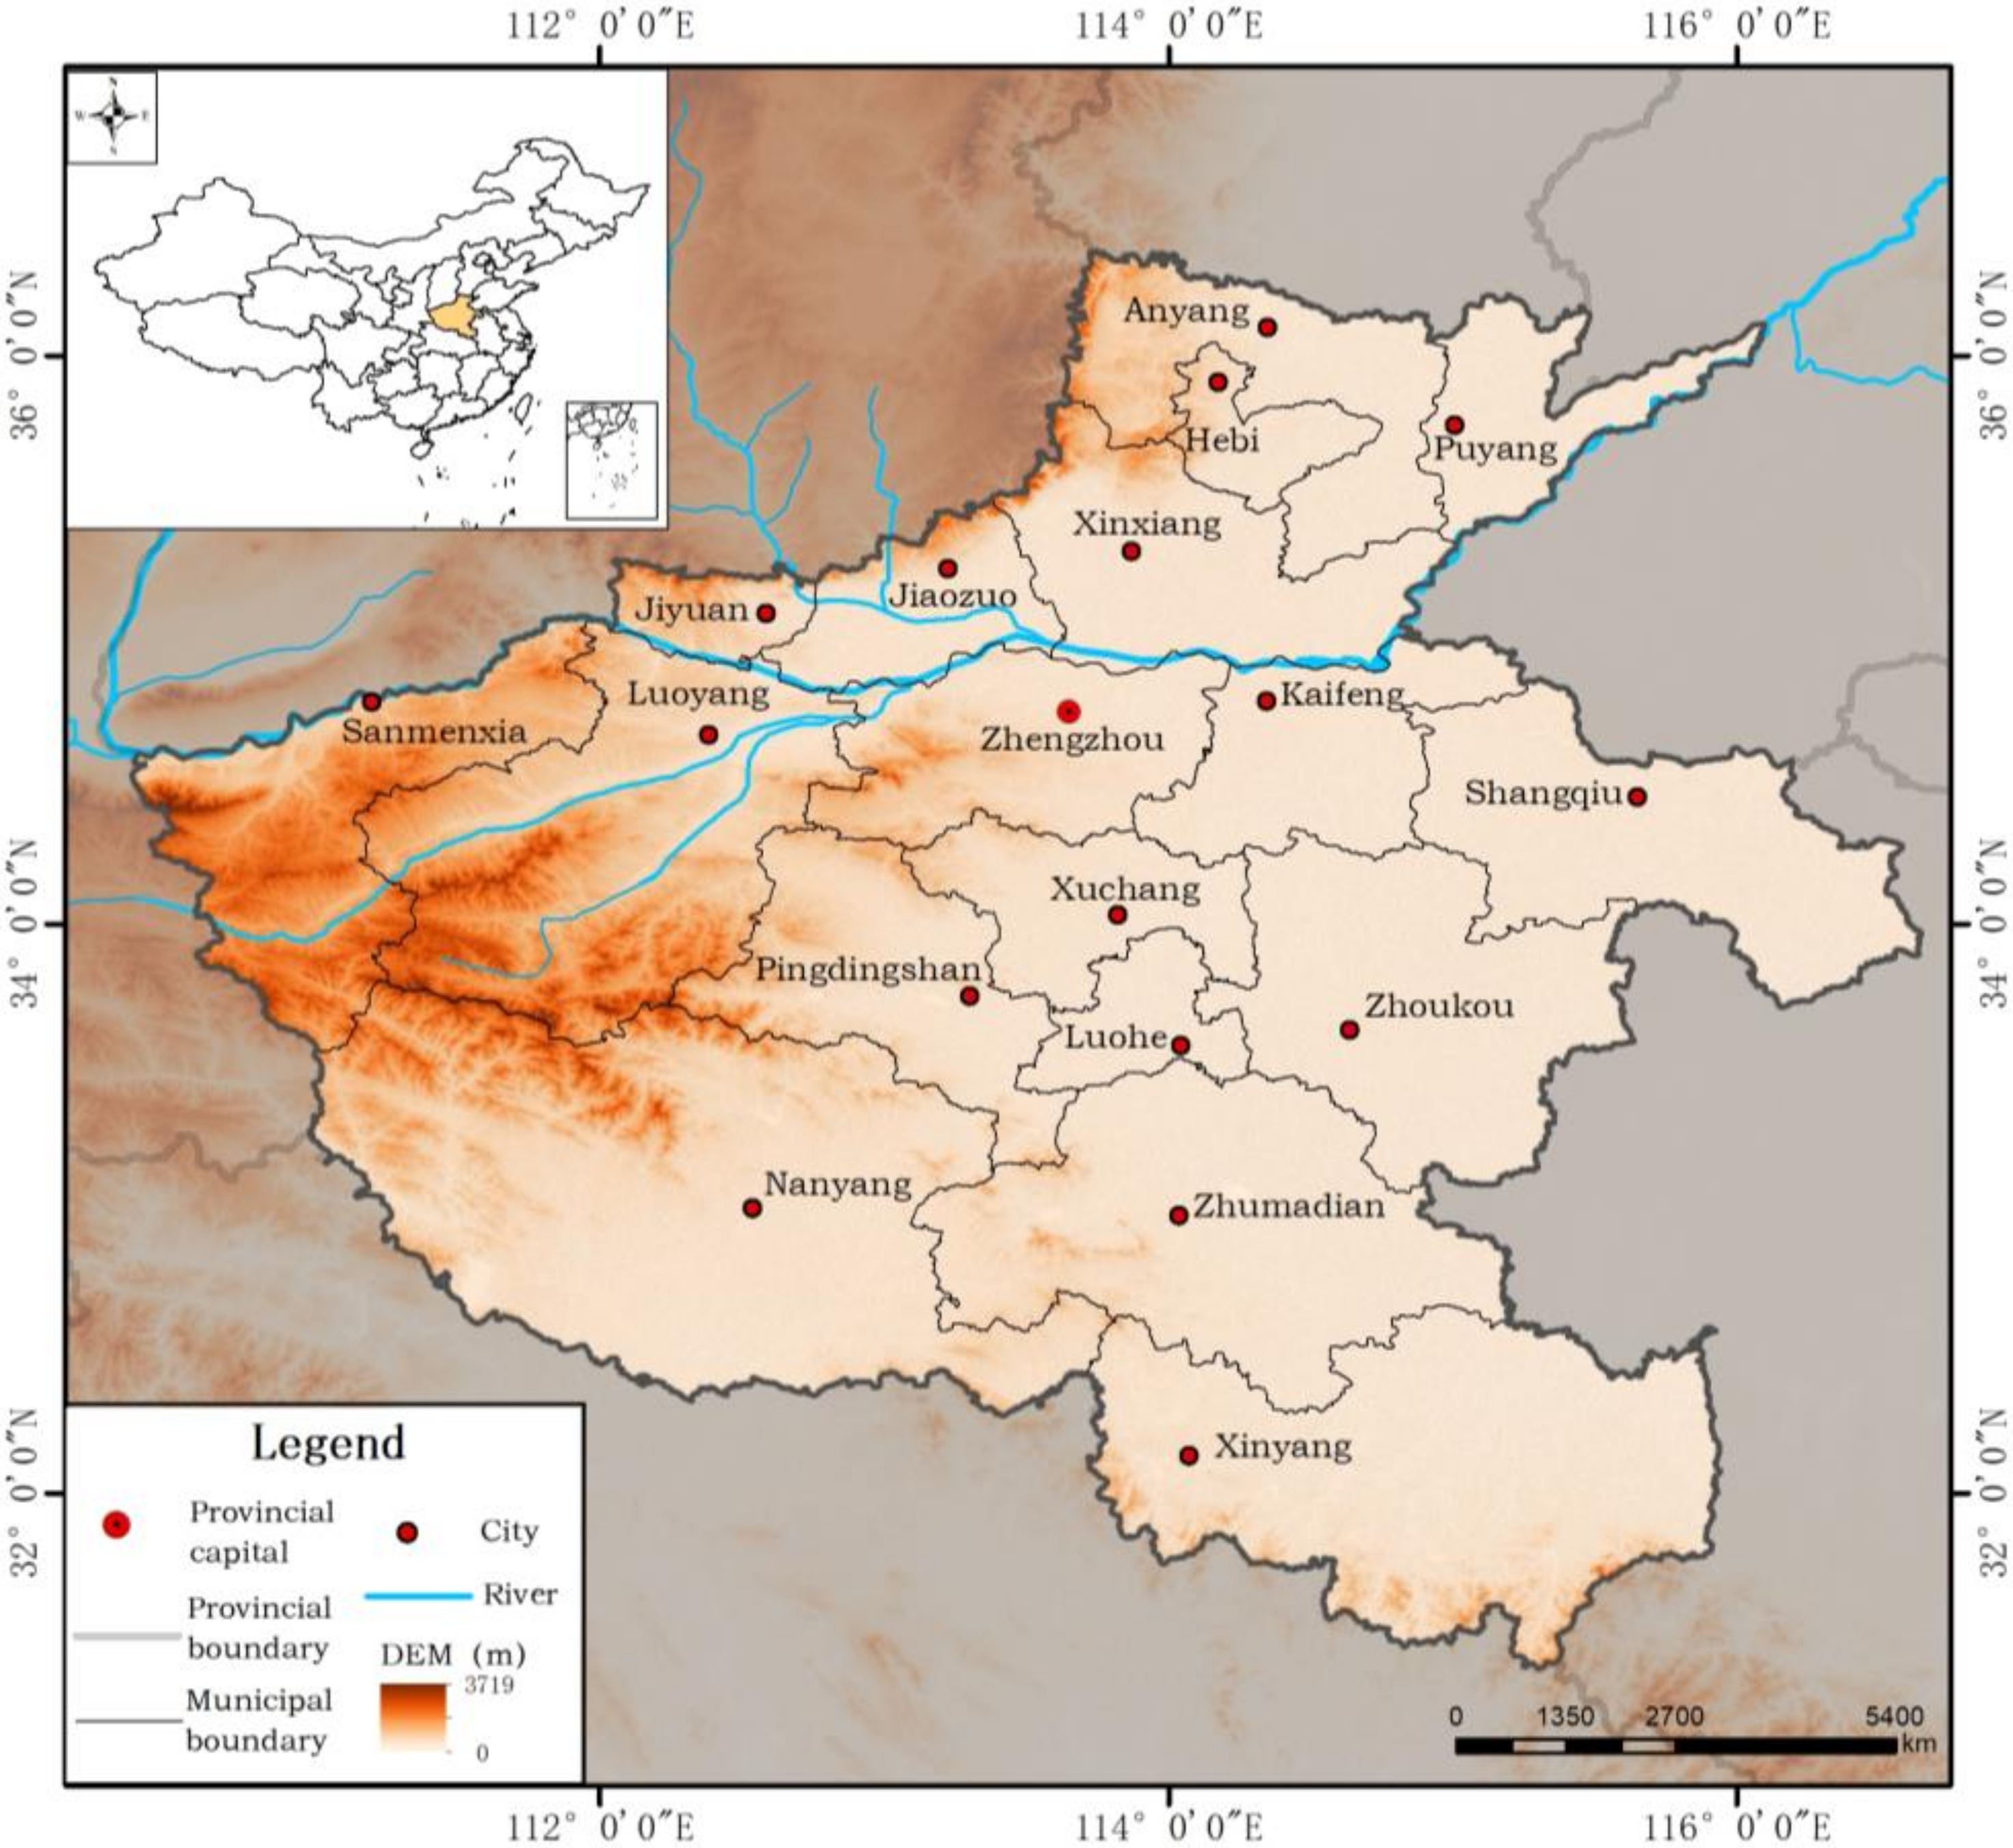
Figure 1. Study area.
Remotesensing 14 03752 g001
Figure 2. Flow chart of delimiting urban boundary divisions.
Remotesensing 14 03752 g002
Figure 3. Distribution of target cities in Henan Province.
Remotesensing 14 03752 g003
Figure 4. Results of urban boundary delimitation in Henan Province.
Remotesensing 14 03752 g004
Figure 5. Heat map of urban boundary areas in Henan Province.
Remotesensing 14 03752 g005
Figure 6. Area comparison between HNUB2018 and GUB (Henan) in 2018.
Remotesensing 14 03752 g006
Figure 7. Comparison of urban boundaries between GUB (Henan) and HNUB2018. (a1d1) and (a2d2) are the areas with significant difference between GUB (Henan) and HNUB2018.
Remotesensing 14 03752 g007aRemotesensing 14 03752 g007b
Table 1. Sentinel-2 remote-sensing imaging data used in this study.
Image NamePhaseResolution (m)
T49SGA_20180930T030541_TCI.jp230 September 201810
T49SGV_20180930T030541_TCI.jp230 September 201810
T50SKE_20180930T030541_TCI.jp230 September 201810
T50SKF_20180930T030541_TCI.jp230 September 201810
T50SLE_20181010T030631_TCI.jp210 October 201810
T50SLF_20181010T030631_TCI.jp210 October 201810
T50SME_20180907T025541_TCI.jp27 September 201810
T50SMF_20181017T025711_TCI.jp217 October 201810
T49SGU_20181010T030631_TCI.jp210 October 201810
T50SKD_20181010T030631_TCI.jp210 October 201810
T49SFU_20181010T030631_TCI.jp210 October 201810
T49SFV_20180930T030541_TCI.jp230 September 201810
T49SGU_20180930T030541_TCI.jp230 September 201810
T49SEU_20181003T031541_TCI.jp23 October 201810
T49SEV_20181003T031541_TCI.jp23 October 201810
T49SFU_20180928T031539_TCI.jp228 September 201810
T49SFV_20180928T031539_TCI.jp228 September 201810
T49SET_20181028T031829_TCI.jp228 October 201810
T49SFT_20181010T030631_TCI.jp210 October 201810
T49SDT_20181003T031541_TCI.jp23 October 201810
T49SDU_20181003T031541_TCI.jp23 October 201810
T49SGT_20181010T030631_TCI.jp210 October 201810
T49SGR_20181005T030549_TCI.jp25 October 201810
T49SGS_20181005T030549_TCI.jp25 October 201810
T49SGS_20181010T030631_TCI.jp210 October 201810
T50RKV_20181012T025639_TCI.jp212 October 201810
T50RLV_20181101T025839_TCI.jp21 November 201810
T50SKA_20181101T025839_TCI.jp21 November 201810
T50SKB_20181010T030631_TCI.jp210 October 201810
T50SLA_20181012T025639_TCI.jp212 October 201810
T50SLB_20181012T025639_TCI.jp212 October 201810
T49SFS_20181005T030549_TCI.jp25 October 201810
T50SKC_20180930T030541_TCI.jp230 September 201810
T49SDS_20181102T031901_TCI.jp22 November 201810
T49SDT_20180928T031539_TCI.jp228 September 201810
T49SES_20181102T031901_TCI.jp22 November 201810
T49SFR_20181010T030631_TCI.jp210 October 201810
T49SFU_20181005T030549_TCI.jp25 October 201810
T49SGT_20181005T030549_TCI.jp25 October 201810
T49SGU_20181005T030549_TCI.jp25 October 201810
T50SKC_20181010T030631_TCI.jp210 October 201810
T50SLD_20181012T025639_TCI.jp212 October 201810
T50SMC_20181027T025811_TCI.jp227 October 201810
T50SMD_20181027T025811_TCI.jp227 October 201810
T50SLC_20181027T025811_TCI.jp227 October 201810
Table 2. Geographic auxiliary data used in this study.
Serial NumberData NameData TypePhaseRange
1Provincial Administrative Region BoundaryVector polygon data2018Henan Province
2Municipal Administrative Region BoundaryVector polygon data2018Henan Province
3Resident of prefecture level municipal governmentVector point data2018Henan Province
4Resident of district and county governmentVector point data2018Henan Province
Table 3. Accuracy verification of HNUB2018 and GUB (Henan).
Division Type
HNUB2018GUB (Henan)
UrbanNonurbanTotalUAUrbanNonurbanTotalUA
Verification typeUrban122920124998.4%1030352138274.53%
Nonurban151980113186.65%4395599895.69%
Total138010002380107313072380
PA89.06%98.00%95.99%73.07%
OA 92.82%83.40%
Kappa 0.85530.6732
Table 4. Test results of the urban boundary sample database for Henan Province.
LINKnetFPNU-Net
AccuracyF1-Scorem-IouAccuracyF1-Scorem-IouAccuracyF1-Scorem-Iou
Jiyuan0.9810.9900.7480.9800.9890.7710.9820.9910.779
Jiaozuo0.8220.8940.5540.9330.9630.7210.8910.9370.641
Kaifeng0.8490.9150.5200.9610.9790.7190.9390.9670.653
Luoyang0.9810.9900.7320.9820.9910.7380.9760.9880.686
Pingdingshan0.9590.9780.6820.9730.9860.7290.9570.9770.666
Puyang0.9620.9800.6870.9820.9910.7720.9850.9920.796
Sanmenxia0.9950.9970.7720.9950.9970.7350.9920.9960.685
Shangqiu0.8660.9260.4990.9640.9810.6640.9600.9790.649
XuChang0.6580.7770.3940.8950.9410.6270.8030.8830.511
Xinxiang0.8750.9290.5790.9630.9800.7610.9430.9690.699
Xinyang0.9950.9970.7990.9960.9970.8170.9950.9970.804
Zhumadian0.9480.9720.6050.9580.9780.6280.9720.9850.676
average0.9080.9460.6310.9650.9810.7240.9500.9720.687
Table 5. 10-fold cross-validation results for HNUB2018.
0123456789
Accuracy0.9390.9560.8760.9420.8630.9090.8890.9380.8920.909
F1-score0.9630.9730.9310.9690.9240.9510.9390.9670.9410.951
Publisher’s Note: MDPI stays neutral with regard to jurisdictional claims in published maps and institutional affiliations.