Article

GNSS Storm Nowcasting Demonstrator for Bulgaria

1
Department Meteorology and Geophysics, Physics Faculty, Sofia University “St. Kliment Ohridski”, 1164 Sofia, Bulgaria
2
Research Institute of Geodesy, Topography and Cartography, 25066 Zdiby, Czech Republic
3
G-Nut Software, s.r.o., 25166 Senohraby, Czech Republic
4
Hail Suppression Agency, 1606 Sofia, Bulgaria
5
National Institute of Meteorology and Hydrology, 1784 Sofia, Bulgaria
*
Author to whom correspondence should be addressed.
Remote Sens. 2022, 14(15), 3746; https://doi.org/10.3390/rs14153746
Submission received: 5 July 2022 / Revised: 30 July 2022 / Accepted: 31 July 2022 / Published: 4 August 2022

Abstract

:
Global Navigation Satellite System (GNSS) is an established atmospheric monitoring technique delivering water vapour data in near-real time with a latency of 90 min for operational Numerical Weather Prediction in Europe within the GNSS water vapour service (E-GVAP). The advancement of GNSS processing made the quality of real-time GNSS tropospheric products comparable to near-real-time solutions. In addition, they can be provided with a temporal resolution of 5 min and latency of 10 min, suitable for severe weather nowcasting. This paper exploits the added value of sub-hourly real-time GNSS tropospheric products for the nowcasting of convective storms in Bulgaria. A convective Storm Demonstrator (Storm Demo) is build using real-time GNSS tropospheric products and Instability Indices to derive site-specific threshold values in support of public weather and hail suppression services. The Storm Demo targets the development of service featuring GNSS products for two regions with hail suppression operations in Bulgaria, where thunderstorms and hail events occur between May and September, with a peak in July. The Storm Demo real-time Precise Point Positioning processing is conducted with the G-Nut software with a temporal resolution of 15 min for 12 ground-based GNSS stations in Bulgaria. Real-time data evaluation is done using reprocessed products and the achieved precision is below 9 mm, which is within the nowcasting requirements of the World Meteorologic Organisation. For the period May–September 2021, the seasonal classification function for thunderstorm nowcasting is computed and evaluated. The probability of thunderstorm detection is 83%, with a false alarm ration of 38%. The added value of the high temporal resolution of the GNSS tropospheric gradients is investigated for a storm case on 24–30 August 2021. Real-time tropospheric products and classification functions are integrated and updated in real-time on a publicly accessible geoportal.

1. Introduction

The severe weather nowcasting is defined by the World Meteorological Organisation (WMO) [1] as “detailed description of the current weather along with forecasts obtained by extrapolation for a period of 0 to 6 h ahead”. Frequently used now casted phenomena include: (1) convective storms; (2) mesoscale features associated with extra-tropical and tropical storms; (3) fog and low clouds; (4) locally forced precipitation events; (5) sand and dust storms; (6) snow, ice, glazed frost, blizzards, avalanches; (7) wildfires and (8) air pollution. According to WMO, nowcasting contributes to the (1) reduction of fatalities and injuries due to weather hazards; (2) reduction of private, public, and industrial, property damages; (3) to improved efficiency and savings for industry, transportation and agriculture. The state-of-the-art nowcasting technique is an extrapolation of weather radar data. However, in recent years, the development of “blending” techniques has been ongoing, combining: (1) in-situ and remote sensing observation, (2) Numerical Weather Prediction (NWP), (3) model output statistic data, (4) high-resolution topography and (5) heuristic rules, in a seamless way.
The WMO requirement specification for the nowcasting application of Integrated Water Vapour includes: (1) uncertainty, (2) horizontal resolution, (3) observation cycle and (4) observation timeliness. As a nowcasting application threshold for spatiotemporal availability of IWV are defined observation cycle every 60 min and a GNSS network density of 50 km and observation timeliness of 30 min after the observation time. For the IWV observation cycle of 30 min, the required timeliness is 10 min and the spatial coverage of the network is 10 km. For the shortest observation cycle of 15 min, the timeliness is 5 min and spatial coverage is 5 km. The observation uncertainty is 5 kg/m 2 and 1 kg/m 2 , respectively.
Monitoring nowcasting phenomena with high temporal resolution using ground-based GNSS observations is now possible to advance observation processing strategies. Theoretically, the Precise Point Positioning (PPP) [2] and the double difference network (DD) [3] approaches of GNSS data processing are equivalent methods as it concerns the solution redundancy and estimated parameters. Practically, each strategy has advantages and disadvantages. While the DD approach is a long-term traditional method, the PPP is considered its modern alternative. Until now, the DD approach has dominated the operational service provided by the EUMETNET GNSS water vapour program (E-GVAP) for products with a latency of 90 min, which is called the near-real time mode. In 2013, the International GNSS Service (IGS) launched the real-time service [4], providing precise satellite orbit and clock corrections in support of ultra-fast or real-time PPP processing. With the evolution of the IGS precise products and models the advantages of PPP became obvious, namely: (1) easy production in both real-time and near-real-time, (2) full flexibility for central or distributed processing, (3) possibility of high spatio-temporal resolution estimates of advanced tropospheric parameters (Zenith Total Delays—ZTD, horizontal gradients and STDs) and (4) exploitation of all observations provided by each individual receiver. All these characteristics profit from a highly efficient and autonomous PPP processing strategy. Nowadays, PPP ZTD biases remain within a few millimetres, which is comparable to DD near-real-time estimates. The quality of the IGS real-time products (2013–2018) were studied [5] and its impact on ZTD was assessed within the GNSS4SWEC benchmark campaign [6]. The GNSS4SWEC real-time processing campaign demonstrated the potential for an operational provision of tropospheric products with an unprecedented temporal resolution. Nowadays, the accuracy of real-time ZTDs obtained routinely are stable and of a quality well comparable to near-real-time solution when provided in a 5-min resolution and latency with the quality suitable for nowcasting. For this study, real-time PPP processing was conducted with the G-Nut software [7] in Southeast Europe during the hail suppression season from May to September 2021.
Since 2020, newly established ground-based GNSS network in Bulgaria has been processed in near-real time with the Trop-NET processing system [8]. To derive Integrated Water Vapour (IWV) from GNSS, the surface pressure and temperature from the NWP model are used. The GNSS IWV, weather radar as well as surface atmospheric observations and NWP model forecasts are integrated into the Bulgarian Integrated NowCAsting tool (BINCA) web platform of the Hail Suppression Agency (HSA). In Bulgaria, severe weather events such as intense precipitations, hail, and thunderstorms occur commonly during the summer months and are associated with large economic losses. A hail storm on 8 July 2014 in the Bulgarian capital Sofia caused widespread damage to over 50,000 vehicles and over 123 million euros in insured losses for an approximate duration of 2 h [9]. Guerova et al. [10] investigated the added value of combining the Instability Indices (II) from radiosonde with GNSS IWV for thunderstorm days in the period May to September 2010–2015 for the Sofia region. The results clearly indicate an improvement in the probability of detection and false alarm ratio scores for a classification function, combining II and IWV. The reported here convective Storm Demonstrator (Storm Demo) is based on real-time GNSS IWV and Instability Indices (II) to derive site-specific threshold values integrated and updated in real-time on a public geoportal. The demonstrator targets the development of services centred on GNSS products for two regions with hail suppression operations in Northwestern and Central Bulgaria. This will serve as a prototype for the real-time provision of GNSS products for storm nowcasting.
This manuscript present the Storm Demo design and validation. The evaluation of real-time ZTD products with respect to post-processed ZTD products (Section 3.1). Comparison between IWV from GNSS and NWP model is presented in Section 3.2, while the classification function is in Section 3.3. The added value of the high temporal resolution of the GNSS IWV and gradients is investigated for one selected storm case presented in Section 3.4.

2. Data and Methods

The Storm Demo concept design is based on GNSS Meteorology [11]. Storm Demo design (Figure 1) has four key components, namely, (1) GNSS data processing, (2) NWP model simulation, (3) time series analysis and (4) geoportal. They are described in detail in this section.

2.1. Real-time GNSS Data Processing

The real-time (RT) troposphere monitoring has been enabled by RT data flow, provision of RT orbit and clock corrections from the IGS Real-time Service, [4] which supports the PPP method. The G-Nut/Tefnut software is used to process continuous data streams with 1-Hz GNSS observations stemming from the ground-based network operated by Sofia University (SU) and HSA. Tropospheric parameters are estimated with a sampling rate of 10 s; however, outputs are provided with a resolution of 5 min. A reference solution was processed in the offline mode, using the same software, but the final orbit and clock products and the post-processing strategy.
The G-Nut/Tefnut real-time solution uses undifferenced GNSS code and carrier-phase observations, the Kalman square root filter and stochastic models for highly efficient epoch-wise parameter estimation. The solution is unlimited in terms of the number of processed stations because the PPP is an autonomous method that can be distributed. Hence individual station-wise normal equations are of a low dimension, and the product may support high-resolution parameters including horizontal tropospheric gradients [12] or slant tropospheric path delays [13]. Both are highly sensitive to a local anisotropy of the low atmosphere at individual stations and thus contribute to advanced monitoring of the troposphere with GNSS. Using the backward smoothing [14], the near real-time solution can eventually be performed simultaneously with the RT while optimally combining a high temporal parameter resolution and a low product latency [5].
The ionosphere-free (IF) observation linear combination is used to eliminate the first-order ionospheric effect. In units of length, the undifferenced code and carrier-phase IF observations exploited in the PPP can be expressed as follows:
P R , I F S = ρ R S + c ( ˙ δ R δ S ) + T R + b R , I F b S , I F + ϵ R , I F , P S L R , I F S = ρ R S + c ( ˙ δ R δ S ) + T R + B R , I F B S , I F + N R , I F S + ϵ R , I F , L S
where indices R, S denote receiver and satellite, ρ is the geometry distance between a receiver and a transmitter, c is the speed of light, δ is a clock correction, T is the line-of-sight tropospheric path delay, b and B stands for a code and phase bias, respectively, and ϵ characterises remaining unmodelled errors. Additionally, the carrier-phase observation equation contains an initial ambiguity N. Code observations are commonly used along with carrier phases to estimate receiver clock errors and initial phase ambiguities in the PPP model. The tropospheric model for a line-of-sight path delay due to the neutral atmosphere is commonly used
T = m h Z ˙ H D + m w Z ˙ W D + m g ( ˙ G N cos ˙ ( A ) , G E sin ˙ ( A ) ) + ϵ T
where ZHD and ZWD denote the zenith hydrostatic (or, more precisely, dry) and wet tropospheric delay, respectively. The PPP tropospheric path delay for individual stations are estimated in absolute values. The tropospheric horizontal gradient vector defined i Equation (2) represents an azimuth-dependent contribution in the local horizontal plane for the Gradient North–south (GN) and the Gradient East–west (GE) directions and includes both dry and wet contributions. Such an advanced model, however, still does not necessarily represent all potential tropospheric effects, e.g., higher order horizontal anisotropy and presence of hydrometeors [6]. The elevation angle dependency of hydrostatic, wet, and gradient contributions is modelled using mapping functions distinguished as m h , m w , and m g , respectively. The ZWD (optionally horizontal gradients) is estimated as a time-dependent parameter, while the ZHD is introduced as a priory value. However, as a GNSS tropospheric product for numerical weather assimilation, the ZTD is considered:
Z T D = Z H D + Z W D
All detailed models, products, and strategies used in real-time and offline processing modes are summarised in Table 1.

2.2. NWP Simulations

Weather Research and Forecasting (WRF) NWP model v3.7 [21] is computed twice daily at 00 and 12 UTC with a 48 h forecast. The domain is with a horizontal resolution of 2 km and 45 vertical levels. The model set-up is as in Guerova et al. [22]. The WRF model simulations are archived in Sofia University Atmospheric Data Archive (SUADA, Guerova et al. [23]). Two types of WRF model output are archived, namely surface parameters (pressure, temperature, specific humidity and precipitation) and vertical profiles (pressure, temperature, water vapour mixing ratio and the model level height). The model profiles are used to compute the water vapour density at each model level ( ρ w v ( z ) ) and then by integration over the model levels, the model IWV (IWV+) is obtained as below:
I W V + = 1 ρ w z z n ρ w v ( z ) d z
where ρ w is the density of liquid water, n is the number of model levels. The computed IWV+ are with 15 min temporal resolution.
WRF model surface pressure ( p s , [hPa]) and temperature ( t s , [K]) are combined with GNSS Zenith Total Delay to derive IWV following Davis et al. [24] and Bevis et al. [25]:
I W V = 10 6 ( k 3 / T m + k 2 ) R v ( Z T D 0.0022768 p s 1 0.00266c o s ( 2 θ ) 0.00028h )
where k 2 = ( 17 ± 10 ) [K/hPa], k 3 = ( 3.776± 0.004) 10 5 [K 2 /hPa] are constants derived by Thayer [26] and R v = 461.51 [J/(kg K)] is the gas constant for water vapour, T m = 70.2+ 0.72 t s [K] is the weighted mean atmospheric temperature, h [km] is the height and θ is the latitude variation of the gravitational acceleration. The pressure difference between the GNSS and WRF model altitude is calculated using the polytropic barometric formula Sissenwine et al. [27]. The temporal resolution of IWV is 15 min for real-time data and the timeliness is 5 min.

2.3. Classification Function

In this study, the storm classification function developed by Guerova et al. [10] is used. The function is computed from GNSS-derived IWV and Instability Indices (II) from the radiosonde station at Sofia. The procedure includes (1) derivation of monthly IWV threshold for storm days; (2) computation of II from the radiosonde; (3) statistical analysis and derivation of storm classification function and (4) computation of skill scores Probability of Detection (POD) and False Alarm Ratio (FAR).

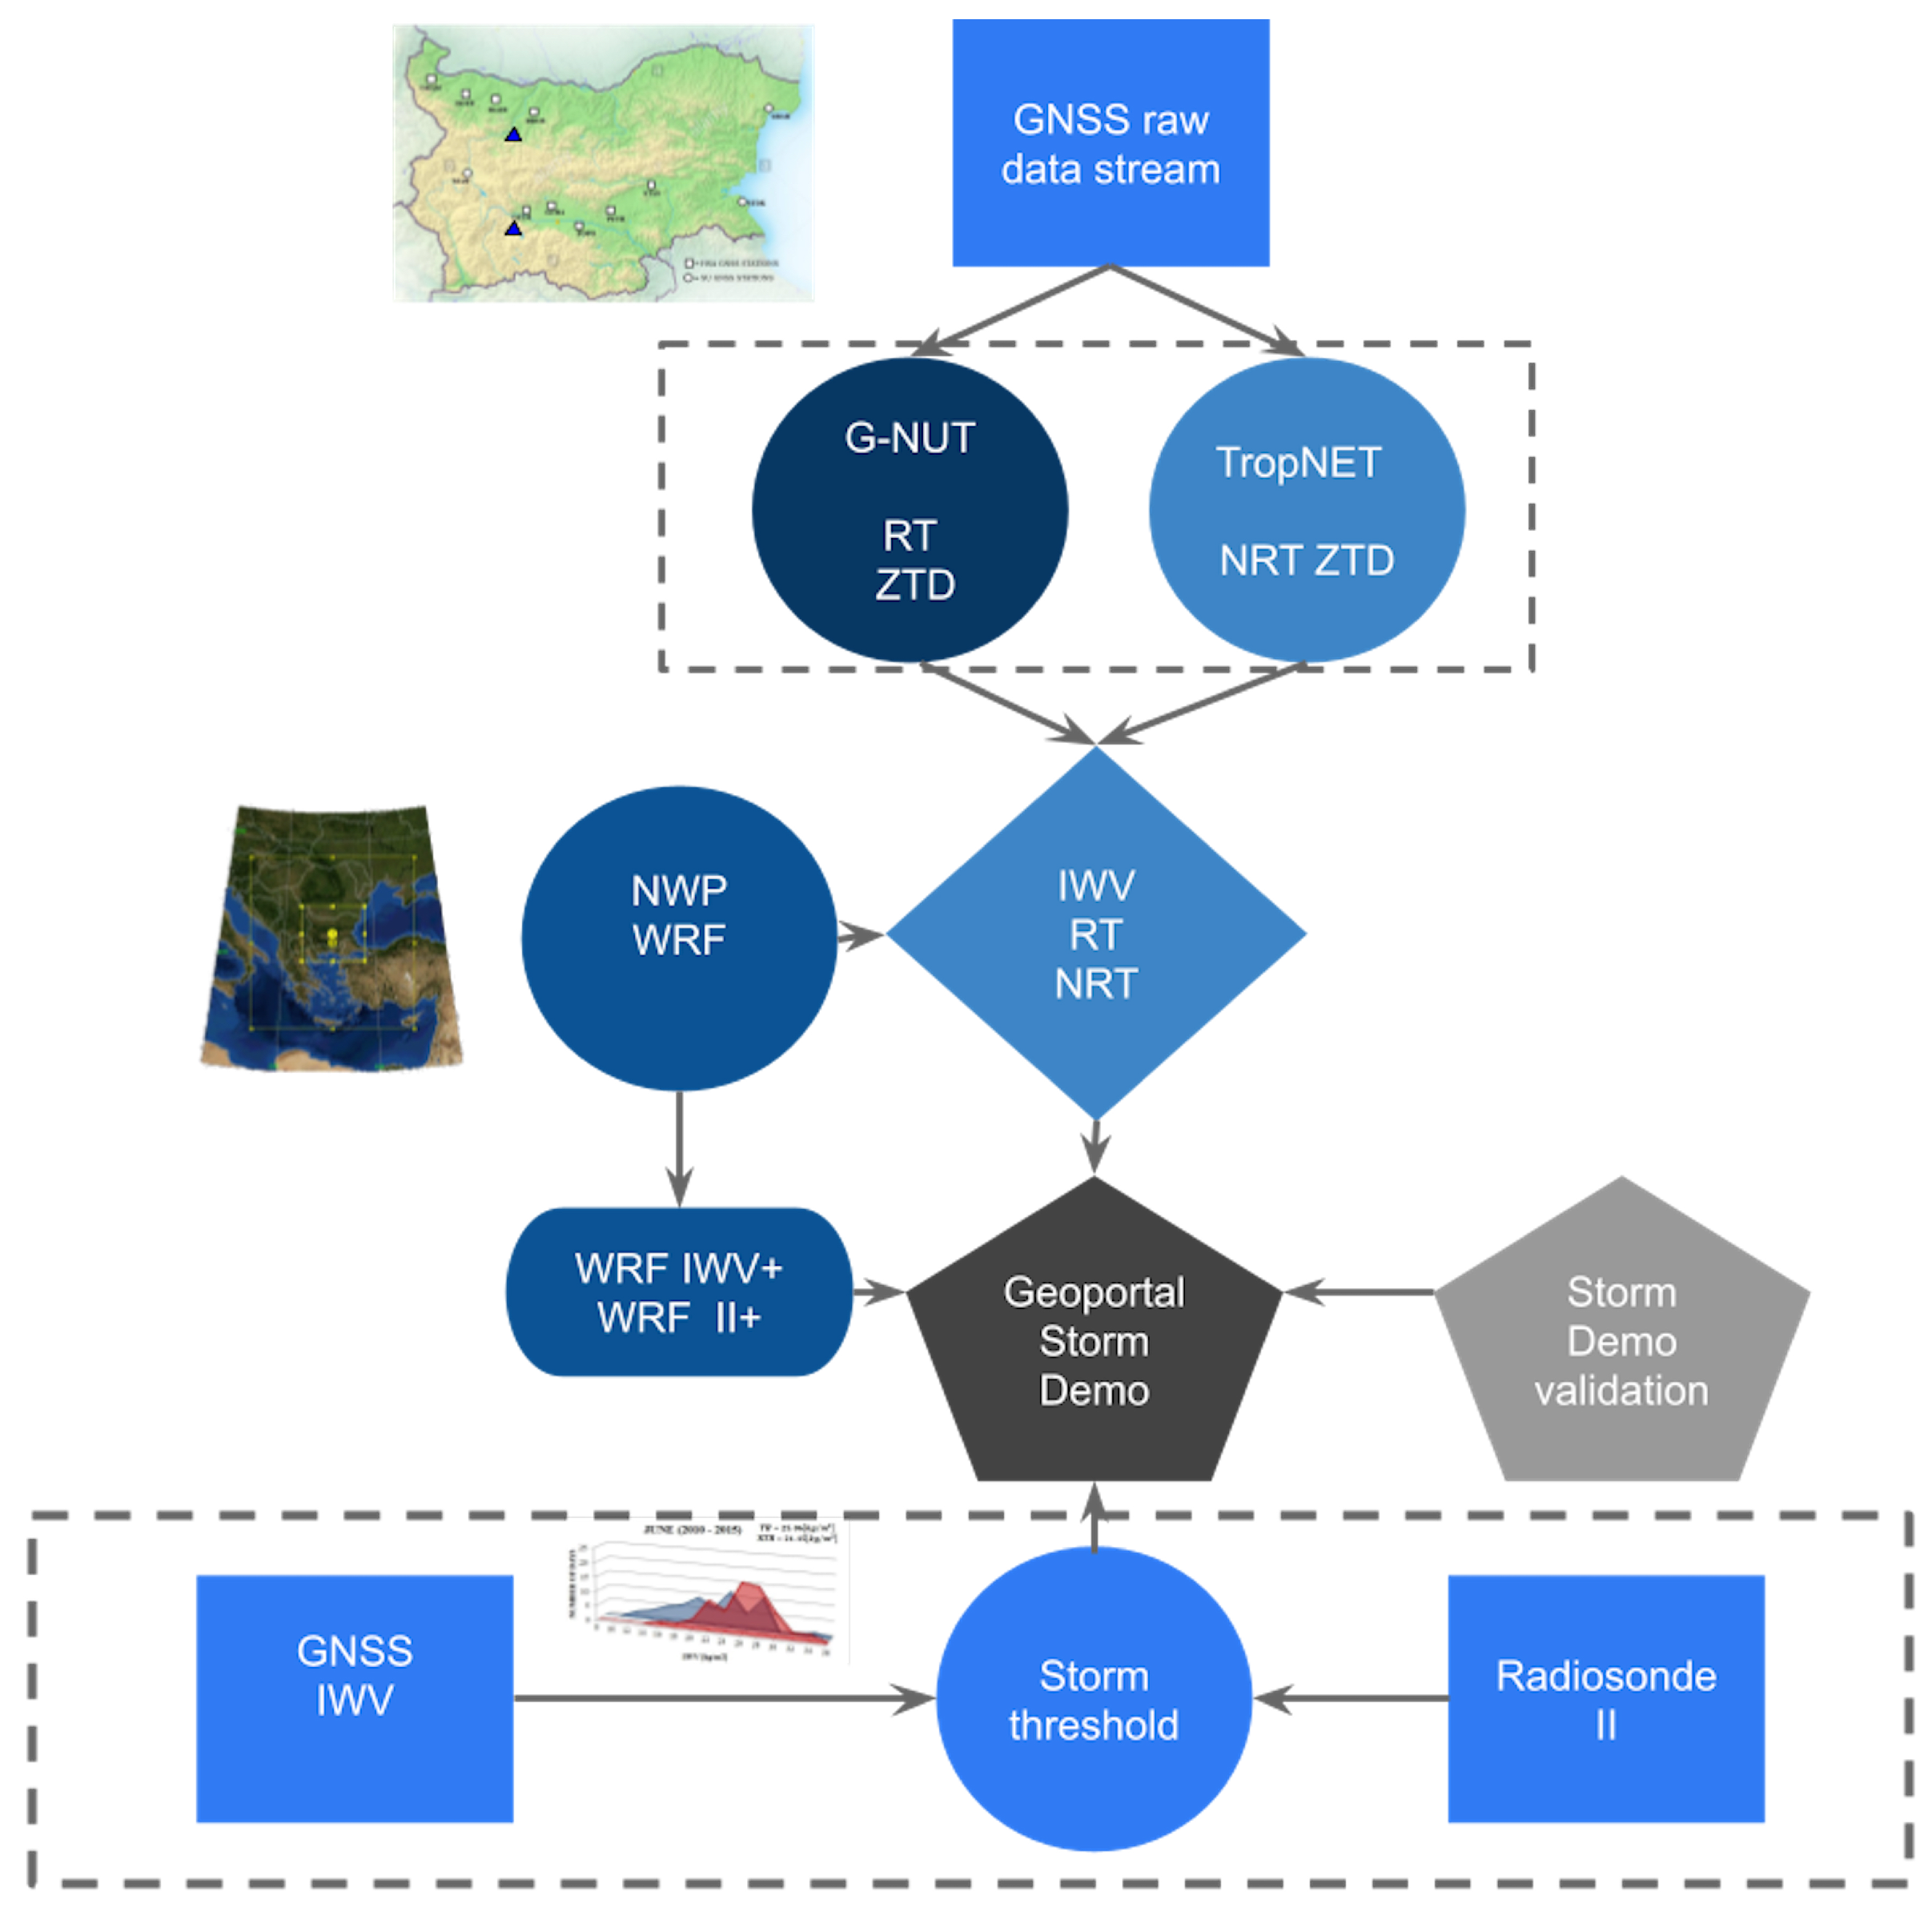
2.4. GNSS Webportal Set-Up

A publicly accessible web portal for GNSS Storm nowcasting demonstrator (Storm Demo) is implemented on the Sofia University SUADA web page (http://suada.phys.uni-sofia.bg/?page_id=4656 (accessed on 4 July 2022)). On the Storm Demo web portal, the IWV, II, IWV+ and respective thresholds for each individual GNSS station are visualised. In addition, for each GNSS station, an event table is generated and based on the IWV monthly threshold, no thunder/thunder event indicator is displayed in the table with a refresh rate of 60 s. There are three subsections of the webportal for IWV, II and Thunderstorm classification function. IWV subsection is the graphical representation of the thunder event indicator and displays the IWV and IWV+ for the current day for two stations—one located in Northwest Bulgaria and one in Centralsouth Bulgaria. There are two date fields and one drop-down selection menu for the selection of past event visualisation. II subsection includes six charts for Showalter Index (SHI), Severe Weather Threat Index (SWEAT), Lifted Index (LI), K Index (K), Total Totals Index (TT) and Temperature at Lifted Condensation Level (TLCL). The indices are computed from radiosonde stations Sofia and Bucharest. The displayed data is for the last 7 days with an option for past event selection and visualisation. The third subsection consists of a chart for the current day of the thunderstorm classification functions based on II and IWV for station Sofia Plana. The chart data is updated every 60 s, synchronised with the event indicator and IWV subsection. Date fields are located above the chart to select a time period for past event visualisation.

3. Results

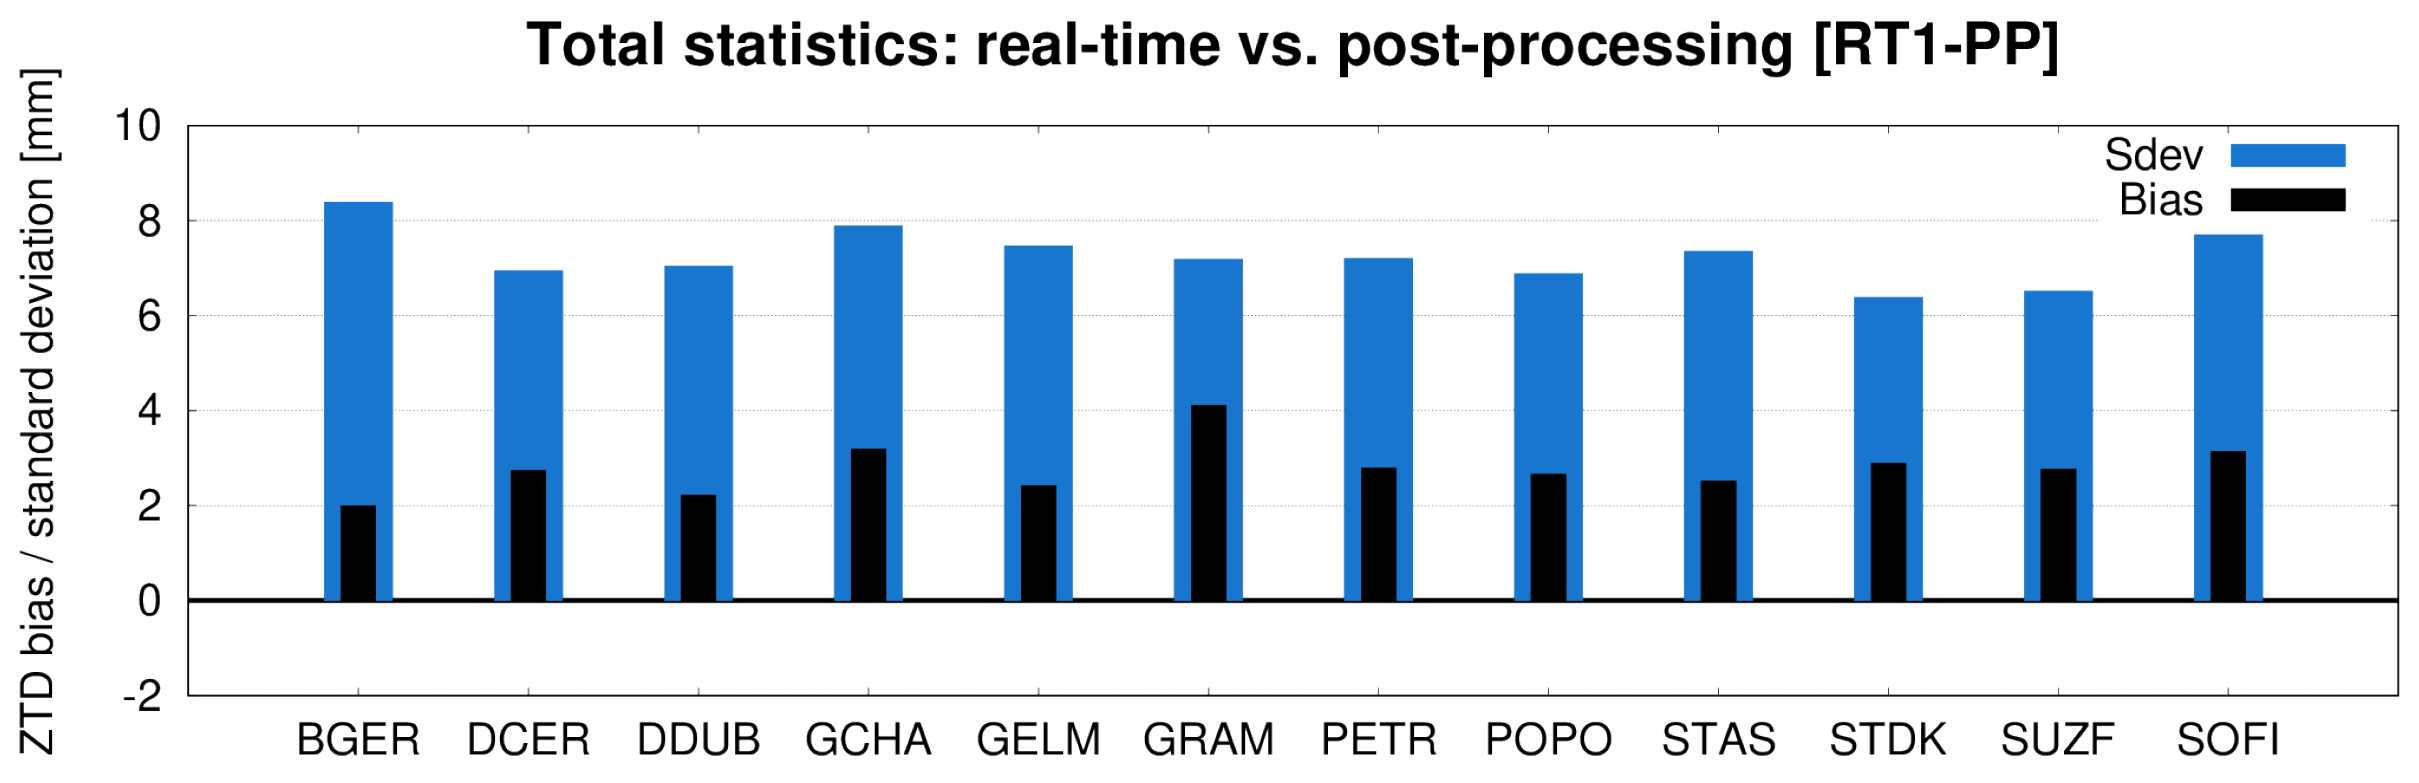
3.1. Real-Time Processing Evaluation: May–September 2021

Real-time GNSS ZTDs (RT1) obtained in the period 1 May–30 September 2021 were evaluated with respect to a Post-Processing (PP) solution. While the real-time solution was generated continuously using the Kalman filter and the real-time precise products, the post-processing solution was performed daily using the backward smoother and the final precise products. All other processing strategy characteristics and G-Nut/Tefnut configurations were identical for both solutions. The precise products used in the real-time and post-processing solution stemmed from the IGS Real-time Service [4] and the IGS final product, respectively.
Figure 2 displays daily (colour) and monthly (black) ZTD biases (green) and standard deviations (blue) for the station POPO, while Figure 3 shows ZTD statistics for the whole period and all processed stations in Bulgaria. The comparison demonstrates that all long-term biases are below 5 mm but may still vary up to a centimetre in a short-term evaluation daily. An overall precision is below 9 mm for all the stations with almost an identical performance on a monthly or daily basis. As the evaluation concerns the summer season, a similar or better performance is expected in winter too, when considering that water vapour content and its variations in the atmosphere is significantly lower. Hence, we may state the ZTDs estimated in real time are performing well within the requirements for nowcasting, i.e., below 15 mm.

3.2. IWV from WRF and RT GNSS: May–September 2021

One of the benefits of GNSS IWV is for the evaluation of NWP model performance. In this work, for the first time, the real-time IWV is compared with the WRF model in Bulgaria (IWV+) with a temporal resolution of 15 min. Presented in Figure 4 are monthly box and whisker plots of IWV (red box) and IWV+ (green box) for 10 stations and the period May–September 2021. The GNSS IWV median is over 5 kg/m 2 lower than WRF for all stations in May and September 2021. In addition, for Sofia, an independent comparison between IWV from WRF and radiosonde is conducted and the wet model bias is confirmed (not shown). For June, July and August, the IWV media from GNSS and WRF have close values, but the spread is seen in the 70 and 90 percentile is much higher in GNSS. This clearly indicates that the model can benefit from real-time evaluation with GNSS IWV. This motivates the implementation of the Storm Demo web portal option for real-time comparison of IWV and IWV+.

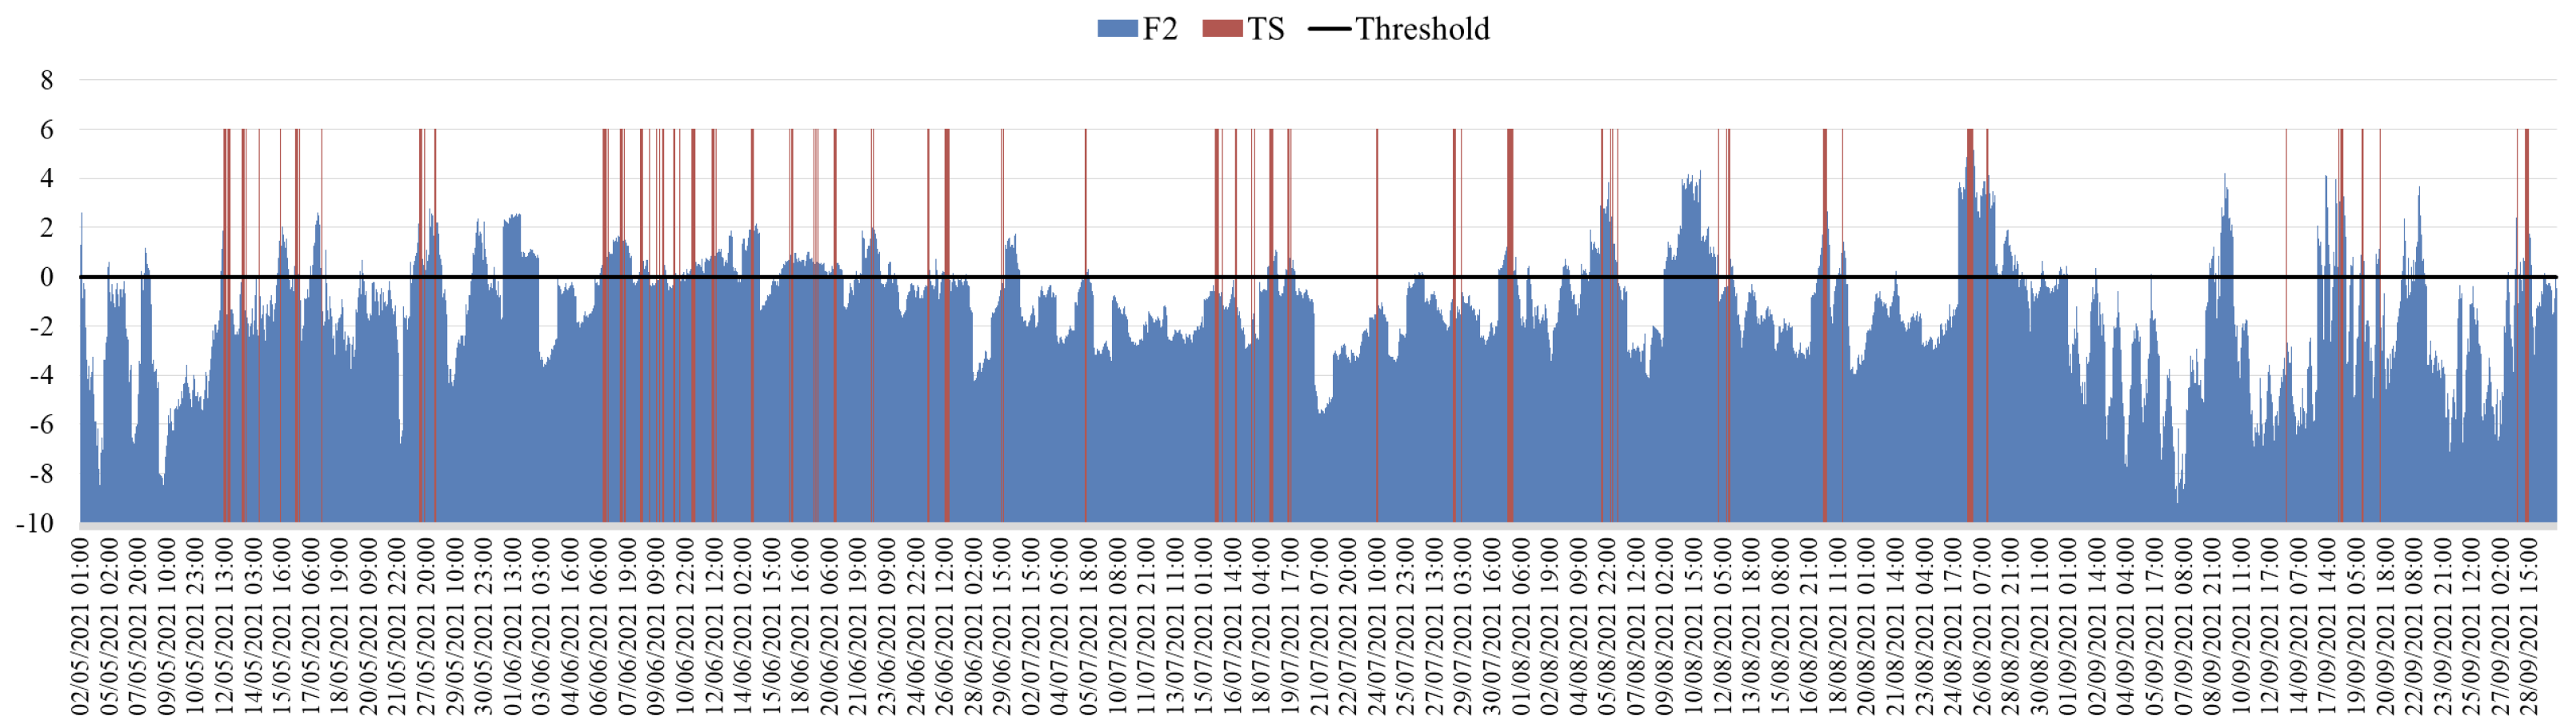
3.3. Thunderstorm Classification Function for Sofia Plana

For the GNSS station Sofia Plana (SOFI), monthly classification functions are obtained by Guerova et al. [10]. Presented in Figure 5 are (1) the values of classification function (F) of post-processed real-time IWV and II (blue bars) and (2) recorded thunder events (red bars) from May to September 2021. Positive values of F indicate thunder event (TH) while negative no thunder (NTH). The month with the largest number of TH events is June with 63, while September has only 16 TH events. May, July and August are with 26, 33 and 26 TH events, respectively. The classification function is mostly positive in June and mostly negative in July (Figure 5). As seen in Figure 5 there are clusters of positive and negative F values. For the majority of the cases with positive F values, there are registered TH events. However, there are also cases with no TH registration, but positive F value as well as cases with negative F values and TH registration. As a next step an overall evaluation of F on a monthly basis is conducted. The monthly mean and standard deviation of F are as follows: (1) −1.75 and 2.41 for May, (2) 0.00 and 1.32 for June, (3) −1.62 and 1.31 for July, (4) −0.47 and 2.06 for August and (5) −2.68 and 2.72 for September 2021. The month with the largest monthly F value is June and this corresponds to the largest number of 61 thunderstorm registrations. In comparison, the month with an F minimum (−2.68) is September, with only 16 thunderstorm registrations (red bars in Figure 5).

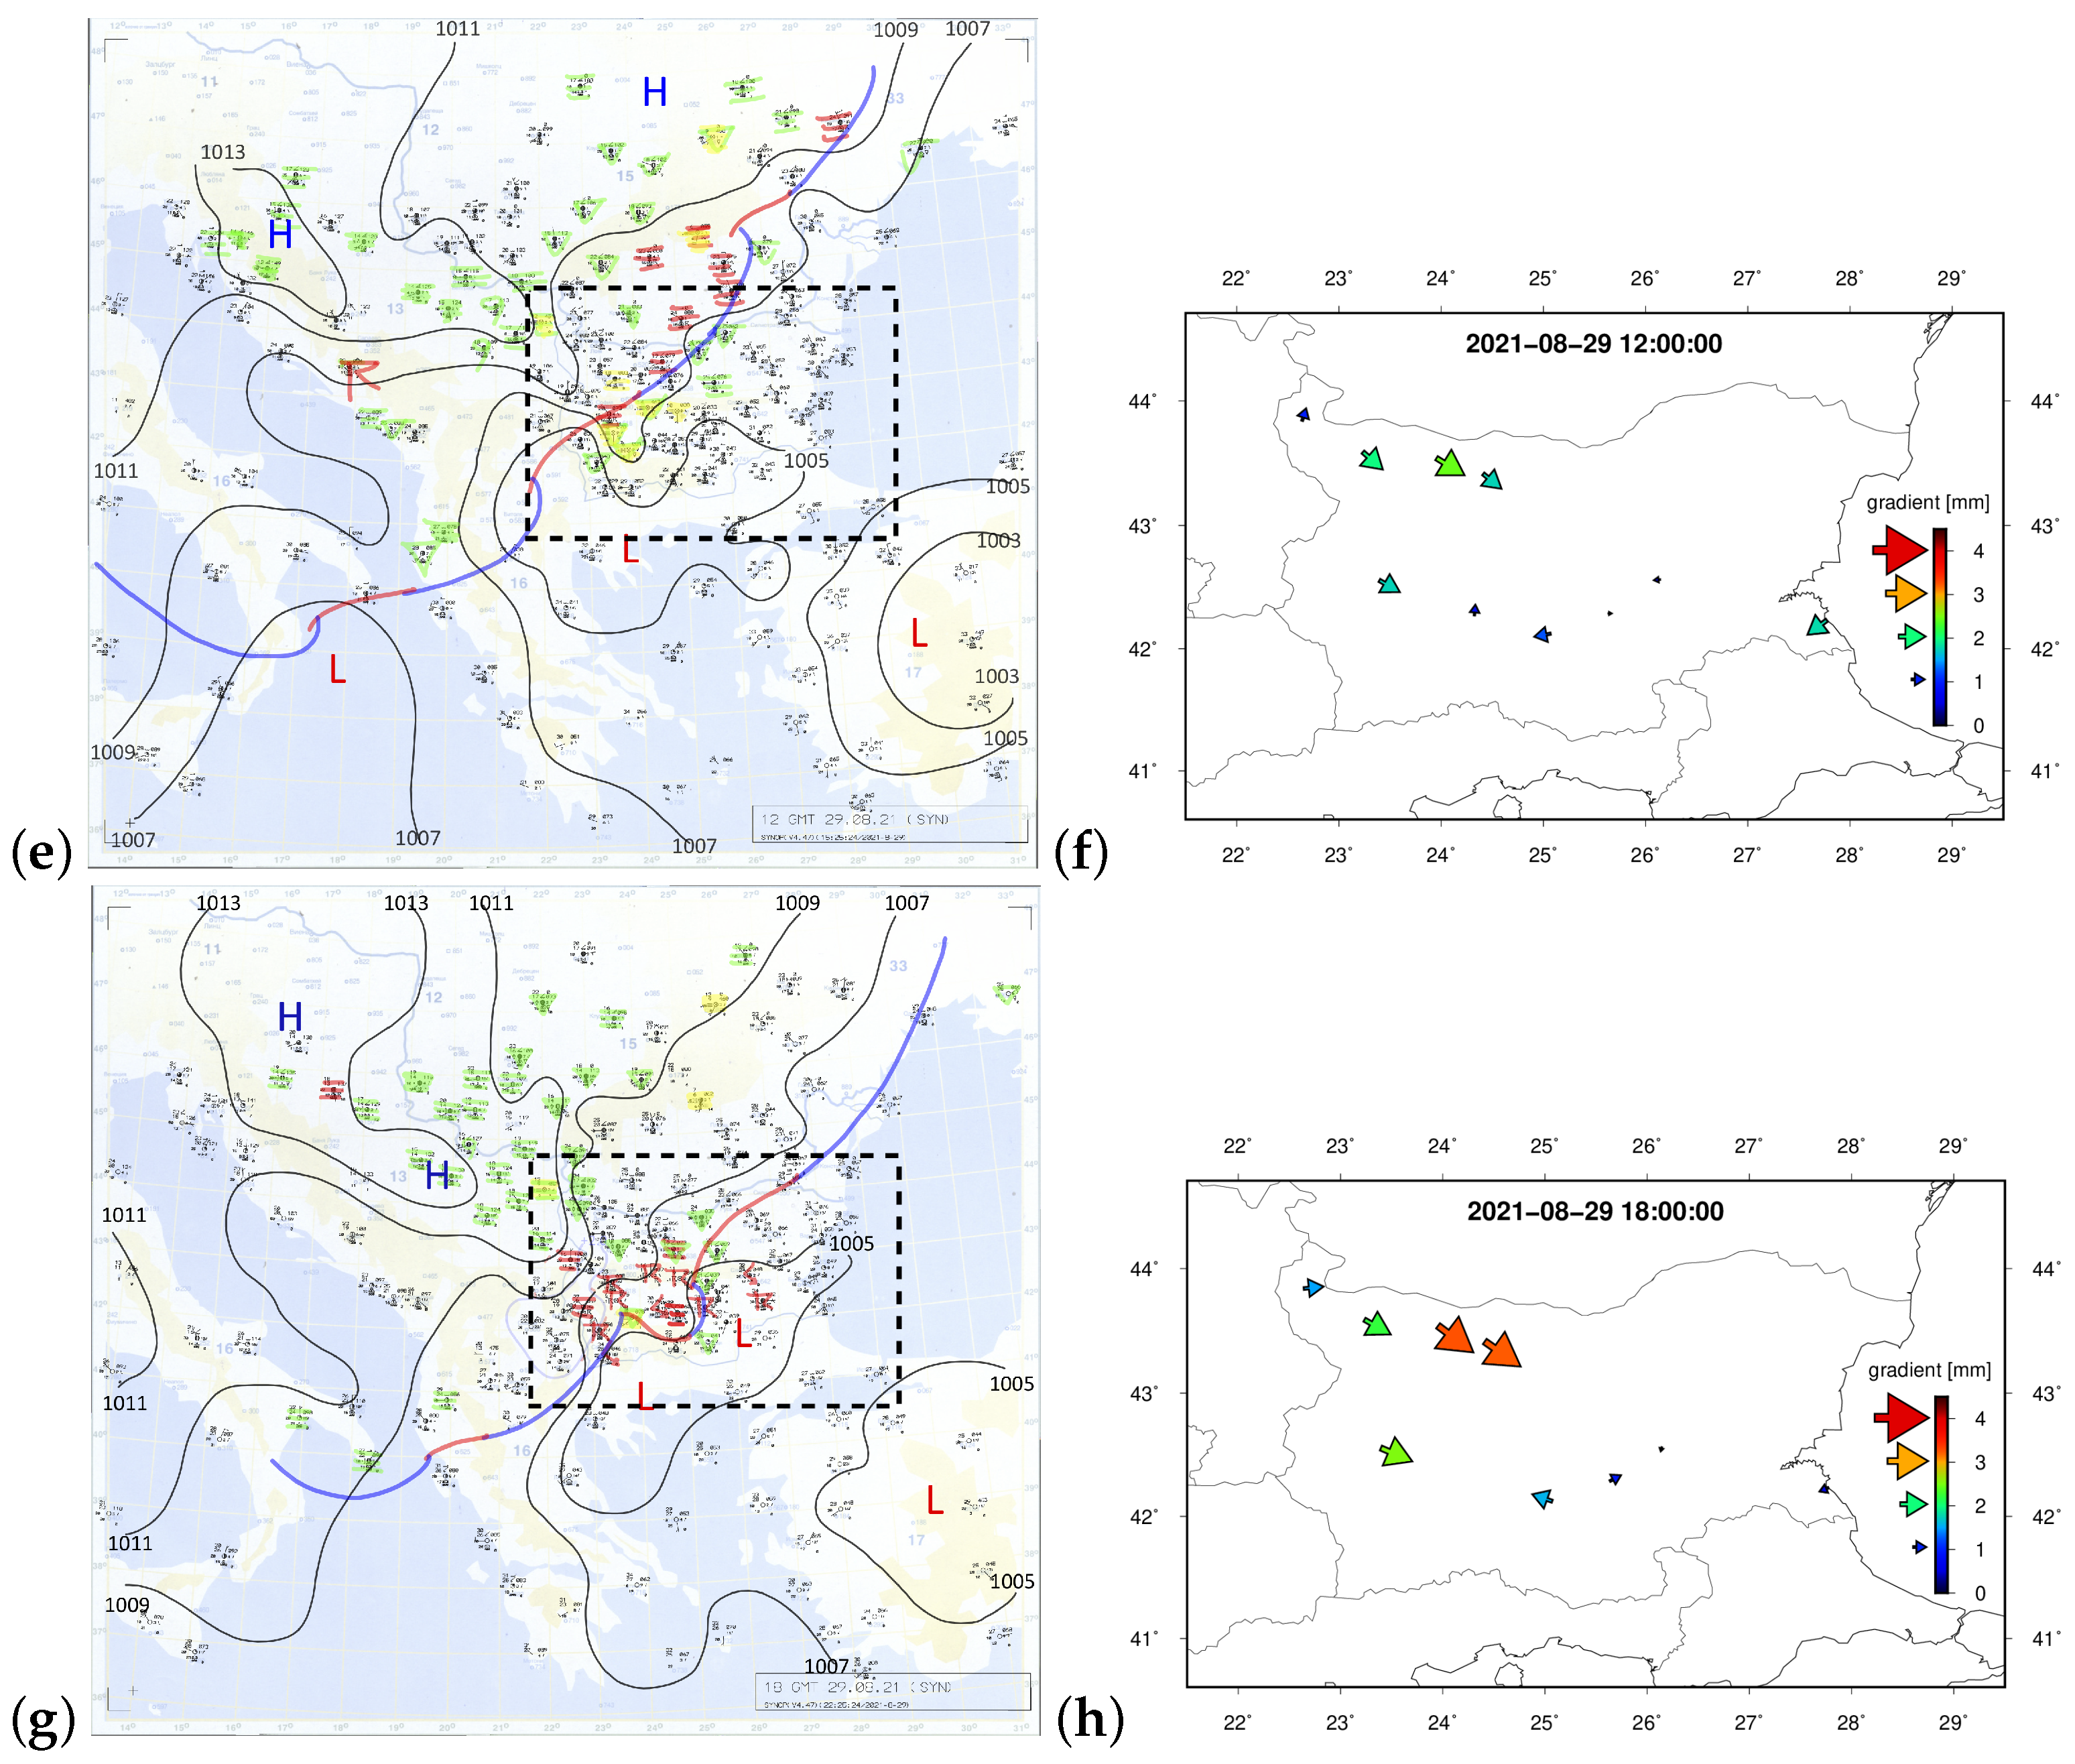
3.4. Case Study—Hail storm 28–29 August 2021

For August 2021, the National Institute of Meteorology and Hydrology (NIMH) issued Meteoalarm warnings for severe weather events as follows: (1) yellow code issued for 16 days, (2) orange code for 6 days and (2) red code for 1 day [28]. Widespread severe hail storms were recorded between 24 and 30 August. The synoptic conditions during the last week of August are described in the Hydro-Meteorological Bulletin of NIMH; Ref. [28] thus, here, a brief summary is offered. On 25–26 August, a cold atmospheric front passed from west to east through Bulgaria with observed heavy convective precipitation and thunderstorms. Between 27 and 31 August, Bulgaria and the Balkan Peninsula were under the influence of the blocked cyclone situated over Central Europe and the blocked anticyclone over the Black sea (see Figure 6). On 28–29 August, two cold atmospheric fronts passed near the surface. Temporary intense rains and thunderstorms were reported. On those days, intense cloud seeding activities were performed by the HSA in central south Bulgaria. On 30 August, with the cold front retreated, the temperature decreased and a ridge developed over Bulgaria.

3.4.1. IWV and Radar Reflectivity

As seen in Figure 7a GNSS IWV at station Gelemenovo increased rapidly on 25 August and decreased on 30 August. Clearly seen is that the daily mean values before 25 August are in the range of 22–26 kg/m 2 . After 25 August IWV values stay above 31.7 kg/m 2 (red line in Figure 7) and indicate moist air mass over the Centralsouth Bulgaria. In the period 26–29 August the daily mean IWV is above the monthly threshold for thunderstorm activity for Gelemenovo of 31.7 kg/m 2 (red line in Figure 7b). In addition, for 28 and 29 August, the IWV increase is calculated for the time interval between 6 and 16 UTC (Table 2). Clearly seen is that for the GNSS stations Gelemenovo, Popovitsa and Petrovo, the hourly increase is by a factor of 2, 4 and 2 higher on 28 August compared to 29 August. It is interesting to be noted that on 29 August, a “yellow” Meteoalarm code is issued by NIMH for the regions where three GNSS stations are located. At Popovitsa clear difference is seen between IWV on 28 and 29 August (blue bars in Figure 8). In addition, plotted with orange bars in Figure 8 is the maximum altitude of 45 dBZ radar reflectively. At Gelemenovo, the 45 dBZ altitude reaches 14 km on 28 August but is below 8 km on 29 August. The mean altitude of 45 dBZ at Popovitsa is 8.9 and 5.0 km between 14:00–19:30 UTC on 28 and 29 August, respectively. Linking the IWV with maximum and mean altitude of 45 dBZ gives a clear correlation between faster IWV increase and the vertical extension of the convective system. While this is a logical and expected result, it is to be noted that for the first time, it has been obtained for this location and will likely be of interest for hailstorm nowcasting. In addition, the added value of the sub-hourly temporal resolution in Figure 8 is demonstrated clearly to be well suited for this type of analysis.

3.4.2. ZTD Gradients: 28–29 August

As a next step of the storm analysis, the GNSS-derived ZTD gradients in Bulgaria are compared to the 4 surface weather maps covering the Balkan peninsula at 12 and 18 UTC on 28 and 29 August. The gradients in northwest Bulgaria and Sofia are in a dominant northwest direction being the smallest at 12 UTC on 28 August (Figure 9b) and the largest at 18 UTC on 29 August (Figure 9h). This can be explained by the position of the frontal system on 28 and 29 August. On 28 August, the frontal system is found north and west of Bulgaria (Figure 9a,c), while on 29, it passes over Bulgaria (Figure 9e,h). Much different in both magnitude and direction are the gradients in central-south Bulgaria. At 12 and 18 UTC on 28 August, the ZTD gradients are larger compared to the same time on 29 August. It is to be noted that at 18 UTC, the gradient direction is: (1) south at Gelemenovo, (2) east at Popovitsa and (3) south at Petrovo and Staro selo.

3.5. Storm Demo Web Portal 20–31 August 2021

As an example of the Storm Demo web portal, the period 20–31 August 2021 is selected. Figure 10 shows the graphical visualisation of the IWV, Severe Weather Threat Index (SWEAT) and classification function computed using IWV and a combination of three instability indices (Total Totals, Showalter and SWEAT) are show. The real-time IWV (yellow dots in Figure 10a) is computed for the GNSS station Sofia Plana and is compared to the forecast IWV by the WRF model (green dots on Figure 10a). The temporal resolution is 15 min. The SWEAT index is computed for the radiosonde station in Sofia, Bulgaria (blue dot) and Bucharest, Romania (green dot) and plotted in Figure 10b. The red colour in Figure 10b is the 25–75 monthly percentile interval for August computed for the period 2010–2020. The temporal resolution of the SWEAT is much lower, with 2 values per day. As seen from Figure 10b, for Sofia, SWEAT values are higher than the 75 percentile in the period 25–29 August 2021. Lastly, the thunderstorm classification function (F) is computed by combing the information from GNSS and radiosonde data from Sofia as described in Guerova et al. [10] and presented in the third subsection of the Storm Demo web portal (Figure 10c). By design, positive value of F indicates possible thunderstorm activity. As seen in Figure 10c the F values are: (1) mostly negative before 25 August, (2) positive on 25 and 26 August in the range 2.5–6.5 and (3) mostly positive from 27 to 31 August but with a much smaller range up to 2.5. Observed thunderstorm activity (https://www.blitzortung.org/en/historical_maps.php?map=10 (accessed on 3 August 2022)) in Sofia on 25 August are at 4 UTC and from 11 to 23 UTC. No thunderstorms are recorded on 26 August.

4. Discussion

In this manuscript, we present a GNSS-based Storm nowcasting demonstrator (Storm Demo). Storm Demo is the first of its kind prototype that is based on real-time sub-hourly tropospheric products aimed at hail suppression service. Verification of real-time ZTD for the period May–September 2021 shows precision below 9 mm, which satisfies the nowcasting requirements defined by the World Meteorologic Organisation. The real-time IWV data is combined with Instability Indices derived from radiosonde observations to compute classification functions for thunderstorm nowcasting for the period May–September 2021. The probability of detection of thunderstorms for the period is 83%, while the false alarm ratio is 38%. Two main reasons can contribute to the false alarm ration. Firstly, the temporal resolution of radiosonde data is 24 h and the sounding is at 12 UTC, which is not optimal for convection monitoring. Secondly, the selection of IWV is based on the maximum value before the storm. It is likely that a machine learning approach can help with optimising IWV selection. For example, the study by Benevides et al. [29] is the first that reports a link between the rate of change of IWV and rainfall for Portugal. In addition, use of independent observations like lightning data with high temporal resolution (5 min) will likely further improve both probabilities of detection and false alarm ratio. During the severe hail storms on 28 and 29 August, the hourly rate of IWV change was found to be correlated with the altitude of the 45 dBZ. This is an expected but interesting result with the potential for further exploitation in operational hail suppression by closely monitoring the hourly increase of IWV before the storm initiation. Machine learning study in Poland [30] for thunderstorm nowcasting also confirms the added value of GNSS tropospheric products, including but not limited to IWV. In this study, the real-time GNSS gradients are used for the time in Bulgaria during the severe hail storm on 28–29 August. They have been found to have added value for understanding the regions with airflow convergence and divergence in Southcentral Bulgaria. The design of the Storm Demonstrator is complemented with a publicly accessible web portal with user-friendly visualisation and timely update in real-time mode. One limitation of this study is the low spatial coverage of the currently available GNSS network in Bulgaria, which limits the interpretation of the storm environment.

Author Contributions

Conceptualisation, G.G. and J.D.; methodology, G.G. and J.D.; software, P.V. and N.P.; validation, P.V. and N.P.; formal analysis, A.S. and T.D.; writing—original draft preparation, G.G.; writing—review and editing, all authors; visualisation, A.S., T.D., N.P., J.D. and P.V. All authors have read and agreed to the published version of the manuscript.

Funding

The work reported in this paper is performed under the ESA Plan for European Cooperating States (PECS) Programme grant number 4000134003/21/NL/CBi and with financial support of National Road-map for Research Infrastructures: HPC 1-221/03.12.2018 (SU-NIS-3318).

Data Availability Statement

Conflicts of Interest

The authors declare no conflict of interest. The funders had no role in the design of the study; in the collection, analyses, or interpretation of data; in the writing of the manuscript, or in the decision to publish the results.

References

  1. WMO. Guidelines for Nowcasting Techniques; Technical Report; World Meteorological Organization: Geneva, Switzerland, 2017; ISBN 978-92-63-11198-2. [Google Scholar]
  2. Zumberge, J.; Heflin, M.; Jefferson, D.; Watkins, M.; Webb, F. Precise point positioning for the efficient and robust analysis of GPS data from large networks. J. Geophys. Res. Solid Earth 1997, 102, 5005–5017. [Google Scholar] [CrossRef]
  3. Teunissen, P.J. Carrier phase integer ambiguity resolution. In Springer Handbook of Global Navigation Satellite Systems; Springer: Berlin/Heidelberg, Germany, 2017; pp. 661–685. [Google Scholar]
  4. Caissy, M.; Agrotis, L.; Weber, G.; Hernandez-Pajares, M.; Hugentobler, U. Innovation: Comming Soon: The International GNSS Real-Time Service. GPS World 2012, 23, 52. [Google Scholar]
  5. Douša, J.; Václavovic, P.; Zhao, L.; Kačmařík, M. New Adaptable All-in-One Strategy for Estimating Advanced Tropospheric Parameters and Using Real-Time Orbits and Clocks. Remote Sens. 2018, 10, 232. [Google Scholar] [CrossRef]
  6. Douša, J.; Dick, G.; Kačmařík, M.; Brožková, R.; Zus, F.; Brenot, H.; Stoycheva, A.; Möller, G.; Kaplon, J. Benchmark campaign and case study episode in central Europe for development and assessment of advanced GNSS tropospheric models and products. Atmos. Meas. Tech. 2016, 9, 2989–3008. [Google Scholar] [CrossRef]
  7. Václavovic, P.; Douš, J.; Györi, G. G-Nut software library - state of development and first results. Acta Geodynynamica Geomater. 2013, 10, 431–436. [Google Scholar] [CrossRef]
  8. Douša, J.; Bennitt, G. Estimation and evaluation of hourly updated global GPS Zenith Total Delays over ten months. GPS Solut. 2013, 17, 453–464. [Google Scholar] [CrossRef]
  9. Bocheva, L.; Dimitrova, T.; Penchev, R.; Gospodinov, I.; Simeonov, P. Severe convective supercell outbreak over western Bulgaria on July 8, 2014. Idojárás 2018, 122, 177–203. [Google Scholar] [CrossRef]
  10. Guerova, G.; Dimitrova, T.; Georgiev, S. Thunderstorm Classification Functions Based on Instability Indices and GNSS IWV for the Sofia Plain. Remote Sens. 2019, 11, 2988. [Google Scholar] [CrossRef]
  11. Guerova, G.; Jones, J.; Douša, J.; Dick, G.; de Haan, S.; Pottiaux, E.; Bock, O.; Pacione, R.; Elgered, G.; Vedel, H.; et al. Review of the state of the art and future prospects of the ground-based GNSS meteorology in Europe. Atmos. Meas. Tech. 2016, 9, 5385–5406. [Google Scholar] [CrossRef]
  12. Kačmařík, M.; Douša, J.; Zus, F.; Václavovic, P.; Balidakis, K.; Dick, G.; Wickert, J. Sensitivity of GNSS tropospheric gradients to processing options. Ann. Geophys. Discuss. 2018, 2018, 1–19. [Google Scholar] [CrossRef]
  13. Kačmařík, M.; Douša, J.; Dick, G.; Zus, F.; Brenot, H.; Möller, G.; Pottiaux, E.; Kapłon, J.; Hordyniec, P.; Václavovic, P.; et al. Inter-technique validation of tropospheric slant total delays. Atmos. Meas. Tech. 2017, 10, 2183–2208. [Google Scholar] [CrossRef]
  14. Václavovic, P.; Douš, J. Backward smoothing for precise GNSS applications. Adv. Space Res. 2015, 56, 1627–1634. [Google Scholar] [CrossRef]
  15. Saastamoinen, J. Atmospheric Correction for the Troposphere and Stratosphere in Radio Ranging of Satellites. Geophys. Monogr. 1972, 15, 247–252. [Google Scholar]
  16. Boehm, J.; Heinkelmann, R.; Schuh, H. Short note: A global model of pressure and temperature for geodetic applications. J. Geod. 2007, 81, 679–683. [Google Scholar] [CrossRef]
  17. Boehm, J.; Niell, A.; Tregoning, P.; Schuh, H. Global Mapping Function (GMF): A new empirical mapping function based on numerical weather model data. Geophys. Res. Lett. 2006, 33, 4. [Google Scholar] [CrossRef]
  18. Chen, G.; Herring, T. Effects of atmospheric azimuthal asymmetry on the analysis of space geodetic data. J. Geophys. Res. Solid Earth 1997, 102, 20489–20502. [Google Scholar] [CrossRef]
  19. Petite, G.; Luzum, B. IERS Conventions; Technical Report; IERS Technical Notes; Verlag des Bundesamts für Kartographie und Geodäsie: Frankfurt am Main, Germany, 2010. [Google Scholar]
  20. Lyard, F.; Lefevre, F.; Letellier, T.; Francis, O. Modelling the global ocean tides: Modern insights from FES2004. Ocean. Dyn. 2006, 56, 394–415. [Google Scholar] [CrossRef]
  21. Skamarock, W.C.; Klemp, J.; Dudhia, J.; Gill, D.O.; Barker, D.M.; Duda, M.G.; Huang, X.Y.; Wang, W.; Powers, J. A Description of the Advanced Research WRF Version 3; NCAR: Boulder, CO, USA, 2008; Available online: https://opensky.ucar.edu/islandora/object/technotes:500 (accessed on 6 December 2016).
  22. Guerova, G.; Dimitrova, T.; Vassileva, K.; Slavchev, M.; Stoev, K.; Georgiev, S. BalkanMed real time severe weather service: Progress and prospects in Bulgaria. Adv. Space Res. 2020, 66, 2844–2853. [Google Scholar] [CrossRef]
  23. Guerova, G.; Simeonov, T.; Yordanova, N. The Sofia University Atmospheric Data Archive (SUADA). Atmos. Meas. Tech. 2014, 7, 2683–2694. [Google Scholar] [CrossRef]
  24. Davis, J.; Herring, T.; Shapiro, I.; Rogers, A.; Elgered, G. Geodesy by radio interferometry: Effects of atmospheric modeling errors on estimates of baseline length. Radio Sci. 1985, 20, 1593–1607. [Google Scholar] [CrossRef]
  25. Bevis, M.; Businger, S.; Herring, T.A.; Rocken, C.; Anthes, R.A.; Ware, R.H. GPS Meteorology: Remote Sensing of Atmospheric Water Vapour Using the Global Positioning System. J. Geophys. Res. 1992, 97, 15787–15801. [Google Scholar] [CrossRef]
  26. Thayer, G.D. An improved equation for the radio refractive index of air. Radio Sci. 1974, 9, 803–807. [Google Scholar] [CrossRef]
  27. Sissenwine, N.; Dubin, M.; Wexler, H. The U.S. Standard Atmosphere, 1962. J. Geophys. Res. 1962, 67, 3627–3630. [Google Scholar] [CrossRef]
  28. NIMH. Monthly Hydrometeorological Bulletin; Technical Report; NIMH: Sofia, Bulgaria, August 2021; ISSN 2815-2743. [Google Scholar]
  29. Benevides, P.; Catalao, J.; Miranda, P. On the inclusion of GPS precipitable water vapour in the nowcasting of rainfall. Nat. Hazards Earth Syst. Sci. 2015, 15, 2605–2616. [Google Scholar] [CrossRef]
  30. Łoś, M.; Smolak, K.; Guerova, G.; Rohm, W. GNSS-based machine learning storm nowcasting. Remote Sens. 2020, 12, 2536. [Google Scholar]
Figure 1. Storm Demo concept design.
Remotesensing 14 03746 g001
Figure 2. Daily statistics for May–September, 2021 of the ZTD comparisons (real–time minus post–processing) for station Popovitsa (POPO); (a) systematic error and (b) standard deviation.
Remotesensing 14 03746 g002
Figure 3. ZTD statistics (real-time minus post-processing) for all stations and the period May–September 2021.
Remotesensing 14 03746 g003
Figure 4. GNSS IWV (red box) and WRF IWV+ (green box) monthly box and whisker plots for the period May–September 2021 (ae).
Remotesensing 14 03746 g004
Figure 5. Classification function for GNSS station SOFI (blue bars) and thunderstorm registrations (red bars) from May to September 2021.
Remotesensing 14 03746 g005
Figure 6. Maps of composite anomalies of (a) temperature at 850 hPa and (b) geopotential height at 500 hPa for the period 24–30 August 2021.
Remotesensing 14 03746 g006
Figure 7. GNSS IWV at (a) Gelemenovo and (b) Popovitsa for the period 20–30 August 2021. The red line indicates the monthly IWV threshold for August. The dashed yellow line marked the day with “yellow” and the Meteoalarm code is issued by NIMH.
Remotesensing 14 03746 g007
Figure 8. IWV (blue bars) and the altitude of 45 dBz (orange bars) at (a) Gelemenovo, (b) Popovitsa, (c) Petrovo and (d) Staro selo on 28–29 August 2021.
Remotesensing 14 03746 g008
Figure 9. Surface weather charts for the Balkan peninsula at (a) 12 UTC on 28 August, (c) 18 UTC on 28 August, (e) 12 UTC on 29 August and (g) 18 UTC on 29 August. ZTD gradients over Bulgaria at (b) 12 UTC on 28 August, (d) 18 UTC on 28 August, (f) 12 UTC on 29 August and (h) 18 UTC on 29 August.
Remotesensing 14 03746 g009aRemotesensing 14 03746 g009b
Figure 10. Storm Demo web portal sections (a) IWV, (b) SWEAT index, and (c) classification function.
Remotesensing 14 03746 g010
Table 1. Real-time and post-processing strategies and models.
Processing StrategyReal-Time SolutionReference Solution
Data sampling rate10 s30 s
ZTD product latency15 min (maximum)15 days (minimum)
Station coordinatesEstimated continuouslyEstimated day by day
Satellite orbits and clocksIGS real-timeIGS finals
Processing modeContinuous forward filterDay-to-day forward filter and backward smoother
Processing methodPrecise Point Positioning
Parameter estimatorSquare root filter
GNSS observationsUndifferenced code+phase IF observations
Observation weighing1/sin(elevation) 2 , code = 100 * phase
Elevation angle cut-off7 degrees
ZTD sampling rate5 min
Receiver clocksEstimated continuously with a white noise
Satellite clocksIntroduced consistently to precise orbits
Phase ambiguitiesFloat values estimated simultaneously to ZTDs
IonosphereThe first order eliminated in IF combination
A priori troposphereSaastamoinen hydrostatic model [15] supported with the atmospheric pressure from the GPT model [16]
Estimated troposphereZWD and horizontal gradients estimated using random walks of 3.0 and 0.3 mm/sqrt(hour), respectively
Mapping functionGMF hydrostatic and wet mapping function [17], and gradient mapping function [18]
Antenna phase centerReceiver/satellite IGS14 antenna type offsets and variations
Solid earth tidesIERS2010 model [19]
Ocean tide loadingFES2004 model [20]
Table 2. IWV hourly increase between 6 and 16 UTC on 28 (second column) and 29 August (third column).
Station Name28 August 202129 August 2021
Gelemenovo0.620.34
Popovitsa0.560.14
Petrovo1.040.53
Staro selo0.630.56
Publisher’s Note: MDPI stays neutral with regard to jurisdictional claims in published maps and institutional affiliations.

