Article

Reflectance Anisotropy from MODIS for Albedo Retrieval from a Single Directional Reflectance

1
School of Geographic and Environmental Sciences, Tianjin Normal University, Tianjin 300387, China
2
State Key Laboratory of Remote Sensing Science, Beijing Normal University, Beijing 100875, China
3
Aerospace Information Research Institute, Chinese Academy of Sciences, Beijing 100101, China
4
State Key Laboratory of Hydrology-Water Resources and Hydraulic Engineering, Hohai University, Nanjing 211100, China
5
College of Geomatics, Xi’an University of Science and Technology, Xi’an 710054, China
*
Author to whom correspondence should be addressed.
Remote Sens. 2022, 14(15), 3627; https://doi.org/10.3390/rs14153627
Submission received: 3 July 2022 / Revised: 24 July 2022 / Accepted: 25 July 2022 / Published: 29 July 2022
(This article belongs to the Special Issue Remote Sensing for Surface Biophysical Parameter Retrieval)

Abstract

:
Surface reflectance anisotropy and insufficient multi-angular observations are the main challenges in albedo estimation from satellite observations. Numerous studies have been developed for albedo retrieval from a single directional reflectance by associating the anisotropy information extracted from coarse-resolution bidirectional-reflectance distribution function (BRDF) data. The contribution of land-cover type (LCT) and the Normalized Difference Vegetation Index (NDVI) in distinguishing reflectance anisotropy in these methods remains controversial. This study first proposed an approach to extracting a priori BRDF (F) from the MODIS BRDF/albedo product by considering the distribution characteristics of the model parameters. LCT- and NDVI-based F were also extracted from the corresponding subset. Then, the F-based albedo was derived from simulated or satellite directional reflectance and the anisotropic information of F. Finally, the directional reflectance and F-based albedo were compared with the MODIS albedo or ground measurement, in order to show the ability of F to compensate for the effect of reflectance anisotropy in the albedo retrieval process. The method was fully validated by the global and time-series MODIS BRDF data. The results showed that reflectance anisotropy has an aggregated distribution pattern, and F can represent the reflectance anisotropy of most pixels within a tile. The improvement of LCT and NDVI only occurs when the tile contains a large area of vegetated and barren ground. With the exception of the hotspot and large viewing-zenith-angle area in the forward hemisphere, the F-based shortwave albedo has high consistency with the MODIS albedo product. A comparison with the ground measurements and MODIS albedo showed that the F-based albedo from a single directional reflectance generally achieves an absolute accuracy requirement, with a root-mean-square error (RMSE) of 0.027 and 0.036.

1. Introduction

Land-surface albedo, which is a critical geophysical variable controlling Earth’s energy budget, must be determined with acceptable accuracy [1]. Satellite remote sensing provides a practical way to perform surface albedo mapping and monitoring [2]. Over the past two decades, the global surface albedo at various spatial and temporal resolutions has been derived from the data from various satellite sensors [2,3,4,5,6,7]. Satellite-derived surface albedos have been widely used as inputs to various climate models [8,9], and the absolute accuracy of the albedo required for model studies has been estimated at ±0.02–0.05 [3,10]. However, existing satellite products suffer from several problems, including the lack of a long-term, fine-spatial-resolution albedo. This is mainly due to a lack of information on surface reflectance anisotropy, the scanning limit of fine-resolution sensors, and contamination by atmospheric aerosols and clouds [2,11,12].
For most natural surfaces, the reflection of incoming solar radiation is anisotropic [13]. The effect of surface anisotropy on remotely sensed observations has been investigated by many researchers over the past two decades [2,14,15]. It is widely accepted that large uncertainties may be introduced to an albedo if the effect of reflectance anisotropy is not appropriately considered in the retrieval process [16]. Usually, the bidirectional-reflectance distribution function (BRDF) is used to describe surface reflectance anisotropy [13]. Various empirical and semi-empirical BRDF models have been developed to convert directional reflectance to albedo. Most BRDF models can accurately perform the BRDF/albedo retrieval inversion given a sufficient number of observations (i.e., >7) that are well distributed in the viewing angle [12]. However, problems will occur when angular samplings are sparse or are not well-distributed [17,18].
The capacity of sensors to acquire multi-angular measurements is most probably limited by sensor scanning configurations and the platform’s orbital characteristics [11]. Since coarse-resolution satellite sensors—such as the Moderate Resolution Imaging Spectroradiometer (MODIS) [2] and the Polarization and Directionality of the Earth’s Reflectances (POLDER) [19]—have wide swaths (approx. 2400 km for both sensors), large maximum satellite zenith angles, and short periods of orbital repeat cycle, they are able to observe a location from a variety of angles in a relatively short period of time [2]. However, most middle-spatial sensors (such as the Landsat Thematic Mapper (TM), Enhanced Thematic Mapper Plus (ETM+), Operational Land Imager (OLI) [20,21,22], and Advanced Spaceborne Thermal Emission and Reflection Radiometer (ASTER) [23]) and high-spatial sensors (such as the Satellite Pour l’Observation de la Terre (SPOT) [24] and GaoFen (GF) [25,26]) provide a narrow swath-width (e.g., Landsat: 185 km and GF-2: 45 km). As such, orbits from consecutive days do not overlap, making them unable to obtain multi-angular observations. This makes it difficult to derive BRDF directly from such middle- and high-resolution sensors.
Various BRDF/albedo products have been derived from existing coarse-resolution satellite data [2,19]. The coarse-resolution BRDF/albedo product has been used to normalize directional reflectance into a common viewing and illumination geometry [27,28,29], and to improve albedo retrieval from fine-resolution reflectance [20,21,22,30]. The influence of spatial resolution on the angular variation patterns of optical reflectance retrieved from various pixel-scale measurements has been typically analyzed [31,32]. There are two main inversion strategies for albedo retrieval from directional reflectance. One is based on directional reflectance at the Top of Atmosphere (TOA) by utilizing linear functions [21,33,34], and the other strategy is based on surface directional reflectance and BRDF knowledge estimated from existing BRDF products [20,22]. In the present study, we focus on the latter and mainly explore how to extract proper BRDF knowledge from a historical MODIS BRDF product for albedo retrieval from a single directional reflectance.
A priori information is widely used in albedo retrievals from poor angular sampling [35,36,37,38]. Early studies based on field measurements revealed that reflectance anisotropy was associated with different homogeneous LCTs [14,39]. Strugnell and Lucht pointed out that the BRDF shape may have a strong relationship with the LCT, and a back-up algorithm was developed for MODIS BRDF products when the observations could not meet the requirement of the full inversion [40]. Varying LCT-based or NDVI-based BRDF knowledge, which was extracted from MODIS BRDF products, has been applied to Landsat or Sentinel surface reflectance to generate albedo, and a comparison with field measurements showed that the retrieved fine-resolution albedo generally satisfied the precision requirement [20,22,41]. However, a different perspective was presented based on POLDER data, stating that the variation in directional signatures is more significant in intra-class than inter-class types [42]. MODIS BRDF and the Anisotropic Flat Index (AFX) theory suggest that reflectance anisotropy does not necessarily have a dependency on LCT and NDVI; therefore, global MODIS BRDF archetypal maps have been generated [43]. It is important to understand the cause of these potentially conflicting conclusions for a deeper understanding of reflectance anisotropy and its effect on albedo retrieval.
Recently, we noticed that the distribution pattern of the model parameters is clustered. A study based on AFX theory and simulated MODIS reflectance revealed that the intermediate archetypal BRDF can improve the accuracy of albedo retrieved from insufficient observations [44]. Combining the two results, we are curious as to whether a priori BRDF extracted from MODIS BRDF can represent the dominant reflectance anisotropy of the underlying surface to convert single directional reflectance to albedo. In the present study, we first explore the distribution pattern of reflectance anisotropy with four MODIS tiles based on the scatter diagram of normalized BRDF model parameters. A priori BRDF, which is expected to represent the reflectance anisotropy of the most pixels, is extracted from a high-quality MODIS BRDF product or from subsets separated by LCT or NDVI in a tile. Then, a priori BRDF is applied to a simulated single directional reflectance to retrieve albedo using the magnitude-inversion method. The accuracy of albedo is evaluated using the high-quality MODIS albedo product. The effect of illumination and observation geometry and the ability of LCT and NDVI to distinguish reflectance anisotropy for albedo retrieval are also discussed. Finally, a fine-spatial-resolution albedo is also generated using a priori BRDF and Landsat reflectance, and the accuracy of the Landsat albedo is validated using ground measurements.

2. Materials and Methods

2.1. Data Used and Study Area

2.1.1. MODIS Data

The MODIS BRDF/albedo product has a temporal and spatial resolution of daily and 500 m, respectively. It can satisfy the accuracy requirements of model studies [12,45,46], and has been widely used in various reflectance anisotropy studies [20,22,43]. To guarantee the precision of the result in prior BRDF extraction and directional reflectance simulation, only the snow-free high-quality MODIS BRDF/albedo product [12] was engaged in this study.
This paper focuses on the analysis of four MODIS tiles (h12v04, h30v12, h20v05, and h18v07), which have different surface structures, to exhibit the distribution characteristics of reflectance anisotropy. The International Geosphere-Biosphere Programme (IGBP) land-cover map in 2010 and the NDVI map on DOY 170 in the four tiles are shown in Figure 1a–h, respectively. On DOY 170, the path of the sun in the sky is farthest north in the Northern Hemisphere. The solar zenith angle at local solar noon is about 22°, 56°, 11°, and 8° around the center of the four tiles. The land cover data were obtained from MCD12Q1, and the NDVI was recalculated from the simulated nadir reflectance based on the high-quality MODIS BRDF product and RTLSR BRDF model at local solar noon. H12v04 is in the northeast of the United States, and h30v12 is in the southeast of South Australia. Both tiles contain various kinds of forests, shrublands, savannas, and grasslands. The large value of the NDVI in h12v04 suggests that it has denser vegetation than h30v12. H20v05 is in the eastern Mediterranean Sea. The northern region of the tile is mainly covered by forests, savannas, and grasslands, while the southern region is covered by barren land. H18v07 is in North Central Africa; similarly, the northern region is covered by barren land, while the southern region is mainly covered by grasslands. Due to the low-quality of the reflectance in the south region, the main land cover of the tile is barren land at this time. Beyond that, the time-series data of MODIS BRDF from 2008 to 2010 over the four tiles, and the global MODIS BRDF data on DOY 170, 2010, were used in the analysis of the temporal and spatial performance of a priori BRDF for albedo retrieval from directional reflectance. The MODIS BRDF data in h12v04, h10v05, h08v05, h09v04, and h11v04 during 2000–2010, which are temporally and spatially consistent with seven surface-radiation budget network (SURFRAD) stations, were also used to extract a priori BRDF for the retrieval of albedo from Landsat reflectance.
To further verify the potential of using a priori BRDF for albedo retrieval from a single directional reflectance, multi-angular observations from MODIS (MOD09GA) during a 16-day composite period (2010.162-177) in h20v04 were also used in this study. Only the first layer of the product was of high quality during the 16-day period and was extracted. Figure 2 shows an example of the MODIS angular samplings during the period. The solar zenith angle ranges from 26° to 32°, the largest viewing zenith angle is around 60°, and the relative azimuth angle is around 45° (240°) in the backward (forward) hemisphere.

2.1.2. Landsat Satellite Data and Field-Measured Albedo

The United States Geological Survey (USGS) provides calibrated and atmospherically corrected Landsat surface reflectance data via Earth Explorer (https://earthexplorer.usgs.gov/, accessed on 1 September 2020.). In this study, all available TM and ETM+ land-surface reflectance data from 2001 to 2010 corresponding to the seven ground sites were downloaded (Table 1). The Landsat 5 TM and 7 ETM+ nominal radiometric calibration accuracy is reported as 5% [47,48]. To ensure the precision of the retrieved albedo, any data gaps in ETM+ caused by the failure of the scan-line corrector (SLC) were omitted in the albedo retrieval process.
SURFRAD has been providing accurate field observation of broadband albedo since 1995 [22]. The dominant LCTs for these sites are grassland and agricultural. The measurements of these sites are spatially representative of the conditions of the surrounding area, with an uncertainty range from ±2% to ±5% [49]. The ground-measured albedo at the seven SURFRAD sites is used to evaluate the accuracy of the retrieved albedo. The 10 m high pyranometer has a field of view of 81°, and covers a radius of ~63 m on the ground, which is equal to a 3 by 3 Landsat 30 m pixels [21,22]. The ground-measured broadband albedo within 30 min before and after the satellite overpass time was averaged to represent the ground albedo [21,22]. The shortwave (0.25–2.5 um) broadband reflectance, which can be taken as the albedo under Lambertian assumption, is calculated from the spectral reflectance via narrow- to broadband conversion coefficients [50]. It is also directly compared with ground measurement to show the improvement in F for albedo retrieval.

2.2. A Priori BRDF (F) Extracted from MODIS BRDF

The RTLSR BRDF model has the following form [2,5,51]:
R θ s , θ v , Φ , λ = f i s o λ + f v o l λ K v o l θ s , θ v , Φ , λ + f g e o λ K g e o θ s , θ v , Φ , λ
where R is the surface bidirectional reflectance in the wavelength λ; fiso, fvol, and fgeo are the spectrally dependent BRDF model parameters; Kvol and Kgeo are kernel functions of the volumetric [52,53] and geometric optical [15,51] scattering, respectively; θs and θv denote the illuminating and viewing zenith angles; and Φ is the relative azimuth angle.
The characteristics of reflectance anisotropy are complex, and the BRDF model parameters provide a feasible method for the quantitative evaluation of reflectance anisotropy. The difference in spectral reflectance amplitude causes the BRDF shapes to be mixed together and makes them difficult to distinguish one from the other. To remove the effect of spectral reflectance amplitude and make the surface reflectance anisotropy comparable, the BRDF parameters are simply normalized by a scale factor α/fiso [43], where α is set to 0.5 to limit the range of normalized BRDF shapes to 0–1.0 when drawing them. The surface reflectance can be rewritten as:
R θ s , θ v , Φ , λ = ( F i s o λ + F v o l λ K v o l θ s , θ v , Φ , λ + F g e o λ K g e o θ s , θ v , Φ , λ / α f i s o
where F′ is the normalized BRDF model parameters with F′iso = α, F′vol = αfvol/fiso, and F′geo = αfgeo/fiso.
Figure 3 shows the density distribution of the original (f) and normalized (F′) volumetric and geometric optical scattering parameters of a tile. The scatter diagram of the two model parameters is divided into Smax × Lmax grids with a size of k. Smax and Lmax refer to the sampling number of columns and rows. Values of 0.005, 260, and 60 were set for k, Smax and Lmax. The distribution pattern of both the original and normalized model parameters is aggregative. Figure 3a also shows the distribution of the normalized model parameters (F’) in four grids (A–D). The pixels that are located in the same grid in the original mode are separated into different grids in the normalized mode. The shapes of the original BRDFs in a grid are almost parallel with each other due to the differences in fiso, while the shapes of the normalized BRDFs in a grid are nearly the same since the F′iso is a constant. BRDF normalization provides a more feasible way to define the reflectance anisotropy in a grid. Furthermore, in the albedo retrieval process (Section 2.3), a multiplicative factor is applied to generate a proper BRDF from a priori BRDF (Equations (6)–(9)), and the BRDF normalization process does not affect the albedo retrieval. Therefore, a priori BRDF is extracted from the normalized BRDFs rather than the original BRDFs.
The integration processes of BRDF can weaken the effect of reflectance anisotropy on the albedo, and an intermediate archetypal BRDF can be used to improve albedo retrieval from insufficient observations [44]. The model parameters within one MODIS tile shows an aggregated distribution (Figure 3). We are curious as to whether a priori BRDF extracted from MODIS BRDF can represent the dominant reflectance anisotropy of the underlying surface for converting single directional reflectance to albedo. A priori BRDF (F) is extracted from the MODIS BRDF product within a MODIS tile based on the probability-weighted method. For column i and row j in the grid, the number of pixels n(i, j) in the grid can be counted. The central value F’(i, j) is taken as the reflectance anisotropy of the grid (Equation (3)). When the grid contains fewer than 10 pixels (gray color in Figure 3), it will not be considered in the process of extracting F. This strategy can filter out some noise pixels that have exception parameters. The probability of each unit can be calculated using the ratio of n(i, j) to the total number of pixels (n) that participated in the operation. The F value can be calculated through the sum of the products of F’(i, j) and n(i, j)/n (Equation (4)). The F value, which is expected to represent the dominant reflectance anisotropy, is taken as the a priori BRDF in this study.
F i , j = k i ,   k j k 2
F = i = 1 s m a x j = 1 L m a x F i , j × n i , j / n
To learn the ability of LCT and NDVI in order to distinguish reflectance anisotropy, the high-quality MODIS BRDF product is further segmented by LCT or NDVI, and F is extracted from each specific BRDF subset. F, FL and FN are used to represent the a priori BRDF extracted from all MODIS BRDF products, and the LCT- and NDVI-based high-quality ones.

2.3. Albedo Inversion Method and Evaluation

2.3.1. F-Based Albedo from a Single Directional Reflectance

The method used to adjust F to fit single directional reflectance follows the MODIS magnitude-inversion algorithm [12]. For a given single directional observation (ρ), the simulated directional reflectance ρs, which has the same viewing geometry as ρ, can be simulated according to RTLSR BRDF model and F (Equation (1)). Suppose that the ratio of directional reflectance and reflectance anisotropy and the albedo should be similar [18,40]; the strength of the BRDF effect could be determined by the ratio (a) between ρs and ρ at given viewing and solar geometries (Equation (5)).
a = ρ / ρ s
Using the RTLSR model, the Black Sky Albedo (BSA) at any solar zenith angle and White Sky Albedo (WSA) of the pixel under consideration can be calculated (Equation (6)). The BSA and WSA are, then, combined as a function of the fraction of diffuse skylight (S) to calculate the blue-sky albedo (α) (Equation (7)) [54]. The albedo refers to blue-sky albedo in the subsequent section. In this study, an aerosol optical depth (AOD) of 0.2 is used to calculate S when learning the anisotropic reflectance characteristics based on the simulated MODIS directional reflectance. When calculating the Landsat albedo at the SURFRAD stations, S is measured using different pyranometers:
B S A θ = a i = 1 3 F i h k θ ;   W S A = a i = 1 3 F i H k
α θ = S θ , τ 550 nm B S A θ + 1 S θ , τ 550 nm WSA
where hk and Hk are the directional-hemispherical and bi-hemispherical integrals of the BRDF model kernels, do not depend on the observations, and can be precomputed and stored in a look-up table; and τ550nm is the AOD at 550 nm.

2.3.2. The Feasibility Analysis Based on Simulated MODIS Directional Reflectance

The feasibility of using F for albedo retrieval from a single directional reflectance is explored. The RTLSR model in the forward mode (Equation (1)) is used to simulate shortwave single directional reflectance (ρ) for each pixel based on the high-quality MODIS BRDF product. The simulated MODIS blue-sky albedo (AF) can be calculated from ρ and F using Equations (6)–(8). The relative difference (Rd) and absolute difference (Ad) between AF and the high-quality MODIS albedo product (Am) can be calculated for each pixel using Equations (8) and (9). The percentage of pixels that have an absolute difference range from −0.02 to 0.02 (P0.02) is used to quantitatively evaluate the performance of F (Equation (10)). The larger the P0.02, the more representative it is of F for albedo retrieval from a single directional reflectance.
Rd = A F A m A m × 100 %
A d = A F A m
P 0.02 = n ( A d < 0.02 ) n
To study the impact of viewing geometry, first, the image of MODIS shortwave-band reflectance in nadir—at a forward and backward angle of 30° with a solar zenith angle at local solar noon, and F-based albedos on DOY 170, 2010 in h12v04—are used to provide a visual evaluation. Second—based on the four MODIS tiles on DOY 170, 2010—nadir reflectance with varying solar zenith angles, and the reflectance in any direction in the entire viewing hemisphere with a solar zenith angle at local solar noon are simulated; then, the albedo is retrieved from a directional reflectance by considering F, FL, and FN, respectively. Finally, the performance of F is fully validated by the spatial and temporal MODIS BRDF product. From a spatial perspective, the global albedo on DOY 170, 2010 is retrieved from F and nadir reflectance. From a temporal perspective, the time-series albedo over the four tiles from 2008 to 2010 is retrieved from F, and any directional reflectance in the principal plane (PP) with a solar zenith angle of the local solar noon. The retrieved albedo is compared with the MODIS albedo product, and the P0.02 in each direction is used to evaluate the effect of viewing geometry and the improvements in LCT and NDVI for albedo retrieval.

2.3.3. Albedo Retrieval from F and Real Satellite Observation

We explore the feasibility of using the MODIS-based F to retrieve albedo from MODIS and Landsat observation. The Fs, which are spatially and temporally consistent with the observation, are extracted from the high-quality MODIS BRDF product based on the probability-weighted method (Section 2.2). To avoid the uncertainty caused by the BRDF model and the atmosphere [45,55,56], the observation with a solar zenith angle greater than 65°, or with a ratio of diffuse skylight measured at ground sites greater than 0.3 are omitted. The F-based Landsat and MODIS albedos are retrieved from 1423 Landsat scenes and MODIS observations during 162–177, 2010 in h20v04.

3. Results

3.1. A Priori BRDF (F) from MODIS

The MODIS BRDF product over H12V04, h20v05, h18v07, and h30v12 on DOY 170, 2010 is used as an example to exhibit the distribution characteristics of reflectance anisotropy. In the case of the four tiles, the number of high-quality pixels is more than one million in the spectral and shortwave broadband, and the number of data can serve as sufficient material for the analysis of the distribution of reflectance anisotropy. Figure 4 shows the scatter diagrams of F′vol and F′geo in the four MODIS tiles. To keep a consistent style, these figures use an X-axis range from 0 to 1 and a Y-axis range from 0 to 0.3.
Although each band contains varying reflectance anisotropy, the distribution pattern of reflectance anisotropy presents an aggregated distribution. The range and gathering center of reflectance anisotropy differ between tiles, which may be caused by ground-surface structures. When the surface is dominated by dense vegetation (e.g., h12v04) and the surface structure is supposed to be complex, the distribution of reflectance anisotropy is more diffuse. When the surface is dominated by desert and the surface structure is simple (e.g., h18v07), the distribution range of reflectance anisotropy is reduced remarkably. The most dense area in the scatter diagrams is close to zero, especially for the geometric optical scattering parameter. When the surface contains a large proportion of both vegetated and barren land (e.g., tile h20v05), the scatter diagrams may have multiple gathering centers. When the surface is covered by vegetation with various densities (e.g., h30v12), the percentage of pixels that have a medium density increases significantly.
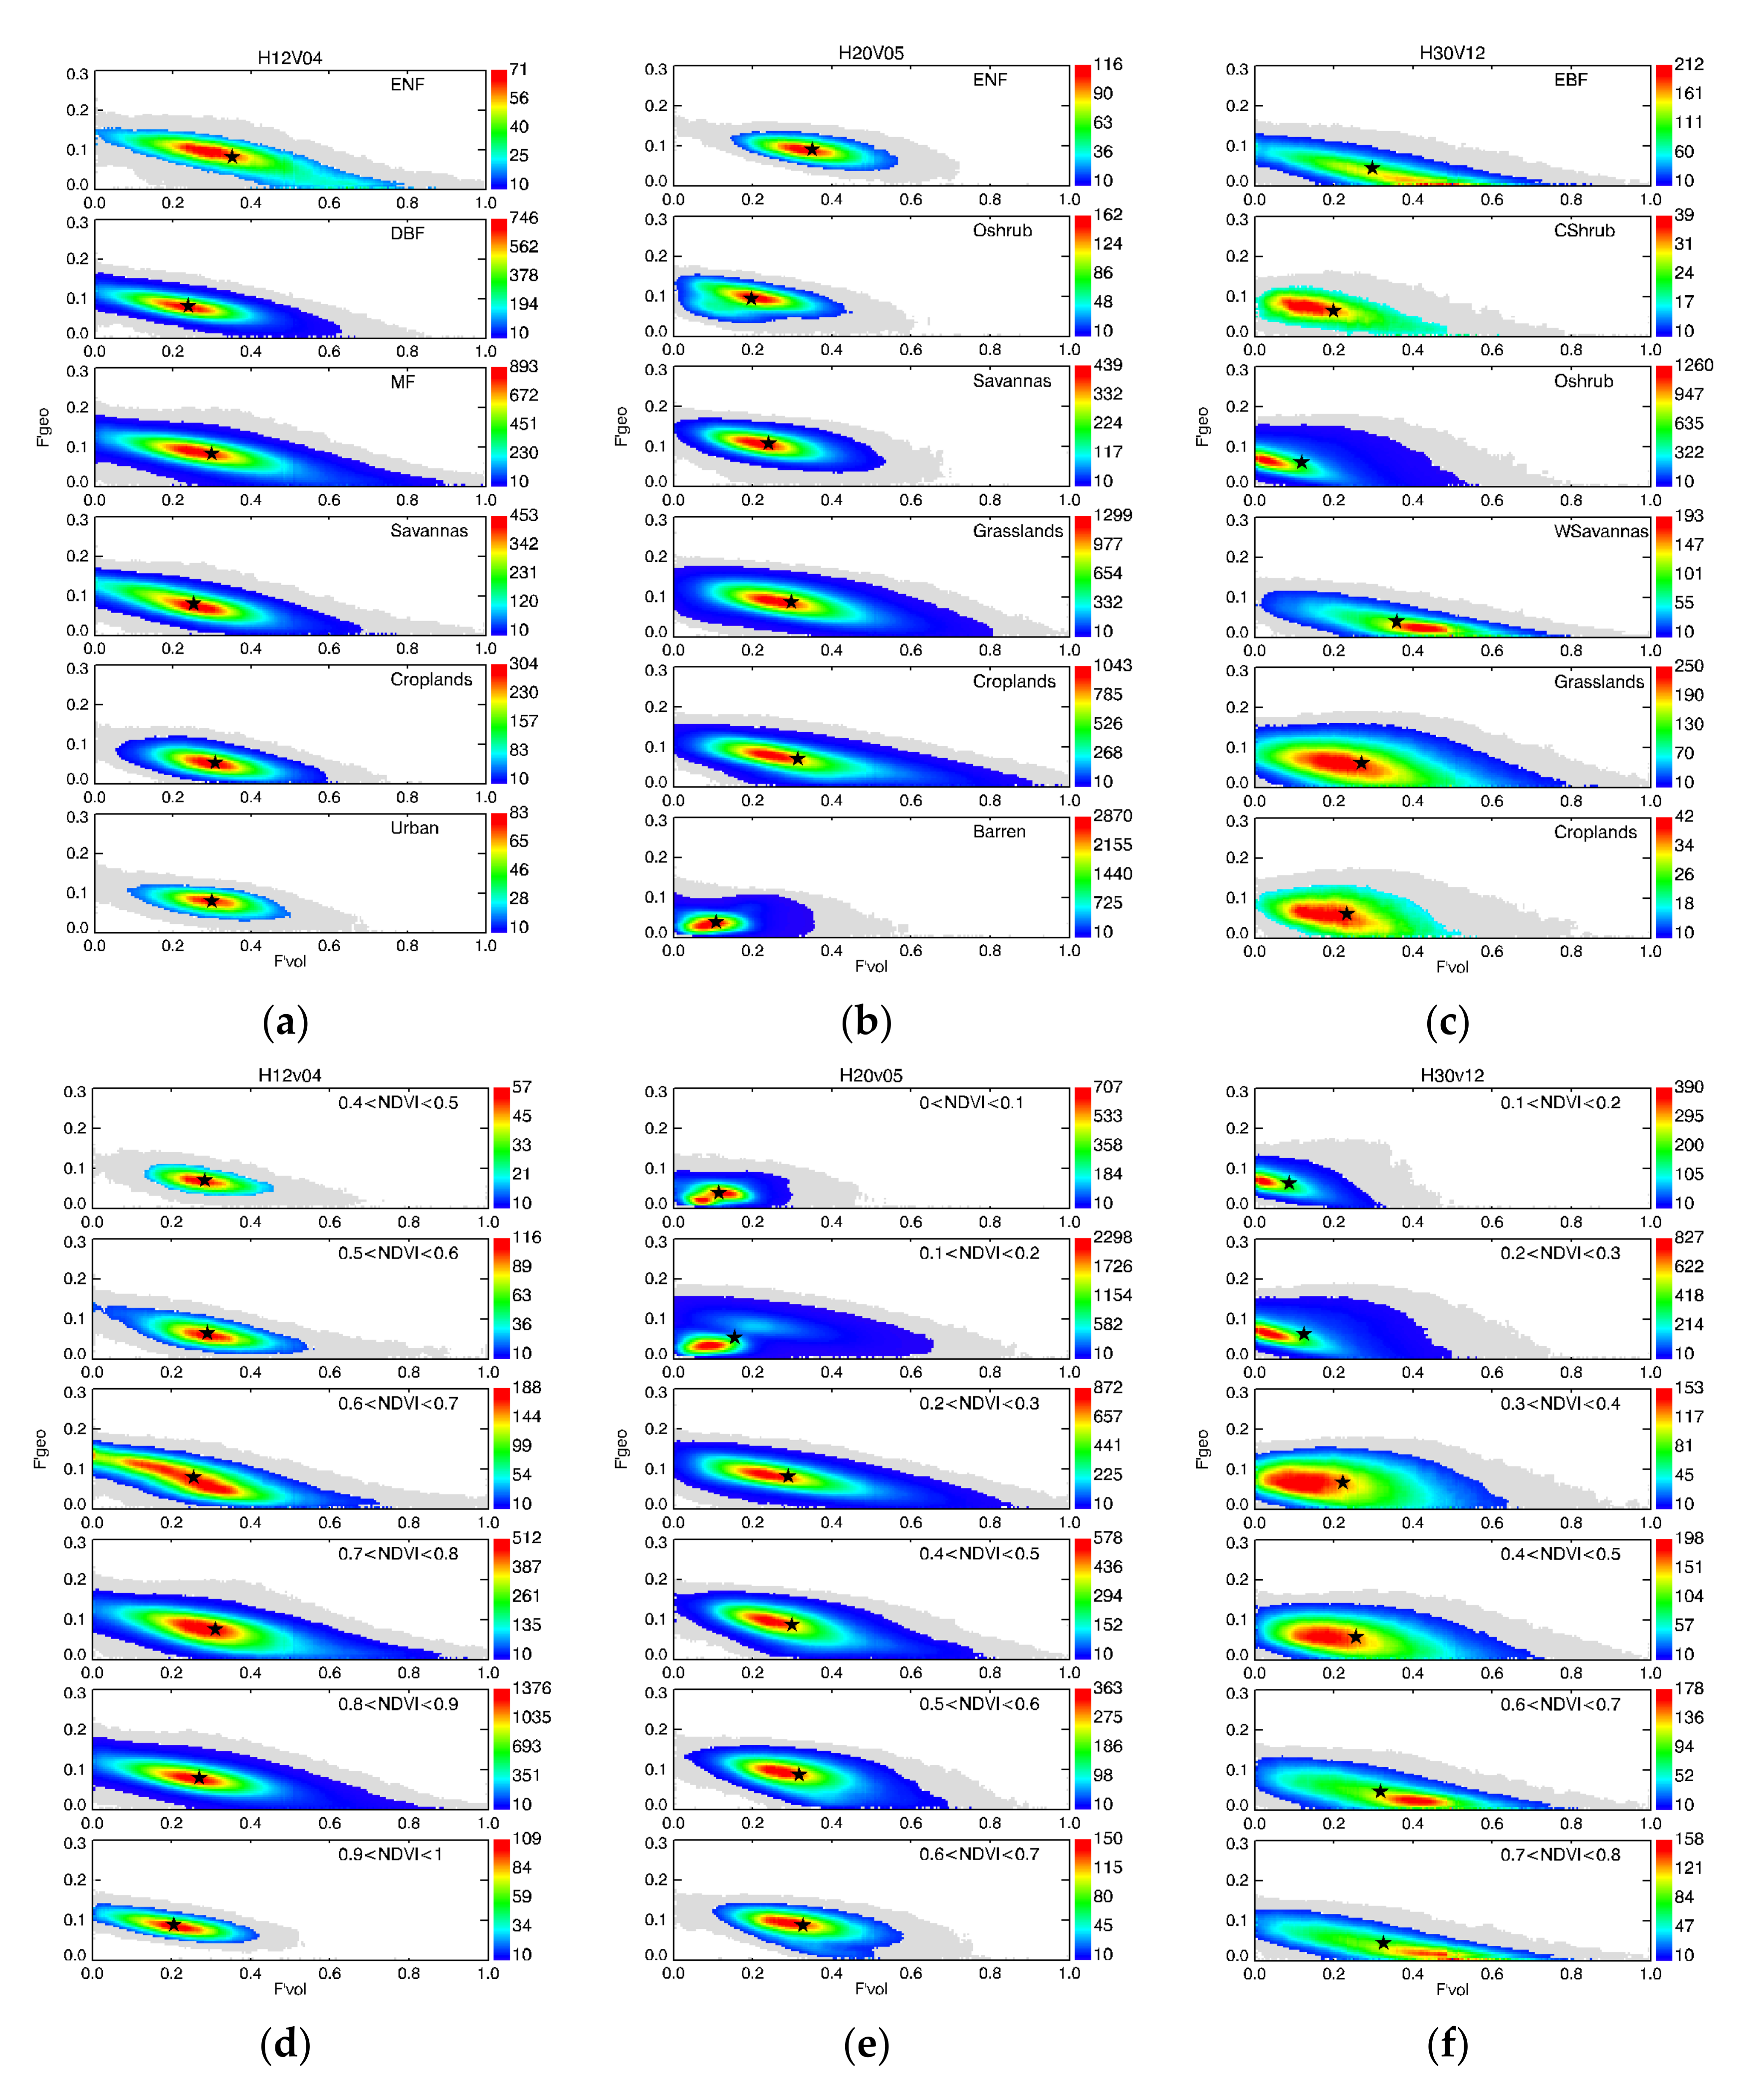
Figure 5 shows the scatter diagrams of F′vol and F′geo for different subsets. Because of the small number of LCTs and relatively stable range of NDVI in h18v07, the tile is not considered in this part. The pentacle represents the location of the FL or FN. Although the number of available pixels for the subset is reduced, these scatter diagrams of reflectance anisotropy in different subsets show an aggregated distribution pattern. In h12v04, the distribution pattern of reflectance anisotropy may be influenced by the number of pixels; however, the gathering center remains consistent for different subsets. In h20v05, the vegetated LCTs have a similar gathering center and the ENF has a relatively strong F′vol. The non-vegetated barren area, which usually has NDVI values less than 0.2, is more Lambertian, as the value of F′vol and F′geo is small. When the NDVI ranges from 0.2 to 0.7, the gathering center remains consistent. In h30v12, the gathering center of EBF and woody savannas is located in a F′vol-dominated area, while open shrubland has a weak F′vol. The other three LCTs have a similar distribution pattern. With an increase in NDVI, the gathering center gradually moves towards the F′vol dominated area. The ability of LCT and the NDVI to distinguish reflectance anisotropy is limited, and a visible difference only appears when there is a surface change from non-vegetated (Barren or NDVI < 0.2) to vegetated (NDVI > 0.2).
Figure 6 shows the values of F, FL, and FN that were extracted from the high-quality MODIS BRDF dataset or from the subset divided into LCT or NDVI in the three tiles. The values of FL and FN are extracted when the number of pixels in the subset is greater than 20,000. The variation regularity of FL and FN is not obvious. The woody, shrub, and herbaceous plants, which have obvious differences in structure, could even have a similar FL values. In the three tiles, the forest (ENF, MF, EBF) usually has a larger Fvol, while the barren and open shrubland usually have the smallest Fvol. The Fvol values in the near-infrared and shortwave broadband have a decreasing trend with the increase in NDVI, while the other bands have an increasing trend in h12v04. In h20v05 and h30v12, Fvol has an increasing trend when the NDVI is less than 0.3, but the momentum appears to wane when the NDVI is greater than 0.3. This may be because the surface structure of the two tiles is not as complex as in h12v04. The Fgeo is always small in the three tiles, and its change with NDVI and LCT is not significant.

3.2. Albedo Retrieval from F and Nadir Reflectance

3.2.1. Impact of the BRDF on Albedo Retrieval from Nadir

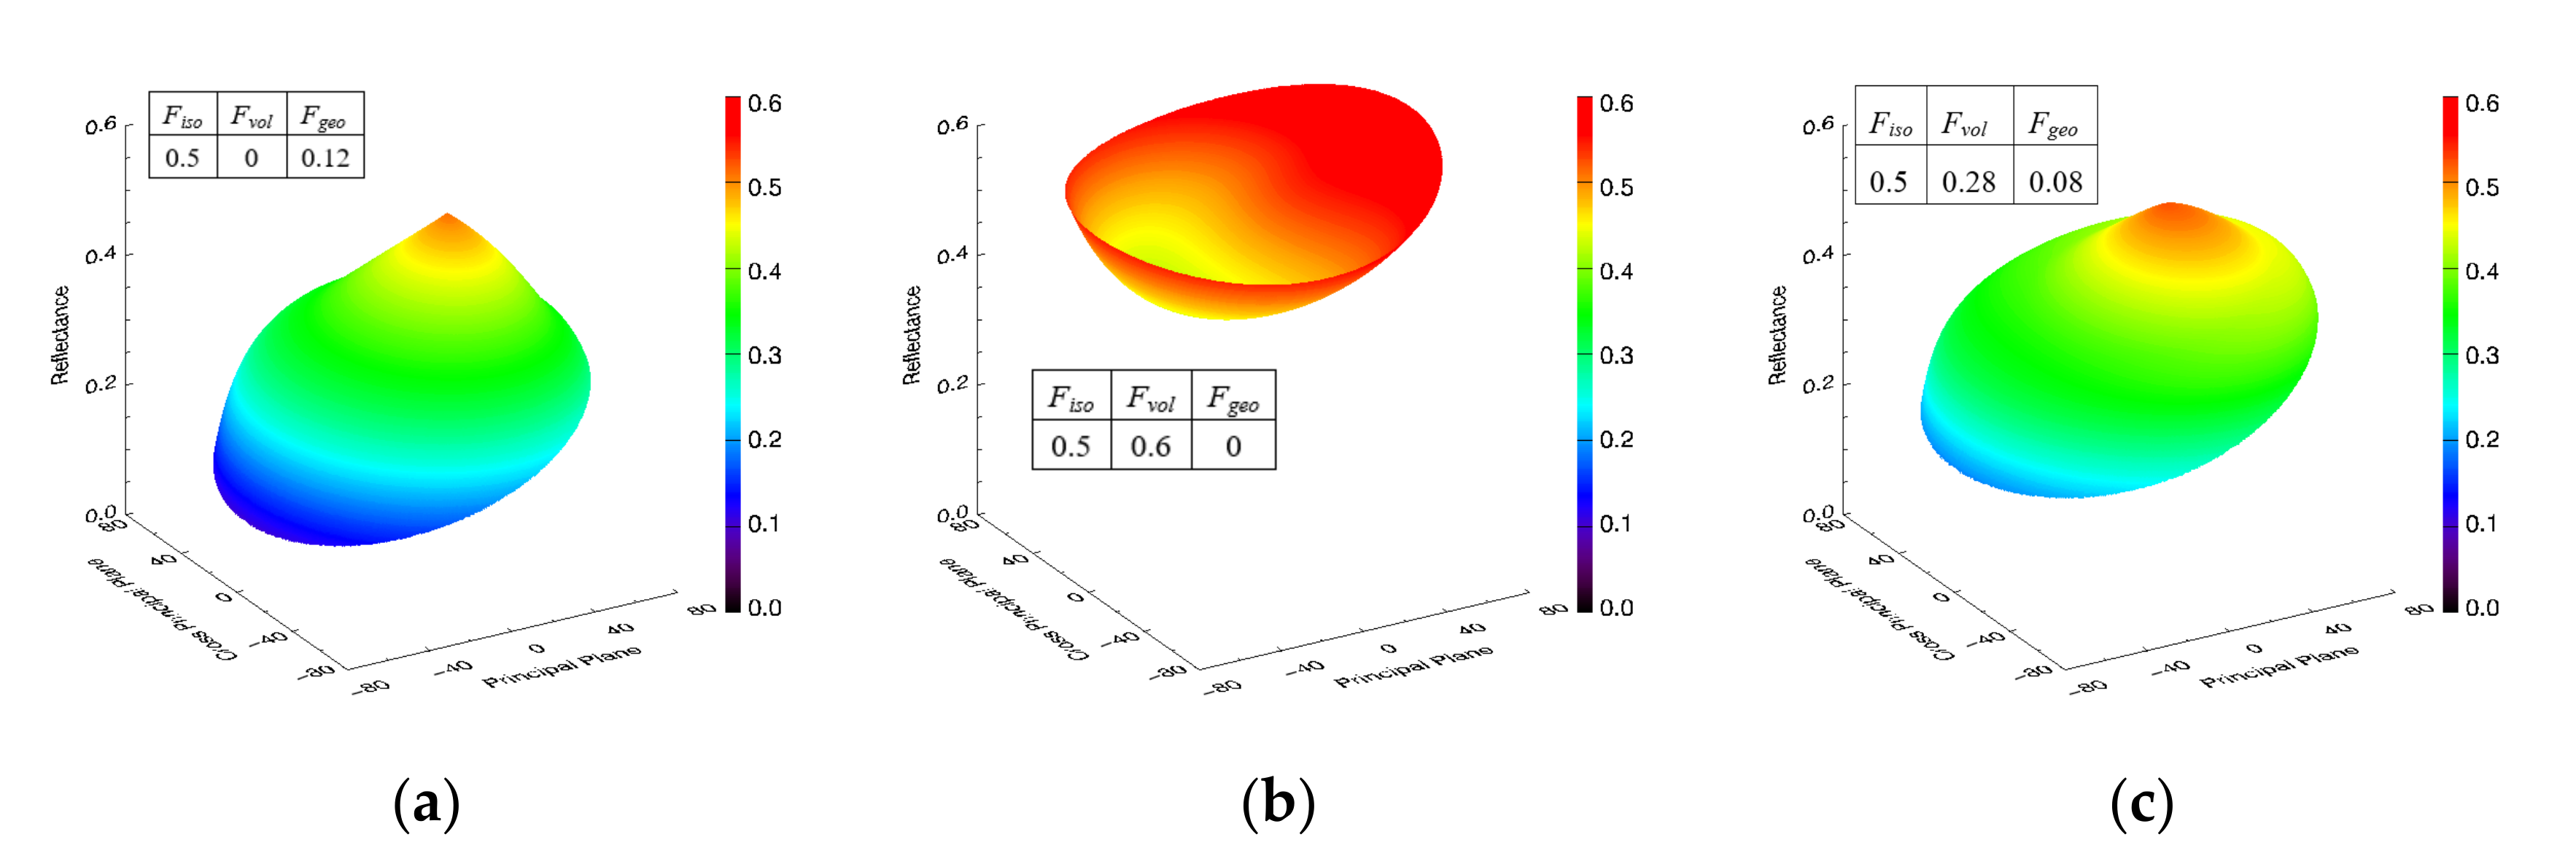
The effect of reflectance anisotropy on albedo retrieval is first investigated based on F and nadir reflectance. Figure 7c shows the BRDF shape of F extracted from h12v04 on DOY 170, 2010. As a comparison, geometric-optical-scattering-dominated (Fg) and volumetric-scattering-dominated (Fv) BRDF shapes are also shown together. The Fg and Fv values are determined according to the distribution of the model parameter (Figure 4a). Fg has a relatively large value of Fgeo, while Fv has a relatively large value of Fvol, and the other parameter is set to 0. The 3D BRDF shapes are plotted using a visualization tool provided by Dong [57]. The Fg shows a dome shape, while the Fv shows a bowl shape. The shape of F is in-between.
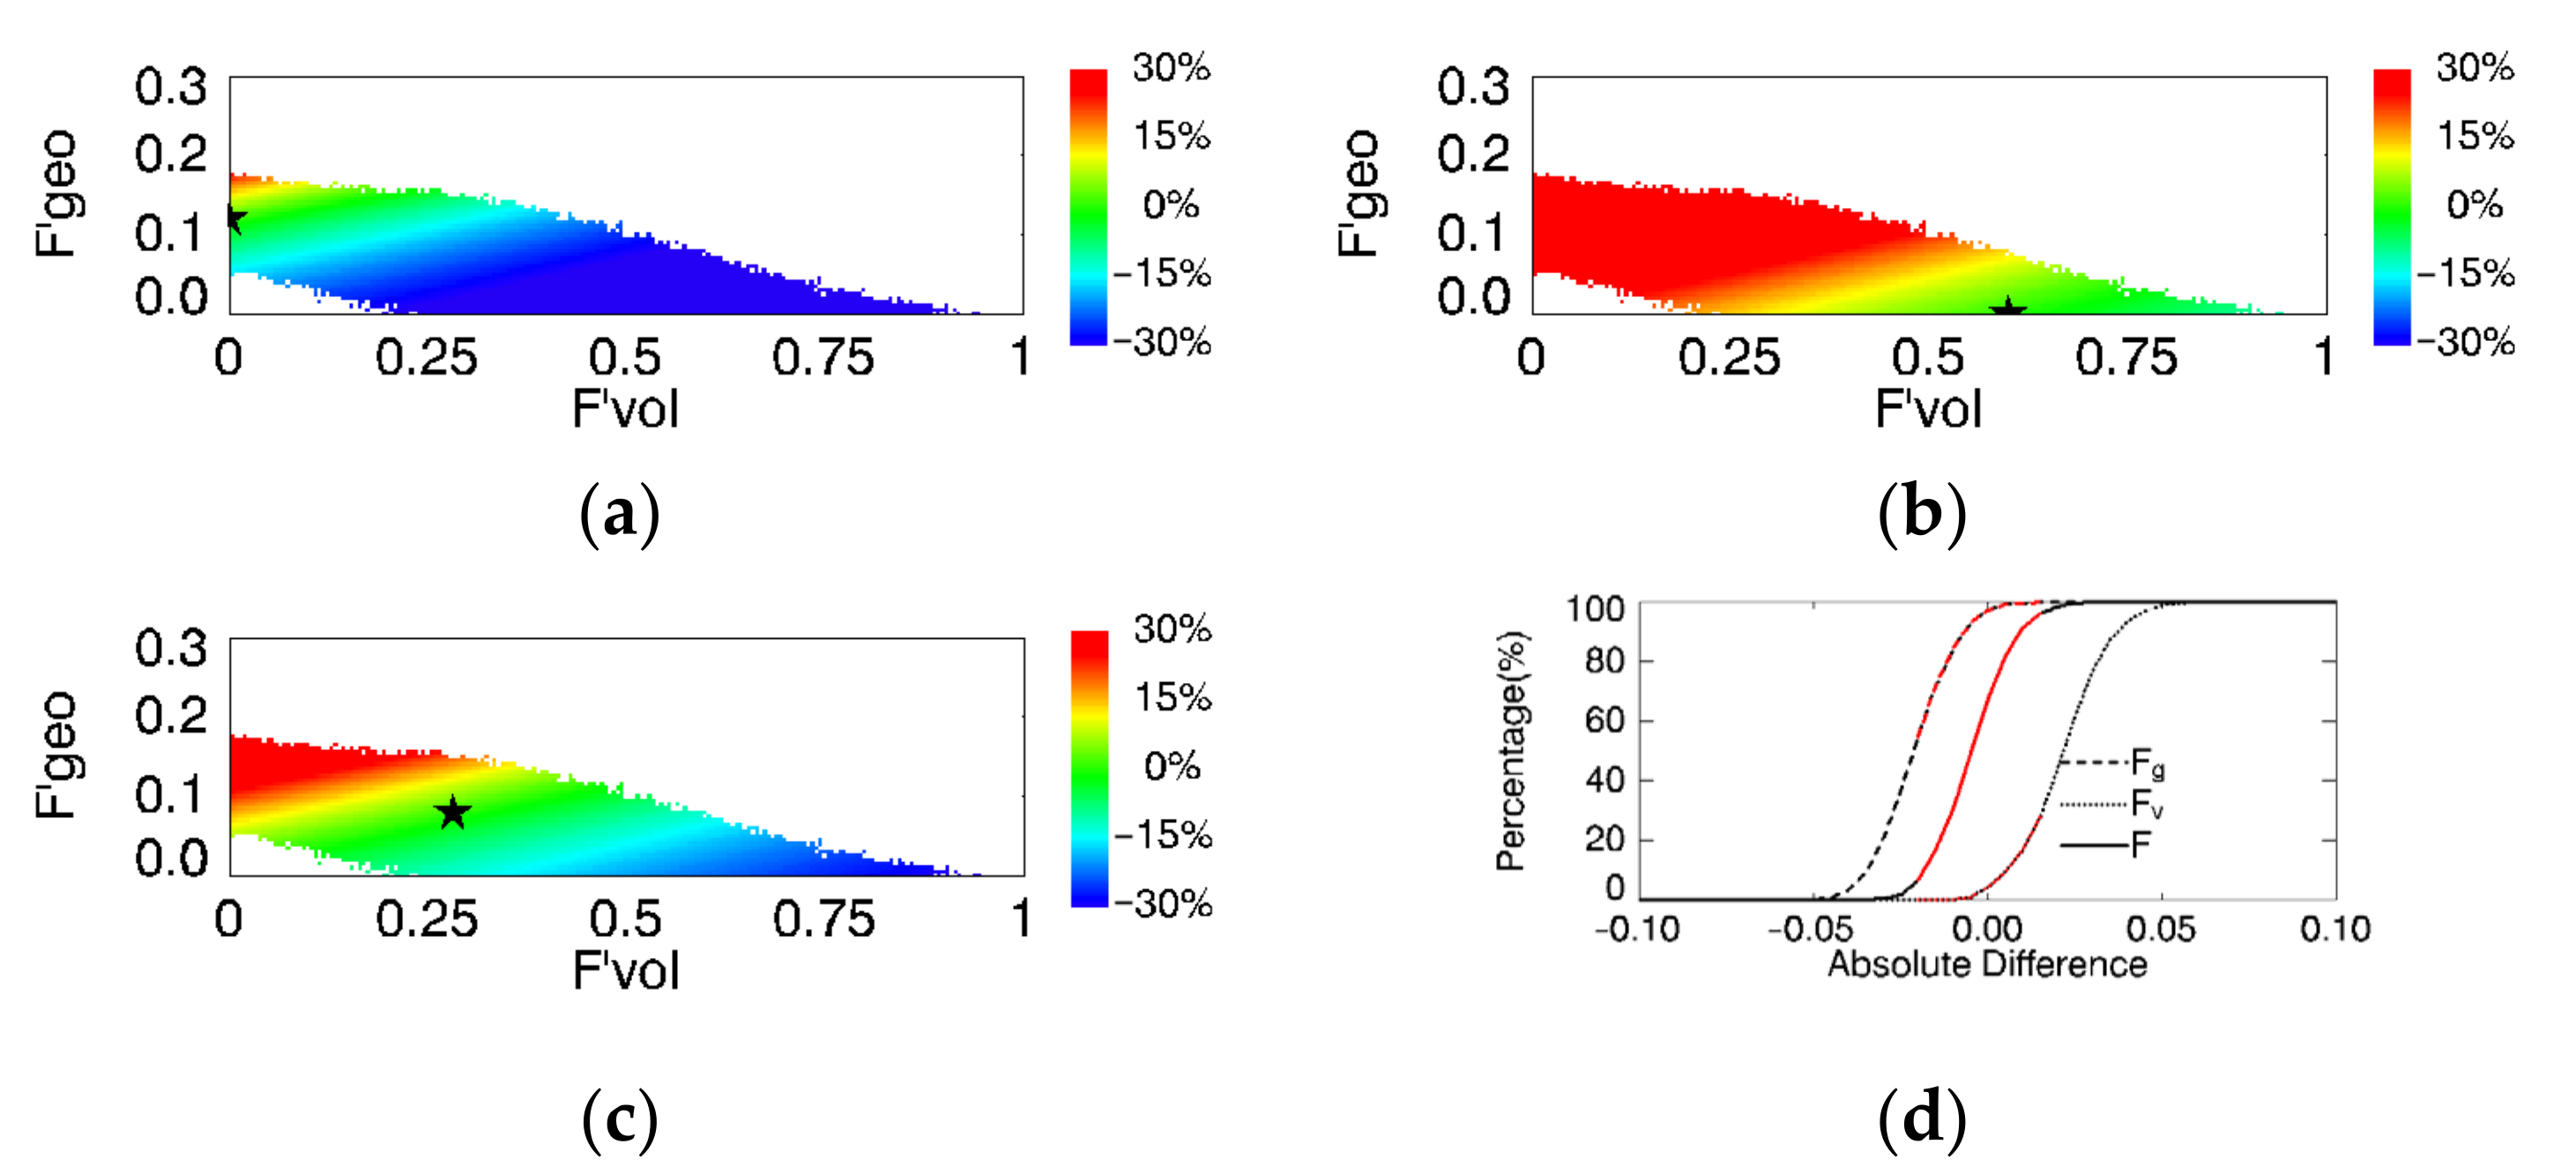
Nadir reflectance is simulated according to the RTLSR BRDF model and high-quality MODIS BRDF product in h12v04 on DOY 170, 2010. The F-based albedo (AF) is retrieved from the nadir reflectance and F. The Ad and Rd between the Ap and MODIS albedo product (Am) are calculated for each pixel. The distribution of Rd in the scatter diagrams and the accumulative distribution of Ad for the shortwave broadband are shown in Figure 8. The results show that when the pixels have similar reflectance anisotropy to F, the relative difference is close to 0. The relative difference gradually increases with increasing distance between F and the real reflectance anisotropy. In conjunction with the distribution of reflectance anisotropy (Figure 4), F is located near the high-density region of reflectance anisotropy, and the retrieved albedo of most pixels has high precision and reliability. Fg and Fv, which are away from the high-density region, may introduce large errors in the albedo for most of the pixels.
The percentage of pixels that have an Rd between −10% and 10% is 13.4%, 7.5% and 61.3% for Fg, Fv, and F, respectively. For the albedo based on F, the percentage of pixels that have an Ad within −0.02 and 0.02 (P0.02) is 94% (Figure 8d), while the P0.02 is 63% and 28% for Fg and Fv, respectively. The P0.02 is 81%, 78%, and 69% for h30v12, h18v07, and h20v05, respectively, in shortwave broadband. The small value of P0.02 may be caused by the small solar zenith angle (h18v07) and multiple gathering centers of reflectance anisotropy (h20v05). The details of the result will be discussed in the subsequent sections.

3.2.2. Impact of the Solar Zenith Angle on Albedo Retrieval from Nadir

In order to explore the effect of the solar zenith angle on albedo retrieval, F, FL, and FN in the four tiles are fitted to the corresponding simulated MODIS nadir reflectance, with different solar zenith angles, to generate the albedo. As a comparison, the nadir reflectance is also compared with the MODIS albedo. Figure 9 shows the change in the P0.02 with the solar zenith angle. The nadir reflectance greatly differs from the albedo, and the retrieved albedo is improved by employing the constraint of F, FL, or FN, especially when the solar zenith angle is small or large. This phenomenon can be explained by the weak fitting ability of the RTLSR BRDF model around the hotspot area [58] and large solar zenith angle condition [45]. When the solar zenith angle is around 40°, both the nadir reflectance and the F-, FL-, or FN-based albedos are close to the MODIS albedo, with a P0.02 greater than 90%. In h20v05, the FL or FN can increase the value of P0.02 by 10–20 percent for the small or large solar zenith angle conditions. This could be caused by the large proportion of both vegetated and barren land in h20v05. In h30v12, when the solar zenith angle is less than 40°, the performance of F, FL, and FN are similar. The difference appears when the solar zenith is greater than 45°, with an increase of 10 percent in P0.02 for FL and FN. In the other two tiles, the FL and FN have similar performance when compared with F.

3.2.3. Spatial Validation with Nadir Reflectance

The spatial variations in reflectance anisotropy are analyzed based on global MODIS shortwave BRDF data on DOY 170, 2010. Figure 10a,b show the model parameters of F. For this period, the northern hemisphere and north-central part of South America usually has a relatively strong Fvol, and the maximum value appears in h20v03, h20v04, and h21v03; this is covered by dense crop, mixed forests, and grass. The relatively strong Fgeo appears around the Americas and the South Africa, and the maximum value appears on the west coast of the Americas, which are mainly covered by shrublands and savannas. For the desert regions in north Africa, the values of both Fvol and Fgeo are small.
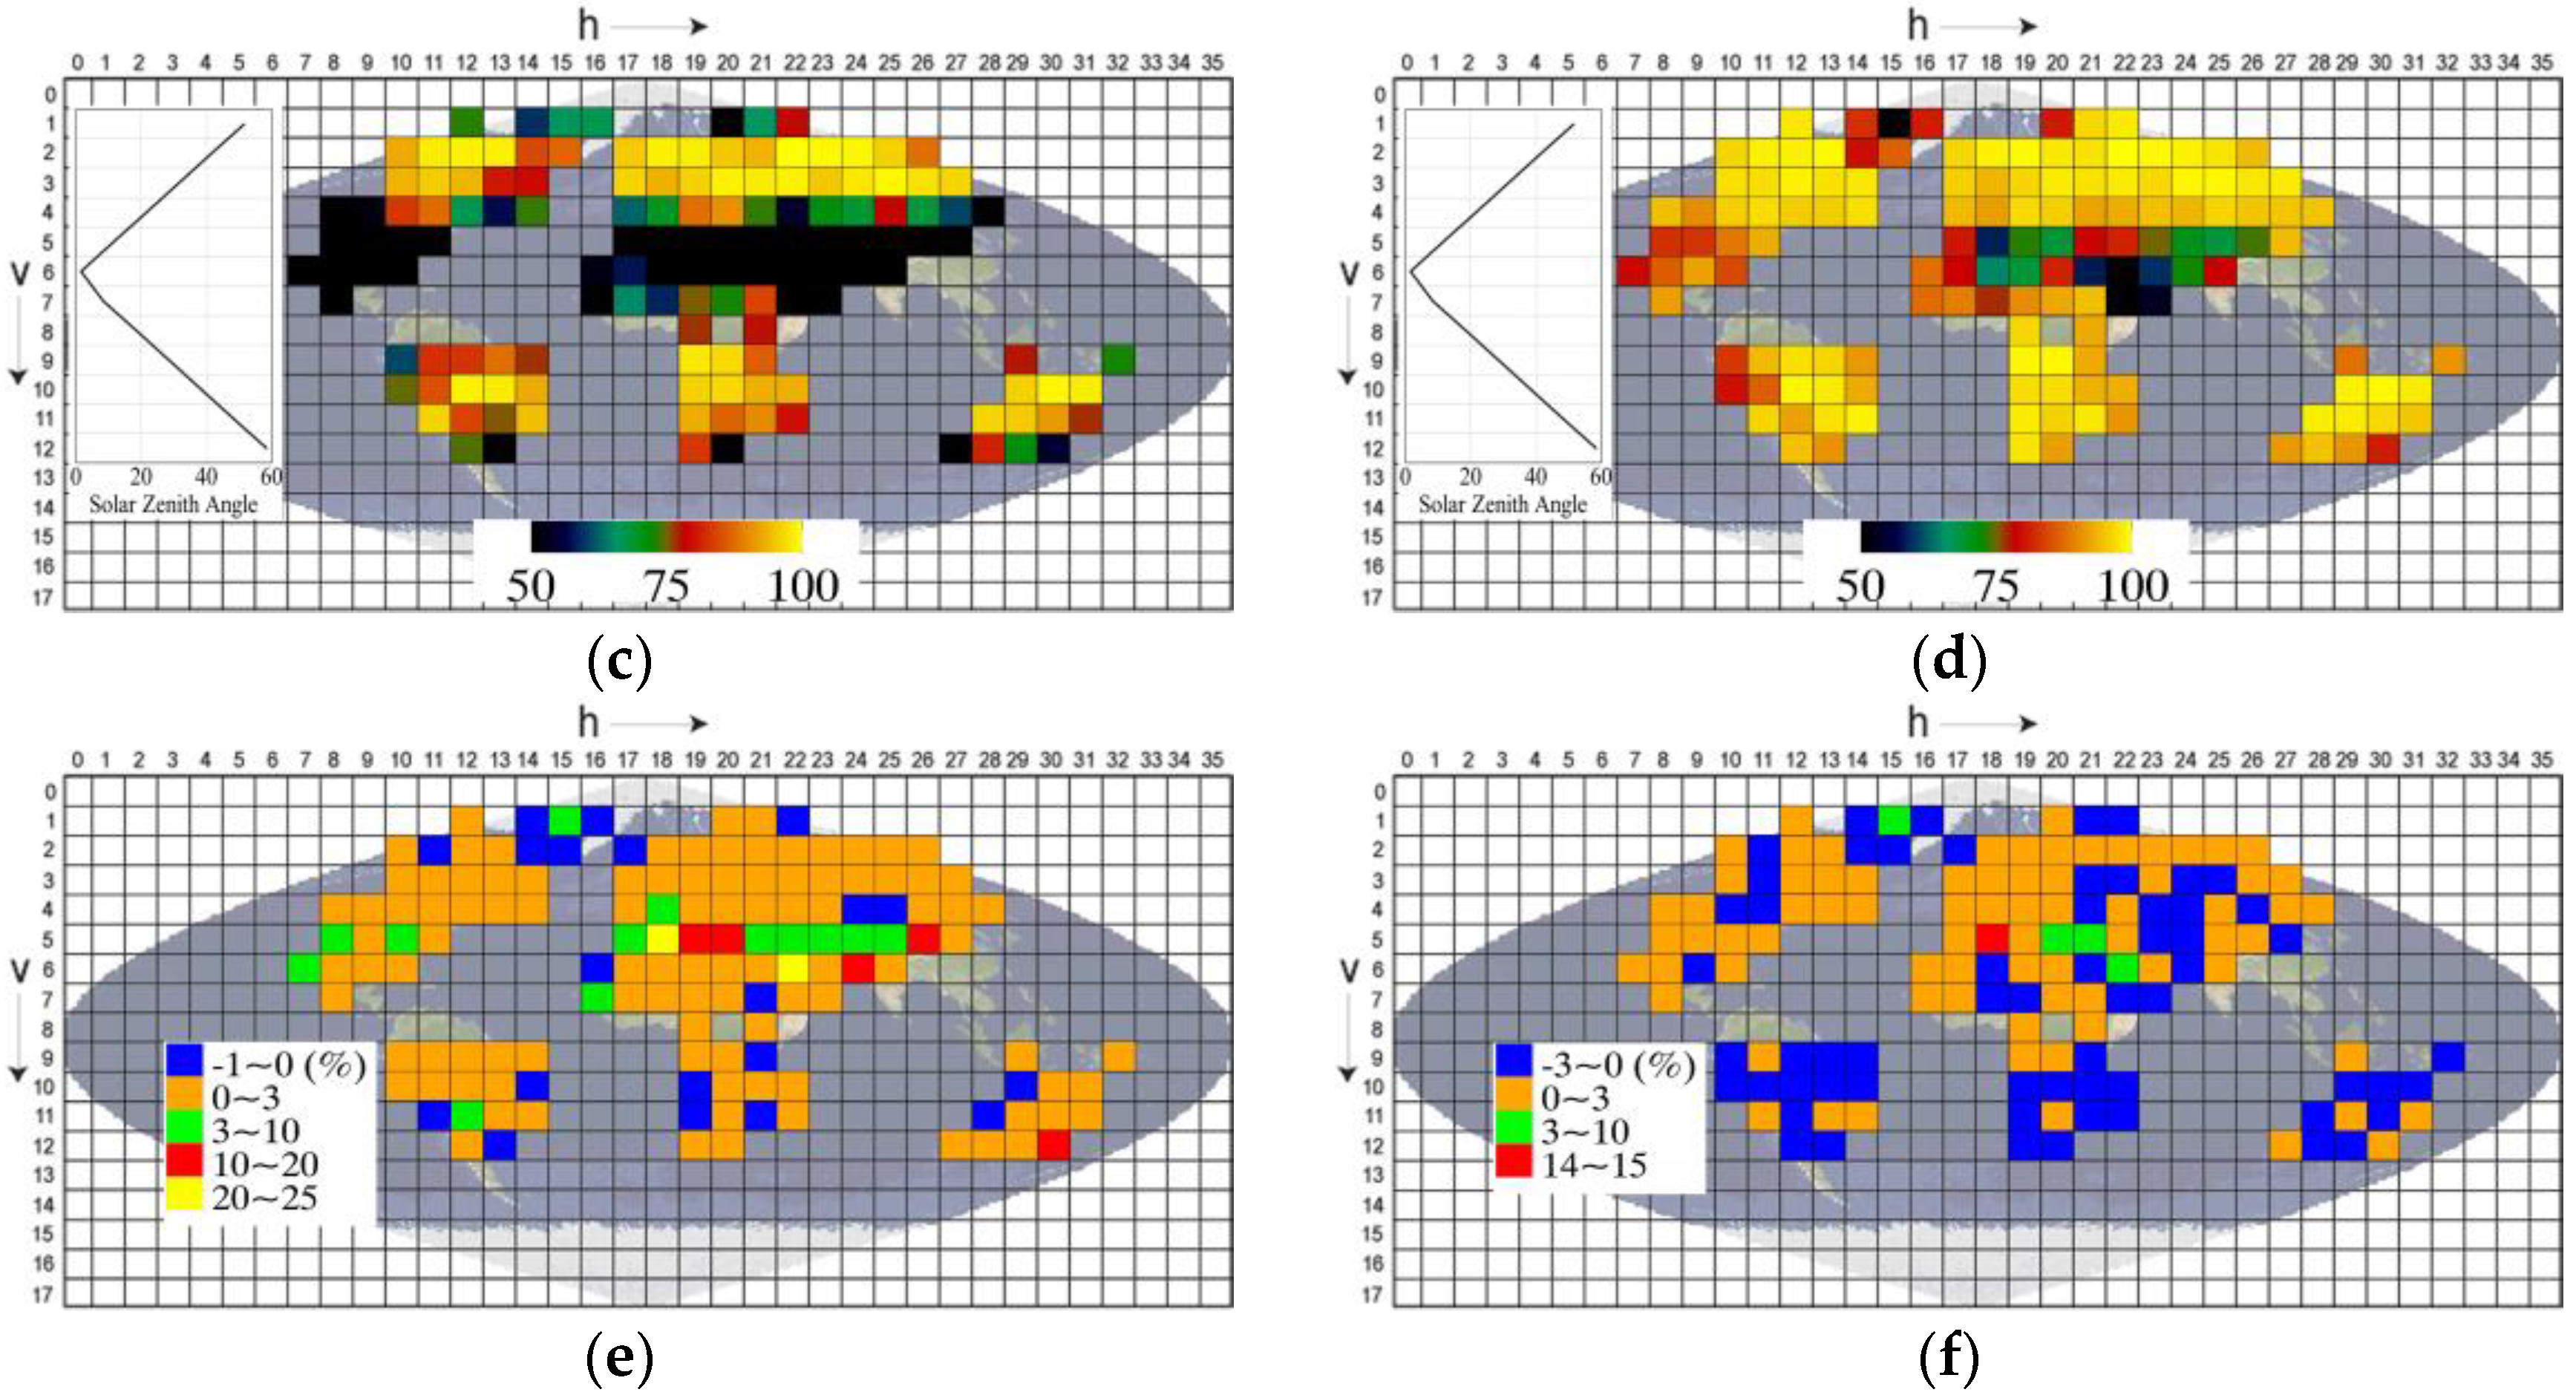
Like the results shown in Figure 9, Figure 10c,d show that the nadir reflectance in the tiles that have a small solar zenith angle greatly differs from the MODIS albedo caused by the hotspot effect. When the solar zenith angle is around 40°, the nadir reflectance has the best consistency with the MODIS albedo. For most of the tiles, F has an appositive impact on albedo retrieval and increases the value of P0.02; notably, the number of tiles that have a P0.02 greater than 80% changes from 56 to 116 compared with the Lambertian assumption result. It also shows that the improvement is more significant for the tiles that have a small or large solar zenith. A small P0.02 appears in h21v06, h22v06, h22v07, h23v07, and h18v05, which may be caused by a large percentage of both vegetation and barren surface, and a small solar zenith angle. The small P0.02 in h15v01 may be caused by snow and ice since the NDVI of most pixels is negative and the mean fiso is greater than 0.5.
Figure 10e shows that for most of the tiles, the difference between FL- and F-based P0.02 is between −1% and 3%, and only six tiles have a difference greater than 10%; this indicates that the improvement of FL is limited in most cases. The improvement appears to be more significant when the solar zenith angle is small, and the largest improvement (20%–25%) appears in h18v05 and h22v06, which contain a large proportion of both vegetation and barren land. There is no obvious distinction between the effect of FN and that of FL for most of the tiles, which have a difference range from −3% to 3% (Figure 10f).

3.2.4. Comparison of Ground Albedo with F-Based Landsat Albedo

The F extracted from a MODIS tile and the Landsat reflectance are combined to generate 30 m-resolution albedo. The F is spatially and temporally consistent with the Land-sat reflectance around the SURFRAD sites during 2001–2010. A comparison with the ground measurements shows that F performs well in albedo retrieval from the TM and ETM+ data (Figure 11). The validation of Landsat shortwave albedo against ground measurements showed a bias of 0.04 and an RMSE of 0.027 for the seven SURFRAD sites. Specifically, Landsat albedo shows a slight underestimation at BON, GWN, and PSU, with a bias of −0.016, −0.017, and −0.023. At the Desert Rock (DRA) and TBL sites, surface albedo has been consistently overestimated compared with ground measurements, with bias ranging from 0.03 to 0.034. The results confirm the findings reported at the SURFRAD sites in previous studies [20,21,22,30].
The Landsat shortwave surface reflectance (Lambertian albedo) is also compared with ground measurements. In general, the surface Lambertian assumption may introduce great uncertainty into the albedo, with RMSEs ranging from 0.022 to 0.042. By applying the concurrent F to the reflectance, the RMSE will be obviously decreased, except for that of the TBL station. For all the data, the RMSE can be reduced from 0.032 to 0.027. This suggests that the F extracted from the MODIS BRDF product can improve the accuracy of the 30 m-resolution albedo retrieved from a single directional reflectance. When the solar zenith angle is small or large, unlike the result based on simulated reflectance (Figure 9), the difference between the reflectance and measured albedo does show an obvious increasing trend. Meanwhile, at the Desert Rock (DRA) and TBL sites, both the Landsat reflectance and albedo have consistently underestimated surface albedo. Both problems may be caused by the uncertainty in the reflectance, since the proposed method to estimate the albedo from single directional reflectance is sensitive to noise, and the uncertainty in the reflectance will be completely transferred to the albedo.

3.3. F-Based Albedo from Any Single Directional Reflectance

3.3.1. The Potential of Using F for Albedo Retrieval from Any Single Directional Reflectance

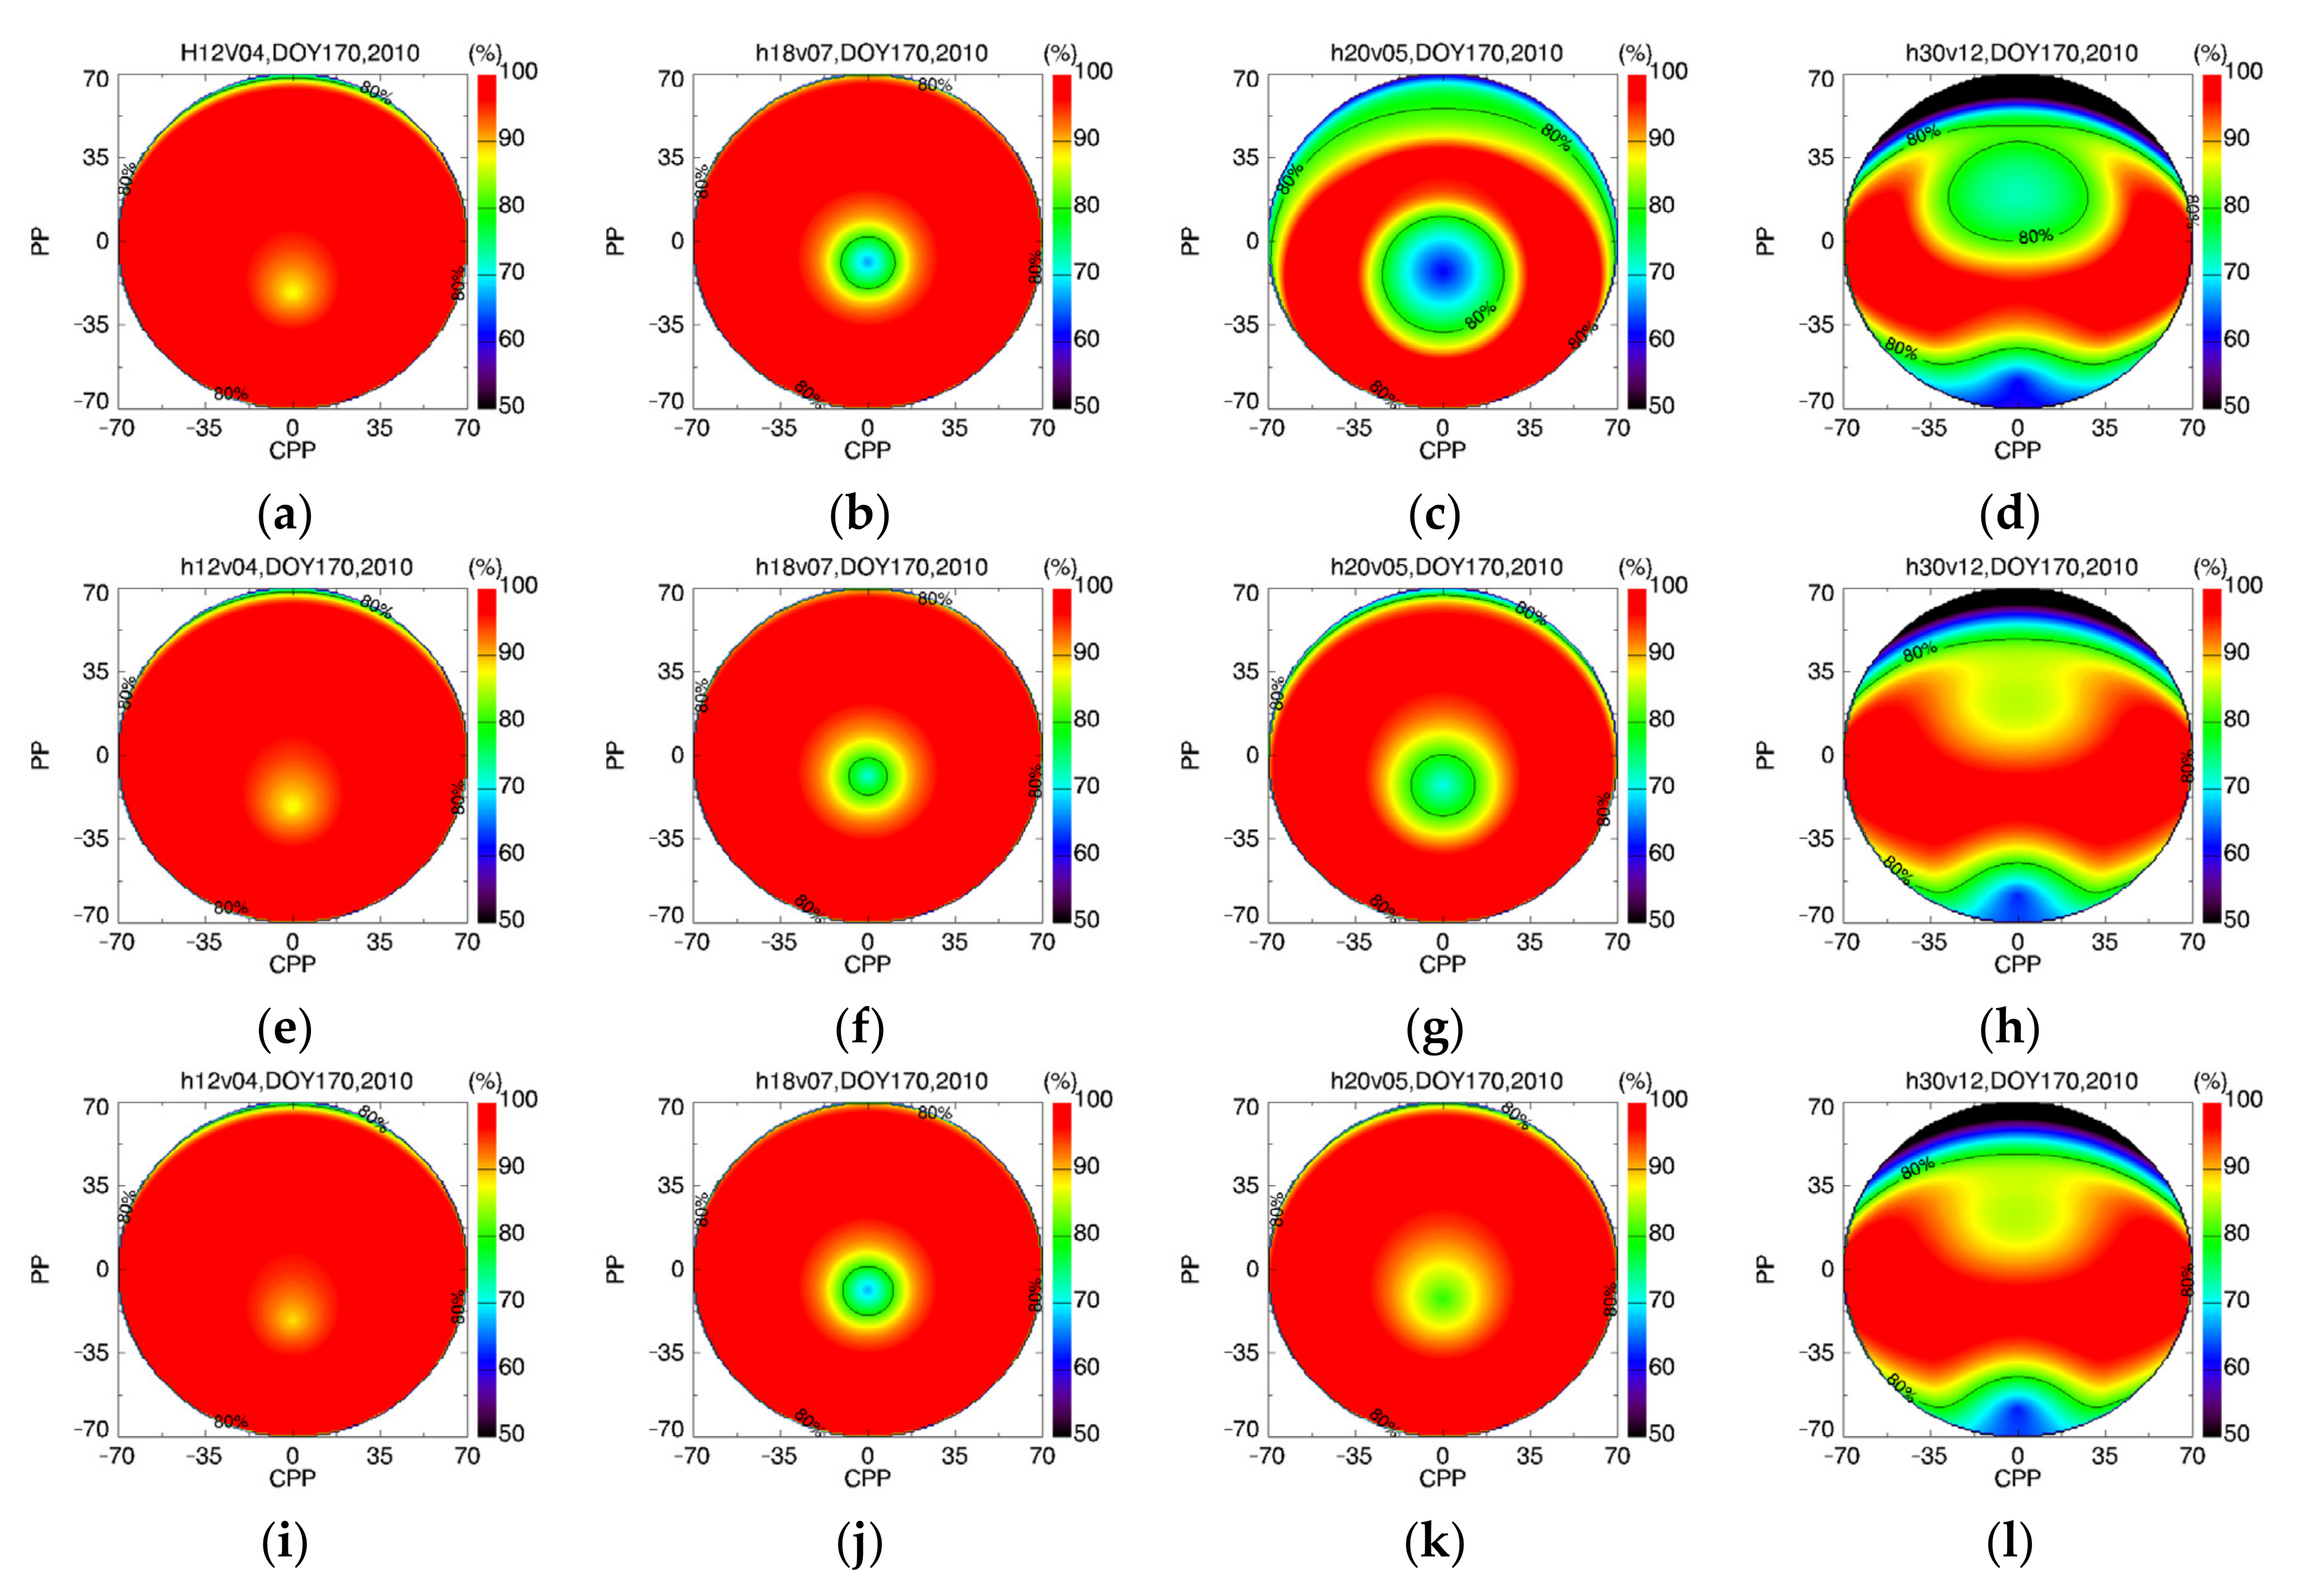
The reflectance in any direction for each pixel is simulated based on the MODIS BRDF product and RTLSR BRDF model. The F, FL, and FN and the directional reflectance are then used to retrieve the albedo. The P0.02 in each direction is shown in Figure 12 for the four tiles. For h12v04 and h18v07, except for the directional reflectance around the hotspot area and the large viewing-zenith-angle area in the forward directions, P0.02 is always greater than 90%. For h20v05 and h30v12, the directions that have low P0.02 increase obviously; these are mainly concentrated around the hotspot and the large viewing-zenith-angle area and in the forward hemisphere. This could be explained by the multi-gathering center of reflectance anisotropy in h20v05, and the relatively large solar zenith angle in h30v12. The performance of FL and FN for albedo retrieval from directional reflectance is similar. There is little or no improvement in h12v04 and h18v07 since F has good performance. For h20v05, visible improvement appears around the hotspot and large viewing-zenith area. For h30v12, the improvement mainly occurs in the forward hemisphere, but the accuracy is relatively low.

3.3.2. Temporal Validation with Reflectance in PP

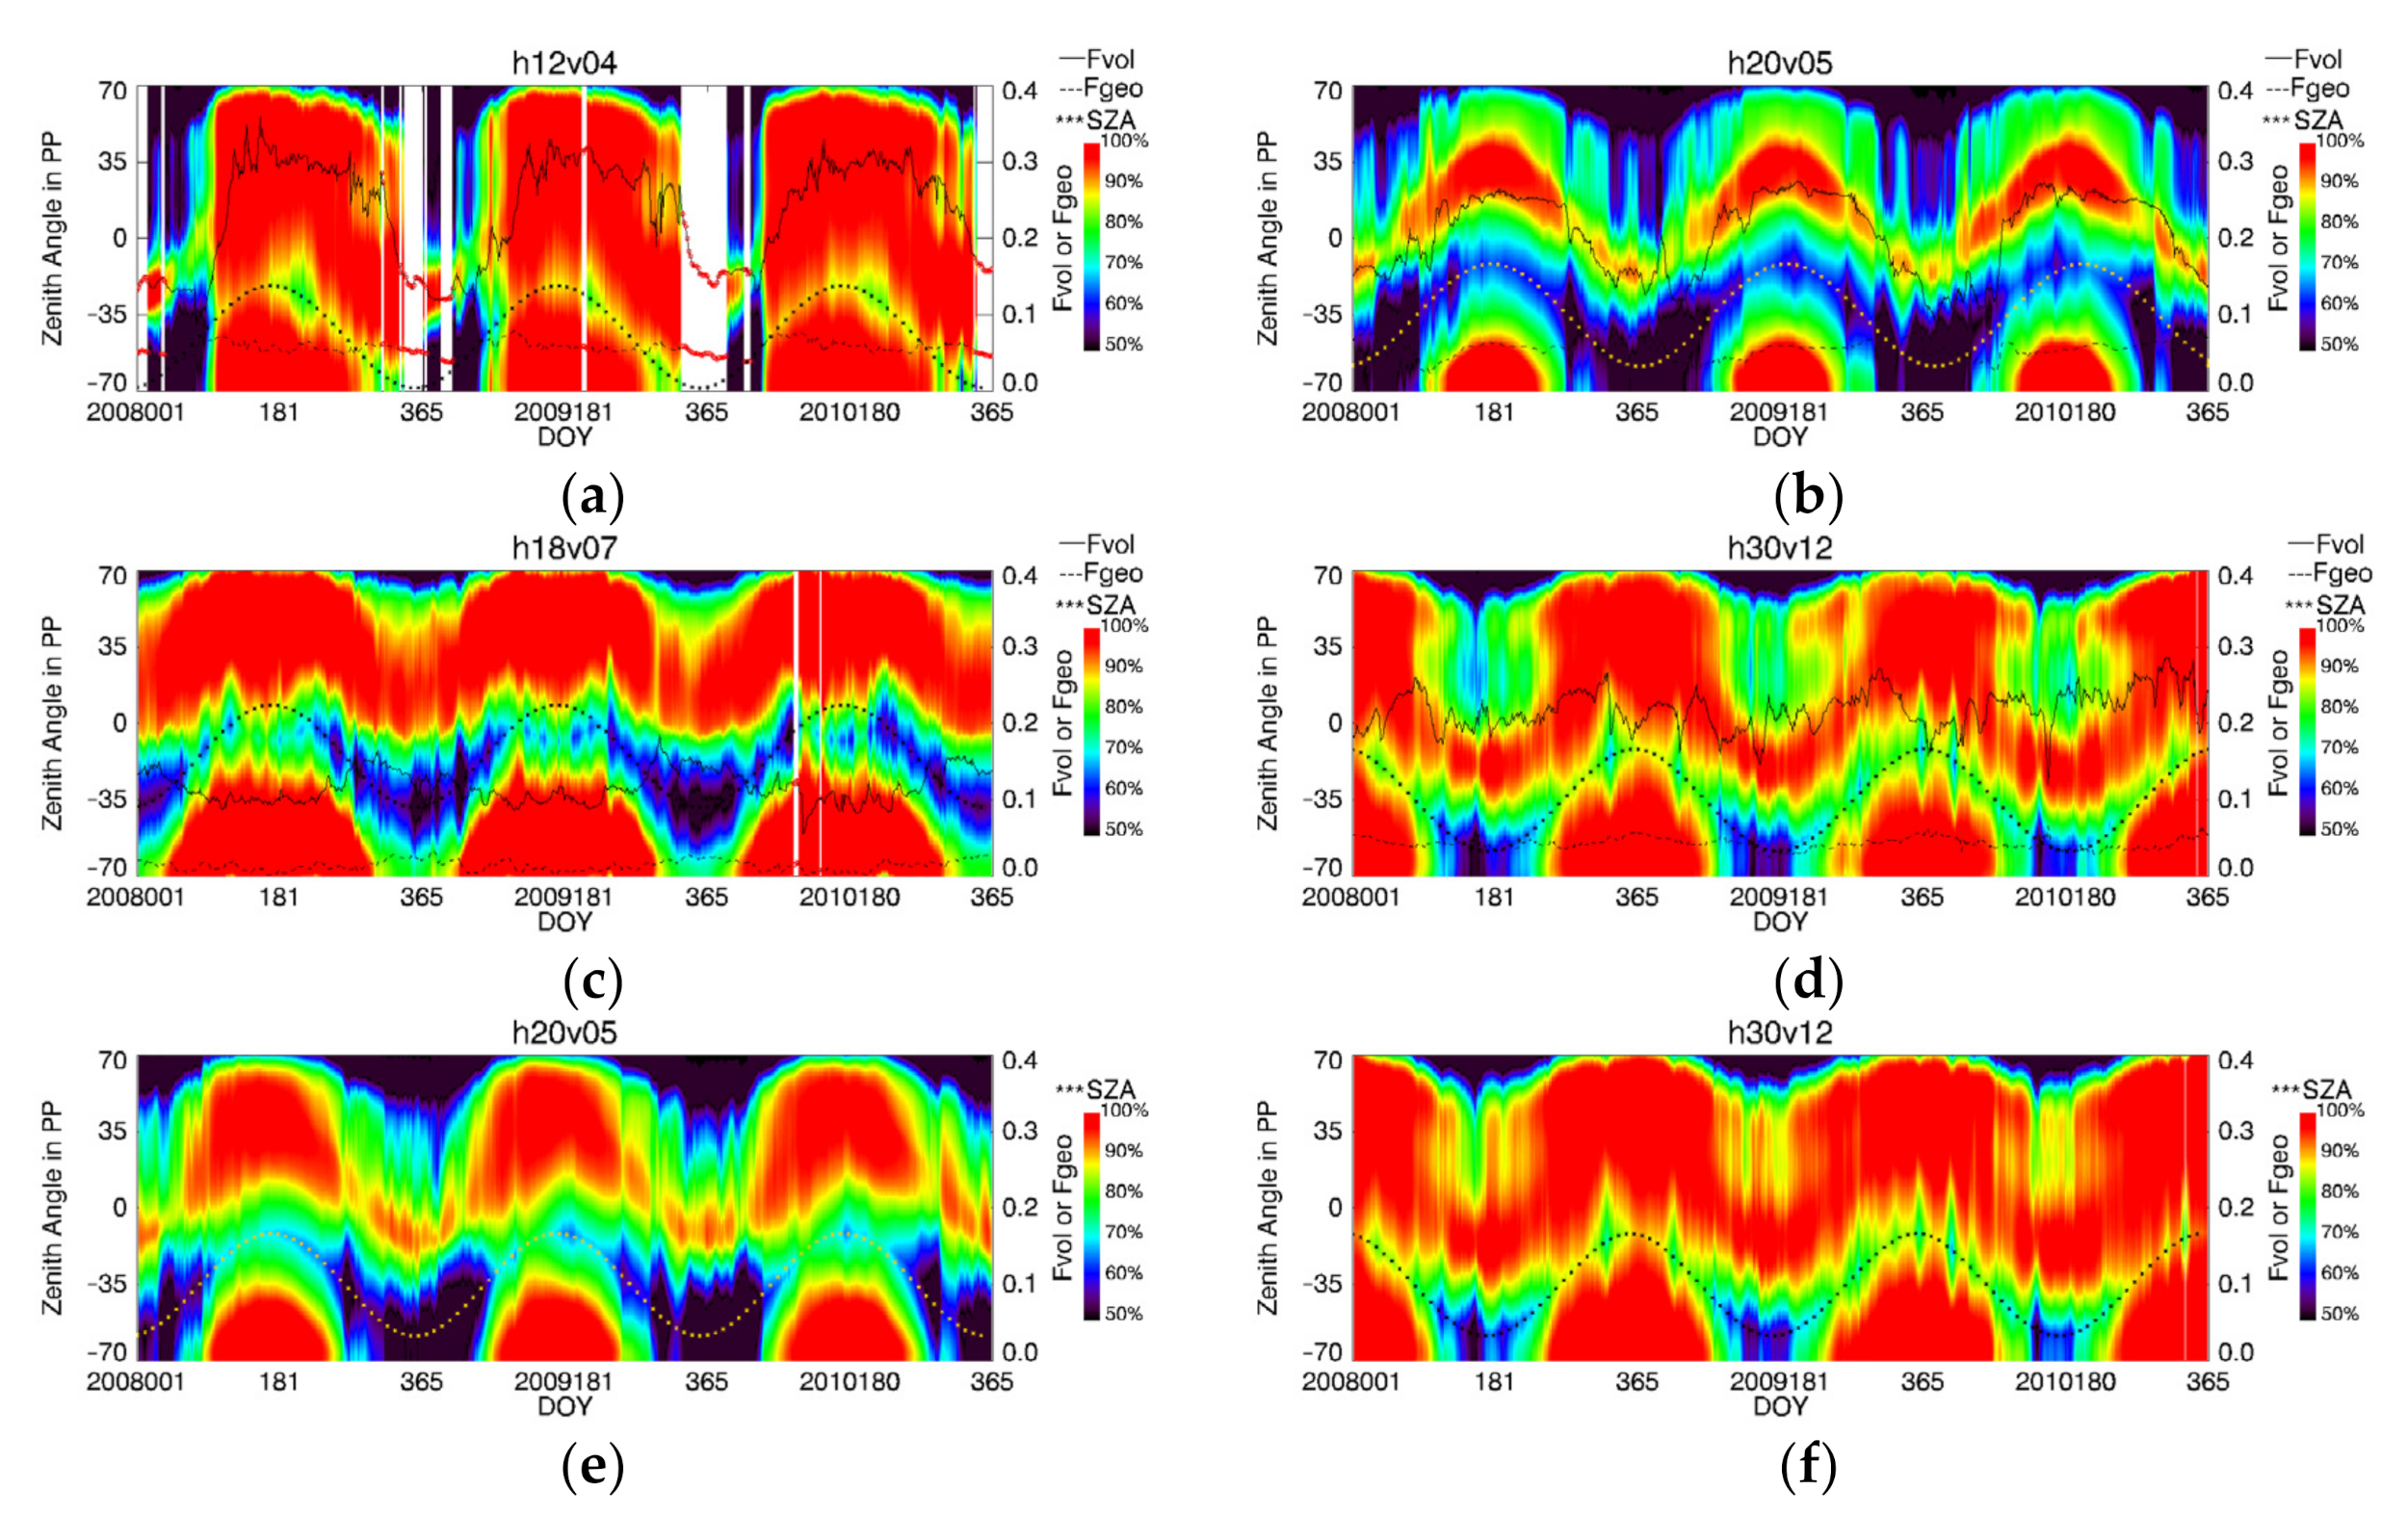
The three-year time series (2008 to 2010) of F, FL, and FN in the shortwave band are extracted from four MODIS tiles. The directional reflectance in PP for each pixel is simulated based on the MODIS BRDF product and the RTLSR BRDF model. The surface albedos are retrieved based on F, FL, and FN and the simulated single directional reflectance in PP. The P0.02 in each direction is also used to evaluate the accuracy of the albedo. The model parameters of the time series of F (right y-axis), the P0.02 in PP, and the solar zenith angle for the four tiles are shown in Figure 13. Some of the F that has low accuracy is plotted with a red circle, because the number of high-quality pixels in the tile is insufficient (i.e., <105). The results show that the inter-annual variability and trend of reflectance anisotropy are similar, which helps to reveal the regularity of the surface anisotropy variation and proves that the probability-weighted method for extracting prior BRDF captures the dominant surface reflectance anisotropy. With the underlying surface change from forest (h12v04) to savanna (h20v05) to semi-desert (h18v07), the degree of variation in Fvol and Fgeo gradually decreases. There are some significant changes in Fvol, especially in the forest areas, while the change in Fgeo is not obvious.
Like the results shown in Figure 12, for h12v04 and h18v07, except for the hotspot and large viewing-zenith-angle area, more than 90% of pixels have a similar albedo to MODIS. A notable feature is that during the winter time, in h20v04, F-based albedo has a low accuracy; this is possibly caused by the effect of snow. For h20v05, the accuracy of the F-based albedo decreases obviously; this is because both the vegetation and barren ground account for a relatively large proportion within the tile. For the four tiles, when the solar zenith angle is greater than 50°, the performance of F starts to show a decline in the forward direction. Apart from these, despite only a priori BRDF being used for one MODIS tile, the F-based albedo in most directions has a high consistency with the MODIS albedo over the three years. Figure 13e,f shows the P0.02 in PP based on the FL and FN. The directions that have high accuracy are increased, especially in h20v05. The accuracy around the forward direction is obviously improved when the solar zenith angle is greater than 50°. There is no significant difference between the FL- and FN-based albedo retrieved from directional reflectance.

3.3.3. F-Based Albedo from Simulated and Real MODIS Directional Reflectance

Figure 14a–c show three simulated shortwave reflectance maps based on the MODIS BRDF product of tile h12v04 and the RTLSR BRDF model with a solar zenith angle of 22°. Compared with the MODIS shortwave albedo product (Figure 12d), the reflectance in nadir and at a backward angle of 30° is larger, while the reflectance at a forward angle of 30° is similar, with a mean difference of 0.014, 0.027 and −0.007, respectively. The albedo of all pixels, except for the water and fill pixels, is simulated based on F and directional reflectance. All the F-based albedos have a high consistency with the MODIS albedo. In the estimation of surface albedo, large errors may occur without considering the anisotropy reflectance effect. However, F, which represents the dominant reflectance anisotropy within a MODIS tile can improve the accuracy of albedo retrieval from a single directional reflectance.
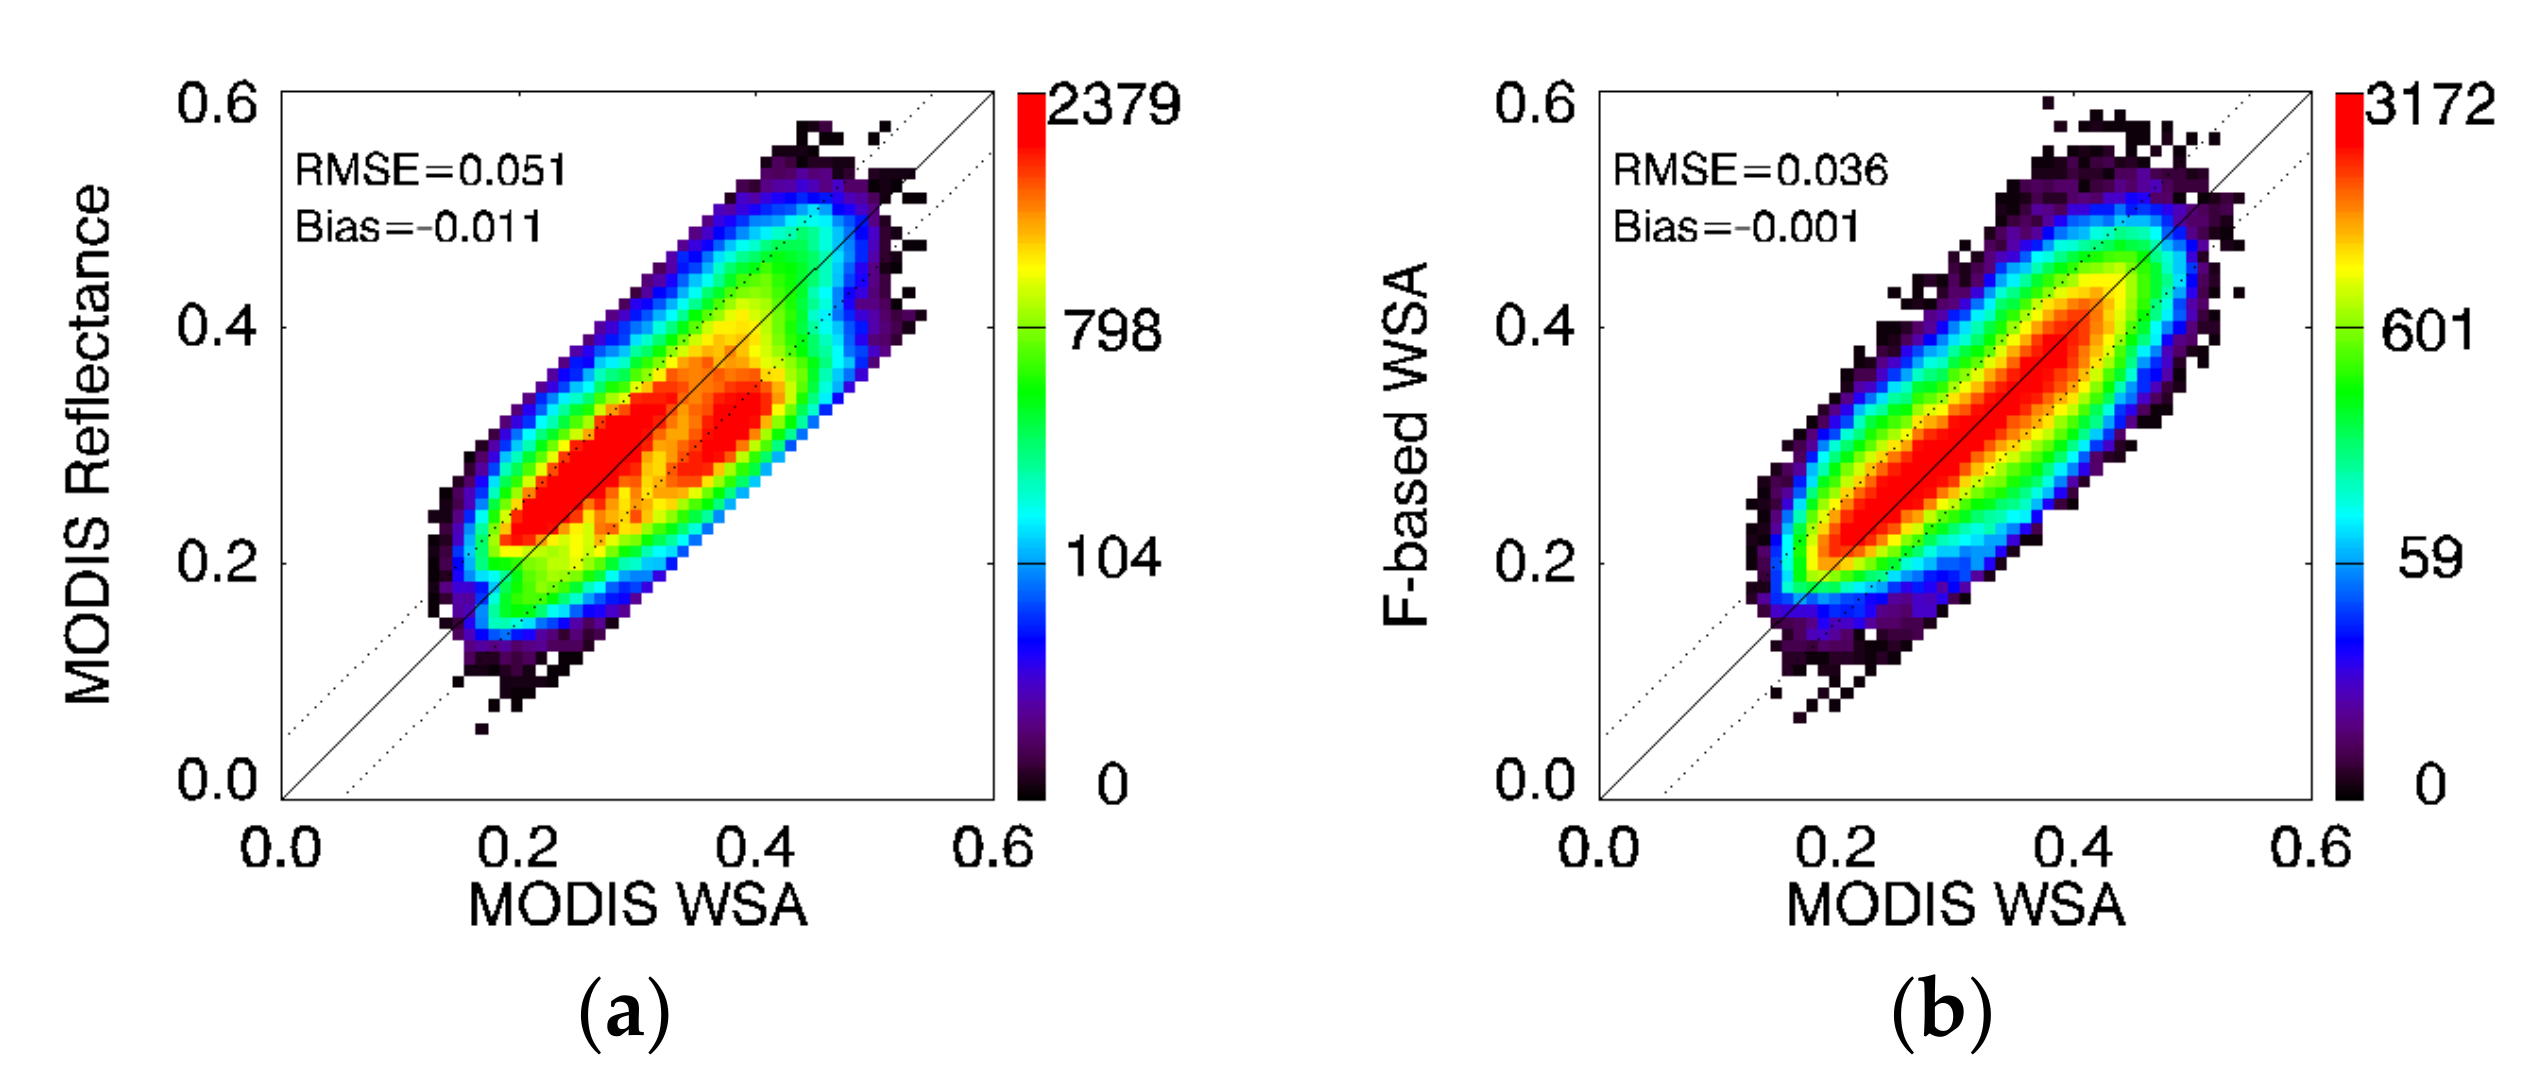
Figure 15 shows the comparison of MODIS WSA with directional reflectance or with F-based WSA. The results indicate that the directional reflectance may overestimate or underestimate the WSA, while the F-based albedo retrieval from the directional reflectance can reduce the effect of reflectance anisotropy with RMES change from 0.051 to 0.036.

4. Discussion

Fine-resolution albedo products are very helpful in various applications such as agricultural and forest management, and ecological environment monitoring and assessments. Additionally, it is crucial for validating coarse-resolution satellite albedos, particularly over heterogeneous land surfaces. With the rapid development of remote-sensing technology, many fine-resolution satellites have been launched or will be launched soon. Therefore, the need to pursue research on new methodologies for the derivation of fine-resolution land-surface albedos is increasing. In this study, we investigated the distribution the characteristics of reflectance anisotropy based on the MODIS BRDF product, and proposed a probability-weighted method to extract a priori BRDF from a MODIS tile. A priori BRDF was used to improve albedo retrieval from a single directional surface reflectance.
The F used in this study was extracted from the normalized model parameters, which is one of the main differences between this method and others. The normalization process removes the effect of spectral reflectance amplitude and makes the BRDF comparable. The corresponding F can better represent the dominant reflectance anisotropy. Another difference is that pixels that have a highly aggregative state, as opposed to “pure” MODIS pixels, were used to extract F. The reason for this is that the pure pixel in the MODIS scale is only relative, and the pure pixels used in the BRDF assignation procedure are only spectrally similar and may not necessarily be similar in surface anisotropy. Furthermore, sometimes, the chance of finding “pure” MODIS pixels for a specific class is lower. This study considered the distribution characteristics of reflectance anisotropy and neglected some discrete pixels in the process of extracting F, which could filter out some exception parameters and help to obtain a more representative F. It should be emphasized that a priori BRDFs can only be used for the retrieval of albedo since albedo is integral to BRDF over the viewing and illuminating hemispheres, since the integration process of BRDF weakens the effect of reflectance anisotropy on albedo. However, this a priori knowledge is not so accurate in retrieving other vegetation structures, such as the clumping index [59,60], particularly when a specific directional reflectance is needed.
Among studies on a priori BRDF extraction from historical MODIS BRDF for albedo retrieval, surface land-cover type and NDVI are usually taken as the basis for classifying reflectance anisotropy. The anisotropy of the reflectance is closely related to the structure of the target, in theory; however, both land-cover type and the NDVI mainly reveal the ground spectral information [61]. Based on AFX and archetypal BRDFs, we have proven that the land-cover type and NDVI are not necessarily appropriate for identifying reflectance anisotropy [43,62]. Although the albedo retrieved from LCT- or NDVI-based a priori BRDF shows a varying degree of consistency with ground measurements [40,42], this does not mean the LCT or NDVI can effectively distinguish reflectance anisotropy. In this study, a notable improvement in LCT or NDVI-based F only appears when both vegetated and barren ground occupy a large proportion in a tile. In most situations, similar results also can be obtained based only on F extracted from all the data. All the a priori BRDFs obtained via different methods captured the dominant reflectance anisotropy, which represent the majority of reflectance anisotropy of the ground. It is important to note that F is very similar to the intermediate archetype BRDF, which can correct the effect of reflectance anisotropy and obtain a relatively stable albedo [44,63].
Concurrent coarse-resolution BRDF data are an essential item for retrieving fine-resolution albedo from nadir reflectance. However, the BRDF assignation procedure may not be effective when sufficient MODIS BRDF data are not available or the size of the study area is too small. In this case, a priori BRDF would be borrowed from spatially adjacent images on the same day. The proposed algorithm provides another possible approach to borrowing a priori BRDF from the time adjacent images. The F extracted from a MODIS tile, based on the probability-weighted method, showed similar interannual variability. Even if the clear-sky MODIS data on the same day are not available, a priori BRDFs near real-time or in a different year may be able to provide an accurate estimation of reflectance anisotropy for albedo retrieval. Another potential advantage is that the present method reduces computational complexity, while providing accurate reflectance anisotropy for albedo retrieval. One specific a priori BRDF can be applied to the entire MODIS tile area for most viewing directions and ensure that most of the pixels have high accuracy. For the observations of most of the polar orbital satellites located around the cross-principal plane (CPP), F usually has a good performance. A priori BRDF extracted from a MODIS tile may be unreasonable, especially for the tiles that have multiple gathering centers. This study only provides a feasible method for a priori BRDF extraction and carries out some simple validation using simulated and real satellite data. More efforts are needed to further refine the method and find the best balance between reflectance anisotropy properties and spatial scale.
Comparing the Landsat surface reflectance and the F-based albedo with ground measurements indicates that the Lambertian assumption could introduce significant errors into the albedo, while after the correction of a priori BRDF, the uncertainty in albedo is obviously reduced. Surface reflectance anisotropy is one of the many factors that affect albedo retrieval from directional reflectance. Since the proposed method needs a single directional reflectance as the most important input, an accurate atmospheric correction is desperately required to generate reliable surface reflectance from the TOA reflectance [64]. However, in general, accurate aerosol loadings around the satellite overpass time are not available for most fine-resolution satellite data; therefore, the atmospheric correction may sometimes be unreliable for obtaining an accurate albedo. Beyond that, the F-based albedo of some pixels shows a relatively large difference compared with the MODIS albedo product, and this problem requires further study for an improved understanding of the characteristics of reflectance anisotropy.
Scale issues in the retrieval of fine-resolution albedo should not be neglected since the MODIS BRDF and Landsat reflectance have different spatial resolutions. Studies have shown that albedo can be significantly impacted by the use of BRDFs of different resolutions [31,34]. However, because of the lack of BRDF data at a fine resolution, in most studies, the reflectance anisotropy information, used for fine-resolution reflectance anisotropy correction or albedo retrieval, is extracted from a coarse-resolution BRDF product [20,21,22,28,30]. The results showed that these coarse-resolution a priori BRDFs can yield reasonable results when applied to fine-resolution reflectance. For the purpose of this study, we expected to find a specific a priori BRDF which can represent the reflectance anisotropy of most pixels for converting directional reflectance to albedo. Following the strategy used in earlier studies, this study does not consider the scale effect, and the extracted BRDF can still yield accurate results when used as a priori knowledge to retrieve the albedo.

5. Conclusions

In this study, the distribution characteristics of reflectance anisotropy over one MODIS tile were discussed, and a priori BRDF was extracted using the probability-weighted method. The effect of reflectance anisotropy on albedo retrieval was learned by adjusting F to nadir reflectance. The possibility of using F to retrieve albedo from various viewing zenith angles, the ability of LCT or NDVI to distinguish reflectance anisotropy, and the improvement of FL and FN for albedo retrieval from a single directional reflectance were also discussed. The possibility of using F to retrieve albedo from a single directional reflectance was validated using global (on DOY 170, 2010) and time-series (over the four tiles) MODIS BRDF data. The F extracted from MODIS was also applied to the Landsat surface reflectance to retrieve the fine-resolution albedo, and the Landsat albedo was validated using ground measurements.
Based on the four tiles, the surface reflectance anisotropy, represented by normalized BRDF model parameters in each spectral band and different tiles, showed a pattern of aggregated distribution. Except for the tiles that had a large percentage of both vegetated and non-vegetated surface and had multiple gathering centers, most of the tiles only had one gathering center. In the shortwave band, the reflectance anisotropy characteristics of different land-cover types or with a certain range of NDVI also presented aggregated distribution patterns. Significant differences appeared only when the NDVI changed from greater than 0.2 to less than 0.2, or when the ground changed from vegetated to barren. For the tiles that had a single anisotropy gathering center, F could capture the dominant reflectance anisotropy of most pixels.
The albedo retrieved from F and nadir reflectance had a high consistency with the MODIS albedo. When the solar zenith angle was around 40°, the nadir reflectance and F-based albedo were close to the MODIS albedo. With an increase or decrease in the solar zenith angle, the difference between nadir reflectance and MODIS albedo was gradually increased. However, the F-based albedo always kept a relatively high accuracy. An improvement in FL and FN occurred when the surface contained a large proportion of both vegetated and barren ground. The global MODIS BRDF data showed that the accuracy of the albedo retrieved from nadir reflectance can be improved efficiently by introducing F. The improvement in FL and FN was not obvious when compared with F, and only seven tiles that had a P0.02 increased more than 10%. A priori BRDF can also be used to generate a reliable fine-resolution albedo from the directional reflectance. The fine-resolution albedo retrieved from the Landsat surface reflectance was highly consistent with ground measurements, with an RMSE of 0.027; however, the influence of spatial resolution on the angular variation patterns of optical reflectance between Landsat and MODIS cannot be considered at this stage. This approach could improve the accuracy of albedo compared with the Lambertian assumption.
For the entire viewing hemisphere, except the hotspot and large viewing-zenith-angle area, the F-based albedo from directional reflectance had high consistency with the MODIS albedo, with more than 90% of pixels having an absolute difference between −0.02 and 0.02. However, when the tile contained a large proportion of both vegetated and barren ground, the directions that had low accuracy would increase. When the solar zenith angle was large, the accuracy around the forward direction would also decrease. The accuracy of FL- and FN-based albedo around these directions could be improved. The time-series BRDF product over the four MODIS tiles also proved these conclusions. Beyond that, F showed obvious seasonal features, and the interannual variability of F showed remarkable regularity. F-based albedo retrieval from simulated or real directional reflectance also had high consistency with the high-quality MODIS albedo product.

Author Contributions

Conceptualization, H.Z. and Z.J.; data curation, M.Z., L.C. (Lei Chen), Y.L. (Yi Lian) and D.Q.; funding acquisition, Z.J., H.Z. and J.L.; investigation, Y.W.; methodology, H.Z. and Z.J.; supervision, Y.D. and X.Z.; writing—original draft, H.Z.; writing—review and editing, Z.J., L.C. (Lei Cui), Y.L. (Yan Liu) and T.C. All authors have read and agreed to the published version of the manuscript.

Funding

This work was supported, in part, by the National Key R&D Program of China (2019YFE0127300) and the National Natural Science Foundation of China (41971306 and 41901301).

Data Availability Statement

All the satellite remote-sensing and field-measured data used in this study are openly and freely available. The Collection 6 MODIS BRDF parameters and land-cover products are available at https://search.earthdata.nasa.gov/search, accessed on 1 April 2019. The ground measurements over the seven SURFRAD stations are available at https://gml.noaa.gov/grad/surfrad/index.html, accessed on 1 July 2019. The Landsat ground reflectance is available at https://earthexplorer.usgs.gov/, accessed on 1 September 2020.

Acknowledgments

We are grateful for the careful review and valuable comments provided by the anonymous reviewers.

Conflicts of Interest

The authors declare no conflict of interest.

References

  1. Dickinson:, R.E. Land surface processes and climate surface albedos and energy balance. Adv. Geophys. 1983, 25, 305–353. [Google Scholar]
  2. Schaaf, C.B.; Gao, F.; Strahler, A.H.; Lucht, W.; Li, X.; Tsang, T.; Strugnell, N.C.; Zhang, X.; Jin, Y.; Muller, J.-P.; et al. First operational BRDF, albedo nadir reflectance products from MODIS. Remote Sens. Environ. 2002, 83, 135–148. [Google Scholar] [CrossRef] [Green Version]
  3. Henderson-Sellers, A.; Wilson, M.F. Surface albedo data for climatic modeling. Rev. Geophys. 1983, 21, 1743–1778. [Google Scholar] [CrossRef]
  4. Leroy, M.; Deuze, J.L.; Breon, F.M.; Hautecoeur, O.; Herman, M.; Buriez, J.C.; Tanre, D.; Bouffies, S.; Chazette, P.; Roujean, J.L. Retrieval of atmospheric properties and surface bidirectional reflectances over land from POLDER/ADEOS. J. Geophys. Res. Atmos. 1997, 102, 17023–17037. [Google Scholar] [CrossRef]
  5. Lucht, W.; Schaaf, C.B.; Strahler, A.H. An algorithm for the retrieval of albedo from space using semiempirical BRDF models. IEEE Trans. Geosci. Remote Sens. 2000, 38, 977–998. [Google Scholar] [CrossRef] [Green Version]
  6. Martonchik, J.V.; Diner, D.J.; Kahn, R.A.; Ackerman, T.P.; Verstraete, M.E.; Pinty, B.; Gordon, H.R. Techniques for the retrieval of aerosol properties over land and ocean using multiangle imaging. Ieee Trans. Geosci. Remote Sens. 1998, 36, 1212–1227. [Google Scholar] [CrossRef] [Green Version]
  7. Martonchik, J.V.; Diner, D.J.; Pinty, B.; Verstraete, M.M.; Myneni, R.B.; Knyazikhin, Y.; Gordon, H.R. Determination of land and ocean reflective, radiative, and biophysical properties using multiangle imaging. Ieee Trans. Geosci. Remote Sens. 1998, 36, 1266–1281. [Google Scholar] [CrossRef]
  8. Dickinson, R.E.; Pinty, B.; Verstraete, M.M. Relating surface albedo in GCM to remotely sensed data. Agric. For. Meteorol. 1990, 52, 109–131. [Google Scholar] [CrossRef]
  9. Saunders, R.W. The determination of broad band surface albedo from AVHRR visible and near-infrared radiances. Int. J. Remote Sens. 1990, 11, 49–67. [Google Scholar] [CrossRef]
  10. Jacob, F.; Olioso, A. Derivation of diurnal courses of albedo and reflected solar irradiance from airborne POLDER data acquired near solar noon. J. Geophys. Res. Atmos. 2005, 110, D10104. [Google Scholar] [CrossRef]
  11. Barnsley, M.J.; Strahler, A.H.; Morris, K.P.; Muller, J.P. Sampling the surface bidirectional reflectance distribution function (BRDF): 1. Evaluation of current and future satellite sensors. Remote Sens. Rev. 1994, 8, 271–311. [Google Scholar] [CrossRef]
  12. Jin, Y.; Schaaf, C.B.; Gao, F.; Li, X.; Strahler, A.H.; Lucht, W.; Liang, S. Consistency of MODIS surface bidirectional reflectance distribution function and albedo retrievals: 1. Algorithm performance. J. Geophys. Res. Atmos. 2003, 108, 4158. [Google Scholar] [CrossRef]
  13. Nicodemus, F.E.; Richmond, J.C.; Hsia, J.J.; Ginsberg, I.W.; Limperis, T. Geometrical Considerations and Nomenclature for Reflectance; National Bureau of Standards, US Department of Commerce: Washington, DC, USA, 1977. [Google Scholar]
  14. Kimes, D.S. Dynamics of directional reflectance factor distributions for vegetation canopies. Appl. Opt. 1983, 22, 1364–1372. [Google Scholar] [CrossRef]
  15. Li, X.; Strahler, A.H. Geometric-optical bidirectional reflectance modeling of the discrete crown vegetation canopy: Effect of crown shape and mutual shadowing. IEEE Trans. Geosci. Remote Sens. 1992, 30, 276–292. [Google Scholar] [CrossRef]
  16. Kimes, D.S.; Sellers, P.J. Inferring hemispherical reflectance of the earth’s surface for global energy budgets from remotely sensed nadir or directional radiance values. Remote Sens. Environ. 1985, 18, 205–223. [Google Scholar] [CrossRef]
  17. Privette, J.L.; Eck, T.F.; Deering, D.W. Estimating spectral albedo and nadir reflectance through inversion of simple BRDF models with AVHRR/MODIS-like data. J. Geophys. Res. Atmos. 1997, 102, 29529–29542. [Google Scholar] [CrossRef]
  18. Jin, Y.; Gao, F.; Schaaf, C.B.; Li, X.; Strahler, A.H.; Bruegge, C.J.; Martonchik, J.V. Improving MODIS surface BRDF/Albedo retrieval with MISR multiangle observations. Geosci. Remote Sens. IEEE Trans. 2002, 40, 1593–1604. [Google Scholar] [CrossRef] [Green Version]
  19. Maignan, F.; Bréon, F.-M.; Lacaze, R. Bidirectional reflectance of Earth targets: Evaluation of analytical models using a large set of spaceborne measurements with emphasis on the Hot Spot. Remote Sens. Environ. 2004, 90, 210–220. [Google Scholar] [CrossRef]
  20. Franch, B.; Vermote, E.F.; Claverie, M. Intercomparison of Landsat albedo retrieval techniques and evaluation against in situ measurements across the US SURFRAD network. Remote Sens. Environ. 2014, 152, 627–637. [Google Scholar] [CrossRef]
  21. He, T.; Liang, S.; Wang, D.; Cao, Y.; Feng, G.; Yu, Y.; Min, F. Evaluating land surface albedo estimation from Landsat MSS, TM, ETM +, and OLI data based on the unified direct estimation approach. Remote Sens. Environ. 2018, 204, 181–196. [Google Scholar] [CrossRef]
  22. Shuai, Y.; Masek, J.G.; Gao, F.; Schaaf, C.B. An algorithm for the retrieval of 30-m snow-free albedo from Landsat surface reflectance and MODIS BRDF. Remote Sens. Environ. 2011, 115, 2204–2216. [Google Scholar] [CrossRef]
  23. Abrams, M.; Tsu, H.; Hulley, G.; Iwao, K.; Pieri, D.; Cudahy, T.; Kargel, J. The Advanced Spaceborne Thermal Emission and Reflection Radiometer (ASTER) after fifteen years: Review of global products. Int. J. Appl. Earth Obs. Geoinf. 2015, 38, 292–301. [Google Scholar] [CrossRef]
  24. Wilson, K.L.; Skinner, M.A.; Lotze, H.K. Eelgrass (Zostera marina) and benthic habitat mapping in Atlantic Canada using high-resolution SPOT 6/7 satellite imagery. Estuar. Coast. Shelf Sci. 2019, 226, 106292. [Google Scholar] [CrossRef]
  25. Shen, G.; Xu, B.; Jin, Y.; Chen, S.; Zhang, W.; Guo, J.; Liu, H.; Zhang, Y.; Yang, X. Monitoring wind farms occupying grasslands based on remote-sensing data from China’s GF-2 HD satellite—A case study of Jiuquan city, Gansu province, China. Resour. Conserv. Recycl. 2017, 121, 128–136. [Google Scholar] [CrossRef]
  26. Song, Q.; Zhou, Q.-b.; Wu, W.-b.; Hu, Q.; Lu, M.; Liu, S.-b. Mapping regional cropping patterns by using GF-1 WFV sensor data. J. Integr. Agric. 2017, 16, 337–347. [Google Scholar] [CrossRef]
  27. Flood, N. Testing the local applicability of MODIS BRDF parameters for correcting Landsat TM imagery. Remote Sens. Lett. 2013, 4, 793–802. [Google Scholar] [CrossRef]
  28. Roy, D.P.; Zhang, H.K.; Ju, J.; Gomez-Dans, J.L.; Lewis, P.E.; Schaaf, C.B.; Sun, Q.; Li, J.; Huang, H.; Kovalskyy, V. A general method to normalize Landsat reflectance data to nadir BRDF adjusted reflectance. Remote Sens. Environ. 2016, 176, 255–271. [Google Scholar] [CrossRef] [Green Version]
  29. Van Doninck, J.; Tuomisto, H. Evaluation of directional normalization methods for Landsat TM/ETM+ over primary Amazonian lowland forests. Int. J. Appl. Earth Obs. Geoinf. 2017, 58, 249–263. [Google Scholar] [CrossRef]
  30. Shuai, Y.; Masek, J.G.; Gao, F.; Schaaf, C.B.; He, T. An approach for the long-term 30-m land surface snow-free albedo retrieval from historic Landsat surface reflectance and MODIS-based a priori anisotropy knowledge. Remote Sens. Environ. 2014, 152, 467–479. [Google Scholar] [CrossRef]
  31. Jiao, Z.; Zhang, X.; Breon, F.-M.; Dong, Y.; Schaaf, C.B.; Roman, M.; Wang, Z.; Cui, L.; Yin, S.; Ding, A.; et al. The influence of spatial resolution on the angular variation patterns of optical reflectance as retrieved from MODIS and POLDER measurements. Remote Sens. Environ. 2018, 215, 371–385. [Google Scholar] [CrossRef]
  32. Román, M.O.; Gatebe, C.K.; Schaaf, C.B.; Poudyal, R.; Wang, Z.; King, M.D. Variability in surface BRDF at different spatial scales (30 m–500 m) over a mixed agricultural landscape as retrieved from airborne and satellite spectral measurements. Remote Sens. Environ. 2011, 115, 2184–2203. [Google Scholar] [CrossRef] [Green Version]
  33. He, T.; Liang, S.; Wang, D.; Wu, H.; Yu, Y.; Wang, J. Estimation of surface albedo and directional reflectance from Moderate Resolution Imaging Spectroradiometer (MODIS) observations. Remote Sens. Environ. 2012, 119, 286–300. [Google Scholar] [CrossRef] [Green Version]
  34. Zhang, X.; Jiao, Z.; Dong, Y.; He, T.; Ding, A.; Yin, S.; Zhang, H.; Cui, L.; Chang, Y.; Guo, J.; et al. Development of the Direct-Estimation Albedo Algorithm for Snow-Free Landsat TM Albedo Retrievals Using Field Flux Measurements. IEEE Trans. Geosci. Remote Sens. 2019, 58, 1550–1567. [Google Scholar] [CrossRef]
  35. Li, X.; Gao, F.; Wang, J.; Strahler, A. A priori knowledge accumulation and its application to linear BRDF model inversion. J. Geophys. Res. Atmos. 2001, 106, 11925–11935. [Google Scholar] [CrossRef]
  36. Roujean, J.-L.; Leon-Tavares, J.; Smets, B.; Claes, P.; Camacho De Coca, F.; Sanchez-Zapero, J. Surface albedo and toc-r 300 m products from PROBA-V instrument in the framework of Copernicus Global Land Service. Remote Sens. Environ. 2018, 215, 57–73. [Google Scholar] [CrossRef]
  37. Wang, Y.; Li, X.; Nashed, Z.; Zhao, F.; Yang, H.; Guan, Y.; Zhang, H. Regularized kernel-based BRDF model inversion method for ill-posed land surface parameter retrieval. Remote Sens. Environ. 2007, 111, 36–50. [Google Scholar] [CrossRef]
  38. Pokrovsky, I.; Pokrovsky, O.; Roujean, J.-L. Development of an operational procedure to estimate surface albedo from the SEVIRI/MSG observing system by using POLDER BRDF measurements: I. Data quality control and accumulation of information corresponding to the IGBP land cover classes. Remote Sens. Environ. 2003, 87, 198–214. [Google Scholar] [CrossRef]
  39. Deering, D.W.; Eck, T.F.; Banerjee, B. Characterization of the Reflectance Anisotropy of Three Boreal Forest Canopies in Spring–Summer. Remote Sens. Environ. 1999, 67, 205–229. [Google Scholar] [CrossRef]
  40. Strugnell, N.C.; Lucht, W. An Algorithm to Infer Continental-Scale Albedo from AVHRR Data, Land Cover Class, and Field Observations of Typical BRDFs. J. Clim. 2001, 14, 1360–1376. [Google Scholar] [CrossRef]
  41. Li, Z.; Erb, A.; Sun, Q.; Yan, L.; Shuai, Y.; Wang, Z.; Peter, B.; Schaaf, C.B. Preliminary assessment of 20-m surface albedo retrievals from sentinel-2A surface reflectance and MODIS/VIIRS surface anisotropy measures. Remote Sens. Environ. 2018, 217, 352–365. [Google Scholar] [CrossRef]
  42. Bacour, C.; Breon, F.M. Variability of biome reflectance directional signatures as seen by POLDER. Remote Sens. Environ. 2005, 98, 80–95. [Google Scholar] [CrossRef]
  43. Jiao, Z.; Hill, M.J.; Schaaf, C.B.; Zhang, H.; Wang, Z.; Li, X. An Anisotropic Flat Index (AFX) to derive BRDF archetypes from MODIS. Remote Sens. Environ. 2014, 141, 168–187. [Google Scholar] [CrossRef]
  44. Zhang, H.; Jiao, Z.; Chen, L.; Dong, Y.; Zhang, X.; Lian, Y.; Qian, D.; Cui, T. Quantifying the Reflectance Anisotropy Effect on Albedo Retrieval from Remotely Sensed Observations Using Archetypal BRDFs. Remote Sens. 2018, 10, 1628. [Google Scholar] [CrossRef] [Green Version]
  45. Liu, J.; Schaaf, C.; Strahler, A.; Jiao, Z.; Shuai, Y.; Zhang, Q.; Roman, M.; Augustine, J.A.; Dutton, E.G. Validation of Moderate Resolution Imaging Spectroradiometer (MODIS) albedo retrieval algorithm: Dependence of albedo on solar zenith angle. J. Geophys. Res. Atmos. 2009, 114, D01106. [Google Scholar] [CrossRef]
  46. Roman, M.O.; Schaaf, C.B.; Woodcock, C.E.; Strahler, A.H.; Yang, X.; Braswell, R.H.; Curtis, P.S.; Davis, K.J.; Dragoni, D.; Goulden, M.L.; et al. The MODIS (Collection V005) BRDF/albedo product: Assessment of spatial representativeness over forested landscapes. Remote Sens. Environ. 2009, 113, 2476–2498. [Google Scholar] [CrossRef] [Green Version]
  47. Chander, G.; Markham, B.L.; Helder, D.L. Summary of current radiometric calibration coefficients for Landsat MSS, TM, ETM+, and EO-1 ALI sensors. Remote Sens. Environ. 2009, 113, 893–903. [Google Scholar] [CrossRef]
  48. Markham, B.L.; Helder, D.L. Forty-year calibrated record of earth-reflected radiance from Landsat: A review. Remote Sens. Environ. 2012, 122, 30–40. [Google Scholar] [CrossRef] [Green Version]
  49. Augustine, J.A.; Deluisi, J.J.; Long, C.N. SURFRAD—A National Surface Radiation Budget Network for Atmospheric Research. Bull. Am. Meteorol. Soc. 2000, 81, 2341–2357. [Google Scholar] [CrossRef] [Green Version]
  50. Liang, S.L. Narrowband to broadband conversions of land surface albedo I: Algorithms. Remote Sens. Environ. 2001, 76, 213–238. [Google Scholar] [CrossRef]
  51. Wanner, W.; Li, X.; Strahler, A.H. On the derivation of kernels for kernel-driven models of bidirectional reflectance. J. Geophys. Res. 1995, 100, 21077–21089. [Google Scholar] [CrossRef]
  52. Myneni, R.B.; Asrar, G.; Hall, F.G. A three-dimensional radiative transfer method for optical remote sensing of vegetated land surfaces. Remote Sens. Environ. 1992, 41, 105–121. [Google Scholar] [CrossRef]
  53. Ross, J.K. The Radiation Regime and Architecture of Plant Stands; Dr. W. Junk: Norwell, MA, USA, 1981; 392p. [Google Scholar]
  54. Lewis, P.; Barnsley, M.J. Influence of the sky radiance distribution on various formulations of the Earth surface albedo. In Proceedings of the 6th International Symposium on Physical Measurements and Signatures in Remote Sensing (ISPRS), Val d’Isere, France, 17–21 January 1994. [Google Scholar]
  55. Lucht, W. Expected retrieval accuracies of bidirectional reflectance and albedo from EOS-MODIS and MISR angular sampling. J. Geophys. Res. Atmos. 1998, 103, 8763. [Google Scholar] [CrossRef] [Green Version]
  56. Zhuo, W.; Barlage, M.; Zeng, X.; Dickinson, R.E.; Schaaf, C.B. The solar zenith angle dependence of desert albedo. Geophys. Res. Lett. 2005, 32, L0543. [Google Scholar] [CrossRef]
  57. Dong, Y.; Jiao, Z.; Zhang, H.; Bai, D.; Zhang, X.; Li, Y.; He, D. A Visualization Tool for the Kernel-Driven Model with Improved Ability in Data Analysis and Kernel Assessment. Comput. Geosci. 2016, 95, 1–10. [Google Scholar] [CrossRef]
  58. Jiao, Z.; Schaaf, C.B.; Dong, Y.; Román, M.; Hill, M.J.; Chen, J.M.; Wang, Z.; Zhang, H.; Saenz, E.; Poudyal, R. A method for improving hotspot directional signatures in BRDF models used for MODIS. Remote Sens. Environ. 2016, 186, 135–151. [Google Scholar] [CrossRef] [Green Version]
  59. Dong, Y.; Jiao, Z.; Yin, S.; Zhang, H.; Zhang, X.; Cui, L.; He, D.; Ding, A.; Chang, Y.; Yang, S. Influence of Snow on the Magnitude and Seasonal Variation of the Clumping Index Retrieved from MODIS BRDF Products. Remote Sens. 2018, 10, 1194. [Google Scholar] [CrossRef] [Green Version]
  60. Jiao, Z.; Dong, Y.; Schaaf, C.B.; Chen, J.M.; Román, M.; Wang, Z.; Zhang, H.; Ding, A.; Erb, A.; Hill, M.J. An algorithm for the retrieval of the clumping index (CI) from the MODIS BRDF product using an adjusted version of the kernel-driven BRDF model. Remote Sens. Environ. 2018, 209, 594–611. [Google Scholar] [CrossRef]
  61. Jiao, Z.; Woodcock, C.; Schaaf, C.B.; Tan, B.; Liu, J.; Gao, F.; Strahler, A.; Li, X.; Wang, J. Improving MODIS land cover classification by combining MODIS spectral and angular signatures in a Canadian boreal forest. Can. J. Remote Sens. 2011, 37, 184–203. [Google Scholar] [CrossRef]
  62. Zhang, H.; Jiao, Z.; Dong, Y.; Du, P.; Li, Y.; Lian, Y.; Cui, T. Analysis of Extracting Prior BRDF from MODIS BRDF Data. Remote Sens. 2016, 8, 1004. [Google Scholar] [CrossRef] [Green Version]
  63. Jiao, Z.; Zhang, H.; Dong, Y.; Liu, Q.; Xiao, Q.; Li, X. An Algorithm for Retrieval of Surface Albedo From Small View-Angle Airborne Observations Through the Use of BRDF Archetypes as Prior Knowledge. IEEE J. Sel. Top. Appl. Earth Obs. Remote Sens. 2015, 8, 3279–3293. [Google Scholar] [CrossRef]
  64. Masek, J.G.; Vermote, E.F.; Saleous, N.E.; Wolfe, R.; Hall, F.G.; Huemmrich, K.F.; Feng, G.; Kutler, J.; Teng-Kui, L. A Landsat surface reflectance dataset for North America, 1990–2000. Geosci. Remote Sens. Lett. IEEE 2006, 3, 68–72. [Google Scholar] [CrossRef]
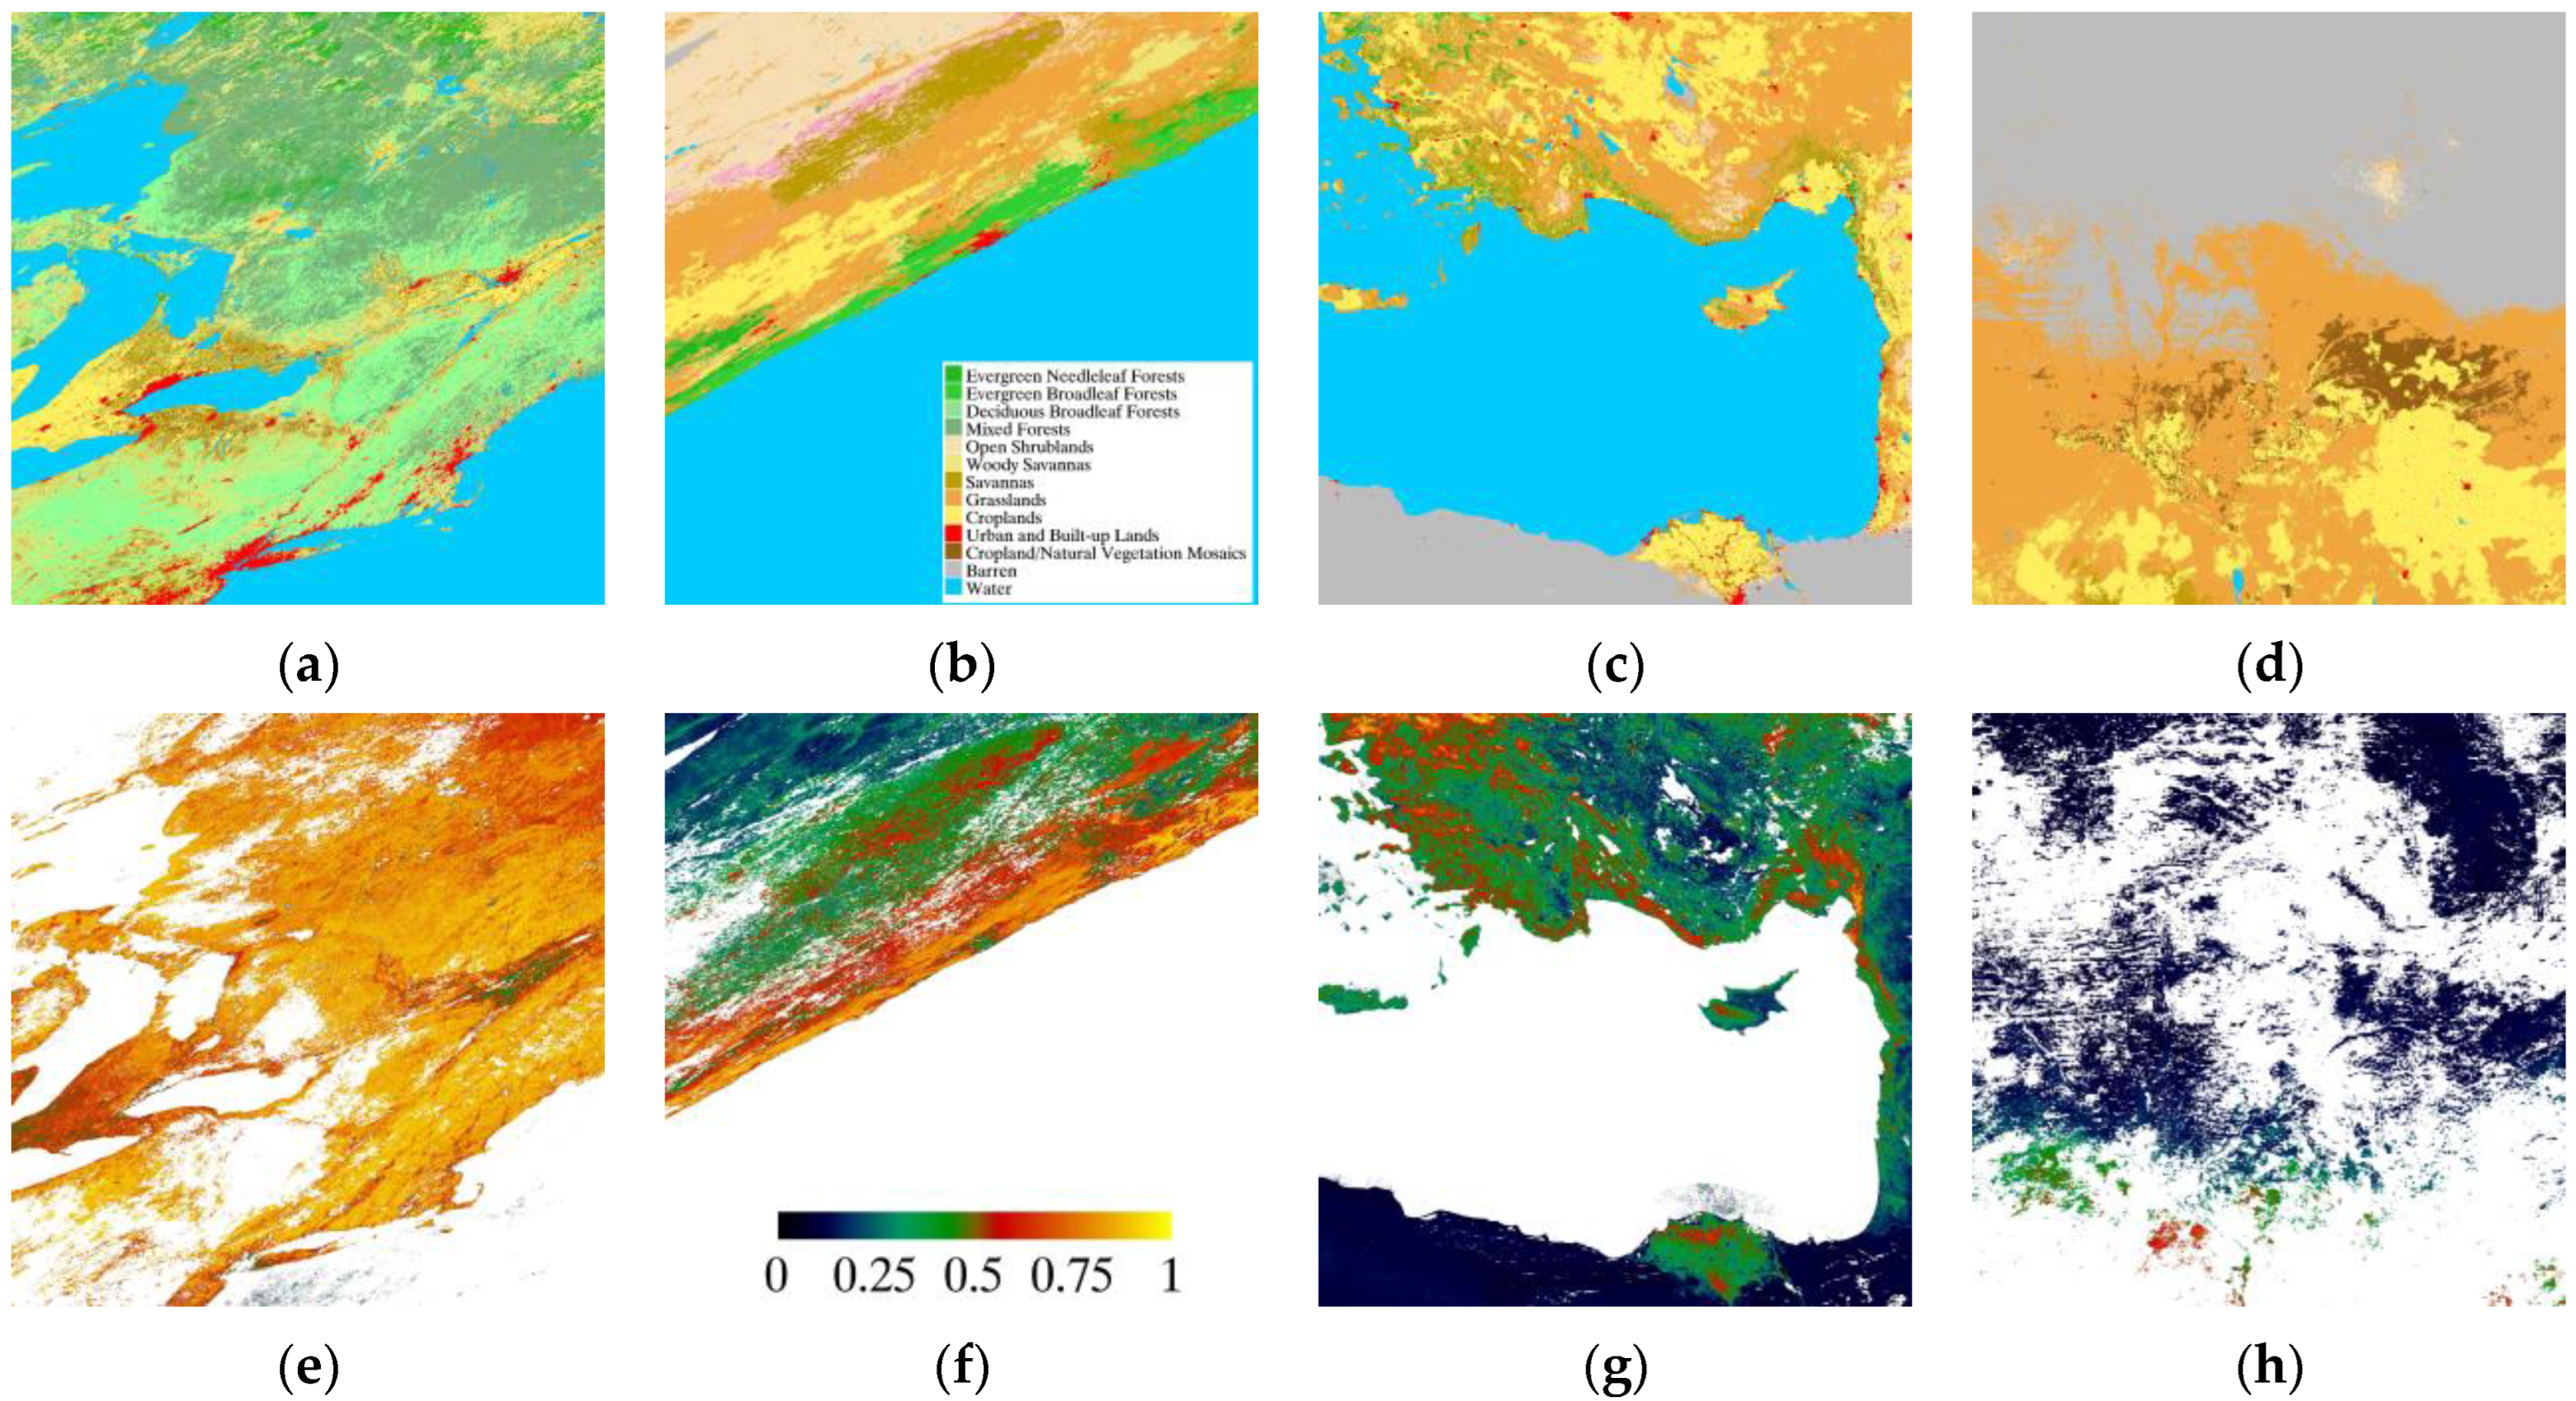
Figure 1. IGBP land-cover map (ad) in 2010 and the NDVI (eh) on DOY 170, 2010 over (a,e) h12v04, (b,f) h30v12, (c,g) h20v05, and (d,h) h18v07. The white area on the NDVI map represents pixels with no or low-quality data.
Remotesensing 14 03627 g001
Figure 2. Angular samplings of MODIS observations for a pixel during 162–177, 2010 in h20v11. The open and solid circles represent the sun and viewing locations. The radius represents the zenith angle with a 20° increment and the polar angle represents the azimuth angle.
Remotesensing 14 03627 g002
Figure 3. The scatter diagrams of original (a) and normalized (b) volumetric and geometric scatter parameters of tile h12v04 on DOY 170, 2010 in shortwave band (b10). The color represents the number of pixels in each grid. The open circles in (a) refer to the distribution of the normalized model parameters in the statistic grid A–D (black circles) of the original BRDF.
Remotesensing 14 03627 g003
Figure 4. The scatter diagrams of F′vol and F′geo in MODIS tile h12v04 (a), h18v07 (b), h20v05, (c) and h30v12 (d) on DOY 170, 2010 at different spectra (b1–4) and broadband (b10) values. The pentacle represents the location of F. Different colors represent the number of pixels in a statistical grid.
Remotesensing 14 03627 g004
Figure 5. The scatter diagrams of F′vol and F′geo in shortwave broadband for six main LCTs (ac) and different ranges of NDVI (df) in h12v04, h20v05, and h30v12. The LCTs include Evergreen Needleleaf Forests (ENF), Evergreen Broadleaf Forests (EBF), Deciduous Broadleaf Forests (DBF), Mixed Forests (MF), Closed Shrublands (CSH), Open Shrublands (OSH), Woody Savannas (WSV), Savannas (SV), Grasslands (GRA), Croplands (CRO), Urban and Built-up Land (UBL), Cropland/Natural Vegetation Mosaics (CNM), and Barren (BRN). The pentacle represents the location of F.
Remotesensing 14 03627 g005
Figure 6. F, FL, and FN extracted from the high-quality MODIS dataset in the three tiles for red (R), near-infrared (N), blue (B), green (G), and shortwave broadband (SW).
Remotesensing 14 03627 g006
Figure 7. The model parameter and 3D shape of Fg (a), Fv (b), and F (c) with a solar zenith angle of 22°. For the bottom coordinate plane, the radius represents the zenith angle, and the polar angle represents the azimuth angle. The BRDF values are plotted on the vertical axis.
Remotesensing 14 03627 g007
Figure 8. The Rd between the MODIS shortwave albedo and the albedo retrieved from the nadir reflectance using Fg (a), Fv (b), and F (c). The colors refer to the value of relative difference. (d) The distribution of accumulative Ad. The pentacle represents the location of F used in the albedo retrieval. The dashed, dotted, and solid lines in (d) refer to Fg, Fv, and F. The red lines refer to the Ad between −0.02 and 0.02.
Remotesensing 14 03627 g008
Figure 9. P0.02 for nadir reflectance, F-, FL-, and FN-based albedo at various solar zenith angles. The sun symbol refers to the real solar zenith angle. (ad) refer to the tile of h12v04, h18v07, h20v05 and h30v12.
Remotesensing 14 03627 g009
Figure 10. The global distribution of Fvol (a) and Fgeo (b) based on the high-quality MODIS BRDF data on DOY 170, 2010: (c,d) the global distribution of P0.02 based on nadir reflectance (c) and F-based albedo (d). The solar zenith angle at local solar noon for each row is also shown; (e,f) the difference between FL- and F-based P0.02 and the difference between FL- and FN-based P0.02.
Remotesensing 14 03627 g010aRemotesensing 14 03627 g010b
Figure 11. Comparison of Landsat shortwave albedo and reflectance with ground measurements at seven SURFRAD sites from 2000 to 2010: (ag) the station of BON, GWN, PSN, FPK, SXF, DRA, and TBL, respectively; (h) result of all stations.
Remotesensing 14 03627 g011
Figure 12. The P0.02 in any direction over the entire viewing hemisphere for h12v04, h20v08, h18v07, and h30v12 on DOY 170, 2010: (ad) the F-based albedo; (eh) the FN-based albedo; and (il) the FL-based albedo. The radius and the polar angle represent the zenith angle and the azimuth angle, respectively.
Remotesensing 14 03627 g012
Figure 13. The distribution of F and P0.02 in PP for the four tiles: (ad) the results of the four tiles based on F; (e,f) based on FL for h20v05 and FN for h30v12. The x-axis is the time, the right y-axis represents the value of the model parameter, and the left y-axis refers to the viewing zenith angle in PP. Different colors represent the values of P0.02. The dotted line refers to the solar zenith angle, the solid and dashed lines represent Fvol and Fgeo, and the red circles represent that F is based on insufficient samples.
Remotesensing 14 03627 g013
Figure 14. The simulated directional reflectance in nadir (a), forward angle of 30° (b) and backward angle of 30° (c) in the principal plane (PP), and the MODIS albedo product (d). (eg) are the simulated albedo based on F and the directional reflectance of (ac), and (h) refers to the MODIS BRDF quality-assurance (QA) product.
Remotesensing 14 03627 g014
Figure 15. Comparison of MODIS WSA with real MODIS directional observation (a) and with F-based WSA (b) retrieval from a single directional reflectance. The colors represent the density of the directional reflectance.
Remotesensing 14 03627 g015
Table 1. Study areas represented by MODIS tile number and Landsat path/row, as well as the site of SURFARD network.
MODIS
Tile No.
Lat./Lon.Dominant LCLandsatSURFRAD
Station
Path/RowNo.
h12v0440–50N/93–65WForest, Mixed Forests, Savannas, and Croplands16/3262PSU
h30v1230–40S/138–169EForest, Shrublands, Savannas, and Grasslands---
h20v0530–40N/26–35EGrasslands, Croplands, and Barren---
h18v0710–20N/0–10EGrasslands, Shrublands, and Barren ---
h10v0530–40N/104–80WForest, Savannas, Croplands, and Mosaics23/36235GWN
h08v0530–40S/104–130EBarren or Sparsely Vegetated40/35277DRA
h09v0440–50S/105–140EGrasslands and Evergreen Needleleaf Forests34/32244TBL
h11v0440–50S/78–109ECroplands and Deciduous Broadleaf Forests23/32195BON
35/26296FPK
29/30114SXF
Publisher’s Note: MDPI stays neutral with regard to jurisdictional claims in published maps and institutional affiliations.