Article

Object Detection Based on Adaptive Feature-Aware Method in Optical Remote Sensing Images

Institute of Geospatial Information, PLA Strategic Support Force Information Engineering University, Zhengzhou 450001, China
*
Author to whom correspondence should be addressed.
Remote Sens. 2022, 14(15), 3616; https://doi.org/10.3390/rs14153616
Submission received: 6 June 2022 / Revised: 18 July 2022 / Accepted: 26 July 2022 / Published: 28 July 2022

Abstract

:
Object detection is used widely in remote sensing image interpretation. Although most models used for object detection have achieved high detection accuracy, computational complexity and low detection speeds limit their application in real-time detection tasks. This study developed an adaptive feature-aware method of object detection in remote sensing images based on the single-shot detector architecture called adaptive feature-aware detector (AFADet). Self-attention is used to extract high-level semantic information derived from deep feature maps for spatial localization of objects and the model is improved in localizing objects. The adaptive feature-aware module is used to perform adaptive cross-scale depth fusion of different-scale feature maps to improve the learning ability of the model and reduce the influence of complex backgrounds in remote sensing images. The focal loss is used during training to address the positive and negative sample imbalance problem, reduce the influence of the loss value dominated by easily classified samples, and enhance the stability of model training. Experiments are conducted on three object detection datasets, and the results are compared with those of the classical and recent object detection algorithms. The mean average precision(mAP) values are 66.12%, 95.54%, and 86.44% for three datasets, which suggests that AFADet can detect remote sensing images in real-time with high accuracy and can effectively balance detection accuracy and speed.

Graphical Abstract

1. Introduction

With the rapid development of remote sensing technology, vision tasks based on remote sensing images, especially object detection, have progressively become popular [1,2]. In recent years, deep learning technology has been widely used in computer vision research with its powerful feature extraction ability and semantic information fusion capacity, providing innovative ideas for object detection in remote sensing images. Object detection in remote sensing images has important applications in satellite surveillance and unmanned aerial vehicles of law enforcement. However, these tasks are highly demanding as they require fast and accurate detection algorithms. Current research on remote sensing image detection algorithms can be generalized into two groups: one focuses on the accuracy of the detection algorithm, while the other focuses on the operation speed of the algorithm.
Object detection in remote sensing images is more challenging than object detection in natural scenes [3]. Remote sensing images have more complex scenes and backgrounds, and large-scale variations in objects are caused by the inconsistent spatial resolution of various sensors or by the great discrepancy in the scale of the objects. For example, there may be both large cargo ships and small fishing boats in the same image, which brings great challenges to the object detection algorithm. In addition, remote sensing images are characterized by dense objects, and the same class of objects often appears in an image in the form of aggregation (such as cars in a parking lot), which makes it difficult to accurately locate objects.
These features pose serious challenges to obtaining accurate models of object detection in remote sensing images. Qian et al. [4] proposed a method of object detection in remote sensing images based on improved bounding box regression and multilevel feature fusion. Generalized Intersection over Union [5] has been applied to remedy computational defects in Intersection over Union (IoU) when the prediction boxes do not overlap with the truth boxes. Additionally, a multilevel feature fusion module has been proposed to allow existing methods to fully utilize multilevel features. Cheng et al. [6] proposed a feature enhancement network (FENet) consisting of a double-attention feature enhancement module and a contextual feature enhancement module for the complex background problem of remote sensing images, which highlights the distinctive features of the object and facilitates the model’s understanding of the scene. Wei et al. [7] proposed a novel single-stage anchor-free rotating object detector and employed a pair of intermediate lines to represent objects with orientation, which improved the problem of inaccurate localization of dense object horizontal frames. The CF2PN model proposed by Huang et al. [8] uses cross-scale feature fusion method and sparse U-shaped module to achieve cross-scale multilevel feature fusion to address the characteristics of widely varying object scales in remote sensing images. For regression problems with large-scale objects, Wang et al. [9] proposed a scale regression invariant structure with a scale compensation strategy and a scale-specific union loss with L1 norm constraints to speed up the convergence. To address the strongly coupled semantic relations in complex scenes, Zhang et al. [10] proposed a powerful multiscale semantic fusion-guided fractal convolutional network where a composite semantic feature fusion approach is designed in the network structure to generate effective semantic descriptions, and a fractal convolutional regression layer is employed for accurate regression of multiscale bounding boxes under irregular aspect ratios. The anchor-based model only considers model accuracy and ignores operation efficiency. Although advanced detection accuracy is obtained, the complexity of the model operation can be high owing to high-performance computing equipment, which causes a hard balance between detection speed and performance. In contrast, the anchor-free-based methods lack a priori information; hence, the network training is relatively destabilized. The inference speed of object detection algorithms for remote sensing images has been widely studied, resulting in the development of rapid detection models. Huang et al [11] proposed an effective lightweight target detection algorithm (LO-Det). The combination of channel separation aggregation (CSA) module and dynamic receptive field (DRF) module was introduced in LO-Det to optimize the speed of the algorithm while maintaining high accuracy. Li et al. [12] proposed a lightweight convolutional neural network (CNN) model for the detection of small sample data and designed a variable IoU loss function for advanced detection accuracy with guaranteed operational speed. Liu et al. [13] proposed the AFDet model, which enables a compromise between detection accuracy and speed by introducing central prediction and semantic supervision branches as well as a boundary estimation branch in the prediction head. Li et al. [14] proposed a detector based on combined MobileNet, YOLOv3, and channel attention to achieve sub real-time detection speed while maintaining superior performance. Lei et al. [15] proposed a lightweight FANet that exploits channel attention to improve the sensitivity of the model to channel information and determine the best position of the anchor box using differential evolution and established a model with one of the fastest detection speeds in the field of object detection in remote sensing images. Although these studies have achieved satisfactory results, the detection speed of partial algorithms with high detection accuracy has remained low. Indeed, some part of the model has reached a high detection speed, yet there remains potential for accuracy improvement. Some algorithms have relied on sophisticated shortcuts such as assisted training; therefore, these algorithms warrant further improvement to achieve a balance between speed and accuracy in object detection, i.e., to enhance the accuracy of real-time object detection.
In addition, we found that most remote sensing image object detectors address only one of the aspects of detection efficiency and accuracy as their main purpose. Although these detectors function well, there are flaws in these methods when considering practical application scenarios. Due to a lack of sufficient feature extraction layers, lightweight detectors have relatively low detection accuracy. There are scenarios for natural image object detection tasks that necessitate high detection efficiency. However, because application scenarios for remote sensing image object detection are primarily post-processing-oriented, greater emphasis is placed on detector accuracy rather than efficiency. Lightweight detectors have limited applications in the field of remote sensing image object detection, except for operations on Unmanned Aerial Vehicle platforms. The newly proposed detector is highly accurate on complex remote sensing image datasets. These detectors have excellent feature mapping capabilities based on sophisticated network architecture and feature enhancement strategies. Most detectors operate inefficiently due to their complex network structure and high computational load. Such detectors lose their advantages in scenarios such as battlefield intelligence analysis and disaster relief, where both efficiency and accuracy of detectors are critical. In summary, detectors capable of performing high-precision object detection tasks with great efficiency need further investigation.
This study proposes a real-time high-precision detector, AFADet, based on the single-shot detector (SSD [16]) framework to address the issues discussed above, where SSD is the classic universal object detector. First, a new adaptive feature-aware module is developed to accomplish the deep fusion of feature information with cross-scale adaptivity. Then, an object positioning module is introduced into the network structure to accurately locate the object’s position and edges. Finally, focal loss [17] is employed to ameliorate the problem of positive and negative sample imbalance and the dominant loss decline of easily classified samples in model training resulting in poor detection accuracy of hardly classified samples.
The main contributions of this study are as follows:
(1)
For the impact of complex background and inter-class similarity of remote sensing images on the object detection mission, an adaptive feature-aware module is developed. The module performed pixel-by-pixel adaptive enhancement of features using an adaptive growth matrix.
(2)
An object positioning module is introduced to detect small-scale or densely arranged objects precisely. The high-level semantic information of the deep features is used to generate a location-sensitive feature map fused with the shallow elements to accurately predict the object’s location.
(3)
An object detection model for remote sensing images with balanced accuracy and speed is proposed.

2. Related Work

In this section, we briefly delineate the current research status in the field of object detection in remote sensing images. Compared with standard images, remote sensing images pose many challenges for object detection, such as large-scale changes, complex backgrounds, and dense objects. Recently, numerous scholars have conducted extensive research to alleviate these fundamental issues.
Accurately detecting multiscale objects with large differences in appearance has always been a challenge in the field of object detection in remote sensing images. To overcome the challenge, multiscale feature fusion techniques have been widely used in object detection tasks. In a recent work, Liu et al. [18] proposed an adaptive feature pyramid network, which first aggregates multiscale features and then splits them into feature pyramids. Subsequently, adaptive feature fusion is performed between different spaces and channels using a selective refinement module; thus, the features of multiscale and dense objects can be accurately extracted by the adaptive feature pyramid network. Ye et al. [19] used a stitcher to generate images containing objects of various scales based on the distribution of objects in the dataset, thereby balancing the scales of multiscale objects. Moreover, the adaptive attention fusion mechanism proposed in this work provides another interesting fusion method. Li et al. [20] developed a backbone called CSP-Hourglass Net, which has shown potential for multiscale object feature learning by using a structure of up- and down-sampling links. In response to large-scale differences in remote sensing image objects, Ma et al. [21] created a feature split-merge strategy that distributes differently scaled objects in a scene into multilevel feature maps to mitigate feature confusion by reducing the salient features of large objects and enhancing the features of small objects. Wang et al. [22] proposed a feature reflow pyramid structure to generate high-quality feature representations for each scale by fusing fine-grained features from adjacent lower levels. The detection capability of the resultant model for multiscale and multiclass objects is thereby improved. Wu et al. [23] introduced a feature refinement module that combines different branches to convolve multiple perceptual fields, thereby improving the feature discrimination at different scales. Han et al. [24] utilized a multiscale residual block, which enhances multiscale contextual information in a cascaded residual block using dilation convolution and improves the ability of the model to represent multiscale features. Liu et al. [25] provided a powerful representation of multiscale object features by building a multireceptive field feature extraction module in feature pyramid network (FPN) [26] that can extract multiscale object features that aggregate information from multiple receptive fields. Cong et al. [27] developed an encoding-decoding network containing a parallel multiscale attention mechanism in the decoding stage, which can handle scale variations and efficiently recover detailed information on objects utilizing shallow features selected by parallel attention. To extract multiscale features and fully utilize semantic context information, Zhang et al. [28] proposed a semantic context-aware network. This network contains a receptive field enhancement module that extracts various scale features by obtaining different receptive fields with several convolutions in multiple branches. The semantic context features from the upper layer are subsequently fused with the lower layer features by a semantic context fusion module.
Remote sensing images have large fields of view and, therefore, wide imaging ranges, resulting in complex backgrounds, which currently presents a key problem for object detection. Currently, mainstream solutions include the use of attention mechanisms to highlight foreground and weaken background information. The relationship between the background and foreground has also been investigated to enhance features that are beneficial to object detection by selecting refinement strategies. The distribution of training data greatly impacts the performance of a model; thus, scholars have considered a dataset-based perspective to improve the resistance of the detector to complex backgrounds. Yu et al. [29] found significant differences in spatial distribution between close-range objects and remotely sensed objects, prompting the proposal of a spatially oriented object detector for remote sensing images. Additionally, deformable convolution has been introduced to accommodate the effects of geometric variations in objects and complex backgrounds. Zhang et al. [30] proposed a foreground refinement network (ForRDet) that contains a foreground relation module, which aggregates the foreground-context representation during the coarse stage, thereby improving the discrimination of foreground regions on the feature map for the refinement stage. Wang et al. [31] introduced a multiscale feature-focused attention module to suppress noisy features, enhance the reuse of effective features, and, moreover, improve feature representation capability for multiscale objects via multilayer convolution. Subsequently, the correlation between feature sets is improved by two-stage deep feature fusion. Liu et al. [25] proposed an object detection model based on multireceptive field features and relational connected attention, where a relational connected attention module automatically selects and refines beneficial features based on relational modeling. Bai et al. [32] proposed a time-frequency analysis object detection method for solving complex background problems. They designed a discrete wavelet multiscale attention mechanism that enables the detector to focus on the object regions. Zhu et al. [33] developed a novel object detection method based on spatial hierarchical perception components and hard sample metric learning. In this method, complex backgrounds are decoupled and constructed datasets are utilized for pretraining models. Cheng et al. [34] proposed an object and scene context-constrained object detection model for remote sensing images, in which the scene context-constrained channel uses a priori scene information and Bayesian criteria to infer the relationship between the scene and the object. Thus, the scene information is fully utilized to improve object detection.

3. Methodology

3.1. Overall Structure of Model

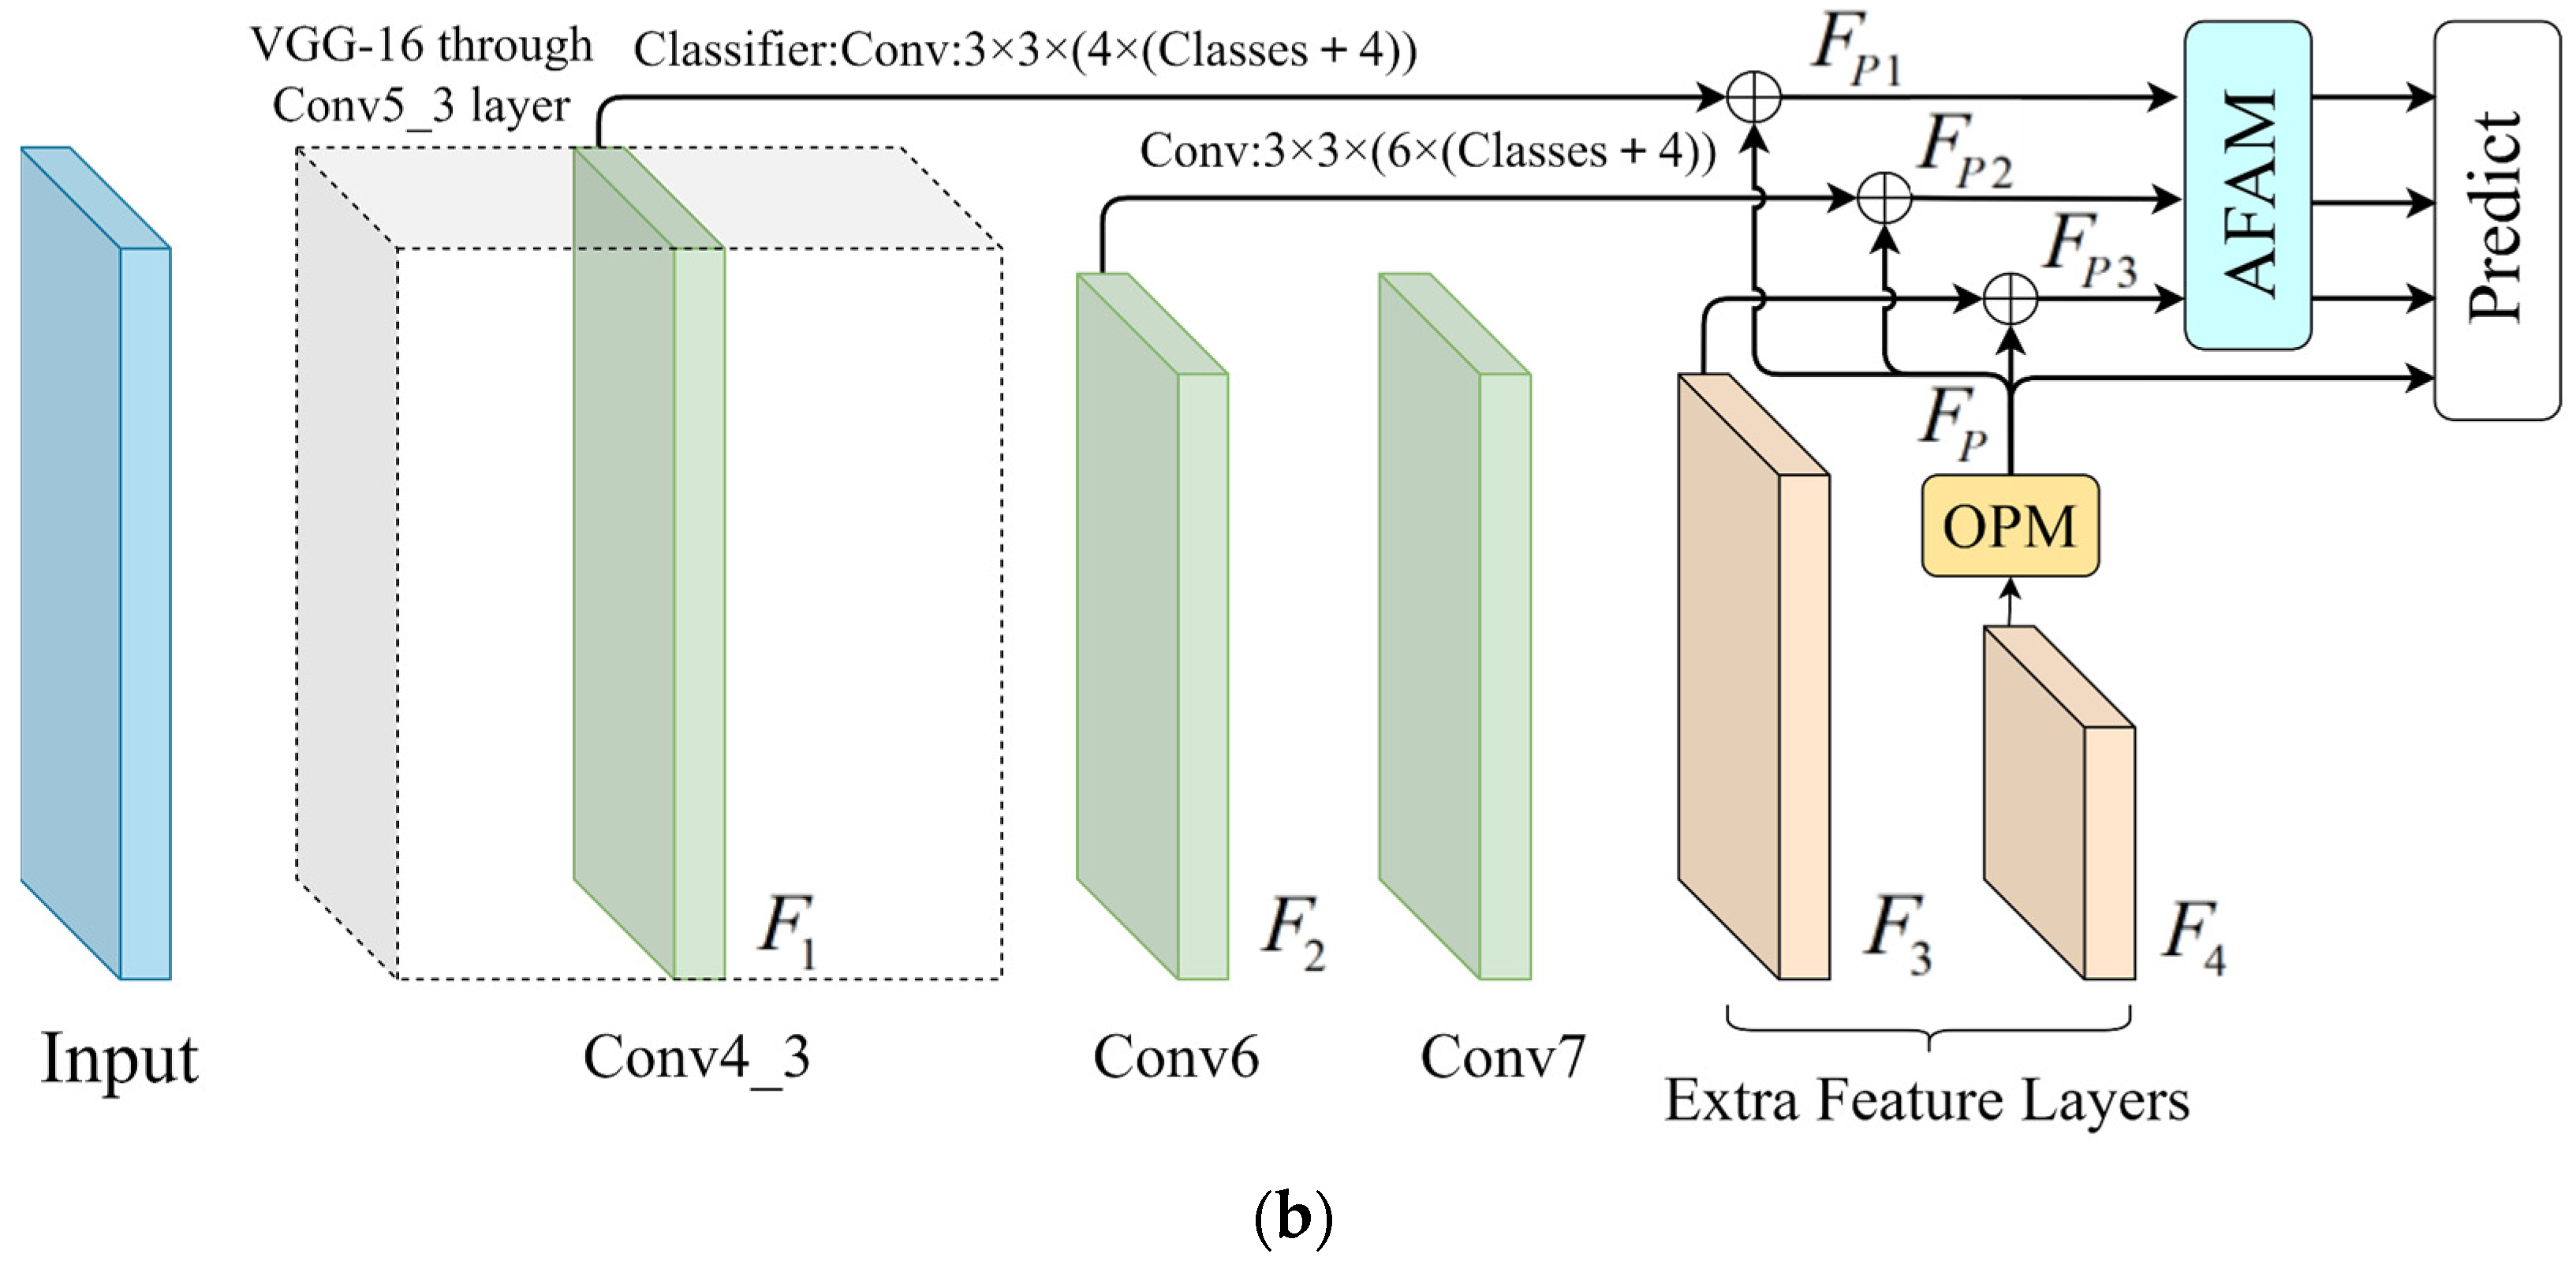
The AFADet is built on the framework of the one-stage object detection network SSD model and has an overarching structure as shown in Figure 1. Figure 1a shows the original SSD model developed with VGG-16 as the backbone network. The original SSD model uses two sets of convolutional layers instead of the fully connected layers in VGG-16 and additional four sets of convolutional layers are added to obtain a series of six groups of feature maps at different scales for object prediction. Figure 1b shows the proposed AFADet model based on the SSD, according to the relationship between the anchor and the receptive field. To reduce the computational complexity of the model and increase the speed of object detection, we remove some convolutional layers. Then, object positioning module (OPM) and the adaptive feature-aware module (AFAM) are introduced to achieve precise object positioning and adaptive depth fusion of the features.
First, the input image is subjected to the feature extraction structure to generate four sets of basic feature maps, F1–F4. Then, feature map F4 with high-level semantic information is fed into the OPM to obtain feature map Fp sensitive to the position of the object. Next, Fp is fused with F1–F3 across scales to generate feature maps FP1–FP3 containing object location information, which are input to the AFAM for additional feature enhancement. Finally, three feature maps output by the AFAM and the advanced semantic feature maps generated by the OPM are fed into the prediction head to complete the object detection.

3.2. Receptive Field Analysis and Anchor Box

In object detection, the matching of the receptive field range to the object size affects the detection performance of the model; thus, the feature maps with different receptive fields are crucial for the detection of multiscale objects. The theoretical receptive field is calculated using the following formula:
R F i = ( R F i + 1 1 ) × S i + K i
where RFi denotes the size of the receptive field in layer i, Si represents the convolution stride of the current feature layer, and Ki is the size of the convolution kernel.
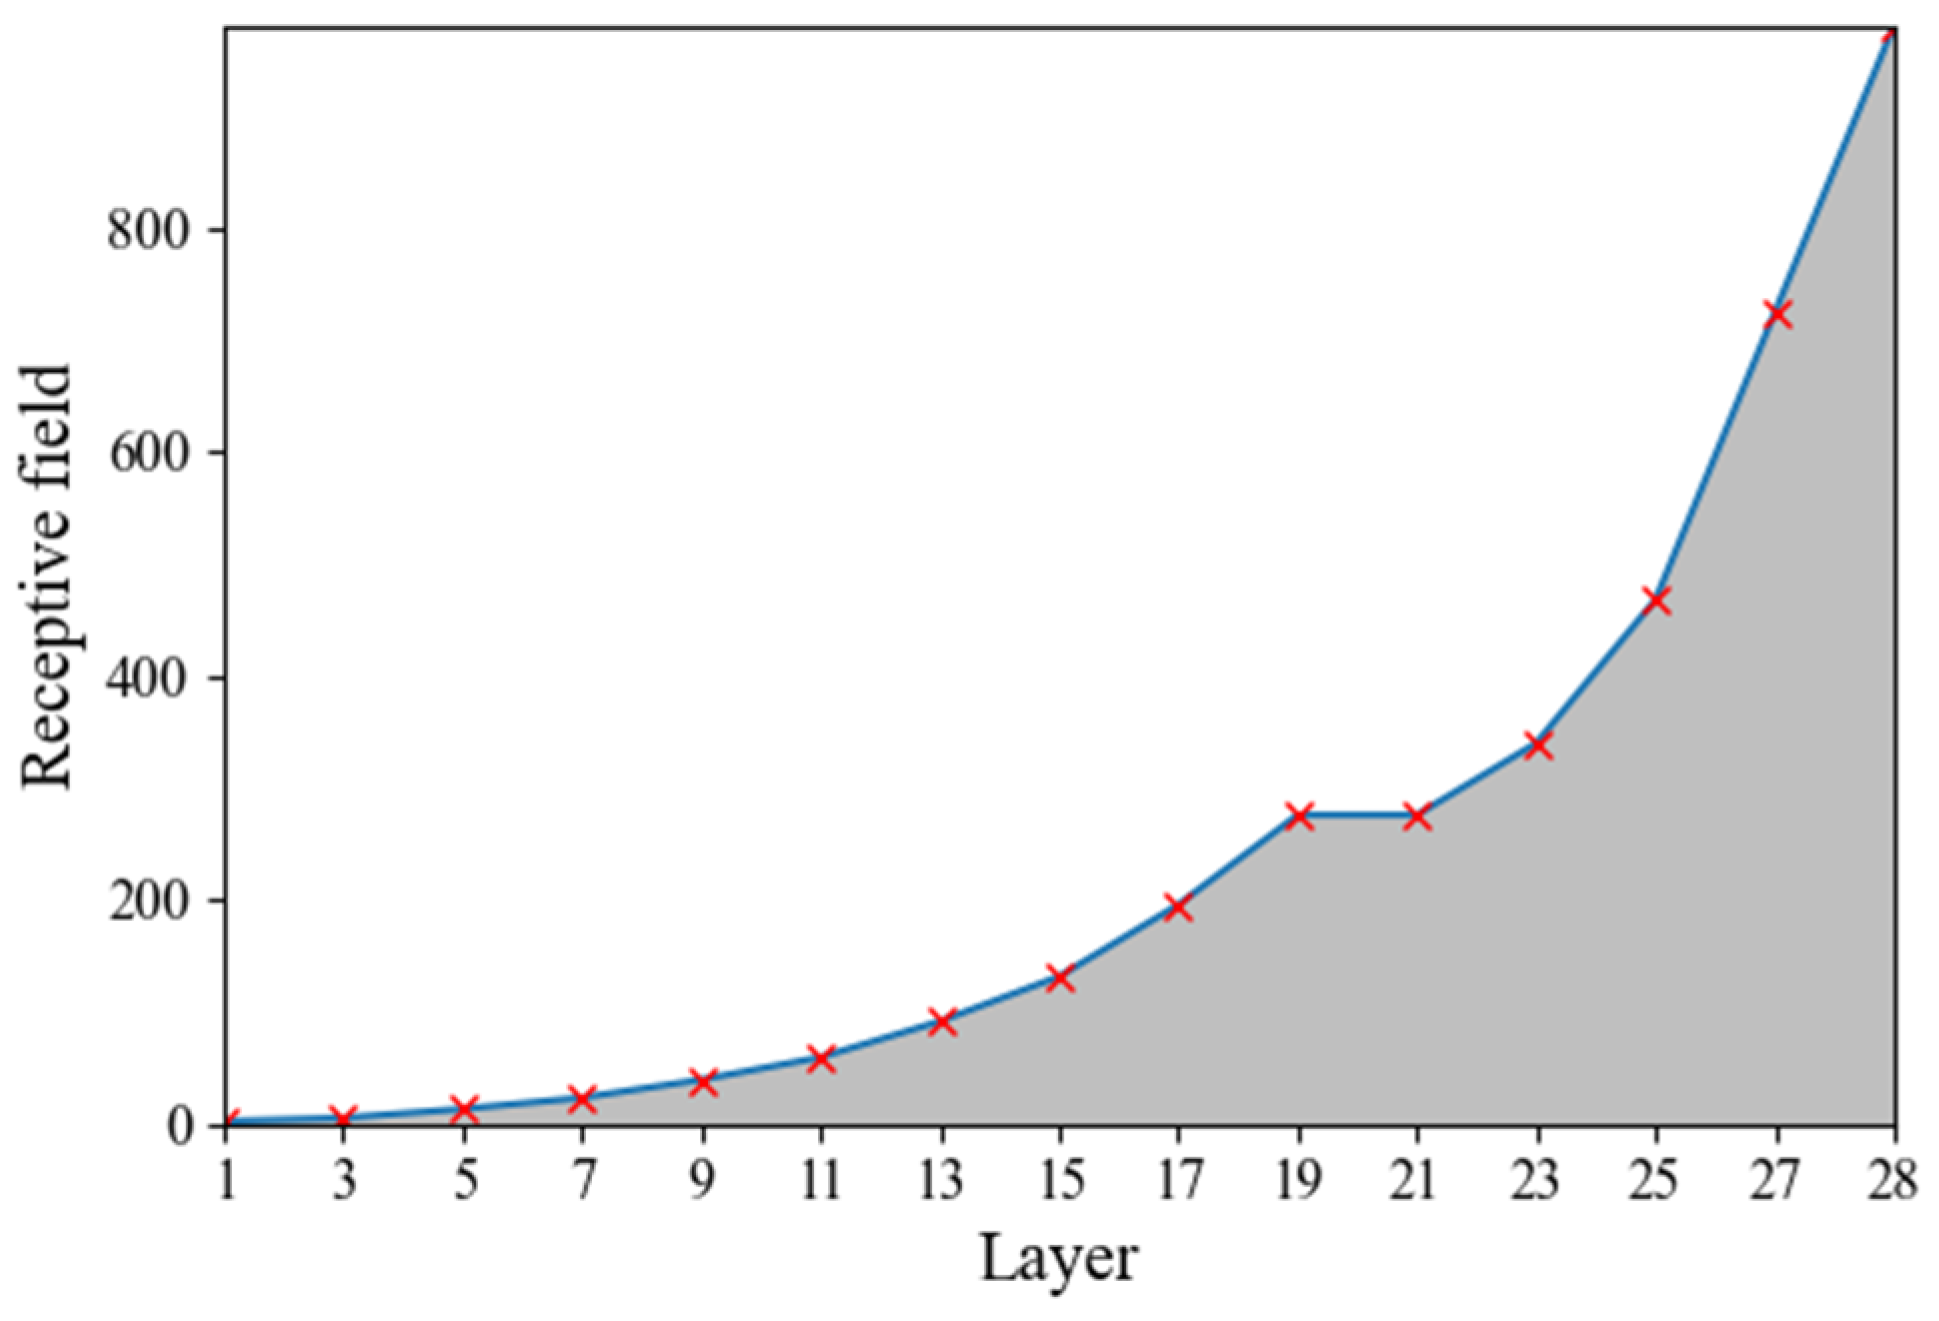
The results of calculating the receptive field size for each layer of the SSD model are shown in Figure 2. The last two additional layers of the SSD (corresponding to layers 27 and 28 in Figure 2) have theoretical receptive fields that are twice and three times larger than the original input, respectively. The anchor is normally set to match the actual receptive field size in object detection [35,36]. Based on this design experience, to reduce the computational complexity of the model, the third and fourth additional layers in the SSD model are not used.
The prediction head of the AFADet is consistent with the SSD. First, a regular prediction grid is defined on the feature map to generate cells, and then k default boxes are set at each cell on individual feature maps. Each default box is used to predict the probability of fitting into one of C categories and the offsets relative to the center point coordinates, width, and height of the truth box. Thus, for a feature map of size m × n, the predicted output of each feature map is (C + 4) × k × m × n. We set four default boxes at each cell on the first predicted feature map and six default boxes on the remaining predicted feature maps. The ratio of the default box shapes on feature maps of different scales is calculated using Equation (2):
s i z e i = s i z e min + s i z e max s i z e min m 1 ( i 1 )
where i [ 1 , m ] , m represents the number of predicted feature maps, sizemin is 0.2, and sizemax is 0.9.
The aspect ratio of each default box is a r { 1 , 2 , 1 / 2 } when four default boxes are used for each cell, and a r { 1 , 2 , 1 / 2 , 3 , 1 / 3 } when six default boxes are used. The width ( w k a ) and height ( h k a ) of each prediction box are calculated using Equation (3):
w k a = s i z e i a r
h k a = s i z e i / a r
In addition, each cell contains a square default box with scale. This design allows the default box to cover various scales and shapes of the object as much as possible to ensure the recall of the model to the object. During model training, the default boxes generated at each cell are matched with the truth box. The matching criterion is whether the IoU between the default box and the truth box is greater than the threshold, which simplifies the training process of the network.

3.3. Adaptive Feature-Aware Module

The AFAM proposed in this study considers a cross-scale feature fusion strategy to achieve the deep fusion between different scales of feature map contextual information. Unlike most feature fusion methods with equal weights between feature maps in object detection models, the proposed module implements adaptive feature fusion with an adaptive growth matrix. This strategy can help to mitigate the influence of irrelevant background information on the detection, thereby reinforcing the information weight of the beneficial features effectively.
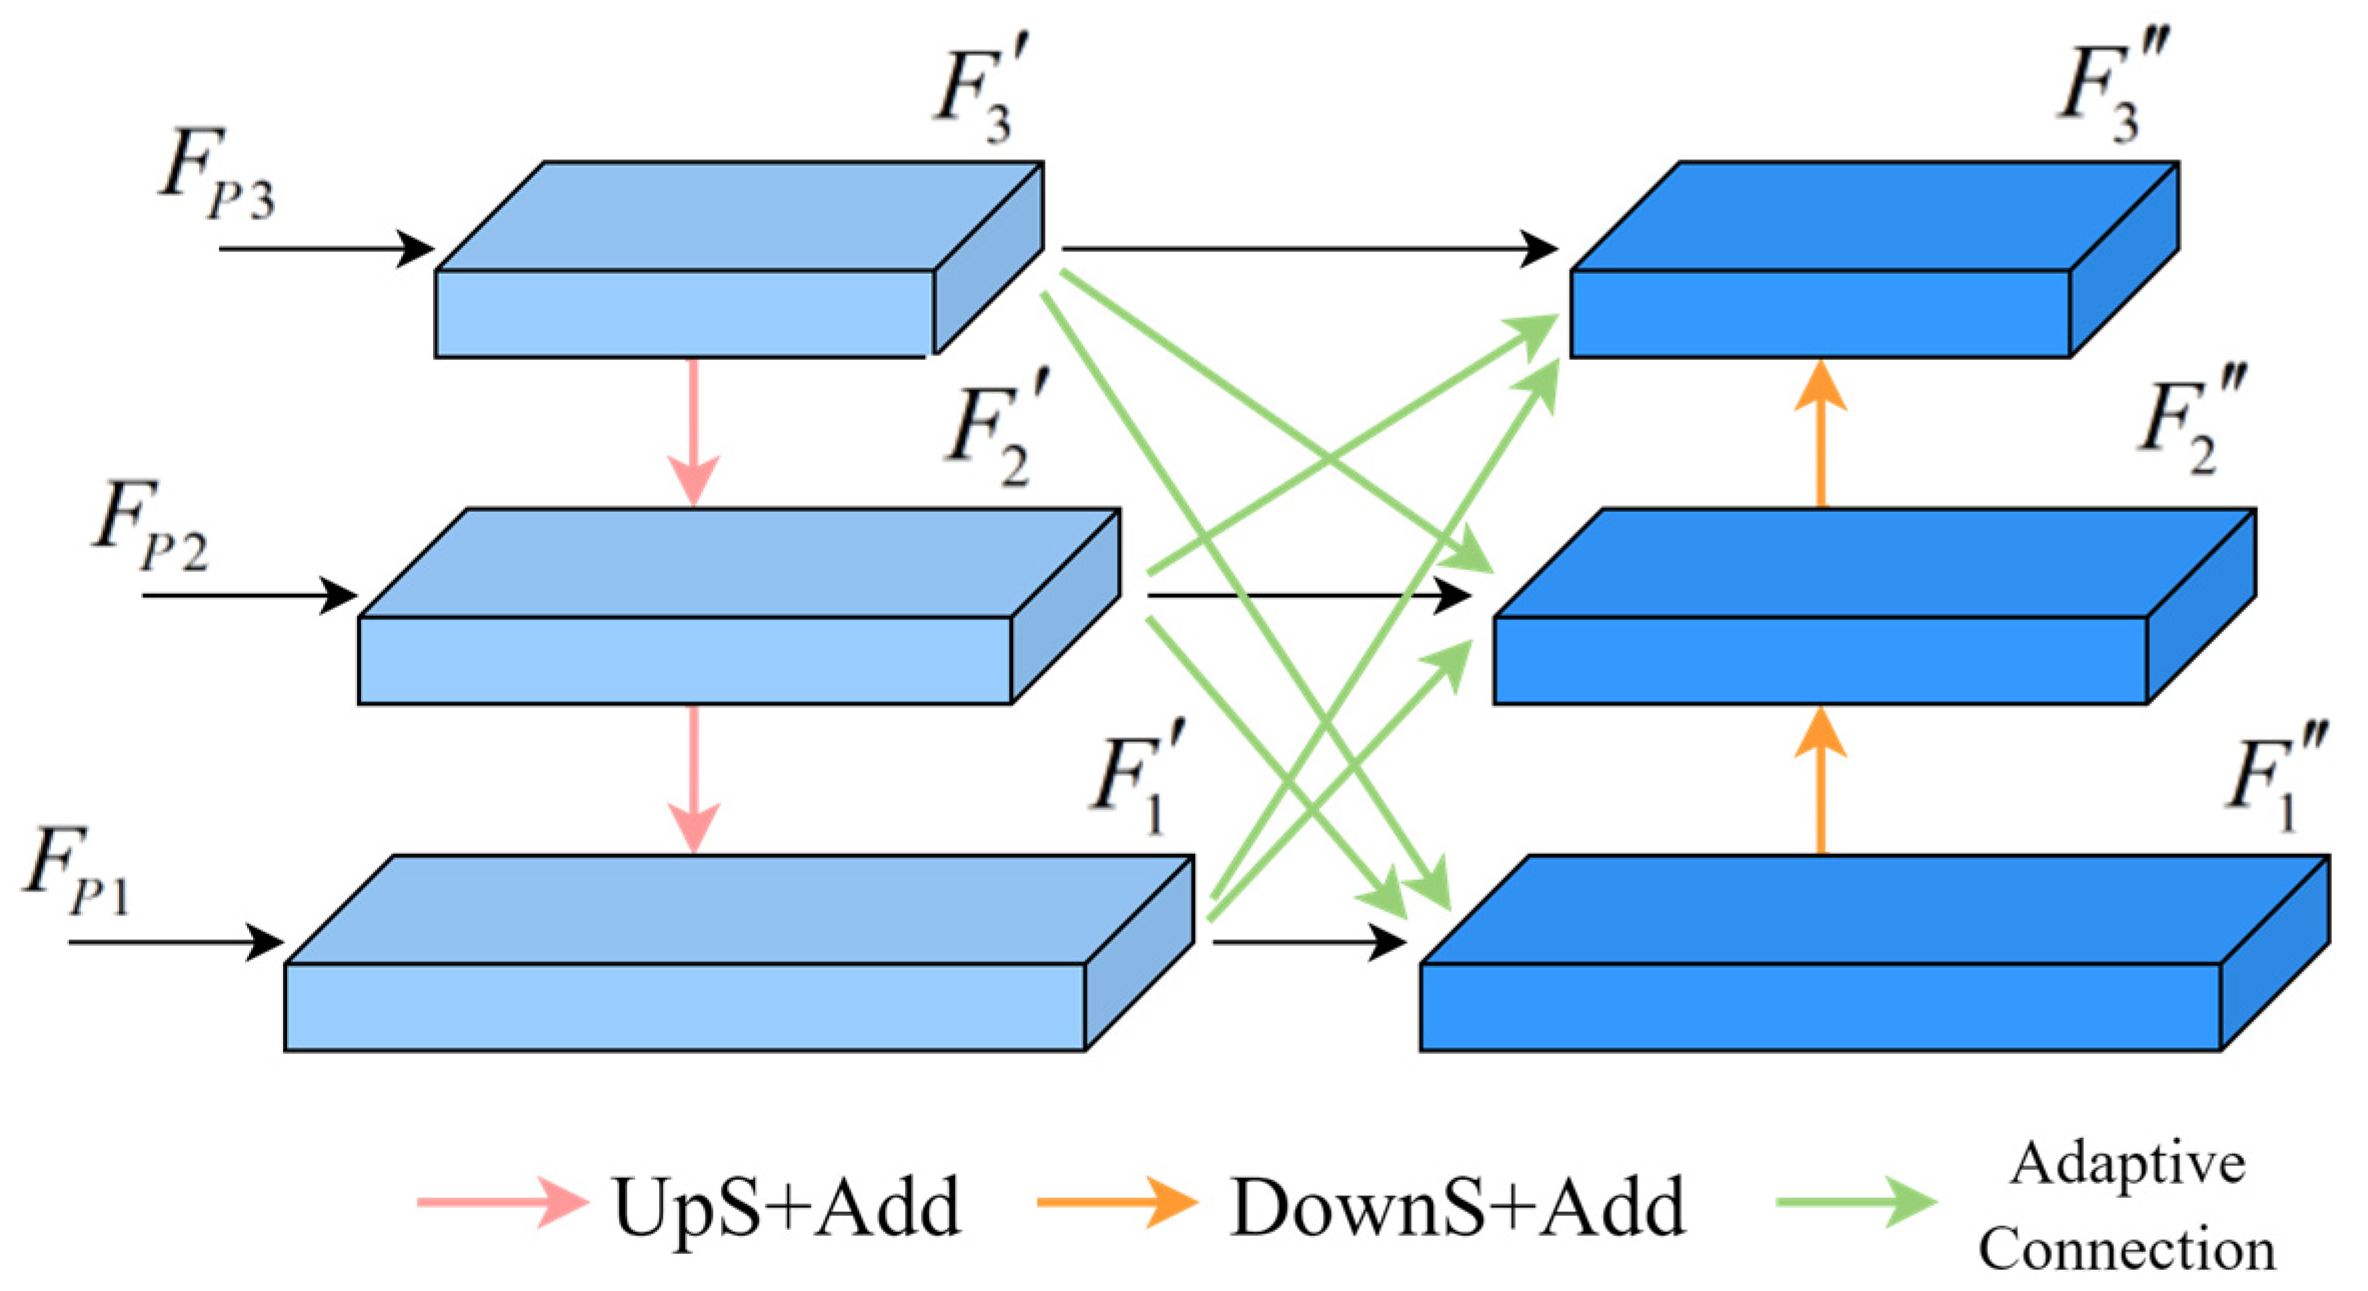
The overall structure of the proposed AFAM is shown in Figure 3. AFAM is based on the concept of feature pyramid network. This module adopts a top-down and then a bottom-up structure, employing a cross-scale feature fusion strategy between different scale feature maps to further enhance the semantic information. As shown in Figure 1b, the output feature maps from VGG-16 and spatial attention are fused to generate feature maps (FP1FP3) that include spatial position information for objects. Subsequently, as shown in Figure 3, these three feature maps are fused using a top-down strategy. The fused features are separately processed through a convolutional layer to produce the primary feature maps, thereby enhancing the model’s ability to perceive multiscale objects. Although the above operations improve feature perception of multiscale objects, the key beneficial features of the feature maps at each scale are not obtained in a direct inheritance manner; thus, the fusion of key features is still lacking. Notably, several previous studies employed equal weights for cross-scale feature fusion; however, this simple fusion cannot determine whether the features are beneficial for the object detection task. Therefore, we adopted a weighted fusion of each pixel in the feature map to extract and fuse critical information in the feature map by adaptively adjusting the weights of each pixel based on the contributions of each feature during model training. Moreover, to enhance the information detail of objects in the deep feature maps, bottom-up fusion is performed on the feature maps that have undergone cross-scale adaptive fusion. The detailed information contained in shallow feature maps is transferred to the deep feature maps to improve the perception of the boundaries of large-scale objects. As shown in Figure 3, the primary feature maps at each scale are adaptively fused across scales, and these adaptively fused feature maps are deeply fused using a bottom-up strategy. Finally, a convolutional layer is used to generate the predicted feature maps.
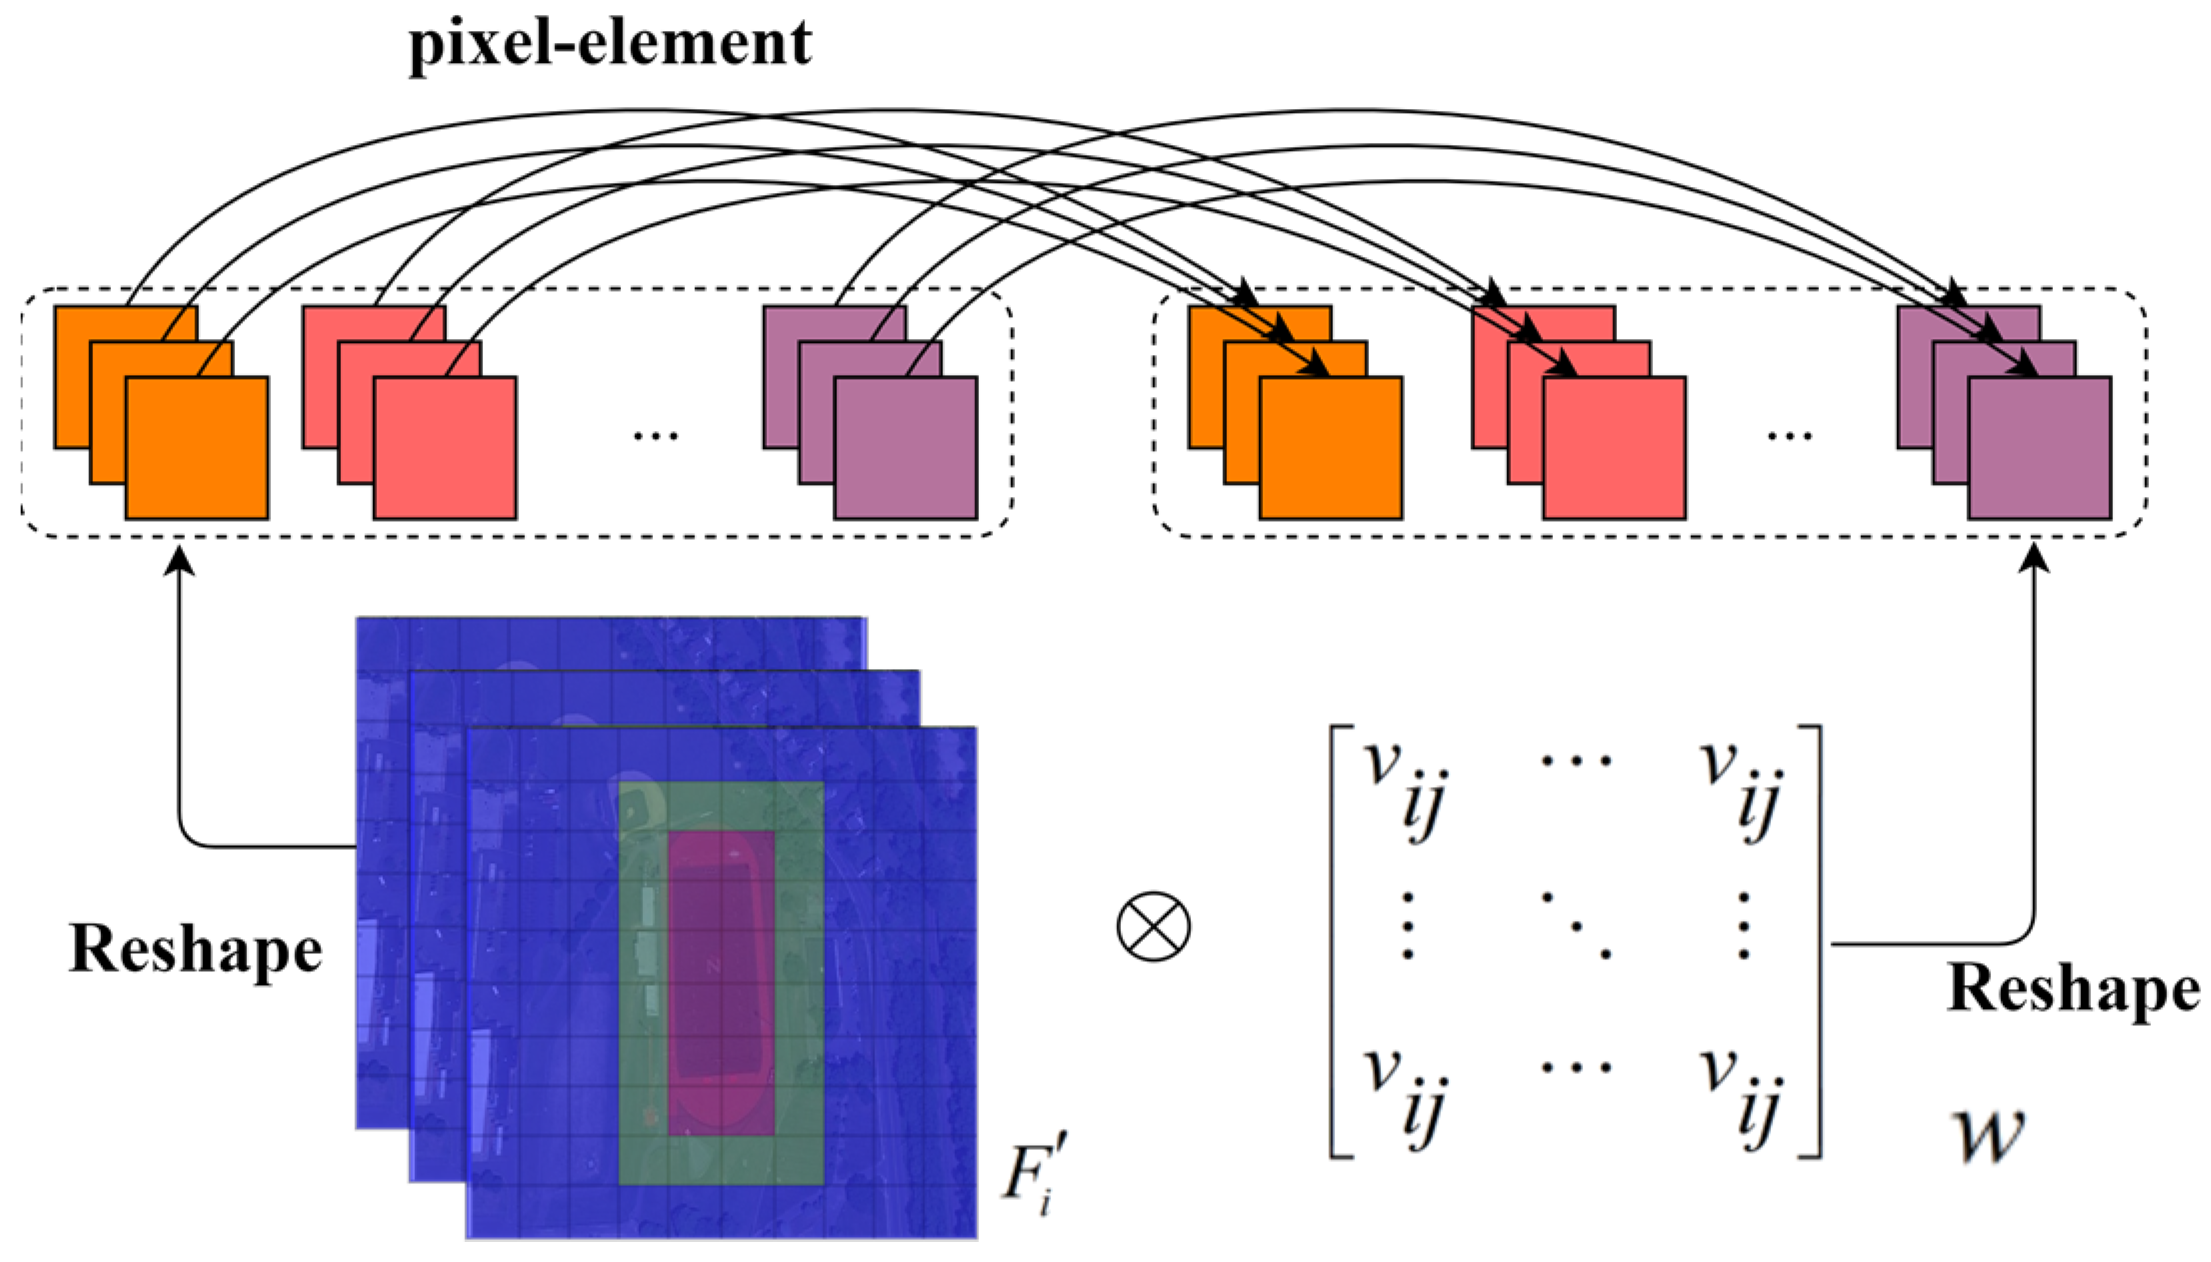
Specifically, taking the generation of F1″ feature map as an example, F1″ inherits three feature maps, F1′, F2′, and F3′, respectively. F1′ delivers the features directly to F1″, while F2′ and F3′ adaptively deliver features to F1″ in a cross-scale manner to achieve feature enhancement. The computational process of cross-scale connectivity is shown in Figure 4. The identical-scale feature map is multiplied pixel-by-pixel by the adaptive growth matrix w and then summed with F1′ in the spatial dimension to generate F1″. The width and height (w, h) are the same as the size of F1′, while each element is initialized to 1. The adaptive growth matrix is continuously updated during model training to achieve adaptive weighted enhancement of the spatial features. The process can be expressed as follows:
F 1 = F 1 + [ v i j v i j v i j v i j ] × F 2 + [ v i j v i j v i j v i j ] × F 3
F1′, F2′, and F3′ are formed by a common process, and three deeply fused feature maps are produced as subsequent predicted features.
Benefits from the above design are as follows. The AFAM implements the cross-scale pixel-by-pixel adaptive deep fusion of multiscale feature maps. The adaptive feature enhancement strategy weakens the background information, and the beneficial features of the objects are effectively enhanced.

3.4. Object Positioning Module

The ability of the model to determine the spatial location of the object is particularly important in the object detection task. To improve the sensitivity of the model to object location and recall performance, this study introduces the positioning module (PM) in PFNet proposed by Mei et al. [37]. PM consists of channel self-attention and spatial self-attention, which help to obtain deep-level features of semantic enhancement from a global perspective. Spatial self-attention is critical for object localization. Considering the model complexity, AFADet utilizes only spatial self-attention in the PM to construct the OPM.
In general, the deeper the network structure, the more abstract the extracted features are and the more accurately they reflect the spatial location of the object. Accordingly, the last layer of abstract features generated from the backbone network becomes the input to the OPM. After spatial attention, the output feature maps are more sensitive to the spatial location of the objects, and the images can be divided into distinct regions based on their contribution to the detection task. As shown in Figure 1b, the feature maps produced by OPM are fused with the F1, F2, and F3 produced by VGG-16 in spatial dimensions to generate FP1, FP2, and FP3 containing object spatial location information.
The structure of the OPM is shown in Figure 5. First, the input feature map F4 is fed through a 1 × 1 convolution layer, and then the shape of the output is changed to create the three feature matrices Q, K, and V in the self-attention operation. Next, matrix multiplication is performed between the transpose of Q and K to obtain the attention matrix and execute the softmax function to normalize the spatial attention feature map X.
X i j = exp ( Q : i · K : j ) j = 1 N exp ( Q : i · K : j )
where Qi represents the ith column of matrix Q and Xij denotes the attention weight at position i , j . Then, the transpose of the global attentional feature map X with V is taken for matrix multiplication and the shape of the result is changed into C × H × W to obtain the output of self-attention. Finally, a ratio parameter γ is imported to fuse the output of self-attention with input feature F4 in the spatial dimension, and the final output of the OPM is obtained after a layer with a convolutional kernel of 7 × 7:
F : i = C o n v ( γ j = 1 N ( V : j X j i ) + F : i )
In this study, the location feature maps generated by the OPM are separately fused with shallow features (F1–F3) to achieve the supervision of the objective location. The introduction of OPM improved the capability of the model to localize the spatial location of the object of interest.

3.5. Loss Function

The total loss of AFADet is composed of position loss and confidence loss (Equation (7)).
L ( x , c , l , g ) = 1 N ( L c o n f ( x , c ) + β L l o c ( x , l , g ) )
where N represents the number of matching default boxes. When N is 0, the loss is directly 0. β is taken as 1 by cross-validation. The object localization loss is used to calculate the error between the prediction box and the true box, which calculates the offset of the center, width, and height of the default box from the true value via the smooth L1 loss function, and the localization loss is calculated as follows:
L l o c = i P o c N m { c x , c y , w , h } x i j k s m o o t h L 1 ( l i m g ^ j m )
where x i j k denotes whether the ith prediction box matches the jth true box for the category, and it is 1 when the prediction box is a positive sample, and 0 otherwise. l i m represents the value of the center, width, and height of the predicted box. g ^ j m represents the value of the center, width, and height of the truth box after coding (Equations (9) and (10)).
g ^ j c x = ( g j c x d i c x ) / d i w g ^ j c y = ( g j c y d i c y ) / d i h
g ^ j w = log ( g j w d i w ) g ^ j h = log ( g j h d i h )
where g represents the truth box and d represents the default box.
Lin et al. [17] reported that one-stage object detection models have severe category imbalance during the training process, which poses two problems: (1) inefficient model training, with useless or easily classifiable background information dominating the gradient; (2) negative samples that can drive the training process and lead to model degradation.
Therefore, the confidence loss in this study adopts the focal loss function, which introduces the adjustment factor ( 1 P t ) γ based on the balanced cross-entropy loss, with γ as the focusing parameter. The formula for calculating the focal loss is shown below:
L c o n f = F L ( P t ) = ( 1 P t ) γ log ( p t )
where P t denotes the probability that the sample is positive. Equation (11) possesses the following properties: (1) when there are misclassified samples and P t is small, the adjustment factor approaches 1 and the loss value is not affected. When P t 1 , the adjustment factor tends to be 0, and easily classifiable samples contribute less weight to the loss. (2) The focusing parameter can smoothly reduce the rate of easily classifiable sample weights. The formula for the focal loss after considering the balance of positive and negative samples is as follows:
L c o n f = F L ( P t ) = α ( 1 P t ) γ log ( p t )
The weight of the positive and negative samples’ contribution to the loss is controlled by the value of α .
The focal loss effectively corrects the class imbalance problem of the one-stage object detection method in terms of both positive and negative sample proportions and difficulty of sample classification.

4. Experimental Data and Evaluation Metrics

4.1. Datasets

To verify the validity of the model developed in this study, experiments are conducted on three widely used publicly available datasets. The NWPU VHR-10 dataset [38] contains 10 common categories and 650 images with completed annotation. The original data are randomly divided into training, validation, and testing sets at the ratio of 6:2:2. Since this division rule ignores the number of instances included in the sample, the data ratio and the distribution of data samples are not adjusted following the initial division in these experiments.
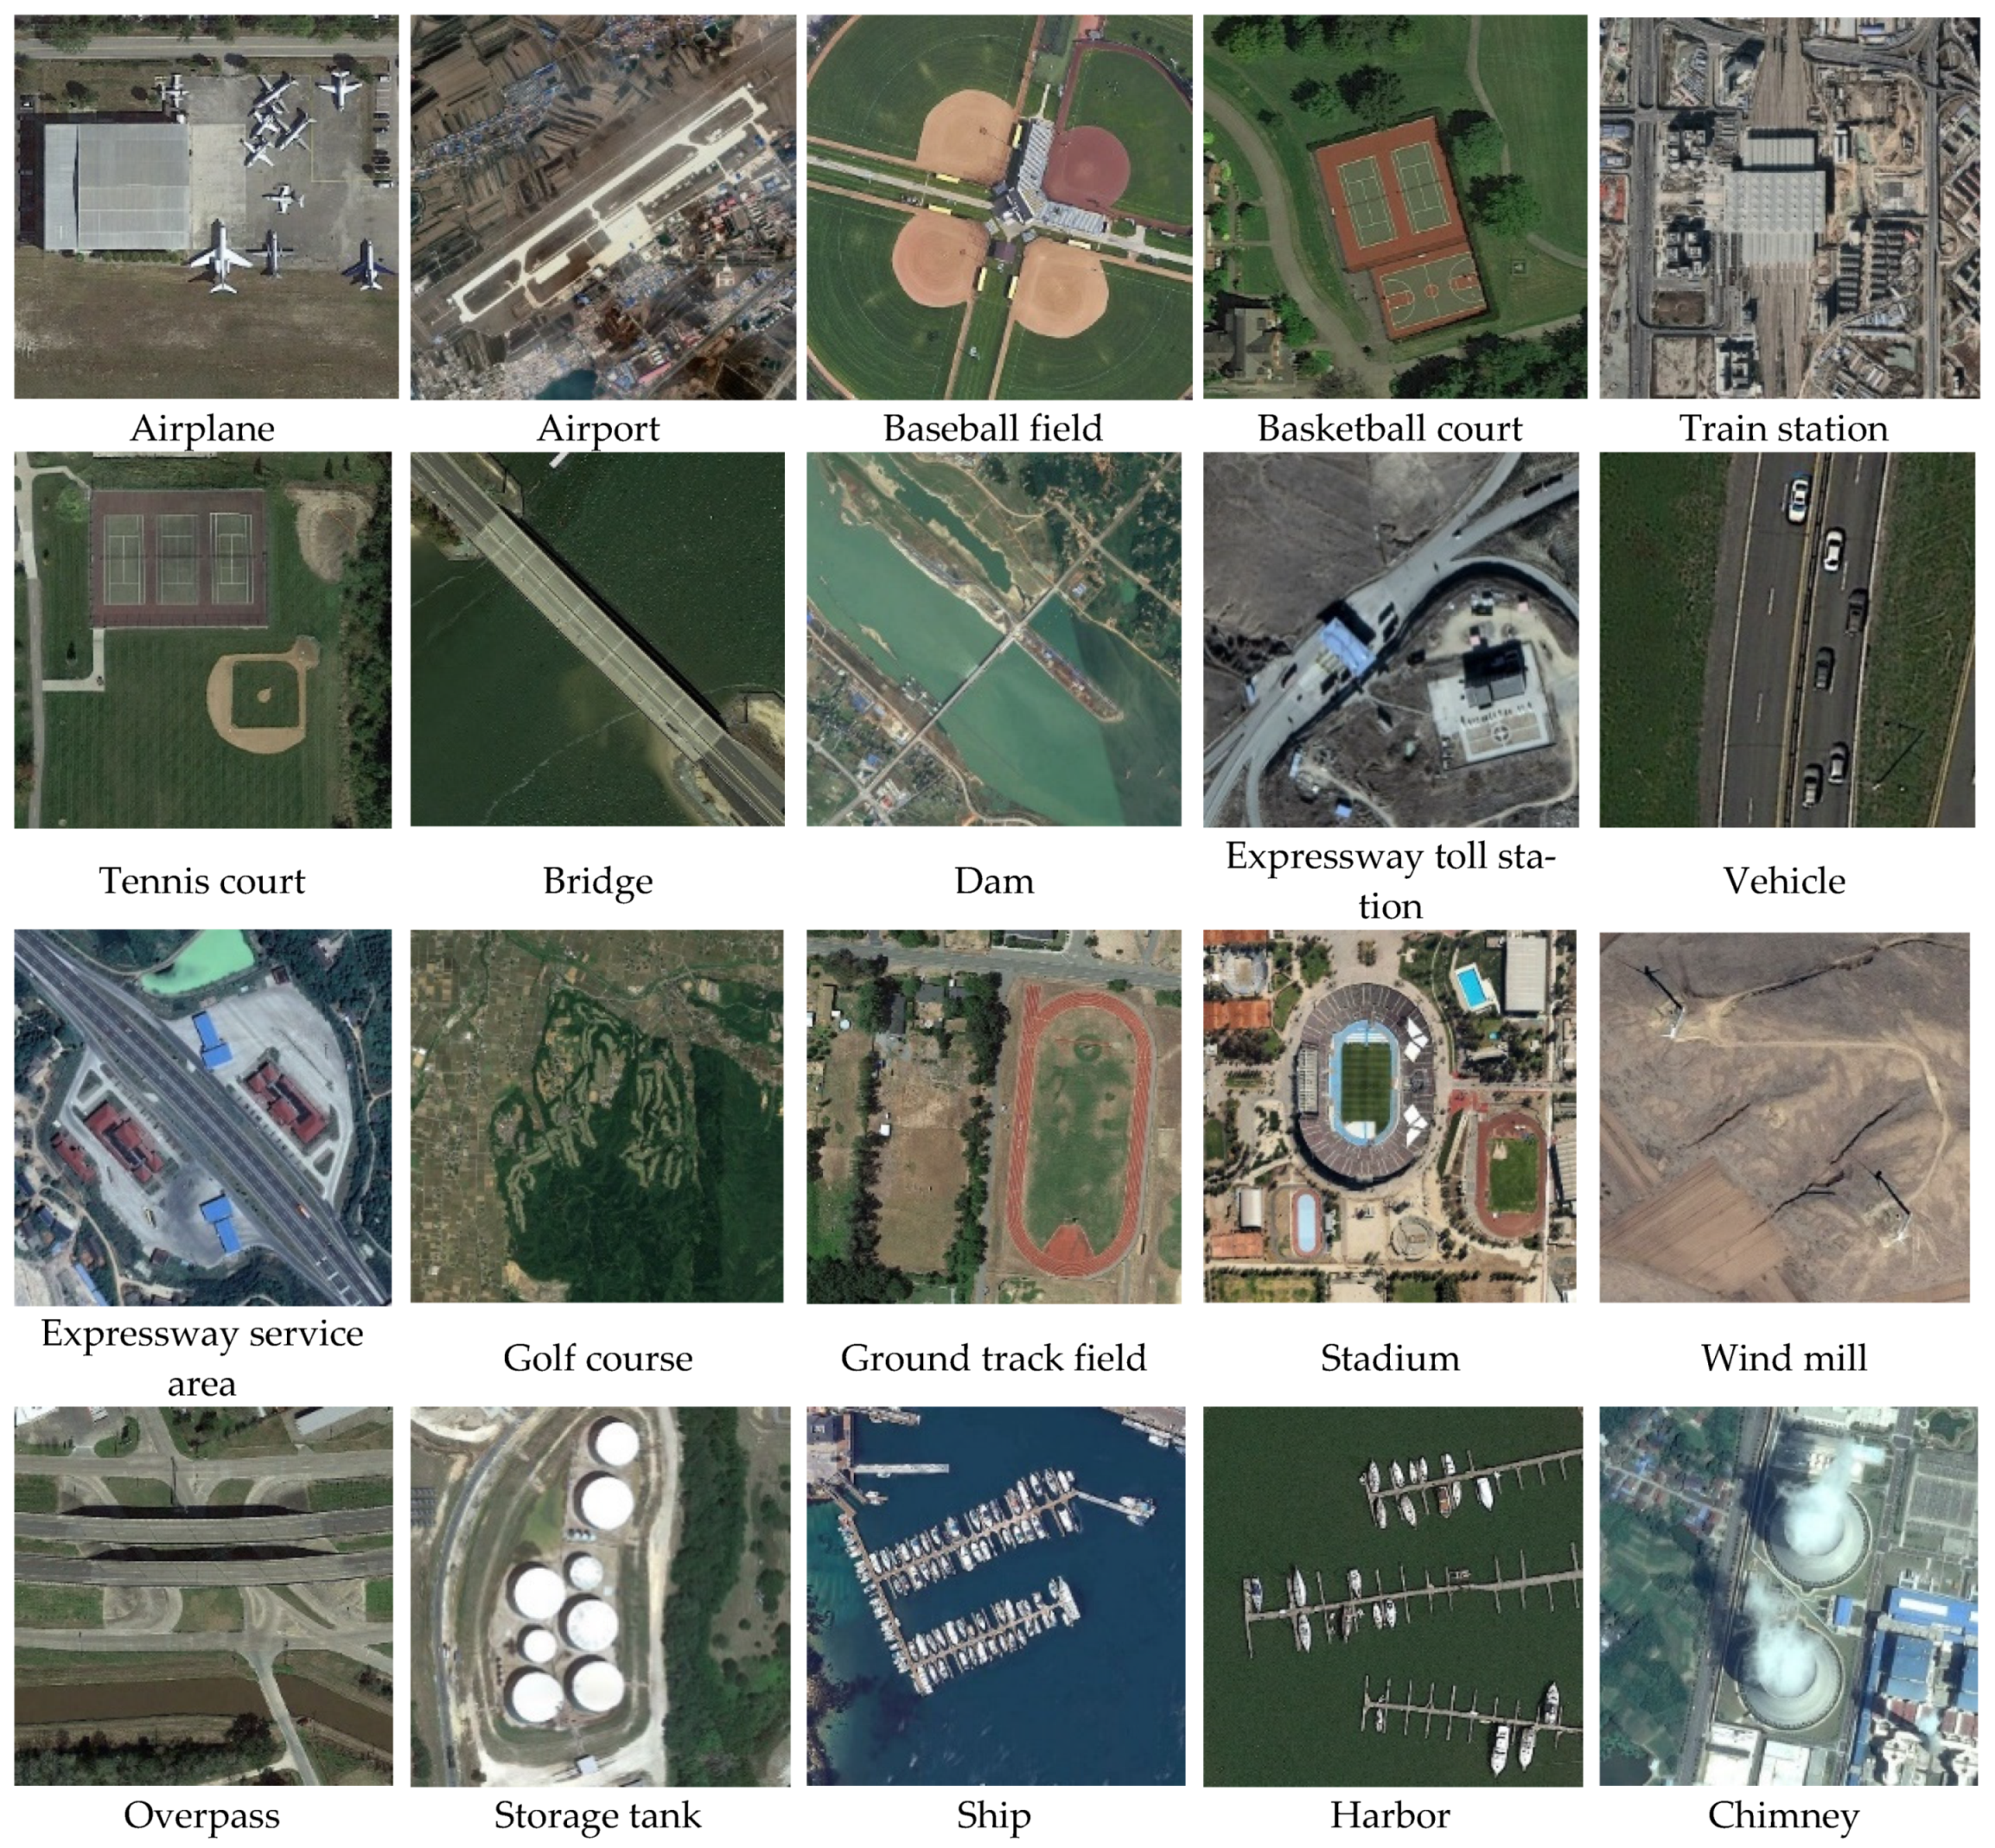
The DIOR dataset [39] is one of the largest datasets in the field of object detection in remote sensing images, and contains 20 common categories, namely airplane, airport, baseball field, basketball court, bridge, chimney, dam, expressway service area, expressway toll station, harbor, golf course, grounds track field, overpass, ship, stadium, oil tank, tennis court, train station, vehicle, and wind mill. The dataset contains 23,463 images, where the training set contains 5862 images, the validation set contains 5863 images, and the testing set has 11,738 images. Since this dataset is characterized by inter-class similarity and high variations in features between the objects in the same class, it is a challenging dataset for object detection in remote sensing images with high computational demand. An example of each category is shown in Figure 6.
The RSOD dataset [40,41] contains 4 categories and 446 images of aircraft with 4993 instances, 189 images containing playground, 165 images of oil tanks with 1586 instances present, and finally 176 images of overpass containing 180 objects. The dataset is divided into the training, validation, and testing sets at a ratio of 6:2:2.

4.2. Evaluation Metrics

We adopted the three commonly used metrics for evaluating the accuracy of object detection models, i.e., precision, recall, and mean average precision (mAP). Precision is defined as the ratio of the number of correctly detected objects to all results detected by the model on the entire test dataset. Recall reflects the proportion of accurately detected targets to those in the test dataset and measures the false detection of correct objects in the dataset using the detector. Precision and recall are calculated as follows:
P r e c i s i o n = T P T P + F P
R e c a l l = T P T P + F N
where TP represents the number of samples correctly classified as positive, FN is the number of samples incorrectly classified as negative, and FP denotes the number of samples incorrectly classified as positive.
mAP represents the average of all categories of AP (average precision), and the AP of each category is calculated as the area under the precision-recall (PR) curve:
A P i = 0 1 P i ( R i ) d R i = k = 0 n P i ( k ) Δ R i ( k )
m A P = 1 C c = 1 c A P i

4.3. Training

All experiments are built on the PyTorch framework and the data are trained on NVIDIA RTX 2080Ti. In the model training process, online data enhancement methods are used in this work. The detailed enhancement methods include scaling, warping, and color space transformation. The relevant parameters for training are set as follows: the pretraining weights of the VGG16 network are selected as the initial values of the network parameters; the initial value of the learning rate is 0.01, the decay of the learning rate is executed using the cosine annealing function, and a total of 300 epochs are operated. The Adam optimizer is applied to train the model.

5. Experiment and Analysis

5.1. Quantitative Accuracy Analysis

To verify the feasibility of the AFADet model, we conducted experiments on two remote sensing image datasets, DIOR and RSOD. The results for the DIOR dataset are presented in Table 1. After several experimental validations, the model achieves an advanced performance with 66.12% mAP. Table 1 shows that the classical general object detection model cannot achieve satisfactory results when tackling the more challenging multiclass massive remote sensing image datasets. In particular, the Faster-RCNN [42] misses the multiscale fusion strategy. Thus, it is less effective in detecting small-scale objects than the other models. The one-stage detection models such as SSD, YOLOv4-Tiny [43], and YOLOv3 [44] consider multiscale prediction but lack effective feature enhancement methods for remote sensing images; thus, the results are still poor.
The recently proposed lightweight detection models such as FANet, ASSD-lite, and LO-Det designed for object detection in remote sensing images obtain a relative balance between detection accuracy and speed. Table 1 shows that AFADet is superior to the above three models in terms of detection accuracy. Compared with the recently proposed high-precision detector (CF2PN, CSFF), AFADet shows no advantage in accuracy but achieves a substantial lead in inference speed. In recent years, anchor-free detectors have been widely explored. Since the anchor-free detectors require the generation of prediction boxes with fixed scale and proportion, they have some limitations in classification and localization. In Table 1, compared to the commonly used anchor-free detectors, AFADet has superior detection accuracy.
A comprehensive analysis is performed using the latest advanced models in terms of accuracy and speed. Table 2 shows that CF2PN and CSFF have the highest detection accuracy but lower detection speed, thus it is difficult to deploy the edge device with limited computing power. In comparison, LO-Det, FANet, and AFADet-300 achieved a greater advantage in terms of detection speed, but all have ordinary performance for detection accuracy. Compared with the simple-CNN, designed for small-sample data, AFADet achieves a significant lead in detection speed; since this model was selected from the DIOR dataset of 900 images for the experiment, it cannot be objectively compared in terms of accuracy. From Table 2, we can see that AFADet accomplishes real-time detection speed while maintaining high detection accuracy, thus achieving a favorable balance between detection accuracy and speed.
To verify the generality of the proposed model in object detection in remote sensing images more comprehensively, experiments are conducted on the commonly used RSOD dataset. Table 3 indicates that AFADet achieves advanced detection accuracy among other recent methods. As shown in Table 3, the detection accuracy of the aircraft confirms that for objects with detailed geometric information, the size of the image input has a large impact on the detection performance of the model. The impact on objects with a single appearance is relatively small, which is consistent with human visual habits. In conclusion, the experimental results of AFADet on ROSD obtain similar conclusions as those of DIOR. Even AFADet-300 can achieve advanced detection accuracy.
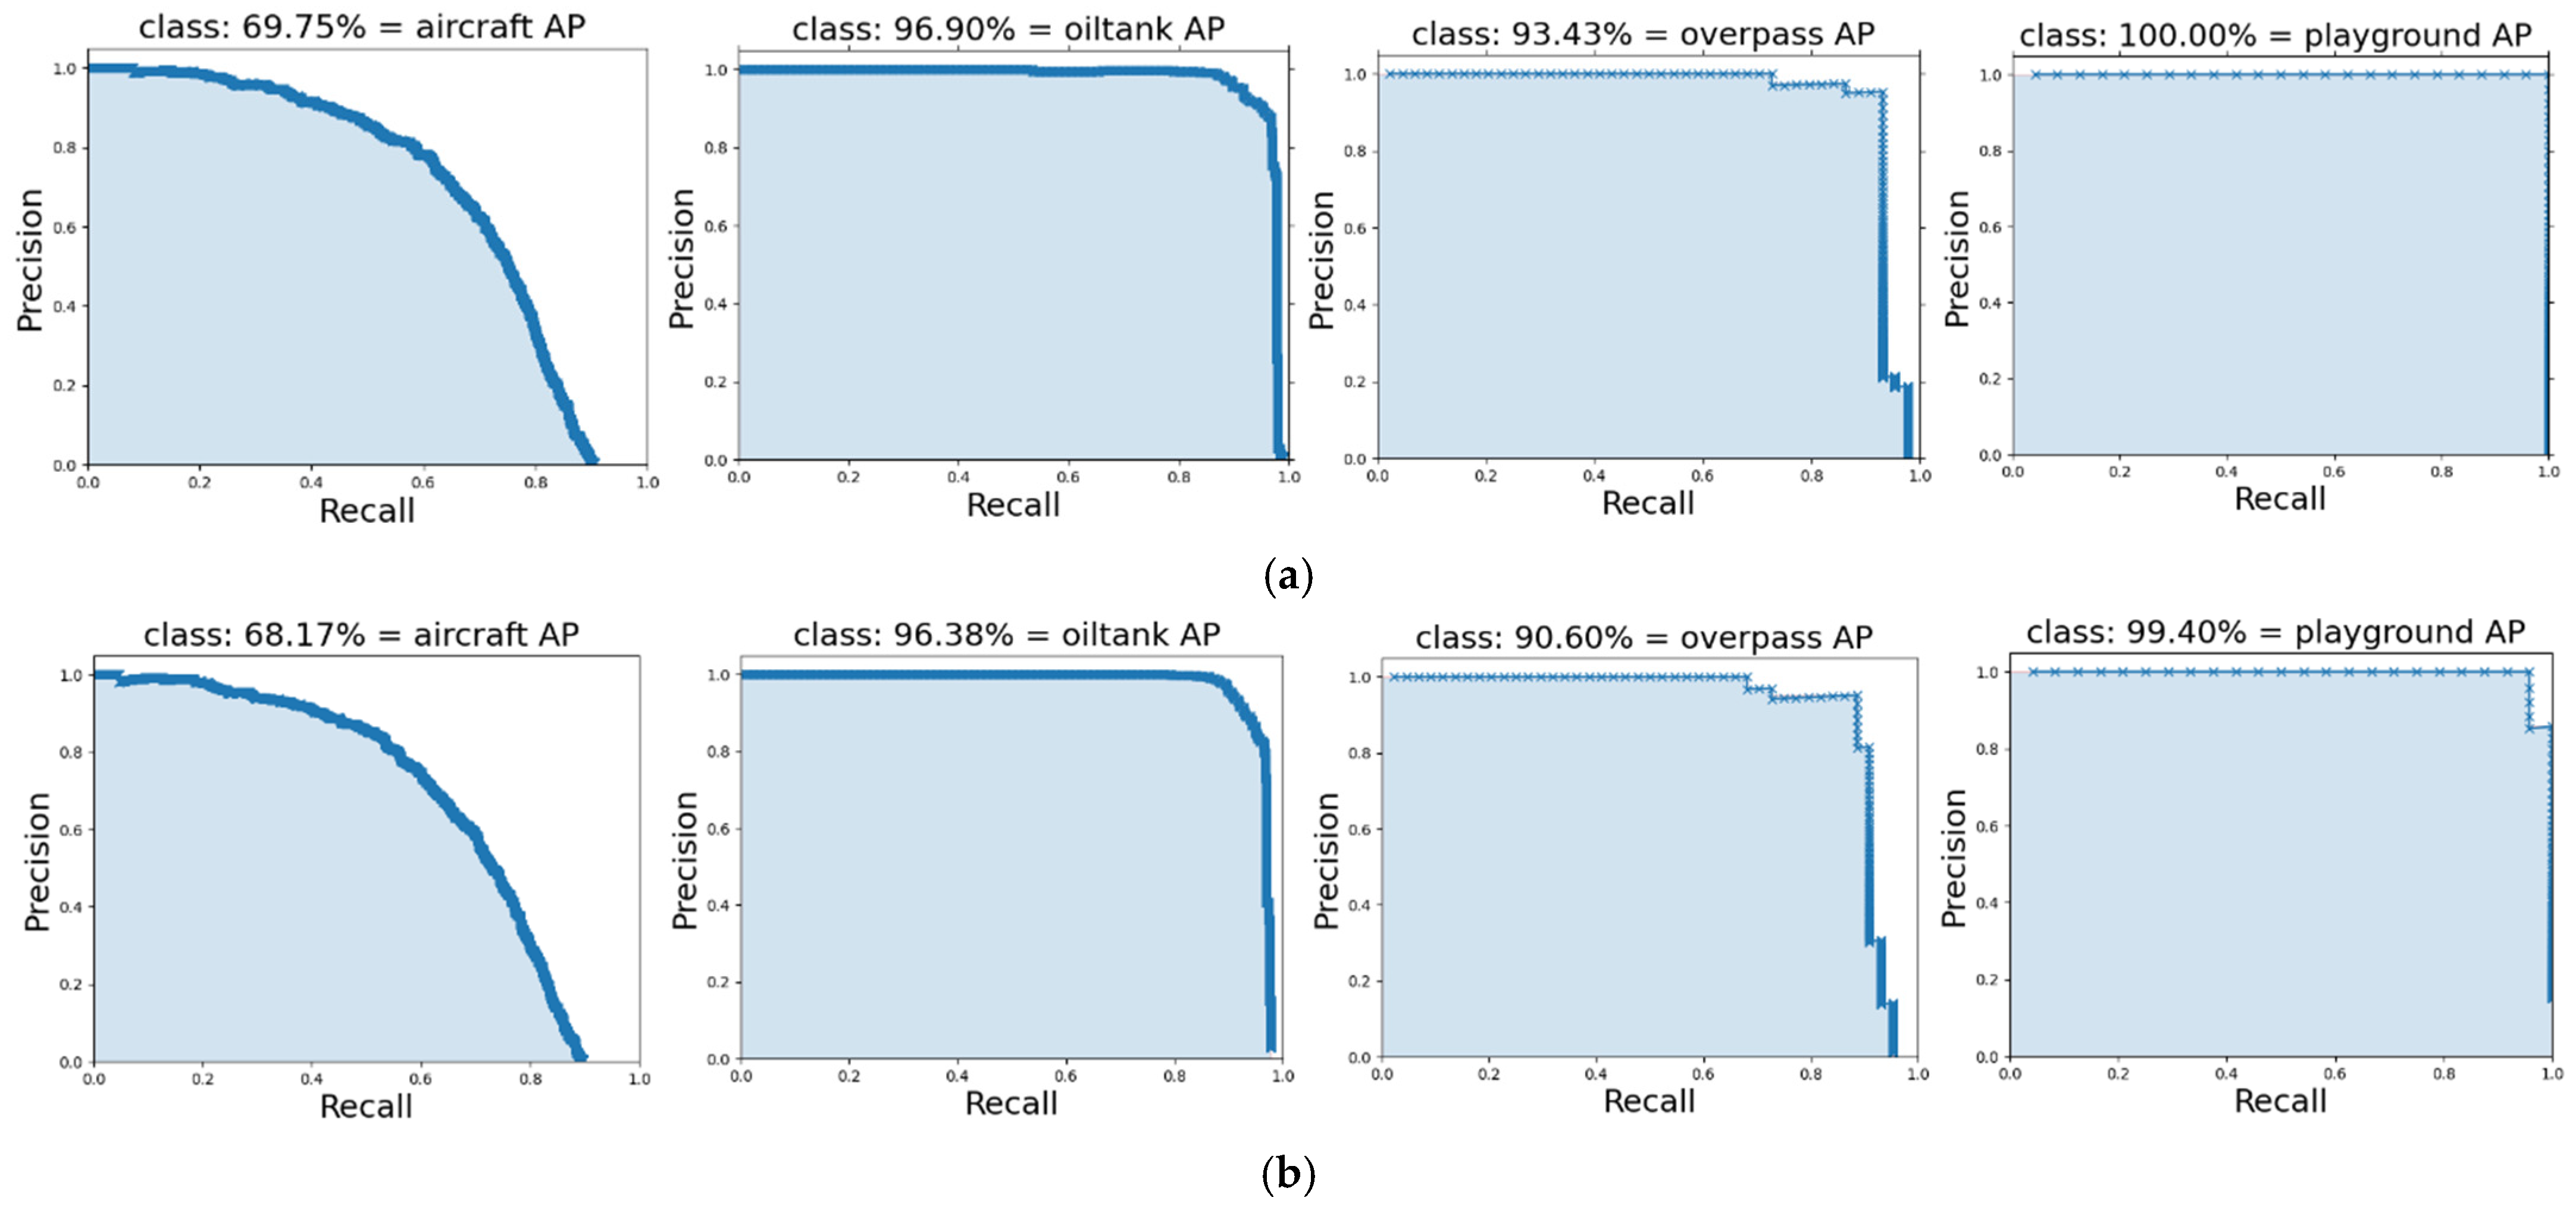
Comprehensive analysis in terms of detection accuracy and speed verifies the effectiveness of AFADet, which suggests that it may be applicable to real application scenarios. Figure 7 shows the visualization results of the PR curves of AFADet and SSD for each category in the RSOD dataset. The detection performance of each category is positively correlated with the area of the blue region. Figure 7 demonstrates that the accuracy of AFADet-300 is better than that of SSD at the same recall rate.

5.2. Ablation Experiments

To demonstrate the effectiveness of the modules, four sets of ablation experiments were performed on the NWPU VHR-10 dataset. The SSD* model is applied as the baseline method, and each module is joined to the network architecture individually for performance evaluation on the basis of the baseline model. The experimental results are listed in Table 4, where SSD* refers to the model after dropping the last two prediction feature layers in the original SSD model.
Table 4 shows that the focal loss increases the mAP from 78.36% to 79.13% (SSD* + FL), which illustrates that the focal loss is effective in solving the positive and negative sample imbalance problem and easily classified samples have an impact on training. The AFAM increases the mAP from 79.13 to 83.87% (4.74% increase by SSD* + FL + AFAM). The mAP of the model is improved by 2.57% after adding the OPM module to the architecture (i.e., SSD* + FL + AFAM + OPM). This suggests that AFAM can effectively improve the effect of multiscale feature fusion. The object positioning module based on the self-attention operation also improves the response of the model to the object position.
Table 4 shows that AFAM significantly enhances several categories, such as harbors, ships, tennis courts, basketball courts, vehicles, and bridges. Harbors and ships appear simultaneously in the temporal and spatial dimensions; the AFAM is capable of effectively augmenting the features of both categories and improving the accuracy for localization. There is a slight discrepancy between the appearance of tennis courts and basketball courts; AFAM is effective in improving the detection accuracy as it learnt the subtle features of the objects by adaptive feature enhancement. In addition, the improvement of vehicles accuracy demonstrates that AFAM is equally effective for the detection of small objects. Notably, the sparse texture and geometric features of the bridges are hardly trained, but AFAM boosts its mAP by 5.66% through effective feature enhancement strategy. However, the accuracy of oil tanks is substantially reduced after adding AFAM. We speculate that it is because the oil tanks are neatly arranged and the pixel-by-pixel adaptive enhancement strategy causes the model to be dominated by other arbitrarily distributed classes during the training process, thus causing a decrease in oil tank accuracy.
The introduction of the OPM module is also crucial to the performance improvement of the model. The detection of small-scale objects such as storage tanks, ships, vehicles, and bridges, which are densely distributed, is significantly improved.
To verify the generalization of the model, ablation experiments are also performed on the complex DIOR dataset, and the results are shown in Table 5. It can be seen from the table that the overall accuracy is significantly improved after the introduction of AFAM. For example, objects such as airports, bridges, dams, golf courses, and railway stations have various appearances and are severely disturbed by the background. However, their detection accuracy has been greatly improved. After the PM module is added, the accuracy of the objects with small scale and dense arrangement is improved obviously. This is the case for oil tanks, vehicles, and tennis courts. Therefore, similar conclusions to the NWPU VHR-10 dataset are obtained on the DIOR dataset.

5.3. Feature Visualization

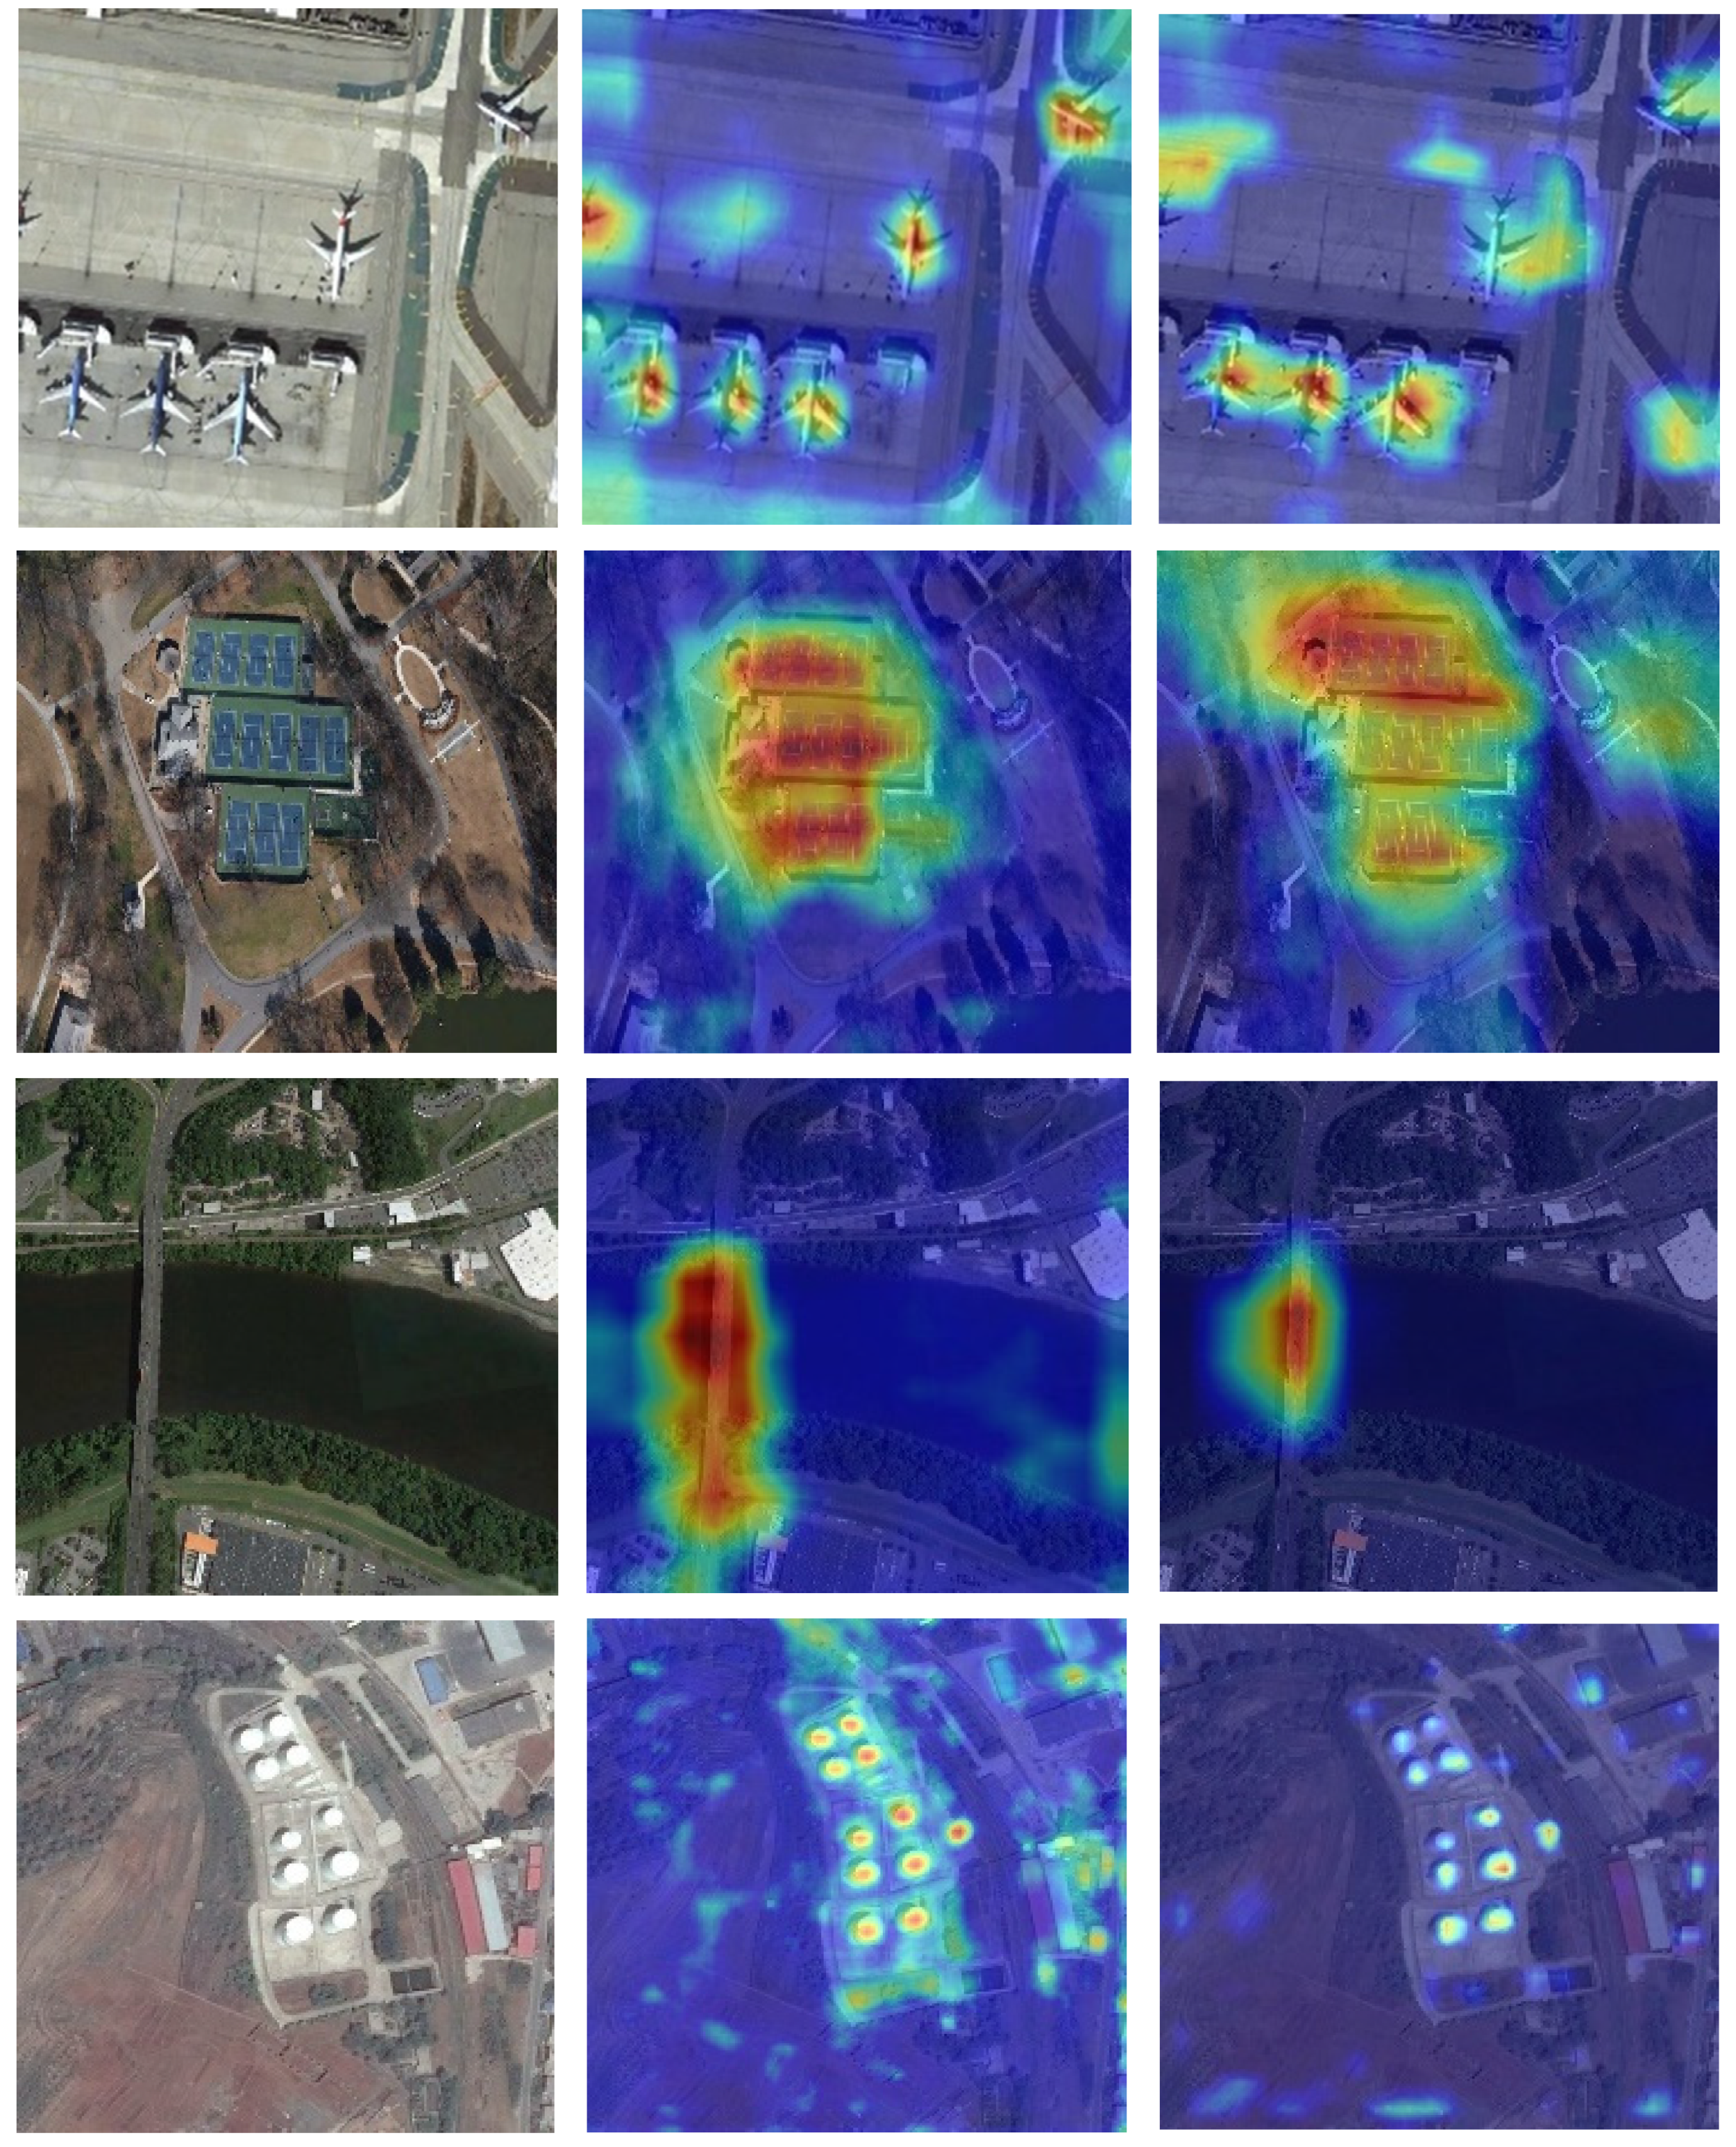
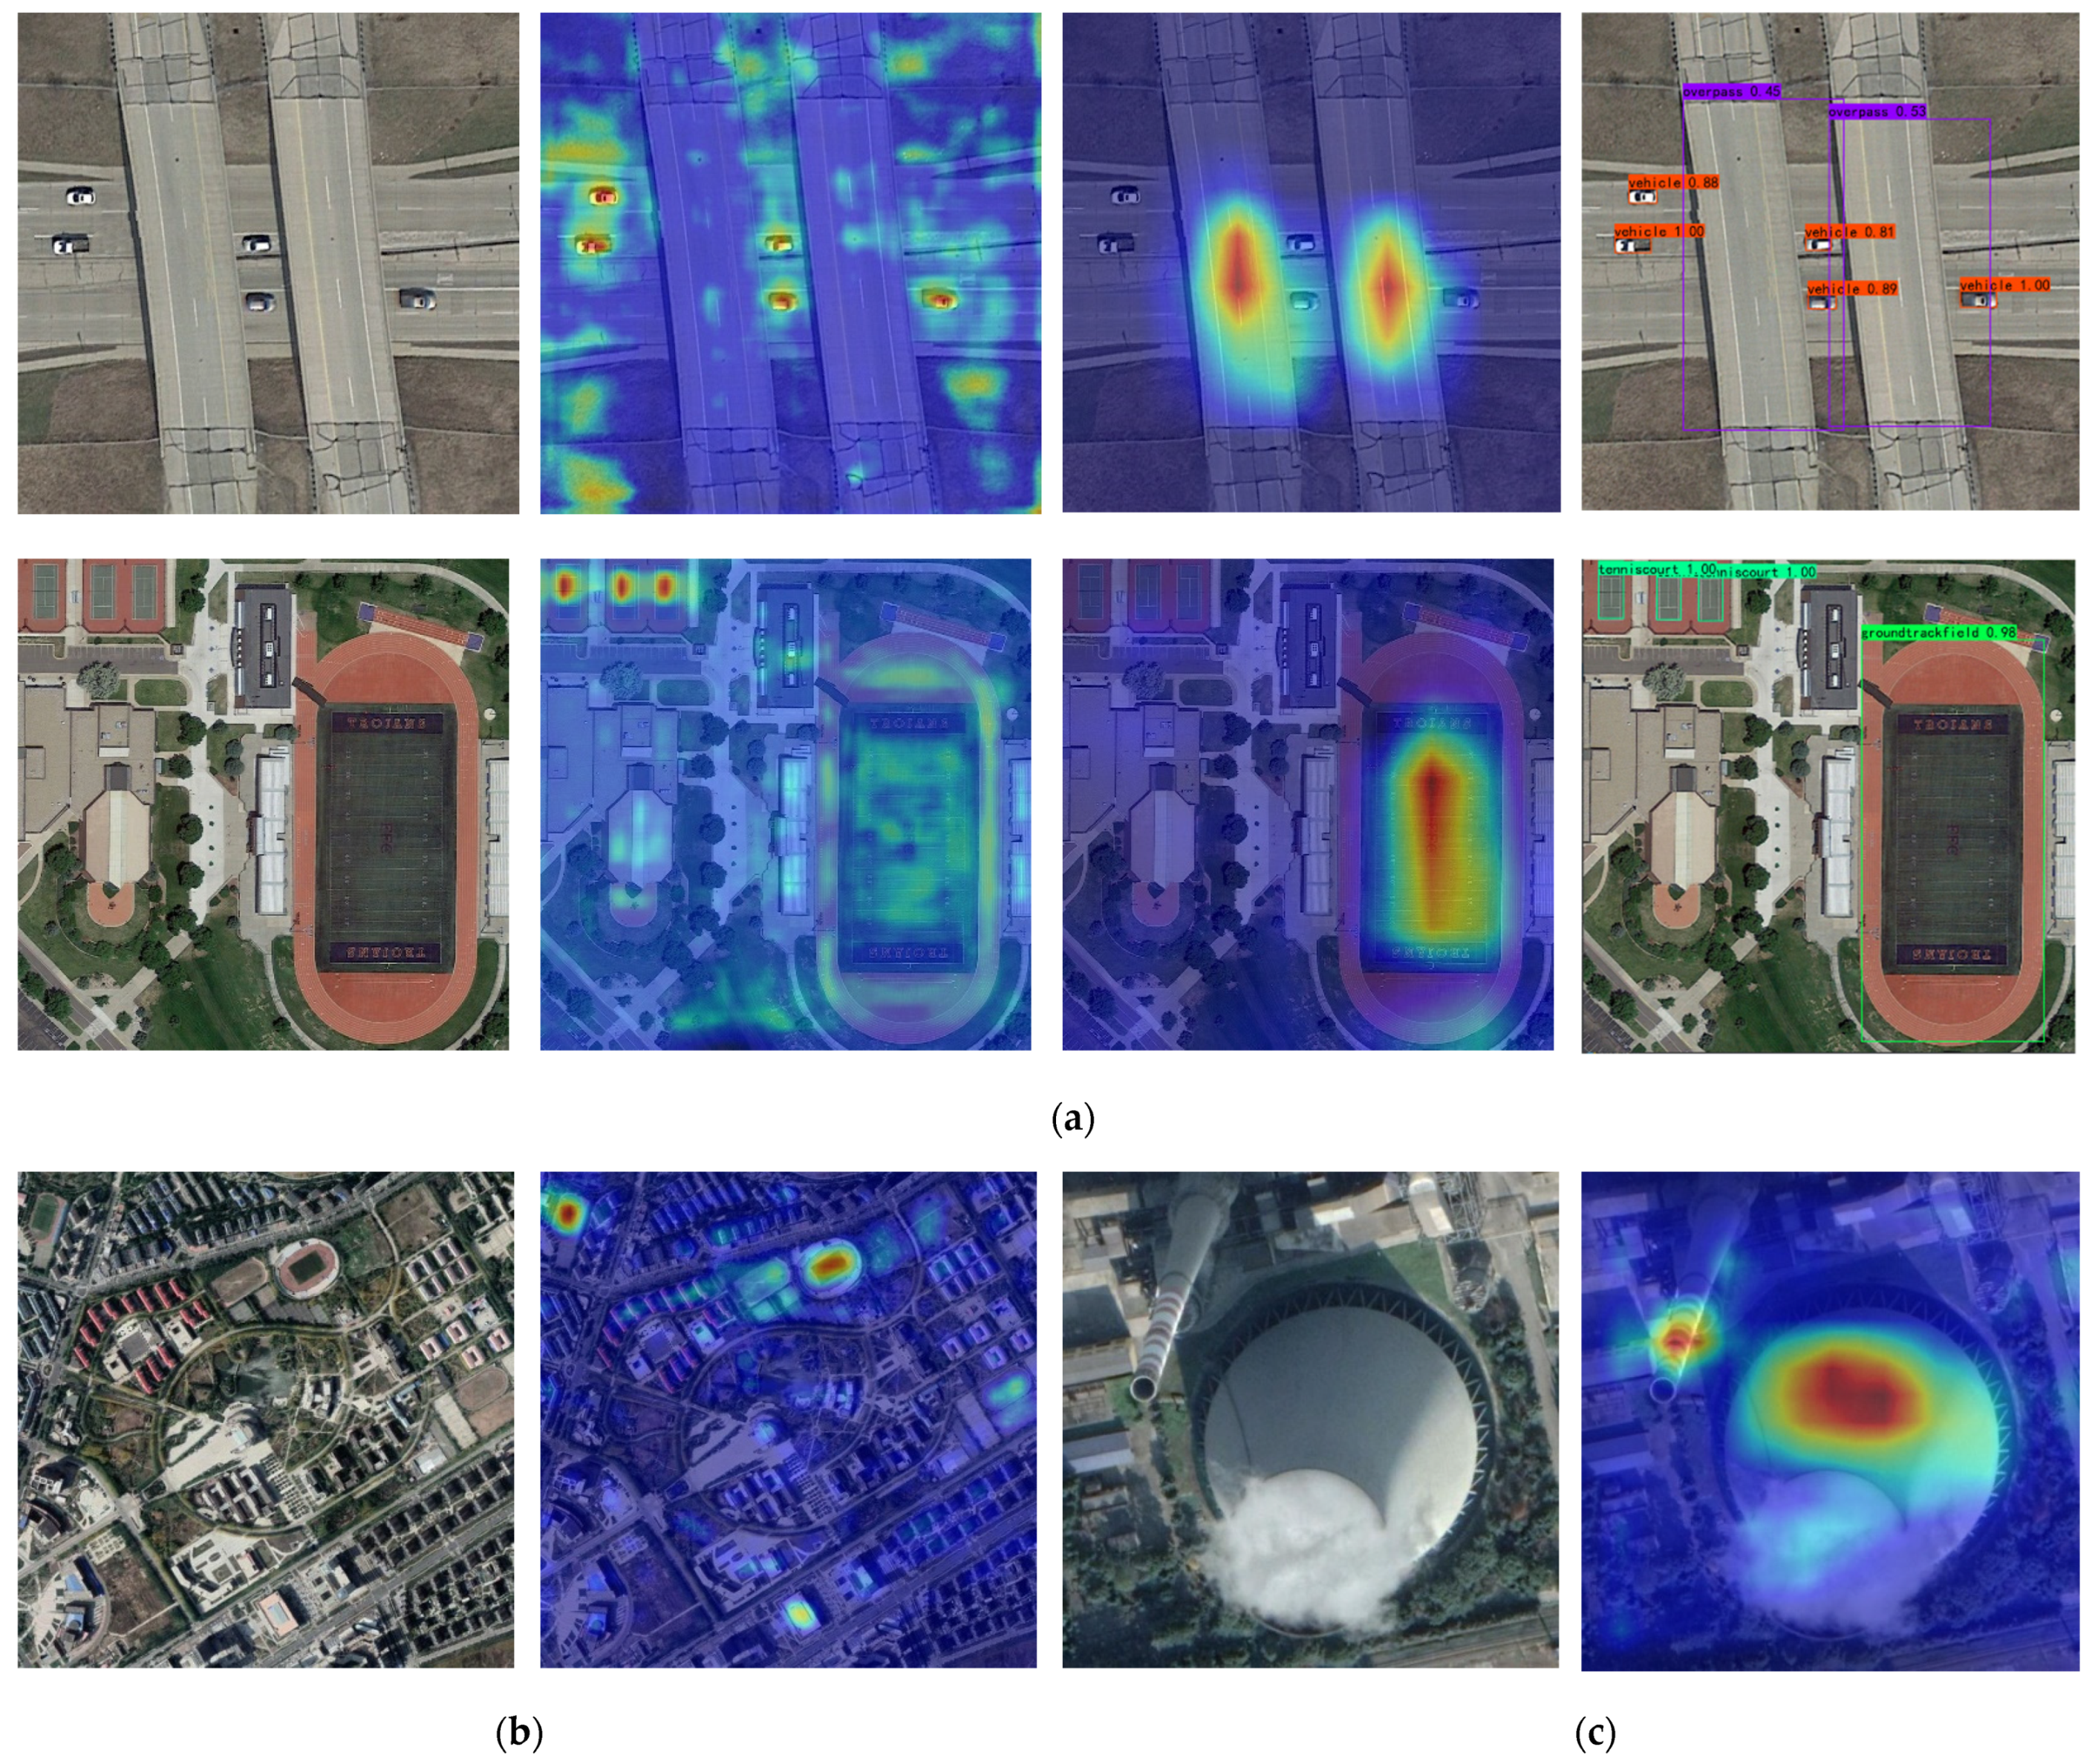
As a visual verification of the AFADet model’s ability to perceive the object’s feature, the predicted feature map of SSD* and AFADet is visualized, as shown in Figure 8. The darker color in the figure indicates higher sensitivity of the model to the features in the region.
As shown from the heat maps of objects such as aircraft, vehicles, and storage tanks, the proposed AFADet can locate the object’s center accurately, while the SSD* suffers from a positioning offset. This illustrates the effectiveness of the OPM. The visualization results for the bridge, tennis court, and baseball field reflect that the addition of the AFAM module provides the model with better feature alignment capabilities than the SSD*, which has significant feature misalignment problems.
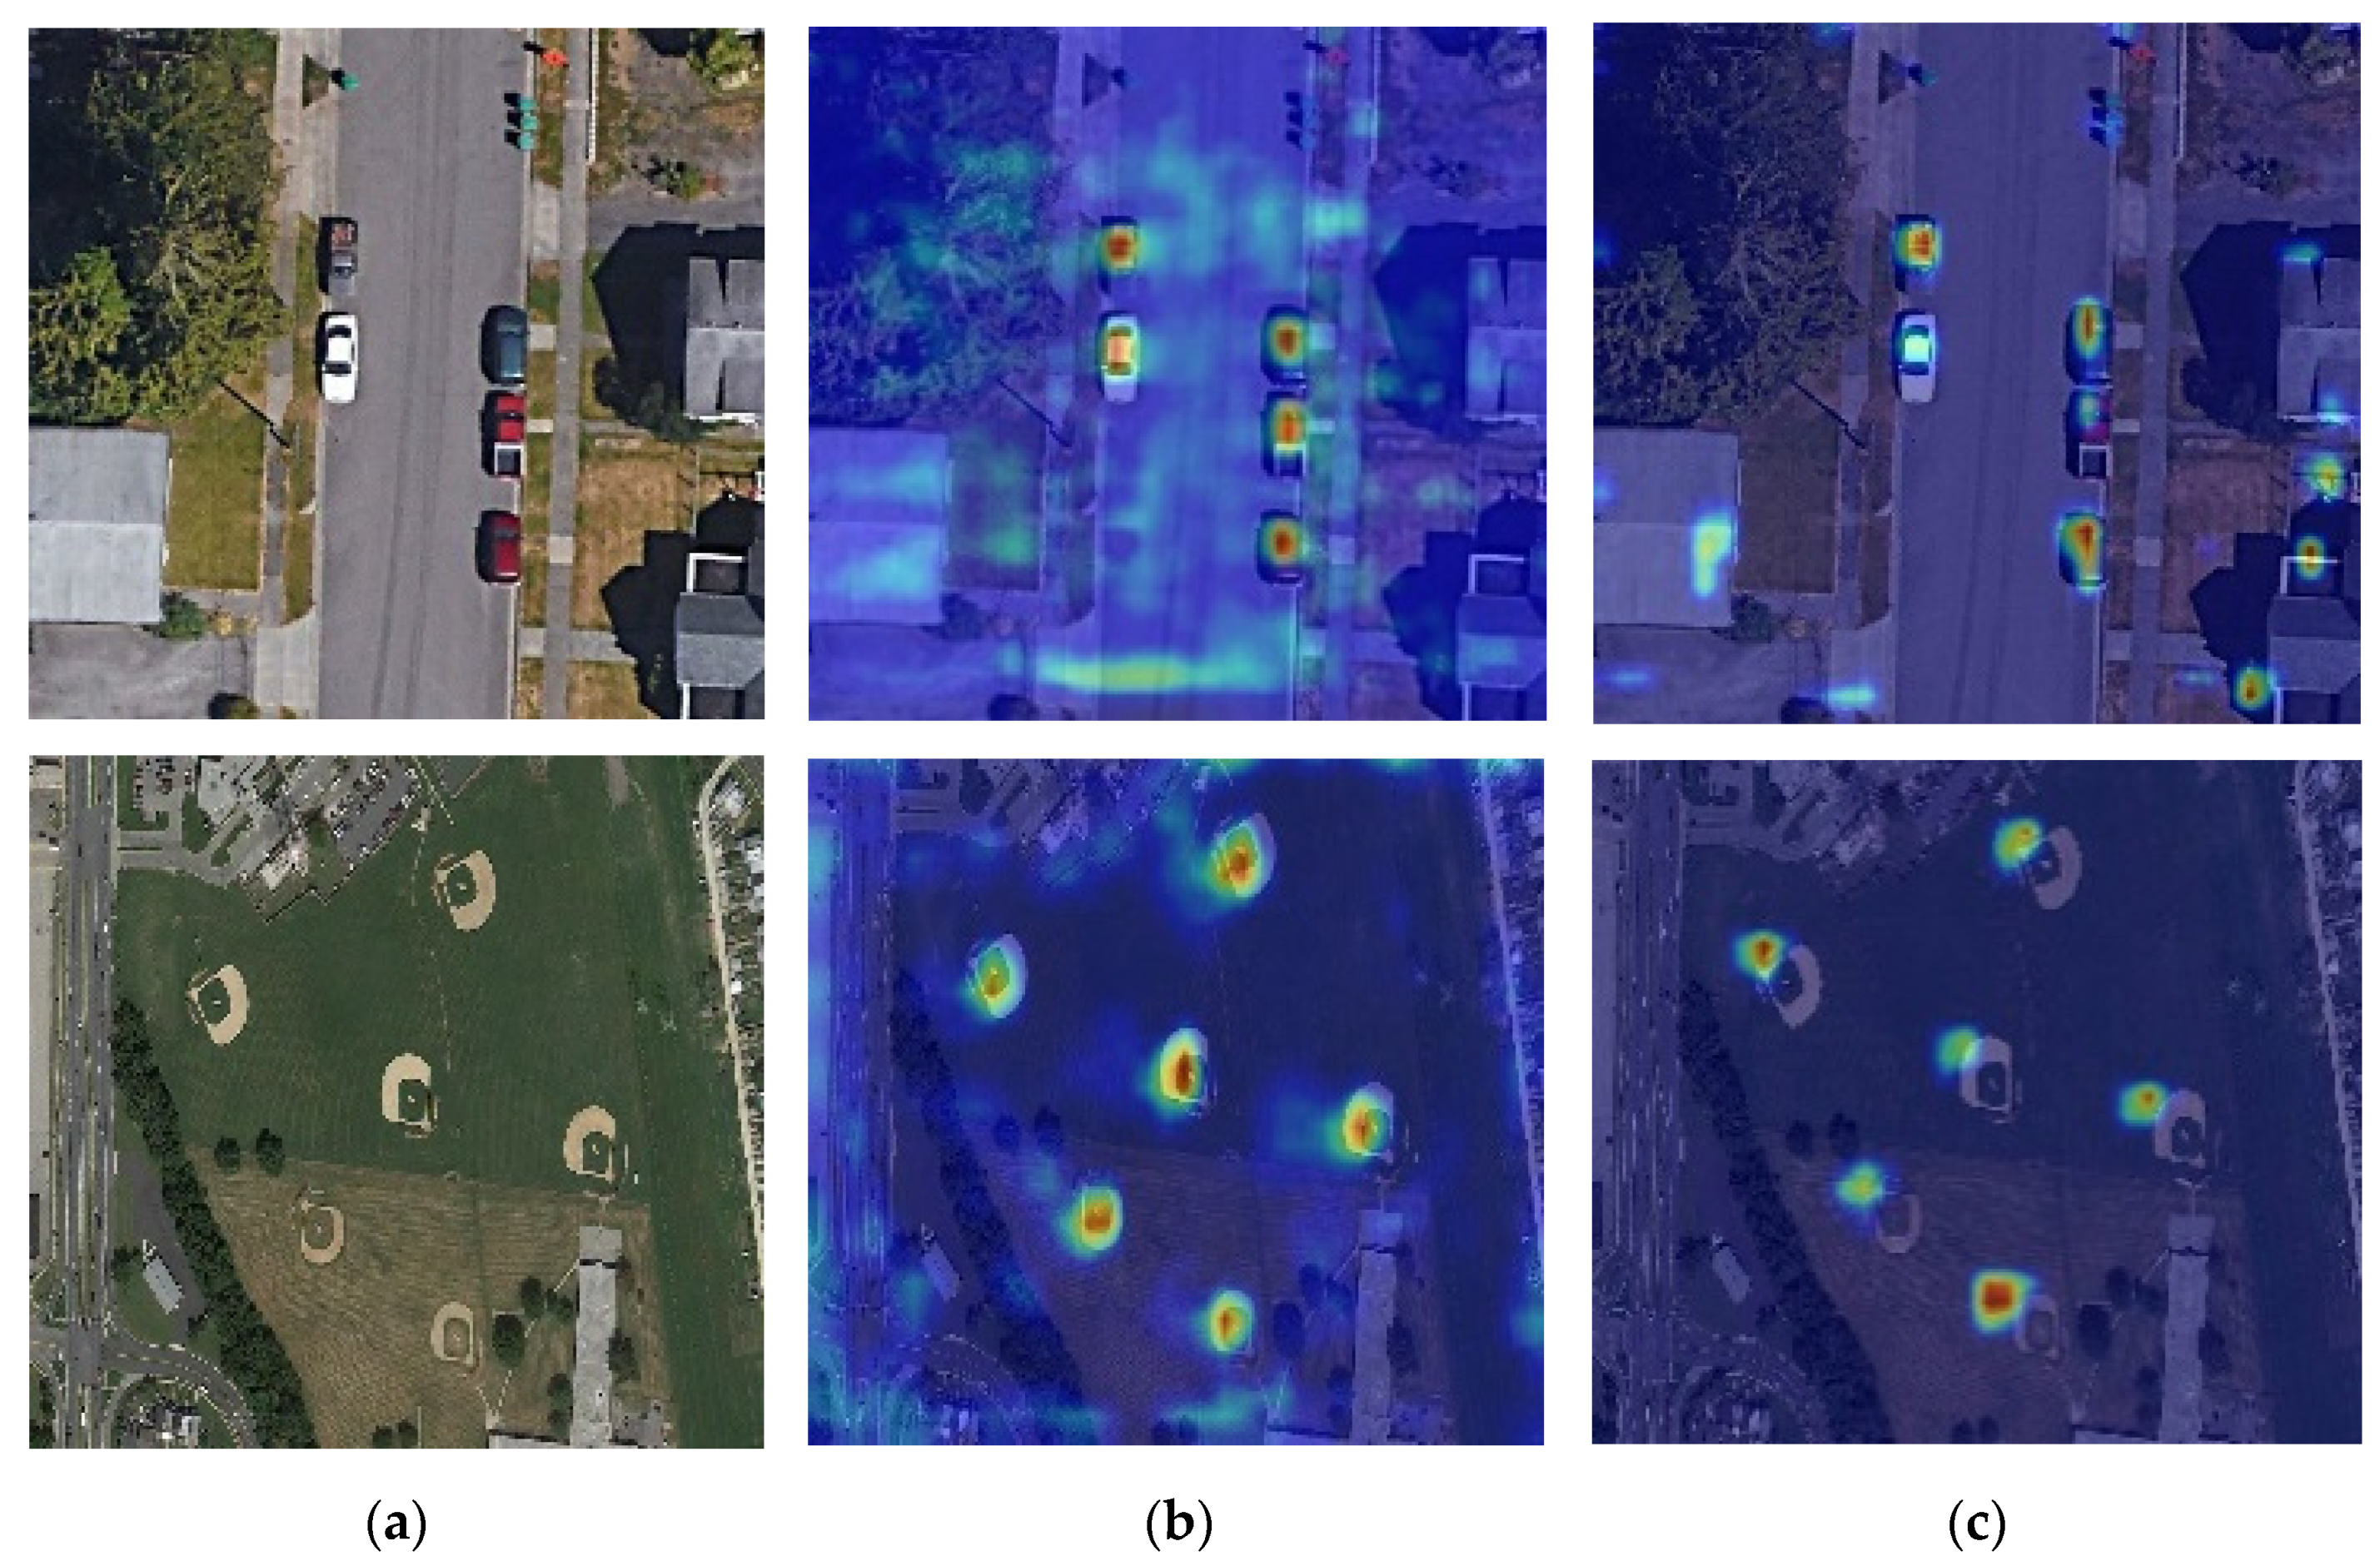
To visually verify the tolerance of AFADet to object diversity, the feature heat maps of several typical classes are visualized; the results are shown in Figure 9. As shown in Figure 9a, the model accurately locates objects of different size in the output predicted feature maps. This result shows that AFADet has excellent adaptability to different classes of objects with great scale differences under the same field of view. Meanwhile, the detection results also suggest that the model still maintains good feature alignment when the object scale varies widely. The spatial resolution of various sensors in remote sensing images is different, thus there are scale differences in different images for the same class of objects. However, it is clear from the visualization results (Figure 9b) that AFADet can accurately detect the same kind of objects at different scales, However, the results of the feature heat map visualization of the athletic field in Figure 9a,b show that AFADet can accurately detect the same kind of objects at different scales, suggesting that the model effectively learns the representational information of objects. In reality, the appearance for the same category of objects is diverse; for example, common industrial cooling towers and exhaust gas discharge tubes are normally categorized as chimneys, yet the appearance of them is distinctly different. Figure 9c demonstrates that AFADet maintains high positioning accuracy even when dealing with chimneys with greatly varying appearance. The result indicates that the model effectively generalizes abstract features in the feature space that are similar between the two, thus improving the model’s ability of generalization to the objects.
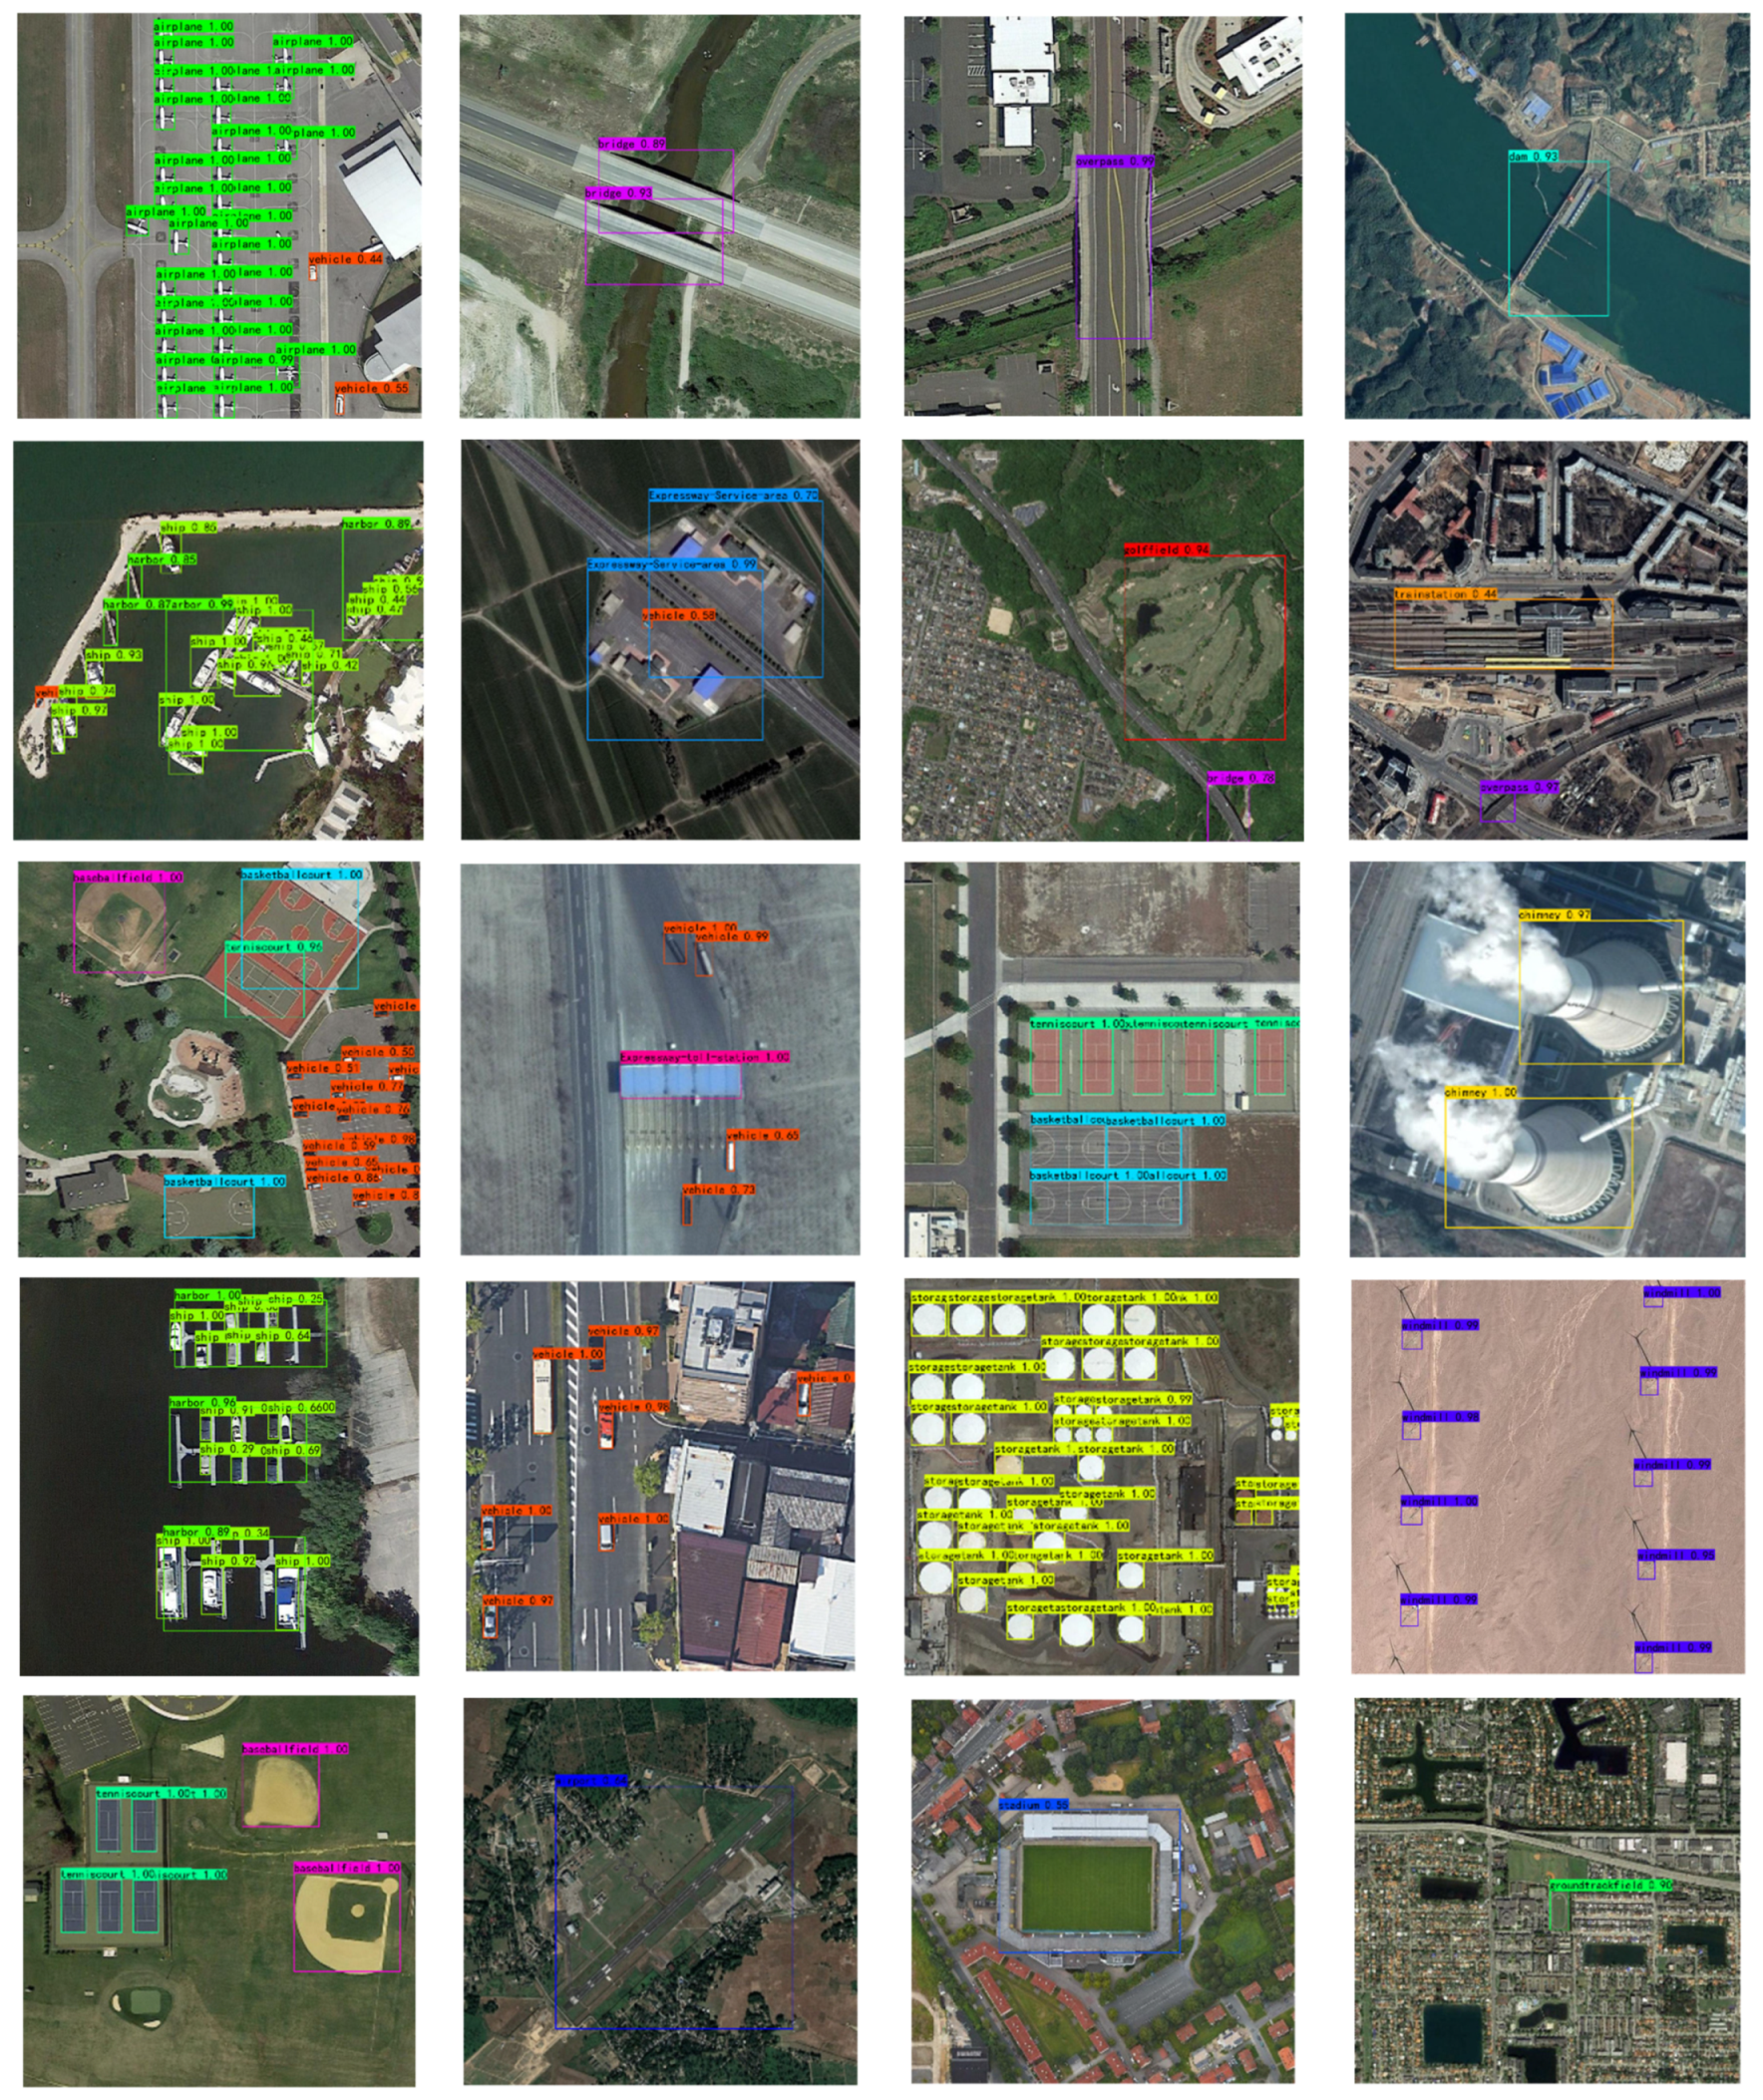
The detection results in the DIOR dataset are visualized, as shown in Figure 10. The visualization results of bridge and dam show strong similarity in their background information. Therefore, it is essential to rely on the object’s own features for accurate detection. The AFADet model can learn the meaningful features of the object itself instead of having a relatively powerful dependence on the background information, thus effectively overcoming the problem of feature interference between similar categories. The visualization results of bridge and overpass show that their own features are nearly identical, and to enable accurate detection of both, the model must have the ability to accurately classify the object with the contextual information rather than relying solely on its own features. From the visualization of the wind mills, the AFADet model succeeds in locating and identifying the object accurately despite the weak information of its own features.
The analytical findings illustrate the effectiveness of the AFAM proposed in this study. The results of the localization of densely distributed objects such as airplanes, ships, vehicles, and oil tanks show that the OPM in AFADet also plays a critical role.

6. Conclusions

To address the problem of inefficient application of the high-precision remote sensing image object detection model for real-time production operations, we developed the AFADet model. First, we designed an adaptive feature-aware module, which adaptively fused multiscale features across scales via a feature growth matrix, and used top-down and bottom-up pyramid fusion strategies for the deep fusion of features. Second, we introduced the object positioning module, which enables the supervision of the spatial location in the objects and mined high-level semantic information from the deep abstract features via self-attention to enhance the sensitivity of the model to the object location. Finally, we adopted the focal loss to effectively address the positive and negative sample imbalance in the one-stage object detection model, reduce the influence of easily classified samples in model training, and improve the training stability of the model. We experimentally verified that the AFAM can effectively improve the learning ability of the model towards the object features, and can successfully eliminate the interference problem of the complex background on objects in remote sensing images. The OPM effectively improves the model’s accuracy in locating the center of the object and increases the recall for small-scale and dense objects. The experimental results for the three commonly used datasets of object detection in remote sensing images also showed that the AFADet model can perform detection at real-time speed and achieve high accuracy, balancing detection accuracy and speed. It has the potential for practical production applications that use remote sensing images. However, there remains room for improvement in increasing the detection accuracy, which is an important research direction that should be pursued.

Author Contributions

Conceptualization, Z.G. and H.G.; methodology, J.W.; software, J.W. and D.Y.; formal analysis, X.L.; writing—original draft preparation, J.W.; writing—review and editing, L.D.; funding acquisition, H.G. All authors have read and agreed to the published version of the manuscript.

Funding

This research was funded by National Science Foundation of China, grant number 41876105; 41671410.

Conflicts of Interest

The authors declare no conflict of interest.

References

  1. Cheng, G.; Si, Y.; Hong, H.; Yao, X.; Guo, L. Cross-Scale Feature Fusion for Object Detection in Optical Remote Sensing Images. IEEE Geosci. Remote Sens. Lett. 2020, 18, 431–435. [Google Scholar] [CrossRef]
  2. Xu, T.; Sun, X.; Diao, W.; Zhao, L.; Fu, K.; Wang, H. ASSD: Feature Aligned Single-Shot Detection for Multiscale Objects in Aerial Imagery. IEEE Trans. Geosci. Remote Sens. 2022, 60, 1–17. [Google Scholar] [CrossRef]
  3. Huang, Z.; Li, W.; Xia, X.-G.; Wu, X.; Cai, Z.; Tao, R. A Novel Nonlocal-Aware Pyramid and Multiscale Multitask Refinement Detector for Object Detection in Remote Sensing Images. IEEE Trans. Geosci. Remote Sens. 2022, 60, 1–20. [Google Scholar] [CrossRef]
  4. Qian, X.; Lin, S.; Cheng, G.; Yao, X.; Ren, H.; Wang, W. Object Detection in Remote Sensing Images Based on Improved Bounding Box Regression and Multi-Level Features Fusion. Remote Sens. 2020, 12, 143. [Google Scholar] [CrossRef] [Green Version]
  5. Rezatofighi, H.; Tsoi, N.; Gwak, J.Y.; Sadeghian, A.; Reid, I.; Savarese, S. Generalized intersection over union: A metric and a loss for bounding box regression. In Proceedings of the IEEE/CVF Conference on Computer Vision and Pattern Recognition, Long Beach, CA, USA, 15–20 June 2019; pp. 658–666. [Google Scholar]
  6. Cheng, G.; Lang, C.; Wu, M.; Xie, X.; Yao, X.; Han, J. Feature enhancement network for object detection in optical remote sensing images. J. Remote Sens. 2021, 2021, 9805389. [Google Scholar] [CrossRef]
  7. Wei, H.; Zhang, Y.; Chang, Z.; Li, H.; Wang, H.; Sun, X. Oriented objects as pairs of middle lines. ISPRS J. Photogramm. Remote Sens. 2020, 169, 268–279. [Google Scholar] [CrossRef]
  8. Huang, W.; Li, G.; Chen, Q.; Ju, M.; Qu, J. CF2PN: A Cross-Scale Feature Fusion Pyramid Network Based Remote Sensing Target Detection. Remote Sens. 2021, 13, 847. [Google Scholar] [CrossRef]
  9. Wang, G.; Zhuang, Y.; Chen, H.; Liu, X.; Zhang, T.; Li, L.; Dong, S.; Sang, Q. FSoD-Net: Full-scale object detection from optical remote sensing imagery. IEEE Trans. Geosci. Remote Sens. 2021, 60, 1–18. [Google Scholar] [CrossRef]
  10. Zhang, T.; Zhuang, Y.; Wang, G.; Dong, S.; Chen, H.; Li, L. Multiscale Semantic Fusion-Guided Fractal Convolutional Object Detection Network for Optical Remote Sensing Imagery. IEEE Trans. Geosci. Remote Sens. 2021, 60, 1–20. [Google Scholar] [CrossRef]
  11. Huang, Z.; Li, W.; Xia, X.G.; Wang, H.; Jie, F.; Tao, R. LO-Det: Lightweight Oriented Object Detection in Remote Sensing Images. IEEE Trans. Geosci. Remote Sens. 2021, 60, 1–15. [Google Scholar] [CrossRef]
  12. Li, L.; Cao, G.; Liu, J.; Tong, Y. Efficient Detection in Aerial Images for Resource-Limited Satellites. IEEE Geosci. Remote Sens. Lett. 2021, 19, 6001605. [Google Scholar] [CrossRef]
  13. Liu, N.; Celik, T.; Zhao, T.; Zhang, C.; Li, H.-C. AFDet: Toward More Accurate and Faster Object Detection in Remote Sensing Images. IEEE J. Sel. Top. Appl. Earth Obs. Remote Sens. 2021, 14, 12557–12568. [Google Scholar] [CrossRef]
  14. Li, P.; Che, C. SeMo-YOLO: A multiscale object detection network in satellite remote sensing images. In Proceedings of the 2021 International Joint Conference on Neural Networks (IJCNN), Shenzhen, China, 18–22 July 2021; pp. 1–8. [Google Scholar]
  15. Lang, L.; Xu, K.; Zhang, Q.; Wang, D. Fast and Accurate Object Detection in Remote Sensing Images Based on Lightweight Deep Neural Network. Sensors 2021, 21, 5460. [Google Scholar] [CrossRef] [PubMed]
  16. Liu, W.; Anguelov, D.; Erhan, D.; Szegedy, C.; Reed, S.; Fu, C.-Y.; Berg, A.C. Ssd: Single shot multibox detector. In European Conference on Computer Vision; Springer: Berlin/Heidelberg, Germany, 2016; pp. 21–37. [Google Scholar]
  17. Lin, T.Y.; Goyal, P.; Girshick, R.; He, K.; Dollar, P. Focal loss for dense object detection. In Proceedings of the IEEE International Conference on Computer Vision, Venice, Italy, 22–29 October 2017; pp. 2980–2988. [Google Scholar]
  18. Liu, Y.; Li, Q.; Yuan, Y.; Du, Q.; Wang, Q. ABNet: Adaptive Balanced Network for Multiscale Object Detection in Remote Sensing Imagery. IEEE Trans. Geosci. Remote Sens. 2021, 60, 1–14. [Google Scholar] [CrossRef]
  19. Ye, Y.; Ren, X.; Zhu, B.; Tang, T.; Tan, X.; Gui, Y.; Yao, Q. An Adaptive Attention Fusion Mechanism Convolutional Network for Object Detection in Remote Sensing Images. Remote Sens. 2022, 14, 516. [Google Scholar] [CrossRef]
  20. Li, W.T.; Li, L.W.; Li, S.Y.; Mou, J.C.; Hei, Y.Q. Efficient Vertex Coordinate Prediction-Based CSP-Hourglass Net for Object OBB Detection in Remote Sensing. IEEE Geosci. Remote Sens. Lett. 2021, 19, 6503305. [Google Scholar] [CrossRef]
  21. Ma, W.; Li, N.; Zhu, H.; Jiao, L.; Tang, X.; Guo, Y.; Hou, B. Feature Split–Merge–Enhancement Network for Remote Sensing Object Detection. IEEE Trans. Geosci. Remote Sens. 2022, 60, 1–17. [Google Scholar] [CrossRef]
  22. Wang, J.; Wang, Y.; Wu, Y.; Zhang, K.; Wang, Q. FRPNet: A Feature-Reflowing Pyramid Network for Object Detection of Remote Sensing Images. IEEE Geosci. Remote Sens. Lett. 2020, 19, 1–5. [Google Scholar] [CrossRef]
  23. Wu, Y.; Zhang, K.; Wang, J.; Wang, Y.; Wang, Q.; Li, X. GCWNet: A Global Context-Weaving Network for Object Detection in Remote Sensing Images. IEEE Trans. Geosci. Remote Sens. 2022, 60, 1–12. [Google Scholar] [CrossRef]
  24. Han, W.; Kuerban, A.; Yang, Y.; Huang, Z.; Liu, B.; Gao, J. Multi-Vision Network for Accurate and Real-Time Small Object Detection in Optical Remote Sensing Images. IEEE Geosci. Remote Sens. Lett. 2021, 19, 1–5. [Google Scholar] [CrossRef]
  25. Liu, J.; Yang, D.; Hu, F. Multiscale Object Detection in Remote Sensing Images Combined with Multi-Receptive-Field Features and Relation-Connected Attention. Remote Sens. 2022, 14, 427. [Google Scholar] [CrossRef]
  26. Lin, T.Y.; Dollár, P.; Girshick, R.; He, K.; Hariharan, B.; Belongie, S. Feature pyramid networks for object detection. In Proceedings of the 30th IEEE Conference on Computer Vision and Pattern Recognition, CVPR 2017, Honolulu, HI, USA, 21–26 July 2017; pp. 936–944. [Google Scholar] [CrossRef] [Green Version]
  27. Cong, R.; Zhang, Y.; Fang, L.; Li, J.; Zhao, Y.; Kwong, S. RRNet: Relational Reasoning Network With Parallel Multiscale Attention for Salient Object Detection in Optical Remote Sensing Images. IEEE Trans. Geosci. Remote Sens. 2021, 60, 1–11. [Google Scholar] [CrossRef]
  28. Zhang, K.; Wu, Y.; Wang, J.; Wang, Y.; Wang, Q. Semantic Context-Aware Network for Multiscale Object Detection in Remote Sensing Images. IEEE Geosci. Remote Sens. Lett. 2021, 19, 1–5. [Google Scholar] [CrossRef]
  29. Yu, D.; Ji, S. A New Spatial-Oriented Object Detection Framework for Remote Sensing Images. IEEE Trans. Geosci. Remote Sens. 2021, 60, 1–16. [Google Scholar] [CrossRef]
  30. Zhang, T.; Zhang, X.; Zhu, P.; Chen, P.; Tang, X.; Li, C.; Jiao, L. Foreground Refinement Network for Rotated Object Detection in Remote Sensing Images. IEEE Trans. Geosci. Remote Sens. 2021, 60, 1–13. [Google Scholar] [CrossRef]
  31. Wang, J.; He, X.; Faming, S.; Lu, G.; Jiang, Q.; Hu, R. Multi-Size Object Detection in Large Scene Remote Sensing Images Under Dual Attention Mechanism. IEEE Access 2022, 10, 8021–8035. [Google Scholar] [CrossRef]
  32. Bai, J.; Ren, J.; Yang, Y.; Xiao, Z.; Yu, W.; Havyarimana, V.; Jiao, L. Object Detection in Large-Scale Remote-Sensing Images Based on Time-Frequency Analysis and Feature Optimization. IEEE Trans. Geosci. Remote Sens. 2021, 60, 1–16. [Google Scholar] [CrossRef]
  33. Zhu, D.; Xia, S.; Zhao, J.; Zhou, Y.; Niu, Q.; Yao, R.; Chen, Y. Spatial hierarchy perception and hard samples metric learning for high-resolution remote sensing image object detection. Appl. Intell. 2021, 52, 3193–3208. [Google Scholar] [CrossRef]
  34. Cheng, B.; Li, Z.; Xu, B.; Dang, C.; Deng, J. Target detection in remote sensing image based on object-and-scene context constrained CNN. IEEE Geosci. Remote Sens. Lett. 2021, 19, 1–5. [Google Scholar] [CrossRef]
  35. Araujo, A.; Norris, W.; Sim, J. Computing Receptive Fields of Convolutional Neural Networks. Distill 2019, 4, e21. [Google Scholar] [CrossRef]
  36. Luo, W.; Li, Y.; Urtasun, R.; Zemel, R. Understanding the effective receptive field in deep convolutional neural networks. In Proceedings of the Advances in Neural Information Processing Systems 29, Barcelona, Spain, 5–10 December 2016. [Google Scholar]
  37. Mei, H.; Ji, G.P.; Wei, Z.; Yang, X.; Wei, X.; Fan, D.-P. Camouflaged Object Segmentation with Distraction Mining. In Proceedings of the IEEE Conference on Computer Vision and Pattern Recognition, Nashville, TN, USA, 20–25 June 2021; pp. 8772–8781. [Google Scholar] [CrossRef]
  38. Su, H.; Wei, S.; Yan, M.; Wang, C.; Shi, J.; Zhang, X. Object Detection and Instance Segmentation in Remote Sensing Imagery Based on Precise Mask R-CNN. In Proceedings of the IGARSS 2019–2019 IEEE International Geoscience and Remote Sensing Symposium, Yokohama, Japan, 28 July–2 August 2019; pp. 1454–1457. [Google Scholar] [CrossRef]
  39. Li, K.; Wan, G.; Cheng, G.; Meng, L.; Han, J. Object detection in optical remote sensing images: A survey and a new benchmark. ISPRS J. Photogramm. Remote Sens. 2020, 159, 296–307. [Google Scholar] [CrossRef]
  40. Xiao, Z.; Liu, Q.; Tang, G.; Zhai, X. Elliptic Fourier transformation-based histograms of oriented gradients for rotationally invariant object detection in remote-sensing images. Int. J. Remote Sens. 2015, 36, 618–644. [Google Scholar] [CrossRef]
  41. Long, Y.; Gong, Y.; Xiao, Z.; Liu, Q. Accurate Object Localization in Remote Sensing Images Based on Convolutional Neural Networks. IEEE Trans. Geosci. Remote Sens. 2017, 55, 2486–2498. [Google Scholar] [CrossRef]
  42. Ren, S.; He, K.; Girshick, R.; Sun, J. Faster R-CNN: Towards Real-Time Object Detection with Region Proposal Networks. In Proceedings of the Advances in Neural Information Processing Systems, 28, Montreal, QC, Canada, 7–12 December 2015. [Google Scholar]
  43. Redmon, J.; Farhadi, A. Yolov3: An incremental improvement. arXiv 2018, arXiv:1804.02767. [Google Scholar]
  44. Bochkovskiy, A.; Wang, C.Y.; Liao, H.Y.M. Yolov4: Optimal speed and accuracy of object detection. arXiv 2020, arXiv:2004.10934. [Google Scholar]
  45. Van Etten, A. You only look twice: Rapid multi-scale object detection in satellite imagery. arXiv 2018, arXiv:1805.09512. [Google Scholar]
  46. Tian, Z.; Shen, C.; Chen, H.; He, T. FCOS: Fully convolutional one-stage object detection. In Proceedings of the IEEE/CVF International Conference on Computer Vision, Seoul, Korea, 27 October–2 November 2019; pp. 9627–9636. [Google Scholar] [CrossRef] [Green Version]
  47. Zhou, X.; Wang, D.; Krähenbühl, P. Objects as points. arXiv 2019, arXiv:1904.07850. [Google Scholar]
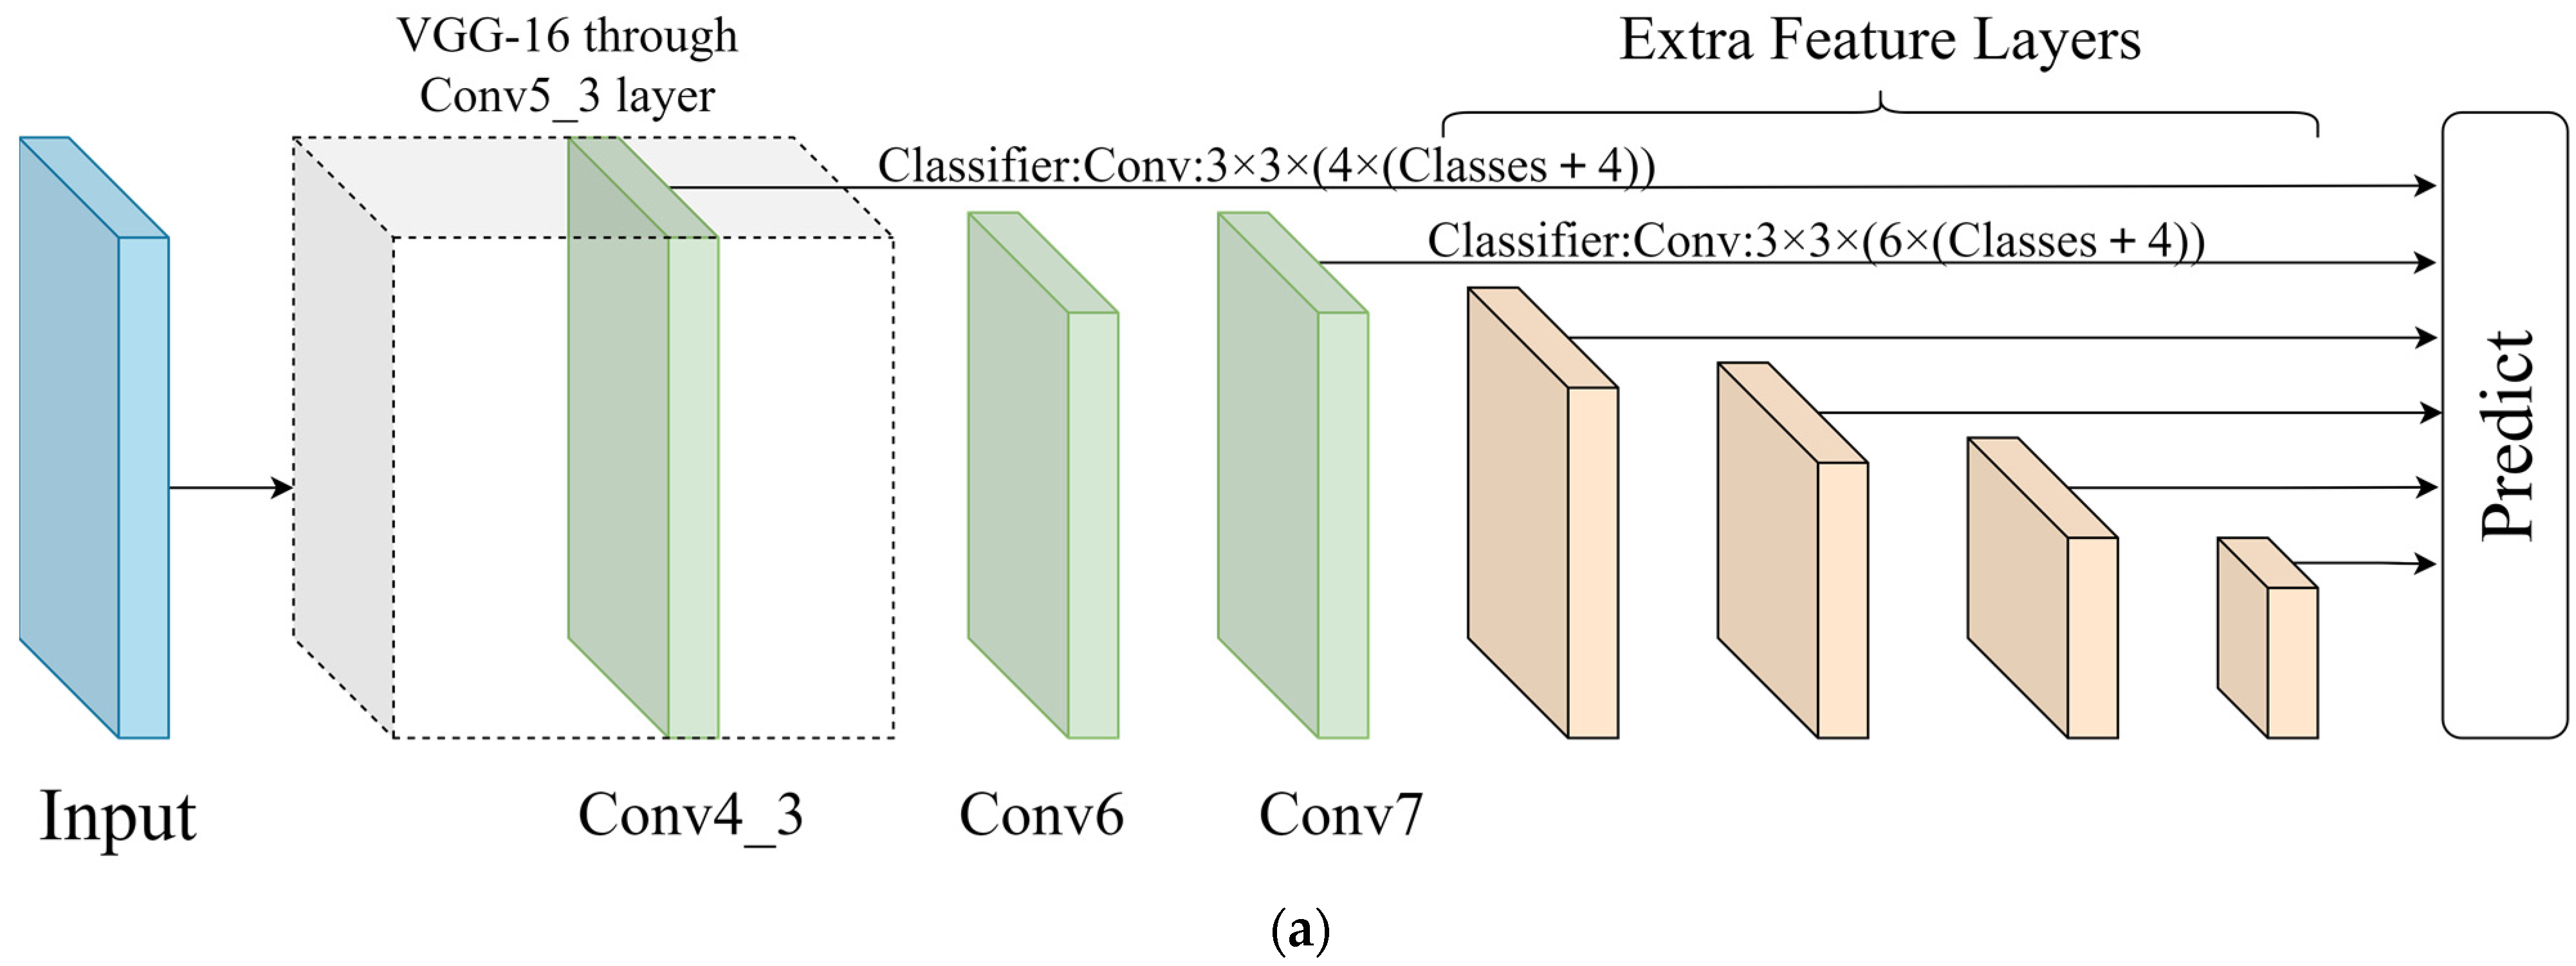
Figure 1. (a) Overall architecture of SSD. (b) Overall architecture of AFADet.
Remotesensing 14 03616 g001aRemotesensing 14 03616 g001b
Figure 2. SSD theoretical receptive field size.
Remotesensing 14 03616 g002
Figure 3. Adaptive feature-aware module structure.
Remotesensing 14 03616 g003
Figure 4. Cross-scale connection calculation; red and green represent the feature response regions and blue represents the noise region.
Remotesensing 14 03616 g004
Figure 5. Object positioning module structure.
Remotesensing 14 03616 g005
Figure 6. Example of DIOR dataset.
Remotesensing 14 03616 g006
Figure 7. PR curves of RSOD dataset for various categories. (a) AFADet-300. (b) SSD.
Remotesensing 14 03616 g007
Figure 8. Attention heat map visualization. (a) Original images. (b) AFADet visualization. (c) SSD* visualization.
Remotesensing 14 03616 g008aRemotesensing 14 03616 g008b
Figure 9. Visualization of object diversity. (a) Multiscale objects of different categories. (b) Small-scale athletic field. (c) Different appearance of the chimney.
Remotesensing 14 03616 g009
Figure 10. DIOR dataset detection results.
Remotesensing 14 03616 g010
Table 1. mAP of each model for the DIOR dataset.
ModelAEAOBFBCBRCNDMESETHBGCGFOPSPSDSTTCTSVCWMmAP
Faster-RCNN [42]51.3561.6262.2180.6626.9674.1837.2653.4645.1243.7669.6361.8148.9756.1441.8239.5673.8844.7433.9865.3253.61
YOLOv3 [43]68.8655.3966.7487.1435.0173.9634.6356.1549.8155.1667.9869.5952.5187.7142.0568.9384.5633.6249.8272.3760.60
YOLOv4-Tiny [44]58.6155.9971.5774.5222.1972.1147.2654.8348.5060.1164.4651.0946.9241.9355.4237.1879.7836.2726.4952.2352.87
SSD [17]59.5072.7072.4075.7029.7065.8056.6063.5053.1065.3068.6049.4048.1059.2061.0046.6076.3055.1027.4065.7058.60
YOLT [45]64.7768.9862.8587.8932.3771.5745.8654.9355.8649.9365.6866.3549.9787.7430.3673.3982.0629.9552.4573.9660.29
ASSD-lite [2]73.7075.7069.5085.4027.8074.6059.2061.9049.0076.7072.2261.0050.5076.5075.8049.7082.5056.5031.3057.2063.30
LO-Det [11]72.6365.0476.7284.6633.4673.7156.8375.8657.5166.2968.0160.9151.5088.6368.0464.3186.2647.5742.4476.7065.85
FANet [15]58.1655.6272.3976.0125.8673.0343.3155.4351.3958.9466.0351.3048.6970.4151.8253.3482.4638.7832.6063.3356.45
CF2PN [7]78.3278.2976.4888.4037.0070.9559.9071.2351.1575.5577.1456.7558.6576.0670.6155.5288.8450.8336.8986.3667.25
CSFF [1]57.2079.6070.1087.4046.1076.6062.7082.6073.2078.2081.6050.7059.5073.3063.4058.9085.9061.9042.9068.0068.00
FCOS [46]73.5068.0169.8685.1134.6673.6049.3352.0647.5667.2168.6746.3151.0672.2459.8464.6181.1742.7242.1774.7861.17
Centernet [47]73.5857.9869.7388.4636.2076.8847.9052.6653.9045.6860.5462.6252.6088.2163.7476.2183.6651.3254.4379.5363.86
AFADet85.5666.4976.3288.0937.4278.3253.5961.8458.4154.3267.2070.3653.0882.7262.7863.9488.2450.3243.9579.1666.12
Note: Airplane (AE), airport (AO), baseball field (BF), basketball court (BC), bridge (BR), chimney (CN), dam (DM), expressway service area (ES), expressway toll station (ET), harbor (HB), golf course (GC), grounds track field (GF), overpass (OP), ship (SP), stadium (SD), oil tank (ST), tennis court (TC), train station (TS), vehicle (VC), wind mill (WM), mean average precision (mAP). Bolded font represents the best value.
Table 2. Comprehensive comparison of detection speed and accuracy.
ModelLO-DetCF2PNFANetCSFFSimple-CNNAFADetAFADet-300
GPURTX3090RTX2080TiRTX2080TiRTX3090GT710RTX2080TiRTX2080Ti
Input
Size
320-416-416608300
FPS66.7119.70227.9015.2113.5125.6861.00
mAP49.1267.2556.4568.0066.50 *66.1257.40
Note: * represents training on DIOR partial samples.
Table 3. mAP of each model for the ROSD dataset.
ModelAircraftOil TankOverpassPlaygroundmAP
CF2PN95.5299.4283.8295.6893.61
FANet87.1098.9756.5897.8685.13
SSD-30068.1796.3890.6099.4088.64
AFADet92.1798.4394.2397.3395.54
AFADet-30069.7596.9093.4399.9990.02
Note: Bolded font represents the best value.
Table 4. Ablation experiments in the NWPU VHR-10 dataset.
ModelAEBDGFHBSTSPTCVCBCBRmAP
SSD*98.2697.7099.7683.3763.7058.9782.5151.5679.8767.9578.36
SSD* + FL98.7497.4399.8787.2556.7160.6577.9649.6782.6980.3179.13
SSD* + FL + AFAM98.5597.0099.8092.9054.4368.1086.1164.0591.5485.9783.87
SSD* + FL + AFAM + OPM98.7897.39100.0091.9767.8273.5388.3168.0887.6290.9186.44
Note: Airplane (AE), baseball diamond (BD), basketball court (BC), bridge (BR), harbor (HB), grounds track field (GF), ship (SP), storage tank (ST), tennis court (TC), vehicle (VC), mean average precision (mAP).
Table 5. Ablation experiments in the DIOR dataset.
ModelAEAOBFBCBRCNDMESETHBGCGFOPSPSDSTTCTSVCWMmAP
SSD*80.7157.9272.7088.8730.6476.9046.5656.6354.3552.0566.1764.0049.4182.9462.6459.4487.1446.5538.9273.0362.38
SSD* + FL82.6558.8175.1588.8032.0876.6244.2455.6553.5652.5865.9266.4051.1783.1362.9362.5887.2845.1640.5075.7463.05
SSD* + FL + AFAM84.2765.0372.6288.5837.9477.8353.4261.3259.2654.9268.3472.6154.3682.7364.5862.6385.9351.3542.0579.0265.94
SSD* + FL + AFAM + OPM85.5666.4976.3288.0937.4278.3253.5961.8458.4154.3267.2070.3653.0882.7262.7863.9488.2450.3243.9579.1666.12
Note: Airplane (AE), airport (AO), baseball field (BF), basketball court (BC), bridge (BR), chimney (CN), dam (DM), expressway service area (ES), expressway toll station (ET), harbor (HB), golf course (GC), grounds track field (GF), overpass (OP), ship (SP), stadium (SD), storage tank (ST), tennis court (TC), train station (TS), vehicle (VC), wind mill (WM), mean average precision (mAP).
Publisher’s Note: MDPI stays neutral with regard to jurisdictional claims in published maps and institutional affiliations.