Article

Self-Supervised Keypoint Detection and Cross-Fusion Matching Networks for Multimodal Remote Sensing Image Registration

1
College of Geological Engineering and Geomatics, Chang’an University, Xi’an 710064, China
2
School of Land Engineering, Chang’an University, Xi’an 710064, China
3
Faculty of Geosciences and Environmental Engineering, Southwest Jiaotong University, Chengdu 610031, China
*
Author to whom correspondence should be addressed.
Remote Sens. 2022, 14(15), 3599; https://doi.org/10.3390/rs14153599
Submission received: 20 June 2022 / Revised: 22 July 2022 / Accepted: 22 July 2022 / Published: 27 July 2022

Abstract

:
Remote sensing image matching is the basis upon which to obtain integrated observations and complementary information representation of the same scene from multiple source sensors, which is a prerequisite for remote sensing tasks such as remote sensing image fusion and change detection. However, the intricate geometric and radiometric differences between the multimodal images render the registration quite challenging. Although multimodal remote sensing image matching methods have been developed in recent decades, most classical and deep learning based techniques cannot effectively extract high repeatable keypoints and discriminative descriptors for multimodal images. Therefore, we propose a two-step “detection + matching” framework in this paper, where each step consists of a deep neural network. A self-supervised detection network is first designed to generate similar keypoint feature maps between multimodal images, which is used to detect highly repeatable keypoints. We then propose a cross-fusion matching network, which aims to exploit global optimization and fusion information for cross-modal feature descriptors and matching. The experiments show that the proposed method has superior feature detection and matching performance compared with current state-of-the-art methods. Specifically, the keypoint repetition rate of the detection network and the NN mAP of the matching network are 0.435 and 0.712 on test datasets, respectively. The proposed whole pipeline framework is evaluated, which achieves an average M.S. and RMSE of 0.298 and 3.41, respectively. This provides a novel solution for the joint use of multimodal remote sensing images for observation and localization.

1. Introduction

The joint observation of multimodal remote sensing images can bring unpredictable discoveries to the region and significantly improve the interpretation of the same scene. There is thus a remote sensing image registration, which is to align two or more multi-temporal/multi-sensor images in the same coordinate system for the observed scenarios. Registration is crucial since it determines the quality and accuracy of the remote sensing image fusion and change detection [1]. Therefore, a matching process needs to be implemented for remote sensing missions for joint observations [2,3,4,5].
The registration problem is usually solved by searching for matching information from the entire image or partial image patches using similarity measurement (e.g., area-based methods) [6], or by discriminative features (e.g., feature-based methods) [7], depending on the different approaches of building matching points.
Area-based methods search for correspondences between images by using a template. These methods can be roughly divided into three categories: correlation methods (NCC) [8], Fourier-based methods [9] and mutual information (MI) methods. Recently, Ye et al. [10] proposed a fast and robust template matching framework for multimodal remote sensing image matching framework based on pixel-wise structure feature representation. It used structure information from the entire template window, combined with a fast similarity measure, to detect correspondences between images. However, since these area-based methods are weak in dealing with large geometric deformation, they fail to process complex remote sensing image registration.
Feature-based methods first perform feature (e.g., points, lines, or regions) detection and description, and then determine correspondences by using the similarity of these features, which is more robust to image distortions compared with area-based methods [2,11]. In the past few decades, various feature-based methods have been developed; the most representative one is the scale invariant feature transformation (SIFT) [12] because it is invariant to translation, rotation and scale. Moreover, some SIFT-like methods, such as OS-SIFT [13] and improved SIFT [14], were also proposed for SAR-optical image matching. However, customizing universal feature matching algorithms for various remote sensing images remains a challenging task. Since these images are obtained by various sensors, multi-temporal observation or different imaging views, they have complicated geometric and radiometric differences. Additionally, those non-learned features (e.g., statistical information of edges, textures, corners and gradients) lack high-level semantic information. Therefore, those methods cannot guarantee that the extracted features are highly repeatable and distinct between multimodal remote sensing images.
Currently, deep learning (DL) methods have achieved great success [15,16,17,18]. They have been applied in remote sensing image processing tasks including image registration [19,20,21], change detection [22] and object detection [23], etc. The main reason is its completely data-driven scheme, trying to abstract the distribution structure from the input data.
Many studies have employed deep neural networks to produce some feature descriptors with rotation and scale invariance [24]. Burgmann et al. [25] investigated a DL-based method for automatically matching SAR and optical images by learning a common feature representation. Wang et al. [26] proposed a DL network to learn the mapping of registration pairs to matching labels. Yang et al. [19] proposed a multi-scale feature descriptor based on a pre-trained convolutional neural network (CNN) [27]. Zhou et al. [28] used deep learning techniques to extract multi-directional gradient features to depict the structure properties of images. The above methods introduce high-level features as matching primitives, which achieve a considerable matching performance in many cases. While these methods use deep neural networks to provide descriptors of salient features, they still use non-learned methods for feature detection rather than learning-based schemes.
To address the above problem, many researchers proposed several learning-based frameworks, discarding the keypoint detection step, by directly using deep neural networks to map matching responses based on patches [29]. Hughes et al. [30] proposed a three-step framework for sparse image matching of SAR and optical images, generating correspondences via a cross-correlation operator. Hughes et al. [31] proposed a pseudo-Siamese network architecture that predicts the correspondence of SAR and optical patch pairs based on learning in the training data. Li et al. [32] proposed a semantic template matching method that used a deep neural network to map the sensed image to the reference image, avoiding the keypoint detection step. Li et al. [32] proposed a semantic mapping image matching method based on deep neural networks, which transforms the matching problem into a semantic centroid correspondence. Although the above methods avoid the keypoint detection step, they are very time consuming in searching for the best correspondence for each patch.
There are some methods that combine feature detection and description in one network for natural images, such as D2-Net [33], Superpoint [34] and R2D2 [35]. D2-Net uses the original image as input to generate feature maps of keypoints. However, the accuracy of the keypoint locations is relatively low due to the detection on the feature maps. Superpoint applies a simulated training approach to obtain keypoint localization, which finds it difficult to obtain keypoint responses on multimodal remote sensing with complex features. R2D2 uses upsampling to maintain the size of the original image and regarded the final output as key information to generate keypoints, which will lose feature responses at corners and edges.
For these natural image-based matching methods, their keypoint detection and feature description mechanisms must be improved, e.g., keypoints detected based on maximum pooling have low repeatability on remotely sensed images with nonlinear radiometric differences. Integrating multiple tasks in a single network may not perform well for keypoint detection and feature description. Furthermore, these unified networks are optimized based on a fixed size image patches, which are difficult to perform global matching optimization for remote sensing images with large sizes. Therefore, each matching step requires an adjusted network structure to optimize remote sensing images globally. Based on the above description, the establishment of multimodal remote sensing image matching needs to overcome the following problems.
(1) The problem of repeatability for the keypoints. Establishing keypoints conditional on local features for one image using maximum pooling, which may be difficult in terms of obtaining a repeatable correspondence on another remote sensing image caused by the radiometric and geometric differences;
(2) The problem of cross-modal feature similarity. Since the heterogeneous information between multimodal remote sensing images, e.g., nonlinear radiometric differences, the feature descriptions may not have similarities and cannot be complete matching;
(3) The problem of global matching optimization. The network structure that integrates detection, description and matching is optimized for only one local fixed size patch. For remote sensing images with larger sizes, this may significantly increase the anomaly correspondence;
In this work, a two-step “detection + matching” network framework is proposed, where each network is applied to a different task to accommodate multimodal remote sensing image matching. To generate keypoints with repeatability, we construct a self-supervised keypoint detection network from both spatial and channel domains rather than local keypoint responses by maximum pooling. To obtain cross-modal similarity feature descriptions, an interactive fusion network is proposed for global optimization. The main contributions are summarized as follows:
(1) For the detection network, considering the differences in the input multimodal images, we build confidence at the same locations from the spatial and channel domains, which discards the maximum pooling keypoint detection mechanism. Overall, we design a self-supervised training manner that communicates the same locations with the same keypoint confidence, which shifts the keypoint detection from a single image response to the fitting of keypoint positions conditional on two images;
(2) In terms of matching networks, it is considered that constructing feature descriptors with local image patches ignores the global information and the interaction between image patch pairs. We develop a cross-fusion mechanism for exchanging high-level semantic information between image patches for feature description. Simultaneously, the network aims to generate a matrix of matching relationships from the overall image patches, unifying the “description + matching” steps into a single network to obtain optimization of overall remote sensing image matching.
The proposed method is evaluated on multimodal SAR-optical images. Experiments show that the keypoint detection network obtains keypoints with a high repetition rate on remote sensing images with geometric distortions and nonlinear radiometric differences. For the cross-fused matching network, state-of-the-art performance is also achieved compared to competitive methods.

2. Related Works

This section briefly introduces the structure of convolutional networks used for feature extraction in the detection network including depthwise separable convolution (DSC) and deformable convolutional network (DCN). For fusion mechanisms, we review multi-scale, high-level and low-level, local and global feature information fusion based on deep neural networks. Moreover, we introduce self-attention for cross-fusion matching.

2.1. Convolution Operation

2.1.1. Depthwise Separable Convolution

DSC [36] is composed of two processes, depth convolution and point-by-point convolution. First, each channel is separated to perform spatial convolution in the depth direction. Then all the results on channels are blended to perform point-by-point convolutions. Compared with the traditional CNN, the separable convolution only transforms the image once in the deep convolution, reducing the computational burden.

2.1.2. Deformable Convolutional Network

The feature extraction capability of DCN is enhanced by inserting offsets (e.g., deformable convolution) in the convolution layer [37], which serves to enable the network to learn the dynamic sensory domain. In the conventional CNN operation, the input feature map is sampled using a regular grid R. For each position, p 0 on the output feature map can be calculated by Equation (1).
y p 0 = p n R w p n · x p 0 + p n ,
where p n is an enumeration of the positions listed in R. In the deformable convolution operation, the regular grid R is expanded by adding an offset, and the same position p 0 becomes:
y p 0 = p n R w p n · x p 0 + p n + Δ p n .

2.2. Fusion Module

The cross-fusion matching network aims to fuse multimodal image patches containing keypoints, which translates them into easy-to-match feature descriptors and generates a matching relationship matrix. Different feature fusion modules are introduced in deep neural networks to combine global and local information through global average pooling and feature connectivity, such as Spatial Pyramid Pooling [38], Receptive Field Block (RFB) [39], Atrous Spatial Pyramid Pooling (ASPP) [40], Pyramid Pooling Module (PPM) [41] and Feature Pyramid Network (FPN) [42]. All of these methods are aimed at the fusion of multi-scale, high-level and low-level, local and global features in the extraction process. However, the multimodal remote sensing image matching needs to improve the similarity of keypoint descriptors; therefore, they must capture each other’s information while achieving better cross-fusion and matching.
Self-attention [43] provides an effective way to model global contextual information through a triplet of (key, query, value), where the key and query are multiplied by points to obtain the corresponding attention weights, and the weights and value are multiplied by points to obtain the final output. For the multimodal remote sensing image matching network, self-attention layers in the Transformer are used for cross-modal feature description matching.

3. Methodology

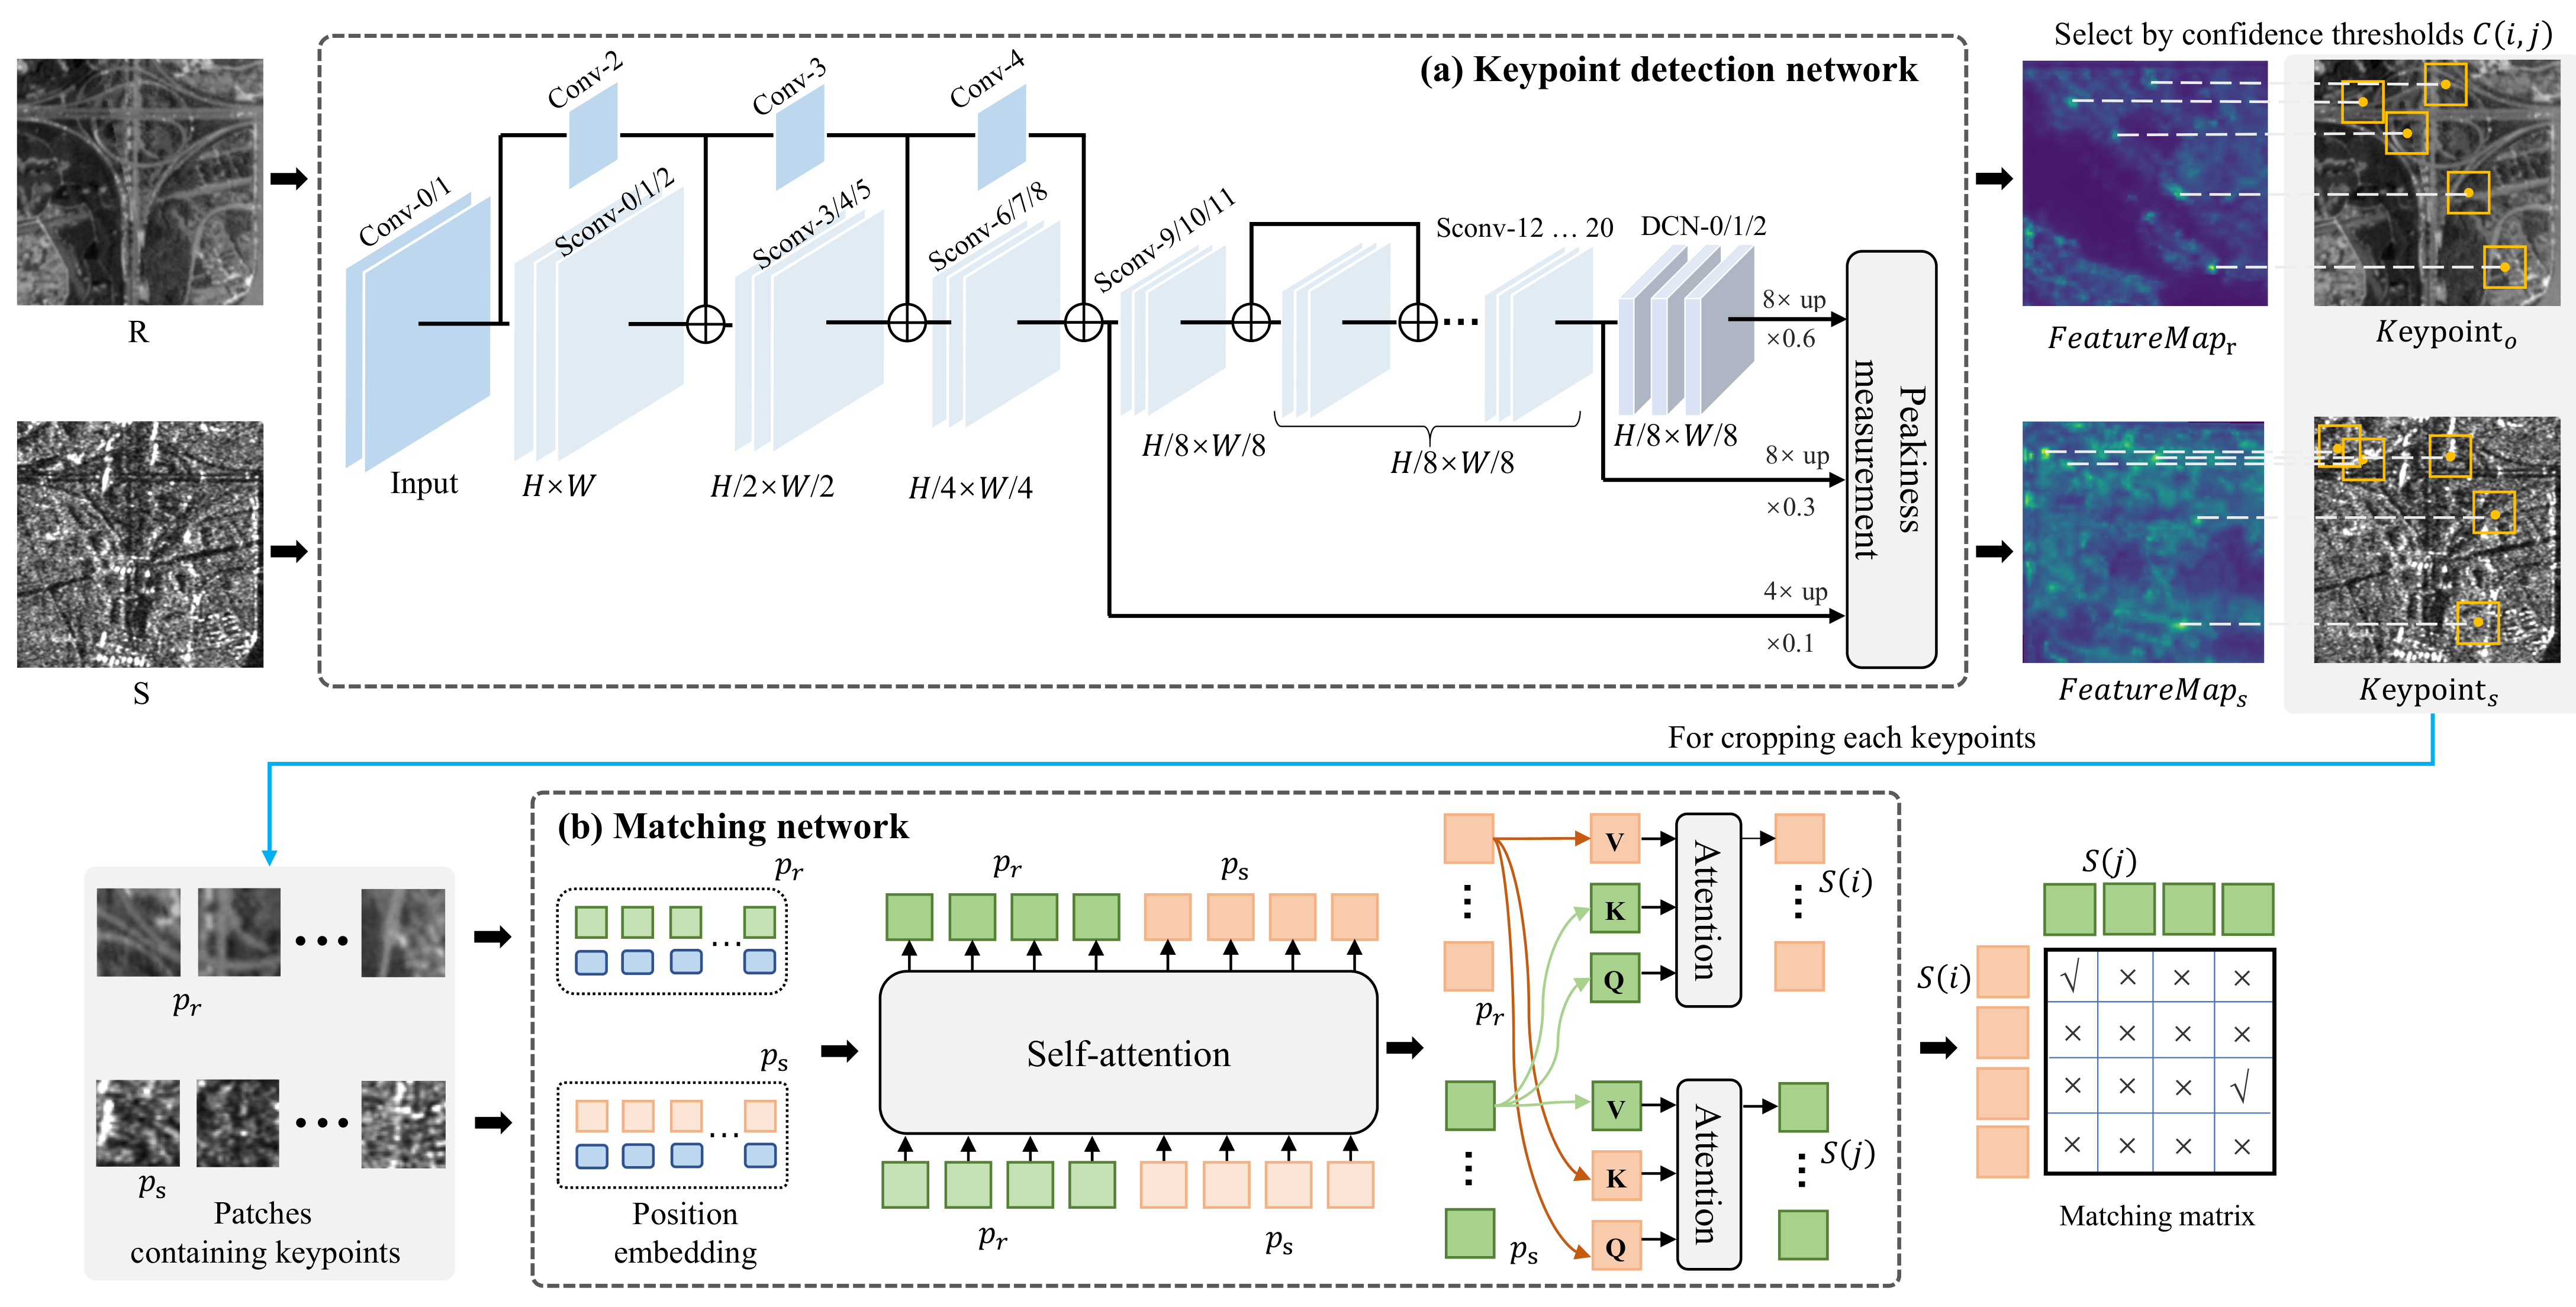
3.1. Overall Framework Description

The proposed matching method consists of two parts, a detection network and a cross-fusion matching network, which are used for specific tasks. A detailed description of these components is shown in Figure 1.
In the detection network, let R, S be the reference and sensed images. DSCs are used to encode the input image to improve the computational efficiency of the network, while introducing DCN operations to enhance the geometric robustness of keypoints in the decoding stage. The weighted results from three scales are chosen to input into the peakiness measurement to obtain the candidate keypoint feature maps. The keypoints measurement is calculated conditional on the two images from the local spatial and channel domains respectively, additionally using S o f t p l u s and confidence threshold C ( i , j ) to activate the peaks to positive values. The detailed calculation procedure is described in this Section 3.2.
In the matching network, image patches containing the candidate keypoints are first fed into the position embedding operation, extracting position-dependent features. The image patches are cropped to be matched from their neighborhoods of keypoints for matching, and enhancing the local domain information of keypoints. Both the reference and sensed image patches are used as the input of the designed interactive fusion layers, which aim to exchange the information. Therefore, they capture each other’s information and transform it into an easy-to-match feature descriptor (feature description step). In the matching phase, multiple fully connected layers are used to optimize the feature descriptor by an overall constraint strategy, and normalize it to [ 0, 1 ] for obtaining the final matching matrix between S ( i ) and S ( j ) (matching step). The proposed cross-fusion network unifies “description + matching” steps into the cross-fusion network for global optimization.

3.2. Detection Network

Network architecture. Figure 1a depicts the structure of the detection network, where Conv, SConv and DCN denote CNN, DSC and DCN respectively. Images with a size of 224 × 224 pixels are as input. The convolutional kernels of the CNN are all of the sizes 3 × 3 , and each CNN layer is followed by ReLU [44] and BN [45]. The input images are first passed through Conv-0/1, then through SConv-0//20 to reduce the size of the feature map, where the previous outputs are reused and CNN operations are performed before each input. The network structure repeats the SConv-9/10/11 operation three times in the middle and then inputs to DCN-0/1/2.
SConv-8/20 and DCN-2 are rehabilitated to their original sizes by upsampling for obtaining undistorted features on-scale, and then are input to the network to generate the three keypoint feature maps, called γ 1 , γ 2   a n d   γ 3 , respectively. For those multiple scale features, they are not assigned the same weight. This is because we have considered the abstraction of these features from low-level to high-level features. The final keypoint feature map is computed as follows:
O = Δ 1 γ 1 + Δ 2 γ 2 + Δ 3 γ 3 ,
where Δ 1 , Δ 2 and Δ 3 are weights, and Δ 1 + Δ 2 + Δ 3 = 1 .
In addition, since the offsets Δ p n are usually fractional, they are implemented by bilinear interpolation, and the number of channels is 128. The rest of the parameter settings are implemented in [37]. The detailed parameters of the network structure are shown in Table 1.
Keypoint detection. To obtain keypoints that are robust to scaling changes, three stages of feature maps in the network Sconv-8/20 and DCN-2 are used for keypoint detection. Subsequently, the outputs from the three stages are input to the upsampling network, which is used to recover the original size and assign the corresponding weights. Keypoints are determined from the peaks in the local spatial- and channel domains, as shown in Figure 2. Specifically, for each position ( i , j ) and channel ( c = 1 , 2 , , c ) in the feature map output by the detection network, the local, spatial ( α i j c ) and channel ( β i j c ) scores are calculated by:
β i j c = softplus y i j c 1 c t y i j t ,
where c is the feature map in the channel domain, y i j c is a value on the feature map ( i , j ) . The activation function ( S o f t p l u s ) [46] serves to activate the keypoint feature map to a positive value.
α i j c = softplus y i j c 1 | N ( i , j ) | i , j N ( i , j ) y i j c ,
where N ( i , j ) is the set of nine neighbors of the pixel ( i , j ) and also its own pixel value.
To evaluate these two criteria, we create a single score map by maximizing the product of two scores in all feature maps c. The formula is as follows:
γ i j = max c α i j c β i j c .
Self-supervised detection.Figure 3 shows the self-supervised training process of the detection network. The SAR and optical images, which are pixel-aligned, are used as examples. A randomly selected image from these two images is a projection transformed by the matrix M, where the optical image is selected in the figure to be transformed for obtaining o . Then, s and o are input to the detection network with shared weights to obtain the feature maps( P o i n t A and P o i n t B ). The feature map P o i n t A is transformed into the same coordinate as P o i n t B using the projection transformation matrix M. Finally, the Huber loss function is used to determine the loss between the peak points, to attain the same confidence value for the keypoints at the same location. The Huber loss function is detailed as follows:
L δ ( y , f ( x ) ) = 1 2 ( y f ( x ) ) 2 for | y f ( x ) | δ δ | y f ( x ) | 1 2 δ 2 otherwise ,
where δ is the optional hyperparameter, f ( x ) is the predicted value, and y is the ground truth value.

3.3. Cross-Fusion Matching Network

Figure 4 depicts the proposed cross-fusion structure used for the keypoint feature description and matching. The reference and sensed patches containing keypoint are referred to as F o and F s . For F o and F s , the same position encoding as in [43] is employed for recording their position information on the original images. First, the position-encoded F o and F s are multiplied by their q u e r y , k e y , v a l u e weights to obtain Q, K, and V, respectively, which are then fed to the respective encoders to convert the image blocks into a 1 × 256 feature vector. To enhance the exchange of information between them, the Q, K, V of F o and F s are swapped to achieve cross-modal matching.
The goal of the network is to acquire a larger range of semantic information through a self-attention mechanism. F o and F s exchange their respective K, V, and the attention weights are calculated from the corresponding V and key vector K using Q to obtain the cross-fused similarity feature description. The specific computation process is as follows:
Attention ( Q , K , V ) = softmax Q K T d k V ,
where d k is the dimension of a Q and K, which is used to prevent the result from being too large.
Intuitively, the self-attention interaction fusion mechanism identifies relevant information that matches by comparing the similarity of the reference and sensed patches. The cross-fusion structure is interleaved eight times in the module. Finally, using numerous dense layers to represent matching possibilities, the two feature descriptors are normalized to [ 0 , 1 ] . The cross-entropy is used to supervise the learning process:
loss = 1 n x [ y ln a + ( 1 y ) ln ( 1 a ) ] ,
where x , y and a denote the sample, label, and output value, respectively, and n denotes the total number of samples.
The matching network is trained by positive and negative samples generated from strictly pixel-aligned remote sensing image patches. The next section describes in detail the method of positive and negative sample generation.

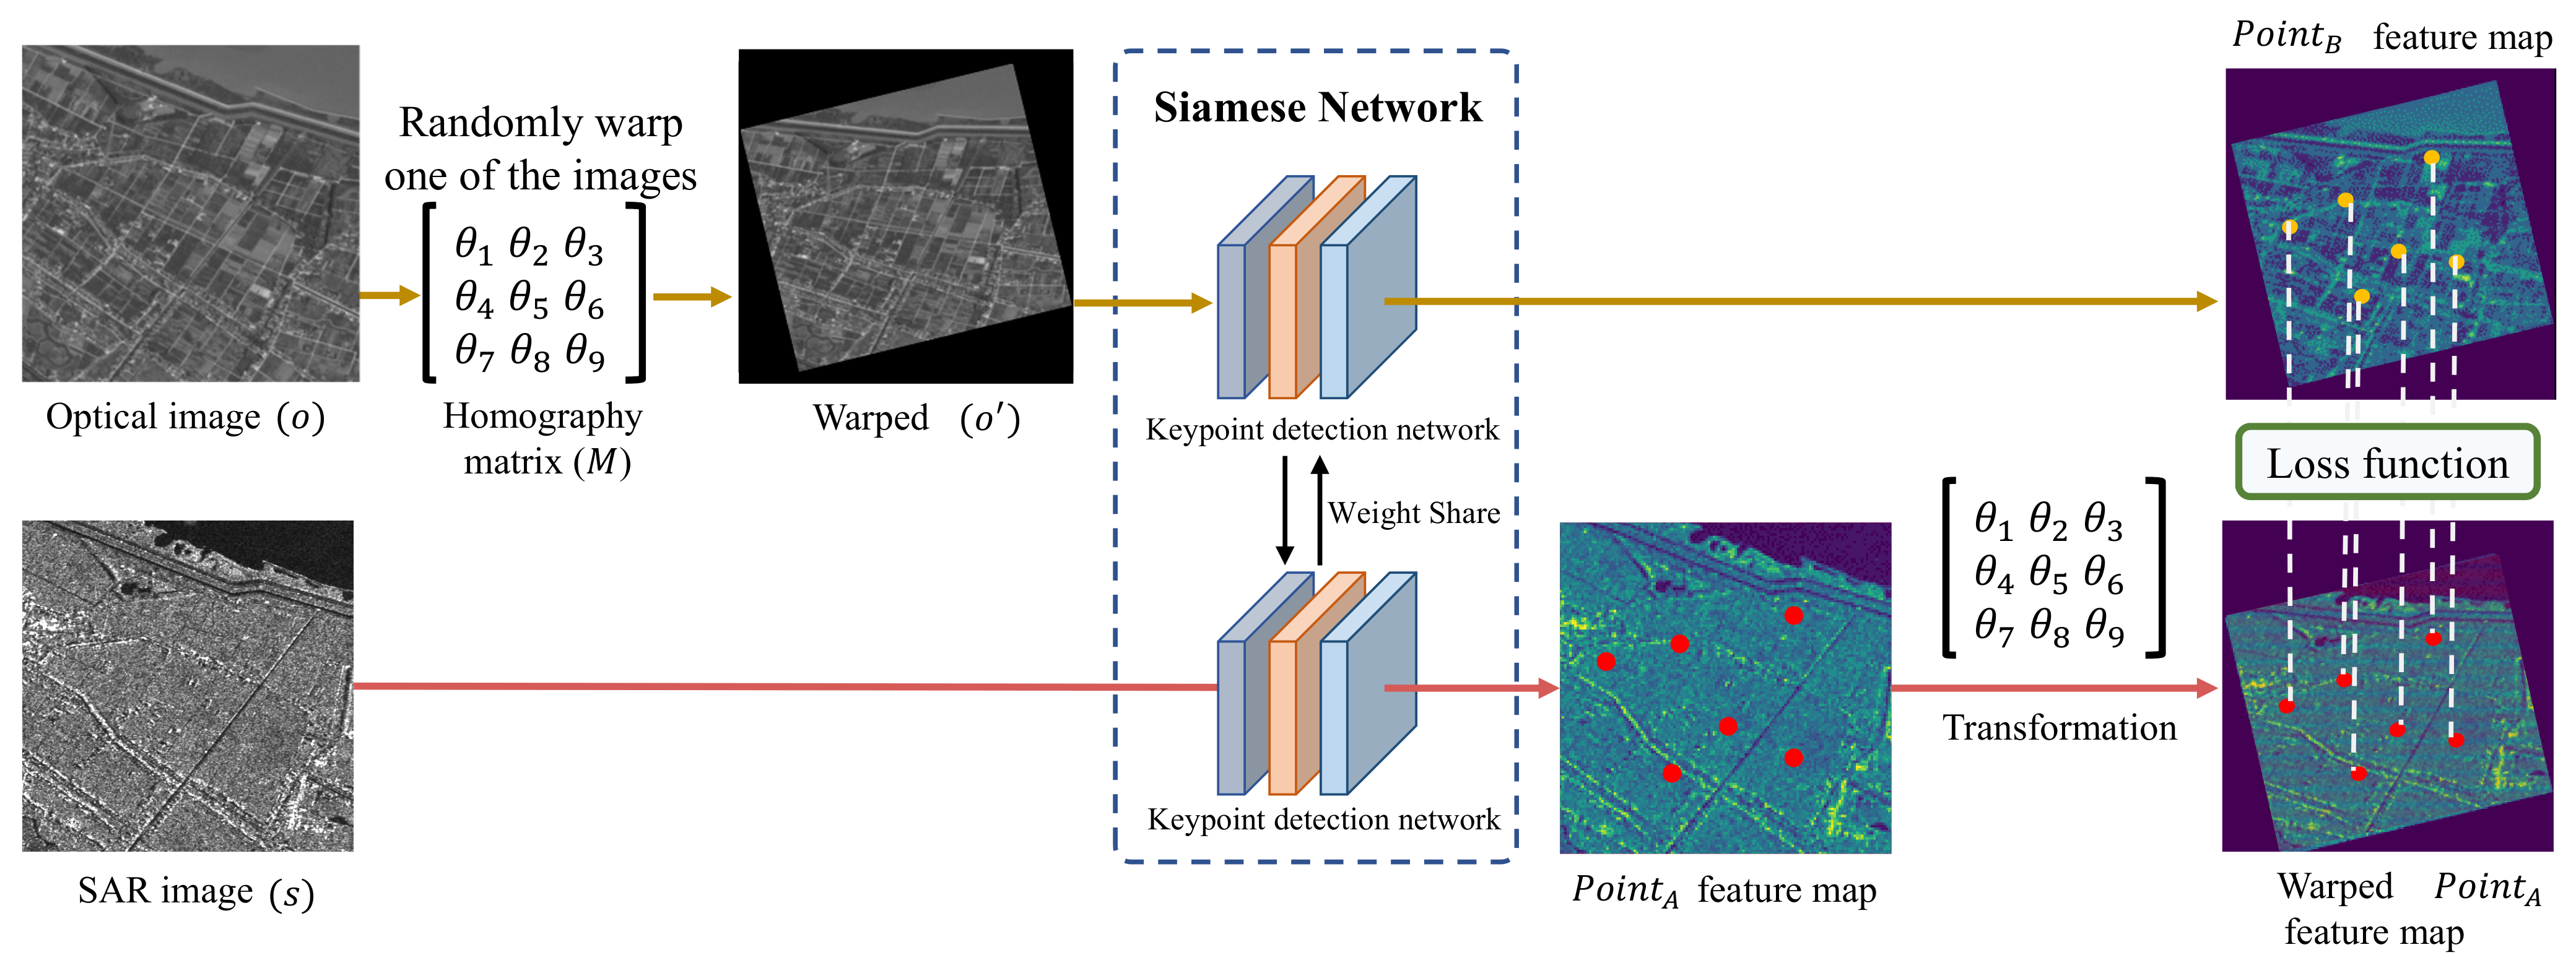
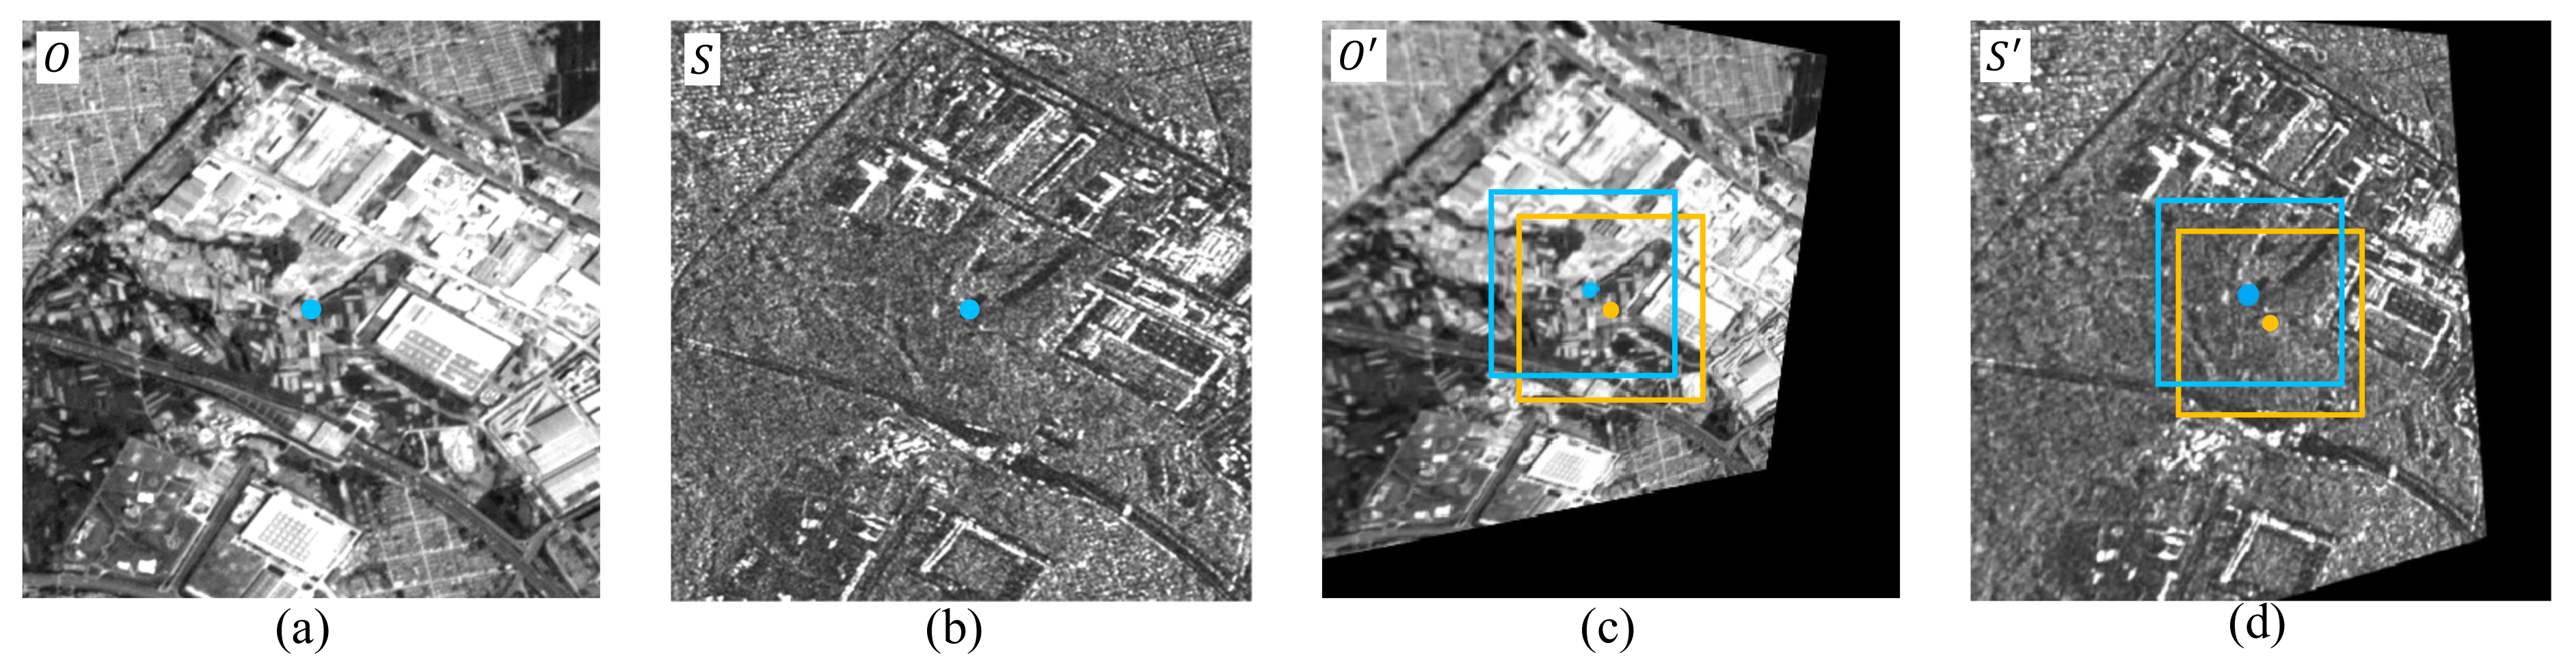
3.4. Positive and Negative Sample Generation

Figure 5 outlines the random sample generation method. Optical(O) and SAR(S) images are applied as an example. Let O and S be the optical and SAR images, which are pixel-aligned. First, O and S are warped by using two different projection transformation matrices, where the warped images are O and S . Then, a pair of corresponding points are selected in O and S , and the image patches of the same size are cropped centered on these two points as positive samples, which ensures that the center pixels of these two patches are matched. The O and S centroids before transformation are used as the reference points for cropping, where the blue boxes indicate the positive samples after cropping. In contrast, negative samples are obtained by cropping the image at a fixed position without selecting a match point in O and S, where the yellow box indicates a negative sample cropped at a fixed position.

3.5. Matching and Parameter Setting

Two factors determine the image matching performance in image registration: (1) the repeatability of keypoints; (2) the robustness of the keypoint descriptor. Therefore, a dataset with multimodal remote sensing images covering different scenes is employed for training the detection network. The weight combinations 0 , 0.1 , 0.3 , 0.6 , 1.0 are allocated to w 1 , w 2 , w 3 during the training and used to obtain stable keypoints. The parameter for the confidence threshold is set to 0.6.
The size of image patches input to the matching network invariably influences the robustness of keypoint feature descriptors, considering different imaging techniques are used in multimodal images. Therefore, patches with the size of 32 × 32, 48 × 48, 64 × 64, 96 × 96, 128 × 128 are selected for training to compare the performance of their keypoint descriptors and matching. Section 4 describes the detailed experimental results.
For the obtained correspondings, they are globally constrained by using the Randomized Sampling Consensus Algorithm (RANSAC) [47]. The point set is refined using the least squares algorithm to calculate the transformation matrix based on the obtained N matched point pairs. The sensed image is converted and aligned with the reference image according to the transformation matrix.

4. Experiments

In this section, we first introduce the dataset used to train the networks in Section 4.1. Then, we describe the details of evaluation metrics in Section 4.2. In Section 4.3, an ablation study is carried out to compare the performance between the network combination and scale weight parameters set in the detection network. Section 4.4 gives an ablation study for the cross-fusion matching network. Section 4.5 and Section 4.6 describe the performance of the proposed detection and matching network. In Section 4.7, the overall performance of our proposed method in multimodal image matching is evaluated.

4.1. Dataset

To train the network model, many optical and SAR images from the different areas are acquired to generate the dataset. The optical satellite sensor is SkySat, with a spatial resolution of 0.8 m. SAR images are acquired by Sentinel-1, which contains all the ground range detected scenes. Each scene is available in three resolutions and four band combinations (corresponding to the scene polarization). In the experiments, we used a combination of V V + V H polarizations. According to the above training data generation method, 70,000 pairs of images are used for detection network training and 120,000 positive and negative samples are generated for matching network training. The original images used to generate the dataset (available at https://github.com/liliangzhi110/SARopticaldataset (accessed on 25 June 2022)), are released for benchmark evaluation.
For the test dataset, the optical satellite sensor is GF-2, with a spatial resolution of 0.8 m. SAR images are acquired by GF-3, which is C-band multi-polarization SAR satellite with a resolution of 1 m. In this paper, all experiments are conducted on an AMAX workstation with Ubuntu 18.04 LTS, RTX3090Ti GPU, and 128 GB RAM, where the initial learning rate is 0.0001 and the number of epochs is 300 with an Adam optimizer.

4.2. Evaluation Metrics

The performance of the detection network and the cross-fusion matching network is evaluated using the following evaluation protocol.
Repeatability. The pixels with the same position between two images are recognized as a keypoint pair, indicating that the keypoint pairs at this position is reliable. We use the repeatability ( n / N ) to evaluate the performance of the detection network, where n , N are the number of repeatable and all keypoints obtained.
Mean Matching Accuracy (MMA). The performance of feature matching is evaluated by using the same definition of MMA as in D2-Net [33], which is the average percentage of correct matches in an image at a given threshold pixel.
Nearest Neighbor mean Average Precision (NN mAP). This metric evaluates the discriminative ability of the descriptor under multiple pixel thresholds. It is calculated by measuring area under curve of the Precision-Recall curve, using the nearest neighbor matching strategy.
Root-mean-square error(RMSR). We use RMSE to evaluate the overall performance of image matching. The calculation formula is as follows:
R M S E = 1 M i = 1 M x i x j 2 + y i y j 2 ,
where m is the number of matching points, x i , x j and y i , y j are the coordinates of the correspondence on the x-axis and y-axis, respectively.
Match Score (M.S.) This metric is used to measure the overall performance of the whole pipeline (detection and cross fusion matching). It evaluates the overall performance by calculating the ratio of the ground truth correspondences that can be recovered for the entire process to the number of keypoints extracted within the same scene for the entire pipeline.

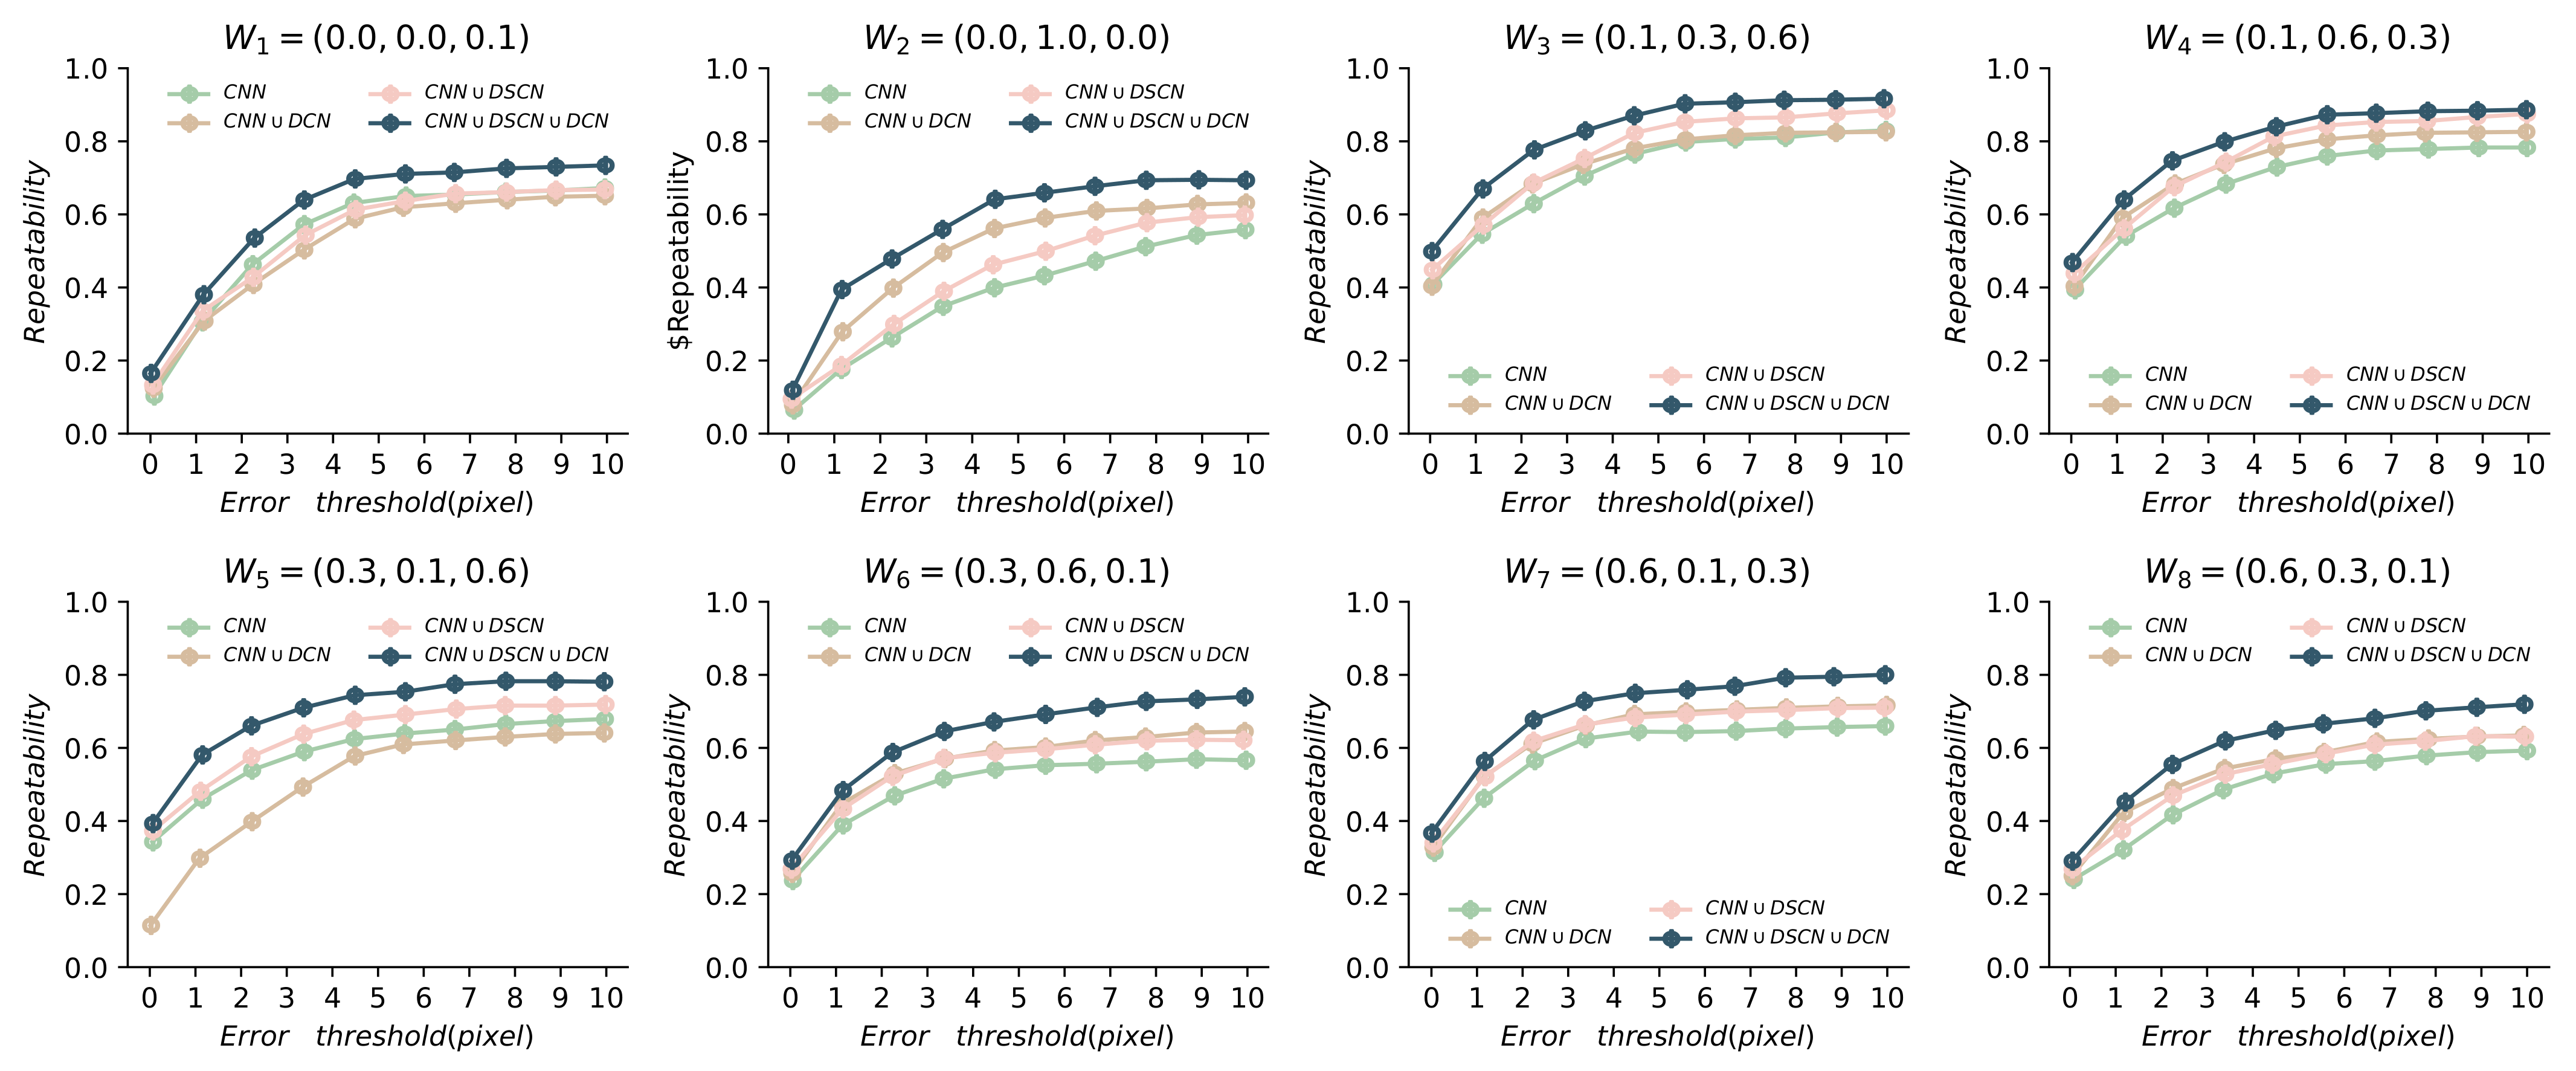
4.3. Ablation Study for the Detection Network

To aid in the design of the detection network described in Section 3, we made different combinations between the variants of the three-stage network. The three components were replaced with the original convolution, where the combinations are C N N , C N N D C N , C N N D S C N , C N N D S C N D C N .
In experiments, we analyzed the performance of keypoint detection by changing the combination of scale weighting parameters, where the scale parameter combinations could be enumerated as W 1 = ( 0.0 , 0 , 1.0 ) , W 2 = ( 0.0 , 1.0 , 0.0 ) , W 3 = ( 0.1 , 0.3 , 0.6 ) , W 4 = ( 0.1 , 0.6 , 0.3 ) , W 5 = ( 0.3 , 0.1 , 0.6 ) , W 6 = ( 0.3 , 0.6 , 0.1 ) , W 7 = ( 0.6 , 0.1 , 0.3 ) , W 8 = ( 0.6 , 0.3 , 0.1 ) for the Sconv-8/20, and DCN-2 weights varying between 0 and 1. Therefore, an ablation study was performed between network combinations and scale weight parameters. The repeatability with different pixel thresholds was used to measure the detection performance. The specific parameter combination is shown in Figure 6.
Overall, the repeatability of C N N D C N D S C N was higher than all the network combinations. C N N D C N could significantly improve the repeatability of keypoints compared to the C N N D S C N combination. It indicated that D C N could cope with the image distortion better. The best experimental results were given by the combination of W 3 = ( 0.1 , 0.3 , 0.6 ) , which was explained by the addition of feature multiscale information at different levels, while using the DSC layer to obtain geometric invariant features. In contrast, the single scale combination ( W 1 = ( 0 , 0 , 1 ) , W 2 = ( 0 , 1 , 0 ) ) were with a lower repeatability for keypoints. For the combination of multiple scales ( W 4 = ( 0.1 , 0.6 , 0.3 ) , W 5 = ( 0.3 , 0.1 , 0.6 ) , W 6 = ( 0.3 , 0.6 , 0.1 ) , W 7 = ( 0.6 , 0.1 , 0.3 ) , W 8 = ( 0.6 , 0.3 , 0.1 ) ), the higher weight was given to DCN-2, the higher the number of keypoints obtained, which proved the importance of DSC layers for the detection network feature extraction.
Figure 7 provided additional insights about the keypoints generated with different weight combinations. The keypoint feature maps generated by the combination ( W 3 = ( 0.1 , 0.3 , 0.6 ) , W 4 = ( 0.1 , 0.6 , 0.3 ) , W 7 = ( 0.6 , 0.1 , 0.3 ) , W 8 = ( 0.6 , 0.3 , 0.1 ) ) were selected to compare the repeatability of the keypoints. The distribution showed that the keypoint feature maps with local maxima (local peaks) could be generated with all scale weight combinations. From the comparison of W 3 = ( 0.1 , 0.3 , 0.6 ) and W 8 = ( 0.6 , 0.3 , 0.1 ) , they showed that the heatmap peaks of W 3 = ( 0.1 , 0.3 , 0.6 ) were more distinguishable, with better local smoothness. The heatmaps in W 4 = ( 0.1 , 0.6 , 0.3 ) and W 7 = ( 0.6 , 0.1 , 0.3 ) generated an irregular shape with peaks surrounding each other, lacking more distinguishable and concentrated keypoint peaks compared to W 3 = ( 0.1 , 0.3 , 0.6 ) .

4.4. Ablation Study for the Matching Network

To fully understand the matching network, four different variants were evaluated. ViT was employed as the basis network ( V i T B a s e ) in ablation studies. The network variants between the ViT and interaction fusion modules were performed for the experiments ( I n t e F ). Furthermore, ablation studies were conducted on the layers of the interaction fusion module, with n = 6 ( I n t e F ( l a y e r = 6 ) ), 8 ( I n t e F ( l a y e r = 8 ) ) as the number of layers. For a fair comparison, the random data during training was set to be deterministic. The performance of the cross-fusion matching network was evaluated using MMA and NN mAP with different pixel thresholds. Detailed results of the ablation tests are described in Table 2.
Table 2 depicted the matching results on the test dataset. The best matching performance was achieved by I n t e F . The overall performance on the test dataset was worse while using V i T B a s e . The average MMA and NN mAP were greatly enhanced when the ViT was replaced with an interactive fusion module. For I n t e F ( l a y e r = 6 ) , the MMA decreased at the 2–3 pixel thresholds, and the MMA decreased to 0.573 at 6 pixel thresholds. Overall, the NN mAP was reduced to 0.739. Similarly, for I n t e F ( l a y e r = 8 ) , the NN mAP decreased to 0.724. The MMA at 2–3 pixel threshold decreased to 0.130. This suggested that increasing the number of interaction fusion layers caused the network to be less accurate, which could be owing to the considerable rise in similarity and loss in distinguishability produced by the increased number of layers.

4.5. Repeatability of the Detection Network

The performance of the detection network was evaluated with the the state-of-art methods (SIFT, Affine-SIFT [48], RIFT [49], Superpoint [34] and R2D2 [35]). Random SAR-optical image pairs( P 1 P 12 ) were selected for testing, as shown in Figure 8. The network was assessed using the keypoint repeatability method. Confidence thresholds greater than 0.6 were considered keypoints in the proposed method.
Quantitative comparison.Table 3 gave an overview of keypoint repeatability results on P 1 P 12 . Overall, the proposed keypoint detection network achieved better performance. While Affine-SIFT generated a significant number of keypoints, the repeatability was poor. RIFT was higher than that of SIFT, which indicated that RIFT performed better for handling nonlinear radiation differences. However, its overall repeatability was lower than that of the proposed method, This might be that RIFT is built in a non-learning way for the specified sensor images, failing to obtain high reproducibility on the scene-rich test dataset. For Superpoint, its repeatability was lower than R2D2, which was since Superpoint used simulation data to train the keypoint, hardly reflecting the real remote sensing application scenes. For the R2D2 method, it found the correspondence by processing the images independently and did not consider the information differences between multimodal images, which made the repeatability of keypoints in multimodal images lower than our proposed method. The keypoint confidence threshold was used to filter keypoints on the proposed detection network, which determines the number of reproducible keypoints. Choosing a larger threshold could increase the repeatability of these keypoints, while reducing the overall number of keypoints. The confidence thresholds needed to be determined manually in practical applications. Therefore, we would study the algorithm for adaptive confidence threshold selection.
Qualitative comparison.Figure 8 showed the results of the detection on P 1 P 12 . The results showed that corresponding keypoints were produced on all image pairs, especially for the regions with more pronounced texture changes. For P 1 , P 4 and P 11 , the ships differ in number on the two images, producing responses that were not reproducible due to the multi-temporal observations. For image pairs with simple geometry, such as P 5 P 10 , their results were able to obtain responses at the same locations. For P 2 , P 3 , and P 10 , the number of keypoints on SAR images was significantly higher than that of optical images, however, the responses of optical images could find their counterparts in SAR images. For P 12 , the peak points produced at the same position were significantly lower than other effect pairs, which might be because of the significant radiometric difference on these two images, resulting in fewer responses of the keypoints at the same position.

4.6. Experimental Analysis of the Matching Network

In this section, numerous experiments were designed to test the effectiveness of the cross-fusion matching network. Individual pixel values were not relevant for feature description, hence image patches for feature matching required a certain scale size. Therefore, we first investigated the effect of input patch size on the performance of feature matching. Theoretically, larger patch sizes generated more identified and distinguished keypoint feature descriptors. To determine the optimal patch size, MMA with a 2.0 pixel threshold on the same dataset was evaluated in different patches sizes (32 × 32, 48 × 48, 64 × 64, 96 × 96 and 128 × 128), whose MMAs were 0.321, 0.539, 0.553, 0.596, 0.504, respectively. It illustrated that the matching performance gradually increased as the patch size increased and reached its highest value near the image patch with a size of 96 × 96, where the matching accuracy gradually leveled off. A patch with a size of 96 × 96 was selected as the following experimental size to improve the efficiency of the calculation while ensuring the matching performance.
To evaluate the effectiveness of the cross-fusion network for multimodal image matching, the proposed method was compared with SIFT, Affine-SIFT, RIFT, Superpoint, and R2D2. For SIFT and Affine-SIFT, they were matched by the Euclidean distance ratio between the corresponding feature nearest neighbors and second nearest neighbors with ratios of 0.60 , 0.70 , and 0.80 , respectively, where the best matching results were used for comparison. For RIFT, the matching parameters used in its online public code were used to conduct a comparison. For Superpoint and R2D2, the Euclidean distance was used to measure the similarity of feature descriptors. The MMA and NN mAP were used to measure the matching performance of the feature descriptors. The experimental results were shown in Figure 9.
The results showed that the proposed method significantly outperformed other methods in multimodal image matching, especially in the lower range of thresholds. It was worth mentioning that the learning-based methods overall outperformed SIFT, Affine-SIFT and RIFT, implying that the learning-based strategy might extract more robust features. Furthermore, the proposed method outperformed multi-task network-based detection and description methods (e.g., Superpoint and R2D2), demonstrating that the information fusion-based matching structure proved capable of communicating descriptor information, hence improving matching performance.

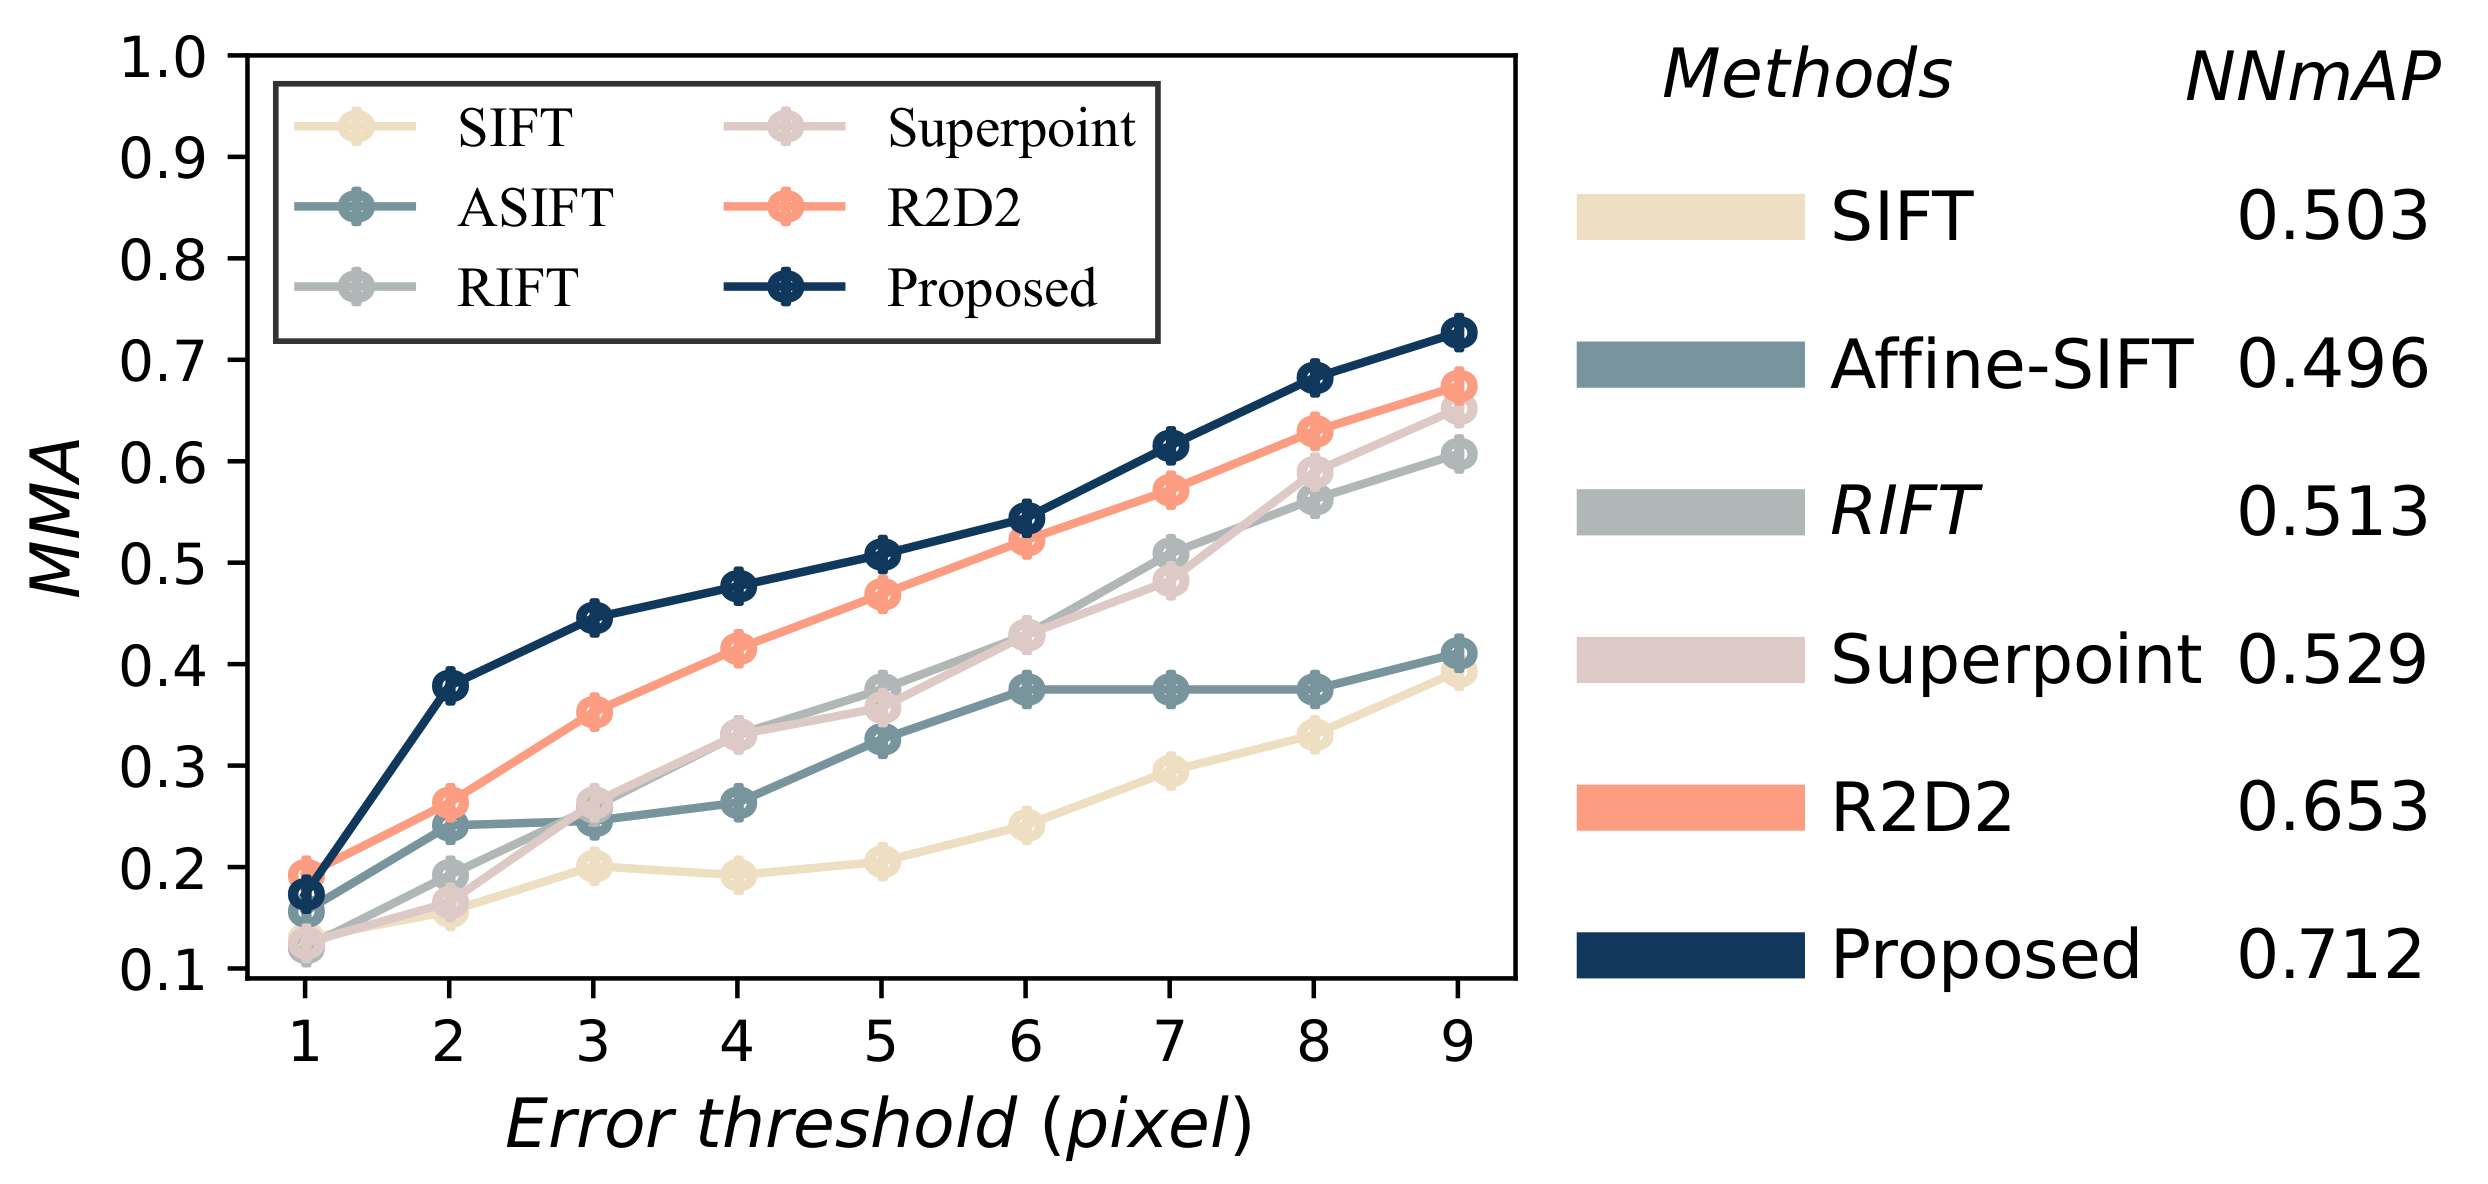
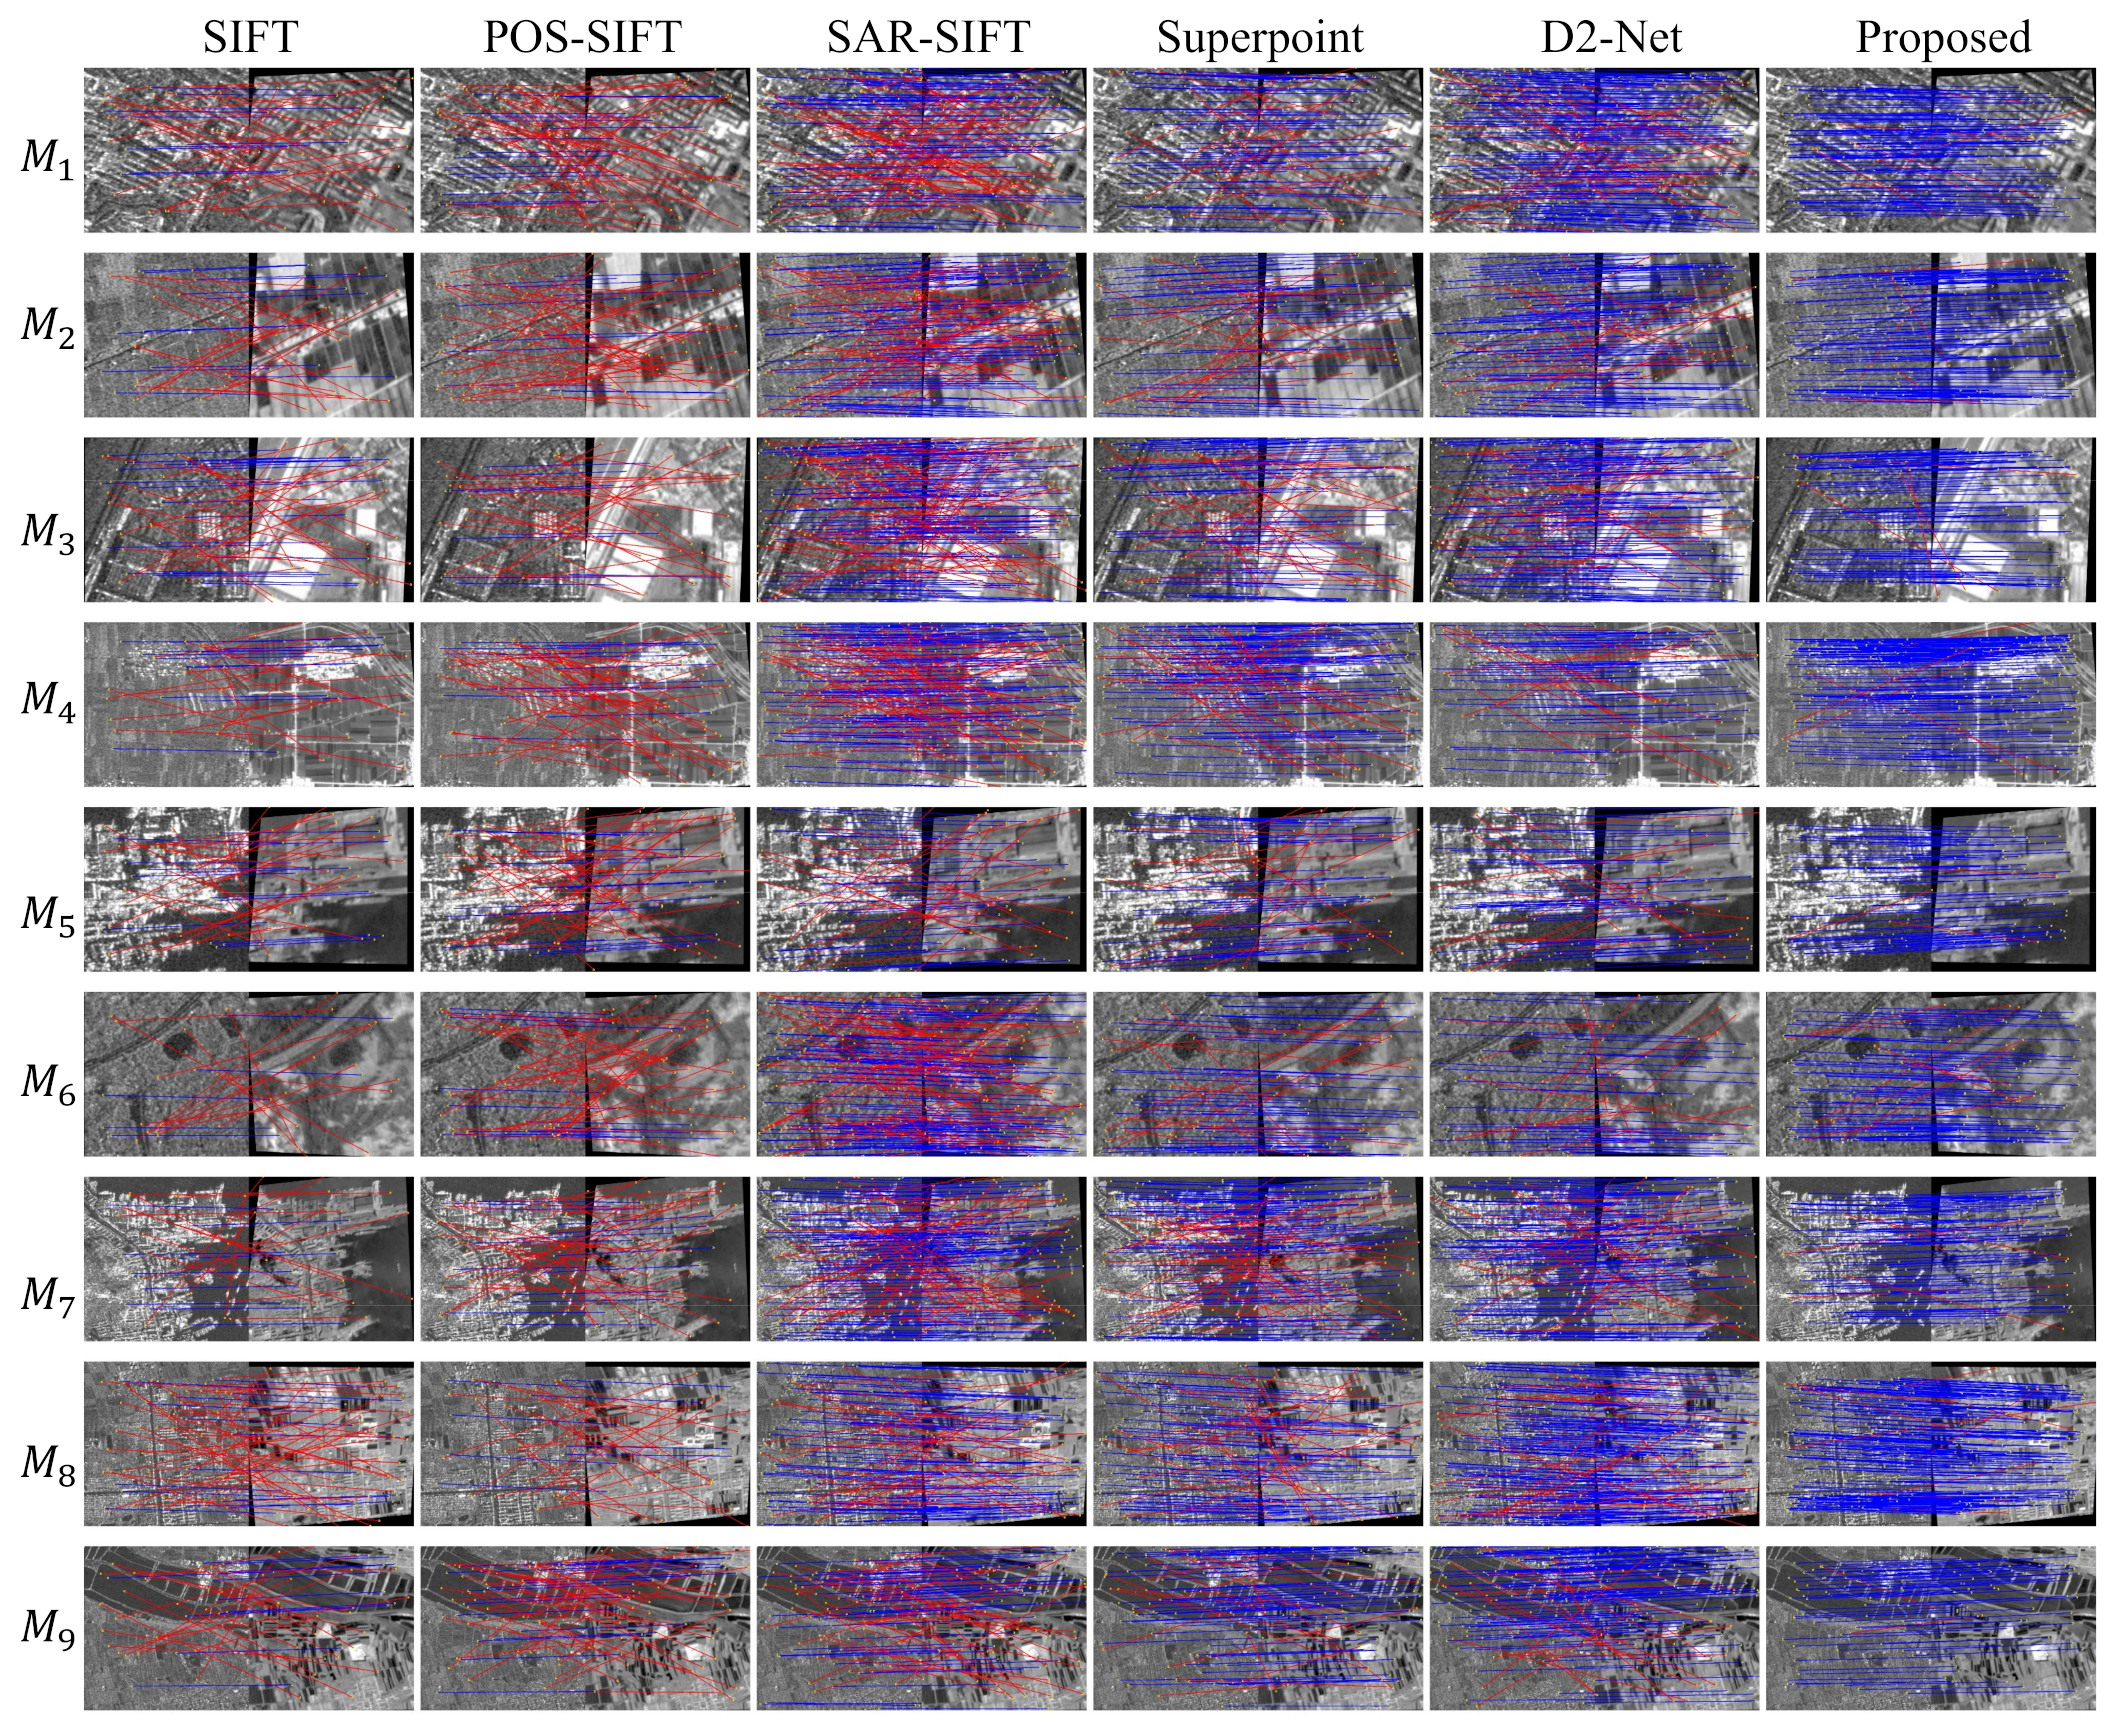
4.7. Overall Matching Performance

The effectiveness of the detection and matching networks had previously been assessed separately in prior studies; however, these experiments only examined the detection and matching networks separately and did not assess the total matching performance of the two networks. Accordingly, we jointly used them to match the test remote sensing images ( M 1 M 9 ) with geometric and radiometric differences, where each pair of images had a size of 512 × 512, as shown in Figure 10.
The keypoints obtained between images contained some matching points that did not have repeatability. Therefore, RANSAC was used to eliminate these mismatched points. The proposed method would be compared with the state-of-art methods based on keypoints (such as SIFT, POS-SIFT, SAR-SIFT, Superpoint and D2-Net). For the SIFT-based methods, they were matched by the Euclidean distance ratio between the corresponding features, and the ratios were 0.6 , 0.7 , 0.8 , 0.9 respectively. For Superpoint, the Euclidean distance was used to measure the similarity of feature matching. For D2-Net, the optimal combination of parameters was applied for comparison [35].
Table 4 listed the quantitative comparison among five methods. The M.S. and RMSE metrics were employed in the quantitative experiments. The proposed method provided higher M.S. and smaller RMSEs on these image pairs than existing comparative methods. SIFT presented the worst overall matching accuracy, which might be because the large radiometric differences between the SAR and optical images result in low repeatability of keypoints. Whereas the PSO-SIFT method used more constraints, which had a lower RMSE than SIFT, the overall matching results were unsatisfactory. For Superpoint, it obtained a lower M.S. on multimodal remote sensing images, which might be attributed to non-linear radiometric differences between images resulting in distinct feature descriptions. The Harris detector employed in SAR-SIFT was too sensitive to nonlinear radiometric differences, resulting in a low matching performance accuracy. The proposed method used a cross-fusion mechanism to make the network robust in both geometrical and radiometric variations, which obtained feature descriptions that fused the similarity between two images. Furthermore, the proposed method performed detection, description and matching on the original image, which enhanced image matching localization accuracy even more when compared to the R2D2 method for positioning on the output feature map.
Figure 10 presented the qualitative results of the proposed method’s overall performance, with blue lines indicating good matches and red indicating mismatches with a greater 4-pixel error. According to the results, the proposed method was capable of obtaining a uniformly distributed correspondence on all tested datasets. For SIFT and POS-SIFT, they could hardly obtain the correct correspondence, overall covered by the red line. SAR-SIFT for SAR and optical images obtained a higher number of correct correspondences. For Superpoint and D2-Net, the number of their correct correspondences was overall lower than that of the proposal. For the proposed method, the correspondence found on M 2 , M 4 , and M 9 was largely concentrated on construction areas, which could be since M 2 , M 4 , and M 9 were mostly covered by plants and water bodies with little textural differences. Overall, the proposed method was effective in providing correspondence on multimodal remote sensing images with geometrically and radiometrically invariant.
The above results demonstrated the effectiveness of the proposed detection and matching network for each step in the whole remote sensing image matching. Designing an applicable network for each step allowed the network to focus on the matching implementation of a single task. However, these separation steps in the implementation increased the complexity of data processing and required consideration of the appropriate parameters that should be selected in each step.

5. Conclusions

To obtain repeatable keypoints and cross-modal feature matching on multimodal remote sensing images, the self-supervised detection and cross-fusion matching networks are proposed in this paper. A detection network with weight-sharing allows keypoints to be automatically learned through self-supervised training. The cross-fusion matching network exchanges information between two images, transforming the multimodal image patches into robust feature descriptors. Specifically, this network unifies “description + matching” steps into one network for global optimization.
The experiment results demonstrate that the self-supervised detection network is capable of obtaining higher repeatability of keypoints on test datasets compared to SIFT, Affine-SIFT, RIFT, Superpoint and R2D2. We further evaluate the cross-fusion matching network, which can produce robust descriptors by the cross-fusion of image patches. For the overall performance, the average M.S and RMSE of the proposed method on the nine SAR-optical image pairs are about 0.298 and 3.41. Although two networks are proposed for the problems of detection and description in multimodal remote sensing image registration, this separate processing of tasks is still cumbersome. Therefore, we will study a unified network to achieve end-to-end matching in future studies.

Author Contributions

Conceptualization, L.L. and L.H.; methodology, L.L.; software, Y.Y.; validation, Y.Y., L.L. and L.H.; formal analysis, Y.Y. and L.H.; resources, L.L.; writing—original draft preparation, L.L.; writing—review and editing, Y.Y., L.H. and Y.Y; funding acquisition, L.H. All authors have read and agreed to the published version of the manuscript.

Funding

This work is supported by the National Science Foundation of China (No. 211035210511), the Fund Project of Shaanxi Key Laboratory of Land Consolidation (Grant No.2019-ZD04), the Science and Technology Department of Shaanxi Province (Grant 211435220242), the China Center for Remote Sensing of Natural Resources Aerial Mapping under (Grant 211735210034), the Natural Science Basic Research Program of Shaanxi (No. 2022JQ-247).

Data Availability Statement

The training data can be obtained from https://drive.google.com/drive/folders/14hLEvRynAeZQJDr5goXNXW5fwrsyM2jD?usp=sharing (accessed on 25 June 2022).

Acknowledgments

We are grateful to those involved in data processing and manuscript writing revision.

Conflicts of Interest

The authors declare no conflict of interest.

References

  1. Zhang, X.; Leng, C.; Hong, Y.; Pei, Z.; Cheng, I.; Basu, A. Multimodal Remote Sensing Image Registration Methods and Advancements: A Survey. Remote Sens. 2021, 13, 5128. [Google Scholar] [CrossRef]
  2. Dawn, S.; Saxena, V.; Sharma, B. Remote sensing image registration techniques: A survey. In Proceedings of the International Conference on Image and Signal Processing; Springer: Berlin/Heidelberg, Germany, 2010; pp. 103–112. [Google Scholar]
  3. Tondewad, M.P.S.; Dale, M.M.P. Remote sensing image registration methodology: Review and discussion. Procedia Comput. Sci. 2020, 171, 2390–2399. [Google Scholar] [CrossRef]
  4. Feng, R.; Shen, H.; Jianjun, B.; Li, X. Advances and opportunities in remote sensing image geometric registration: A systematic review of state-of-the-art approaches and future research directions. IEEE Geosci. Remote Sens. Mag. 2021, 9, 120–142. [Google Scholar] [CrossRef]
  5. Jiang, X.; Ma, J.; Xiao, G.; Shao, Z.; Guo, X. A review of multimodal image matching: Methods and applications. Inf. Fusion 2021, 73, 22–71. [Google Scholar] [CrossRef]
  6. Johnson, H.J.; Christensen, G.E. Consistent landmark and intensity-based image registration. IEEE Trans. Med. Imaging 2002, 21, 450–461. [Google Scholar] [CrossRef]
  7. Ma, W.; Wen, Z.; Wu, Y.; Jiao, L.; Gong, M.; Zheng, Y.; Liu, L. Remote sensing image registration with modified SIFT and enhanced feature matching. IEEE Geosci. Remote Sens. Lett. 2016, 14, 3–7. [Google Scholar] [CrossRef]
  8. Gonzalez, R.C.; Woods, R.E. Digital Image Processing. 2002. Available online: https://www.codecool.ir/extra/2020816204611411Digital.Image.Processing.4th.Edition.www.EBooksWorld.ir.pdf (accessed on 25 June 2022).
  9. Reddy, B.S.; Chatterji, B.N. An FFT-based technique for translation, rotation, and scale-invariant image registration. IEEE Trans. Image Process. 1996, 5, 1266–1271. [Google Scholar] [CrossRef] [Green Version]
  10. Ye, Y.; Bruzzone, L.; Shan, J.; Bovolo, F.; Zhu, Q. Fast and robust matching for multimodal remote sensing image registration. IEEE Trans. Geosci. Remote Sens. 2019, 57, 9059–9070. [Google Scholar] [CrossRef] [Green Version]
  11. Zhang, J.; Ma, W.; Wu, Y.; Jiao, L. Multimodal remote sensing image registration based on image transfer and local features. IEEE Geosci. Remote Sens. Lett. 2019, 16, 1210–1214. [Google Scholar] [CrossRef]
  12. Ng, P.C.; Henikoff, S. SIFT: Predicting amino acid changes that affect protein function. Nucleic Acids Res. 2003, 31, 3812–3814. [Google Scholar] [CrossRef] [Green Version]
  13. Xiang, Y.; Wang, F.; You, H. OS-SIFT: A robust SIFT-like algorithm for high-resolution optical-to-SAR image registration in suburban areas. IEEE Trans. Geosci. Remote Sens. 2018, 56, 3078–3090. [Google Scholar] [CrossRef]
  14. Fan, B.; Huo, C.; Pan, C.; Kong, Q. Registration of optical and SAR satellite images by exploring the spatial relationship of the improved SIFT. IEEE Geosci. Remote Sens. Lett. 2012, 10, 657–661. [Google Scholar] [CrossRef] [Green Version]
  15. Zhu, X.X.; Tuia, D.; Mou, L.; Xia, G.S.; Zhang, L.; Xu, F.; Fraundorfer, F. Deep learning in remote sensing: A comprehensive review and list of resources. IEEE Geosci. Remote Sens. Mag. 2017, 5, 8–36. [Google Scholar] [CrossRef] [Green Version]
  16. Tang, Y.; Zhu, M.; Chen, Z.; Wu, C.; Chen, B.; Li, C.; Li, L. Seismic performance evaluation of recycled aggregate concrete-filled steel tubular columns with field strain detected via a novel mark-free vision method. In Proceedings of the Structures; Elsevier: Amsterdam, The Netherlands, 2022; Volume 37, pp. 426–441. [Google Scholar]
  17. Kussul, N.; Lavreniuk, M.; Skakun, S.; Shelestov, A. Deep learning classification of land cover and crop types using remote sensing data. IEEE Geosci. Remote Sens. Lett. 2017, 14, 778–782. Available online: https://www.sciencedirect.com/science/article/abs/pii/S2352012421011747 (accessed on 25 June 2022). [CrossRef]
  18. Wang, H.; Lin, Y.; Xu, X.; Chen, Z.; Wu, Z.; Tang, Y. A Study on Long–Close Distance Coordination Control Strategy for Litchi Picking. Agronomy 2022, 12, 1520. [Google Scholar] [CrossRef]
  19. Yang, Z.; Dan, T.; Yang, Y. Multi-temporal remote sensing image registration using deep convolutional features. IEEE Access 2018, 6, 38544–38555. [Google Scholar] [CrossRef]
  20. Zhang, H.; Ni, W.; Yan, W.; Xiang, D.; Wu, J.; Yang, X.; Bian, H. Registration of multimodal remote sensing image based on deep fully convolutional neural network. IEEE J. Sel. Top. Appl. Earth Obs. Remote Sens. 2019, 12, 3028–3042. [Google Scholar] [CrossRef]
  21. Li, L.; Han, L.; Ding, M.; Liu, Z.; Cao, H. Remote sensing image registration based on deep learning regression model. IEEE Geosci. Remote Sens. Lett. 2020, 19, 1–5. [Google Scholar] [CrossRef]
  22. Gong, M.; Yang, H.; Zhang, P. Feature learning and change feature classification based on deep learning for ternary change detection in SAR images. ISPRS J. Photogramm. Remote Sens. 2017, 129, 212–225. [Google Scholar] [CrossRef]
  23. Qi, G.; Zhang, Y.; Wang, K.; Mazur, N.; Liu, Y.; Malaviya, D. Small Object Detection Method Based on Adaptive Spatial Parallel Convolution and Fast Multi-Scale Fusion. Remote Sens. 2022, 14, 420. [Google Scholar] [CrossRef]
  24. Kuppala, K.; Banda, S.; Barige, T.R. An overview of deep learning methods for image registration with focus on feature-based approaches. Int. J. Image Data Fusion 2020, 11, 113–135. [Google Scholar] [CrossRef]
  25. Bürgmann, T.; Koppe, W.; Schmitt, M. Matching of TerraSAR-X derived ground control points to optical image patches using deep learning. ISPRS J. Photogramm. Remote Sens. 2019, 158, 241–248. [Google Scholar] [CrossRef]
  26. Wang, S.; Quan, D.; Liang, X.; Ning, M.; Guo, Y.; Jiao, L. A deep learning framework for remote sensing image registration. ISPRS J. Photogramm. Remote Sens. 2018, 145, 148–164. [Google Scholar] [CrossRef]
  27. Kalchbrenner, N.; Grefenstette, E.; Blunsom, P. A convolutional neural network for modelling sentences. arXiv 2014, arXiv:1404.2188. [Google Scholar]
  28. Zhou, L.; Ye, Y.; Tang, T.; Nan, K.; Qin, Y. Robust Matching for SAR and Optical Images Using Multiscale Convolutional Gradient Features. IEEE Geosci. Remote Sens. Lett. 2021, 19, 4017605. [Google Scholar] [CrossRef]
  29. Ye, Y.; Tang, T.; Zhu, B.; Yang, C.; Li, B.; Hao, S. A multiscale framework with unsupervised learning for remote sensing image registration. IEEE Trans. Geosci. Remote Sens. 2022, 60, 1–15. [Google Scholar] [CrossRef]
  30. Hughes, L.H.; Marcos, D.; Lobry, S.; Tuia, D.; Schmitt, M. A deep learning framework for matching of SAR and optical imagery. ISPRS J. Photogramm. Remote Sens. 2020, 169, 166–179. [Google Scholar] [CrossRef]
  31. Hughes, L.H.; Merkle, N.; Bürgmann, T.; Auer, S.; Schmitt, M. Deep learning for SAR-optical image matching. In Proceedings of the IGARSS 2019-2019 IEEE International Geoscience and Remote Sensing Symposium, Yokohama, Japan, 28 July–2 August 2019; pp. 4877–4880. [Google Scholar]
  32. Li, L.; Han, L.; Ding, M.; Cao, H.; Hu, H. A deep learning semantic template matching framework for remote sensing image registration. ISPRS J. Photogramm. Remote Sens. 2021, 181, 205–217. [Google Scholar] [CrossRef]
  33. Dusmanu, M.; Rocco, I.; Pajdla, T.; Pollefeys, M.; Sivic, J.; Torii, A.; Sattler, T. D2-net: A trainable cnn for joint description and detection of local features. In Proceedings of the IEEE/cvf Conference on Computer Vision and Pattern Recognition, Long Beach, CA, USA, 15–20 June 2019; pp. 8092–8101. [Google Scholar]
  34. DeTone, D.; Malisiewicz, T.; Rabinovich, A. Superpoint: Self-supervised interest point detection and description. In Proceedings of the IEEE Conference on Computer Vision and Pattern Recognition Workshops, Salt Lake City, UT, USA, 18–22 June 2018; pp. 224–236. [Google Scholar]
  35. Revaud, J.; Weinzaepfel, P.; De Souza, C.; Pion, N.; Csurka, G.; Cabon, Y.; Humenberger, M. R2D2: Repeatable and reliable detector and descriptor. arXiv 2019, arXiv:1906.06195. [Google Scholar]
  36. Hannun, A.; Lee, A.; Xu, Q.; Collobert, R. Sequence-to-sequence speech recognition with time-depth separable convolutions. arXiv 2019, arXiv:1904.02619. [Google Scholar]
  37. Dai, J.; Qi, H.; Xiong, Y.; Li, Y.; Zhang, G.; Hu, H.; Wei, Y. Deformable convolutional networks. In Proceedings of the IEEE International Conference on Computer Vision, Venice, Italy, 22–29 October 2017; pp. 764–773. [Google Scholar]
  38. He, K.; Zhang, X.; Ren, S.; Sun, J. Spatial pyramid pooling in deep convolutional networks for visual recognition. IEEE Trans. Pattern Anal. Mach. Intell. 2015, 37, 1904–1916. [Google Scholar] [CrossRef] [Green Version]
  39. Liu, S.; Huang, D.; Wang, Y. Receptive field block net for accurate and fast object detection. In Proceedings of the European Conference on Computer Vision (ECCV), Munich, Germany, 8–14 September 2018; pp. 385–400. [Google Scholar]
  40. Chen, L.C.; Papandreou, G.; Kokkinos, I.; Murphy, K.; Yuille, A.L. Deeplab: Semantic image segmentation with deep convolutional nets, atrous convolution, and fully connected crfs. IEEE Trans. Pattern Anal. Mach. Intell. 2017, 40, 834–848. [Google Scholar] [CrossRef] [Green Version]
  41. Zhao, H.; Shi, J.; Qi, X.; Wang, X.; Jia, J. Pyramid scene parsing network. In Proceedings of the IEEE Conference on Computer Vision and Pattern Recognition, Honolulu, HI, USA, 21–26 July 2017; pp. 2881–2890. [Google Scholar]
  42. Lin, T.Y.; Dollár, P.; Girshick, R.; He, K.; Hariharan, B.; Belongie, S. Feature pyramid networks for object detection. In Proceedings of the IEEE Conference on Computer Vision and Pattern Recognition, Honolulu, HI, USA, 21–26 July 2017; pp. 2117–2125. [Google Scholar]
  43. Dosovitskiy, A.; Beyer, L.; Kolesnikov, A.; Weissenborn, D.; Zhai, X.; Unterthiner, T.; Dehghani, M.; Minderer, M.; Heigold, G.; Gelly, S.; et al. An image is worth 16 × 16 words: Transformers for image recognition at scale. arXiv 2020, arXiv:2010.11929. [Google Scholar]
  44. Agarap, A.F. Deep learning using rectified linear units (relu). arXiv 2018, arXiv:1803.08375. [Google Scholar]
  45. Ioffe, S.; Szegedy, C. Batch normalization: Accelerating deep network training by reducing internal covariate shift. In Proceedings of the International Conference on Machine Learning, PMLR, Lille, France, 7–9 July 2015; pp. 448–456. [Google Scholar]
  46. Zheng, H.; Yang, Z.; Liu, W.; Liang, J.; Li, Y. Improving deep neural networks using softplus units. In Proceedings of the 2015 International Joint Conference on Neural Networks (IJCNN), Killarney, Ireland, 12–17 July 2015; pp. 1–4. [Google Scholar]
  47. Chum, O.; Matas, J.; Kittler, J. Locally optimized RANSAC. In Proceedings of the Joint Pattern Recognition Symposium; Springer: Berlin/Heidelberg, Germany, 2003; pp. 236–243. [Google Scholar]
  48. Yu, G.; Morel, J.M. ASIFT: An algorithm for fully affine invariant comparison. Image Process. Line 2011, 1, 11–38. [Google Scholar] [CrossRef] [Green Version]
  49. Li, J.; Hu, Q.; Ai, M. RIFT: Multi-modal image matching based on radiation-invariant feature transform. arXiv 2018, arXiv:1804.09493. [Google Scholar]
Figure 1. Flowchart of the multimodal remote sensing image matching framework. (a) Keypoint detection network. The detection network parameterizes the multimodal remote sensing image (R and S) and calculates the responses for keypoints from three scales to generate the keypoint feature maps ( F e a t u r e M a p r and F e a t u r e M a p s ). (b) Matching network. The matching network performs global interaction fusion of all patches cropped from k e y p o i n t o and k e y p o i n t s , which is used to obtain similarity feature descriptions ( S ( i ) and S ( j ) ) with cross-modal matching. The matching matrix is used to describe the matching correspondence of all candidate patches.
Remotesensing 14 03599 g001
Figure 2. Illustration of peakiness measurement extracted by local- and channel-feature maps.
Remotesensing 14 03599 g002
Figure 3. Self-supervised training process for keypoints. First, a randomly selected image from a strictly pixel-aligned remote sensing image is subjected to a projection transformation. Then, the warped image and the other image are simultaneously fed into the detection network with shared weights for feature point extraction. Finally, the losses of corresponding keypoints are computed by the projection transformation relationship.
Remotesensing 14 03599 g003
Figure 4. (a) Cross-fusion matching network architecture. N C denotes the number of times the network structure is executed. (b) Encode layer.
Remotesensing 14 03599 g004
Figure 5. Illustration of the generation process for positive and negative samples. (a,b) are the pixel-aligned optical and SAR images (O and S). (c,d) are the warped images ( O , S ) by random projection transformation matrices.
Remotesensing 14 03599 g005
Figure 6. Comparison between network combinations and scale weight parameters with different pixel error thresholds.
Remotesensing 14 03599 g006
Figure 7. Example of keypoint feature maps generated from different weight combinations. (a) is the original remote sensing image. (be) are the keypoint feature maps results with weight combinations W 3 = ( 0.1 , 0.3 , 0.6 ) , W 4 = ( 0.1 , 0.6 , 0.3 ) , W 7 = ( 0.6 , 0.1 , 0.3 ) , W 8 = ( 0.6 , 0.3 , 0.1 ) .
Remotesensing 14 03599 g007
Figure 8. Qualitative comparison results on P 1 P 12 .
Remotesensing 14 03599 g008
Figure 9. Comparison of different error thresholds using MMA and NN mAP evaluation results, where the comparison methods include SIFT, Affine-SIFT, RIFT, Superpoint and R2D2. The abbreviation for Affine-SIFT is ASIFT.
Remotesensing 14 03599 g009
Figure 10. Qualitative matching results by the overall network on M 1 M 9 , where the blue lines indicate correct matching and the red lines indicate incorrect correspondences.
Remotesensing 14 03599 g010
Table 1. Detection network structure parameters. The abbreviations are as follows: C: CNN layer; S: DSC layer; D: DCN layer; mp: maximum pooling layer.
LayerSizeOperation
c-0/1 w × h × 32 / × 64 3 × 3 c
c-2 w × h × 32 3 × 3 c
S-0/1/2 w × h × 64 / × 64 / × 64 2 × 2 c; mp
c-3 w × h × 32 3 × 3 c
S-3/4/5 ( w / 2 ) × ( h / 2 ) × 64 / × 64 / × 64 1 × 1 c; 3 × 3 c; mp
c-4 w × h × 32 / × 64 3 × 3 c
S-6/7/8 ( w / 4 ) × ( h / 4 ) × 128 / × 128 / × 128 1 × 1 c; 3 × 3 c; mp
S-9/10/11 ( w / 8 ) × ( h / 8 ) × 256 / × 256 / × 256 1 × 1 c; 3 × 3 c
S-1220 ( w / 8 ) × ( h / 8 ) × 512 / × 512 1 × 1 c; 3 × 3 c
D-0/1/2 ( w / 8 ) × ( h / 8 ) × 128 / × 128 / × 128 3 × 3 c
Table 2. Ablation test results in cross-modal networks.
MMA NNmAP
≤2 px(%)≤3 px(%)≤4 px(%)≤5 px(%)≤6 px(%) ( % )
V i T B a s e 0.1060.1290.5640.2930.426 0.675
I n t e F 0.1160.1710.6350.3980.559 0.743
I n t e F ( l a y e r = 6 ) 0.1340.1360.5720.3870.573 0.739
I n t e F ( l a y e r = 8 ) 0.1070.1300.5800.3730.569 0.724
Table 3. The repeatability of keypoints on P 1 P 12 .
Repeatability
SIFTASIFTRIFTSuperpointR2D2Proposed
P 1 0.0610.2270.2010.2950.3610.391
P 2 0.0870.1330.3270.2900.4590.503
P 3 0.1030.1160.1970.2550.3910.426
P 4 0.0930.2350.2490.4070.4890.473
P 5 0.0610.1350.3270.3370.3640.437
P 6 0.0850.0960.2070.3400.4200.466
P 7 0.0640.1450.1180.3830.4590.416
P 8 0.0530.2300.3010.3740.2520.398
P 9 0.0770.1080.1430.2670.3820.471
P 10 0.0780.0980.3150.3540.4630.452
P 11 0.0680.2300.2430.3820.3090.316
P 12 0.1150.1380.2250.4510.4710.473
Table 4. The repeatability of matching points. D 1 , D 2 , D 3 , D 4 , D 5 , D 6 are urban, suburban, industrial, pond, port and mountain scenes respectively.
P 1 P 2 P 3 P 4 P 5 P 6 P 7 P 8 P 9
M.S.RMSEM.S.RMSEM.S.RMSEM.S.RMSEM.S.RMSEM.S.RMSEM.S.RMSEM.S.RMSEM.S.RMSE
SIFT0.1587.550.1859.50.1369.930.1698.010.1988.10.1058.190.1659.650.1828.950.1579.95
POS-SIFT0.1659.390.1167.810.1459.850.0978.470.0848.050.1497.650.1489.380.1649.350.1427.55
SAR-SIFT0.1635.740.2475.860.1885.740.2265.060.2456.030.1555.790.2276.530.1585.430.2056.14
Superpoint0.2453.950.2414.720.2553.650.2783.350.2954.220.2914.950.2114.360.3064.590.3063.81
D2-Net0.3133.870.1984.670.1914.620.2283.870.1914.460.1784.950.2134.290.3254.150.2404.93
Proposed0.3623.100.2883.060.2463.520.2763.380.3483.940.2323.220.2463.260.3483.490.3063.76
Publisher’s Note: MDPI stays neutral with regard to jurisdictional claims in published maps and institutional affiliations.

