Abstract
To control the quality of X-band marine radar images for retrieving information and improve the inversion accuracy, the research on rainfall detection from marine radar images is investigated in this paper. Currently, the difference in the correlation characteristic between the rain-contaminated radar image and the rain-free radar image is utilized to detect rainfall. However, only the correlation coefficient at a position in the lagged azimuth is utilized, and a statistical hard threshold is adopted. By deeply investigating the difference between the calculated correlation characteristic and the marine radar images, the correlation coefficient in the lagged azimuth can be used to constitute the correlation coefficient feature vector (CCFV). Then, an unsupervised K-means clustering learning method is used to obtain the clustering centers. Based on the constituted CCFV and the K-means clustering algorithm, a new method of rainfall detection from the collected X-band marine radar images is proposed. The acquired X-band marine radar images are utilized to verify the effectiveness of the proposed rainfall detection method. Compared with the zero-pixel percentage (ZPP) method, the correlation coefficient difference (CCD) method, the support vector machine (SVM) method and the wave texture difference (WTD) method, the experimental results demonstrate that the proposed method could finish the task of rainfall detection, and the detection accuracy increases by , , and , respectively, for the proportion of the training dataset.
1. Introduction
Due to the low cost of the non-coherent X-band marine radar, it is commonly utilized for ship navigation and has been widely used to measure sea wave parameters in recent years [1,2,3]. The wavelength of the electromagnetic wave of the X-band radar is about 3 cm. Due to the influence of the ocean and the meteorological environment, the collected X-band marine radar image is the backscatter echo intensity of the rough sea surface and usually captures the sea clutter from the observed sea surface. The collected X-band radar image also contains some non-wave information, such as rainfall interference, since the marine radar is sensitive to rainfall.
Rainfall determination based on diverse radars has recently attracted more attention [4]. A fuzzy logic algorithm is used to separate the rainfall and the non-rainfall echo based on the acquired polarimetric radar data [5]. A composite-weighted algorithm is utilized to retrieve rainfall for the X-band polarimetric radar data [6]. At a high temporal resolution of 1 min, the rainfall detection is completed by using rain-induced microwave attenuation [7]. With the rapid development of artificial intelligence, the convolutional neural network, instead of the traditional exponential relation between radar reflectivity factors and precipitation, is used to estimate the precipitation [8]. However, the weather radar installation for rain intensity monitoring is strictly limited by the shortage of spectrum resources on a ship. Meanwhile, the design of adding a meteorological channel to a coherent warning radar is deeply troubled by the “radar fingerprint” exposure. When the shipborne marine radar is used for navigation safety, the obtained radar echo image can be used for rainfall detection. This is particularly critical for saving ship resources and controlling equipment costs. Although the non-coherent X-band marine radar only outputs intensity, the X-band marine radar commonly has a high temporal resolution of the second order compared to the weather radar. Thus, the research on rainfall detection from the non-coherent X-band marine radar is developed to control the radar quality for improving the inversion accuracy and reliability of wave parameters.
When the marine radar illuminates the sea surface, raindrops will change the roughness of the sea surface and affect the propagation of the electromagnetic wave. Meanwhile, the echo intensity of the radar image increases with the increase in sea surface roughness [9,10]. The existing rainfall interference changes the texture features of the sea wave in the radar image, which decreases the quality of the radar image and the reliability of the extracted wave information [11]. Thus, the rain-free radar images are commonly utilized to extract wave parameters and wind information.
Currently, inversion methods for extracting sea-state parameters and wind information from rain-contaminated radar images are being developed. The wind parameters are obtained from the rain-contaminated radar images based on the ensemble empirical mode decomposition and the texture feature of the echo intensity [12,13]. Based on the S-band marine radar, the feasibility of retrieving wave information during precipitation is investigated [14]. However, the retrieving accuracy of the wave parameters is limited when the utilized radar image contains rainfall interference. To improve the reliability and accuracy of wave parameters extracted from a rain-contaminated radar image, a novel method based on the wavelet transform is utilized to eliminate the influence of rainfall on the radar image [15].
The inversion technology of retrieving ocean environmental information from rain-contaminated radar images is different from that from rain-free radar images, since the rain changes the texture of the images. To control the quality of radar images and improve the retrieving accuracy, it is necessary to detect whether the collected radar image contains rainfall interference before retrieving wave parameters. Meanwhile, the research on rainfall detection from collected X-band marine radar images has recently attracted much attention. Therefore, we focus on rainfall detection technology from the selected analysis area of the X-band marine radar images in this paper.
By investigating the influence of rainfall on the backscatter echo characteristics of sea waves, it is found that the rainfall intensity is proportional to the echo intensity of the radar image. Moreover, a difference in the spatial texture between the rain-contaminated image and the rain-free radar image exists. The statistical parameters, such as mean value, standard deviation and correlation coefficient of the radar image, are used to detect rainfall [16]. Since the influence of rainfall interference on echo intensity is complex, these statistical parameters are not entirely suitable for the task of rainfall detection, and the performance of the rainfall detection needs to be further improved. Based on the fact that the number of zero intensity pixels varies with the rainfall intensity, a parameter index of the zero-pixel percentage (ZPP), which is the percentage of the number of zero intensity pixels in the whole image, is proposed to detect whether the radar image contains rainfall interference [17]. However, the threshold value needs to be reset for different radar platforms, which seriously limits the application of the ZPP method. Based on the rough sea surface model and the radiative transfer model, the backscatter model of rainfall over the sea surface is developed for the synthetic aperture radar [18]. Based on the feature that the image echo intensity changes with rainfall intensity, a support vector machine (SVM) scheme is proposed to detect the rain-contaminated radar image [19]. A histogram of the radar echo intensity is utilized to extract the rainfall feature. Based on the extracted intensity feature and the SVM-based algorithm, the proposed method can accurately classify rainfall images [20]. Based on the extracted texture feature vector and the hierarchical agglomerative clustering technology, the difference in the echo intensity is used to distinguish the low-backscatter region and the rainfall region from the collected X-band marine radar images [21]. Based on the difference in the average echo intensity between a rain-contaminated radar image and a rain-free radar image, a rainfall detection method combining the ZPP and the average echo intensity is proposed in [22]. The detection accuracy of the method is higher than that of the ZPP method, but the determination of the threshold value depends on abundant experimental data and the engineering experience. Based on the correlation characteristic of sea clutter, a new rainfall detection method, which is called the correlation coefficient difference (CCD) method that uses the difference in the correlation coefficient in the azimuth between the rain-free radar images and the rain-contaminated radar images is proposed in [23]. The CCD-based method completes the task of rainfall detection by analyzing the CCD characteristic of echo intensity in the collected marine radar images. The experiment demonstrates that the calculated correlation coefficient of the rain-free radar image is higher than that of the rain-contaminated radar image. However, only the correlation coefficient at a lagged azimuth is utilized to detect the rainfall image. Based on the wave texture difference (WTD), a consecutive pixel method is used to detect the rainfall radar images in [24]. Although the WTD-based method of rainfall detection has good detection performance, both the threshold value and the wave direction are required in advance. The wave direction could be retrieved from the rain-free marine radar image. However, it is difficult to accurately measure the wave direction from the rain-contaminated radar images.
Recently, an unsupervised machine learning algorithm has been introduced into X-band marine image processing for rainfall detection and recognition. Since the K-means clustering learning method is easy to implement and the principle is simple, the K-means clustering algorithm has been utilized for rainfall detection based on the video data and the satellite images. Based on the K-means clustering algorithm, a histogram model is proposed for the application of rainfall detection from the video data [25]. Then, a method for heavy rain detection and removal from the video image is developed [26]. Because of the complexity of rainfall in the video image, the pixel of the video image is classified based on the optimized K-means clustering algorithm. To detect the information change of the satellite image, a novel approach is proposed by combining principal component analysis, which is used to extract the feature, and the K-means clustering algorithm [27,28]. Based on the measurement of the minimum Euclidean distance, rainfall detection is achieved by assigning each image pixel to different clusters. The monthly precipitation data provided by the meteorological organization are used to verify the effectiveness of the proposed method. In [29], an algorithm is proposed to detect the raindrops based on K-means clustering technology and the median filtering strategy. In [30], based on the K-means algorithm, a method using the Gaussian mixture model is proposed to predict the rainfall intensity. The performance of the rainfall prediction is demonstrated based on the obtained satellite images. Meanwhile, the random-forest-based classification model is used to mitigate the rain effect, and the clustering model based on the self-organizing map is used to extract the regions with blurry wave signatures [31]. Then, a convolutional neural network is used to calibrate the rain-contaminated radar images [32]. Experimental results show that the proposed scheme could obtain relatively high inversion accuracy. To identify the rain-contaminated region from the marine radar images, a method based on the texture features is proposed [33]. The discrete wavelet transform and the Gabor filter are utilized to generate feature vectors. Based on the collected shipborne marine radars under different rain conditions, the experimental results show that the proposed method could effectively detect rain-contaminated pixels of the radar image. Since the rain-contaminated radar images deteriorate the performance of ocean remote sensing, a novel method is proposed to detect and segment rain-contaminated regions in the marine radar images based on a deep neural network model [34]. For retrieving the wave direction, the ZPP of the occlusion area of the radar image is utilized to distinguish the rain-free radar images [35].
Although the K-means clustering algorithm could be utilized to detect rainfall interference from the video data and the satellite images, the imaging mechanism of the sea wave and rainfall in the X-band marine radar image is different from that of the video data and the satellite images. At the same time, the characteristic of rainfall in the X-band marine radar images is different from that of the satellite images. Until now, the K-means clustering algorithm has not been used to detect rain-contaminated images from collected X-band marine radar images. Based on the difference in the correlation coefficients between the rain-free radar image and the rain-contaminated radar image, the correlation coefficient feature vector (CCFV) could be constructed from the calculated correlation coefficient in the lagged azimuth. Since a difference in extracted CCFVs between rain-free radar images and rain-contaminated radar images exists, it is possible to detect the rainfall image based on the CCFVs. Thus, a method of rainfall detection using the constructed CCFV and an unsupervised K-means clustering method is proposed in this paper to control the quality of the radar image. For the rainfall detection of the proposed method, a detection threshold value is not required since the K-means clustering learning method is adopted.
The organization of the paper is as follows: The radar configuration and radar data are described in Section 1. Based on the difference in the correlation coefficient characteristic, the detection method of the rain-contaminated images from the acquired X-band marine radar images is described in Section 2. Section 3 presents the proposed rainfall detection method using the constructed CCFV and the K-means clustering algorithm. The effectiveness of the proposed method is certified based on the acquired X-band marine radar images in Section 4. Finally, the discussion and conclusion are summarized.
2. Radar Data Overview
The collected radar data based on the 760B marine radar on 14–18 December 2013 were utilized to certify the effectiveness and analyze the performance of the proposed method. The detailed configuration parameters of the marine radar are shown in Table 1. The output analog signal of the marine radar is digitized by a 14-bit high-speed acquisition card. Then, the collected signal, which is called the backscatter echo intensity, is mapped to the range between 0 and 2.5 V. The original marine radar image acquired on 15 December at 21:33 with a rainfall rate of 2 mm/5 min is shown in Figure 1. The heading of the radar image is 6 from the north. The wind direction and wind speed are 35 and 13.7 m/s, respectively. The significant wave height of the sea wave is 2.1 m. The fan-shaped area composed of the red solid line in Figure 1 is the sea observation area of the X-band marine radar. The yellow part of the fan-shaped area is the superposition of the sea clutter and the rainfall interference. The blue part is mainly the background noise. From Figure 1, it can be observed that the X-band marine radar is sensitive to rainfall. The texture feature of the sea wave cannot be observed clearly due to the influence of the rainfall interference on the backscatter echo intensity.

Table 1.
The configuration parameters of X-band marine radar.
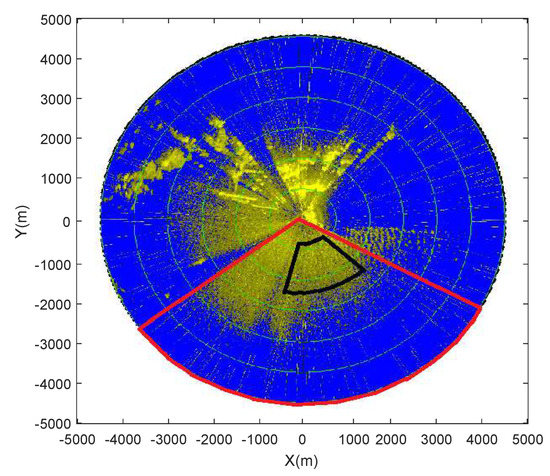
Figure 1.
The original rain-contaminated marine radar image.
Considering the decay of the radar signal in distance and the texture feature of the observation area, the observation region in the azimuth from 125 to 190 and at a distance of 900 m to 1800 m, which is denoted by the black solid line in Figure 1, was selected for analysis. Meanwhile, the echo intensity of the selected analysis area in the azimuth is used to obtain the correlation coefficient and calculate the CCFV. The image resolution in distance is 7.5 m. Thus, 120 sets of the correlation coefficient in the lagged azimuth are obtained and are averaged to achieve the averaged correlation coefficient and construct the CCFV for rainfall detection in our experiment.
The simultaneous rainfall rate was recorded by the rain gauge, and the cumulative rainfall per 5 min as the reference value is presented in Figure 2. The horizontal axis is the data number. The vertical axis is the simultaneous rainfall rate. The resolution of the rain gauge is 1 mm/min. The rainfall rate changes from 0 to 7 mm/5 min. Since the rainfall intensity changes rapidly, the rain intensity of 5 min is used to minimize the measurement error for light rain in this experiment.
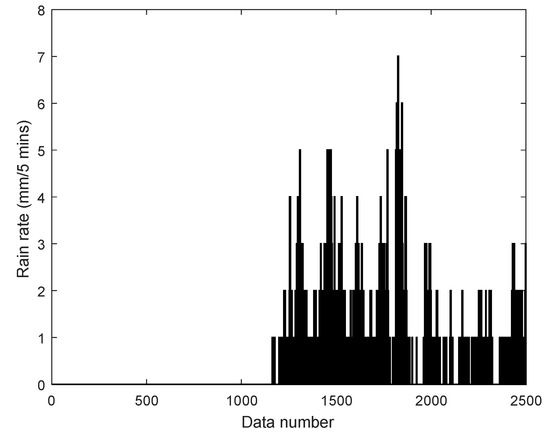
Figure 2.
The simultaneous rainfall rate during the experiment.
3. Rainfall Detection Based on the CCD
Since the texture feature of the rain-contaminated radar image is different from that of the rain-free image, the methods of extracting wave parameters and wind information from the rain-contaminated image and the rain-free radar image are different. Thus, the research on rainfall detection from the acquired X-band marine radar images is extremely necessary and important. In this section, a rainfall detection method based on the CCD between the rain-contaminated image and the rain-free image is briefly reviewed [23].
3.1. The Calculation of the Correlation Coefficient
The sea clutter in the marine radar image has a strong correlation in the spatial domain and the temporal domain. The echo intensity of the radar image and the correlation characteristic of the sea clutter will change when the high-frequency rainfall component is introduced into the radar image. Thus, the correlation coefficient between the rain-contaminated radar image and the rain-free radar image should be different. For the collected X-band marine radar images, the correlation characteristic can be described by the autocorrelation coefficient in the distance direction and the azimuth direction, respectively. Then, the radar image, whether or not it is contaminated by rainfall, can be distinguished by comparing the calculated correlation coefficient with a threshold value.
Since the calculated CCD from the radar images in the azimuth is more dominant than that in the distance [23], the CCD in the azimuth is used to distinguish the rain-contaminated radar images. The autocorrelation coefficient of the radar echo image in the azimuth is defined as
where is the backscatter echo intensity, is the azimuth angle, is related to the lagged angle in azimuth, and denotes the expectation of the echo intensity. When the correlation coefficient is close to one, the positive correlation characteristic of the echo signal is strong. However, the correlation characteristic is weak when the correlation coefficient is close to 0. Based on the X-band marine radar images, the task of rainfall detection can be finished by utilizing the CCD under different rainfall conditions.
3.2. The Detection Principle of the CCD-Based Method
The radar data in the azimuth are used to analyze the spatial correlation of the sea clutter images. Based on the correlation characteristic of the sea clutter, the task of rainfall detection is conducted by comparing the correlation coefficient at a position of the lagged azimuth with the threshold value 1/e [23]. Thus, the task of rainfall detection is described as follows
where is the threshold value 1/e, denotes that the radar image is rain-contaminated, and denotes the rain-free radar image.
4. The Proposed Rainfall Detection Method Based on the Constructed CCFV
Since the CCD between the rain-contaminated radar image and the rain-free image exists in the lagged azimuth, the feature of the correlation characteristic in the azimuth is used to constitute the CCFV and execute the task of rainfall detection. The rainfall detection from the marine radar images can be recognized as the task of classification. Due to the simple principle and the convenience of the implementation, the unsupervised K-means clustering learning method is adopted to divide the extracted CCFVs into the rain-free and rain-contaminated classifications. Based on the CCFV and the K-means clustering algorithm, a new method for rainfall detection from the collected X-band marine radar images is proposed in this paper.
Based on the acquired radar images, the analysis area is selected after filtering the co-frequency interference noise of the radar images. A method for detecting and suppressing co-frequency interference noise in X-band marine radar images is proposed in [36]. The data lines containing co-frequency interference noise in the distance direction are detected from radar images by using the correlation, and a Laplace enhancement template is used to traverse the detected data line to locate the noise points. Then, the interpolation method with the adjacent information is used to repair the located co-frequency interference. Subsequently, the correlation coefficient of the radar image in the azimuth can be calculated based on Equation (1). The CCFV is established by determining the length of the vector and selecting the correlation coefficient in the lagged azimuth. For the unsupervised K-means clustering algorithm, the recorded ≈2500 radar images are randomly divided into a training and a testing dataset. For the proportion of the 50% training dataset, both the training dataset and the testing dataset have 625 rain-free images and 624 rain-contaminated images. The CCFVs of the training dataset are used to obtain the clustering centers. After setting the number of clustering centers, the clustering center of the rain-contaminated images and the clustering center of the rain-free images can be determined based on the K-means clustering technology and the training dataset. Eventually, the rain-contaminated radar images can be detected by comparing the measurement distance between the CCFV of the testing dataset and the obtained clustering centers. A flowchart of the proposed rainfall detection method is presented in Figure 3. In our radar system, the received signal is mainly the system thermal noise when the echo intensity is less than the threshold value of 983 for the 14-bit acquisition card. For the selected analysis area in Figure 1, which is surrounded by a black solid line, the low backscatter direction is determined when the mean of the echo intensity in a distance direction is less than the threshold value of 983. The radar image is discarded when the low backscatter direction percentage is higher than 90%, since the correlation coefficient of the sea clutter is used to detect the rain-contaminated radar image [37,38]. Thus, the control strategy of the image quality in [37,38] is adopted to control the quality of the marine radar image.
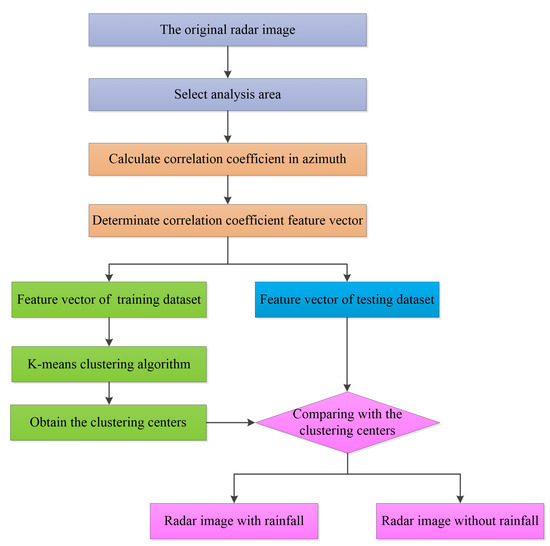
Figure 3.
The flowchart of the proposed rainfall detection method.
4.1. The Determination of the CCFV
Based on the correlation of the sea clutter in the spatial domain and the azimuth resolution of the marine, the detailed determination of the CCFV is given below. By statistical analysis of the correlation characteristic of the collected X-band radar images, the autocorrelation coefficient of the collected radar images in the lagged azimuth is presented in Figure 4. The horizontal axis and the vertical axis denote the lagged angle in the azimuth and the calculated correlation coefficient, respectively. The blue solid line with the circle represents the correlation coefficient of the rain-free radar image, and the red dotted line with the star represents the correlation coefficient of the rain-contaminated radar images with the rainfall intensity of 2 mm/5 min. At the same time, the significant wave height of the sea state is 2.3 m, and the average wind speed of the sea surface is 12.4 m/s. The marine radar antenna is m, and the horizontal beamwidth is about in our experiment. The number of data lines of the radar image in the azimuth is . However, the antenna angular speed of the marine radar is not even, due to the influence of the sea surface wind. Meanwhile, the loss of the backscattered echo exists because of the fluctuation in the sea surface. Thus, the data lines in a radar image are different in practice. The number of the azimuthal line in a horizontal beamwidth is about 13.
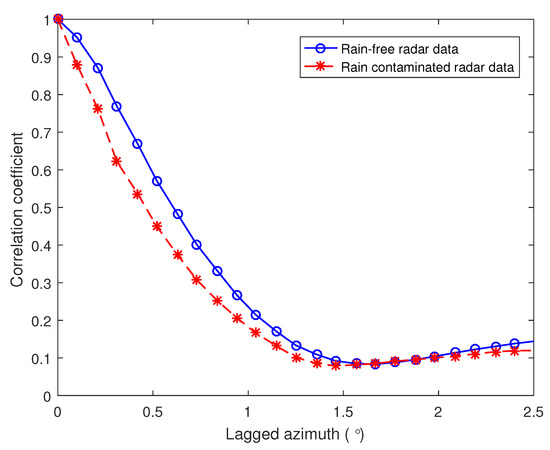
Figure 4.
The correlation coefficient in the lagged azimuth under different rainfall conditions.
The spatial correlation of the sea clutter is determined by both the correlation feature of the sea clutter and the horizontal beamwidth of the antenna of the observed radar system [39,40]. The calculated correlation coefficient of the rain-contaminated image in the azimuth based on Equation (1) is different from that of the rain-free image. Unfortunately, only the correlation characteristic near the position of the half horizontal beamwidth is utilized to detect rainfall for the CCD-based rainfall detection method. Moreover, the correlation coefficient of the rain-contaminated radar image may be higher than the hard threshold at the position of half horizontal beamwidth, since the backscatter mechanism of the marine radar image is complex under rainfall conditions.
From Figure 4, it can be observed that the autocorrelation coefficient of the rain-free radar image in the azimuth is larger than that of the rain-contaminated image when the lagged azimuth is less than 1.4, which is close to the horizontal beamwidth of the radar antenna. When the lagged azimuth is less than the horizontal beamwidth , both the rain-contaminated images and the rain-free images have a high correlation coefficient, since the illumination area of the marine radar in a horizontal beamwidth partially overlaps. However, when the lagged azimuth is greater than 1.4, the correlation coefficient of the rain-contaminated radar image is close to that of the rain-free radar image. In this paper, the obtained CCFV in the lagged azimuth instead of the correlation coefficient at a fixed position in azimuth is used to execute the task of rainfall detection. Thus, the correlation coefficient of the lagged azimuth less than 1.4 can be selected to establish the CCFV.
From Figure 4, we found that the difference in the correlation coefficient between the rain-contaminated radar images and the rain-free radar images is relatively large, from to in the azimuth. When the established CCFV contains the element where the difference between the rain-contaminated images and the rain-free images is small, it is disadvantageous for distinguishing the rain-contaminated radar image. The correlation coefficient of the rain-contaminated images may be close to the correlation coefficient of the rain-free images when the lagged azimuth is less than . The correlation coefficient in the azimuth from to is selected to constitute the feature vector. Hence, the selected CCFV contains eight bins in this paper.
4.2. The Unsupervised K-Means Clustering Learning Algorithm
The task of rainfall detection can be considered as classifying the radar images into rain-free and rain-contaminated clusters. The marine radar images are used to constitute both the training dataset and the testing dataset, which contain the rain-contaminated radar images and the rain-free radar images. Based on the technology of the K-means clustering algorithm, the obtained CCFV of the training dataset can be used to achieve the clustering centers of the rain-contaminated and the rain-free images. Subsequently, the CCFV of the testing datasets can be classified into the cluster of rain-free or the cluster of rain-contaminated images. Then, the rainfall images can be detected by measuring the distance between the CCFV and each cluster center.
The main idea of the K-means clustering algorithm is to divide the training dataset into different categories through the iterative process to optimize the criterion function, which is used to evaluate the clustering performance. For the K-means clustering algorithm, the cost function is used to evaluate the clustering performance. Supposing the training dataset S contains K cluster subsets , the cost function is given as
where is the clustering center of the i-th cluster, and the data point belongs to the cluster . The clustering process, which is used to seek the best clustering center , is subject to minimizing the cost function V. To obtain the cost function V, it is necessary to calculate the square sum of the Euclidean distance from the CCFV in each cluster to each clustering center. Then, the cost function V is achieved by summing the K distance square. The K clustering process of dataset S is commonly finished when the value of the cost function V is lowest. The general step of the K-means clustering algorithm is given below [41,42,43]:
- Input the training dataset , which is the extracted CCFV from the X-band marine radar images, and set the number of categories K. The feature dataset should be divided into categories of the rain-contaminated radar images and the rain-free radar images.
- Initialize the clustering center. Select K elements from the extracted dataset S as the initial clustering center of the cluster , where denotes the new clustering center of the cluster after n iterations.
- Categorize the obtained CCFV. The Euclidean distance between each CCFV and each clustering center can be calculated in turn. Based on the criterion of the minimum distance, each CCFV will be divided into the cluster where the CCFV is nearest to the clustering center.
- Update the K clustering centers. For cluster , the obtained clustering center after j iterations iswhere is the number of the chosen CCFVs of the clustering cluster . The K-means clustering algorithm is trying to seek the clustering centers of the rain-contaminated radar images and the rain-free radar images based on the testing dataset.
- Determine whether the classification ends. If , the K-means algorithm converges, and the clustering process ends. Otherwise, we continue to perform the clustering adjustment in steps 3 and 4. In practice, the condition is not easy to satisfy. Commonly, we set the number of iterations in advance or suppose that the process of the iteration ends when the absolute error between the clustering center and the clustering center is close to zero.
Based on the above K-means clustering algorithm, the clustering centers of the rain-contaminated radar images and the rain-free radar images can be determined by using the training dataset.
4.3. Calculate the Distance between CCFV and Clustering Centers
Based on the achieved K clustering centers from the CCFVs in the training dataset, the Euclidean distance between the CCFV in the testing dataset and the cluster centers can be described as
where denotes the Euclidean distance between the CCFV and the clustering center i-th.
For the task of rainfall detection from the acquired marine radar images, it is important to distinguish whether the collected radar image is rain-contaminated. Supposing that and are respectively the clustering center of the rain-contaminated images and the clustering center of the rain-free images, the task of rainfall detection can be implemented by distinguishing the Euclidean distance between the CCFV and the clustering center of the rain-contaminated radar images. When the Euclidean distance between the CCFV of the testing dataset and the clustering center of the rain-contaminated radar images is less than that between the CCFV and the clustering center of the rain-free radar images, the radar image is recognized as rain-contaminated; otherwise, vice versa.
4.4. The Determination of the Number of the Clustering Centers
To determine the number of clustering centers K, 300 rain-contaminated images and 300 rain-free images were randomly selected to generate the clustering centers based on the constructed CCFV and the K-means clustering algorithm, respectively. Figure 5 shows the generated clustering centers based on the randomly selected radar images for . For the rain-free images, the generated clustering centers are presented in Figure 5a. The distance between the two clustering centers is relatively close. Figure 5b is the obtained clustering centers based on the rain-contaminated images. From Figure 5, it can be observed that the difference of clustering centers of the rain-contaminated radar images is larger than that of the rain-free radar images.
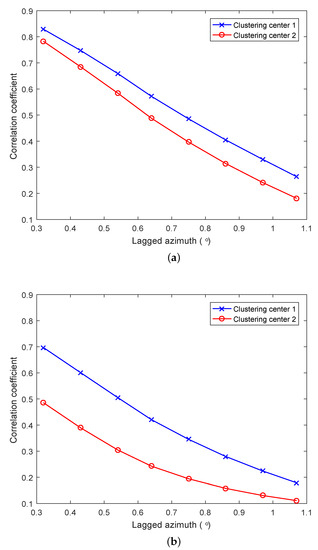
Figure 5.
The generated clustering centers: (a) the clustering centers of rain-free images; (b) the clustering centers of rain-contaminated images.
For the task of rainfall detection, it is necessary to detect whether the collected radar image is rain-contaminated. Based on the constructed CCFV of the training dataset and the K-means clustering algorithm, the calculated clustering centers are presented in Figure 6. Figure 6a,b are the obtained clustering centers for and , respectively, based on the training dataset. In Figure 6a, the blue solid line with the cross is clustering center 1, which denotes the clustering center of the rain-free radar images. The red solid line with the circle is clustering center 2, which denotes the clustering center of the rain-contaminated radar images. From Figure 6a, it can be found that the detection performance of the proposed method is not ideal when the number of the clustering center K is set to 2. Since the variation range of the rainfall rate is large, the difference between the CCFV of the radar image with heavy rain and the CCFV of the radar image with light rain is larger than that between the CCFV of the rain-free radar image and the CCFV of the radar image with light rain. Thus, one obtained clustering center based on the CCFV is the rain-contaminated radar image with heavy rain. The other clustering center is the rain-free radar image and the radar image contaminated by light and moderate rain, since the clustering center of the rain-free radar image is close to that of the radar image contaminated by light or moderate rain.
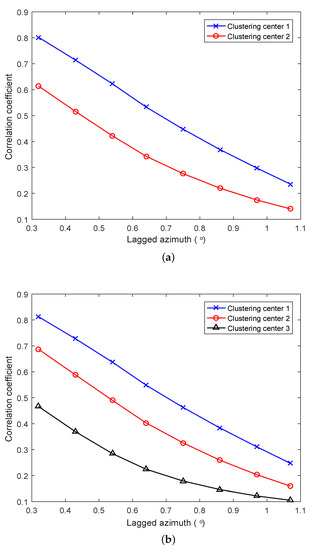
Figure 6.
The obtained clustering centers by using the CCFVs: (a) the obtained clustering centers for ; (b) the obtained clustering centers for .
In Figure 6b, the blue solid line with the cross is clustering center 1, which denotes the clustering center of the rain-free radar images. The red solid line with the circle is clustering center 2, which denotes the clustering center of the marine radar images contaminated by light and moderate rain. The black solid line with the triangle is clustering center 3, which denotes the clustering center of the marine radar images contaminated by heavy rain. From Figure 6, it can be observed that the difference in the correlation coefficient between clustering center 1 and clustering center 2 is still relatively large. Thus, clustering center 1 and clustering center 2 can be easily separated. Since the difference in the correlation coefficient between clustering center 1 and clustering center 3 is large, it is easy to detect the radar images with heavy rain from the acquired marine images. The software of Matlab and the K-means functions are used to execute the K-means clustering process. The maximum number of iterations is set to 100, and the iteration process is ended in advance when the absolute error of the extracted clustering centers is zero.
Compared with Figure 5, we observed that the obtained clustering center of the rain-free images in Figure 6b is similar to that of rain-free images in Figure 5a, and the clustering centers of the rain-contaminated images could perfectly denote that of rain-contaminated images in Figure 5b. However, it is hard to accurately distinguish radar images when the extracted CCFV is between clustering center 1 and clustering center 2 for . Therefore, we set the number of the clustering centers to distinguish the rain-free and the rain-contaminated radar images under different rainfall rates.
4.5. Rainfall Detection Principle of the Proposed Method
Based on the obtained Euclidean distance , , between the CCFV and the clustering center i, the task of rainfall detection for the number of the clustering center can be described as
where is the Euclidean distance between the CCFV and the clustering center 1 of the rain-free images. Since and are the distance between the CCFV and the clustering centers of the rain-contaminated images, the task of rainfall detection is induced to detect the rain-free radar images. When the Euclidean distance between the CCFV of the radar image of the testing dataset and clustering center 1, which is the clustering center of the rain-free radar images, is the lowest, the radar image is rain-free; otherwise, the radar image is rain-contaminated.
5. Experimental Results and Analysis
Compared with the record of the simultaneous rain gauge, the effectiveness of the proposed method for rainfall detection is certified in this section. First, the analysis area is selected from the radar image to calculate the correlation coefficient. Then, the CCFV is constructed by using the obtained correlation coefficient and is used to generate the clustering centers based on the randomly selected training dataset and the K-means clustering algorithm. Finally, the task of rainfall detection is completed by comparing the calculated Euclidean distances between the clustering centers and the CCFV of the testing dataset. Meanwhile, the performance of the rainfall detection is analyzed by comparing the proposed method with the ZPP method, the CCD-based method, the SVM-based method and the WTD-based method. In the experiment, the radar data are randomly divided into a training dataset and testing dataset. The training radar data are used to obtain the clustering centers for the number of clustering centers K = 3, and only the testing radar data are used to evaluate the performance of the method. The radar data for rainfall detection and the detailed detection results are given below.
5.1. Experimental Results
From 14–18 December, we acquired about 2500 marine radar images, including rain-free and rain-contaminated images, respectively, which were selected to verify the effectiveness of the proposed rainfall detection method.Meanwhile, the percentage distribution of the rain-contaminated radar images under different rainfall rates is presented in Table 2. The rain-contaminated radar images with rainfall rates between 1 mm/5 min and 3 mm/5 min are dominant. To ensure that the clusters are represented in a balanced way for the rain-contaminated images, the number of rain-contaminated radar images with 1 mm/5 min is approximately equal to that of the remaining rain-contaminated radar images. Since the rain-contaminated radar images with a rainfall rate greater than 3 mm/5 min are less, two clusters could represent the clustering centers of the rain-contaminated radar images well. With the increase in the rainfall rate, the correlation coefficient and the CCFV of the rain-contaminated decrease. Thus, it is easy to detect the rain-contaminated images with heavy rain.

Table 2.
The percentage distribution of the rain-contaminated radar images under different rainfall rates.
The randomly selected 50% of the available radar images is used to build up the training dataset. Then, the remaining radar images are applied to constitute the testing dataset. Both the training dataset and testing dataset have balanced rain-free and rain-contaminated images. For the proportion of 50% of the training dataset, the percentage of rain-contaminated images for the training and testing dataset is presented in Table 2. In this paper, the difference in the correlation coefficient in the lagged azimuth is selected to generate the CCFV, and the proposed rainfall detection method uses the CCFV to complete the task of rainfall detection. Based on the extracted CCFV and the K-means clustering algorithm, the clustering centers can be extracted by using the training dataset. Meanwhile, the Euclidean distance between the CCFV and the clustering centers can be calculated based on the testing dataset.
For a testing dataset with a proportion of 50 % radar images, the Euclidean distance between the CCFV and the clustering centers is shown in Figure 7. The first-half data and the second-half data are the rain-free images and the rain-contaminated images, respectively. The horizontal axis denotes the data number during the experiment. The vertical axis denotes the calculated Euclidean distance. The blue solid line, red solid line and black solid line denote the Euclidean distance between the calculated CCFV and clustering center 1, clustering center 2 and clustering center 3, respectively. When the calculated Euclidean distance from the extracted CCFV is closest to a clustering center, the collected radar images belong to this cluster. Cluster 1 denotes the distance between the CCFV and the clustering center of the rain-free radar images. Cluster 2 and Cluster 3 denote the distance between the CCFV and the clustering center of the rain-contaminated radar images. Thus, the task of rainfall detection from the X-band marine radar images is deduced to detect the rain-free radar images from the collected dataset. For , the rain-free radar images can be detected by judging whether the calculated Euclidean distance between the CCFV of the testing dataset and the clustering center 1 is the smallest.
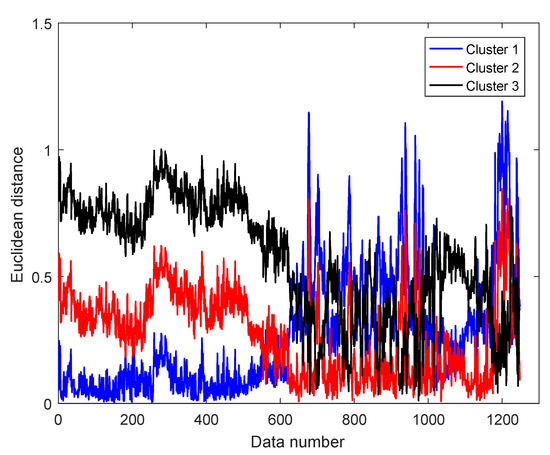
Figure 7.
The calculated Euclidean distance between the CCFV of the testing dataset and the clustering centers.
The detection result of the proposed method is presented in Figure 8. The vertical axis is the detection result. When the detected radar image is rain-contaminated, the radar image is labeled as 1. Otherwise, the radar image is labeled as 0. For the testing dataset, the detection success rate is 94.2% by using the obtained clustering centers from the training dataset, where the detection success rate of the rain-free radar images is 96.8% and the detection success rate of the rain-contaminated radar images is 91.7%. By comparing the detection performance between the rain-free radar image and the rain-contaminated radar image, it can be found that the detection accuracy of the rain-free radar images is higher than that of the rain-contaminated radar images.
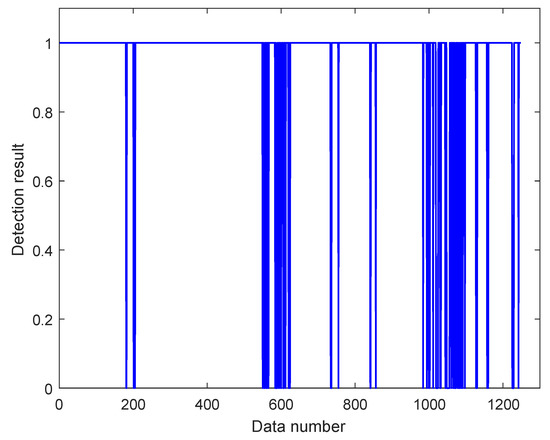
Figure 8.
The detection result based on the proposed detection method.
In addition, the calculated Euclidean distance and the detection performance for all the collected radar datasets are presented in Figure 9 and Figure 10, respectively. From Figure 9, it can be observed that the fluctuation of the calculated distance of Cluster 1, which is denoted by the blue solid line, is similar to the simultaneously recorded rainfall rate compared with the rainfall rate in Figure 2. For the rain-free radar images, the calculated distance to Cluster 1 is almost the least, and the distance to Cluster 3 is the largest. On the other hand, the calculated distance to Cluster 1 is the largest for the rain-contaminated images. Meanwhile, it can be observed that both the radar images contaminated by the light rain and the rain-free radar images can be distinguished when the number of the clustering center . From Figure 10, it can be observed that the proposed method could well finish the detection task and distinguish the rain-contaminated radar images and the rain-free radar images compared with the rainfall rate in Figure 2.
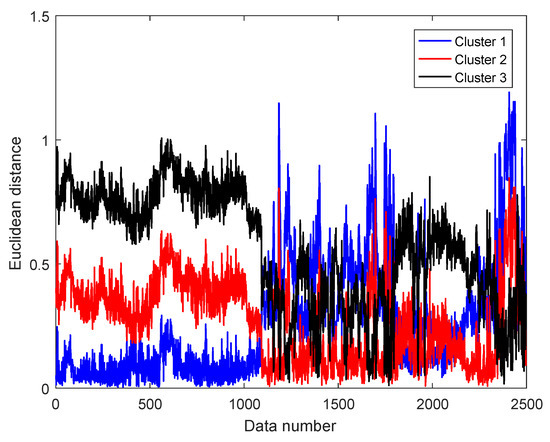
Figure 9.
The calculated Euclidean distance for all the datasets.
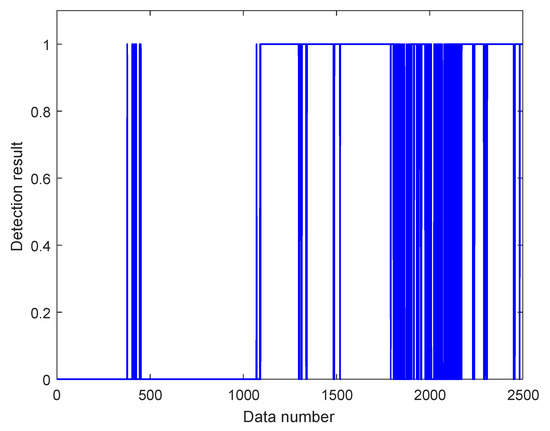
Figure 10.
The detection result for all the datasets.
To further verify the effectiveness of the proposed rainfall detection approach, the detection result is compared with that of the ZPP method, the CCD-based method, the SVM-based method and the WTD-based method. The calculated ZPP of the selected analysis area from the radar image is given in Figure 11. The red solid line denotes the obtained optimal detection threshold value 48.5% based on the training dataset. Since the determination of the threshold depends on the engineering experience and the threshold value changes for different radar systems, the strategy in [20] is used to determine the threshold value. From Figure 11, it can be observed that the calculated ZPP of the radar image changes with the rainfall. The ZPP is relatively small when the radar image is contaminated by heavy rain. The ZPP of the radar image increases with the decrease in the rain rate. When the calculated ZPP is less than the threshold value, the radar image is defined as rain-contaminated for the ZPP detection method.
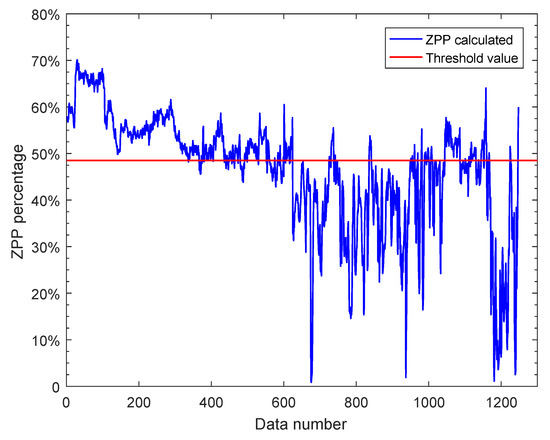
Figure 11.
The calculated ZPP percentage.
The detection result of the ZPP method is presented in Figure 12. When the detected radar image is contaminated by rainfall, the radar image is labeled as one. Otherwise, the radar image is labeled as zero. The detection success rate of the testing dataset is 84.5%. The detection success rate of the rain-free radar images is 87.3% and is higher than that of the rain-contaminated radar images at 81.6%. Although the optimal detection threshold is selected based on the training dataset, the detection performance of the training dataset is not ideal, since the ZPP of the radar images contaminated by light rain fluctuates near the threshold value. Further study is needed to improve the detection accuracy of the radar images, especially in the case of light rain.
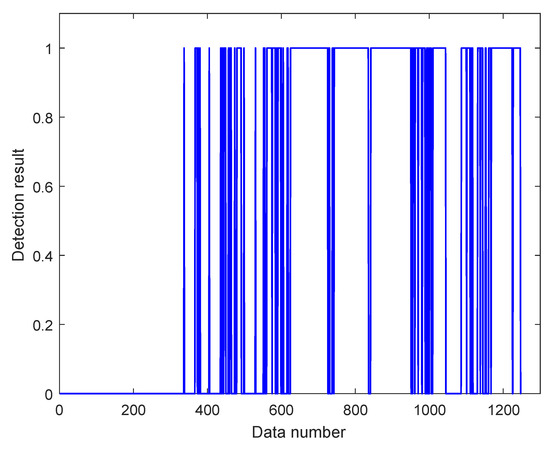
Figure 12.
The detection result of the ZPP method.
Based on the CCD method in [23], the achieved correlation coefficient is presented in Figure 13. The correlation coefficient at a lagged azimuth is selected to detect the rainfall interference from the collected radar images. The vertical axis denotes the calculated correlation coefficient at the lagged azimuth. The blue solid line is the calculated correlation coefficient from the collected radar images. The red solid line is the threshold value. For the CCD-based method, the task of rainfall detection is executed by comparing the obtained correlation coefficient to the optimal threshold, which is determined based on the training dataset. From Figure 13, it can be observed that the calculated correlation coefficient from the testing dataset is above the threshold value in most cases when the rainfall does not exist. Moreover, it can be observed that the calculated correlation coefficient at the lagged azimuth changes with the rainfall. For the collected rain-free radar image, the calculated correlation coefficient, which depends on the backscatter echo, is relatively large. In the case of rain-free images, the correlation coefficient of the sea clutter increases with the increase in the sea state. When the correlation coefficient is less than the threshold, the radar image is considered as rain-contaminated for the CCD-based method.
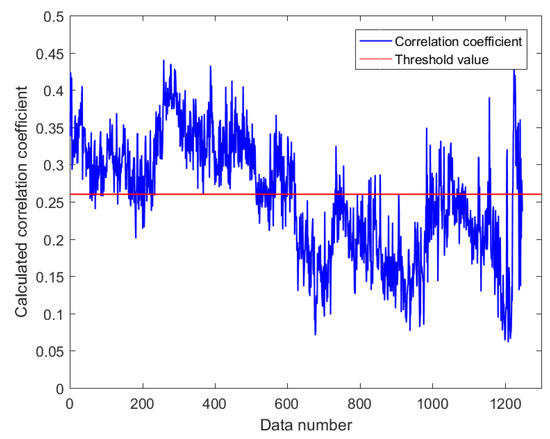
Figure 13.
The calculated correlation coefficient based on the CCD method.
The detection result based on the CCD method is presented in Figure 14. For all the testing datasets, the detection success rate is 88.1%, which is 3.6% higher than the ZPP method. The detection success rate of the rain-free images and rain-contaminated image is 89.1% and 87.2%, respectively. By comparing the detection performance to the ZPP method, the detection accuracy of rain-contaminated and rain-free radar images is increased by 5.6% and 1.8%, respectively.
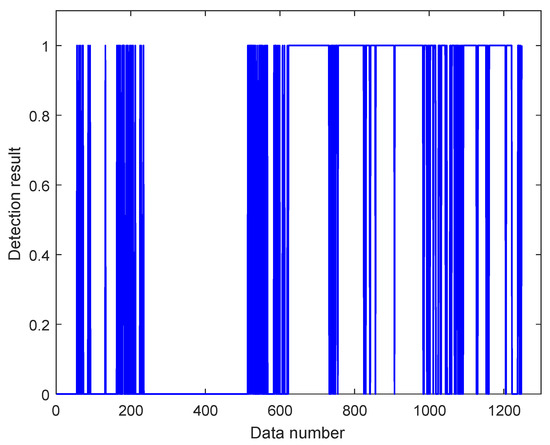
Figure 14.
The detection result of the CCD-based method.
The rainfall detection of the SVM-based method is completed using the statistical histogram of the radar images. The radar images of the training dataset are utilized to obtain the structure of the SVM. The detection result of the SVM-based method is described in Figure 15. From Figure 15, it can be observed that the detection result is excellent, especially for the rain-contaminated radar images, compared to the ZPP method and the CCD-based method. However, some rain-free radar images of the testing dataset are recognized as rain-contaminated radar images. The detection success rate of the SVM-based method for the rain-free images and the rain-contaminated images is 92.8% and 96.6%, respectively. The detection accuracy of rain-contaminated images is higher than the proposed detection method. However, the detection accuracy of rain-free images is lower than the proposed method based on the CCFV and the clustering algorithm. The detection success rate is 94.4%, which is close to that of the proposed method in this paper. The recorded radar image is rain-contaminated and labeled as one when the corresponding rainfall rate is non-zero. The correlation coefficient between the detection result of the SVM-based method and the reference value is 0.89. Since the variation range of the rainfall rate is relatively large, the feature of the statistical histogram of the rain-contaminated radar images is captured well. The training dataset may be less, and the performance of the SVM-based method cannot be presented well for the rain-free images. Meanwhile, the 19 bins may not be enough to describe the detailed information of the statistical histogram of the marine radar images when the 14-bit acquisition card instead of 8-bit is utilized.
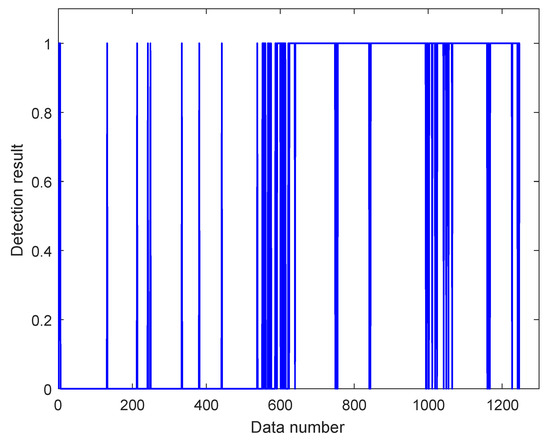
Figure 15.
The detection result of the SVM-based method.
Based on the WTD and the consecutive pixel detection, the rain-contaminated radar images could be detected. Since the threshold value and the wave direction are required, the obtained feature WTD of the training dataset is used to obtain the optimal threshold value and the wave direction of manual observation inputs to the WTD-based rainfall detection method. The detection result of the WTD-based method is presented in Figure 16. From Figure 16, it can be observed that the detection result is excellent, especially for the rain-free radar images, compared to the ZPP method, the CCD-based method, and the SVM-based method. However, some rain-contaminated radar images of the testing dataset are recognized as rain-free radar images. The detection success rate of the WTD-based method for the rain-free images and rain-contaminated images is 96.3% and 91.7%, respectively. The detection success rate of the rain-free radar images is higher than that of the rain-contaminated radar images. The detection accuracy of both the rain-free and rain-contaminated radar images is close to that of the proposed rainfall detection method based on the CCFV and the clustering algorithm. Although the detection success rate of the WTD-based method is 94.0%, which is close to that of the proposed method in this paper, an initial hard threshold value should be determined in advance based on the median of the statistical histogram of the WTD. In addition, the wave direction is required for consecutive pixel detection. Currently, it is difficult to obtain an accurate wave direction from rain-contaminated radar images, and this limits the application of the WTD-based method in practice.
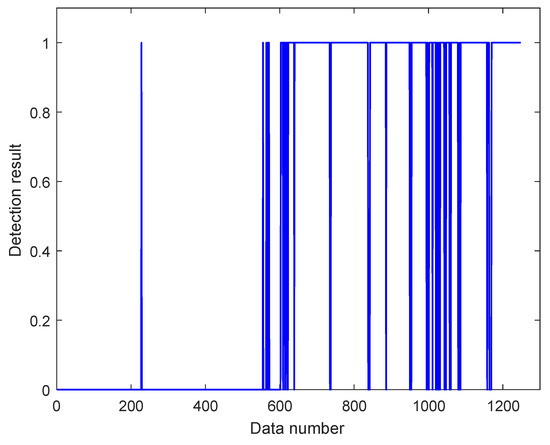
Figure 16.
The detection result of the WTD-based method.
5.2. Performance of the Rainfall Detection
To further evaluate the performance of the rainfall detection algorithm, the detection accuracy of the ZPP method, the CCD-based method, the SVM-based method, the WTD-based method and the proposed method for a different proportion of the training dataset is presented in Table 3. For the proposed rainfall detection method, the training data with the proportion of 25%, 50% and 75% are used to extract the clustering centers, and the testing data with the remaining proportion of 75%, 50% and 25% are used to verify the detection performance. Based on the achieved threshold and the clustering centers from the training dataset, the accuracy of the ZPP method, the CCD-based method, the SVM-based method, the WTD-based method and the proposed method is analyzed by using the remaining testing dataset.

Table 3.
The comparison of the rainfall detection accuracy.
From Table 3, it can be observed that the proposed rainfall detection method in this paper has higher detection accuracy than the ZPP method, the CCD-based method and the SVM-based method for the training dataset. The proposed method has the highest detection accuracy for rain-free radar images among these detection methods. However, the detection accuracy of rain-contaminated radar images for the proposed method is a little lower than that of the SVM-based method. With the increase in the proportion of the training dataset, the detection success rate increases and then decreases for the SVM method. Although the detection success rate of the proposed method is close to the SVM method for the proportion of the training dataset, the detection accuracy is higher than that of the ZPP method and higher than that of the CCD method. For the proportion of the and training datasets, the performance of the proposed method is a little higher than that of the SVM method. The detection accuracy of the WTD-based method for the proportion of the training dataset is higher than that of the proportion of the and training datasets. Although the optimal threshold value is obtained based on the training dataset, the rainfall detection accuracy of both the rain-free radar images and the rain-contaminated radar images is lower than that of the proposed rainfall detection method. The detection accuracy of rain-contaminated images of the proposed method has the highest detection accuracy for the proportion of the training dataset. The detection accuracy of rain-free images decreases with the increase of training dataset proportion. For the proportion of , and training datasets, the detection accuracy of the proposed rainfall detection method is relatively high, and the difference is slight. Thus, the proposed rain detection method based on the CCFV and the K-means clustering algorithm could effectively detect rain-contaminated images from the collected X-band marine radar images.
From Table 3, it can be observed that the detection accuracy of the rain-contaminated radar images does not seem ideal and can be further improved, compared with the SVM-based method. Since the measuring mechanism of the rainfall of the radar images is different to that of the rain gauge, the rain gauge may not output the change in the rainfall when the rainfall intensity is light or moderate. The rainfall detection based on the radar images could reflect the change in the rainfall intensity in real time. Meanwhile, the installation position of the rain gauge is far from the observation area of the radar. However, for the training dataset, it can be observed that both the rain-contaminated radar images and the rain-free radar images can be effectively detected.
6. Discussion
Although the ZPP method is commonly used to detect rainfall interference from X-band marine radar images, the detection accuracy of the ZPP method depends on the threshold value. For the CCD-based method, the determination of the threshold value depends on the engineering experience, and only the information at a fixed position in the lagged azimuth is utilized to detect rainfall interference. Rainfall images can be effectively detected with a hard threshold value compared to the ZPP method. Based on the unsupervised K-means clustering strategy, the threshold value for rainfall detection is not required. Compared to the CCD-based method, the proposed method adequately uses the difference in the correlation coefficient by constructing CCFV and overcomes the drawback of determining the detection position in the lagged azimuth.
For the SVM-based method, the analysis area close to the radar antenna is selected. In the near range of the radar images, the echo intensity of the sea wave is relatively large under high sea conditions. For the dataset, the significant wave height of the rain-free radar images is between 1.1 m and 4.2 m. However, the significant wave height of the collected rain-contaminated radar images is between 2.8 m and 3.1 m. In addition, the rainfall rate of the rain-contaminated images is mainly 1 mm/5 min. The echo intensity and the feature of the statistical histogram of some rain-free radar images under high sea conditions are similar to that of rain-contaminated radar images. Due to the high sea conditions, some rain-free images may be recognized as rain-contaminated images for training the SVM structure. Thus, the accuracy of rain-contaminated images is better than that of rain-free images for the SVM-based method.
Since the whole sea observation area of the radar is used to calculate the ZPP, the accuracy of the ZPP method is lower for rain-contaminated images. The echo intensity of the sea clutter decays in the distance. The attenuation of the electromagnetic wave in the distance may influence radar imaging. The spatial distribution of rainfall intensity is complex, and the rainfall is uneven in radar images, which may be part of the regional distribution. Meanwhile, the percentage of rain-contaminated images with rainfall of 1 mm/5 min is prominent. Thus, the ZPP may not be sensitive to a change in rainfall with light rain when the whole sea observation area of the radar is used.
Although the threshold value is not required for the proposed rainfall detection method in this paper, it is vitally important to determine the appropriate number of the clustering centers of the K-means clustering algorithm based on the acquired radar images. The sea state was relatively stable, and the change was not obvious during the experiment, but the rainfall changed rapidly. There are great differences in the correlation coefficient of the rain-contaminated radar images with different rainfall rates. A clustering center could not accurately describe the characterization of the rain-contaminated radar images based on the acquired radar images. The number of clustering centers could be changed for the collected radar data under complicated rainfall conditions. In addition, the training and the testing dataset should have balanced rain-free and rain-contaminated radar images to accurately achieve the clustering centers, which are the characterization of the rain-free and rain-contaminated radar images, and evaluate the effectiveness of the proposed rainfall detection method.
The distribution of the rainfall on the radar images is uneven and the echo intensity of the rain-contaminated radar images is sensitive to the size of the raindrop. Thus, the detection performance based on radar images is not ideal, and a large error exists compared to the rain gauge. Since the annual rainfall at the experiment site and the number of rainfall days is less, the training data are not sufficient to achieve better clustering centers for the proposed method in this paper. Thus, more radar data can be collected to generate the training dataset and improve the detection performance of the proposed method in the future.
The recorded rain rate of the rain gauge is the accumulation of rainfall over a few minutes. The rain gauge records an original rainfall rate every minute. In this paper, the averaged rainfall rate over 5 min is utilized. The recorded rainfall rate of the rain gauge could not rapidly reflect the change in rainfall, especially for the case of light rain. The scanning period of the marine radar is about 2.3 s in our experiment. The instantaneous rain information in the marine radar is captured. The sequence of 32 radar images for retrieving wave parameters and rainfall detection is collected and stored about every 4 min due to the large volume of radar data. From the continuously observed radar images, we found that the change in the rainfall rate is complex and rapid. Since the detection mechanism between the rain gauge and the X-band marine radar is different, it is not easy to improve the detection accuracy compared with the SVM-based method or to further improve the detection accuracy of the proposed detection method compared with the rain gauge. Thus, the detection error may exist between the data number of the rain gauge and the radar images.
7. Conclusions
When rainfall interference exists in X-band marine radar images, the reliability of the inversion results is greatly reduced for retrieving wave and wind information. It is necessary to detect the rainfall before retrieving the wave parameters from the collected radar images. Therefore, rainfall detection from the collected X-band marine radar images is investigated in this paper.
Since the correlation coefficient of the sea clutter will change when the echo intensity of the radar image is rain-contaminated, a method of rainfall detection based on an unsupervised machine learning strategy is proposed in this paper. The CCFV is extracted from the marine radar images based on the calculated correlation coefficient in the lagged azimuth. Compared with the existing ZPP-based and CCD-based rainfall detection methods, the detection accuracy, respectively, increases by and for the proportion of the training dataset. Meanwhile, the proposed method does not require the threshold value, since the unsupervised K-means clustering technology is introduced. Based on the collected radar images, the experimental results demonstrate that the detection accuracy of the proposed method is, respectively, and higher than that of the SVM-based method and is, respectively, and higher than that of the WTD-based method for the proportion of the and training dataset. For the proportion of the training dataset, the performance of the proposed method is close to that of the SVM-based method and the WTD-based method.
In this paper, the length of the selected CCFV is experientially determined based on the difference in the correlation coefficient. The influence of the length of the extracted feature on the detection accuracy can be further evaluated in the future. Meanwhile, since the clustering centers depend on the rainfall intensity and the training dataset, a perfect strategy for determining the number of the clustering centers should be developed. Although the proposed method has the ability to detect the rainfall images, the performance and the accuracy of the proposed method should be further verified based on the radar images collected from different radar systems and under different sea conditions.
Author Contributions
Y.W. conducted the analysis of the problem, conceived the methodology and wrote the first draft of the paper; Y.L. (Yalin Liu) and Y.L. (Yifei Lei) conceived the experiment and wrote the software code to verify the novel method; Z.L. contributed to the analysis of the research, to conceiving the experiment and to the revisions of the paper; R.L. and L.S. arranged the experimental data. Hui Wang interpreted and analyzed the experimental results. All authors have read and agreed to the published version of the manuscript.
Funding
This research was supported in part by the Henan Provincial Science and Technology Research Project under Grand No. 212102210272 and the Key Scientific Research Project in Colleges and Universities of Henan Province under Grand No. 22A170015.
Data Availability Statement
The part data presented in this study are available on request from the corresponding author.
Conflicts of Interest
The authors declare no conflict of interest.
References
- Wei, Y.; Lu, Z.; Pian, G.; Liu, H. Wave height estimation from shadowing based on the acquired X-band marine radar images in coastal area. Remote Sens. 2017, 9, 859. [Google Scholar] [CrossRef] [Green Version]
- Huang, W.; Liu, X.; Gill, E.W. Ocean wind and wave measurements using X-band marine radar: A comprehensive review. Remote Sens. 2017, 9, 1261. [Google Scholar] [CrossRef] [Green Version]
- Nieto-Borge, J.C.; Hessner, K.; Jarabo-Amores, P.; MataMoya, D. Signal-to-noise ratio analysis to estimate ocean wave heights from X-band marine radar image time series. IET Radar Sonar Navig. 2008, 2, 35–41. [Google Scholar] [CrossRef] [Green Version]
- Sokol, Z.; Szturc, J.; Orellana-Alvear, J.; Popová, J.; Jurczyk, A.; Célleri, R. The role of weather radar in rainfall estimation and its application in meteorological and hydrological modelling—A review. Remote Sens. 2021, 13, 351. [Google Scholar] [CrossRef]
- Gourley, J.J.; Tabary, P.; Parent du Chatelet, J. A fuzzy logic algorithm for the separation of precipitating from nonprecipitating echoes using polarimetric radar observations. J. Atmos. Ocean. Tech. 2007, 24, 1439–1451. [Google Scholar] [CrossRef]
- Thurai, M.; Mishra, K.V.; Bringi, V.N.; Krajewski, W.F. Initial results of a new composite-weighted algorithm for dual-polarized X-band rainfall estimation. J. Hydrometeorol. 2017, 18, 1081–1100. [Google Scholar] [CrossRef]
- Kim, M.-S.; Kwon, B.H. Rainfall detection and rainfall rate estimation using microwave attenuation. Atmosphere 2018, 9, 287. [Google Scholar] [CrossRef] [Green Version]
- Tian, W.; Yi, L.; Liu, W.; Huang, W.; Ma, G.; Zhang, Y. Ground radar precipitation estimation with deep learning approaches in meteorological private cloud. J. Cloud Comput. Adv. Syst. Appl. 2020, 9, 22. [Google Scholar] [CrossRef] [Green Version]
- Chen, X.; Huang, W. Spatial-temporal convolutional gated recurrent unit network for significant wave height estimation from shipborne marine radar data. IEEE Trans. Geosci. Remote Sens. 2022, 60, 4201711. [Google Scholar] [CrossRef]
- Braun, N.; Gade, M.; Lange, P.A. The effect of artificial rain on wave spectra and multi-polarization X band radar backscatter. Int. J. Remote Sens. 2010, 23, 4035–4312. [Google Scholar]
- Zhang, B.; Alpers, W. The effect of rain on radar backscattering from the ocean. In Advances in SAR Remote Sensing of Oceans; CRC Press: Boca Raton, FL, USA, 2018; pp. 317–330. [Google Scholar]
- Huang, W.; Liu, Y.; Gill, E.W. Texture-analysis-incorporated wind parameters extraction from rain-contaminated X-band nautical radar images. Remote Sens. 2017, 9, 166. [Google Scholar] [CrossRef] [Green Version]
- Liu, X.; Huang, W.; Gill, E.W. Wind direction estimation from rain-contaminated marine radar data using the ensemble empirical mode decomposition method. IEEE Trans. Geosci. Remote Sens. 2017, 55, 1833–1841. [Google Scholar] [CrossRef]
- Cheng, H.Y.; Chien, H. Implementation of S-band marine radar for surface wave measurement under precipitation. Remote Sens. Environ. 2017, 188, 85–94. [Google Scholar] [CrossRef]
- Chen, Z.; He, Y.; Zhang, B.; Ma, Y. A method to correct the influence of rain on X-band marine radar image. IEEE Access 2017, 5, 25576–25583. [Google Scholar] [CrossRef]
- Shen, J.; Li, Y.; Dai, Y.; Wang, S. Identification and suppression of rain interference on X-band radar images. Opt. Precis. Eng. 2012, 20, 1846–1853. [Google Scholar] [CrossRef]
- Lund, B.; Graber, H.C.; Romeiser, R. Wind retrieval from shipborne nautical X-band radar data. IEEE Trans. Geosci. Remote Sens. 2012, 50, 3800–3811. [Google Scholar] [CrossRef]
- Xu, F.; Li, X.; Wang, P.; Pichel, W.G.; Jin, Y.Q. A backscattering model of rainfall over rough sea surface for synthetic aperture radar. IEEE Trans Geosci. Remote Sens. 2015, 53, 3042–3054. [Google Scholar] [CrossRef]
- Chen, X.; Huang, W. Rain Detection From X-Band Marine Radar Images. In Proceedings of the IEEE Radar Conference, Boston, MA, USA, 22–26 April 2019. [Google Scholar]
- Chen, X.; Huang, W.; Zhao, C.; Tian, Y. Rain detection from X-band marine radar images: A support vector machine-based approach. IEEE Trans. Geosci. Remote Sens. 2020, 58, 2115–2123. [Google Scholar] [CrossRef]
- Chen, X.; Huang, W. Identification of rain and low-backscatter regions in X-band marine radar images: An unsupervised approach. IEEE Trans. Geosci. Remote Sens. 2020, 58, 4225–4236. [Google Scholar] [CrossRef]
- Lu, Z.; Sun, L.; Zhou, Y. A method for rainfall detection and rainfall intensity level retrieval from X-band marine radar images. Appl. Sci. 2021, 11, 1565. [Google Scholar] [CrossRef]
- Zheng, Y.; Shi, Z.; Lu, Z.; Ma, W. A method for detecting rainfall from X-band marine radar images. IEEE Access 2020, 8, 19046–19057. [Google Scholar] [CrossRef]
- Sun, L.; Lu, Z.; Wang, H.; Liu, H.; Shang, X. A wave texture difference method for rainfall detection using X-band marine radar. J. Sens. 2022, 2022, 1068885. [Google Scholar] [CrossRef]
- Zhao, X.; Liu, P.; Liu, J.; Tang, X. The Application of Histogram on Rain Detection in Video. In Proceedings of the 11th Joint International Conference on Information Sciences, Guangzhou, China, 19–21 November 2008. [Google Scholar]
- Zhou, M.; Zhu, Z.; Deng, R.; Fang, S. Rain detection and removal of sequential images. In Proceedings of the Chinese Control and Decision Conference, Mianyang, China, 23–25 May 2011. [Google Scholar]
- Celik, T. Unsupervised change detection in satellite images using principal component analysis and k-means clustering. IEEE Trans. Geosci. Remote Sens. Lett. 2009, 6, 772–776. [Google Scholar] [CrossRef]
- Amiri, M.A.; Mesgari, M.S. Spatial variability analysis of precipitation in northwest Iran. Arab J. Geosci. 2016, 9, 578. [Google Scholar] [CrossRef]
- Kanthan, M.R.; Sujatha, S.N. Rain drop detection and removal using K-Means clustering. In Proceedings of the IEEE International Conference on Computational Intelligence and Computing Research, Madurai, India, 10–12 December 2015. [Google Scholar]
- Krishna, G.V. Prediction of rainfall using unsupervised model based approach using K-means algorithm. Int. J. Math. Sci. Comput. 2015, 1, 11–20. [Google Scholar]
- Yang, Z.; Huang, W.; Chen, X. Evaluation and mitigation of rain effect on wave direction and period estimation from X-band marine radar images. IEEE J. Sel. Top. Appl. Earth Obs. Remote Sens. 2021, 14, 5207–5219. [Google Scholar] [CrossRef]
- Chen, X.; Huang, W.; Haller, M.C. A novel scheme for extracting sea surface wind information from rain-contaminated X-band marine radar images. IEEE J. Sel. Top. Appl. Earth Obs. Remote Sens. 2021, 14, 5220–5234. [Google Scholar] [CrossRef]
- Chen, X.; Huang, W. Texture features and unsupervised learning-incorporated rain-contaminated region identification from X-band marine radar images. Mar. Technol. Soc. J. 2020, 54, 59–67. [Google Scholar]
- Chen, X.; Huang, W.; Haller, M.C.; Pittman, R. Rain-contaminated region segmentation of X-band marine radar images with an ensemble of SegNets. IEEE J. Sel. Top. Appl. Earth Obs. Remote Sens. 2021, 14, 141–154. [Google Scholar] [CrossRef]
- Wang, H.; Qiu, H.; Lu, Z.; Wang, L.; Akhtar, R.; Wei, Y. An energy spectrum algorithm for wind direction retrieval from X-band marine radar image sequences. IEEE J. Sel. Top. Appl. Earth Obs. Remote Sens. 2021, 14, 4074–4088. [Google Scholar]
- Lu, Z.; Zhou, Y.; Huang, Y. Research on correlation in spatial domain to eliminate the co-channel interference of the X-band marine radar. Syst. Eng. Electron. 2017, 39, 758–767. [Google Scholar]
- Liu, X.; Huang, W.; Gill, E.W. Wave height estimation from shipborne X-band nautical radar images. J. Sens. 2016, 2016, 1078053. [Google Scholar] [CrossRef]
- Liu, Y.; Huang, W.; Gill, E.W.; Peters, D.K.; Vicen-Bueno, R. Comparison of algorithms for wind parameters extraction from shipborne X-band marine radar images. IEEE J. Sel. Top. Appl. Earth Obs. Remote Sens. 2015, 8, 896–906. [Google Scholar] [CrossRef]
- Armstrong, B.C.; Griffiths, H.D. Modelling spatially correlated K-distributed clutter. Electron. Lett. 1991, 27, 1355–1356. [Google Scholar] [CrossRef]
- Ward, K.D. Compound representation of high resolution sea clutter. Electron. Lett. 1981, 17, 561–563. [Google Scholar] [CrossRef]
- Orhan, U.; Hekim, M.; Ozer, M. EEG signals classification using the K-means clustering and a multilayer perceptron neural network model. Expert Syst. Appl. 2011, 38, 13475–13481. [Google Scholar] [CrossRef]
- Shi, N.; Liu, X.; Guan, Y. Research on k-means Clustering Algorithm: An Improved k-means Clustering Algorithm. In Proceedings of the International Symposium on Intelligent Information Technology and Security Informatics, Jinggangshan, China, 2–4 April 2010. [Google Scholar]
- Qi, J.; Yu, Y.; Wang, L.; Liu, J.; Wang, Y. An effective and efficient hierarchical K-means clustering algorithm. Int. J. Distrib. Sens. Netw. 2017, 13, 1–17. [Google Scholar] [CrossRef] [Green Version]
Publisher’s Note: MDPI stays neutral with regard to jurisdictional claims in published maps and institutional affiliations. |
© 2022 by the authors. Licensee MDPI, Basel, Switzerland. This article is an open access article distributed under the terms and conditions of the Creative Commons Attribution (CC BY) license (https://creativecommons.org/licenses/by/4.0/).