Article

Deriving River Discharge Using Remotely Sensed Water Surface Characteristics and Satellite Altimetry in the Mississippi River Basin

1
Department of Civil & Environmental Engineering, Northeastern University, Boston, MA 02115-5005, USA
2
Department of Marine & Environmental Sciences, Northeastern University, Boston, MA 02115-5005, USA
*
Author to whom correspondence should be addressed.
Remote Sens. 2022, 14(15), 3541; https://doi.org/10.3390/rs14153541
Submission received: 13 June 2022 / Revised: 15 July 2022 / Accepted: 21 July 2022 / Published: 24 July 2022
(This article belongs to the Section Remote Sensing in Geology, Geomorphology and Hydrology)

Abstract

:
River discharges are critical for understanding hydrologic and ecological systems, yet in situ data are limited in many regions of the world. While approximating river discharge using satellite-derived water surface characteristics is possible, the key challenges are unknown channel bathymetry and roughness. Here, we present an application for merging mean river-reach characteristics and time-varying altimetry measurements to estimate river discharge for sites within the Mississippi River Basin (USA). This project leverages the Surface Water and Ocean Topography (SWOT) River Database (SWORD) for approximating mean river-reach widths and slopes and altimetry data from JASON-2/3 (2008–Present) and Sentinel-3A/B (2015–Present) obtained from the Hydroweb Theia virtual stations. River discharge is calculated using Manning’s Equation, with optimized parameters for surface roughness, bottom elevation, and channel shape determined using the Kling–Gupta Efficiency (KGE). The results of this study indicate the use of optimized characteristics return 87% of sites with KGE > −0.41, which indicates that the approach provides discharges that outperform using the mean discharge. The use of precipitation to approximate missing flows not observed by satellites results in 66% of sites with KGE > −0.41, while the use of TWSA results in 65% of sites with KGE > −0.41. Future research will focus on extending this application for all available sites in the United States, as well as trying to understand how climate and landscape factors (e.g., precipitation, temperature, soil moisture, landcover) relate to river and watershed characteristics.

1. Introduction

River discharge is a critical component in hydrologic studies, Earth’s climate system, and water resource management. Discharge describes the volume of water passing through a particular cross-section in a unit of time (e.g., cubic meters per second), typically estimated at given location along a river using the measured water level and a calibrated relationship between water level and discharge [1]. Such in situ measurements are often expensive and limited in availability globally [2]. River discharge measurements are used to understand the health of stream ecosystems, water quality, potential for flooding, and water supply. Monitoring river discharges is not only critical for water resources, but also essential for predictions of future hydrologic conditions that are likely to exist as a result of changes in climate [3].
Despite river discharge being critical in hydrologic and climate studies, there has been a decline in global discharge information as a result of declining monitoring infrastructure or the withholding of information due to political reasons [4,5]. The Global River Data Centre (GRDC) provides information for river discharges at over 10,000 locations [4], although only 7% of the stations provide measurements beyond the year 2020 [6]. Nationally, the United States Geological Survey (USGS) provides a time series of the streamflow at approximately 10,500 gauging sites (USGS National Water Dashboard) [7]. Still, many undeveloped regions of the world have limited access to river discharge data—yet this information is perhaps most critical to these hydrologically complex or stressed regions [4]. Frequent variations in geometry and channel characteristics complicate the estimation of discharge capacity [8]. Thus, predictions of runoff are often most successful where gauges are present for calibration, further demonstrating the implications of the declining number of monitoring stations [9]. At regional scales, hydrologic modeling is a powerful tool allowing for the sensible use of functional relationships to extract discharge [10]. However, hydrologic models used to estimate discharge, including water-balance accounting, require the input of precipitation, evapotranspiration, and storage, as well as routing parameters that incorporate the temporal and spatial scale of such models [11,12]. As a result, there is significant uncertainty in such models, as the necessary scale of the hydrologic parameters used is often difficult to obtain, especially at finer spatial and temporal scales.
Alternative methods of estimating river discharge have improved with satellite observations. Although discharge cannot be measured directly from remotely sensed measurements, previous research has demonstrated several methods for estimating discharge in an ungauged catchment, including satellite gravimetry [13], satellite imagery [14], satellite altimetry [15], and a combination of satellite altimetry and imagery [16]. Used to measure the water level of rivers, lakes, and flood plains, satellite altimetry has been applied since the early 1990s following the launch of several satellites (e.g., TOPEX/Poseidon) [17]. Optical and radar imaging sensors are used for river discharge estimations, as these instruments provide measurements of river widths and water surface elevations (WSE). Such observations must be used in tandem with statistical or hydraulic relationships to be converted to discharge [10]. Current satellite missions that provide WSE include JASON-3 and Sentinel-3A/B. Previous satellite missions provide historical measurements of WSE, including TOPEX/Poseidon, Envisat, JASON-1, and JASON-2, as these missions have reached the end of their service. Future satellite missions, including the Surface Water and Ocean Topography (SWOT) satellite, will provide the WSEs of terrestrial water bodies at a finer scale (e.g., for rivers greater than 50 m in width). Additionally, SWOT will provide paired measurements of WSE, surface slope, and channel width, which is not possible for current altimetry satellites. However, a challenge related to the future SWOT mission is that the temporal sampling and discharge algorithms may not adequately capture extreme flooding events or rapidly varying flow on the scale of a week or less [18].
While relevant remotely sensed observations are becoming more common, approximating river discharge using satellite-derived water surface characteristics is still a challenge because of missing channel bathymetry (i.e., channel shape below the minimum observed WSE) and roughness. Thus, it is difficult to develop methods for estimating discharge independent of in situ data [19], although few exceptions are possible [20]. Additionally, the time resolution for remotely sensed discharge methods is a general problem for all such studies, as these time series are governed by the return period of the satellite orbit [13]. Ref. [21] used satellite measurements of WSE and the Manning’s resistance relationships to estimate river discharge and demonstrated one of the first approaches for estimating river discharges solely from remote sensing. This method utilized in-stream hydraulic relationships, which are independent of regional variables; the caveat to this method is such that channel resistance (e.g., surface roughness) and average channel depth cannot be measured from space but can be related to other hydraulic variables of the channel [21]. Ref. [1] used optical imagery and satellite altimetry to obtain long-term time series of river discharge. Due to the relationship between water surface elevations and discharge, the cross-sectional geometry of the river was determined using a width-to-depth relationship. Surface roughness was estimated using a previously determined adjustment factor; even still, there is much uncertainty in the estimation of the surface roughness coefficient, which is unknown in many regions. Estimations for surface roughness coefficients are often affected by the type and size of the channel material, as well as the overall channel shape—although field verification of roughness coefficients is not always available. Hydraulic models for river channels are often calibrated for surface roughness using observed water levels, where the size of the river may cause variation in the sensitivity of this parameter [8]. Due to the fact that satellite altimetry uses radar-based measurements that do not penetrate the water surface, the depth below the minimum WSE cannot be observed. Thus, there is a part of flow that is not observed by satellite altimetry that must be acknowledged in order to accurately capture streamflow. Although the future SWOT mission will capture WSE, width, and slope for river channels, it will not measure actual water depth [22].
In this study, we evaluate the use of satellite altimetry in tandem with remotely sensed river-reach characteristics (mean river width and slope) to estimate river discharge using Manning’s Equation and optimized parameters for surface roughness, depth, and channel shape. We use the Mississippi River Basin as proof of concept. The Mississippi River Basin drains over 3 million square kilometers, with rivers of various sizes (e.g., the Mississippi River itself and its tributaries including the Missouri and Ohio Rivers and their tributaries). Snowmelt, frontal storms, and convective storms are the main contributors to discharge within the Mississippi River Basin [1]. While many portions of the Basin are unregulated, there are numerous dams, reservoirs, and instream structures that alter the natural hydrologic cycle. The effects of these regulations are assumed to be minimal in this research as time series of WSEs should capture regulated processes.
In this study, the following research questions are addressed: (1) How well can we estimate river discharge in gauged locations using Manning’s Equation for optimization of unknown quantities (e.g., surface roughness and channel bathymetry), satellite altimetry, and satellite-derived mean river-reach characteristics; and (2) Can we estimate unknown quantities using satellite-derived watershed characteristics (e.g., monthly precipitation and monthly total water storage anomalies) for ungauged locations? The results of this study demonstrate the potential for an enhanced understanding of river discharge in areas with limited access to real-time gauges. Further research should be conducted to validate how well this optimization of unknown parameters (surface roughness and bathymetry) actually captures discharge, as well as using other environmental relationships to provide more accurate estimates.

2. Materials and Methods

2.1. Estimation of River Discharge

The Manning Equation is used to estimate river discharge (Q) where hydraulic parameters are known [23]. This method assumes a steady, uniform flow in open channels [14,15]. Manning’s Equation is defined in Equation (1) as:
Q = 1.0 n A R ( 2 3 ) S ( 1 2 ) ,
where n is the channel roughness coefficient (unitless), A is the cross-sectional flow area of the channel (m2), R is the hydraulic radius (m) measured as cross-sectional flow area divided by the wetter perimeter of the cross-section, and S is the water surface slope along the channel (m/m). (Note, 1.0 is used as the units are metric, but 1.49 is used for U.S. customary units.)
Both cross-sectional area and hydraulic radius parameters require information regarding the channel width, depth, and form. In this study, the width, slope, and roughness coefficient are assumed to be constant through time. This assumption is necessary in order to apply mean reach characteristics derived through remote sensing.
Because mean river width and slope can be obtained from remote-sensing techniques (assuming these parameters are static), depth is an unknown parameter determined using optimization. The maximum potential bottom elevation is assumed to be the minimum observed water surface elevation from the satellite altimeter [24]. There is a part of river discharge that is also not observed by satellite altimetry—that is, the depth below the minimum altimetry measurement. In this study, we refer to this parameter as Q Missing, and it corresponds to the minimum WSE given by the altimetry time series for a particular site. Thus, Q Missing essentially represents the low-flow condition that is not observed from space. Similarly, channel roughness is tested using a range from 0.02 to 0.06. This range is typical for flow within natural channels, as Ref. [23] characterized n values as low as 0.01 and as high as 0.07 as being unreasonable for larger rivers observable by SWOT or comparable satellites.
The shape of river channels is generally related to the amount of water, sediment type, and channel alignment. Hydrologic studies will often assume channel shape based on characteristic relationships (e.g., width/depth) [2,19,24]. In this study, we consider 5 channel forms below the min observed WSE: rectangular, trapezoidal with a 2:1 side slope, trapezoidal with a 1:1 side slope, parabolic, and triangular (Figure 1). Above the min observed WSE, we assume a rectangular cross-section with a constant width estimated from the SWORD database (i.e., mean river width). This assumption is needed because of the lack of paired river widths and WSEs from a single satellite, which the future SWOT mission will provide and perhaps allow for a more precise representation of the bathymetry above the minimum WSE in future research. Previous studies have evaluated the efficiency of discharge by calculating the shape factor, which is the maximum depth divided by the mean depth of the channel. With a shape factor of 1.5, the parabolic cross-section is quantitatively the most “efficient” at discharging water compared to other channel shapes [23]; this observation is a result of the parabola having the smallest wetter perimeter for a given cross-sectional area [25,26].

2.2. In Situ Data

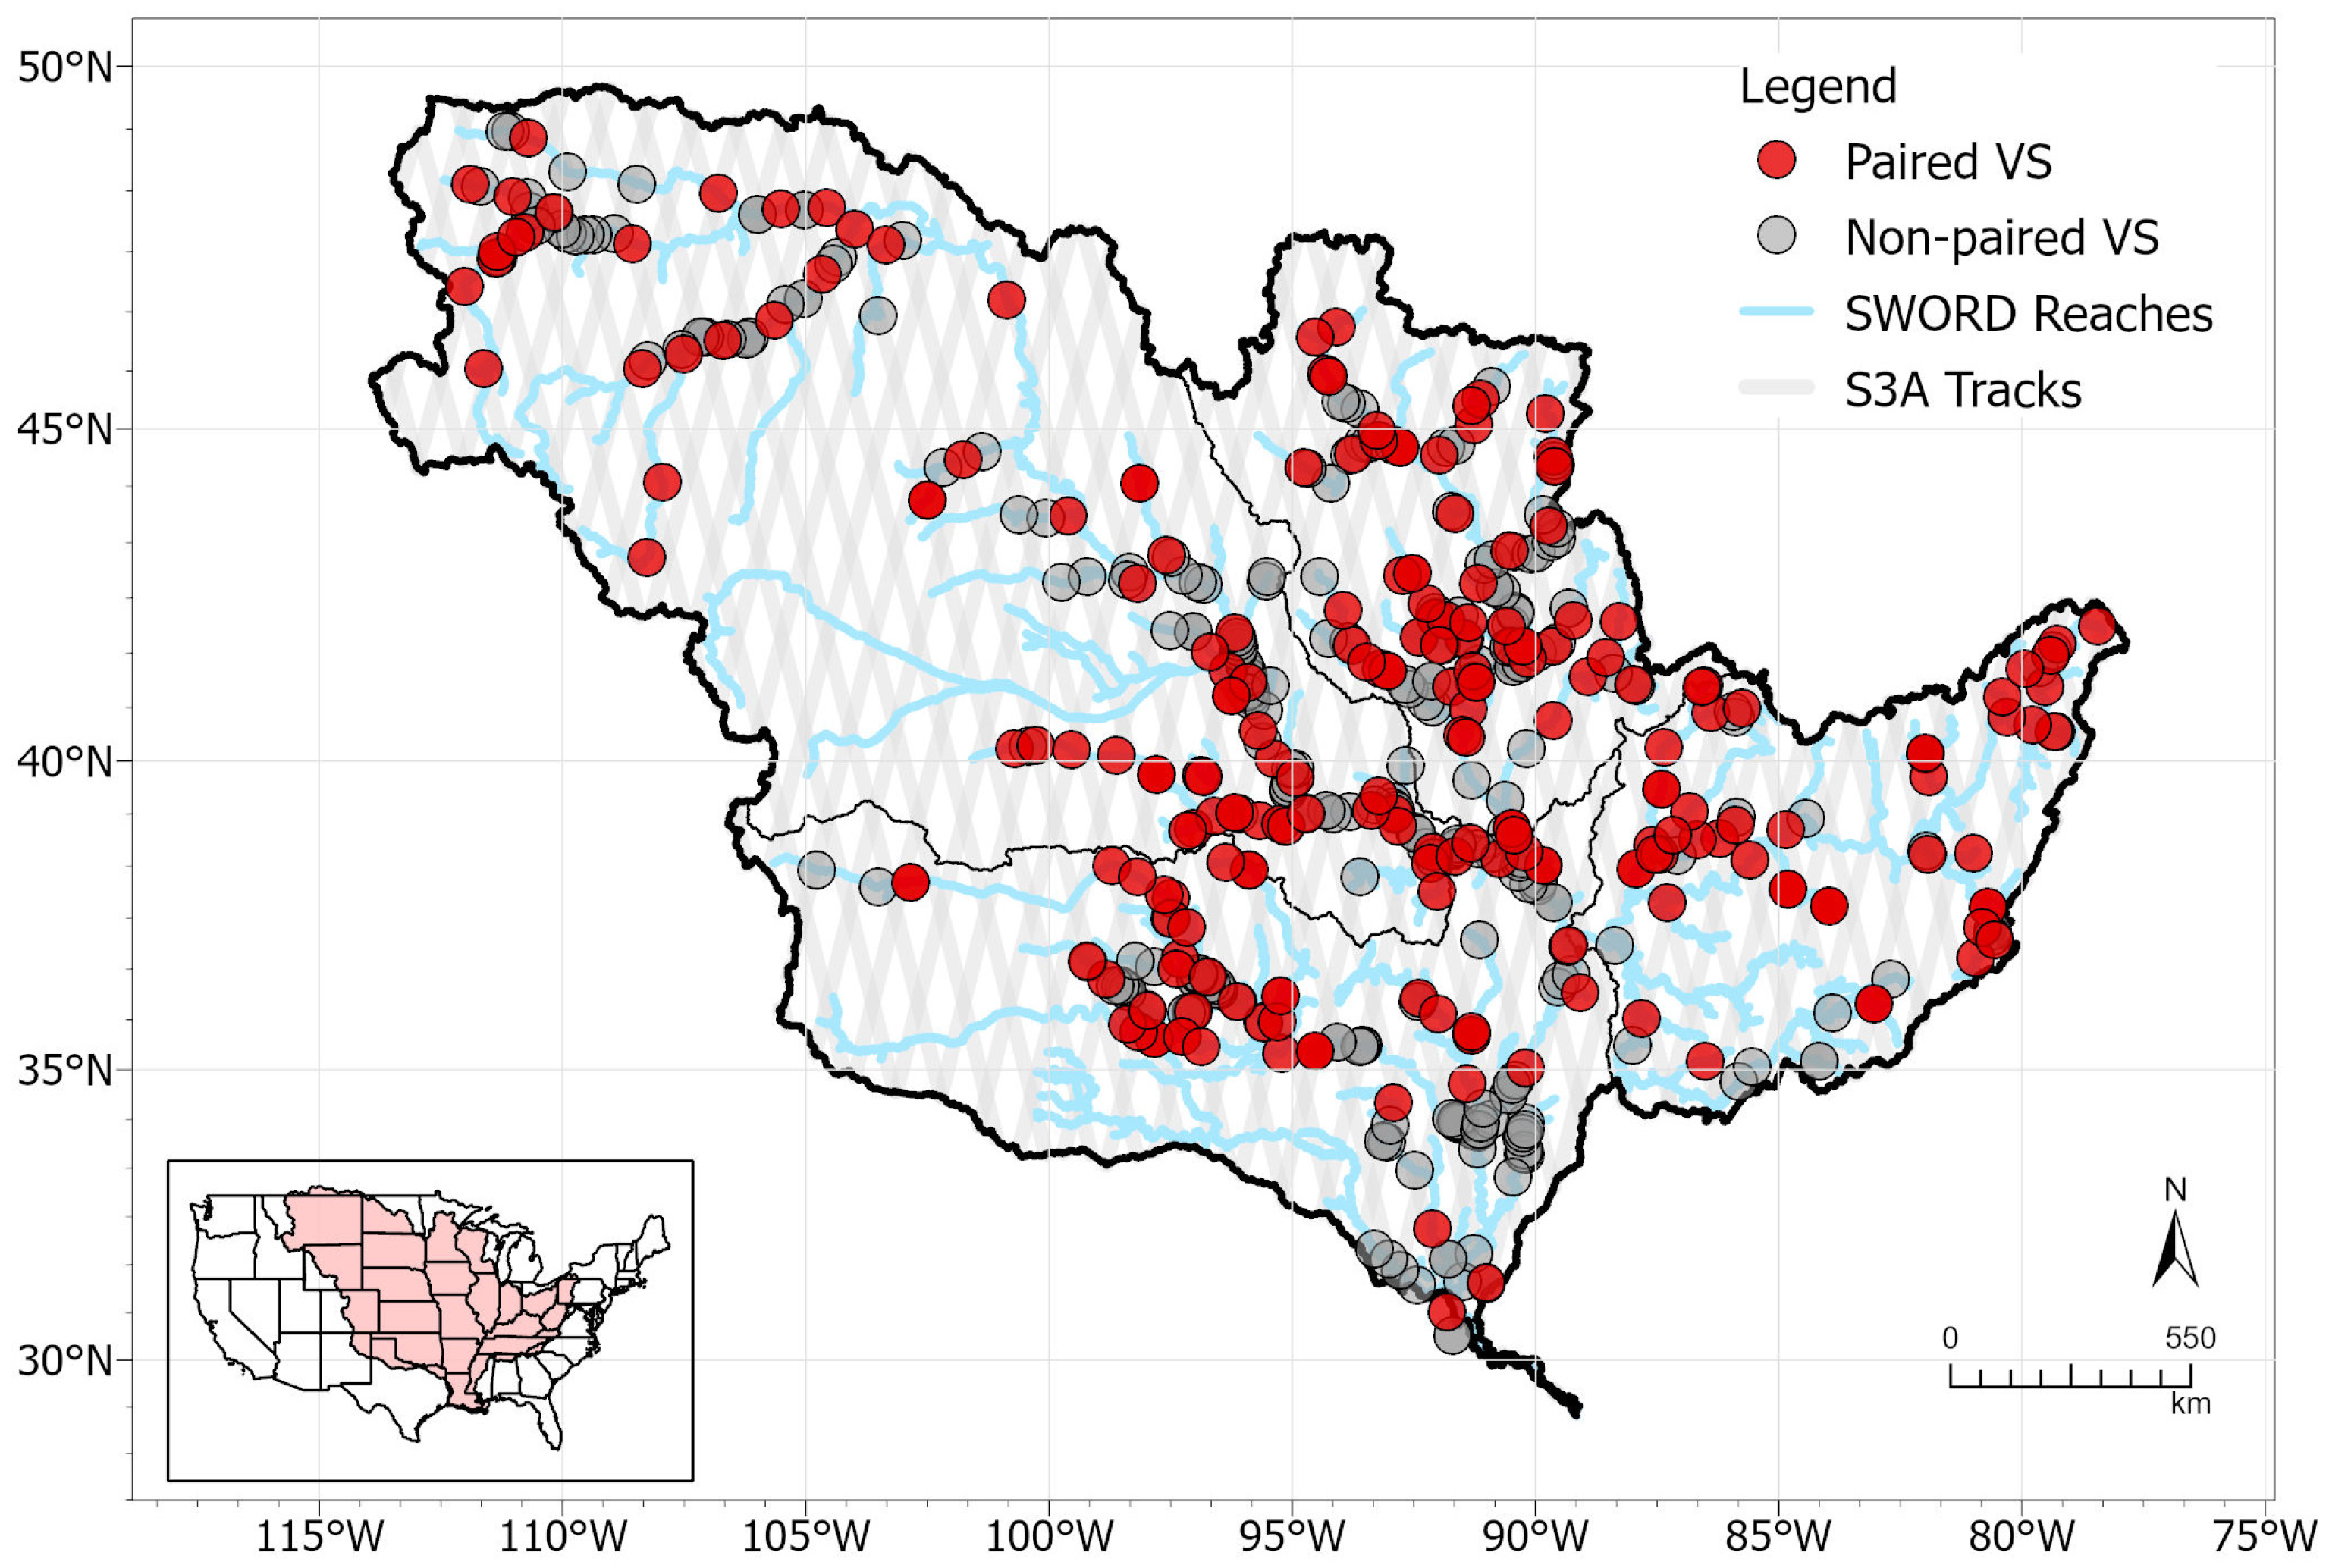
In situ daily river discharges were obtained from the USGS to be used for validation and optimization. These data are available from the USGS National Water Information System (NWIS) [7]. There are nearly 500 active sites available from the USGS within the Mississippi River Basin for the period 2001–2021. The locations of the USGS gauges used in this analysis are shown in Figure 2. The gauges drain watersheds ranging from 1000 to 3,000,000 km2 and are located along SWOT observable rivers (i.e., SWORD river reaches).

2.3. Remote Sensing Data

2.3.1. Satellite Altimetry

Remotely sensed data used in this study include satellite altimetry data processed and provided by Hydroweb Theia (https://hydroweb.theia-land.fr/, accessed on 20 July 2022), as well as river-reach characteristics provided by SWORD (GRWL) [27]. Satellite altimetry data from JASON-2/3 (2008–Present) and Sentinel-3A/B (2015–Present) was obtained from Hydroweb Theia virtual stations (VS), which are defined as the intersections of river-reach lines and satellite tracks. Hydroweb Theia provides publicly available time series of WSE for rivers and lakes using satellite altimetric observations. The historical time series in this database were constructed using JASON-2 and Envisat. Current altimetry data from JASON-3 and Sentinel-3A/B are used to update the VS time series. Bias from the use of multiple satellite missions is minimized during an intercalibration in the data processing of the product.
CNES, NASA, NOAA, and EUMETSAT determined the JASON-3 mission objectives, including the same continued data products as its predecessors (e.g., related to temporal and spatial frequency and accuracy). JASON-3 launched in 2016 with a dual frequency altimeter operating at approximately 13.6 GHz and 5.3 GHz. Each ground-track location is measured every 10 days. Sentinel-3A launched in 2016, while Sentinel-3B (which is identical to Sentinel-3A) launched in 2018. Sentinel-3A/B utilizes synthetic aperture radar (SAR), which operate at a pulse frequency of 17.8 KHz and limits the total range error to 3 cm; the spatial resolution is 300 m. The constellation of altimeter systems allows for optimum spatial resolution (cross coverage), cross-calibration, and reference altimetry. The combined repeat cycle of Sentinel-3A and Sentinel-3B allows for measurements every ~16 days. Thus, the combination of the altimeters has allowed for increased data availability, notably over coastal regions and inland water bodies [28].

2.3.2. SWOT River Database (SWORD)

The SWOT River Database (SWORD) is a combination of multiple river- and satellite-related datasets at the global scale representing river reaches expected to be observed by the future SWOT satellite. The primary satellite products used are Global River Widths from Landsat (GRWL) [29] and hydrography from the MERIT HydroDEM [30]. The database contains a total of 213,485 reaches (~10 km long) and includes a variety of data products and attributes, including width, slopes, drainage area, water surface elevations, and river discharges [27]. Approximately 73% of the reaches in the database are primarily rivers, with nearly 10% of the reaches containing dams or waterfalls [27]. Thus, an advantage of using SWORD is the comprehensiveness of river obstructions in a single dataset. The river-reach characteristics that are critical to this study included mean reach width, slope, and drainage area. Mean river-reach widths ranged from 40 to 2500 m. The upstream drainage areas for the river reaches range from 1100 to nearly 3,000,000 km2.

2.3.3. Global Precipitation Measurement (GPM)

Precipitation data were retrieved from the Global Precipitation Measurement (GPM) mission. NASA and JAXA’s GPM satellite launched in February 2014 and has worked with a constellation of satellites to provide global coverage of observations of precipitation at a spatial resolution of 0.1° × 0.1° [31]. The combination of satellites allows for global coverage within two to three hours. For GPM, the Integrated Multi-satellitE Retrievals (iMERGE) algorithm compiles precipitation estimates every 30 min. The core precipitation instrument is the Dual-Frequency Precipitation Radar (DPR), which operates at 13.6 GHz and a 5-km footprint, and the GPM Microwave Imager (GMI), which operates from 10 GHz to 183 GHz and has a swath width of approximately 900 km [31]. This combination allows for a more precise measurement of light precipitation, particularly at mid-latitude regions [31]. For this study, monthly GPM precipitation data [32] were retrieved and averaged over the watershed draining to the VS locations. For each VS, one year of previous monthly precipitations (averaged over the VS’s upstream watershed area) from the month containing the minimum altimeter measurement were extracted to understand how precipitation impacts baseflow conditions.

2.3.4. GRACE Total Water Storage Anomalies (TWSA)

Total water storage anomalies (TWSA) from NASA’s Gravity Recovery and Climate Experiment (GRACE) mission describe monthly changes in the vertical storage of water, providing a metric for the functionality of a watershed [33]. Ref. [33] demonstrates the significance of TWSA for a given area, as a large variation in storage may result in a large variation in discharge. This relationship provides the basis for which to use TWSA in relation to baseflow (Q Missing) values. The water storage anomalies are relative to the 2004 to 2009 established baseline from the GRACE mission [34]. The GRCTellus product for TWSA is reported at a 1° grid resolution, with mass-change data based on spherical harmonics from JPL [34]. Building on the relationship between the discharge and the GRACE TWSA established by [33], we analyze TWSA to understand the amount of water stored by each watershed. Although TWSA have been sighted on a coarse spatial scale, this effort focuses on areas where TWSA were spatially averaged over the upstream drainage area (thus relying on a finer spatial scale) [33]. The same approach used with the precipitation data was followed with the monthly GRACE TWSA data, resulting in monthly TWSA from 2002 to 2020 averaged over the upstream land area draining to the VS locations.

2.4. Discharge Estimation and Parameter Optimization

After data collection from Hydroweb, USGS, SWORD, GPM, and GRACE, the following workflow was performed: first, the time series of altimetric data were retrieved from Hydroweb and paired with its nearby USGS gauge. Next, the river-reach characteristics from SWORD were extracted for the VS point location using ArcGIS. Due to the fact that the SWORD rivers are stored as river centerline shapefiles, a buffer was applied to allow for the intersection of the line and point features. USGS gauges were paired with VSs, within a maximum distance of 30 km along the river. Additionally, in order to ensure the USGS gauges were along the same reaches as the VS, only USGS gauges that reported drainage areas within ±25% of the reported VS drainage area were used. The locations of all available VSs, as well as those that were not paired with a nearby USGS gauge, are shown in Figure 2. Of the available VSs within the study region, approximately 230 VSs are located along rivers near available USGS streamflow gauges. This indicates that 230 sites met the following criteria: (1) within 30 km of USGS gauging locations; (2) USGS gauge and VS are along the same river reach; (3) the drainage areas reported by the USGS gauge and SWORD are within ±25% of each other; (4) the VS intersects an available SWORD reach; and (5) the USGS gauge and VS have overlapping time series data. Note that 269 of the available VSs did not meet these criteria and thus were not used for river discharge calculations. The average difference in drainage area between the sites is 1.4%. Table S1 lists the VSs, the closest USGS gauge, and the river reach characteristics determined for each site.
We then applied Manning’s Equation to estimate the river discharge using known and optimized parameters. Here, width and slope from the SWORD reaches are known parameters. The unknown parameters in the equation, which require optimization, include the depth below the min WSE reported by the altimeter, the surface roughness of the channel, and the channel form below the min WSE (i.e., channel shape is assumed as rectangular above the min WSE). The depth below the WSE values tested a sequence of values in intervals of 0.01 m, starting from the minimum WSE to 10 s of meters below that value. The surface roughness range tested was from 0.02 to 0.06. Due to the fact that missing bathymetry captures low-flow characteristics, we explore relationships between low flow and environmental parameters (e.g., precipitation) to estimate n and bottom elevations. For the estimation of river discharge, we use the following methods: (1) optimization of all unknown parameters: n, depth below, and channel form (Optimized All); (2) set channel form, but optimized n and depth below (Opt. 1); (3) set n, but optimized channel form and depth below values (Opt. 2); (4) set channel form and n, with optimized depth below parameter (Opt. 3); (5) set n and channel form, with depth (h0) estimated using a relationship between precipitation and Q Missing (i.e., derived h0 from GPM precipitation, Section 3.3); and (6) estimated using a relationship between the range in TWSA and Q Missing (i.e., derived h0 from GRACE TWSA, Section 3.3). Note, the relationships between precipitation, TWSA and Q Missing are based on the results optimization method 1. Each method derives discharge with a more simplified approach than the previous one, demonstrating the potential for moving away from full optimization approaches to using fitted relationships for areas where no gauges are present. The set channel form and surface roughness values were determined following the optimization of all parameters. A summary of these methods and their associated optimized and constant parameters is shown in Table 1.

2.5. Assessing the Discharge Method

The Kling–Gupta Efficiency (KGE) is a metric often used for applications across hydrology as a means of calibrating or evaluating models [35]. Here, KGE is used to select optimal (maximum KGE) surface roughness, channel-bottom elevation, and channel form by comparing the estimated river discharges to USGS measurements. Thus, KGE is calculated using two time series: the “truth” time series being the river discharge measured at the USGS gauging station, and the estimated river discharge from satellite altimetry and mean reach characteristics. KGE is defined in Equation (2) as:
KGE = 1 ( R 1 ) 2 + ( β 1 ) 2 + ( γ 1 ) 2
R = c o v ( Q e ,   Q o ) σ Q e σ Q o ,   β = μ e μ o ,   γ = σ e μ e σ o μ o ,
where R is the Pearson correlation coefficient, β is the bias ratio, and γ is the relative variability between the time series (Equation (3)) [35]. In this study, Qe is the estimated discharge, and Qo is the observed discharge at the gauge. Cov is the covariance between variables, μ indicates the mean of the time series, and σ indicates the standard deviation of the time series.
A KGE of one (optimum value) indicates that the estimated discharge time series was identical to the observed discharge. While KGE values can have various benchmarks, we use KGE > −0.41 to indicate the estimated value is better than the mean (“reasonable”) [35], while KGE > 0.32 is expected to be similar to or better than the SWOT-derived discharge (“good”) [36]. We consider model simulations with KGE values between −0.41 and 1 to be reasonable. Due to the nature of KGE, it is critical to look at its individual dimensionless components: correlation, bias ratio, and variability ratio. The advantage of KGE as a metric is such that the evaluation of individual components can provide insights into what is driving the performance [24,25,26].
In addition to KGE, absolute and log residual distributions are used to assess performance in terms of relative flow level. In the context of the Manning’s flow equation, errors at lower flow levels can be associated with the remote-sensing resolution, the relative contribution of the missing flow area, and a higher relative importance of flow resistance with decreasing flow depth. At higher flow levels, errors are influenced by increased flow resistances due to bedload transport and vegetation along the banks and overbank flow areas. In both cases, errors are also influenced by the slope and fixed width assumptions.

3. Results

3.1. Results of Estimation Methods

When all unknown parameters were optimized for the 230 sites where river discharge time series were returned, KGE > −0.41 was reported for 87% of sites, and KGE > 0.32 was reported for 71% sites. The optimal surface roughness value selected was generally within the lower range of the tested values (0.02 to 0.03). As a result, surface roughness was held constant at 0.025. Additionally, changing the channel shape resulted in little variability, such that the triangular form was held constant for the remainder of the trial runs. Table 2 summarizes the percentage of sites that reported reasonable and good KGE for each method. The method which relies on derived depth below from GPM precipitation results in 66% of sites with KGE > −0.41 and 47% of sites with KGE > 0.32.
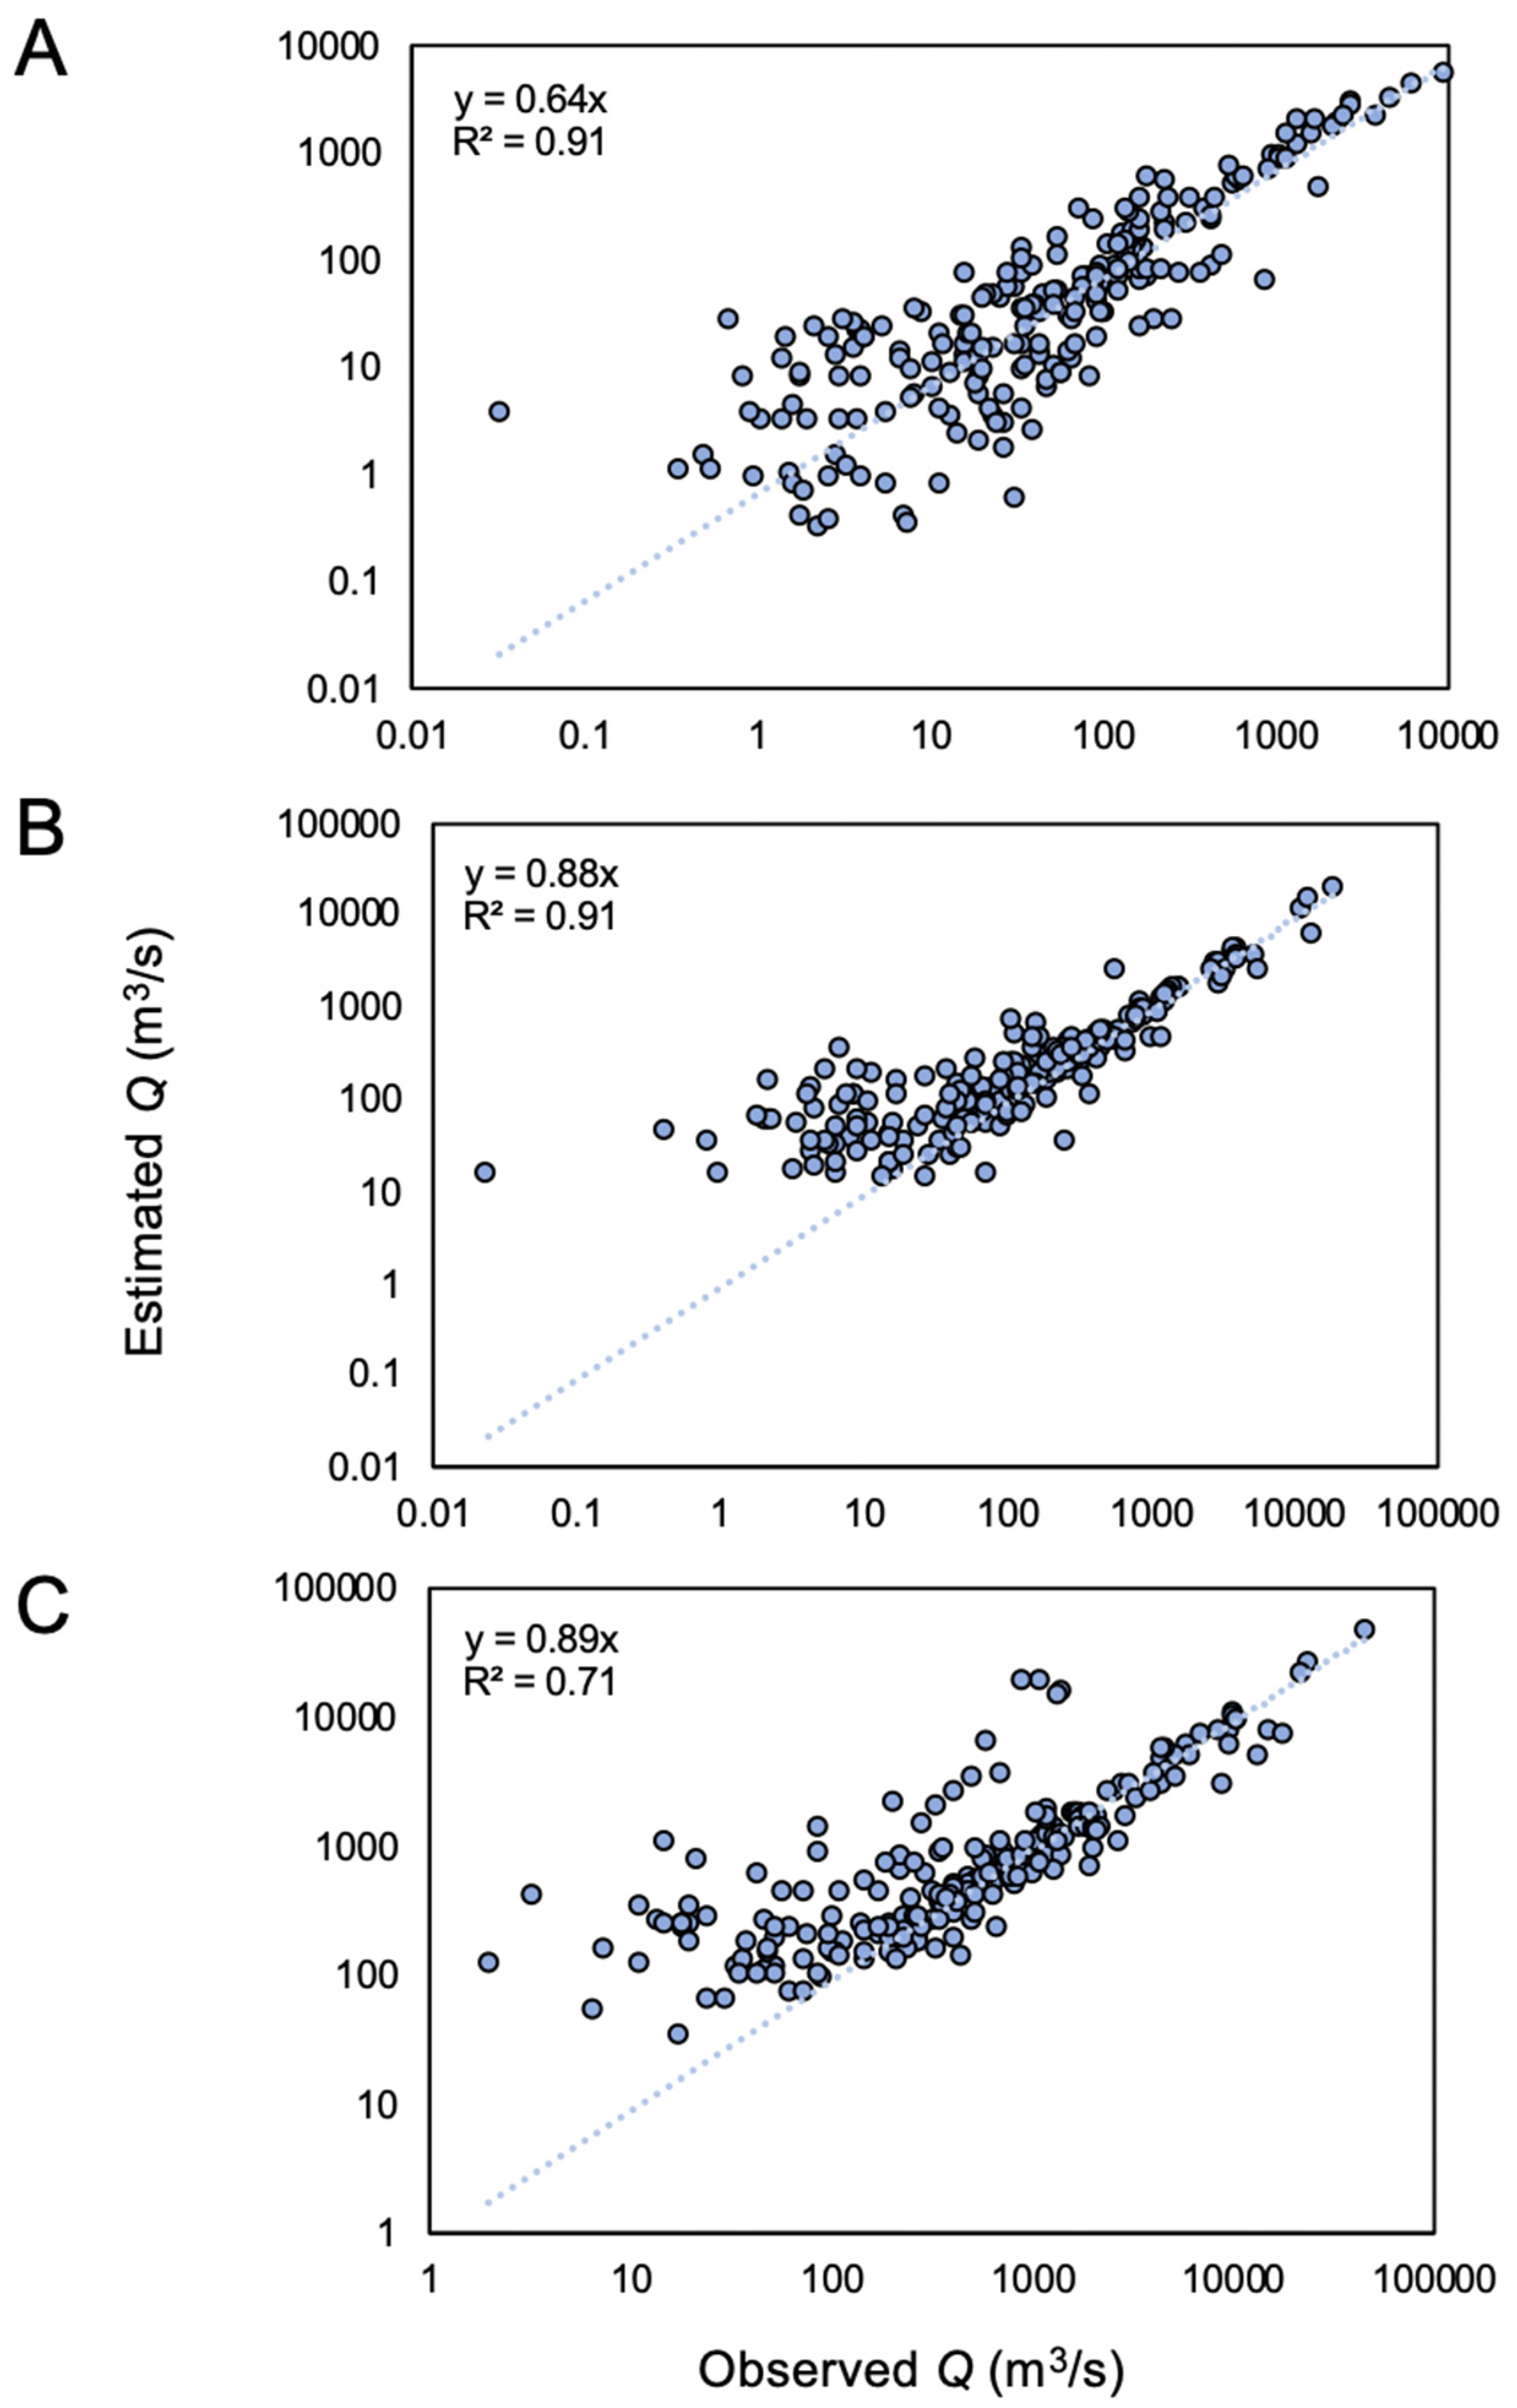
We evaluated how well the remote-sensing-derived time series performed compared to the measured USGS discharge. Within the range of the WSE time series, the minimum, median, and maximum estimated discharge values were compared to the observed USGS discharge values (on the same day as the altimeter observation). The results of the minimum, median, and maximum flow values for the observed and estimated flows are shown in Figure 3. A linear relationship was used to understand how well the minimum flow was captured and suggests that our method tends to underestimate the measured flow by roughly 36%. For median and maximum flows, our approach performs better, underestimating observed discharges by roughly 12% and 11%, respectively.
Tuning the Manning Equation using the mean annual discharge, a constant river slope, and an idealized channel shape has previously been proven to be a robust method, given there are no extreme events for the time series (e.g., floods) [22]. This is perhaps demonstrated in our relationships between the observed and estimated minimum, median, and maximum flows, as our results show that the river discharge derived from remote sensing captures the median flows better than the minimum and maximum extremes—despite all reporting acceptable R2 values.
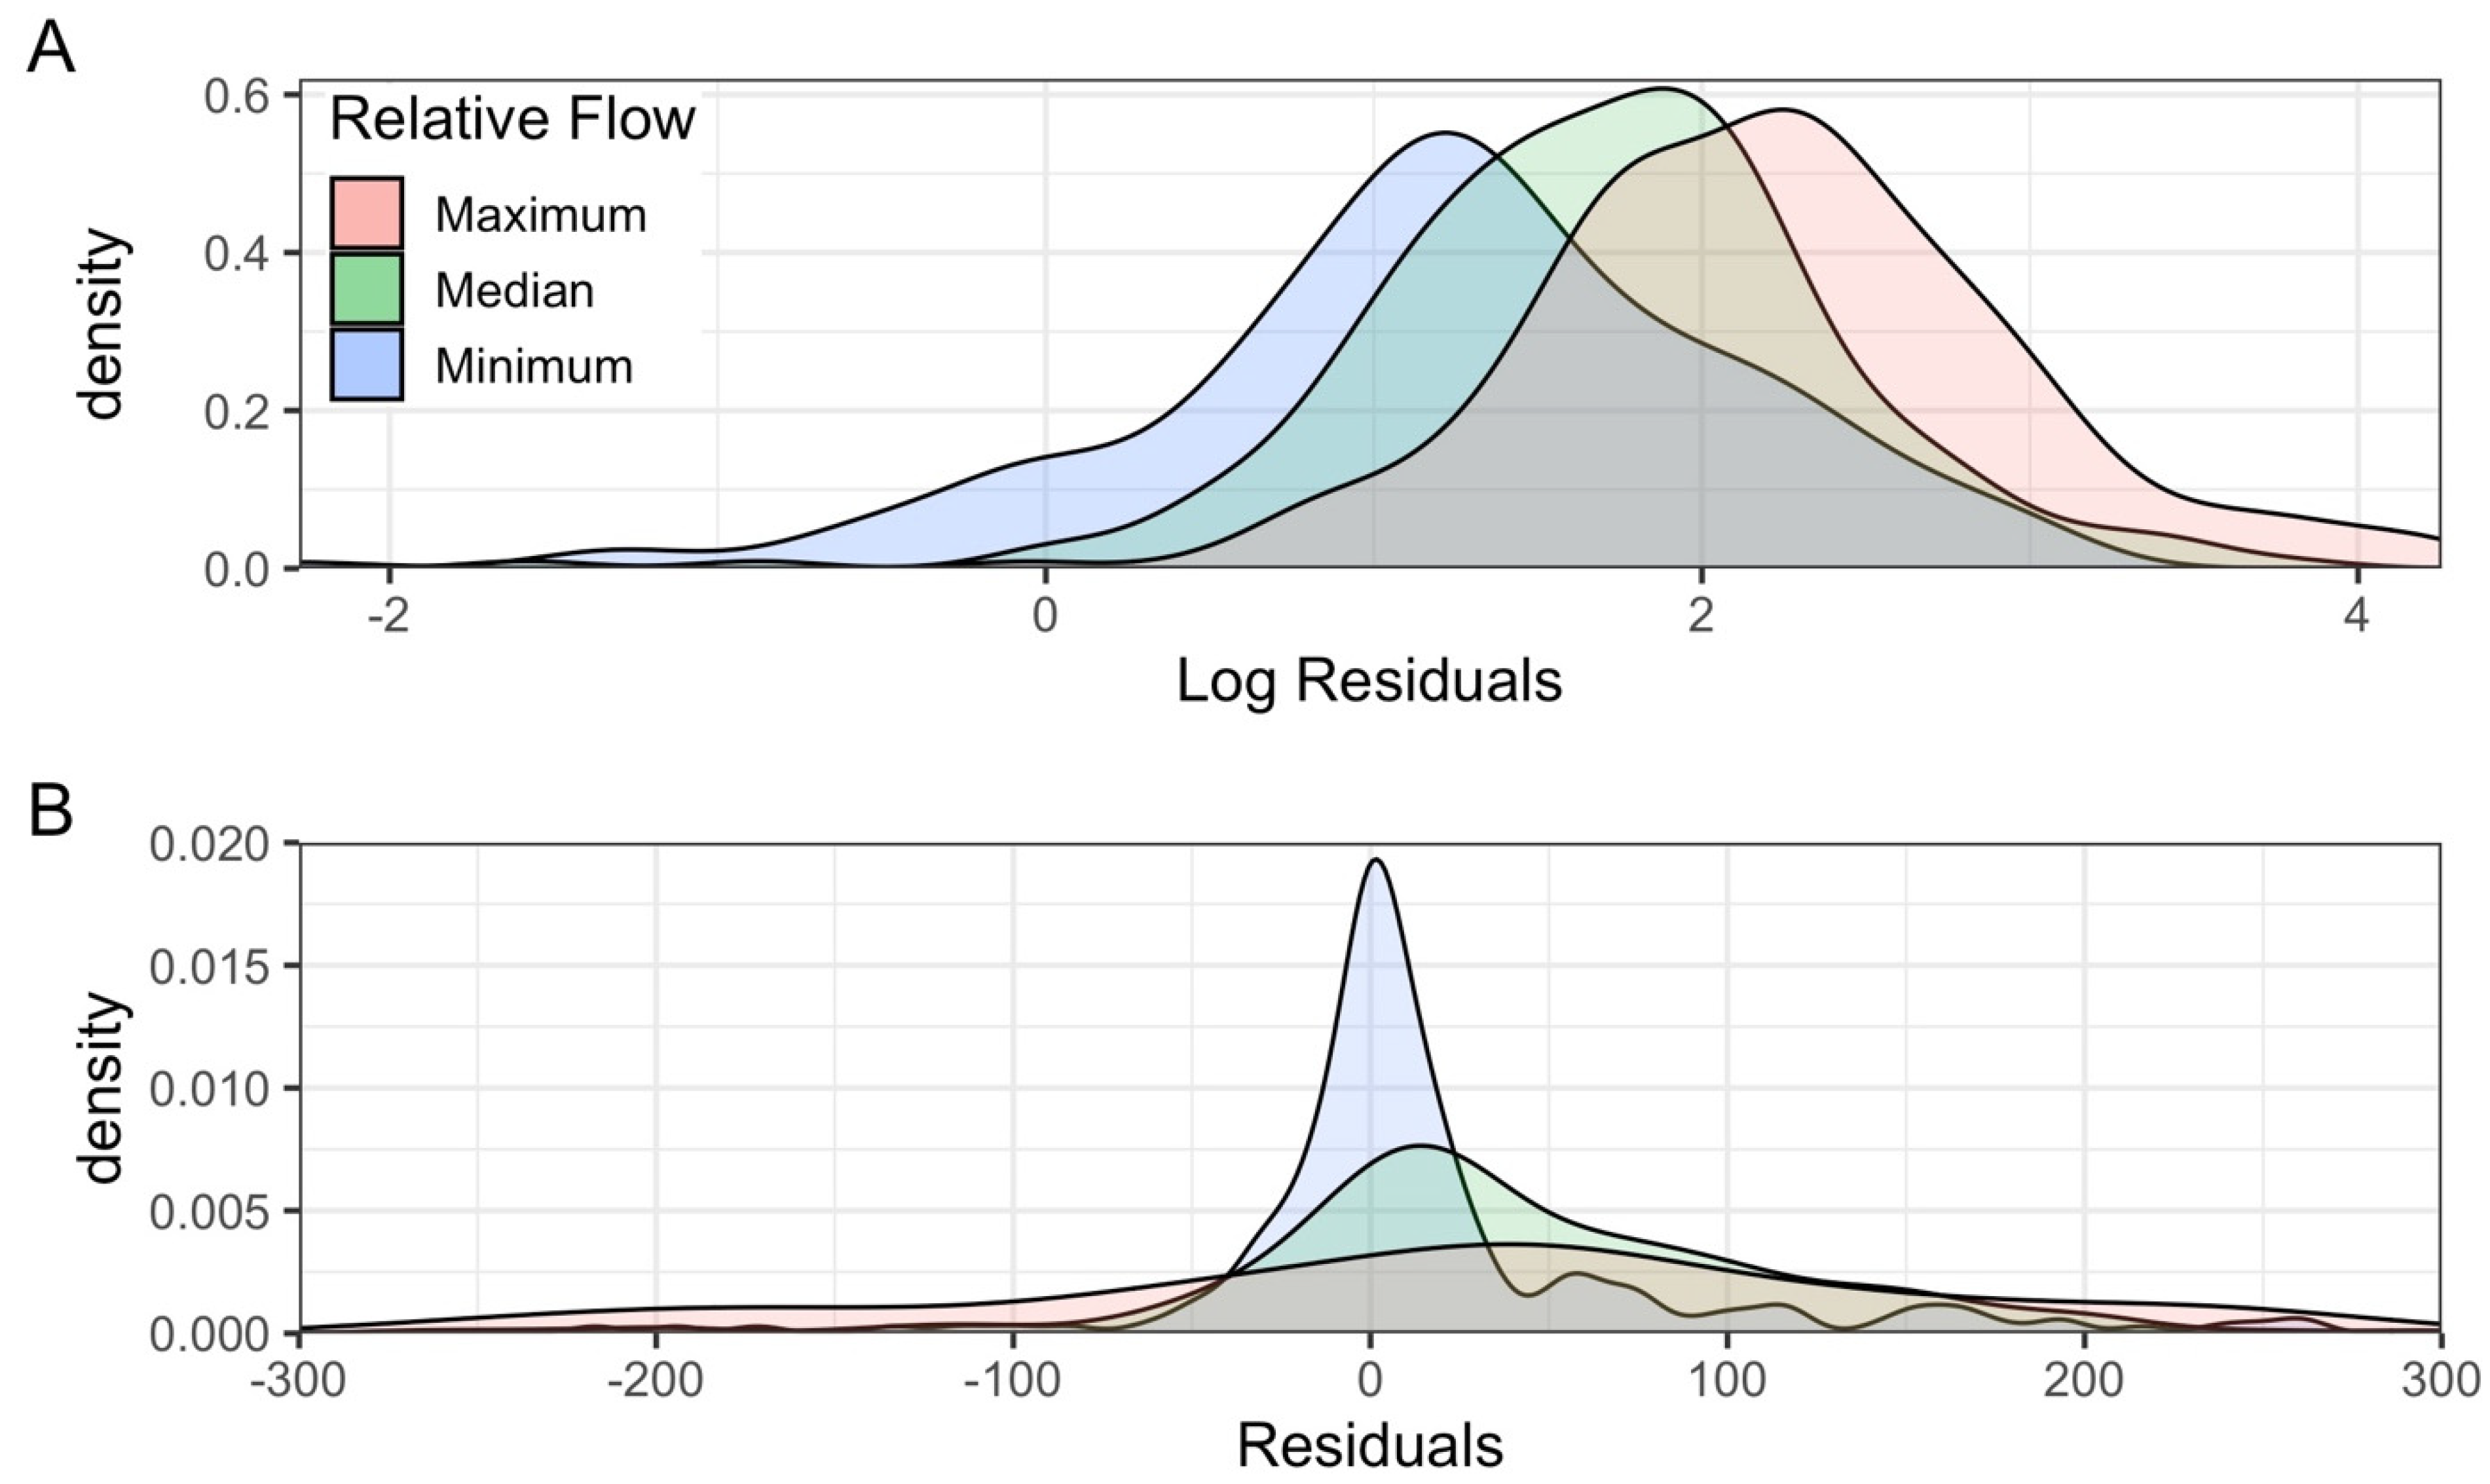
To expand on these issues, the distributions of the residuals were analyzed. The estimated log of the residual values shows the skew of the relative flows (Figure 4A). Although the widths of the log residual distributions for the minimum, median, and maximum flows are similar (1.48, 1.46, and 1.55, respectively), the means of the residual values increase from minimum to median to maximum flow values (1.2, 1.7, and 2.2, respectively). The distribution of the residuals suggests that minimum flows are consistent with neither under- nor over-estimating the observed values (Figure 4B), as nearly 50% of sites result in residuals of roughly 0. The median and maximum flows tend to over-estimate relative to the observed values at nearly 75% and 64% of residuals greater than 0, respectively. Additionally, the distribution of the residuals for the maximum flows suggests there are some cases where the maximum flow is severely overestimated. The results of the analysis of the residuals supports the idea that maximum flows are perhaps most difficult to capture using remote-sensing methods.

3.2. Performance of Channel Form

The assumption of different idealized channel shapes was used, as channel forms tend to remain stable over time [2]. The width–discharge (w/d) rating method is often used for understanding the river flow of rivers of varying widths, although it is critical to note that this relationship does not define the cross-sectional shape of the channel. The assumption is such that width would generally increase as discharge increases. This relationship is generally true for rivers as they flow downstream, because the river adjusts (e.g., in width) to maintain the capacity of flow [37]. Thus, rivers will approximate equilibrium between the channel geometry and the water and sediment volumes it is transporting [25]. The significance of this relationship is demonstrated for various channel forms. Whether channel forms are theoretical or practical, it is often not obvious what the efficiencies of the cross-sectional characteristics are [25]. For rectangular channels, river width is likely to remain stable; the same is true for highly irregular channel shapes.
Here, the triangular form for the flow area below the min WSE returned the maximum KGE for nearly 60% of sites. The parabolic form returned the maximum KGE for 27% of sites. Notably, the trapezoidal channel shape with a 1:1 side slope was not the optimal channel shape for any of the sites. Given that the ratio of width to depth is governed by the channel shape, the triangular channel form was likely the most “ideal” for the majority of study regions, because the fixed width allowed for the channel to optimize at a greater depth, thus more precisely estimating the lowest flow conditions (e.g., Q Missing). This observation is consistent with findings which suggest the depth (with respect to the assumed w/d ratio and associated cross-sectional form) of the channel is significant for understanding the discharge efficiency of a given channel [25].

3.3. Using GPM Precipitation and GRACE TWSA for Estimating Q in Ungauged Locations

In order to estimate discharge without optimization methods (e.g., for use where there is no adjacent in-situ gauge), the missing channel bathymetry, or the depth below which the altimeter can see, must be determined. This study uses simple linear regression models to calculate Q Missing where the precipitation and TWSA are known. From this estimation of Q Missing, the h0 value can be determined using Manning’s Equation—by solving for h0 rather than discharge. This estimate of Q Missing can thus mimic an ungauged location.
The use of precipitation to understand channel bathymetry is such that more rainfall will result in higher streamflow (i.e., Q Missing). The relationships between different combinations of the previous months of rainfall (e.g., 1, 2, 3, 6) relative to the date of the observed minimum water level and optimized Q Missing values were calculated using a linear regression model (Figure 5A). The previous two months of rainfall reported the best R2 value at 0.47. The previous three and six months of precipitation reported R2 values of 0.38 and 0.40, respectively.
The use of GRACE TWSA to understand channel bathymetry is such that TWSA describes how much water is moving through the system. The relationships between various ranges in TWSA (e.g., annual, monthly) and Q Missing were calculated using a linear regression model (Figure 5B). This annual range in TWSA reported the best R2 value at 0.53. Monthly changes in TWSA were also calculated on an annual basis and resulted in an R2 value of 0.25. Changes in TWSA related to the date of the minimum observed water level (similar to that calculated for precipitation) were also calculated but resulted in a lower R2 (0.17).
The relationships between rainfall and Q Missing and TWSA and Q Missing are preliminary and intended to represent what is possible for ungauged locations. Other methods, including multiple linear regression or machine learning, may provide better relationships between environmental factors and the missing baseflow. For the river discharge calculated using the GPM precipitation-derived h0, our method underestimates the minimum observed flow by 23%. The comparison of the median and maximum flows for this method reveals an underestimation of 4% and 16%, respectively. River discharge calculated using the GRACE TWSA-derived h0 underestimates the minimum observed flow by 32%. The median and maximum observed flows are also underestimated by 7% and 11%, respectively.
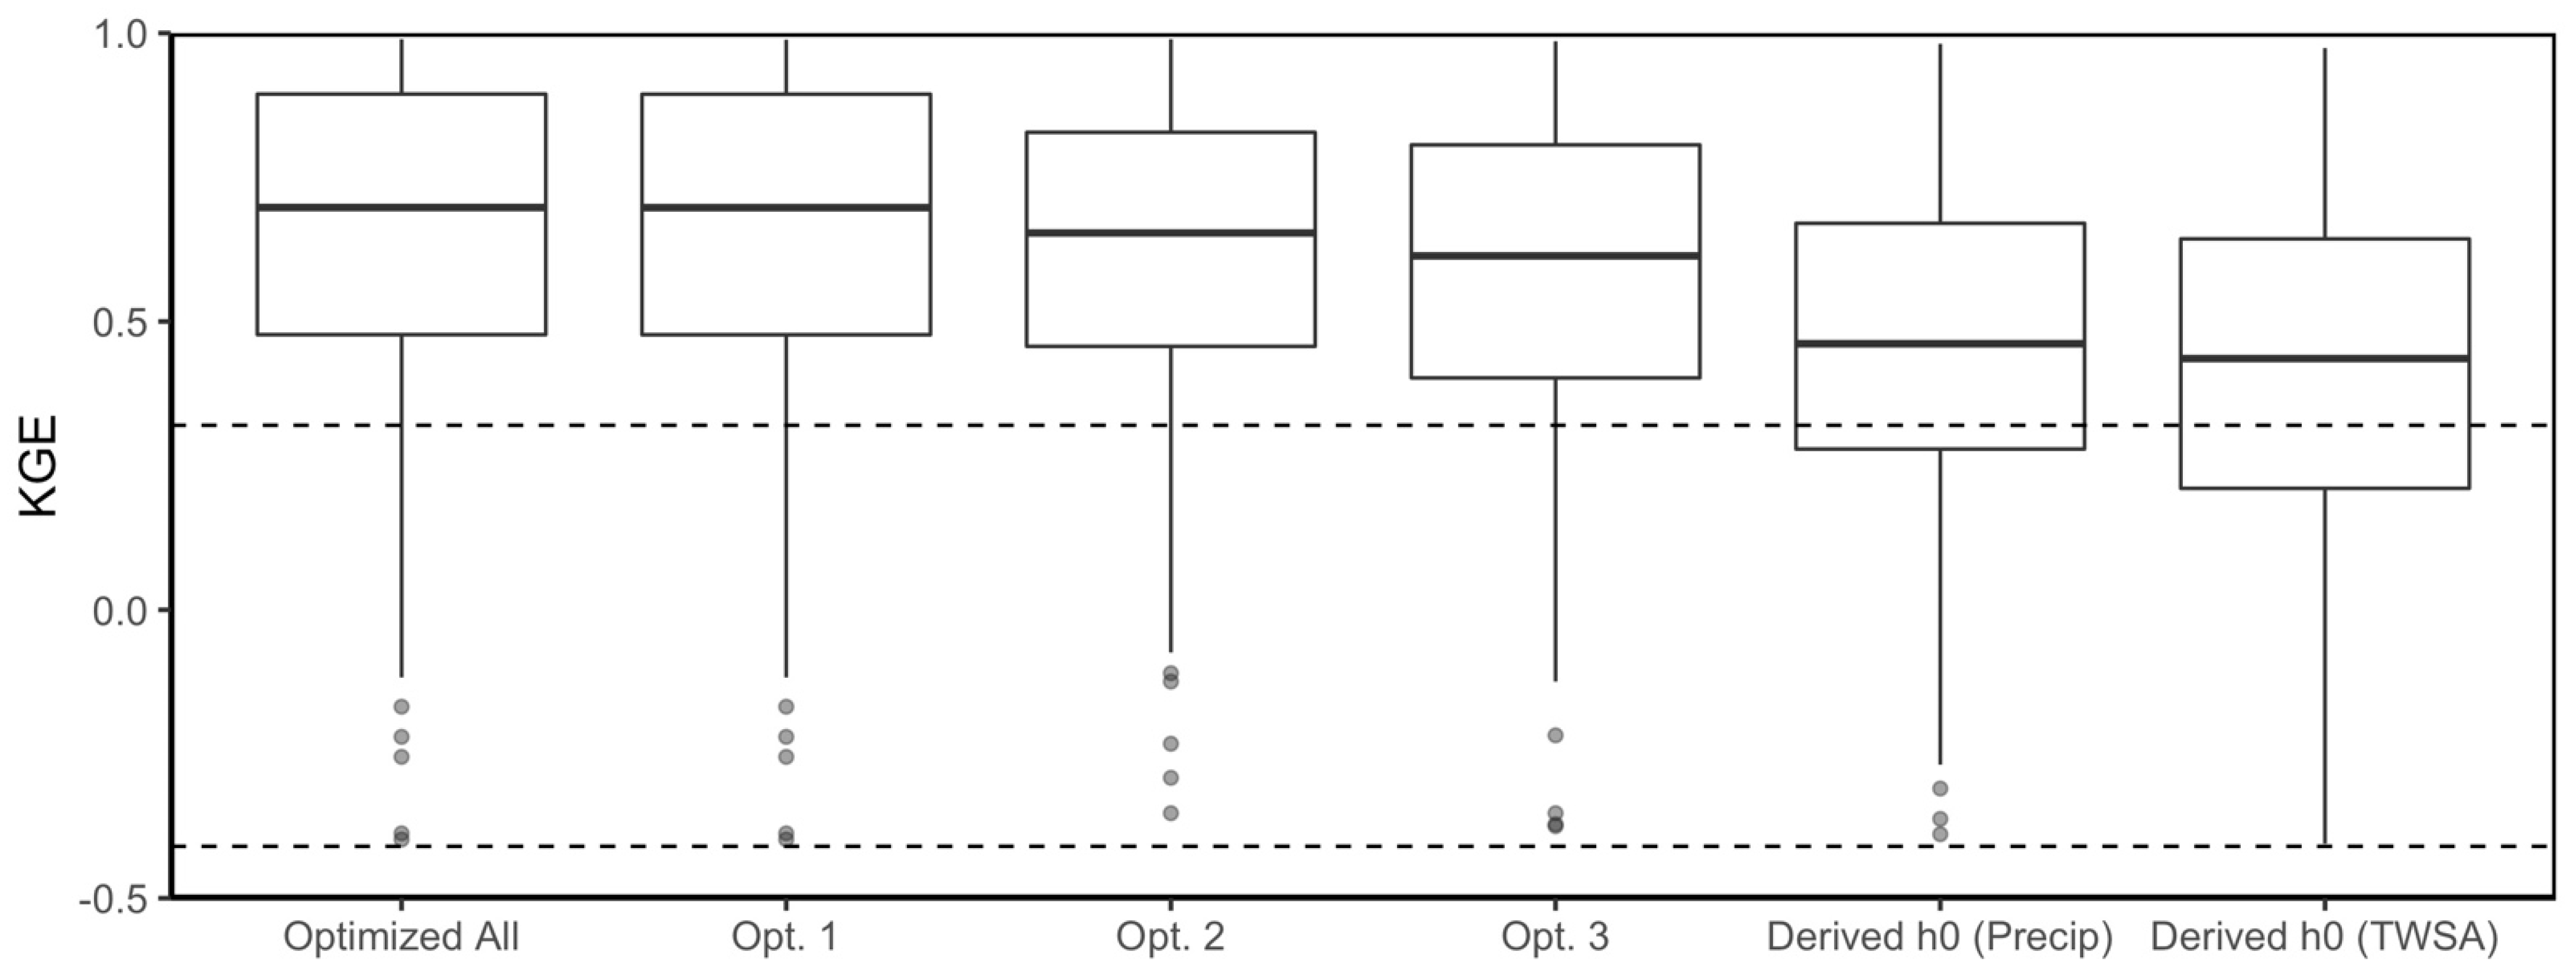
The distributions of KGE for all of the methods tested are displayed in Figure 6. The optimization of all parameters provides the best KGE, but the river discharge derived from the precipitation and TWSA relationships (which offers the simplest approach and ties the baseflow to environmental parameters) still report median KGEs > 0.32, thus implying a “good” median KGE across all sites for these methods. It is perhaps interesting to note that the precipitation-derived depth values report a higher median KGE (0.46) than the TWSA-derived depth values (0.44) despite the higher correlation between TWSA and Q Missing shown in Figure 5. This is perhaps because the precipitation values are directly related to the environment at the time of the observed low flow. Additional tuning of these relationships is likely required to best capture the missing bathymetry using such remotely sensed methods.
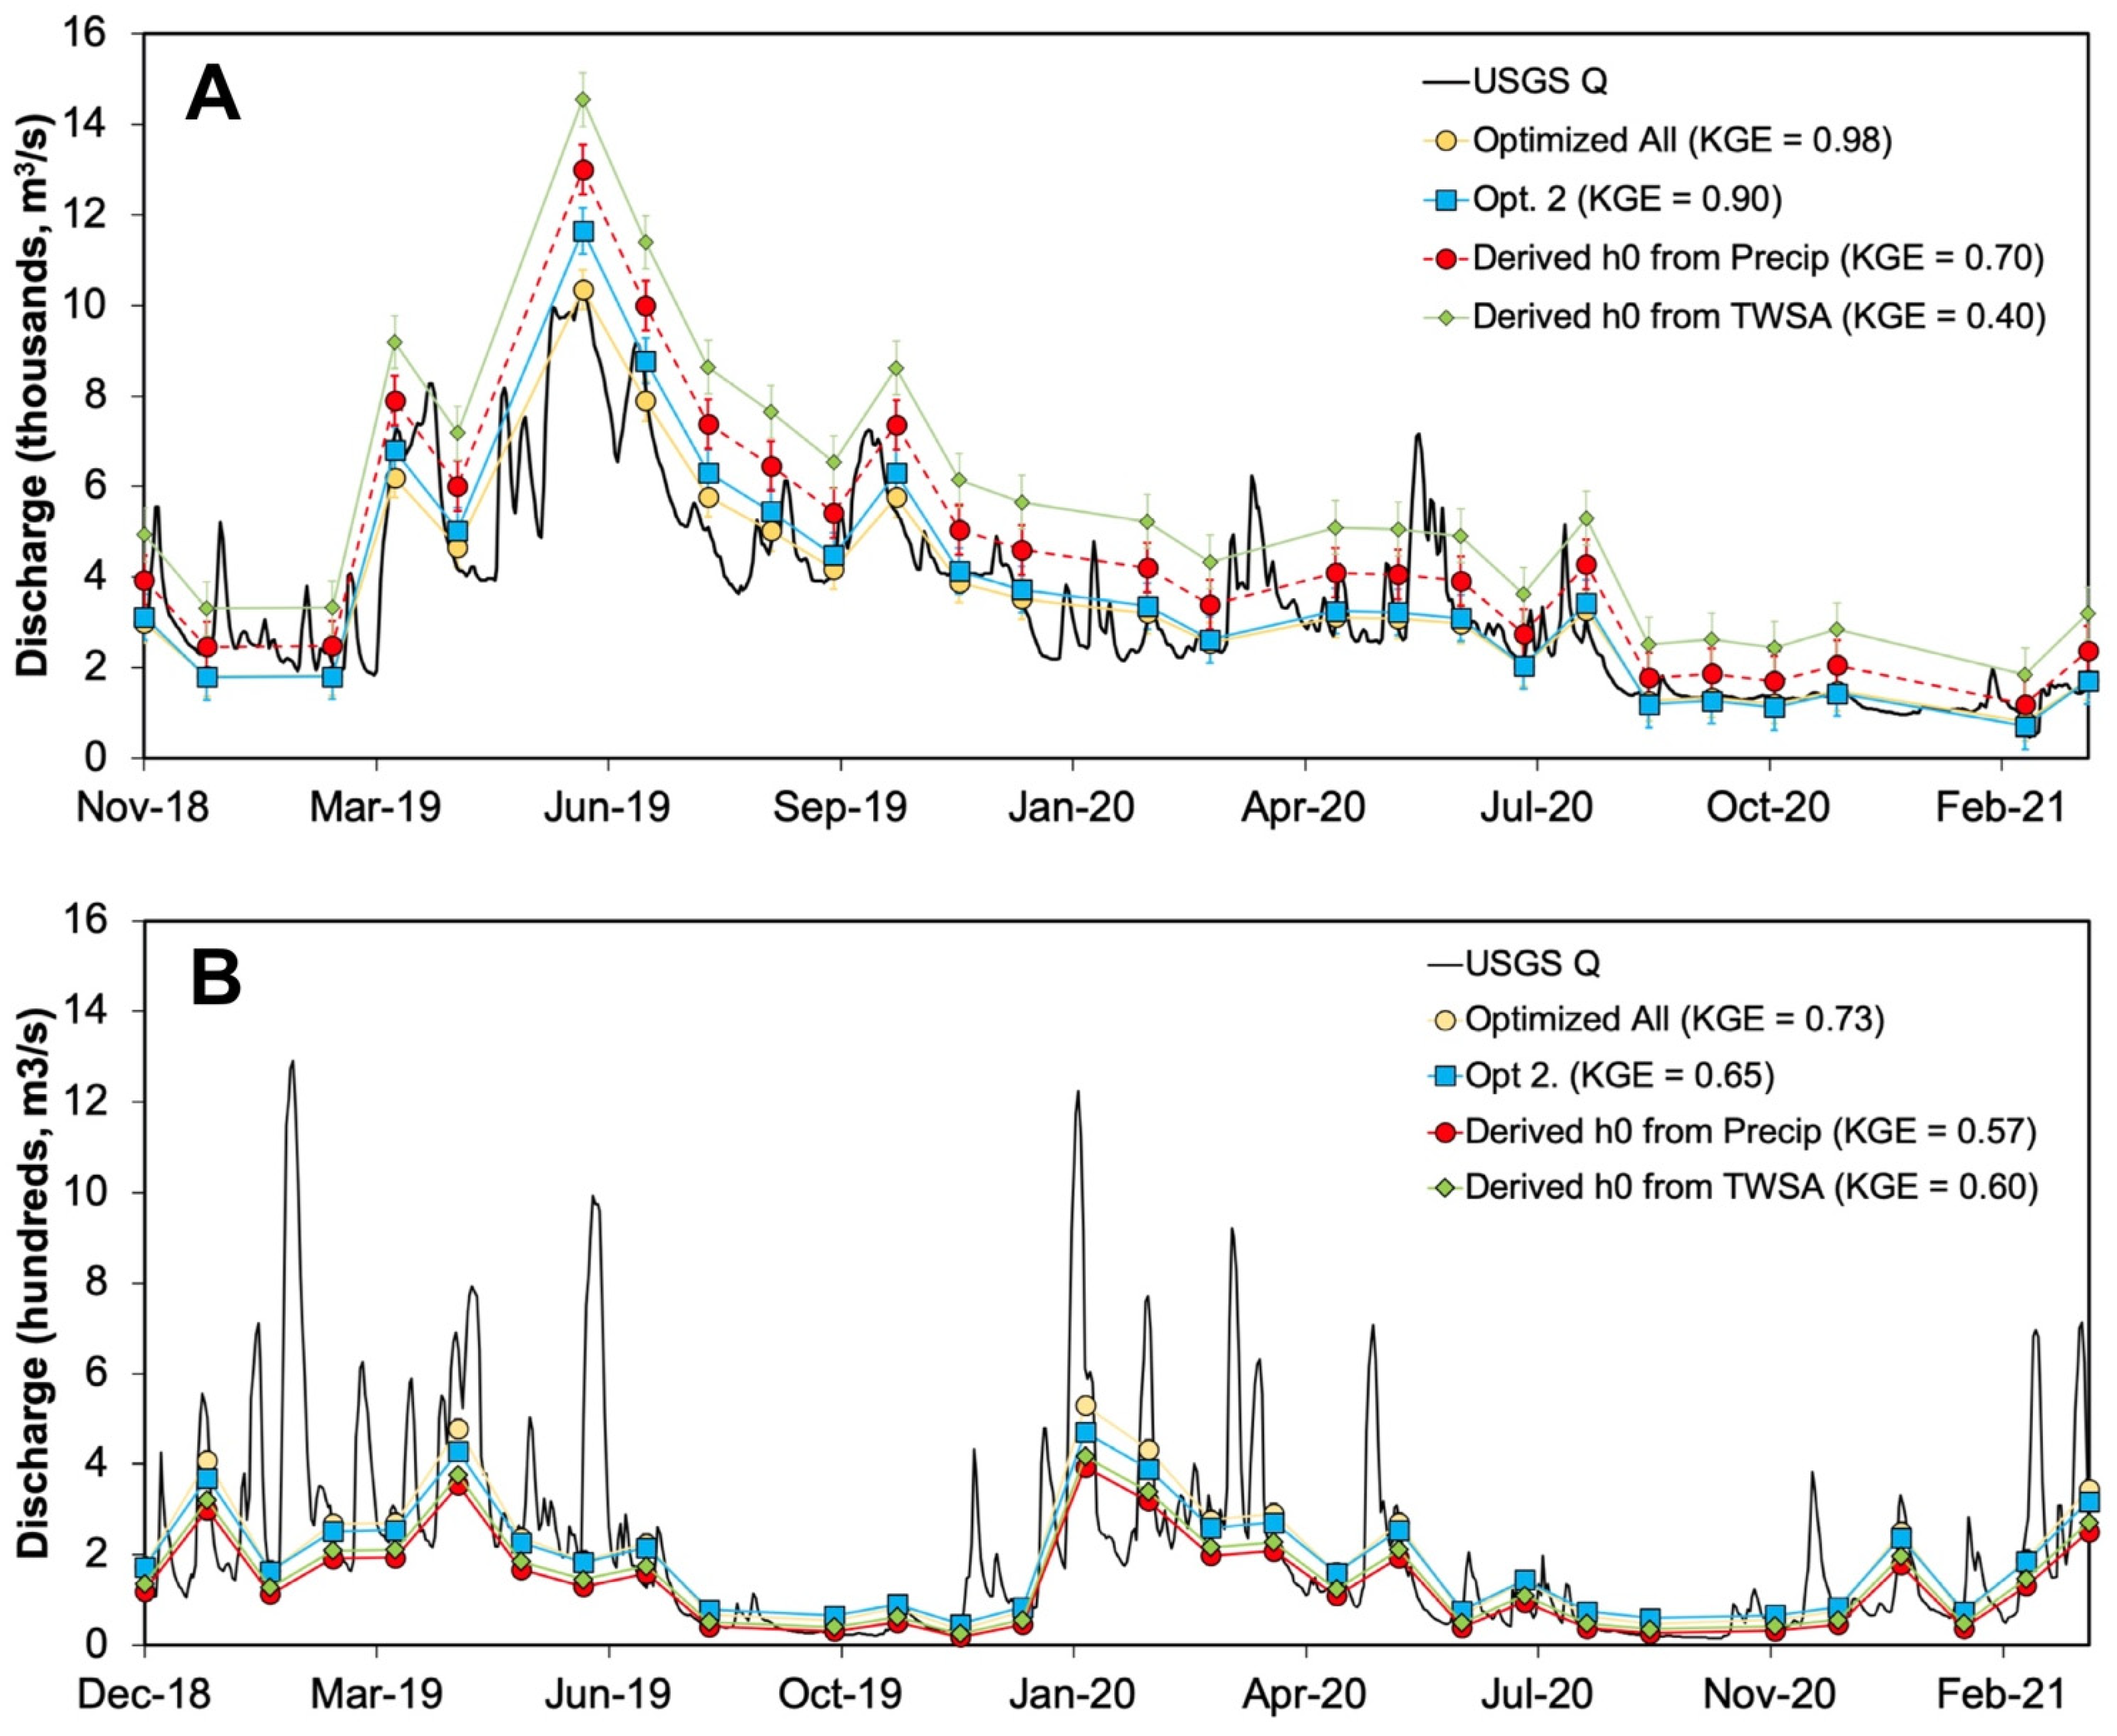
The results of the time series output by the various methods are displayed in Figure 7 for VS #2086 and USGS Gauge 06910450 (Missouri River at Jefferson City, MO, USA) and VS #2036 and USGS Gauge 03360500 (White River at Newbury, IN, USA). It is important to note that there is not yet a method to combat the lack of temporal coverage in WSE [13]; this spacing between points is a result of the repeat cycles for a given satellite. In general, the discharge calculated using the Manning Equation and WSE captures the fluctuations in discharge observed by the USGS. The derived methods are able to capture peak flows and low flows relatively well (e.g., KGE > −0.41), although altimeter observations miss some of the peak values due to a lack in the temporal coverage on those days. Nonetheless, for VS #2086, the optimized method results in a KGE of 0.98, while the more simplified methods—where the surface roughness is held constant at 0.025, and Q Missing is calculated using precipitation- or TWSA-derived depth values—result in KGE values of 0.90, 0.70, and 0.40, respectively. Thus, KGE decreases as the methods deviate farther from optimizing all factors; the same observation is generally true for VS #2036. Notably, for VS #2086, the precipitation-derived depth values provide a time series closer to the truth series than the TWSA-derived values; the opposite is true for VS #2036. For all sites, the average percentage changes in KGE from the optimization of all methods to the precipitation- and TWSA-derived depth values are −5.6% and −5.3%, respectively. KGE improved using the derived h0 from precipitation and TWSA for two sites (VS #5376 and VS #2203).

4. Discussion

4.1. Sources of Bias in the Calculated Discharge

A preliminary analysis of the spatial variation of KGE from the estimated and observed time series shows a trend in areas with reasonable and unreasonable results. The conversion of precipitation to streamflow could result in a potential source of bias in the estimated discharge time series. This is observed in Figure 8, where a cluster of bias-dominated sites is located in Lower Missouri and Arkansas.
It is possible this bias is a result of reservoirs controlling flow more than the assumption of satellite-derived rainfall in these areas (i.e., the relationship between discharge and precipitation is altered in this region due to reservoir regulations) or flow conditions being more dominant in this region. Recently, research has shown precipitation within the Missouri River Basin to be lower than average, despite wetter soil moisture conditions [38]. Additionally, flooding potential in the basin is dominated by precipitation and snowmelt events [39]. The hydrologic response of the region in the Lower Mississippi River Basin has been shown to be dominated by reservoirs and dams in simulated hydrographs [38]. The inclusion of reservoirs in model simulations improved the results of the modeled discharge significantly, proving (1) there are challenges related to model computations of streamflow, and (2) the significance of dams and reservoirs can be demonstrated at various scales [38]. Thus, it may be significant for future research to include other environmental parameters in addition to precipitation in order to best capture the processes which govern streamflow.
An example of this bias related to an overestimation of the precipitation—Q Missing relationship can be demonstrated using the VS, as shown in Figure 5. VS 2086 is located along the Missouri River. In Figure 5, the location of the point in relation to where it falls relative to the established relationship between previous months of precipitation and Q Missing is highlighted. The point representing VS 0286 falls below the line, indicating that the fraction of precipitation contributing to the low flow is a source of bias (i.e., precipitation overestimates Q Missing). This is likely due to the conversion of precipitation to streamflow, given some areas produce more or less runoff for a given volume of precipitation. This discrepancy explains what causes the overestimation of flow for this method. KGE can be assessed by breaking down the correlation coefficient, bias ratio, and variability components. The bias ratio calculated for the optimized method is 1.004, while the bias ratio for the precipitation-derived h0 method is 1.4; this comparison (33% difference in the resulting bias ratio) for this site further demonstrates the significance of bias in such calculations. It is important to note the use of these methods does not always result in an over- or under-estimation. The location of VS 2036 is also displayed in Figure 5, and the time series of various methods shown in Figure 7B reveals discharge values with less of a varied range.
The cumulative distribution functions of the performance metrics incorporated in KGE were calculated in order to understand why some locations did not compare well relative to the truth time series. The further breakdown of the KGE components reveals bias to be the dominating factor in the calculation of KGE for our sites (Figure 9). Due to the fact that a KGE of 1.0 would imply the modeled time series perfectly reproduced the observations, the optimal values of each individual component would also be 1. Generally, bias percentages within ±20% are acceptable [40]. Approximately 75% of sites reported a correlation better than 0.5. For variance, almost 90% of sites were within ±0.5 of 1. Nearly 75% of the bias ratios for our study area are generally between 0 and 1.2, although there are some locations that are consistent with large (e.g., greater than 2) positive bias ratios that are likely to be skewing the calculation of KGE for these locations. Related to the calculation of KGE, errors in bias are more significant than errors in the other components, particularly variance [41]. These sites are generally located in dryer regions (i.e., where the conversion of precipitation to runoff is highly variable) of the United States (e.g., Kansas, Missouri, and Arkansas; Figure 8) [41].
This observation of bias-dominated locations is consistent with our current theory that reservoirs and arid/semi-arid conditions control streamflow. This observation necessitates further analysis on the climate of this region and associated calculated discharge values.

4.2. Uncertainty

Uncertainty values related to each WSE measurement from Hydroweb Theia are reported for each site. At each transect, the associated uncertainty represents the standard deviation from a median value (calculated after analyzing the high-frequency measurements) [42]. Uncertainty values range from 0.01 to 4.93 m. The average uncertainty reported for WSE across all sites is 0.27 m. Adding and subtracting the measured uncertainty to the WSE for the estimation of the discharge results in −3.0% and −2.7% median changes in KGE, respectively. To understand how uncertainty could impact the discharge time series, a random uncertainty value within +/− the range of the reported uncertainty was selected and added to the WSE for each site. This process was repeated 10 times to ensure random results. The median KGE of the output of the time series with randomly selected uncertainty values is 0.57; the median change of the output time series for the uncertainty analysis is −8.9%.
Additionally, there is potential uncertainty in the derived parameters from SWORD, as using width and slope as static variables does not reflect the dynamic variability of the river channels. Ref. [43] suggests that river discharge from space may be most applicable on reaches where river-width and water-level variations are pronounced. The assumption of width and slope as reach-averaged, static values for each site would reflect the relationship between WSE and river channel morphology. This means the river discharge we calculated is perhaps less representative of overall channel geometry and flow resistance [43]. Potential limitations also arise with the estimation of the roughness coefficient. Although there are some regions with determined roughness coefficients through field verification, this parameter is unknown in many areas [8]. Due to the fact that the range in selected surface roughness values during the optimization process remained steady in the lower ends of the tested values (between 0.02 and 0.03), it seems appropriate to assume a constant value will not greatly impact the results of the calculations.
There is also uncertainty related to a guessed depth parameter. This analysis does not estimate the potential uncertainty related to either the surface roughness coefficient or the assumed bathymetry, because it is difficult to discern the significance of each variable. These variables can be determined using a variety of methods if necessary, including measurements from field surveys [2]. Other methods have been used to determine the unknown bathymetry in river channels; for example, bathymetric inversion has previously been applied to determine the average depth of the channel in river-discharge calculations [44]. Bathymetric inversion implies machine-learning techniques used to infer the bathymetry based on measurable data (e.g., velocity profiles). The inverse problem is consistent with the assumptions in this study, where, on the global scale, there are generally three unknown factors: discharge, bathymetry, and the friction coefficient [31,32]. This is most challenging for ungauged rivers (naturally, where these methods are most necessary), although such methods are often improved with an input annual mean discharge. This method, however, is perhaps most dependent on the surface roughness coefficient, which is not measurable from space [43].

5. Conclusions

We demonstrate the use of Manning’s Equation for quickly estimating river discharge, allowing for the potential to establish time series in ungauged locations using assumed parameters (surface roughness, channel shape) and established relationships between low flows, months’ precipitation, and ranges in TWSA. It is critical to note that remotely sensed river-reach characteristics and WSE are not to be used as a replacement for in situ gauge networks, but rather an improvement of the overall lack of globally available data. Due to the fact that stream gauge data are collected on a local scale, it is possible that a broader picture (e.g., spatially and temporally) of river discharge could be captured using remote-sensing products [45]. Our results show that 70% of the sites report a KGE > −0.41 using methods that are applicable for ungauged locations (e.g., the derivation of low-flow conditions using precipitation data). For optimization, surface roughness values generally remained consistent, with 0.025 being the most used across the sites. The triangular channel form below the min observed WSE returned the best KGE across nearly 60% of sites, with an average KGE of 0.57. This consistency suggests it may be appropriate to approximate these parameters. This approach will be expanded to assess its use globally on rivers of various shapes and sizes. The integration of satellite altimetry and optical observations across different platforms would allow for a more complete temporal and spatial record, potentially improving this methodology. Additionally, the impact of the assumed rectangular shape above the minimum WSE could be explored in future studies.
It is also possible that future research could use a machine-learning approach to determine which of the unknown parameters is most important for discharge estimation (e.g., a random forest model to assess the importance of each parameter using weighting). This approach would not only demonstrate which parameters are of most hydraulic importance, but it would also allow for a greater understanding of locations where this approach is most applicable (e.g., for deriving river discharge from space, what are the best locations?) [43]. This research would be significant for further applications that could be used to derive discharges in remote locations where bathymetry and river characteristics are often difficult to determine. The incorporation of other remote-sensing instruments can be used to validate some of the assumptions used in this study, including the measurement of the depth below our altimetric observation. Should this be an accurate way of understanding bathymetry (or depth to bottom), this remote-sensing application could be used to validate our methodology.

Supplementary Materials

The following supporting information can be downloaded at: http://www.hydroshare.org/resource/c37e286970344d2e81c2ece1f6189532.

Author Contributions

Individual contributions are as follows: Conceptualization, J.G. and E.B.; methodology, J.G. and E.B.; software, J.G. and E.B.; validation, J.G. and E.B..; formal analysis, J.G.; investigation, J.G.; resources, J.G. and E.B.; data curation, J.G. and B.D.; writing—original draft preparation, J.G.; writing—review and editing, J.G. and E.B.; visualization, J.G.; supervision, E.B.; project administration, E.B and J.G.; funding acquisition, E.B. and J.G. All authors have read and agreed to the published version of the manuscript.

Funding

This research was funded by the NASA, GRACE-FO, and Carbon Cycle Science Teams, grant numbers 80NSSC20K0742 and 80NSSC22K0145. Any opinions, findings, and conclusions or recommendations expressed in this material are those of the authors and do not necessarily reflect the views of the research sponsors.

Data Availability Statement

All code and text files used for the implementation of this research are available through CUAHSI’s HydroShare (https://www.hydroshare.org/, accessed on 18 May 2022) with the following link: http://www.hydroshare.org/resource/c37e286970344d2e81c2ece1f6189532. The Hydroweb Theia river altimetry data can be accessed here: https://hydroweb.theia-land.fr/?lang=en& (accessed on 18 May 2021). The USGS gauge discharges can be accessed here: https://waterdata.usgs.gov/nwis/sw (accessed on 18 May 2021). The SWORD dataset can be accessed here: https://zenodo.org/record/3898570#.YoUOFxPMJZI (accessed on 18 May 2021). Global precipitation data from GPM can be accessed here: https://disc.gsfc.nasa.gov/datasets/GPM_3IMERGM_06/summary (accessed on 18 May 2021). The TWSA data from GRACE can be accessed here: https://grace.jpl.nasa.gov/data/get-data/monthly-mass-grids-land/ (accessed on 25 May 2021).

Conflicts of Interest

The authors declare no conflict of interest.

References

  1. Scherer, D.; Schwatke, C.; Dettmering, D.; Seitz, F. Long-Term Discharge Estimation for the Lower Mississippi River Using Satellite Altimetry and Remote Sensing Images. Remote Sens. 2020, 12, 2693. [Google Scholar] [CrossRef]
  2. Bjerklie, D.M. Estimating the bankfull velocity and discharge for rivers using remotely sensed river morphology information. J. Hydrol. 2007, 341, 144–155. [Google Scholar] [CrossRef]
  3. Nickles, C.; Beighley, E.; Feng, D. The Applicability of SWOT’s Non-Uniform Space–Time Sampling in Hydrologic Model Calibration. Remote Sens. 2020, 12, 3241. [Google Scholar] [CrossRef]
  4. Pavelsky, T.M.; Durand, M.T.; Andreadis, K.M.; Beighley, E.; Paiva, R.; Allen, G.H.; Miller, Z.F. Assessing the potential global extent of SWOT river discharge observations. J. Hydrol. 2014, 519, 1516–1525. [Google Scholar] [CrossRef]
  5. Gleason, C.J.; Wada, Y.; Wang, J. A Hybrid of Optical Remote Sensing and Hydrological Modeling Improves Water Balance Estimation. J. Adv. Model. Earth Syst. 2018, 10, 2–17. [Google Scholar] [CrossRef]
  6. The Global Runoff Data Centre. Koblenz, Germany. Available online: https://www.bafg.de/GRDC/EN/Home/homepage_node.html (accessed on 12 June 2022).
  7. Maidment, D.R. Open Water Data in Space and Time. JAWRA J. Am. Water Resour. Assoc. 2016, 52, 816–824. [Google Scholar] [CrossRef]
  8. Boulomytis, V.; Zuffo, A.; Filho, J.G.D.; Alam Imteaz, M. Estimation and calibration of Manning’s roughness coefficients for ungauged watersheds on coastal floodplains. Int. J. River Basin Manag. 2016, 15, 199–206. [Google Scholar] [CrossRef]
  9. Sneeuw, N.; Lorenz, C.; Devaraju, B.; Tourian, M.J.; Riegger, J.; Kunstmann, H.; Bárdossy, A. Estimating Runoff Using Hydro-Geodetic Approaches. Surv. Geophys. 2014, 35, 1333–1359. [Google Scholar] [CrossRef]
  10. Zakharova, E.; Nielsen, K.; Kamenev, G.; Kouraev, A. River discharge estimation from radar altimetry: Assessment of satellite performance, river scales and methods. J. Hydrol. 2020, 583, 124561. [Google Scholar] [CrossRef]
  11. Dixon, B.; Earls, J. Effects of urbanization on streamflow using SWAT with real and simulated meteorological data. Appl. Geogr. 2012, 35, 174–190. [Google Scholar] [CrossRef]
  12. Faramarzi, M.; Abbaspour, K.C.; Vaghefi, S.A.; Farzaneh, M.R.; Zehnder, A.J.; Srinivasan, R.; Yang, H. Modeling impacts of climate change on freshwater availability in Africa. J. Hydrol. 2013, 480, 85–101. [Google Scholar] [CrossRef]
  13. Ferreira, V.G.; Gong, Z.; He, X.; Zhang, Y.; Andam-Akorful, S.A. Estimating total discharge in the yangtze river basin using satellite-based observations. Remote Sens. 2013, 5, 3415–3430. [Google Scholar] [CrossRef] [Green Version]
  14. Tourian, M.J.; Sneeuw, N.; Bárdossy, A. A quantile function approach to discharge estimation from satellite altimetry (ENVISAT). Water Resour. Res. 2013, 49, 4174–4186. [Google Scholar] [CrossRef]
  15. Tourian, M.J.; Schwatke, C.; Sneeuw, N. River discharge estimation at daily resolution from satellite altimetry over an entire river basin. J. Hydrol. 2017, 546, 230–247. [Google Scholar] [CrossRef]
  16. Tourian, M.J.; Elmi, O.; Mohammadnejad, A.; Sneeuw, N. Estimating River Depth from SWOT-Type Observables Obtained by Satellite Altimetry and Imagery. Water 2017, 9, 753. [Google Scholar] [CrossRef] [Green Version]
  17. Abdalla, S.; Kolahchi, A.A.; Ablain, M.; Adusumilli, S.; Bhowmick, S.A.; Alou-Font, E.; Amarouche, L.; Andersen, O.B.; Antich, H.; Aouf, L.; et al. Altimetry for the future: Building on 25 years of progress. Adv. Space Res. 2021, 68, 319–363. [Google Scholar] [CrossRef]
  18. Revel, M.; Ikeshima, D.; Yamazaki, D.; Kanae, S. A Framework for Estimating Global-Scale River Discharge by Assimilating Satellite Altimetry. Water Resour. Res. 2021, 57. [Google Scholar] [CrossRef]
  19. Fekete, B.M.; Vörösmarty, C.J. The Current Status of Global River Discharge Monitoring and Potential New Technologies Complementing Traditional Discharge Measurements; Predict. Ungauged Basins PUB Kick-off (Proceedings PUB Kick-off Meet. held Bras. Novemb. 2002), IAHS Publ. no. 309. November 2007, pp. 129–136. Available online: https://www.researchgate.net/profile/Balazs-Fekete-5/publication/228607122_The_current_status_of_global_river_discharge_monitoring_and_potential_new_technologies_complementing_traditional_discharge_measurements/links/00b7d521cca70a8c3d000000/The-current-status-of-global-river-discharge-monitoring-and-potential-new-technologies-complementing-traditional-discharge-measurements.pdf (accessed on 20 July 2022).
  20. Lamine, B.; Ferreira, V.; Yang, Y.; Ndehedehe, C.; He, X. Estimation of the Niger River cross-section and discharge from remotely-sensed products. J. Hydrol. Reg. Stud. 2021, 36, 100862. [Google Scholar] [CrossRef]
  21. Bjerklie, D.M.; Birkett, C.M.; Jones, J.W.; Carabajal, C.; Rover, J.; Fulton, J.; Garambois, P.-A. Satellite remote sensing estimation of river discharge: Application to the Yukon River Alaska. J. Hydrol. 2018, 561, 1000–1018. [Google Scholar] [CrossRef] [Green Version]
  22. Biancamaria, S.; Lettenmaier, D.P.; Pavelsky, T.M. The SWOT Mission and Its Capabilities for Land Hydrology. Surv. Geophys. 2016, 37, 307–337. [Google Scholar] [CrossRef] [Green Version]
  23. Te Chow, V. Open Channel Hydraulics; McGraw-Hill: New York, NY, USA, 1959. [Google Scholar]
  24. Kim, D.; Yu, H.; Lee, H.; Beighley, E.; Durand, M.; Alsdorf, D.E.; Hwang, E. Ensemble learning regression for estimating river discharges using satellite altimetry data: Central Congo River as a Test-bed. Remote Sens. Environ. 2018, 221, 741–755. [Google Scholar] [CrossRef]
  25. Das, B.C. Modeling of most efficient channel form: A quantitative approach. Model. Earth Syst. Environ. 2015, 1, 1–9. [Google Scholar] [CrossRef] [Green Version]
  26. Bjerklie, D.M.; Fulton, J.W.; Dingman, S.L.; Canova, M.G.; Minear, J.T.; Moramarco, T. Fundamental Hydraulics of Cross Sections in Natural Rivers: Preliminary Analysis of a Large Data Set of Acoustic Doppler Flow Measurements. Water Resour. Res. 2020, 56. [Google Scholar] [CrossRef]
  27. Altenau, E.H.; Pavelsky, T.M.; Durand, M.T.; Yang, X.; Frasson, R.P.D.M.; Bendezu, L. The Surface Water and Ocean Topography (SWOT) Mission River Database (SWORD): A Global River Network for Satellite Data Products. Water Resour. Res. 2021, 57. [Google Scholar] [CrossRef]
  28. Zhang, X.; Jiang, L.; Kittel, C.M.M.; Yao, Z.; Nielsen, K.; Liu, Z.; Wang, R.; Liu, J.; Andersen, O.B.; Bauer-Gottwein, P. On the Performance of Sentinel-3 Altimetry Over New Reservoirs: Approaches to Determine Onboard A Priori Elevation. Geophys. Res. Lett. 2020, 47. [Google Scholar] [CrossRef]
  29. Allen, G.H.; Pavelsky, T.M. Global extent of rivers and streams. Science 2018, 361, 585–588. [Google Scholar] [CrossRef] [PubMed] [Green Version]
  30. Yamazaki, D.; Ikeshima, D.; Sosa, J.; Bates, P.D.; Allen, G.H.; Pavelsky, T.M. MERIT Hydro: A High-Resolution Global Hydrography Map Based on Latest Topography Dataset. Water Resour. Res. 2019, 55, 5053–5073. [Google Scholar] [CrossRef] [Green Version]
  31. Skofronick-Jackson, G.; Kirschbaum, D.; Petersen, W.; Huffman, G.; Kidd, C.; Stocker, E.; Kakar, R. The Global Precipitation Measurement (GPM) mission’s scientific achievements and societal contributions: Reviewing four years of advanced rain and snow observations. Q. J. R. Meteorol. Soc. 2018, 144, 27–48. [Google Scholar] [CrossRef] [Green Version]
  32. Huffman, J.; Stocker, G.J.; Bolvin, E.F.; Nelkin, D.T.; Tan, E.J. GPM IMERG Final Precipitation L3 1 month 0.1 degree × 0.1 degree V06,” Greenbelt, MD, Goddard Earth Sciences Data and Information Services Center (GES DISC). 2019. Available online: https://catalog.data.gov/dataset/gpm-imerg-final-precipitation-l3-1-month-0-1-degree-x-0-1-degree-v06-gpm-3imergm-at-ges-di (accessed on 20 July 2022).
  33. Macedo, H.E.; Beighley, R.E.; David, C.H.; Reager, J.T. Using GRACE in a streamflow recession to determine drainable water storage in the Mississippi River basin. Hydrol. Earth Syst. Sci. 2019, 23, 3269–3277. [Google Scholar] [CrossRef] [Green Version]
  34. Sun, A.Y.; Scanlon, B.R.; AghaKouchak, A.; Zhang, Z. Using GRACE Satellite Gravimetry for Assessing Large-Scale Hydrologic Extremes. Remote Sens. 2017, 9, 1287. [Google Scholar] [CrossRef] [Green Version]
  35. Knoben, W.J.M.; Freer, J.E.; Woods, R.A. Technical note: Inherent benchmark or not? Comparing Nash–Sutcliffe and Kling–Gupta efficiency scores. Hydrol. Earth Syst. Sci. 2019, 23, 4323–4331. [Google Scholar] [CrossRef] [Green Version]
  36. Nickles, C.; Beighley, E.; Zhao, Y.; Durand, M.; David, C.; Lee, H. How Does the Unique Space-Time Sampling of the SWOT Mission Influence River Discharge Series Characteristics? Geophys. Res. Lett. 2019, 46, 8154–8161. [Google Scholar] [CrossRef]
  37. Maritan, A.; Rinaldo, A.; Rigon, R.; Giacometti, A.; Rodríguez-Iturbe, I. Scaling laws for river networks. Phys. Rev. E 1996, 53, 1510–1515. [Google Scholar] [CrossRef] [Green Version]
  38. Tavakoly, A.A.; Snow, A.D.; David, C.H.; Follum, M.L.; Maidment, D.R.; Yang, Z.-L. Continental-Scale River Flow Modeling of the Mississippi River Basin Using High-Resolution NHDPlus Dataset. JAWRA J. Am. Water Resour. Assoc. 2016, 53, 258–279. [Google Scholar] [CrossRef]
  39. Grannemann, N.G.; Sharp, J.M. Alluvial hydrogeology of the lower Missouri River valley. J. Hydrol. 1979, 40, 85–99. [Google Scholar] [CrossRef]
  40. Lin, P.; Pan, M.; Beck, H.E.; Yang, Y.; Yamazaki, D.; Frasson, R.; David, C.H.; Durand, M.; Pavelsky, T.M.; Allen, G.H.; et al. Global Reconstruction of Naturalized River Flows at 2.94 Million Reaches. Water Resour. Res. 2019, 55, 6499–6516. [Google Scholar] [CrossRef] [Green Version]
  41. Harrigan, S.; Zsoter, E.; Alfieri, L.; Prudhomme, C.; Salamon, P.; Wetterhall, F.; Barnard, C.; Hannah Cloke, H.; Pappenberger, F. GloFAS-ERA5 operational global river discharge reanalysis 1979–Present. Earth Syst. Sci. Data 2020, 12, 2043–2060. [Google Scholar] [CrossRef]
  42. Hydroweb Product User Manual: Timeseries Specified by LEGOS and Computed by CLS on Behalf of CNES. 2021. Available online: https://www.theia-land.fr/wp-content/uploads/2021/06/Handbook_Hydroweb-V2.1.pdf (accessed on 20 July 2022).
  43. Bjerklie, D.M.; Dingman, S.L.; Vorosmarty, C.J.; Bolster, C.H.; Congalton, R.G. Evaluating the potential for measuring river discharge from space. J. Hydrol. 2003, 278, 17–38. [Google Scholar] [CrossRef]
  44. Simeonov, J.A.; Holland, K.T.; Anderson, S.P. River Discharge and Bathymetry Estimation from Inversion of Surface Currents and Water Surface Elevation Observations. J. Atmospheric Ocean. Technol. 2019, 36, 69–86. [Google Scholar] [CrossRef]
  45. Larnier, K.; Monnier, J.; Garambois, P.-A.; Verley, J. River discharge and bathymetry estimation from SWOT altimetry measurements. Inverse Probl. Sci. Eng. 2020, 29, 759–789. [Google Scholar] [CrossRef]
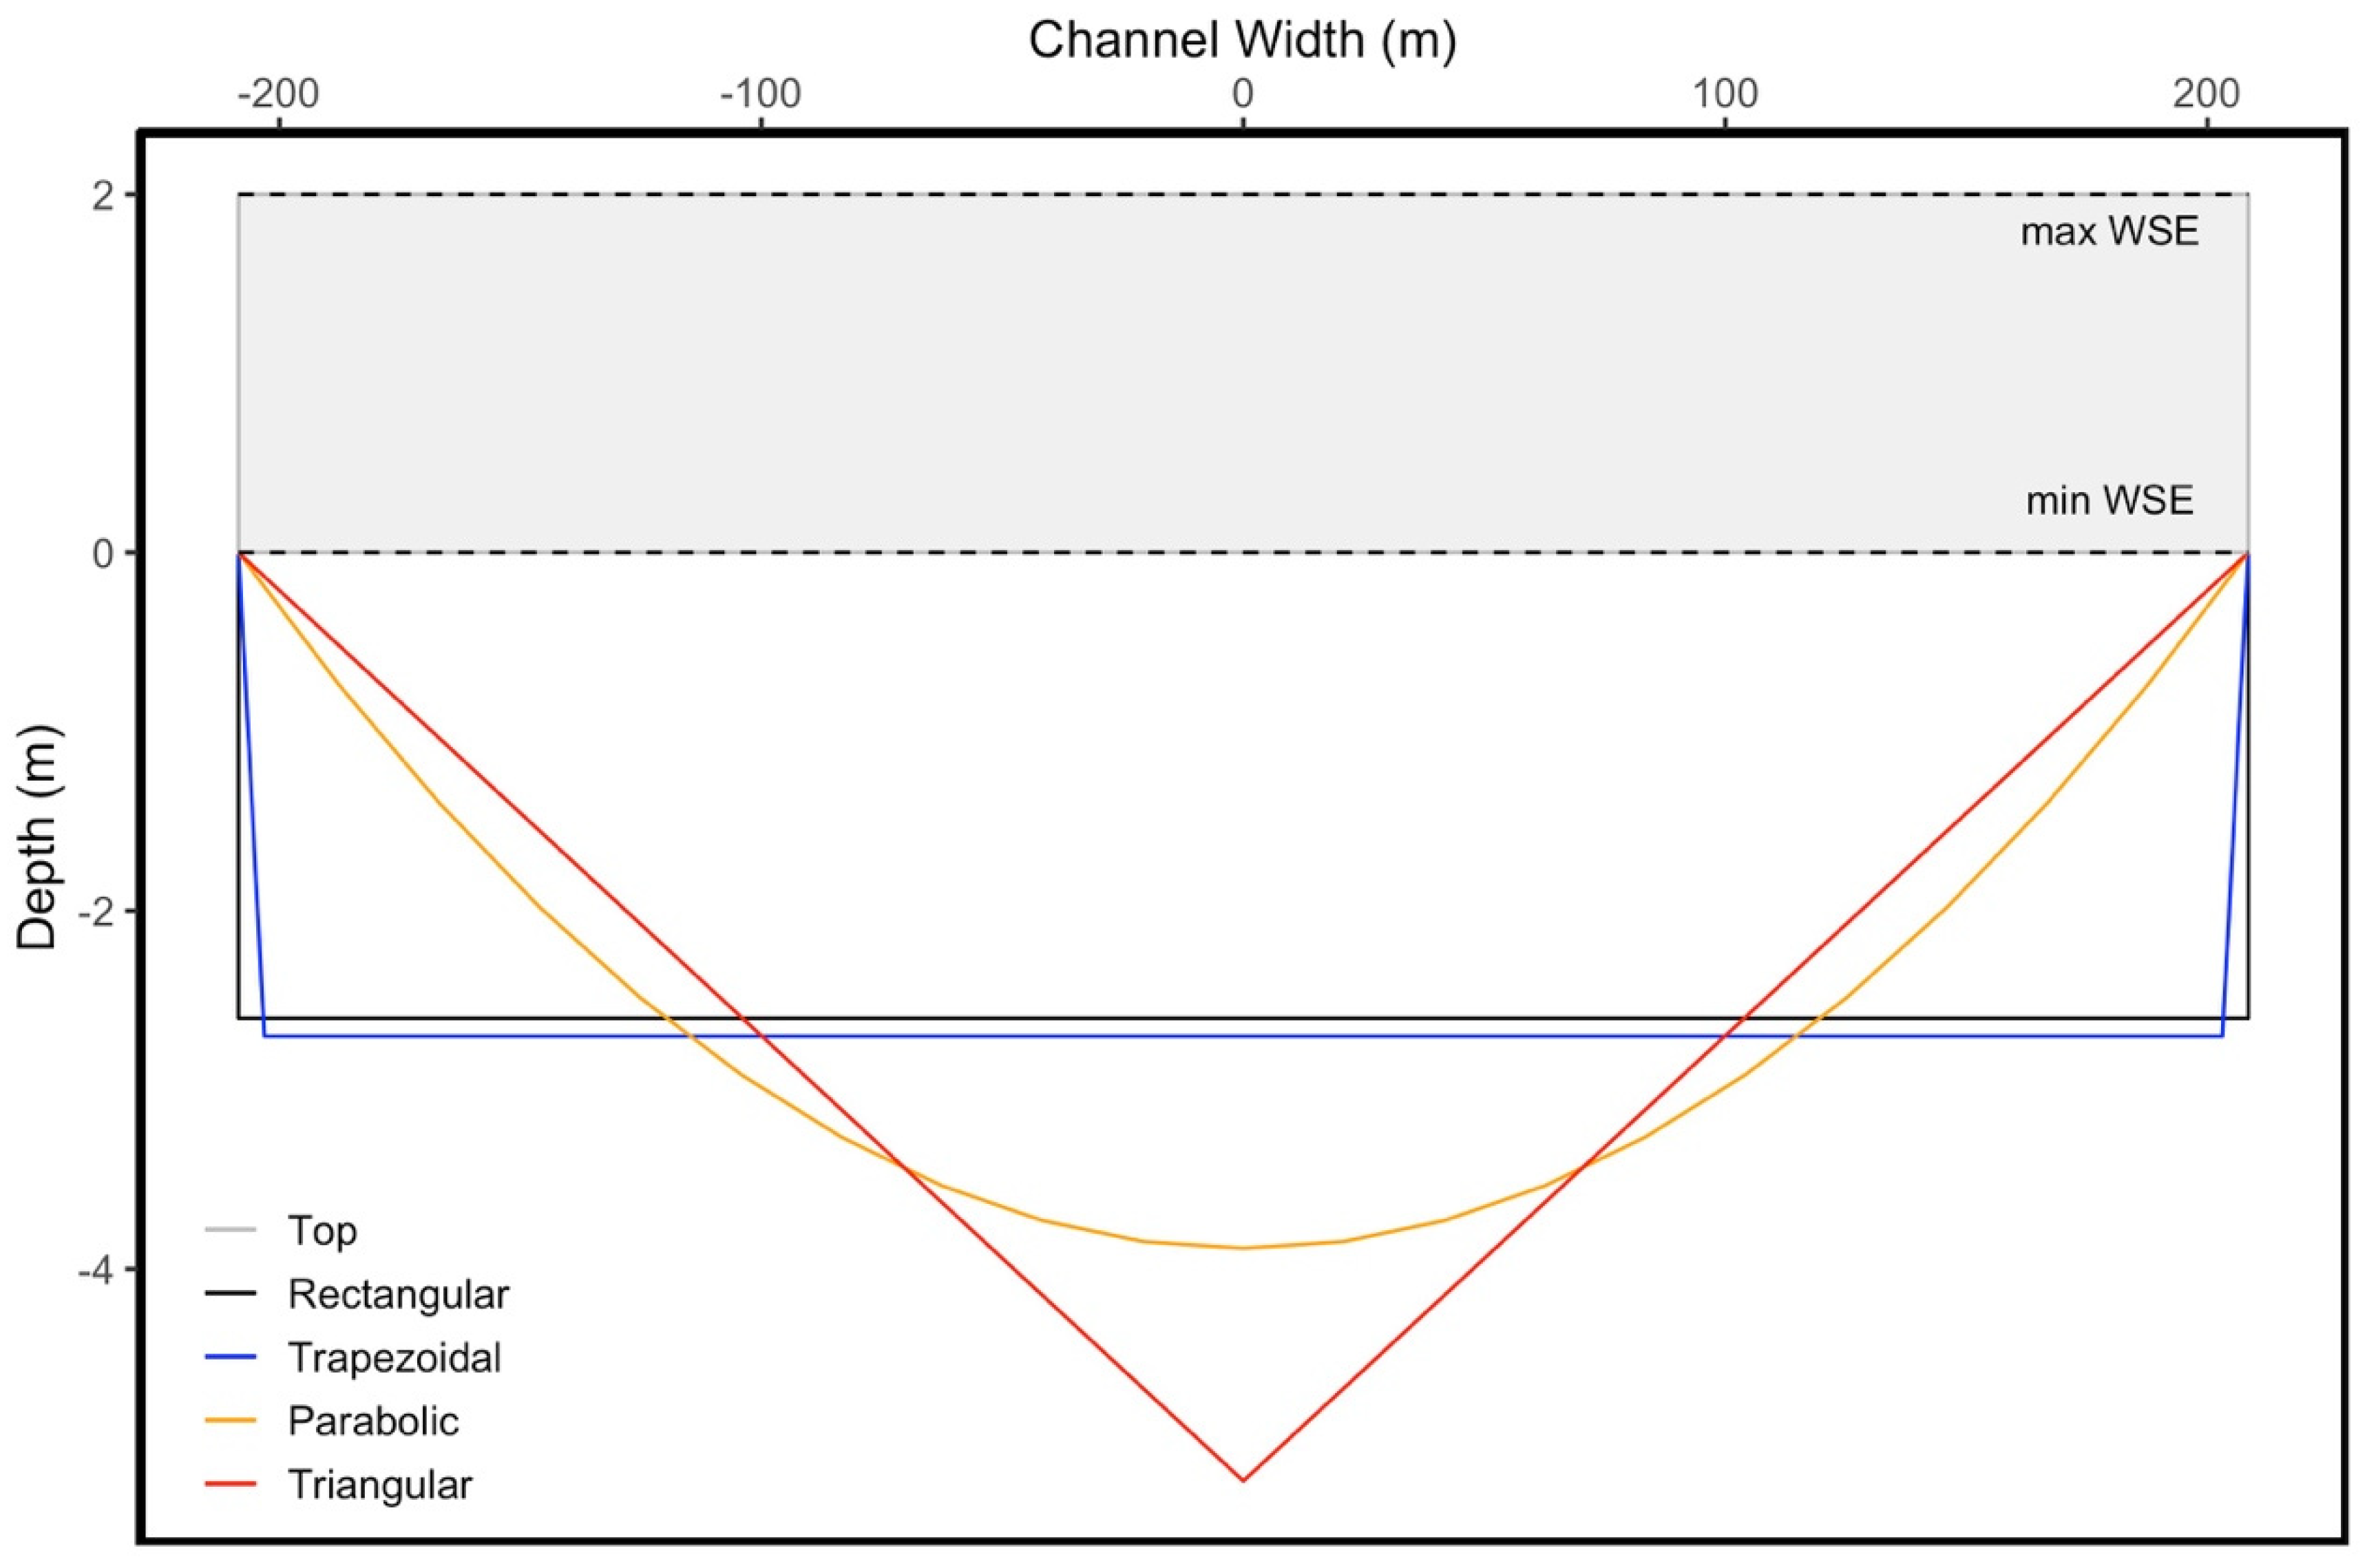
Figure 1. An example of the differences in depth with varying channel forms (rectangular, trapezoidal, parabolic, and triangular). For this example, the area of all shapes remains the same, while depth varies. This variation in shape and depth represents the flow that is not observed by the satellite (Q Missing). Note, the trapezoidal channel form with a 1:1 side slope is not displayed in this figure despite being tested. Figure is not drawn to scale; widths are much larger than depths.
Remotesensing 14 03541 g001
Figure 2. Study region with all of the available virtual stations (VS) from Hydroweb. VSs that were paired to nearby USGS gauges are shown in red (n = 230). VSs that could not be paired with gauges, and thus were not used in this study, are shown in grey (n = 269). Sentinel-3A satellite tracks and SWORD river reaches are also included.
Remotesensing 14 03541 g002
Figure 3. Comparison of the estimated discharge using the optimization of all parameters and observed USGS discharge measurements on the day of the (A) minimum, (B) median, and (C) maximum. All sites (n = 230) are shown in this figure.
Remotesensing 14 03541 g003
Figure 4. Distribution of the (A) log of the residuals and (B) residuals for the predicted flow of the relative flow conditions (minimum, median, and maximum).
Remotesensing 14 03541 g004
Figure 5. Relationship between the (A) previous two months of precipitation and the estimated Q Missing (minimum discharge value) for each paired VS where KGE > 0.32 and (B) annual range in TWSA (maximum–minimum) values and estimated Q Missing where KGE > 0.32. The relationship between Q Missing and range in TWSA exhibits a better correlation (R2 = 0.53) than the relationship between Q Missing and the previous 2 months of precipitation (R2 = 0.47). VS #2086 and VS #2036 are used as examples of the potential for bias (e.g., either by the fraction of precipitation being converted to runoff or the fraction of water moving through the system annually) and are highlighted by the red and blue circles, respectively, in each panel. The locations of these points with respect to the derived relationships are discussed in Section 4.1.
Remotesensing 14 03541 g005
Figure 6. Comparison of optimized to simplified methods of estimating discharge for the site locations. The dashed lines represent the reasonable (−0.41) and good (0.32) values for KGE.
Remotesensing 14 03541 g006
Figure 7. Estimated river discharge using different methods compared to USGS gauged data for (A) USGS Gauge 06910450 and VS #2086. Optimized values for n and bottom elevation return maximum KGE for this pair. Error bars display the uncertainty given for each altimetric measurement. (B) USGS Gauge 03360500 and VS #2036. (Recall “Opt. 2” describes the optimization of the shape and h0 parameters, while holding the surface roughness value constant at n = 0.025.).
Remotesensing 14 03541 g007
Figure 8. Map of the study sites, colored by the dominating component of KGE. Discharge was calculated using depth below values derived from precipitation. Sites with KGE < −0.41 are highlighted with a pink outline.
Remotesensing 14 03541 g008
Figure 9. Cumulative distribution function (CDF) of the performance metrics across the 230 stations (using the precipitation-derived depth method), including (A) the correlation coefficient, (B) the bias ratio, and (C) variance. The red dashed line notes the optimal value for each component (where all values would result in a KGE of 1).
Remotesensing 14 03541 g009
Table 1. Summary of methods used, with the optimized and constant parameters listed.
MethodOptimized ParametersConstant Parameters
Optimized Allshape, n, h0-
Opt. 1n, h0shape
Opt. 2shape, h0n
Opt. 3h0shape, n
Derived h0 (GPM precip.)h0shape, n
Derived h0 (GRACE TWSA)h0shape, n
Table 2. Summary of the percentage (%) of sites (out of 230) which reported reasonable (KGE > −0.41) and good (KGE > 0.32) error metrics.
MethodKGE > −0.41KGE > 0.32
Optimized All8771
Opt. 18771
Opt. 27563
Opt. 37360
Derived h0 (GPM precip.)6647
Derived h0 (GRACE TWSA)6542
Publisher’s Note: MDPI stays neutral with regard to jurisdictional claims in published maps and institutional affiliations.