Article

The Influence of Image Properties on High-Detail SfM Photogrammetric Surveys of Complex Geometric Landforms: The Application of a Consumer-Grade UAV Camera in a Rock Glacier Survey

by
Adrián Martínez-Fernández
1,2,*,
Enrique Serrano
2,3,
Alfonso Pisabarro
2,4,
Manuel Sánchez-Fernández
5,
José Juan de Sanjosé
2,5,
Manuel Gómez-Lende
2,
Gizéh Rangel-de Lázaro
6 and
Alfonso Benito-Calvo
1
1
Centro Nacional de Investigación sobre la Evolución Humana (CENIEH), 09002 Burgos, Spain
2
Research Group Natural Heritage and Applied Geography (PANGEA), Universidad de Valladolid, 47011 Valladolid, Spain
3
Department of Geography, Universidad de Valladolid, 47011 Valladolid, Spain
4
Department of Geography and Geology, Universidad de León, 24071 León, Spain
5
Research Group Engineering, Territory and Heritage (NEXUS), Universidad de Extremadura, 10003 Cáceres, Spain
6
Department of Earth Sciences, Natural History Museum, London SW7 5BD, UK
*
Author to whom correspondence should be addressed.
Remote Sens. 2022, 14(15), 3528; https://doi.org/10.3390/rs14153528
Submission received: 10 June 2022 / Revised: 19 July 2022 / Accepted: 21 July 2022 / Published: 23 July 2022
(This article belongs to the Special Issue UAV Photogrammetry for Environmental Monitoring)

Abstract

:
The detailed description of processing workflows in Structure from Motion (SfM) surveys using unmanned aerial vehicles (UAVs) is not common in geomorphological research. One of the aspects frequently overlooked in photogrammetric reconstruction is image characteristics. In this context, the present study aims to determine whether the format or properties (e.g., exposure, sharpening, lens corrections) of the images used in the SfM process can affect high-detail surveys of complex geometric landforms such as rock glaciers. For this purpose, images generated (DNG and JPEG) and derived (TIFF) from low-cost UAV systems widely used by the scientific community are applied. The case study is carried out through a comprehensive flight plan with ground control and differences among surveys are assessed visually and geometrically. Thus, geometric evaluation is based on 2.5D and 3D perspectives and a ground-based LiDAR benchmark. The results show that the lens profiles applied by some low-cost UAV cameras to the images can significantly alter the geometry among photo-reconstructions, to the extent that they can influence monitoring activities with variations of around ±5 cm in areas with close control and over ±20 cm (10 times the ground sample distance) on surfaces outside the ground control surroundings. The terrestrial position of the laser scanner measurements and the scene changing topography results in uneven surface sampling, which makes it challenging to determine which set of images best fit the LiDAR benchmark. Other effects of the image properties are found in minor variations scattered throughout the survey or modifications to the RGB values of the point clouds or orthomosaics, with no critical impact on geomorphological studies.

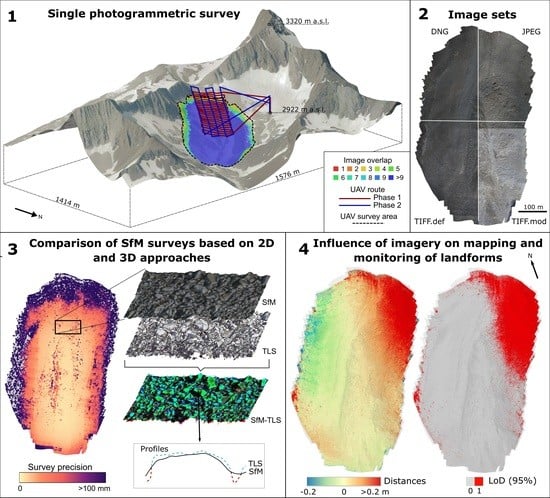
Graphical Abstract

1. Introduction

Recent years have witnessed a growth in studies showing the advantages of combining images from unmanned aerial vehicles (UAVs) and photogrammetric software based on Structure from Motion (SfM) for a detailed topographic representation of landforms. Geoarchaeology [1], environmental geography [2], coastal geomorphology [3], volcanology [4], and glaciar or periglaciar geomorphology [5,6,7] are some of the many fields of study that benefit from these systems. Flexibility and ease of use, added to the good results offered by consumer-grade equipment, are reasons for its application. The acquisition of high-quality and high-resolution reconstructions is simplified, as is the mapping and analysis of surface change from 3D (point clouds and meshes), 2.5D (DEMs), and 2D (orthoimages) perspectives.
It is precisely the 2.5D comparisons based on the DEM of difference (DoD) that are conventional in geoscience studies to analyse spatial variability. However, this approach does not allow a three-dimensional analysis of fully 3D datasets and presents several drawbacks associated with creating DEMs, even more so in steep and complex topographies [8].
Landforms such as rock glaciers are often an example of this challenging topography. Usually located in the mid and high mountains, active rock glaciers are formed by heterometric rock debris and interstitial ice. The deformation of frozen bodies causes creep downslope, affecting slope stability. Variations in periglacial landforms such as rock glaciers indicate rapid global and regional climate change, and their analysis contributes to the understanding of the global climate [9,10,11,12].
Consequently, cryosphere-related studies in general, and of rock glaciers in particular, have benefited from the rise in the use of UAVs and SfM for mapping and monitoring [13]. These studies can present different designs and executions, processing workflows, or quality reports of the photogrammetric surveys. On the one hand, this variety may be due to the extent and complexity of the geomorphological environments [14] and the equipment and software available for the photogrammetric reconstructions [15]. On the other, it may be down to the lack of photogrammetric considerations (i.e., image network geometry and tie-point quality), the absence of detailed information to allow reproducibility, and insufficient analysis of the quality of results [16].
Regarding SfM processing software, the usual lack of information reported on computing processes has hindered the homogenisation of photogrammetric processing workflows. In addition to the black box that some SfM software can be limited to [17,18], undefined processing routines and parameters or default values are also used. This is possibly due to the often user-friendly SfM software, which does not always encourage consideration of the processing parameters involved. In fact, the ease of use and the good results of SfM software such as Agisoft Metashape has led to its application in considerable studies related to geomorphology and cryosphere, to the extent that it is now the most widely used SfM software in these environments [15]. Despite research that has explored the effects that different UAV survey designs and processing parameters can have on SfM reconstructions [19,20], comprehensive analyses of SfM processing workflows used in geomorphological environments are rare. Moreover, SfM geoscience literature does not usually specify all the elements or parameters used in the photo-reconstructions, which is crucial for accurate and reproducible results [19].
One of the often-overlooked essential elements of the photogrammetric process is image properties. In this context, different image formats or processing levels can be used. Raw image formats such as DNG preserve all the information captured by the camera sensor, whereas image formats commonly used in SfM reconstructions, such as JPEG, are generally processed by the camera. Such processing leads to uncontrolled compression and modification of raw image characteristics (e.g., sharpening, noise, exposure). TIFF images can be generated from the controlled processing of raw images in order to prevent the loss of information or the alteration of photographic adjustments. It is a versatile image format that allows lossless compression and is widely recognised by the graphic industry. This last aspect differentiates the TIFF format from raw images, for which each manufacturer usually offers a proprietary format. UAV consumer-grade cameras have typically generated JPEG-format images which, together with the small file size compared to other image formats, has popularised its application in photogrammetry. Nevertheless, it is becoming increasingly common for low-cost UAV cameras to output raw images for post-processing. Like the raw image, the TIFF-format image has a larger size than JPEG and it is used in SfM projects for which high quality is required. The influence of the image format or compression level in consumer-grade UAV photogrammetric reconstruction can affect the final models [21]; however, to our knowledge, its impact has not been thoroughly explored in geosciences.
The present study aims to evaluate the influence of the image and its properties on the UAV photogrammetric reconstruction of complex geometric landforms in high mountain environments for mapping and change detection activities. The study uses raw images via the open DNG format, as well as camera pre-processed JPEG images and post-processed TIFF images with different photographic adjustments. Due to the extensive processing that can be applied to the photographs, the choice of image sets was limited to those provided directly by the UAV camera and two high-quality image sets derived from the raw images. All photographs were obtained or derived from a single photogrammetric survey with ground control over a rock glacier. This scenario is limited given its survey design and execution which are common in high mountain environments tied to the cryosphere. Image capture is executed with low-cost UAVs and low-cost flight planning software due to its increasing usage in research [13]. This study similarly limits the SfM reconstruction process to the Agisoft Metashape software following the new photogrammetric experiences in the scientific community [15]. In this sense, the processing workflow and parameters used for the high-resolution photogrammetric reconstructions are specified in detail. Differences between photo-based surveys are analysed in a 2.5D and fully 3D context from fixed and spatially variable precisions that will allow the confidence-bounded quantification of topographic change. From the 3D perspective, precisions and comparisons with geometric attributes of the scene are contrasted in order to identify relationships between deformations and terrain features. Moreover, reliable systems that have proven helpful for monitoring slight variations in rock glaciers, such as ground-based LiDAR [22], are used to analyse the accuracy of the SfM surveys. Finally, from the results obtained, an overview of the impacts that consumer-grade UAV camera imagery can have on monitoring geomorphological processes is given.

2. Study Site

The study focuses on the La Paúl rock glacier in the NW of the Posets peak (3375 m a.s.l.) in the Posets massif, Spanish Pyrenees (Lat. 42°39′40″N/Lon. 0°26′34″E) (Figure 1). Posets massif is a mountain permafrost environment where one glacier (La Paúl) and two rock glaciers (Posets and La Paúl) are located [23,24]. Studies on rock glacier displacement have been made by means of the global navigation satellite system real-time kinematic (GNSS-RTK) which reveals centimetric displacements and the existence of frozen bodies and buried ice masses [25]. The La Paúl rock glacier is a debris rock glacier formed in front of the site where the Posets glacier once was. The rock glacier front is at about 2800 m a.s.l., with a 400 m tongue and slope of more than 20%. It is dated as pre-Little Ice Age (LIA) because the glacial advances during the LIA period deformed its north-west side, although the flow deformation features, mainly arches, are both prior and posterior to the erosion by the glacier. The ground thermal regime, the basal temperatures of snow (BTS measurements), and geoelectrical sounding show the presence of a frozen body [12,23,26].
This is a high mountain environment of high-relief topography in which the application of UAV systems in glacial and periglacial studies is not usual [13]. Nevertheless, permafrost behaviour in the area has been studied for more than 10 years [12] and the La Paúl rock glacier velocities monitored for more than five years [27].

3. Materials and Methods

3.1. Data Collection and Benchmark Generation

Data collection was carried out using the UAV multirotor DJI Mavic 2 Pro, flight planning and control software UgCS PRO (v.3.2; SPH Engineering; Riga, Latvia), and ground control targets. These are systems widely used in cryosphere or environmental monitoring [14,15]. For a better adjustment of the waypoints followed by the UAV to the topography during flights, a 5 m resolution DEM derived from 2010 LiDAR flights over the area [28] was introduced to the flight design. Data collection work was affected by an environment of difficult access and mobility, limited hours of daylight, and legal restrictions concerning UAV flights (flying altitude up to 120 m above ground level and distance below 500 m to the controller). The weight and volume of the equipment were reduced accordingly while maintaining the principles of consumer-grade systems and widespread flight planning strategies.
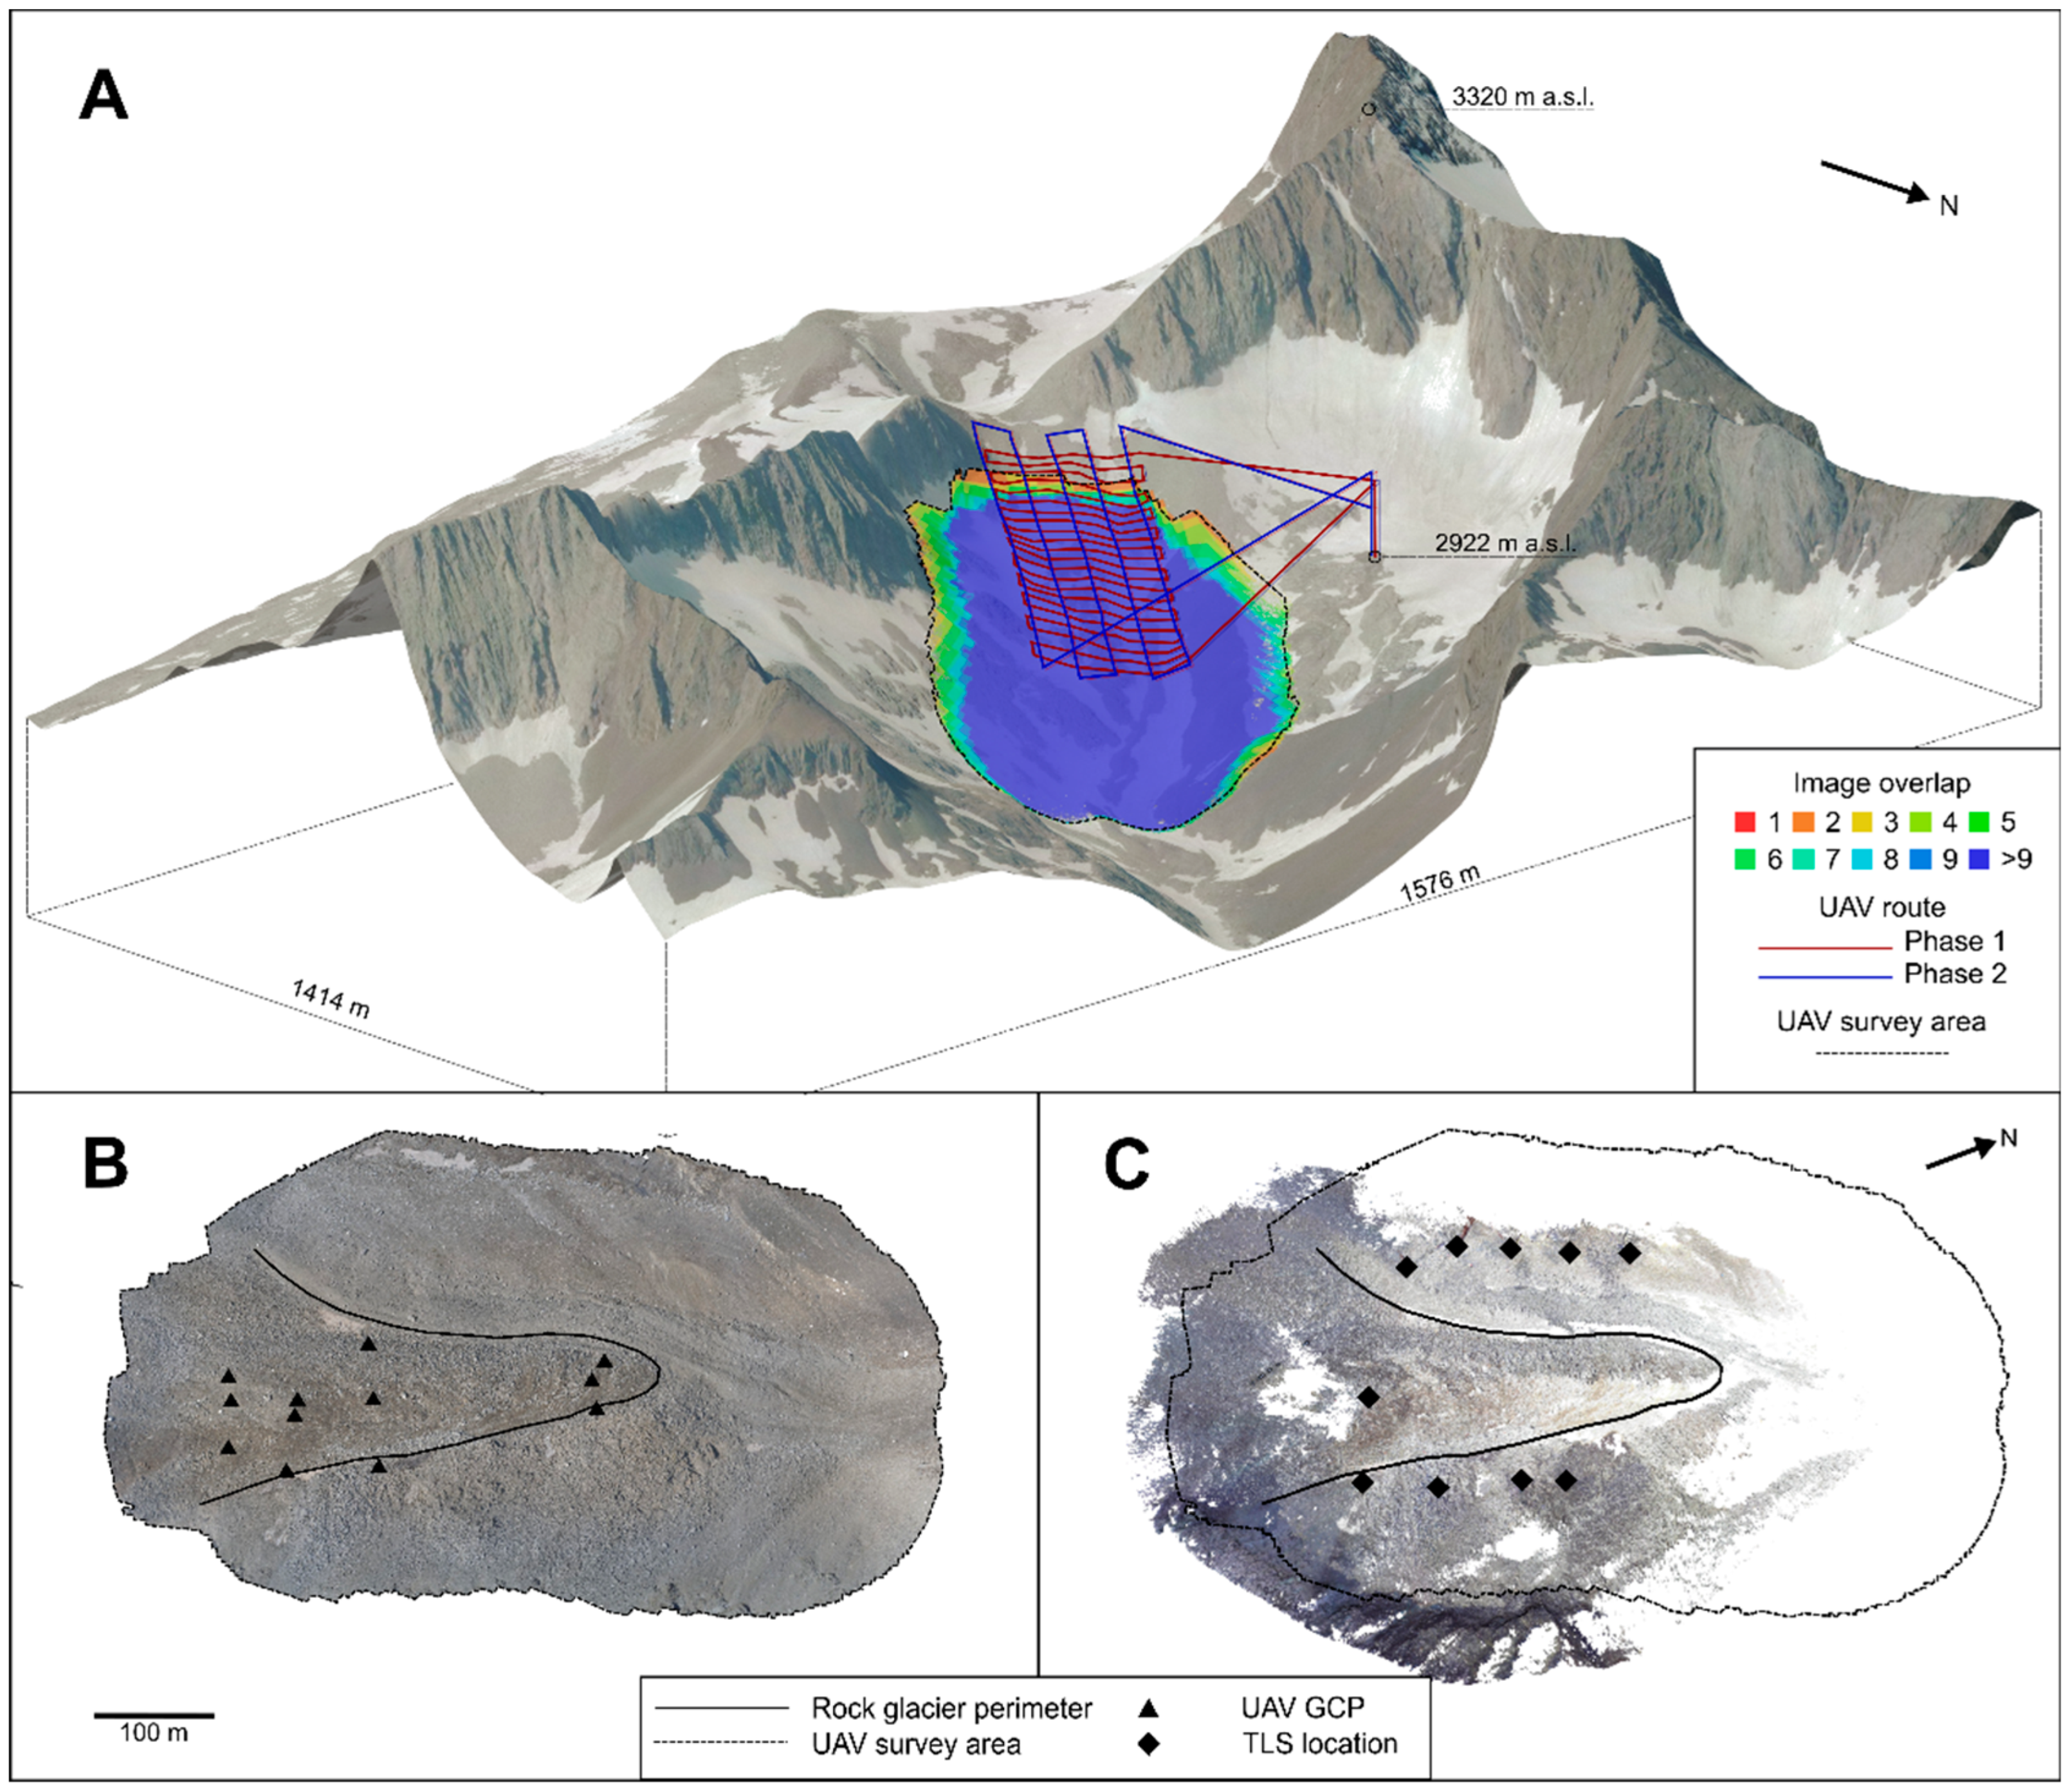
To establish a robust image network, flight plans were divided into two phases (Table 1; Figure 2). The first phase consisted of nadir images with flight lines perpendicular to the slope direction of the rock glacier (i.e., strips transverse to the tongue). A constant flight height of almost 80 m above ground level was established, providing a ground sample distance (GSD) of 20 mm/pixel. Forward and side overlap between images was set at 80%. This resulted in an approximate acquisition every 15 m over 6.8 ha to collect a total of 303 images. The second phase involved capturing oblique images with a camera tilt of 25° to the vertical. Flight lines were perpendicular to the first phase (i.e., longitudinal strips along the rock glacier tongue), further enhancing the geometry of the network by combining images with portrait and landscape orientations [20]. In this phase, a flight of 88 m above ground level with 70% frontal and 65% lateral overlap were planned. In total, 125 images were captured with an acquisition every 25 m. Oblique photographs allowed the strengthening of the image network geometry, which improved the quality of the photogrammetric survey. Considerations related to systematic topographic error, such as the determination of the self-calibration camera parameter, typical of SfM software, are improved with the application of oblique flights, even with sparse ground control points (GCPs) [29,30]. Images were obtained in DNG and JPEG formats, the latter automatically processed by the Hasselblad L1D-20c camera embedded in the UAV. The camera parameters remained constant during the phases (Table 1) to ensure minimum motion blur [31].
Photogrammetric flight control consisted of 12 GCPs distributed over the rock glacier (Figure 2B). The GCPs were square fabric targets with high contrast (red and yellow colours) and a well-defined centre. Due to physical (accessibility) and time constraints (limited working hours), the GCPs were not optimally distributed over the survey area [32,33]. The georeferencing of targets to a global reference system was performed using differential GNSS using RTK techniques. The GNSS reference station and rover measurements were post-processed using the National Geodetic Network of GNSS Reference Stations [34] for an overall standard deviation (SD) of ±10 mm in planimetry and ±17 mm in altimetry in the location of the targets.
The LiDAR benchmark was acquired through the terrestrial laser scanner (TLS) Faro Focus3D X330. A total of 10 scan positions were performed around the tongue of the rock glacier in order to record its shape (Figure 2C). Scans were registered and georeferenced using Faro Scene v.2019 software. This registration was performed using the cloud-to-cloud method for an average scan point tension of 17 mm. With the scans registered as a single block, georeferencing was carried out using 24 targets of identical characteristics to those of the photogrammetric flight. These targets were placed so that a minimum of three were identified in each scan, ensuring that a target was always visible from two consecutive scan positions. As for the flights, the coordinates of the control points were acquired through differential GNSS for a SD of ±12 mm in planimetry and ±19 mm in altimetry. The mean target tensions of a georeferenced block of scans were 44 mm.

3.2. Image Processing

In order to analyse the differences between SfM reconstructions using raw imagery (DNG format) and derived imagery (JPEG and TIFF formats), four sets of images were incorporated into the photogrammetric workflow. Unlike JPEG images, raw images are not compressed or pre-processed by the UAV camera when shooting. They are images that have not undergone image corrections so that all the information recorded by the camera sensor is preserved. As part of the default settings, some UAV on-board cameras, such as the DJI Mavic 2 Pro, apply a range of lens distortion corrections to images through built-in lens profiles. These geometric adjustments can lead the SfM software to erroneous physical-based lens distortion models and thus to more inaccurate photo-reconstructions [35]. Furthermore, JPEG images often undergo modifications, such as dynamic range, sharpening, contrast, or saturation, as part of the raw-to-JPEG conversion.
Agisoft Metashape (v.1.5.5; Agisoft LLC; St. Petersburg, Russia) allows the processing of DNG-formatted raw images; however, the software does not read all image metadata (XMP/EXIF). For this reason, DNG image parameter modifications that are predictably favourable (e.g., exposure, chromatic aberration, highlight and shadow adjustments, or vignetting) for the reconstruction or appearance of the model, as well as unfavourable (e.g., sharpening, noise filter adjustments or lens correction) for the photogrammetric process [36], are not applied. Therefore, the DNG images were converted to the lossless TIFF format. The conversion was based on a controlled processing in which aspects that could significantly affect the lens distortion models were eliminated. Two TIFF image sets were generated with different parameters and without the geometric adjustments applied by default to the JPEG images. In a first TIFF set, the images were acquired from the default settings of the photographic editing program (default TIFF; hereinafter TIFF.def). That is, chromatic aberrations were corrected and sharpening and noise reduction filters were applied (luminance, detail, and colour) to the DNG image. In a second set (modified TIFF; hereinafter TIFF.mod), sharpness and noise filter adjustments were overridden; chromatic aberration was corrected; and white balance, exposure, shadows, and vignetting were modified. Because the Hasselblad L1D-20c camera built-in lens profile is applied by default to images, the choice of the photo editing software was based on the capacity of the software to mitigate or remove the effects of the profile. Although there are open options [37], Capture One software (v.20; Phase One; Frederiksberg, Denmark) was chosen to override the effects of the embedded lens profile in DNG images and produce the TIFF images (lens geometric adjustments in the JPEG files are irreversible). Well-known programs such as Adobe Photoshop Lightroom Classic (v.8.4 CC2019; Adobe Systems; San Jose, CA, USA) apply the built-in profile directly to the images, leaving no possibility of correcting the distortion associated with the lens profile.

3.3. Processing of SfM Surveys

There are numerous recommendations and workflows for photogrammetric processing using Metashape software (e.g., [19,38]); however, in this study, the developer’s recommendations [39] (Table 2) were followed for the generation of a dense point cloud (i.e., final 3D survey) for each of the four image sets (DNG, JPEG, TIFF.def, and TIFF.mod).
The Agisoft workflow used as a reference does not provide specific values for all steps, so some were defined for this study. Among them is the elimination of approximately 5% of the tie points (i.e., feature point matches across images) with the highest reprojection error (step 7 in Table 2). Other steps have been modified to improve the quality of the surveys, such as defining X, Y, and Z accuracy values for each GCP according to GNSS-RTK measurements (step 6 in Table 2); avoiding the use of the UAV GNSS coordinates associated with the images because of their low accuracy (step 9 in Table 2), or selecting a higher quality for the generation of the dense point cloud (step 10 in Table 2).
The GCPs defined in the DNG project were exported and used in the TIFF projects to ensure that control was set to the same pixels in Metashape. Due to size differences (Table 1), the GCPs were manually redefined in the JPEG images. Root-mean-square error (RMSE) differences after the bundle adjustments were low (Table 3). Differences in the re-projection RMSE of the markers (i.e., Error(pix) in the markers section of Metashape) were 0.008 pix between DNG-TIFF projects and 0.078 pix between DNG-JPEG projects. Moreover, the marker locations RMSE for the XYZ coordinates (i.e., Error(m) in the markers section) were less than 4 mm between projects. The number of projections of each marker (i.e., number of images where the marker appears) was the same in the formats with identical dimensions (DNG and TIFF files), and on average two fewer in the JPEG project due to lens corrections.

3.4. Comparison Methods

The 2.5D comparisons from the DEM of difference (DoD) were carried out by subtracting 55 mm grid resolution DEMs (the Metashape’s default DEM resolution in the projects). The DEM generation from the dense point clouds and the DoD calculation were performed in the photogrammetric software. In order to determine whether the calculated differences were significant, a 95% confidence level (LoD95%) was assigned to them. To establish the LoD95% of the differences across the survey, Equation (1) was applied. Thus, the Z error of the GCPs in the Metashape software after the bundle adjustment (Table 3) was used as the vertical standard deviation for the surveys. The calculation of the DoDs using a survey (LoD95% overall) was performed with QGIS v.3.8.0 [40].
L O D 95 % = t ( σ Z 1 2 + σ Z 1 2 )
where t = 1.96 and σ Z 1 and σ Z 2 are vertical standard deviations of the Z coordinate in the DEMs.
The 3D comparisons were performed using the multiscale model to model cloud comparison with precision maps method (M3C2-PM; [8,20]). The M3C2 approach is especially suited to computing signed and robust distances between TLS point clouds with an associated spatially variable 95% confidence level (LoD95%; [41,42]). This algorithm can handle 3D differences in complex topography by measuring distances along the normal direction of the local surface. The combination of M3C2 and PM enables a complete 3D change detection approach to compare 3D point clouds from SfM photo reconstructions. This is because PM is a suitable tool for propagating spatially variable precision in SfM surveys, according to considerations of the photogrammetric and georeferencing process. M3C2-PM is partially implemented in CloudCompare v.2.11 [43] within the M3C2 plug-in, requiring a Python script in Agisoft Metashape and the SfM_georef software [20] to generate and analyse the precision maps, respectively. The generation of precision maps comprises a Monte Carlo processing to derive the tie points’ precision and covariances, among other parameters. For the M3C2-PM comparisons, precisions were derived after 1000 iterations for each case (about 20 h of processing time per survey with i7-8700 CPU and 32 GB RAM). Differences between Monte Carlo means and initial error-free values were of the order of 0.1 mm. The results of the iterative process were analysed through SfM_georef and the tie-point interpolation of coordinate precision and covariances to the dense cloud through CloudCompare. The interpolation process was performed in a fully 3D environment through a median-based interpolation within a radius of 2.5 m (enough to interpolate values to almost the entire survey). Within the Cloudcompare M3C2 plug-in, the multiscale calculation mode was used to determine normals on a 50 mm subsampled core point cloud. The normals’ computation diameter values of 0.05 m to 0.3 m (with a 0.05 m step) and 0.30 m to 1.2 m (with a 0.30 m step) were used for the point clouds derived from the DNG images and the TLS benchmark, respectively. These dimensions ensured the correct generation of normals in the surveys, as they are 20 to 25 times the roughness values of the point clouds. A registration error was disabled between SfM comparisons, as the precision maps comprise the photogrammetric and georeferencing precisions. In addition, the mean target tension of the TLS survey was used as uncertainty for the instrument position. Thus, a registration error value of 44 mm was applied in the comparisons with the TLS benchmark. As the TLS point cloud has no associated precision maps, a conservative value of 17 mm (i.e., mean scan point tensions) was set to represent the within-survey precision in each axis.
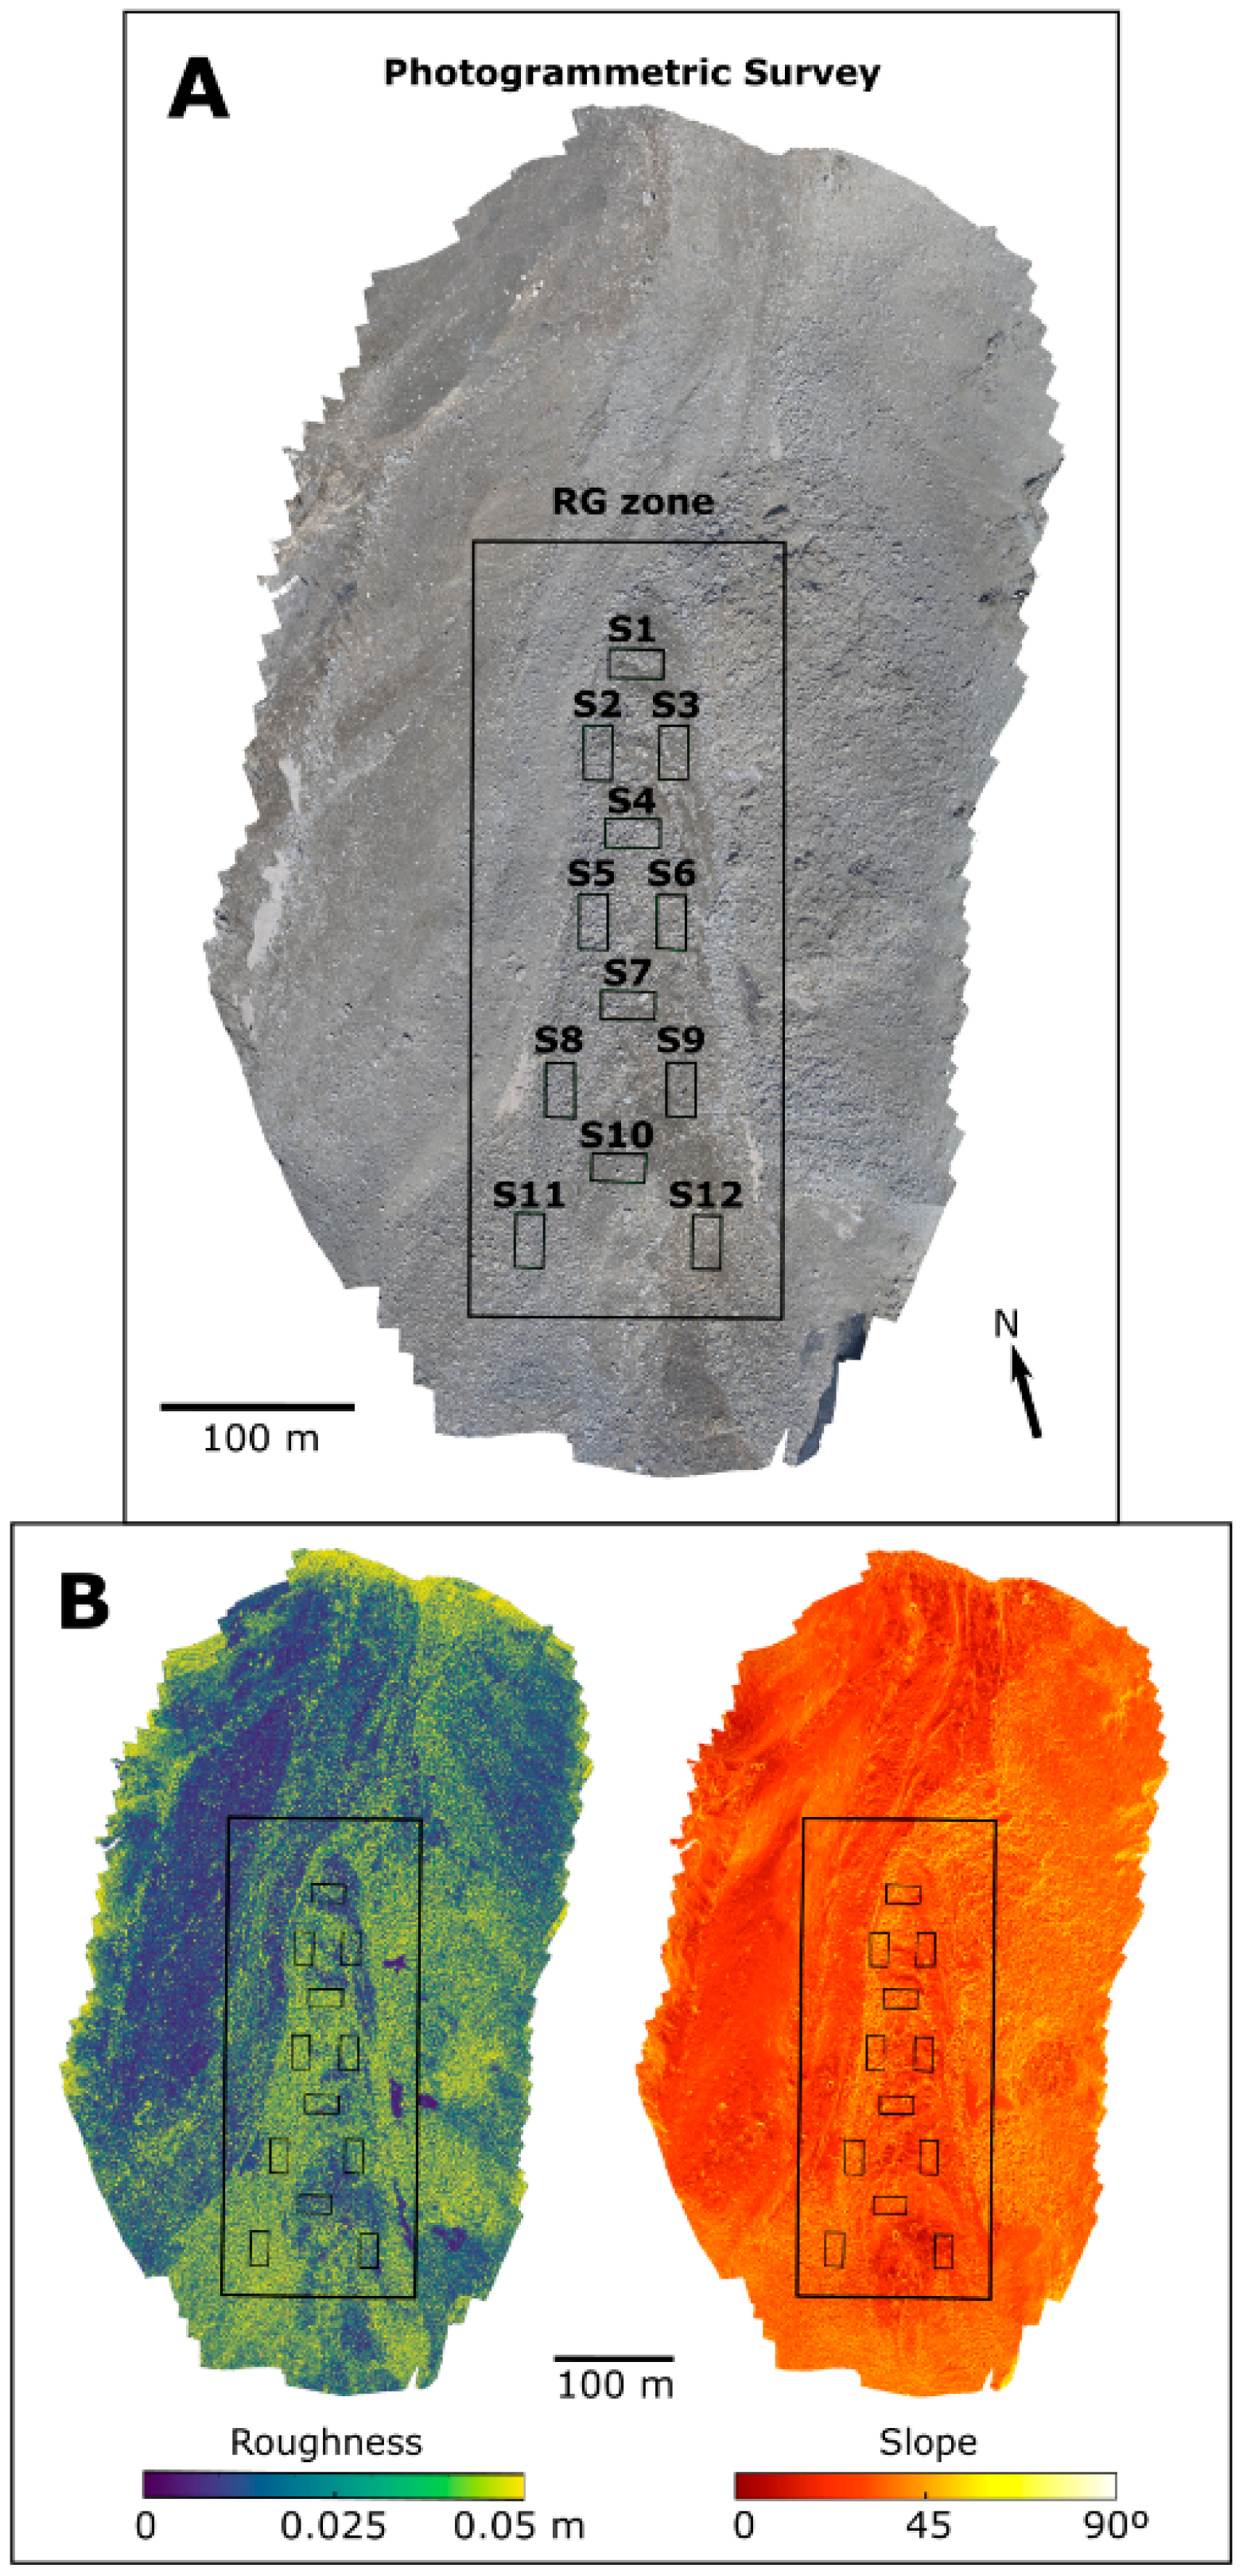
In the search for a detailed analysis of the surfaces, three different survey extensions were considered (Figure 3A): a first extension of the entire survey, a second one of the area comprising the rock glacier body (RG zone), and a third of sectors (S) of about 450 m2 on the rock glacier tongue. The performance of different regions of the photogrammetric surveys, regarding precision values, M3C2-PM differences, and geometric properties, was thus examined. Roughness (for a sphere with 0.3 m radius) and slope (from normals) were three-dimensionally computed from the SfM point clouds in CloudCompare (Figure 3B).

4. Results

4.1. SfM Surveys Properties

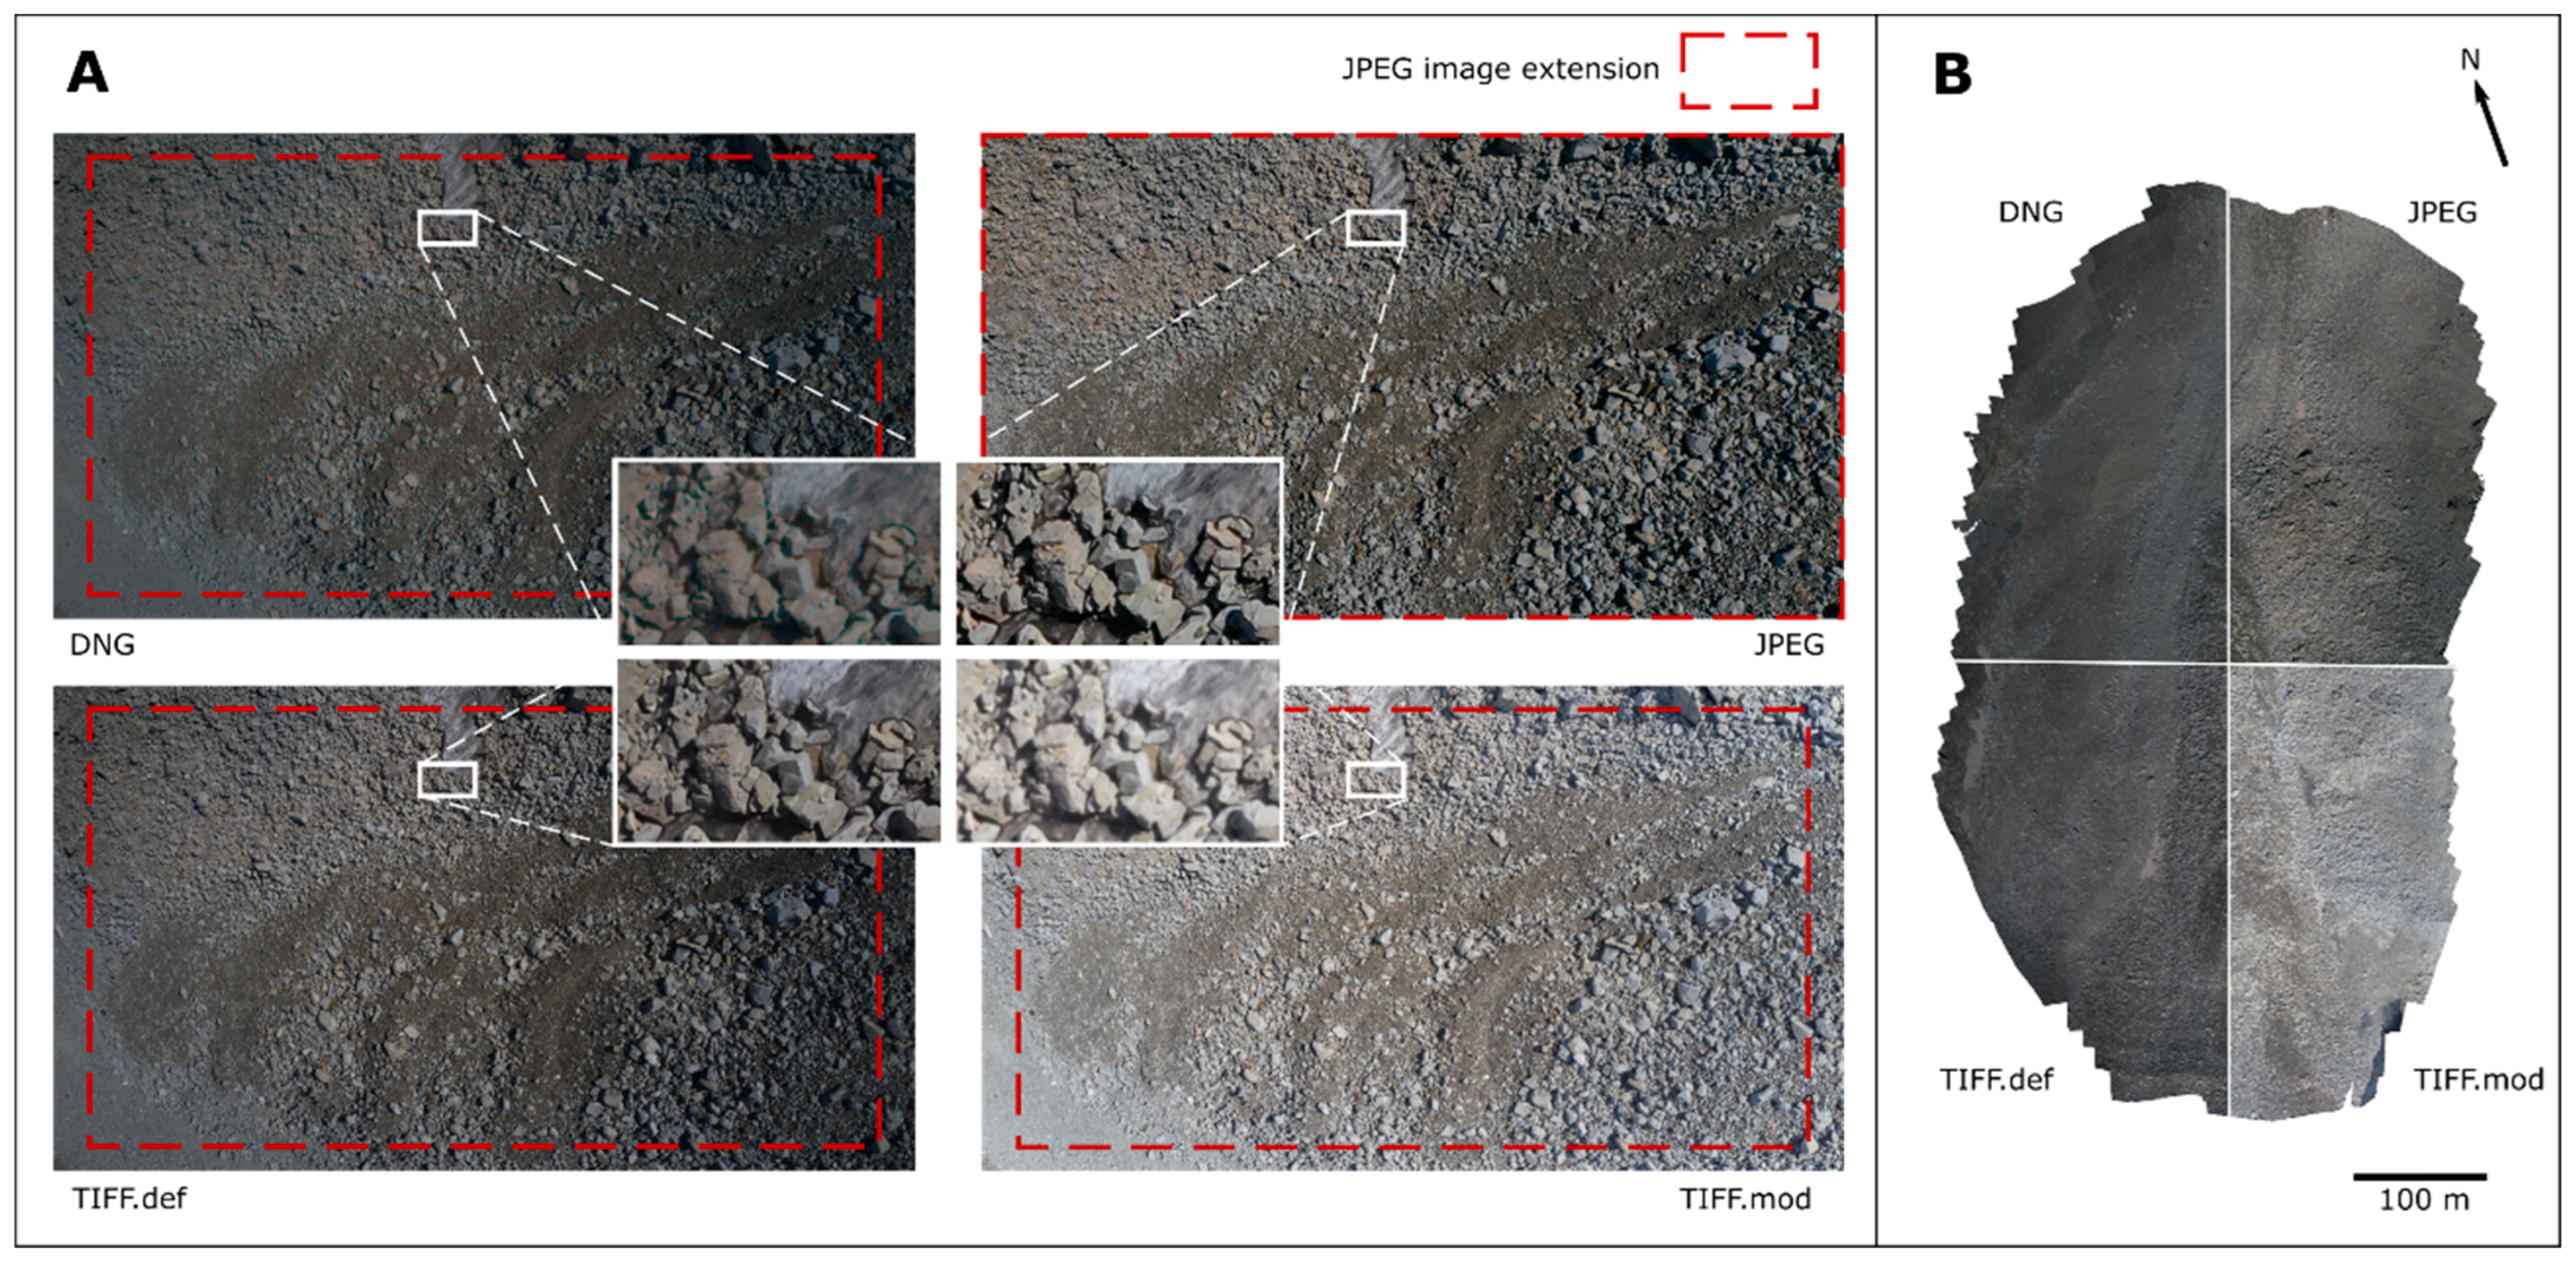
The rock glacier and its surroundings were photographed from more than nine different positions during the UAV flights (Figure 2A). The cropping of the JPEG images due to the build-in lens profile (Figure 4A) did not influence the regular photographing of the entire rock glacier surface. The raw and TIFF-derived images showed good quality (i.e., no blur, ghosting, or overexposure); however, modified parameters (e.g., white balance, exposure or shadow) in some of the image sets affected the appearance of the scene to a greater extent (Figure 4A). For example, variations in sharpening levels were evident between the DNG and TIFF.def images, while exposure levels were evident between the DNG and TIFF.mod images. In turn, the parameters directly affected the appearance of the resulting point clouds; however, in this case, the image exposure levels were more influential in that they significantly changed the colour (RGB values) of the points (Figure 4B).
The different image sets affected the number and distribution of the tie points extracted for the bundle adjustment. The reconstruction of the JPEG images increased the number of tie points compared to the other formats by 20–28% (20% TIFF.def; 24% DNG; 28% TIFF.mod), although the DNG and TIFF images captured a larger extent of the rock glacier surroundings (Figure 4A). On the rock glacier body (RG zone), tie-point differences increased by 29% to 39%, with JPEG and TIFF.mod showing the highest variations. Nevertheless, the disparities in the number of points were considerably reduced after densification of the SfM reconstruction (dense point cloud). Thereafter, the JPEG survey only had 2% more points than the DNG survey in the RG zone; however, due to the cropping effects caused by the lens correction, the JPEG reconstruction had 2.1% fewer points than the DNG reconstruction over the entire photogrammetric survey.

4.2. Quality of SfM Surveys

The Metashape projects with DNG, TIFF.def, and TIFF.mod images showed similar camera parameter values (Supplementary Table S1). Nevertheless, the effects of the lens geometric adjustments on the JPEG images had an impact on parameters such as principal point coordinates (cx, cy) or radial distortion coefficients (k1) [35], which were different from the rest of the projects. Regarding the bundle adjustment errors, these were similar in the four Metashape projects (Table 3), with the re-projection RMSE as an indicator of the adequate quality of the reconstructions. Only the JPEG survey showed slightly higher errors, with differences in the order of hundredths of a pixel compared to the rest. Visible on an average of 30 images, the GCPs presented RMSEs in line with the GNSS measurement accuracies in all cases. Again, the only difference was identified in the JPEG project, in which there was a 5 mm variation in the z-coordinate RMSE over the rest.
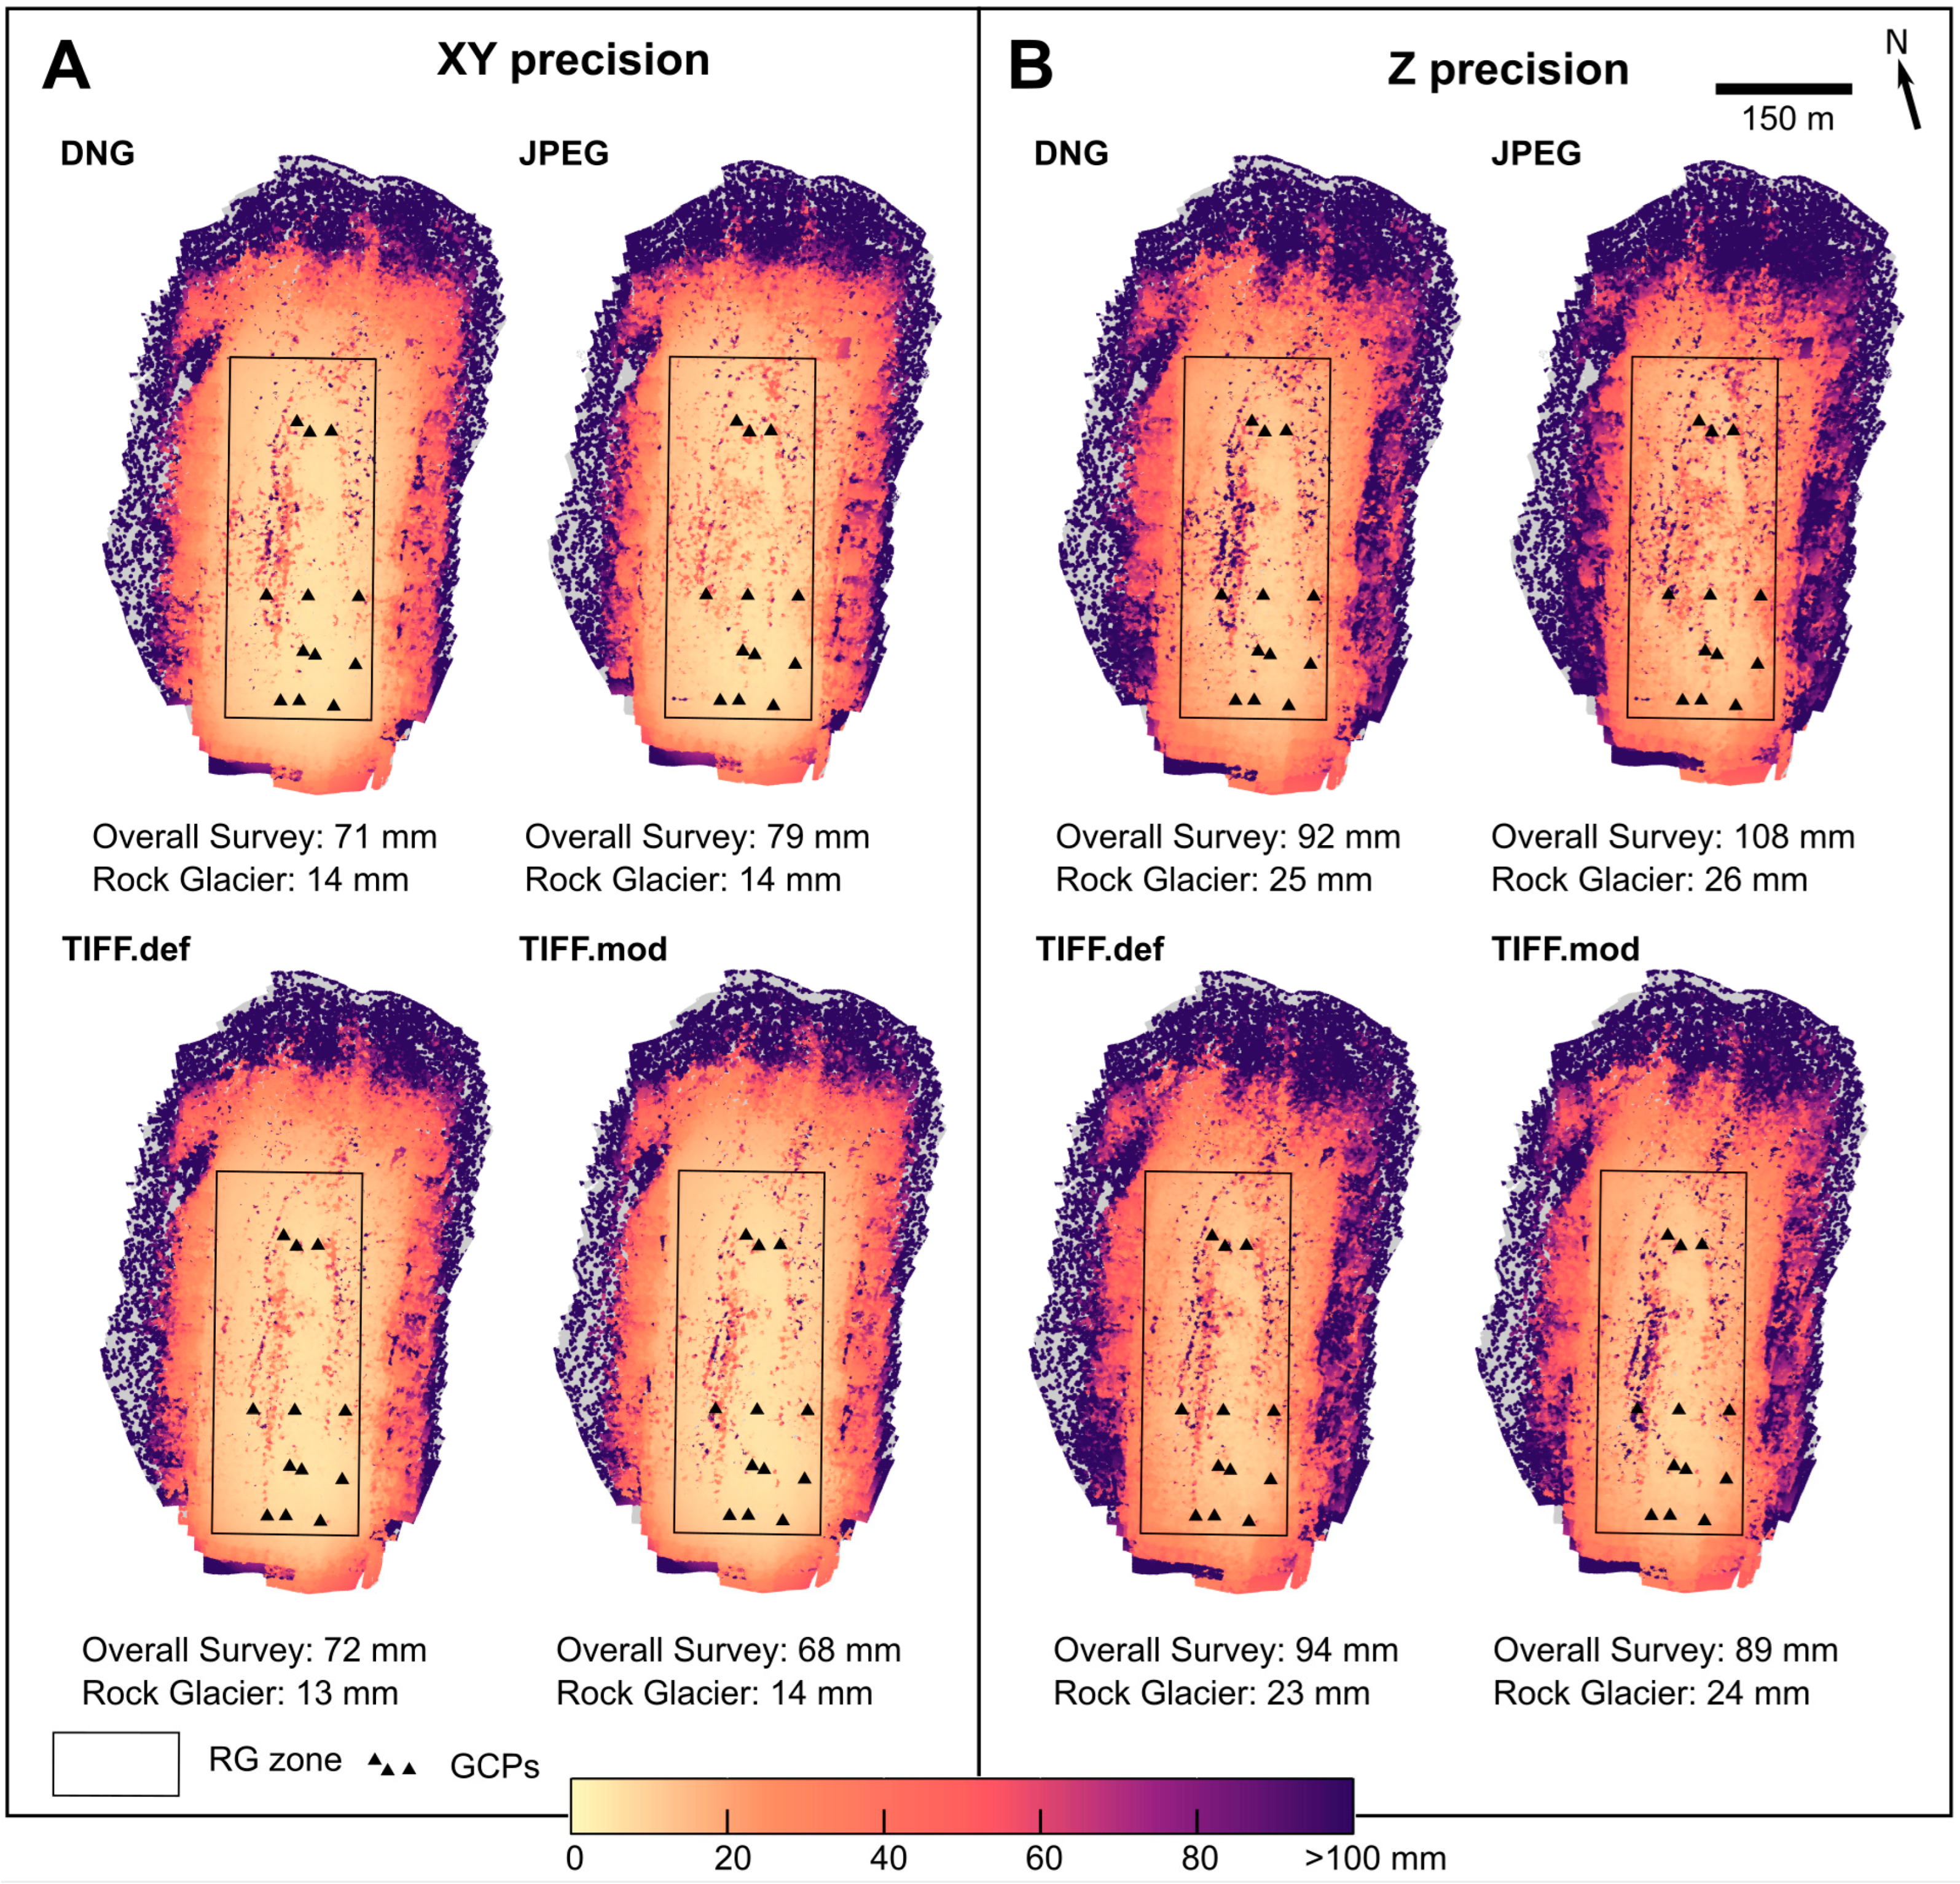
The errors provided by the photogrammetric software were initially lower than the tie-point precision values obtained from PM (Table 4). Although the SfM surveys were performed with a strong image network, tie-point internal precision (i.e., tie-point precision without georeferencing influence) showed mean values higher than ±110 mm in XY and ±170 mm in Z. Considering the effects of georeferencing (i.e., full tie-point precision), the tie-point precision was almost identical to the internal precision (planimetric and altimetric differences lower than ±2 mm). Hence, the mean tie-point precisions were similar among the different photo-reconstructions regardless of the influence of georeferencing (shape and full tie-point precision, Table 4). The random error variations among surveys were less than ±6 mm in planimetry, while in the Z component they were up to ±22 mm. TIFF.def exhibited the highest precision values, while DNG and JPEG showed the worst values in planimetry and altimetry, respectively. Overall, georeferencing precision variation among reconstructions was less than one unit in translations (mm) and rotations (mdeg), and almost identical in the scale factor (Table 4). Thus, the georeferencing precision in surveys was around ±6 mm in XY translations, and up to ±0.008° in rotations, with a scale factor close to zero. The tie-point precision interpolation to the dense point clouds improved the mean values of the precision linked to the surveys (Figure 5). This was mainly due to the association of higher precisions with areas with higher point density (e.g., rock glacier tongue) compared to areas with lower precisions (e.g., survey boundaries). In the DNG survey, the mean XY precision of the whole surface went from ±120 mm in the tie points to ±71 mm in the dense point cloud, while the mean Z precision went from ±186 mm to ±92 mm. The improvement was more significant in the RG zone, where ±14 mm in XY and ±25 mm in Z were achieved. In fact, the mean precision differences among surveys in the RG zone were almost null (Figure 5), focusing the possible variations in the rest of the surface surveyed. The photo reconstruction derived from the JPEG images showed the highest mean precision values, while the TIFF.mod photo reconstruction showed the lowest. The differences between these surveys reached ±11 mm in the XY component and ±19 mm in the Z component.

4.3. 3D Comparison of SfM Surveys

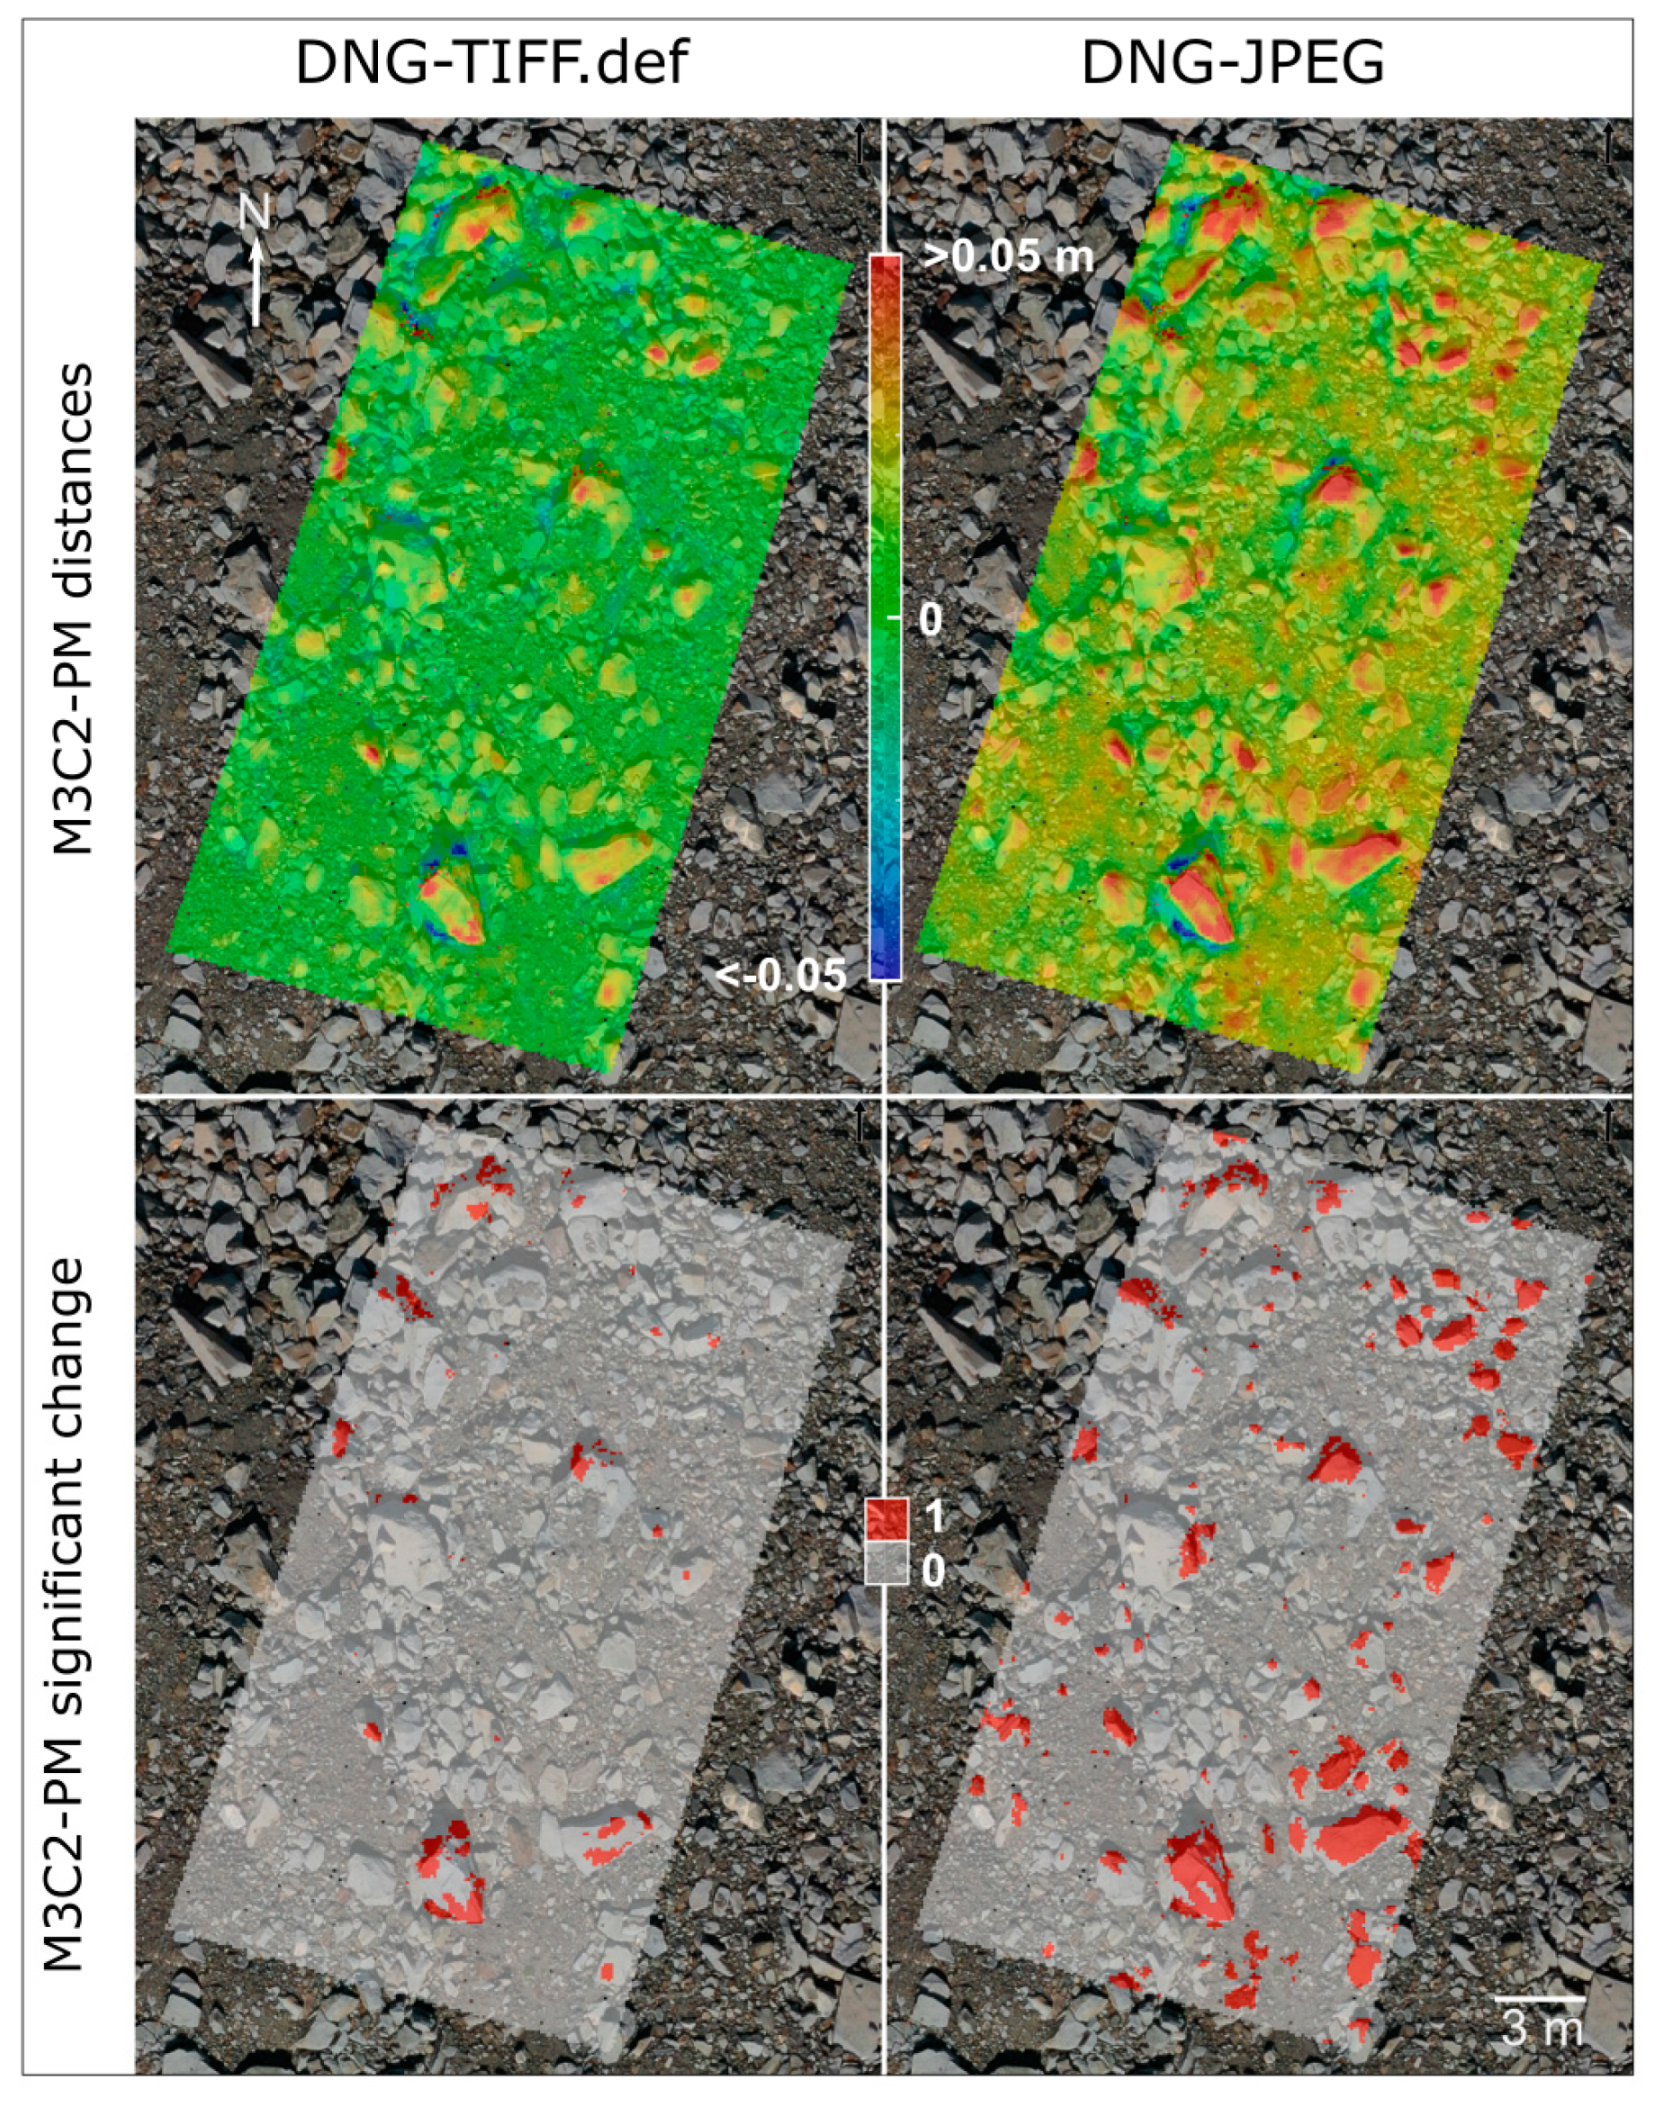
The M3C2-PM comparisons between raw and derived image surveys showed variations in differing magnitudes (Figure 6; Table 5). The highest values between the DNG to JPEG, TIFF.def, and TIFF.mod comparisons (distances from the DNG survey to the rest) were found between the DNG and JPEG surveys. Differences were of 26 ± 77 mm (mean ± SD) across the whole survey, with the most pronounced DNG-JPEG variations matching areas with poor precision values. Differences were predominantly positive to the NE and negative to the NW. This pattern increased gradually from the vicinity of the rock glacier tongue to the survey boundaries (Figure 6A). At the central area of the survey, where the tongue and the GCPs are located, variations in magnitude and extent were low, as well as being intermittently distributed over the surface. In order to check whether the manual positioning of the GCPs could have caused the JPEG surface to tilt relative to the DNG, an iterative closest point registration [43] was performed among surveys. The RMSE of the registration and subsequent M3C2 comparison of the surfaces did not show significant variations to the initial M3C2-PM comparison.
In contrast to the JPEG, the main differences between DNG-TIFF.def and DNG-TIFF.mod reconstructions were only found at the photogrammetric survey boundaries. In these cases, the mean variations were 6 ± 27 mm (DNG-TIFF.def) and 8 ± 27 mm (DNG-TIFF.mod) over the whole survey. The differences were reduced by the proximity to the centroid of the control points and the increased overlap between images.
With no significant variations (95% confidence interval) in large areas between DNG and TIFF surveys (less than 0.5% of the DNG cloud total points), the main differences were found between the DNG and JPEG models. The DNG-JPEG significant differences became continuous in the NE near the rock glacier tongue. The area affected by these variations amounted to 6.9% of the survey points. The mean value of these significant variations was 90 ± 83 mm, while for non-significant differences it was 20 ± 75 mm. In the rock glacier zone (RG zone), the percentage of significant differences between DNG-JPEG remained at 6.8%. Although the mean differences were 3 ± 28 mm in this zone, the magnitude of the significant variations reached 31 ± 63 mm, exceeding 50 mm in areas close to the tongue (Figure 6). The M3C2-PM distances in the remaining comparisons were 4 ± 12 mm in DNG-TIFF.def and 5 ± 11 mm in DNG-TIFF.mod, with significant changes in 0.8% and 0.6% of the points, respectively (Figure 6; Table 5).
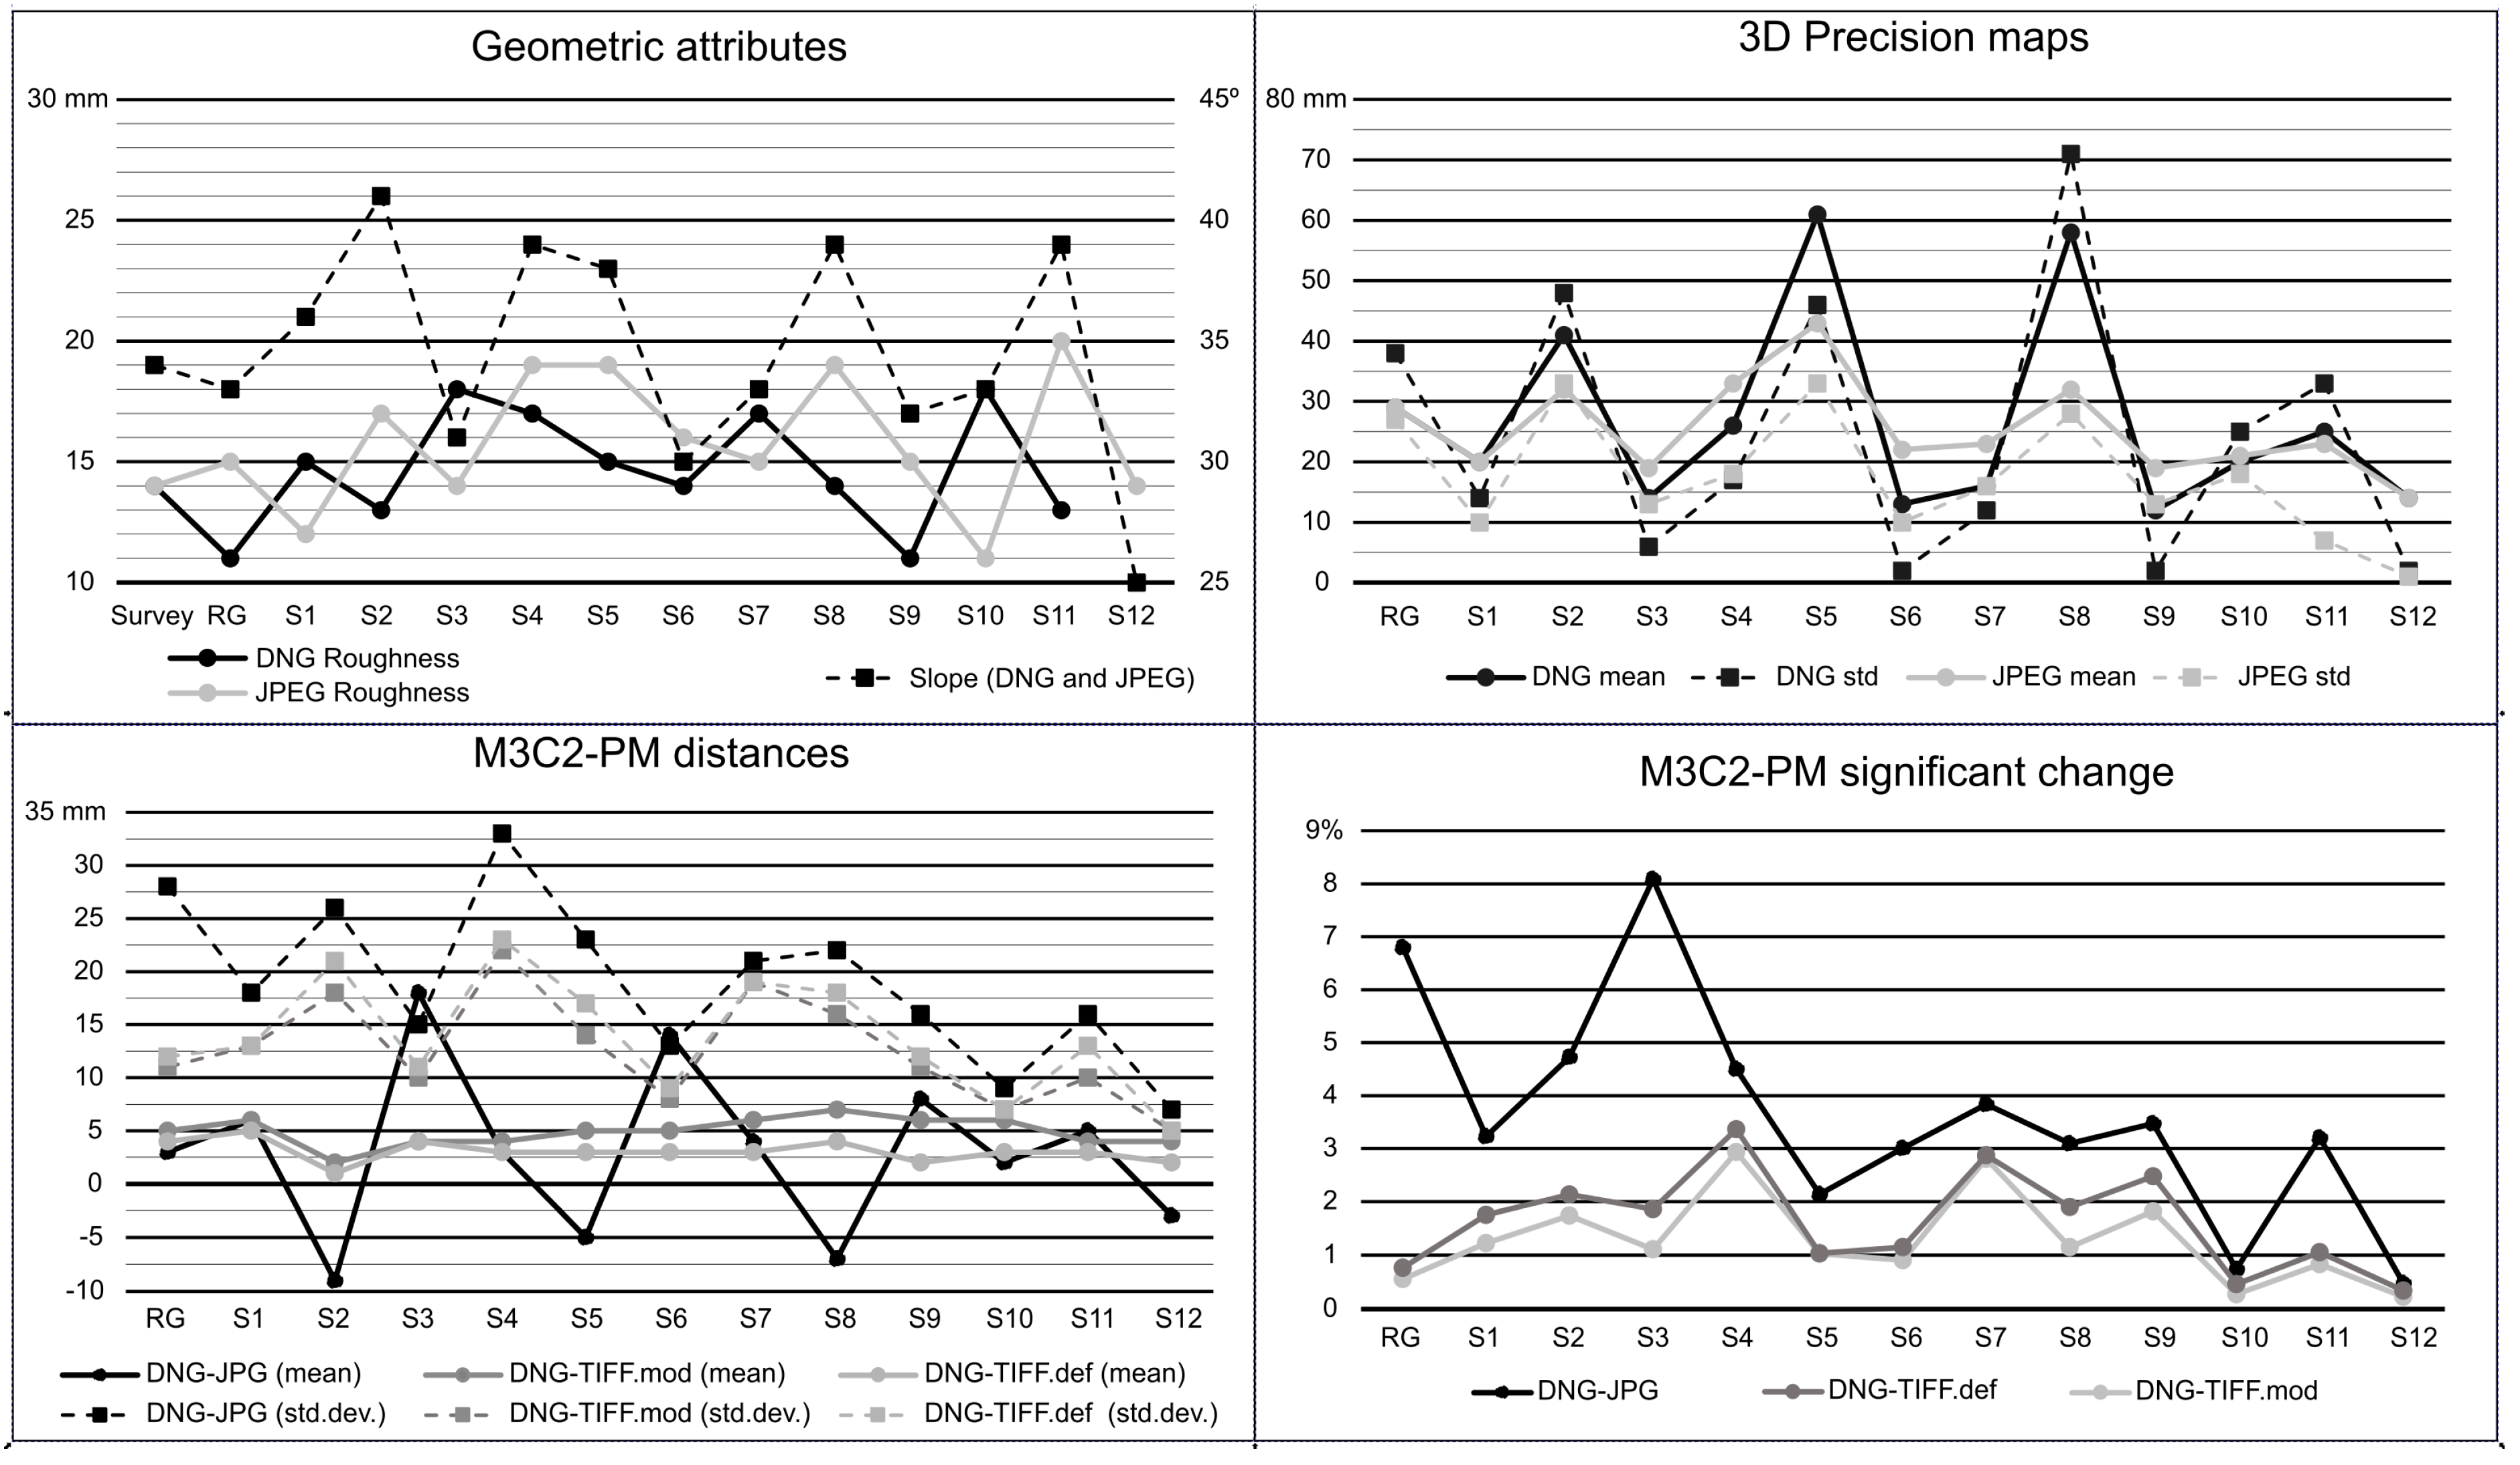
The sectors (S) analysed showed significant differences intermittently, without covering large areas of the reconstructed surface (Figure 6). Comparisons between DNG and TIFF surveys showed mean differences of less than or equal to 5 mm for TIFF.def and 7 mm for TIFF.mod in all sectors. Only the standard deviation of S2 (TIFF.def) and S4 (TIFF.def and TIFF.mod) exceeded ±20 mm (GSD size in the flight plan). Significant M3C2-PM distances in sectors S2, S4, S7, and S9 between DNG and TIFF.def represented more than 2% of the DNG survey points, while for DNG and TIFF.mod, the S4 and S7 sectors were the only ones to exceed 2%. With higher variations, the dispersion value obtained from the DNG and JPEG comparison exceeded ±20 mm in sectors S2, S4, S5, S7, and S8. Unlike the DNG and TIFF comparisons, there were negative means in the M3C2-PM distances (i.e., S2, S5, S8, S12), although these were no greater than -10 mm. The western sectors generally had negative mean distances and the highest dispersion values. At the same time, the easternmost sectors had positive mean differences and lower standard deviations. The percentage of points with significant changes between DNG-JPEG increased compared to the TIFF measurements, with values exceeding 8% in sectors such as S3 (Figure 6; Table 5).
In order to analyse the dispersed distribution of the variations in the rock glacier tongue, sectors were observed in the comparisons. Regarding DNG-JPEG, all sectors had similar behaviour. Positive differences were located on block surfaces that were clearly identifiable from the UAV images (mainly block edges). In contrast, negative values were common in shadow zones between blocks or sudden changes in the vertical component (i.e., transitions from large boulders to small ones or sediments; Figure 7). This behaviour indicates less smoothing of surfaces in the JPEG reconstruction than in the DNG reconstruction.
Although the greatest differences between the sectors were generally significant variations, these were not always located in shadow areas or on the edges of large blocks. Surfaces composed of small blocks (<50 cm) clearly visible in the images also presented significant changes (Figure 7). Nevertheless, surfaces without pronounced changes in geometry in the RG zone, such as snow or sediment cover, did not show significant differences, and their mean M3C2-PM distances were smaller than the GSD size. With less than 1% significant variations (0.8% TIFF.def and 0.6% TIFF.mod), the relationships between terrain features and M3C2-PM distances in the sectors were less evident in the DNG and TIFF surveys. These variations were concentrated in areas with sudden changes in the vertical component or shaded areas; however, unlike the DNG-JPEG comparison, surfaces clearly visible from multiple images that did not meet the above conditions showed more isolated significant variations (Figure 7).

4.4. Geometric Attributes of SfM Surveys

Terrain roughness and slope values were either identical or very similar in the four SfM surveys (Figure 8). Roughness between DNG and TIFF.mod reconstructions was practically identical, while the same attribute in the JPEG and TIFF.def surveys was occasionally higher (up to 2 mm) in the areas analysed (Figure 8). Sectors located on the western side of the rock glacier tongue (S2, S5, S8), mainly made up of debris of different dimensions, presented high roughness values (>17 mm) and slopes above 38°. Sectors located on the eastern side (S3, S6, S9) were composed of sediments, scattered blocks, and less steep slopes, which resulted in lower roughness values than on the west side. Finally, sectors in the upper part of the glacier (S10, S11 and S12) had lower roughness values than those in the central part of the tongue, such as S4. The uniform sampling of the SfM reconstructions meant that sectors with higher roughness, and therefore larger reconstructed surface, showed a greater number of points than sectors with lower roughness values.

4.5. 2.5D Comparison of SfM Surveys

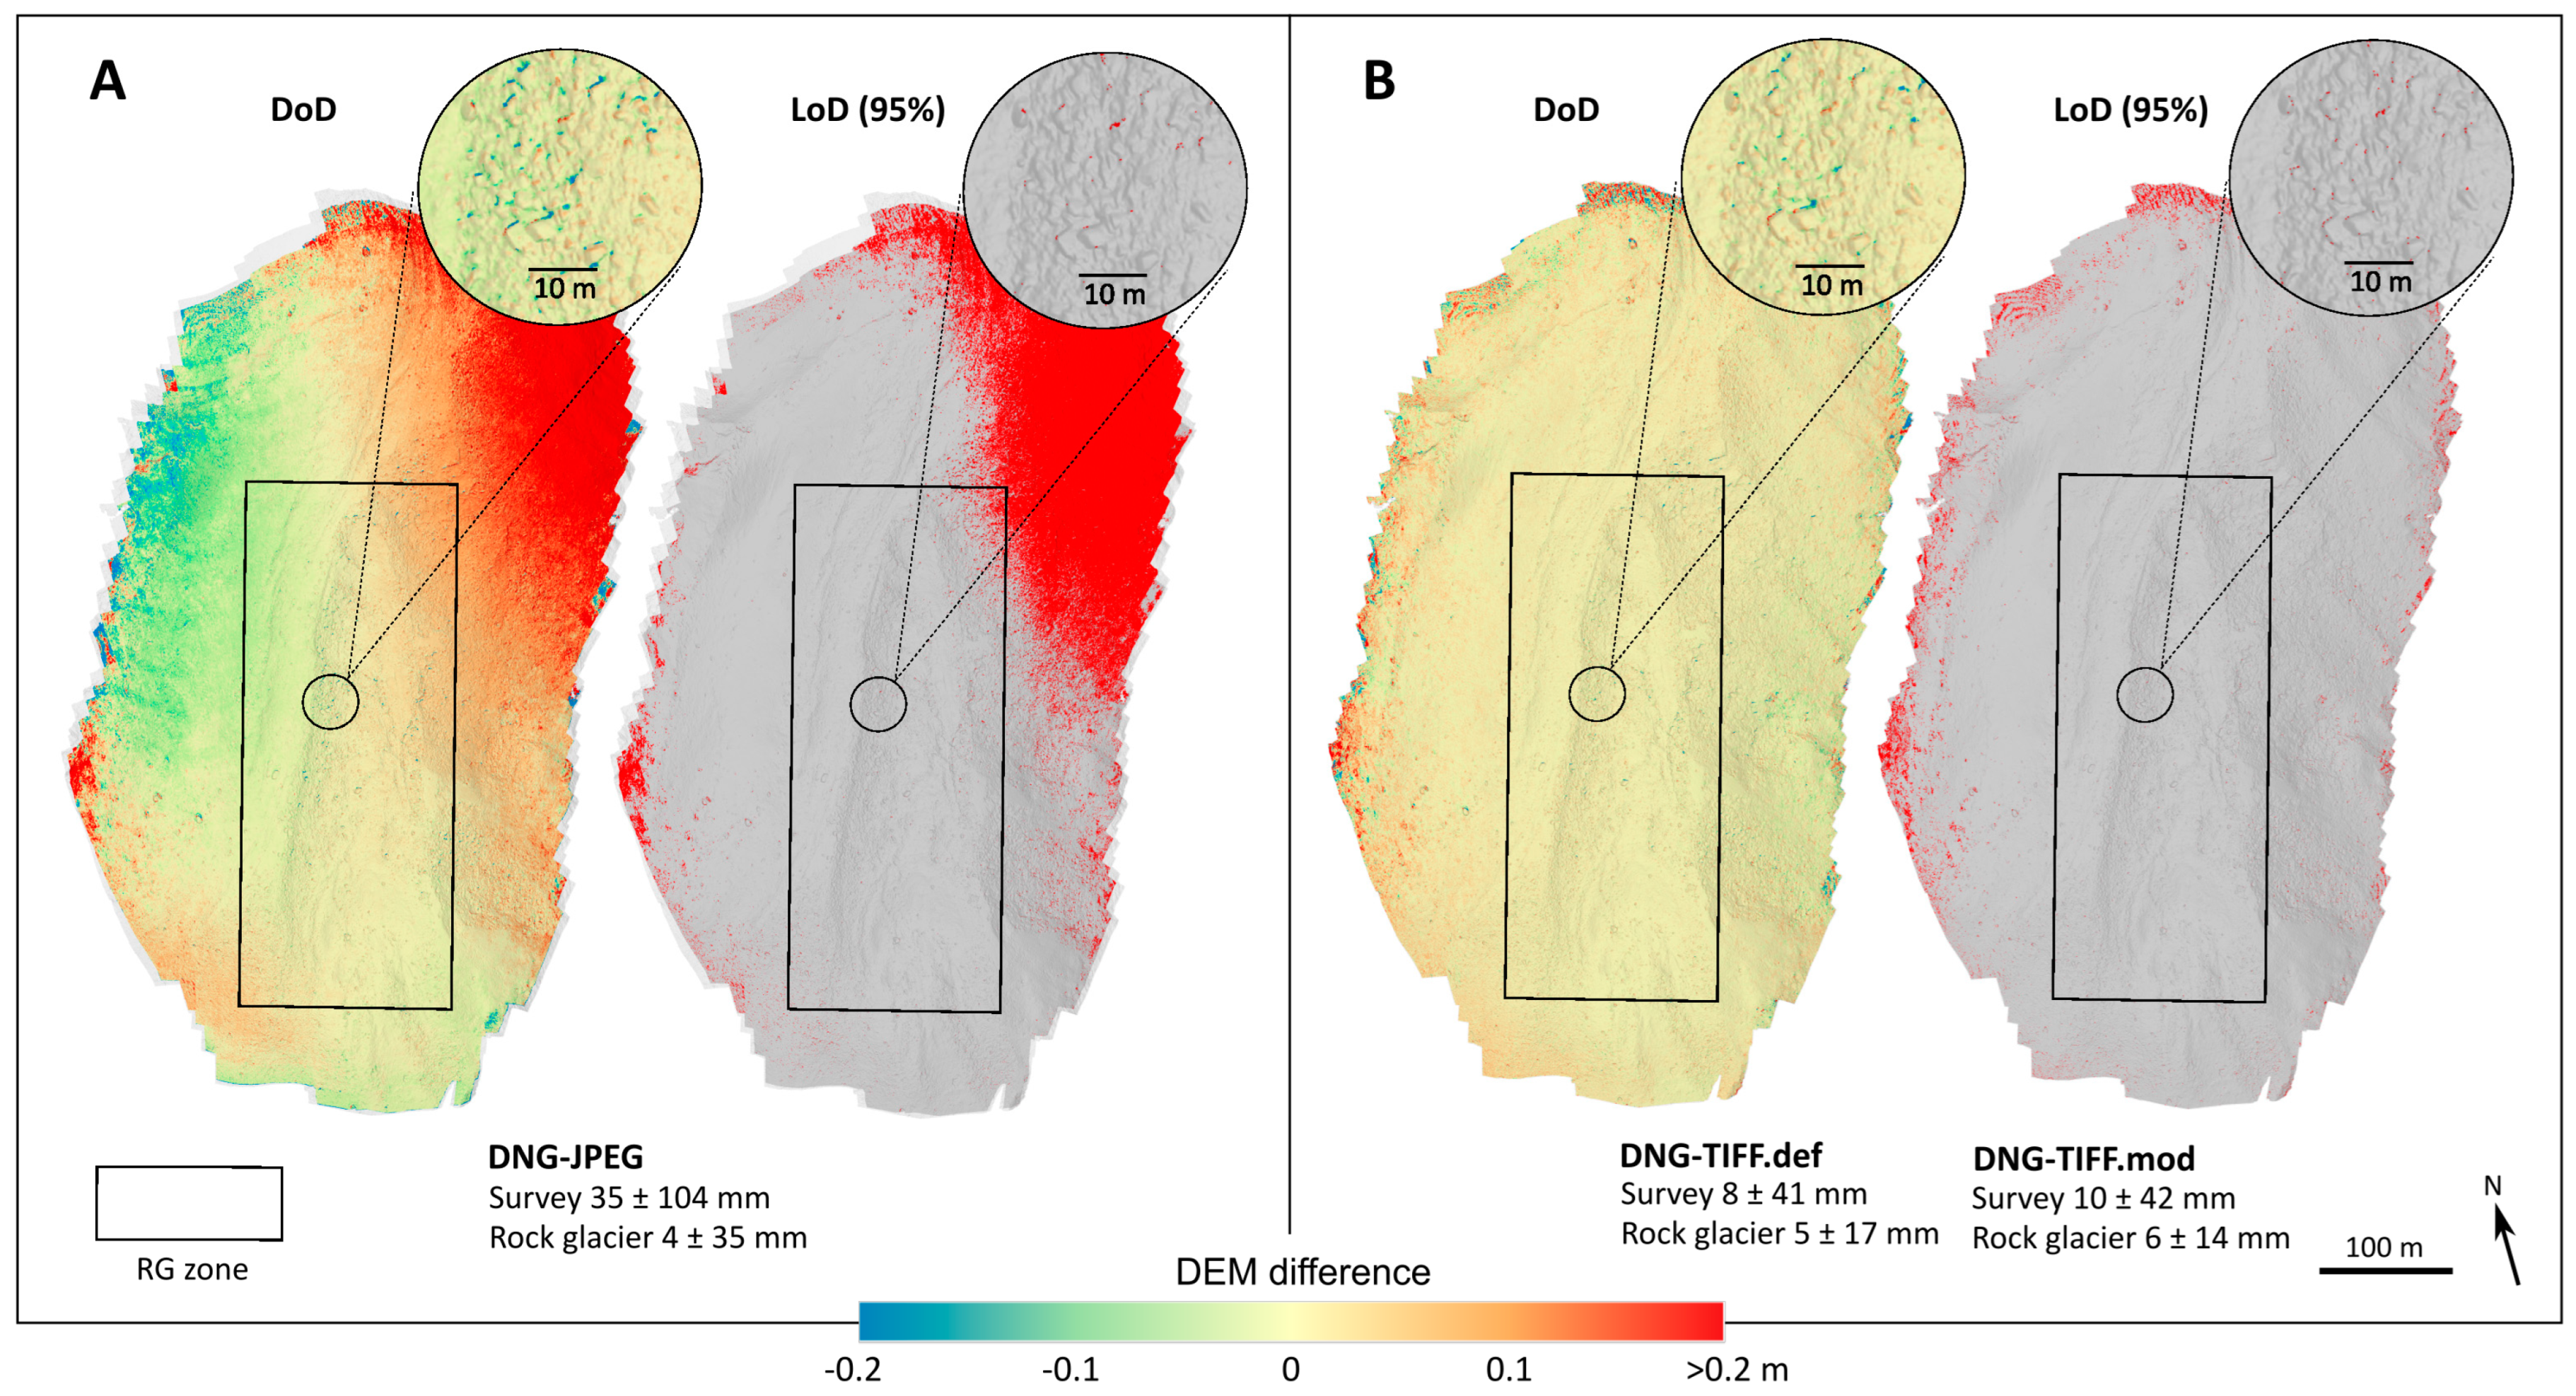
Comparing DEMs with LoD95% showed similar patterns to the 3D comparison in terms of the distribution of differences (Figure 9). The DNG-JPEG DoD revealed variations over a large part of the survey area, maintaining the trend of the M3C2-PM comparison by presenting positive values to the NE and negative values to the NW. Similarly, the main differences of the DNG-TIFF.def and DNG-TIFF.mod DoDs were located at the survey boundaries; however, the mean magnitude of variations was slightly higher than the M3C2-PM comparisons in the overall survey (Figure 9; Table 6). In all cases, the mean differences and standard deviation (except for DNG-JPEG SD) were below the pixel resolution in the DEMs. Nevertheless, the magnitude of DNG-JPEG DoD variations exceeded 50 mm and 200 mm over large areas of the RG zone and the general survey, respectively. With regards to distance, significant variations were found in greater proportion in the 2.5D comparisons than in the 3D comparisons. While 6.9% of the points showed significant changes in the M3C2-PM comparison of the DNG-JPEG surveys, this percentage increased to 20% of pixels in the DoD. As in the 3D comparison, most of these significant changes were located on the NE surface of the survey (Figure 9). In the remaining cases (DNG-TIFF DoDs), significant variations were reduced to 2% of the total area, concentrated at the survey boundaries along with the largest DoD distances. In the RG zone, the percentage of the surface with significant changes was equal to or less than 1% in all cases (TIFF and JPEG). These changes had a scattered distribution over the surface of the frozen body, mainly appearing near large blocks.

4.6. 3D Comparison of TLS and SfM Surveys

The terrain characteristics and scan positions limited the terrain extent recorded in the TLS survey. Similarly, the density of the TLS point cloud varied depending on the area surveyed and its proximity to the scans. Despite the multiple TLS positions, most sectors had fewer points than the SfM surveys. Thus, sectors such as S3 had approximately 10% of the average number of points counted in each sector of the TLS survey (i.e., 316 × 103). There were exceptions, however, such as S10, which had a close scan that increased the mean number of points by more than 800%. This meant there was no direct relationship between the number of points and the complexity or roughness (on average around 50% higher than the SfM reconstructions) of the sectors analysed.
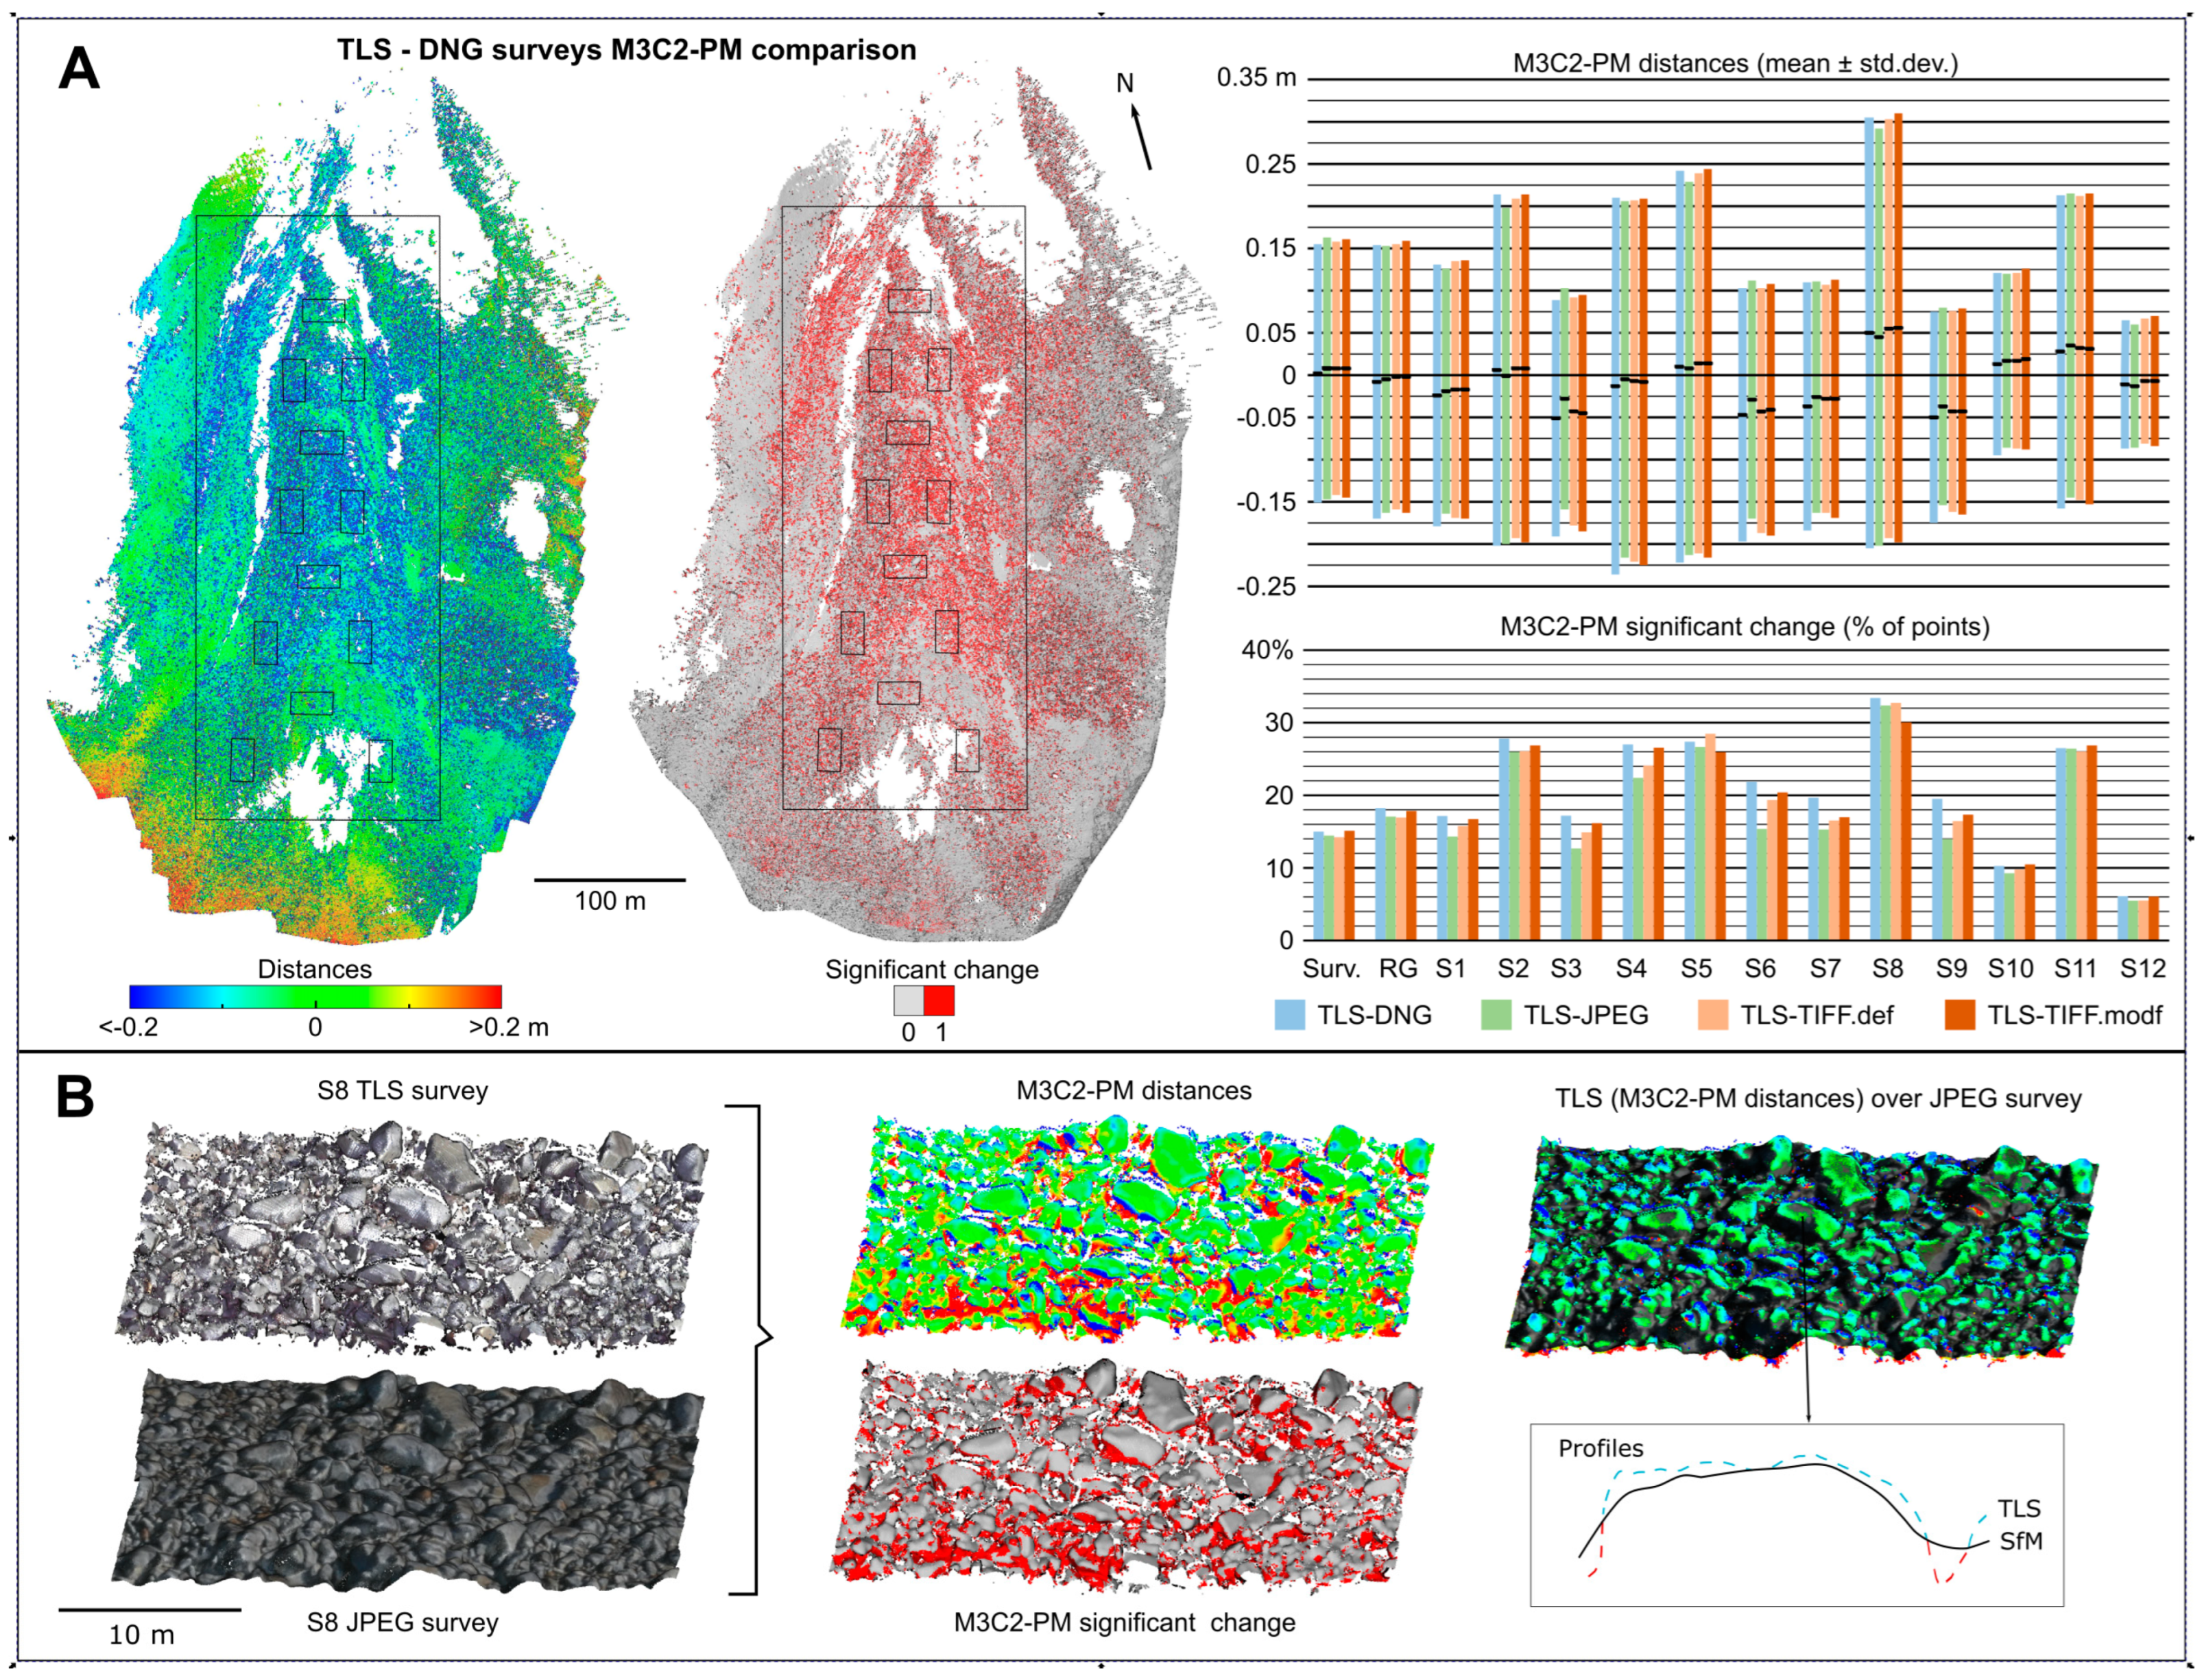
The 3D comparison of the TLS benchmark with the SfM surveys (distance from the benchmark to the photo-reconstructions) showed mean M3C2-PM distances of similar magnitude to the image-based comparisons (Figure 10A; Table 7). The differences were 2 ± 153 mm between TLS-DNG, 8 ± 155 mm between TLS-JPEG, 8 ± 150 mm between TLS-TIFF.def, and 8 ± 153 mm between TLS-TIFF.mod. With mean values close to zero, the fluctuation of the positive and negative deformations was exposed by the dispersion values (Table 7). These deviations were two to five times higher than the deviations detected in the SfM comparisons.
Within sectors, the mean differences increased in the entire TLS survey. Sectors such as S3, S8, or S9 showed values greater than or equal to ±50 mm, while 4 of the 12 sectors observed showed deviations greater than ±200 mm in the TLS-DNG comparison. These pronounced variations were mainly associated with variations in the sampling of the TLS measurements. In areas of the TLS survey with dense and uniform sampling, the reconstruction was less smooth than in the SfM reconstructions (Figure 10B). Clearly visible surfaces in the images (e.g., the highest part of the blocks) showed an underestimation (negative M3C2-PM distances) of the dimensions in the SfM reconstruction concerning the TLS. In contrast, less visible surfaces in the images (e.g., shadow areas or gaps between blocks) showed overestimation (positive M3C2-PM distances) of the dimensions. Although the variations were not identical in all comparisons, the mean TLS-SfM distances never varied by more than ±20 mm in all sectors (except S3, which exceeded 20 mm in TLS-DNG and TLS-JPEG). Even the standard deviations were similar at all levels analysed (survey, rock glacier zone, and sectors) with maximum variations of about ±10 mm.
In contrast to the SfM surveys, significant changes were especially concentrated and intermittently distributed on the rock glacier tongue. The proportion of points with significant differences between the TLS and image-based surveys increased according to terrain features, from variations between 14.2% (TIFF.def) and 15.1% (TIFF.mod) in the entire TLS survey, to 16.9% (TIFF.def) and 18.2% (JPEG) in the mainly debris-formed surface of the RG zone. The surface percentage with significant changes increased in the sectors, representing more than a quarter of the points in S3 (27.8%), S5 (27%), S6 (27.4%), S9 (33.4%), and S12 (26.5%) in the TLS-DNG comparison. In all cases, the distribution of these significant changes was predominantly located on surfaces less visible from the aerial perspective of the UAV (Figure 10B).

5. Discussion

5.1. SfM Surveys Properties

The first effects of the image properties on the SfM reconstruction are observed at the radiometric level. The surveys exhibit similar characteristics to the images used for the reconstruction (Figure 4). Thus, models such as DNG and TIFF.mod show differences in the RGB values of the point clouds depending on the exposure of the images. Meanwhile, other image characteristics, such as chromatic aberration or modifications in sharpening, are not evident in point clouds, but they are in cartographic products such as orthomosaics. These results partially correlate with those previously reported by [21] in terms of brightness values in DNG-derived images.
Geometrically, the first differences are found in the number of tie points extracted for bundle adjustment. Images such as pre-processed JPEG show a considerable increase compared to the rest of the image sets, followed by TIFF.def and DNG. Images with filters such as sharpening and noise reduction increase the number of feature points matched across the images. Modifications in white balance, exposure, or shadows, which were intended to improve the appearance and quality of the reconstruction, seem to negatively affect the number of point matches in the reconstructed area. This effect can be explained by the better definition of block edges in images that are pre-processed or with filters applied. These results contrast with those previously reported by [21]. According to the authors, DNG images present a tie-point increment in the photo reconstructions of natural scenarios (river bed) regarding the JPEG and TIFF formats. In any case, the differences in the number of points between DNG and TIFF images found in the current study are of less than 10%. These differences become insignificant after cloud densification, with differences of around 2% in the number of points. Neither a reduction in the surface area captured with the JPEG images (due to the built-in lens profile cropping) nor the photographic adjustments seem to significantly affect the point density values extracted from the final survey.

5.2. Quality of SfM Surveys

Along with the highest number of tie points, the greatest error values of the bundle adjustment are found in the JPEG reconstruction (Table 3). Nevertheless, the differences in error between reconstructions are negligible (smaller than the GSD dimensions or the georeferencing device precision) even with the influence of different camera parameters (Supplementary Table S1). It follows that the strong image network and accurate location of control points offer similar quality regardless of the image processing level when analysing the information provided by the SfM software. Suitable distribution and location of GCPs has been shown to be necessary for obtaining residuals below the accepted practical accuracy of up to twice the size of the GSD in planimetry and up to three times the GSD in altimetry [17]. Further, studies have shown the importance of the number and distribution of GCPs in defining the residuals of the photogrammetric reconstruction (e.g., [33]). Nevertheless, this study demonstrates how, with a suitable image network, the residuals offered by SfM software can be good even with non-optimally distributed GCPs with centimetric errors in steep terrain. This becomes even more relevant when considering the alteration of the position, and thus the number of GCPs in the JPEG project compared to the other SfM projects. Studies such as [21] support this geometrical similarity between reconstructions derived from different formats and show the negative effects of JPEG image compression in a variety of scenarios.
In an exhaustive analysis of the quality of the photo reconstructions from the precision maps, a considerable decrease in tie-point precision values was observed in all cases (Table 4). Nevertheless, the precision difference with or without the georeferencing considerations was lower than the RMSE of the GCPs after bundle adjustment, and very close to the mean error achieved at the Z coordinate by GNSS-RTK. Furthermore, the high precision of the georeferencing parameters supports the idea that control distribution and quality do not significantly affect SfM projects that only differ in the photographic adjustments applied to the images (according to this study characteristic). Discrepancies between photo reconstructions would not affect the mapping through orthomosaics, which would support the smaller relevance of GCP density on orthophoto quality, as reported by [32]. Moreover, in most cases, the precision in translations (less than 10 mm) and rotations (less than 0.01°) would allow the determination of annual surface creep, even in transitional rock glaciers with reduced movement rates [44].
Tie-point precision interpolation to dense point clouds facilitates the identification of a similar distribution of uncertainty across the four surveys. The distribution and magnitude of the variable 3D precisions over the different photo reconstructions follows photogrammetric, georeferencing, and physical environment considerations. Induced by the uncertainty of the georeferencing parameters, the reconstructions show a radial degradation of precision as the distance to the GCPs centroid increases, as reported in [20]. From an image network geometry point of view, the overlap between images also correlates with the precision of the points. In fact, it is possible to identify a pronounced degradation of precision at the boundaries, where the overlap is reduced (Figure 5). The degradation is more evident in the JPEGs and less in the TIFF.mod among the image sets. These sets have the highest (JPEG) and lowest (TIFF.mod) number of matched points determined during image alignment, which indicates that the number of tie points does not imply higher quality of the final point cloud. In any case, the average variations between the image sets in the reconstruction agreed with the quality of the GCPs or the pixel size programmed for the photogrammetric flights (Table 1). In the RG zone, with high overlap between images and proximity to the GCPs centroid, 3D precisions improved significantly in all cases, with almost null differences (Figure 5). Nevertheless, it is possible to identify precision decreases in steep slope areas such as the boundaries of the rock glacier tongue. Thus, the first influences on the physical terrain features are found in the UAV photo reconstructions (especially in the Z-component due to the photogrammetric approach, as remarked in ref. [32]).

5.3. 3D Comparison of SfM Surveys

The application of M3C2-PM proves that the characteristics of images can significantly affect photogrammetric reconstruction, even if there are indications of good reconstruction (fixed and variable precision values presented in the study). The GCP errors (Table 3) or precision maps (Table 4) show similar mean values between SfM surveys; however, the M3C2-PM comparison from image sets such as DNG and JPEG can show significant geometric differences over large areas (Figure 6; Table 5). Some of these major differences are found at the boundaries of the photo reconstructions, where the image network or the proximity to the ground points are not adequate [19]. Nevertheless, despite showing M3C2-PM distances exceeding ±20 cm (10 times the GSD size) around the boundaries, the surfaces do not show significant variations. This is a result of the high random errors associated with these areas. Instead, significant variations between DNG-JPEG can be found in central areas of the survey, where precisions are higher due to the improvement in photogrammetric considerations. Geometric discrepancies exceed ±5 cm in large surfaces of the RG zone. Moreover, the SD displacements in the zone are higher than georeferencing precisions or GSD size. Interestingly, reconstructions that should be geometrically identical due to the exact image acquisition moment and similar processing workflow show areas with greater differences than the ground control quality or image resolution. Bearing in mind that the derived internal and georeferencing precisions are very similar between surveys, and the DNG and TIFF photo-reconstructions are geometrically similar, the JPEG survey differences from the rest were tied to the built-in lens profile. This is in line with [35], who point out the application of on-board geometric image corrections by camera manufacturers and the need for users to be aware of the effects they may have.
In addition to the deformations over large extensions, the photo reconstructions show significant differences on dark surfaces between blocks and, though less common, on well-illuminated surfaces on the top of the blocks. These significant variations are intermittent and mainly focused on the rock glacier tongue. They are present in all comparisons, but are more frequent between DNG-JPEG surveys. The differences in areas where the image network and ground control can be assumed to be optimal suggest that the appearance of image sets (Section 3.2) significantly affects the reconstruction of poorly visible surfaces or abrupt geometries (considering GSD size as a reference).
There appears to be a relationship between the geometric attributes extracted from the photogrammetric surveys and the real terrain features. Furthermore, the increase in roughness in the JPEG and TIFF.def images in comparison with the remaining image sets could be interpreted as an improvement in surface reconstruction. Nevertheless, the differences in the areas analysed are so slight that the attributes of the surveys can be considered identical. Moreover, these geometric attributes are not directly related to the M3C2-PM differences between projects. The DNG-JPEG comparison of S3, for example, shows a higher proportion of its surface with significant changes compared to the rest of the sectors; however, this sector does not have high roughness or slope values compared to sectors further west. In the same sense, sectors close to each other, such as S4 and S5, show similar roughness and slope values, but M3C2-PM distances and significant changes of different magnitude. Otherwise, the comparison of DNG-TIFF.def surfaces presents significant variations in smaller proportion. The mean M3C2-PM distances of these surfaces are negative, suggesting that the impact of the shadow zones is more significant than the visible surface of the blocks (Figure 7). Even so, the positive variations in the DNG-TIFF.mod comparison might suggest the opposite, such that the impact of the shadowed areas is not that influential. In any case, the values are small (±5 mm) and show such similar deviations that they can be considered negligible. Although there may be a relationship between terrain complexity and the differences detected between the SfM projects, there is no linear correlation between geometric attributes and M3C2-PM differences (distances and percentage of the surface with significant changes) in all the sectors studied (Figure 8).
The above results highlight the relevance of the information provided in photogrammetric reconstructions in geomorphic research, as pointed out by [16]. Most geomorphic related studies do not indicate the properties of the images beyond the camera used (e.g., [1,3,5]). Although this information would be sufficient in numerous investigations, there are studies where it may play a critical role, as found in the present study. Without information on the usage or treatment of raw or derived imagery generated by the camera or raster processing software, alterations in the results of comparative software studies (e.g., [17,18,21]) or surface change analyses (e.g., [3,5,45]) may go unnoticed.

5.4. 2.5D Comparison of SfM Surveys

The DoD between surveys shows deformations with similar patterns but higher magnitudes than the 3D comparisons. Even though the most prominent variations are found between DNG-JPEG surveys, the proportion of the surface with significant changes in the rock glacier tongue is smaller than the other cases (DNG-TIFF). Considering the higher SD in the DNG-JPEG DoD, the increase in significant changes in the DNG-TIFF comparisons was associated with a smaller LoD value. In contrast to the variable values of precision maps, the effects of a constant systematic error for the entire survey were also reflected in the significant differences. Thus, the DEM comparisons show significant deformations at the survey boundaries to a much greater extent (Figure 9; Table 6).
Another limitation of the 2.5D comparisons is the increase in differences in areas of steep slope and high roughness (sudden changes in the vertical component) or small surfaces with shadows. Nevertheless, as seen in the 3D comparisons, these variations are smaller in areas of simple geometry, such as snow-covered surfaces adjacent to the rock glacier tongue. Under the tests performed, it follows that image processing does not necessarily affect the reconstruction geometry in areas with a good control and image network in 2.5D comparisons if no lens corrections are applied. Otherwise, images such as the JPEG from the Mavic 2 Pro camera may alter the surface even with identical project conditions (ground control, image network, and surface characteristics). In any case, the considerable increase in significant differences between models supports the limitations of the 2.5D comparison in environments with complex geometry, as reported in ref. [8].

5.5. 3D Comparison of TLS and SfM Surveys

The magnitude and distribution of the differences between TLS surveys and image-based reconstructions are more closely related to the complexity of the terrain than to the characteristics of the photogrammetric flight (under the assumptions provided in Section 4.6). Therefore, areas such as the debris-formed rock glacier tongue show variations spread almost throughout its entire surface. In contrast, snow-covered areas with more uniform geometry do not significantly differ in any 3D comparison. Moreover, the sectors show no direct statistical relationship among features such as point density, roughness, slope, and M3C2-PM distances. This lack of any relationship is attributed to the irregular sampling inherent to high-resolution TLS surveys in complex terrain. Limitations in the number and positioning of scans leads to oversampled or unregistered surfaces, as noted by [46]. In addition, irregular sampling can also affect the computation of normals, which is crucial in the M3C2 comparison process.
In sectors uniformly registered by both methods such as S8, the SfM reconstruction presents an overestimate in shadow areas and an underestimate in well-identified areas in the images regarding the TLS benchmark (Figure 10B). This behaviour is similar to the comparison of the DNG and JPEG photo reconstructions and is partially presented in studies where multiple image compression levels are used in the SfM reconstructions [21]. Still, the magnitude of the TLS-JPEG differences in the S8 surface reaches deviations of about ±250 mm in the rock glacier area unlike the ±20 mm for the DNG-JPEG deviation in the same area. Such large distances imply significant variations in a great part of the TLS surface in all comparisons, exceeding 25% of the points in many sectors. The magnitude of the M3C2-PM distances and its significance level are similar in all the TLS-SfM reconstructions. The differences are lower than or close to the pixel size of the georeferencing error and the percentage of points with significant changes is around 1% in all the TLS points.
Considering the conditions presented in this study, none of the image sets used for the photogrammetric reconstruction fit better to the TLS survey, even with the high-sampling TLS record from multiple scans around the frozen bodies, which leads to low uncertainty in change detection [22] and is not often feasible due to the mobility difficulties in these scenarios.

5.6. Potential and Limitations in Monitoring Geomorphic Processes

Beyond the negative influence that JPEG image compression may have on photogrammetric reconstruction [21], the characteristics of the high-quality image are also shown to be relevant for the detailed geometric representation of surfaces. Monitoring processes with equipment (e.g., consumer-grade UAV, GNSS-RTK positioning devices), flight planning (e.g., ground support, image network) and products (e.g., DEM) similar to those shown in the La Paúl rock glacier is commonplace. It is easy, however, to find geoscience related studies where the format or properties of the images are not specified; ground control is not optimally distributed due to constraints or DoDs are used to quantify deformations between different epochs. Some examples with DJI Mavic drones are shown below.
The control of landslide processes with UAVs, as performed by [47], may be affected by the images used in the photogrammetric survey. Ref. [47] uses the DJI Mavic 2 Pro UAV and mentions the difficulty of achieving adequate ground control coverage of the whole landslide area due to terrain instability. If the surveys of the different epochs were performed using the JPEG format images with a built-in lens profile (applied by default by the UAV), the areas with less ground control could be affected during the comparison of DEMs. Applying different geometric lens corrections to images by onboard cameras could also induce alterations in the quantification of terrain displacements. This is the case of [48], in which different low-cost DJI UAVs (Phantom 3 Pro and DJI Mavic Platinum Pro) were used for deformation control in meandering rivers. In addition, ground control covering just one side of the curve line of each meander structure, and the differences in the magnitude of the errors associated with the GCPs following photogrammetric processing between epochs would favour the alteration of the quantified deformations. The quantification of the processes would increase in studies where ground control is not used. That is the case of [49], where the DJI Mavic 2 Pro and DJI Mavic Air UAVs were used to evaluate hazard processes. As demonstrated by [49], the application of these UAVs is sufficient to identify features; however, the reported fixed centimetric accuracies of the surveys may be significantly affected by the image properties and the accuracy of the UAV geolocation device.
Naturally, each photogrammetric project for the study of landform processes will have its requirements. The particular morphology of each landform and its deformation rates will affect flight planning and ground control according to the accuracy required. In the studies mentioned above, the deformation rates of the processes were generally high (several metres), whereas the high-resolution DEMs used to quantify the deformations were of just a few centimetres. This means that even with alterations in the quantification of displacement, the deformation patterns or features, and thus the overall behaviour of the processes, would not be drastically affected.
In studies where there is a trade-off between the resolution of the photogrammetric products and the deformation rates to be determined, the image treatment used in the photogrammetric process could play a fundamental role. According to the results obtained in this study, more than 20 cm differences between DEMs of different image sets (DNG-JPEG) used in La Paúl may camouflage or double the annual variations in the rock glacier over a large part of its surface [27].

6. Conclusions

The use of images with different processing levels to produce high-detail models of landforms, such as the La Paúl rock glacier, has been shown to affect the photogrammetric survey and the need to review primary products. Nevertheless, these variations can be considered insignificant depending on the aim of the photo reconstructions. If the aim is to generate detailed orthophotos for geomorphological mapping, the influence of the image could be reduced to the appearance of the orthomosaic. Nevertheless, if 2.5D or 3D models are generated to monitor landforms, aspects such as the lens distortion corrections that some popular UAVs apply to their images can influence deformation rates even with demanding flight plans.
Deriving from the same photogrammetric flight and identical processing strategies, the surveys of the rock glacier with different image sets should be very similar. That is the case if one observes the errors reported by the photogrammetric software, which does not reflect significant variations between surveys. Comparisons between point clouds with spatially variable 3D precision and comparisons of DEMs with fixed 2D precision, however, have shown significant variations over large areas of the surveys where any of the image sets used would have undergone geometric lens corrections. Significant variations (DNG-JPEG) have reached up to 20% of the surveyed area in the DEMs and 7% between point clouds. In areas with close ground control (RG zone), the significant variations between DEMs are considerably reduced (1%). Nonetheless, the distribution of significant changes in 2.5D models should be treated with caution in high-relief topography such as the La Paúl rock glacier, where the standard deviation of the variations reached 2/3 the grid resolution in the RG zone and twice the grid resolution in the entire survey. Both comparison methods (2D and 3D) showed large areas with displacements of around ±5 cm in the central area of the survey and over ±20 cm (10 times the ground sample distance) on surfaces outside the GCP surroundings. In monitoring studies, these alterations may be wrongly interpreted by debris displacement events leading to mistaken interpretations of the landform behaviour. These results highlight the convenience of using raw images or high-quality images (lossless or low compression), and the cautious use of images that have been automatically modified by build-in lens profiles applied by some low-cost UAV on-board cameras.
The adequate distribution of ground control has shown to reduce the effects of built-in lens profiles in 2D and 3D comparisons if they are not mitigated prior to photogrammetric processing. Parameters that modify image appearance, such as exposure or sharpness, do not lead to variations in the surveys that could significantly affect the periodic monitoring of landform deformations with the detail and complexity present in this study. Despite the similarity or disparity of the photo reconstructions, their geometric accuracy could not be adequately assessed with the TLS benchmark. The differences between the photogrammetric and TLS surveys of irregular surfaces have been shown to be dominated by limitations related to the ground perspective of the sensor, even in the presence of multiple scans.

Supplementary Materials

The following supporting information can be downloaded at: https://www.mdpi.com/article/10.3390/rs14153528/s1. Table S1: Camera calibration coefficients from Agisoft Metashape (v.1.5.5; Agisoft LLC; St. Petersburg, Russia).

Author Contributions

Conceptualisation, A.M.-F. and G.R.-d.L.; data curation, A.M.-F.; formal analysis, A.M.-F.; funding acquisition, E.S. and A.B.-C.; investigation, A.M.-F., E.S., A.P., M.S.-F., J.J.d.S. and M.G.-L.; methodology, A.M.-F.; project administration, E.S. and J.J.d.S.; supervision, E.S. and J.J.d.S.; validation, A.M.-F. and A.B.-C.; visualisation, A.M.-F.; writing—original draft, A.M.-F. and E.S.; writing—review and editing, A.M.-F., E.S., A.P., M.S.-F., G.R.-d.L. and A.B.-C. All authors have read and agreed to the published version of the manuscript.

Funding

The research was supported by the Spanish Ministry of Economy, Industry, and Competitiveness projects CGL2015-68144-R and PID2020-113247RB-C21. The APC was funded by A.B.-C.

Acknowledgments

We thank Viktor Kaufmann and the Institute of Geodesy of the Graz University of Technology for their assistance. We also thank Alan Atkinson, Ibai Rico, Eñaut Izagirre, and Isaac Gurdiel for technical and field support. This work could not have been accomplished without the logistical support of the Department of Geography of the University of Valladolid, and the Digital Mapping and 3D Analysis Laboratory of the CENIEH.

Conflicts of Interest

The authors declare no conflict of interest.

References

  1. Benito-Calvo, A.; Haddoumi, H.; Aouraghe, H.; Oujaa, A.; Chacón, M.G.; Sala-Ramos, R. Geomorphological analysis using small unmanned aerial vehicles and submeter GNSS (Gara Soultana butte, High Plateaus Basin, Eastern Morocco). J. Maps 2020, 16, 459–467. [Google Scholar] [CrossRef]
  2. Brown, A.G.; Fallu, D.; Walsh, K.; Cucchiaro, S.; Tarolli, P.; Zhao, P.; Pears, B.R.; van Oost, K.; Snape, L.; Lang, A.; et al. Ending the Cinderella status of terraces and lynchets in Europe: The geomorphology of agricultural terraces and implications for ecosystem services and climate adaptation. Geomorphology 2021, 379, 107579. [Google Scholar] [CrossRef]
  3. de Sanjosé Blasco, J.J.; Serrano-Cañadas, E.; Sánchez-Fernández, M.; Gómez-Lende, M.; Redweik, P. Application of Multiple Geomatic Techniques for Coastline Retreat Analysis: The Case of Gerra Beach (Cantabrian Coast, Spain). Remote Sens. 2020, 12, 3669. [Google Scholar] [CrossRef]
  4. Granados-Bolaños, S.; Quesada-Román, A.; Alvarado, G.E. Low-cost UAV applications in dynamic tropical volcanic landforms. J. Volcanol. Geotherm. Res. 2021, 410, 107143. [Google Scholar] [CrossRef]
  5. Ewertowski, M.W.; Tomczyk, A.M.; Evans, D.J.A.; Roberts, D.H.; Ewertowski, W. Operational Framework for Rapid, Very-high Resolution Mapping of Glacial Geomorphology Using Low-cost Unmanned Aerial Vehicles and Structure-from-Motion Approach. Remote Sens. 2019, 11, 65. [Google Scholar] [CrossRef] [Green Version]
  6. Santos-González, J.; González-Gutiérrez, R.B.; Redondo-Vega, J.M.; Gómez-Villar, A.; Jomelli, V.; Fernández-Fernández, J.M.; Andrés, N.; García-Ruiz, J.M.; Peña-Pérez, S.A.; Melón-Nava, A.; et al. The origin and collapse of rock glaciers during the Bølling-Allerød interstadial: A new study case from the Cantabrian Mountains (Spain). Geomorphology 2022, 401, 108112. [Google Scholar] [CrossRef]
  7. Vidaller, I.; Revuelto, J.; Izagirre, E.; Rojas-Heredia, F.; Alonso-González, E.; Gascoin, S.; René, P.; Berthier, E.; Rico, I.; Moreno, A.; et al. Toward an Ice-Free Mountain Range: Demise of Pyrenean Glaciers During 2011–2020. Geophys. Res. Lett. 2021, 48, e2021GL094339. [Google Scholar] [CrossRef]
  8. Lague, D.; Brodu, N.; Leroux, J. Accurate 3D comparison of complex topography with terrestrial laser scanner: Application to the Rangitikei canyon (N-Z). ISPRS J. Photogramm. Remote Sens. 2013, 82, 10–26. [Google Scholar] [CrossRef] [Green Version]
  9. Harris, C.; Arenson, L.U.; Christiansen, H.H.; Etzelmüller, B.; Frauenfelder, R.; Gruber, S.; Haeberli, W.; Hauck, C.; Hölzle, M.; Humlum, O.; et al. Permafrost and climate in Europe: Monitoring and modelling thermal, geomorphological and geotechnical responses. Earth-Sci. Rev. 2009, 92, 117–171. [Google Scholar] [CrossRef] [Green Version]
  10. Oliva, M.; Serrano, E.; Gómez-Ortiz, A.; González-Amuchastegui, M.J.; Nieuwendam, A.; Palacios, D.; Pérez-Alberti, A.; Pellitero-Ondicol, R.; Ruiz-Fernández, J.; Valcárcel, M.; et al. Spatial and temporal variability of periglaciation of the Iberian Peninsula. Quat. Sci. Rev. 2016, 137, 176–199. [Google Scholar] [CrossRef]
  11. Serrano, E.; Oliva, M.; González-García, M.; López-Moreno, J.I.; González-Trueba, J.; Martín-Moreno, R.; Gómez-Lende, M.; Martín-Díaz, J.; Nofre, J.; Palma, P. Post-little ice age paraglacial processes and landforms in the high Iberian mountains: A review. Land Degrad. Dev. 2018, 29, 4186–4208. [Google Scholar] [CrossRef] [Green Version]
  12. Serrano, E.; de Sanjosé-Blasco, J.J.; Gómez-Lende, M.; López-Moreno, J.I.; Pisabarro, A.; Martínez-Fernández, A. Periglacial environments and frozen ground in the central Pyrenean high mountain area: Ground thermal regime and distribution of landforms and processes. Permafr. Periglac. Process. 2019, 30, 292–309. [Google Scholar] [CrossRef]
  13. Śledź, S.; Ewertowski, M.W.; Piekarczyk, J. Applications of unmanned aerial vehicle (UAV) surveys and Structure from Motion photogrammetry in glacial and periglacial geomorphology. Geomorphology 2021, 378, 107620. [Google Scholar] [CrossRef]
  14. Tmušić, G.; Manfreda, S.; Aasen, H.; James, M.R.; Gonçalves, G.; Ben-Dor, E.; Brook, A.; Polinova, M.; Arranz, J.J.; Mészáros, J.; et al. Current practices in UAS-based environmental monitoring. Remote Sens. 2020, 12, 1001. [Google Scholar] [CrossRef] [Green Version]
  15. Gaffey, C.; Bhardwaj, A. Applications of unmanned aerial vehicles in cryosphere: Latest advances and prospects. Remote Sens. 2020, 12, 948. [Google Scholar] [CrossRef] [Green Version]
  16. James, M.R.; Chandler, J.H.; Eltner, A.; Fraser, C.; Miller, P.E.; Mills, J.P.; Noble, T.; Robson, S.; Lane, S.N. Guidelines on the use of structure-from-motion photogrammetry in geomorphic research. Earth Surf. Process. Landf. 2019, 44, 2081–2084. [Google Scholar] [CrossRef]
  17. Casella, V.; Chiabrando, F.; Franzini, M.; Manzino, A.M. Accuracy Assessment of a UAV Block by Different Software Packages, Processing Schemes and Validation Strategies. ISPRS Int. J. Geo-Inf. 2020, 9, 164. [Google Scholar] [CrossRef] [Green Version]
  18. Hendrickx, H.; Vivero, S.; De Cock, L.; De Wit, B.; De Maeyer, P.; Lambiel, C.; Delaloye, R.; Nyssen, J.; Frankl, A. The reproducibility of SfM algorithms to produce detailed Digital Surface Models: The example of PhotoScan applied to a high-alpine rock glacier. Remote Sens. Lett. 2019, 10, 11–20. [Google Scholar] [CrossRef] [Green Version]
  19. James, M.R.; Robson, S.; D’Oleire-Oltmanns, S.; Niethammer, U. Optimising UAV topographic surveys processed with structure-from-motion: Ground control quality, quantity and bundle adjustment. Geomorphology 2017, 280, 51–66. [Google Scholar] [CrossRef] [Green Version]
  20. James, M.R.; Robson, S.; Smith, M.W. 3-D uncertainty-based topographic change detection with structure-from-motion photogrammetry: Precision maps for ground control and directly georeferenced surveys. Earth Surf. Process. Landf. 2017, 42, 1769–1788. [Google Scholar] [CrossRef]
  21. Alfio, V.S.; Costantino, D.; Pepe, M. Influence of Image TIFF Format and JPEG Compression Level in the Accuracy of the 3D Model and Quality of the Orthophoto in UAV Photogrammetry. J. Imaging 2020, 6, 30. [Google Scholar] [CrossRef] [PubMed]
  22. Ulrich, V.; Williams, J.G.; Zahs, V.; Anders, K.; Hecht, S.; Höfle, B. Measurement of rock glacier surface change over different timescales using terrestrial laser scanning point clouds. Earth Surf. Dyn. 2021, 9, 19–28. [Google Scholar] [CrossRef]
  23. Serrano, E.; Agudo, C.; Delaloyé, R.; González-Trueba, J.J. Permafrost distribution in the Posets massif, Central Pyrenees. Nor. Geogr. Tidsskr. Nor. J. Geogr. 2010, 55, 245–252. [Google Scholar] [CrossRef]
  24. Serrano, E. The existing glaciers of the Iberian Peninsula: The Central Pyrenees. Iberia Land Glaciers 2022, 525–553. [Google Scholar] [CrossRef]
  25. Serrano, E.; de Sanjosé, J.J.; González-Trueba, J.J. Rock glacier dynamics in marginal periglacial environments. Earth Surf. Process. Landf. 2010, 35, 1302–1314. [Google Scholar] [CrossRef]
  26. Lugon, R.; Delaloye, R.; Serrano, E.; Reynard, E.; Lambiel, C.; González-Trueba, J.J. Permafrost and Little Ice Age glacier relationships, Posets Massif, Central Pyrenees, Spain. Permafr. Periglac. Process. 2004, 15, 207–220. [Google Scholar] [CrossRef]
  27. Martínez-Fernández, A.; Serrano, E.; Sanjosé, J.J.; Gómez-Lende, M.; Pisabarro, A.; Sánchez, M. Geomatic methods applied to the change study of the La Paúl rock glacier, Spanish Pyrenees. Int. Arch. Photogramm. Remote Sens. Spat. Inf. Sci. 2019, XLII-2/W13, 1771–1775. [Google Scholar] [CrossRef] [Green Version]
  28. CNIG. Centro de Descargas National Center for Geographic Information. Centro de Descagas del CNIG. 2019. Available online: https://centrodedescargas.cnig.es/CentroDescargas/index.jsp (accessed on 23 September 2020).
  29. Harwin, S.; Lucieer, A.; Osborn, J. The Impact of the Calibration Method on the Accuracy of Point Clouds Derived Using Unmanned Aerial Vehicle Multi-View Stereopsis. Remote Sens. 2015, 7, 11933–11953. [Google Scholar] [CrossRef] [Green Version]
  30. Nesbit, P.; Hugenholtz, C. Enhancing UAV–SfM 3D Model Accuracy in High-Relief Landscapes by Incorporating Oblique Images. Remote Sens. 2019, 11, 239. [Google Scholar] [CrossRef] [Green Version]
  31. O’Connor, J.; Smith, M.J.; James, M.R. Cameras and settings for aerial surveys in the geosciences. Prog. Phys. Geogr. Earth Environ. 2017, 41, 325–344. [Google Scholar] [CrossRef] [Green Version]
  32. Rangel, J.M.G.; Gonçalves, G.R.; Pérez, J.A. The impact of number and spatial distribution of GCPs on the positional accuracy of geospatial products derived from low-cost UASs. Int. J. Remote Sens. 2018, 39, 7154–7171. [Google Scholar] [CrossRef]
  33. Martínez-Carricondo, P.; Agüera-Vega, F.; Carvajal-Ramírez, F.; Mesas-Carrascosa, F.J.; García-Ferrer, A.; Pérez-Porras, F.J. Assessment of UAV-photogrammetric mapping accuracy based on variation of ground control points. Int. J. Appl. Earth Obs. Geoinf. 2018, 72, 1–10. [Google Scholar] [CrossRef]
  34. ERGNSS. Red Geodésica Nacional de Estaciones de Referencia GNSS (ERGNSS)—IGN. 2020. Available online: https://www.ign.es/web/ign/portal/gds-gnss-estaciones-permanentes (accessed on 23 September 2020).
  35. James, M.R.; Antoniazza, G.; Robson, S.; Lane, S.N. Mitigating systematic error in topographic models for geomorphic change detection: Accuracy, precision and considerations beyond off-nadir imagery. Earth Surf. Process. Landf. 2020, 45, 2251–2271. [Google Scholar] [CrossRef]
  36. USGS NUPO Materials. Processing UAS Imagery Using Agisoft Photoscan. USGS National Unmanned Aircraft Systems Project Office (NUPO) Materials. 2021. Available online: https://uas.usgs.gov/nupo/pdf/BauerPhotoscanNASAMarch2017.pdf (accessed on 24 September 2020).
  37. P4P Color Profiles. GitHub-Darana/P4P__Color-Profiles: Color Profiles for the Phantom 4 Pro Drone. 2017. Available online: https://github.com/darana/P4P__color-profiles (accessed on 5 April 2021).
  38. USGS NUPO Materials. USGS Agisoft PhotoScan Workflow. USGS National Unmanned Aircraft Systems Project Office (NUPO) Materials. 2021. Available online: https://uas.usgs.gov/nupo/pdf/USGSAgisoftPhotoScanWorkflow.pdf (accessed on 19 September 2020).
  39. Agisoft Beginner Level Tutorials. Orthophoto & DEM Generation (with GCPs). 2020. Available online: https://www.agisoft.com/support/tutorials/beginner-level/ (accessed on 23 April 2020).
  40. QGIS. Development Team. QGIS Geographic Information System. Open Source Geospatial Foundation Project. 2019. Available online: http://qgis.osgeo.org (accessed on 9 June 2022).
  41. Benito-Calvo, A.; Gutiérrez, F.; Martínez-Fernández, A.; Carbonel, D.; Karampaglidis, T.; Desir, G.; Sevil, J.; Guerrero, J.; Fabregat, I.; García-Arnay, Á. 4D Monitoring of Active Sinkholes with a Terrestrial Laser Scanner (TLS): A Case Study in the Evaporite Karst of the Ebro Valley, NE Spain. Remote Sens. 2018, 10, 571. [Google Scholar] [CrossRef] [Green Version]
  42. Martínez-Fernández, A.; Benito-Calvo, A.; Campaña, I.; Ortega, A.I.; Karampaglidis, T.; Bermúdez de Castro, J.M.; Carbonell, E. 3D monitoring of Paleolithic archaeological excavations using terrestrial laser scanner systems (Sierra de Atapuerca, Railway Trench sites, Burgos, N Spain). Digit. Appl. Archaeol. Cult. Herit. 2020, 19, e00156. [Google Scholar] [CrossRef]
  43. CloudCompare. CloudCompare (Version 2.11) [GPL Software]. 2020. Available online: http://www.cloudcompare.org/ (accessed on 9 June 2022).
  44. RGIK. Towards Standard Guidelines for Inventorying Rock Glaciers: Baseline Concepts; Version 4.2; IPA Action Group Rock Glacier Inventories and Kinematics, Ed.; University of Fribourg: Fribourg, Switzerland, 2021; p. 13. [Google Scholar]
  45. Groh, T.; Blöthe, J.H. Rock Glacier Kinematics in the Kaunertal, Ötztal Alps, Austria. Geosciences 2019, 9, 373. [Google Scholar] [CrossRef] [Green Version]
  46. Zahs, V.; Hämmerle, M.; Anders, K.; Hecht, S.; Sailer, R.; Rutzinger, M.; Williams, J.G.; Höfle, B. Multi-temporal 3D point cloud-based quantification and analysis of geomorphological activity at an alpine rock glacier using airborne and terrestrial LiDAR. Permafr. Periglac. Process. 2019, 30, 222–238. [Google Scholar] [CrossRef]
  47. Koutalakis, P.D.; Tzoraki, O.A.; Prazioutis, G.I.; Gkiatas, G.T.; Zaimes, G.N. Can Drones Map Earth Cracks? Landslide Measurements in North Greece Using UAV Photogrammetry for Nature-Based Solutions. Sustainability 2021, 13, 4697. [Google Scholar] [CrossRef]
  48. Akay, S.S.; Özcan, O.; Sanli, F.B.; Görüm, T.; Sen, Ö.L.; Bayram, B. UAV-based evaluation of morphological changes induced by extreme rainfall events in meandering rivers. PLoS ONE 2020, 15, e0241293. [Google Scholar] [CrossRef]
  49. Ybañez, R.L.; Ybañez, A.A.B.; Lagmay, A.M.F.A.; Aurelio, M.A. Imaging ground surface deformations in post-disaster settings via small UAVs. Geosci. Lett. 2021, 8, 23. [Google Scholar] [CrossRef]
Figure 1. Study site. (A) Rock glacier location (EPSG: 25831). (B) Rock glacier and surroundings image in 2019.
Remotesensing 14 03528 g001
Figure 2. Data collection design and extension. (A) UAV flight design, image overlap, and area surveyed during the photogrammetric flight. (B) Ground control points location used in the UAV flights over the surveyed area. (C) TLS benchmark surveyed area and scan placements.
Remotesensing 14 03528 g002
Figure 3. Levels of detail and geometric characteristics of the terrain in the photo reconstruction with JPEG images. (A) Surface extensions analysed. Photogrammetric survey, rock glacier zone (RG zone), and sectors (S). (B) Survey roughness (sphere 0.3 m radius) and slope (from point cloud normals) values.
Remotesensing 14 03528 g003
Figure 4. Effect of image properties on the appearance of photographs and 3D surveys. (A) Detail of the images used in the photogrammetric reconstructions. DNG: Raw imagery from DJI Mavic 2 Pro UAV (Hasselblad L1D-20c camera). JPEG: Imagery processed by the UAV camera. TIFF.def: Imagery with build-in lens profile removed and automatic parameters modification from the image editing software. TIFF.mod: Imagery with build-in lens profile removed and user-defined parameters. (B) Top view of the dense point clouds from the photogrammetric reconstruction for each image set.
Remotesensing 14 03528 g004
Figure 5. Three-dimensional variable precision distribution and values of the SfM surveys. Yellow colors represent high-precision points; purple colors represent lower-precision points. Overall and rock glacier mean precisions are displayed. (A) Dense cloud horizontal precision (σXY). (B) Dense cloud vertical precision (σZ).
Remotesensing 14 03528 g005
Figure 6. M3C2-PM 3D comparisons between SfM surveys. (A) M3C2-PM distances values and distribution (distances less than −0.05 m are shown in blue and distances greater than 0.05 m in red). Significant change values and distribution (significant changes are shown in red). (B) M3C2-PM distances (mean and SD) and significant change percentages in the different rock glacier sectors.
Remotesensing 14 03528 g006
Figure 7. Detail of the M3C2-PM comparison between image sets (sector 3). M3C2-PM distances less than −0.05 m are shown in blue and distances greater than 0.05 m are shown in red. M3C2-PM significant changes are shown in red.
Remotesensing 14 03528 g007
Figure 8. Values of geometric attributes, precisions, and comparisons of SfM surveys in the studied areas.
Remotesensing 14 03528 g008
Figure 9. DEM of difference (DoD) distances and significant change identification. Mean and standard deviation values of the entire survey and RG zone are shown (all the surveys were cropped according to the extent of the JPEG reconstruction). DoD distances equal or less than −0.2 m are shown in blue and distances equal or greater than 0.2 m are shown in red. DoD significant changes (LoD95%) are shown in red color. (A) DNG to JPEG DoD comparison. (B) DNG to TIFF.def and TIFF.mod DoD comparison. At the level of detail presented, there is no difference between TIFF.def and TIFF.mod; therefore, only one figure is shown.
Remotesensing 14 03528 g009
Figure 10. M3C2-PM comparisons between TLS and SfM surveys. Distances less than −0.2 m are shown in blue and distances greater than 0.2 m are shown in red. Significant changes are shown in red. (A) M3C2-PM distances and significant change values and distribution. M3C2-PM distances show predominantly negative values due to the top viewpoint of the survey. At the level of detail presented, there is no difference between TLS and SfM surveys. Therefore, only the TLS-DNG comparison image is shown. (B) Detail of the differences between TLS-DNG reconstructions in S8.
Remotesensing 14 03528 g010
Table 1. UAV camera and photogrammetric survey characteristics.
Camera Specs and Parameters
ModelHasselblad L1D-20cSensor1″ CMOS (20 MP)
Focal length (mm)28 (35 mm equivalent);
10.26 (true focal length)
Vel. Obturator (seg.)1/800-1/1250
Lens aperturef/7.1ISO100
Image size (pix; format)5472 × 3078; JPEG
5464 × 3070; DNG
Image bit depth (bit; format)8; JPEG
16; DNG
Flight Design
Phase 1: Nadiral imageryPhase 2: Oblique imagery
Camera tilt to the vertical (°)0Strip strategyPerpendicular to the tongueCamera tilt to the vertical (°)25Strip strategyParallel to the tongue
AGL altitude (m)78.6GSD (mm)20AGL altitude (m)88.4GSD (mm)22.5
Image overlap (forward-side; %)80-80Number of images303Image overlap (forward-side; %)70-65Number of images125
Ground Control
Number of GCP12GCP dimensions (m)1 × 1
GCP measurement methoddGNSS-RTK base and rover. Post-processing through permanent station networkMin/max GCPs precision (XY, Z; mm)±6/±16
±12/±25
Table 2. Agisoft Metashape workflow and parameters based on Agisoft tutorials [39]. Parameters modified or not present in the Agisoft tutorial are shown in italics.
Steps and Parameters
1. Add photos
2. Set coordinate system
3. Camera calibration checks
Unique camera group; check on: ‘Enable rolling shuttter compensation’
4. Align photos
High accuracy; generic and reference preselection; 40K key points limit; 4K tie-point limit; adaptive camera model fitting
5. Place markers
6. Input marker GNSS-RTK coordinates and accuracy
7. Remove tie points with the highest reprojection error values
About the 5% of the tie points
8. Set image coordinates’ accuracy
0.1 pix marker accuracy; 1 pix tie-point accuracy
9. Optimize camera alignment
Disable image coordinates; adaptative camera model fitting
10. Generate dense cloud
High quality; aggressive depth filtering; calculate point colors
Table 3. Agisoft Metashape tie points and markers root mean square errors of each image set.
Bundle Adjustment RMSEs
DNGJPGTIFF.defTIFF.mod
Reproj. Error (pix)0.4120.4460.390.409
GCPs XY (mm)24242424
GCPs Z (mm)32373232
GCPs 3D (mm)40444140
GCPs Image (pix)0.190.2680.1970.189
Table 4. Survey tie-point precision values extracted from the Monte Carlo analysis for each of the image sets. Full involves photogrammetric and georeferencing considerations. Shape only involves photogrammetric considerations.
DNGJPGTIFF.defTIFF.mod
Survey overall mean tie-point precision
Full (XY; Z, mm)119.59; 185.77 116.0; 199.0113.1; 176.3117.5; 188.0
Shape (XY; Z, mm)119.2; 184.2115.7; 197.7112.7; 174.8117.3; 186.5
Survey overall georeferencing precision
Translation (XY; Z, mm)6.41; 8.065.88; 7.86.39; 8.066.58; 8.6
Slope (angles to X; Y; Z axes; mdeg) Rotation (as Euler angles)3.8; 8.08; 3.133.8; 8.3; 3.13.89; 8.27; 3.14.2; 8.5; 3.2
Scale (%)0.00370.00350.00360.0037
Table 5. Summary of 3D comparisons between the photogrammetric surveys of the different image sets in the areas studied. Mean and standard deviation of the differences are shown, as well as the percentage of points where the differences are significant (95% confidence level).
M3C2-PM Distances
(Mean ± SD; mm)
M3C2-PM Distances
(Significant Change; % of Points)
DNG-JPGDNG-TIFF.defDNG-TIFF.modDNG-JPGDNG-TIFF.defDNG-TIFF.mod
Survey26 ± 776 ± 278 ± 27700
RG3 ± 284 ± 125 ± 11711
S16 ± 185 ± 136 ± 13321
S2−9 ± 261 ± 212 ± 18522
S318 ± 154 ± 114 ± 10821
S43 ± 333 ± 234 ± 22533
S5−5 ± 233 ± 175 ± 14211
S614 ± 133 ± 95 ± 8311
S74 ± 213 ± 196 ± 19433
S8−7 ± 224 ± 187 ± 16321
S98 ± 162 ± 126 ± 11322
S102 ± 93 ± 76 ± 7100
S115 ± 163 ± 134 ± 10311
S12−3 ± 72 ± 54 ± 5000
Table 6. Summary of 2.5D comparisons between the photogrammetric surveys of the different image sets in the areas studied. Mean and standard deviation of the differences are shown, as well as the percentage of pixels where the differences are significant (95% confidence level).
DoD Distances
(Mean ± SD; mm)
DoD Distances
(Significant Change; % of Pixels)
DNG-JPGDNG-TIFF.defDNG-TIFF.modDNG-JPGDNG-TIFF.defDNG-TIFF.mod
Survey35 ± 1048 ± 4110 ± 422022
RG4 ± 355 ± 176 ± 14100
S17 ± 24.16 ± 188 ± 19000
S2−12 ± 391 ± 303 ± 26000
S321 ± 165 ± 145 ± 12000
S43 ± 485 ± 325 ± 31000
S5−7 ± 315 ± 247 ± 20000
S616 ± 164 ± 146 ± 12000
S74 ± 423 ± 147 ± 41000
S8−8 ± 296 ± 269 ± 23000
S99 ± 223 ± 187 ± 16000
S102 ± 124 ± 127 ± 11000
S117 ± 254 ± 216 ± 18000
S12−4 ± 103 ± 105 ± 10000
Table 7. Summary of 3D comparisons between the TLS survey and the photogrammetric surveys of the different image sets in the areas studied. Mean and standard deviation of the differences are shown, as well as the percentage of points where the differences are significant (95% confidence level).
M3C2-PM Distances
(Mean ± SD; mm)
M3C2-PM Distances
(Significant Change; % of Points)
TLS-DNGTLS-JPGTLS-TIFF.defTLS-TIFF.modTLS-DNGTLS-JPGTLS-TIFF.defTLS-TIFF.mod
Survey2 ± 1538 ± 1558 ± 1508 ± 15315141415
RG−8 ± 162−5 ± 158−2 ± 157−2 ± 16118171718
S1−24 ± 155−19 ± 145−17 ± 152−17 ± 15317141617
S26 ± 208−1 ± 1998 ± 2018 ± 20628262627
S3−51 ± 140−28 ± 131−43 ± 135−45 ± 14017131516
S4−13 ± 223−5 ± 211−7 ± 214−8 ± 21727222427
S510 ± 2328 ± 22114 ± 22514 ± 23027272826
S6−47 ± 150−29 ± 141−42 ± 145−41 ± 14922151920
S7−37 ± 147−26 ± 137−28 ± 135−28 ± 14120151717
S850 ± 25545 ± 24755 ± 24856 ± 25433323330
S9−50 ± 125−37 ± 117−43 ± 119−43 ± 12220141617
S1013 ± 10817 ± 10317 ± 10419 ± 1071091010
S1128 ± 18536 ± 18033 ± 18032 ± 18426262627
S12−11 ± 76−13 ± 73−7 ± 74−7 ± 776566
Publisher’s Note: MDPI stays neutral with regard to jurisdictional claims in published maps and institutional affiliations.