
Hydrothermal Alteration Mapping Using Landsat 8 and ASTER Data and Geochemical Characteristics of Precambrian Rocks in the Egyptian Shield: A Case Study from Abu Ghalaga, Southeastern Desert, Egypt

 ,
, 
 ,
, 
Abstract
1. Introduction
2. Materials
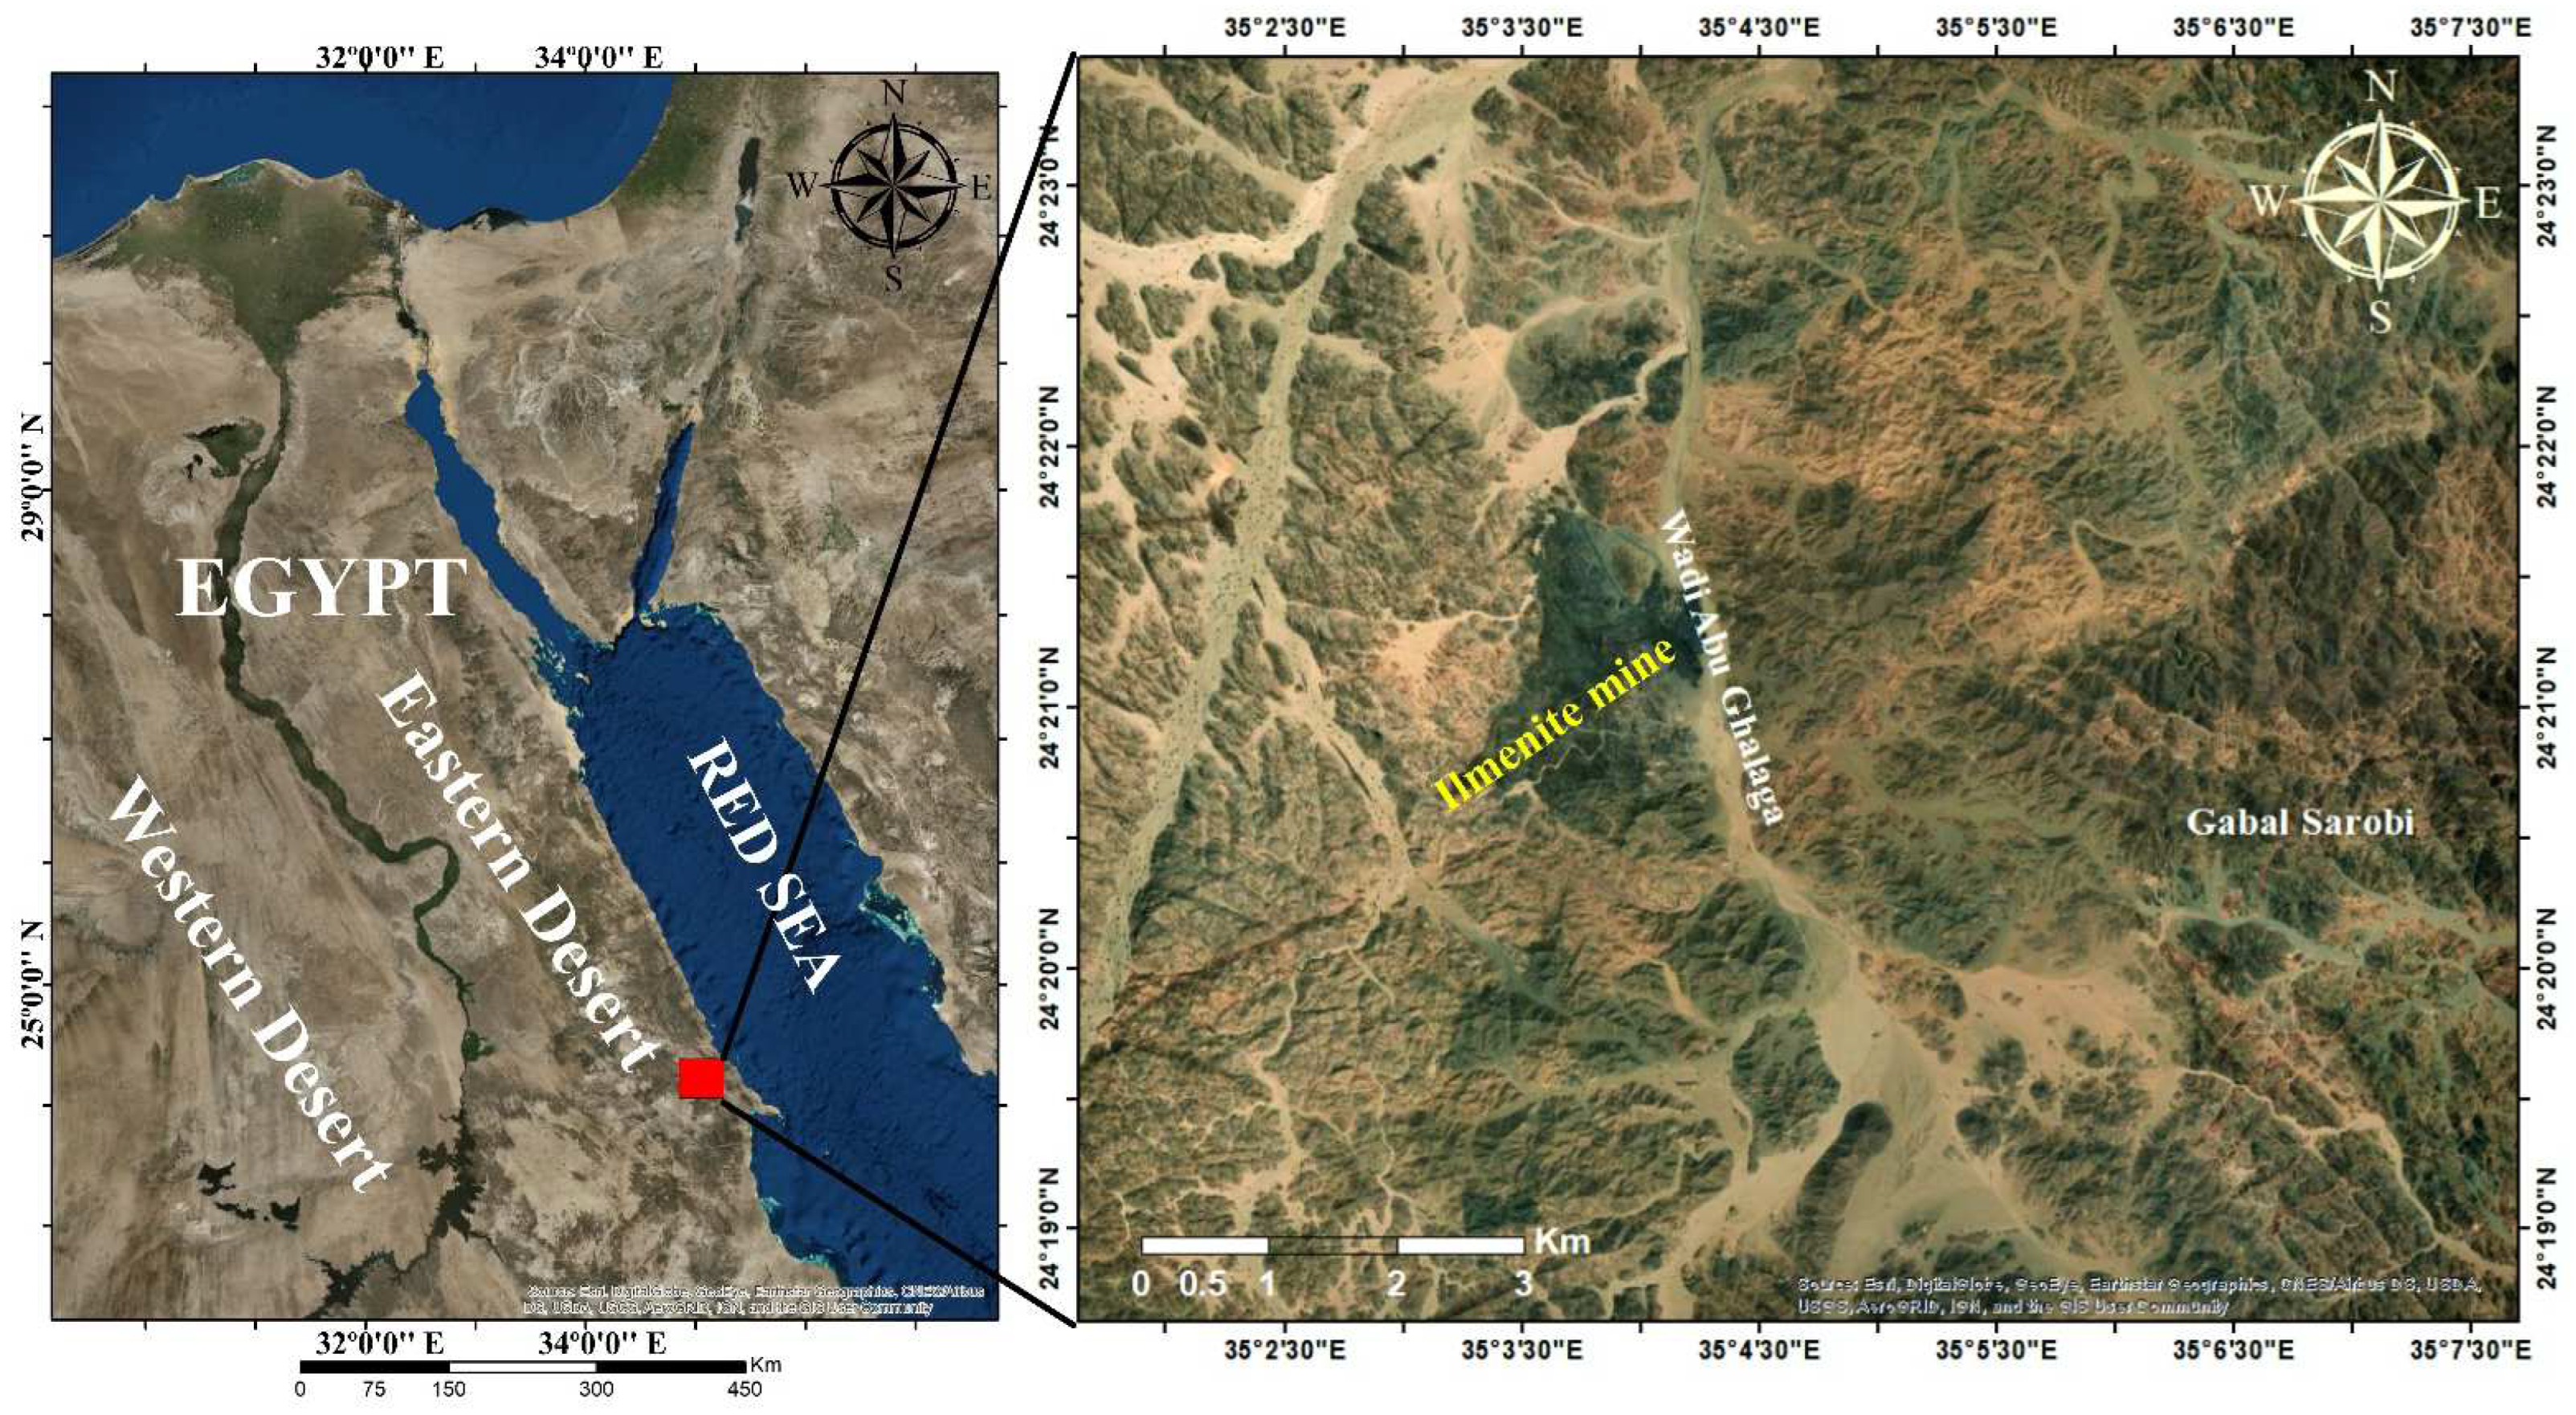
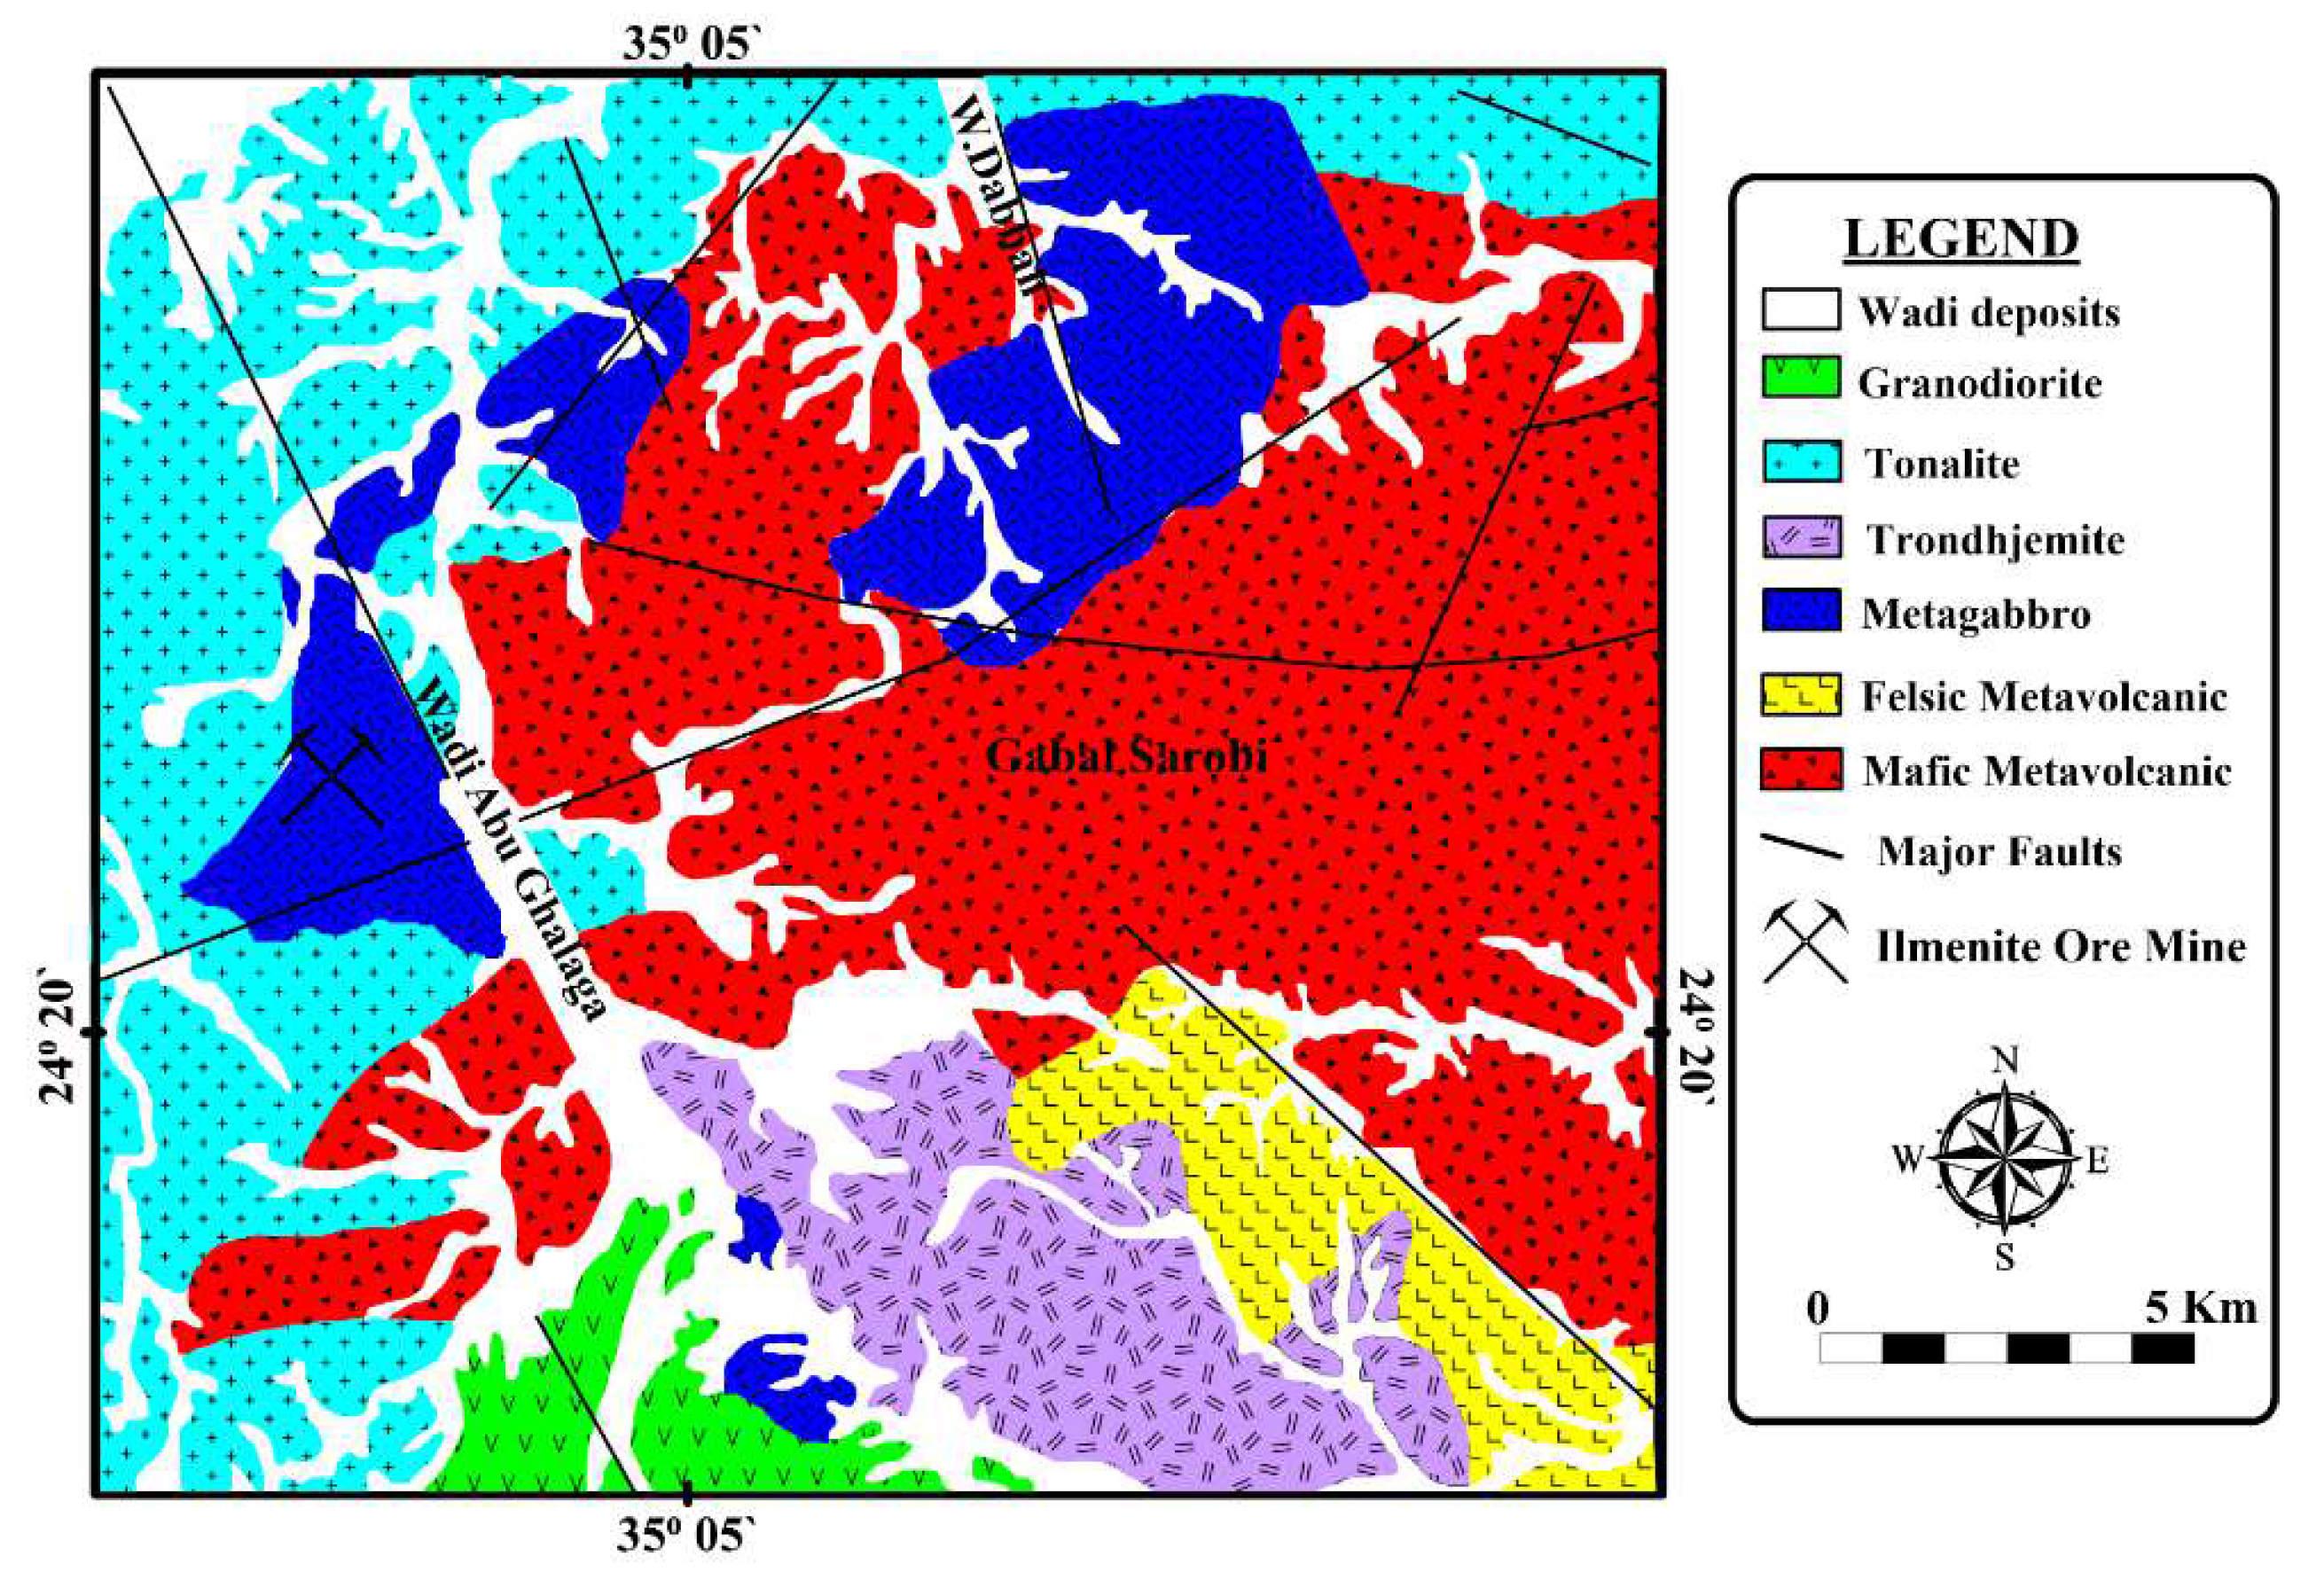
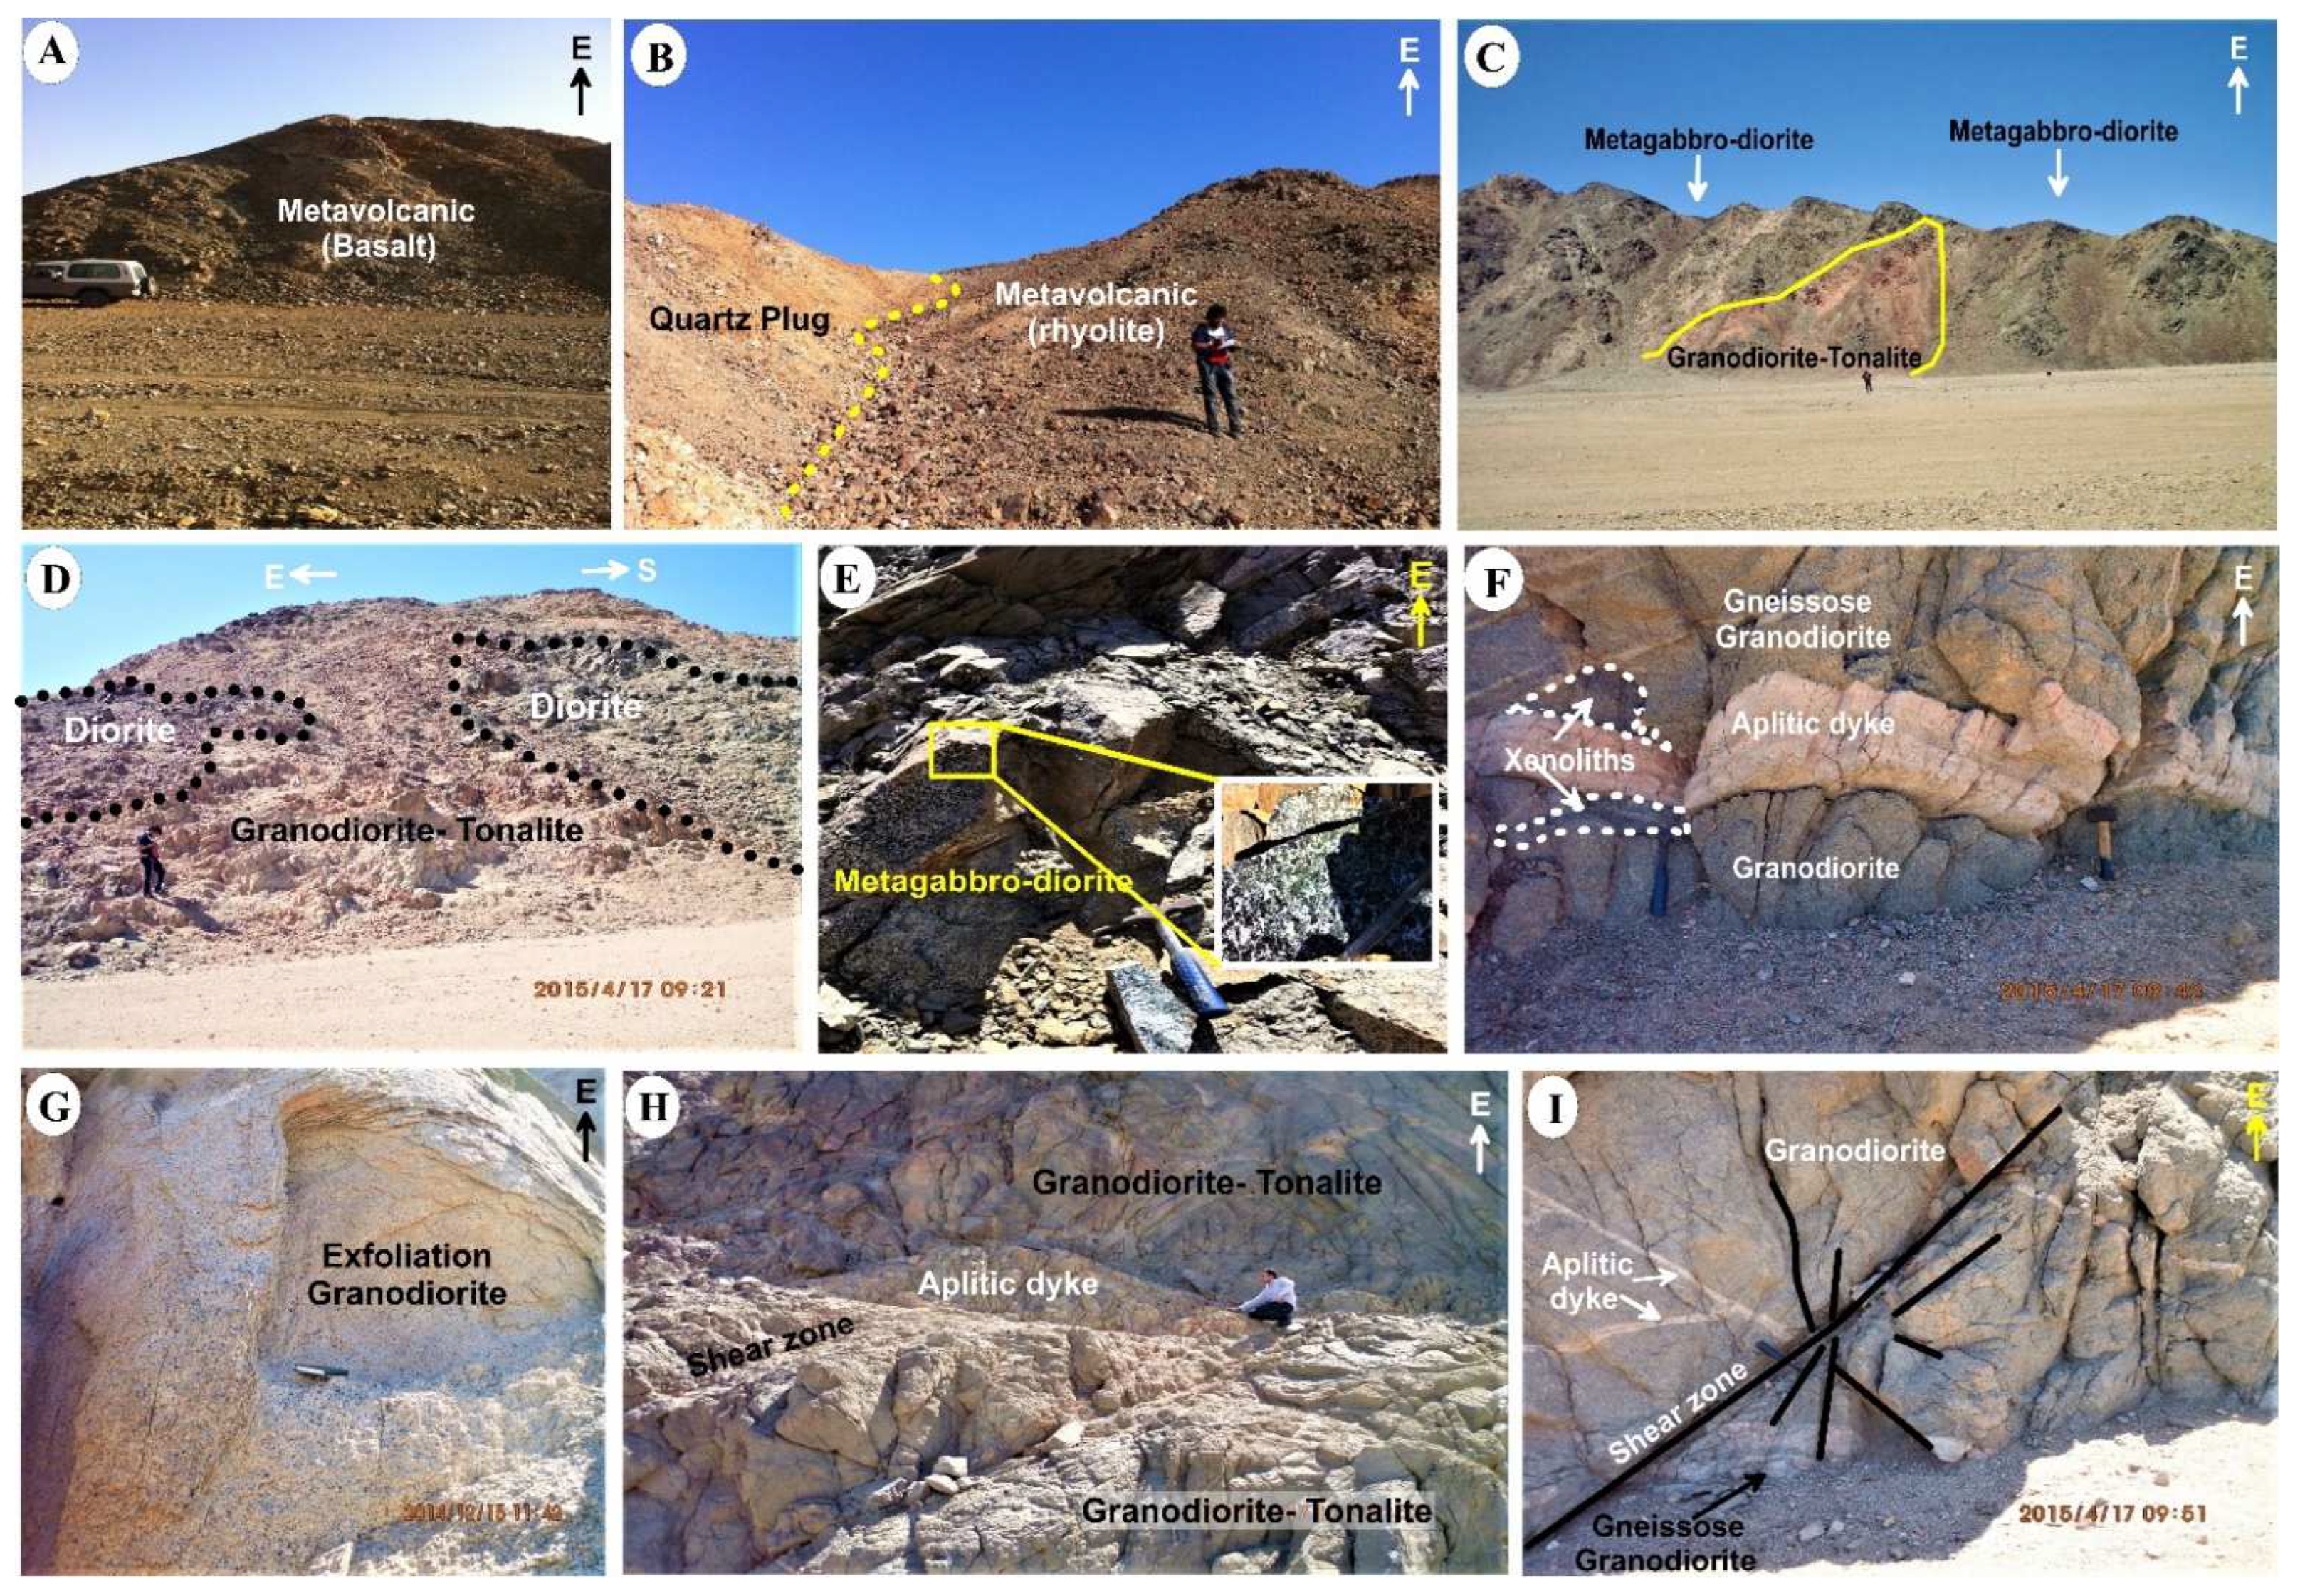
Geologic Setting
- Dykes (youngest).
- Gneissose granitite (granodiorite–tonalite).
- Arc metagabbro–diorite.
- Arc metavolcanics (basalt–rhyolite) (oldest).
3. Methodology
3.1. Landsat Imagery
3.2. Advanced Spaceborne Thermal Emission and Reflection Radiometer (ASTER) Imagery
3.3. Digital Elevation Model
3.4. Preprocessing
- Lλ represents the cell value as radiance
- DN is the cell value for digital number
- gain represents the gain value for the specific band
- bias represents the bias value for the specific band
- Pλ represents unitless planetary reflectance
- Lλ represents spectral radiance
- d is the Earth–Sun distance in astronomical units
- ϴs represents the solar zenith angle
3.5. Image Processing
3.5.1. Band Ratio
3.5.2. Principal Component Analysis
3.5.3. Lineament Extraction
3.6. Fieldwork and Laboratory Techniques
4. Results
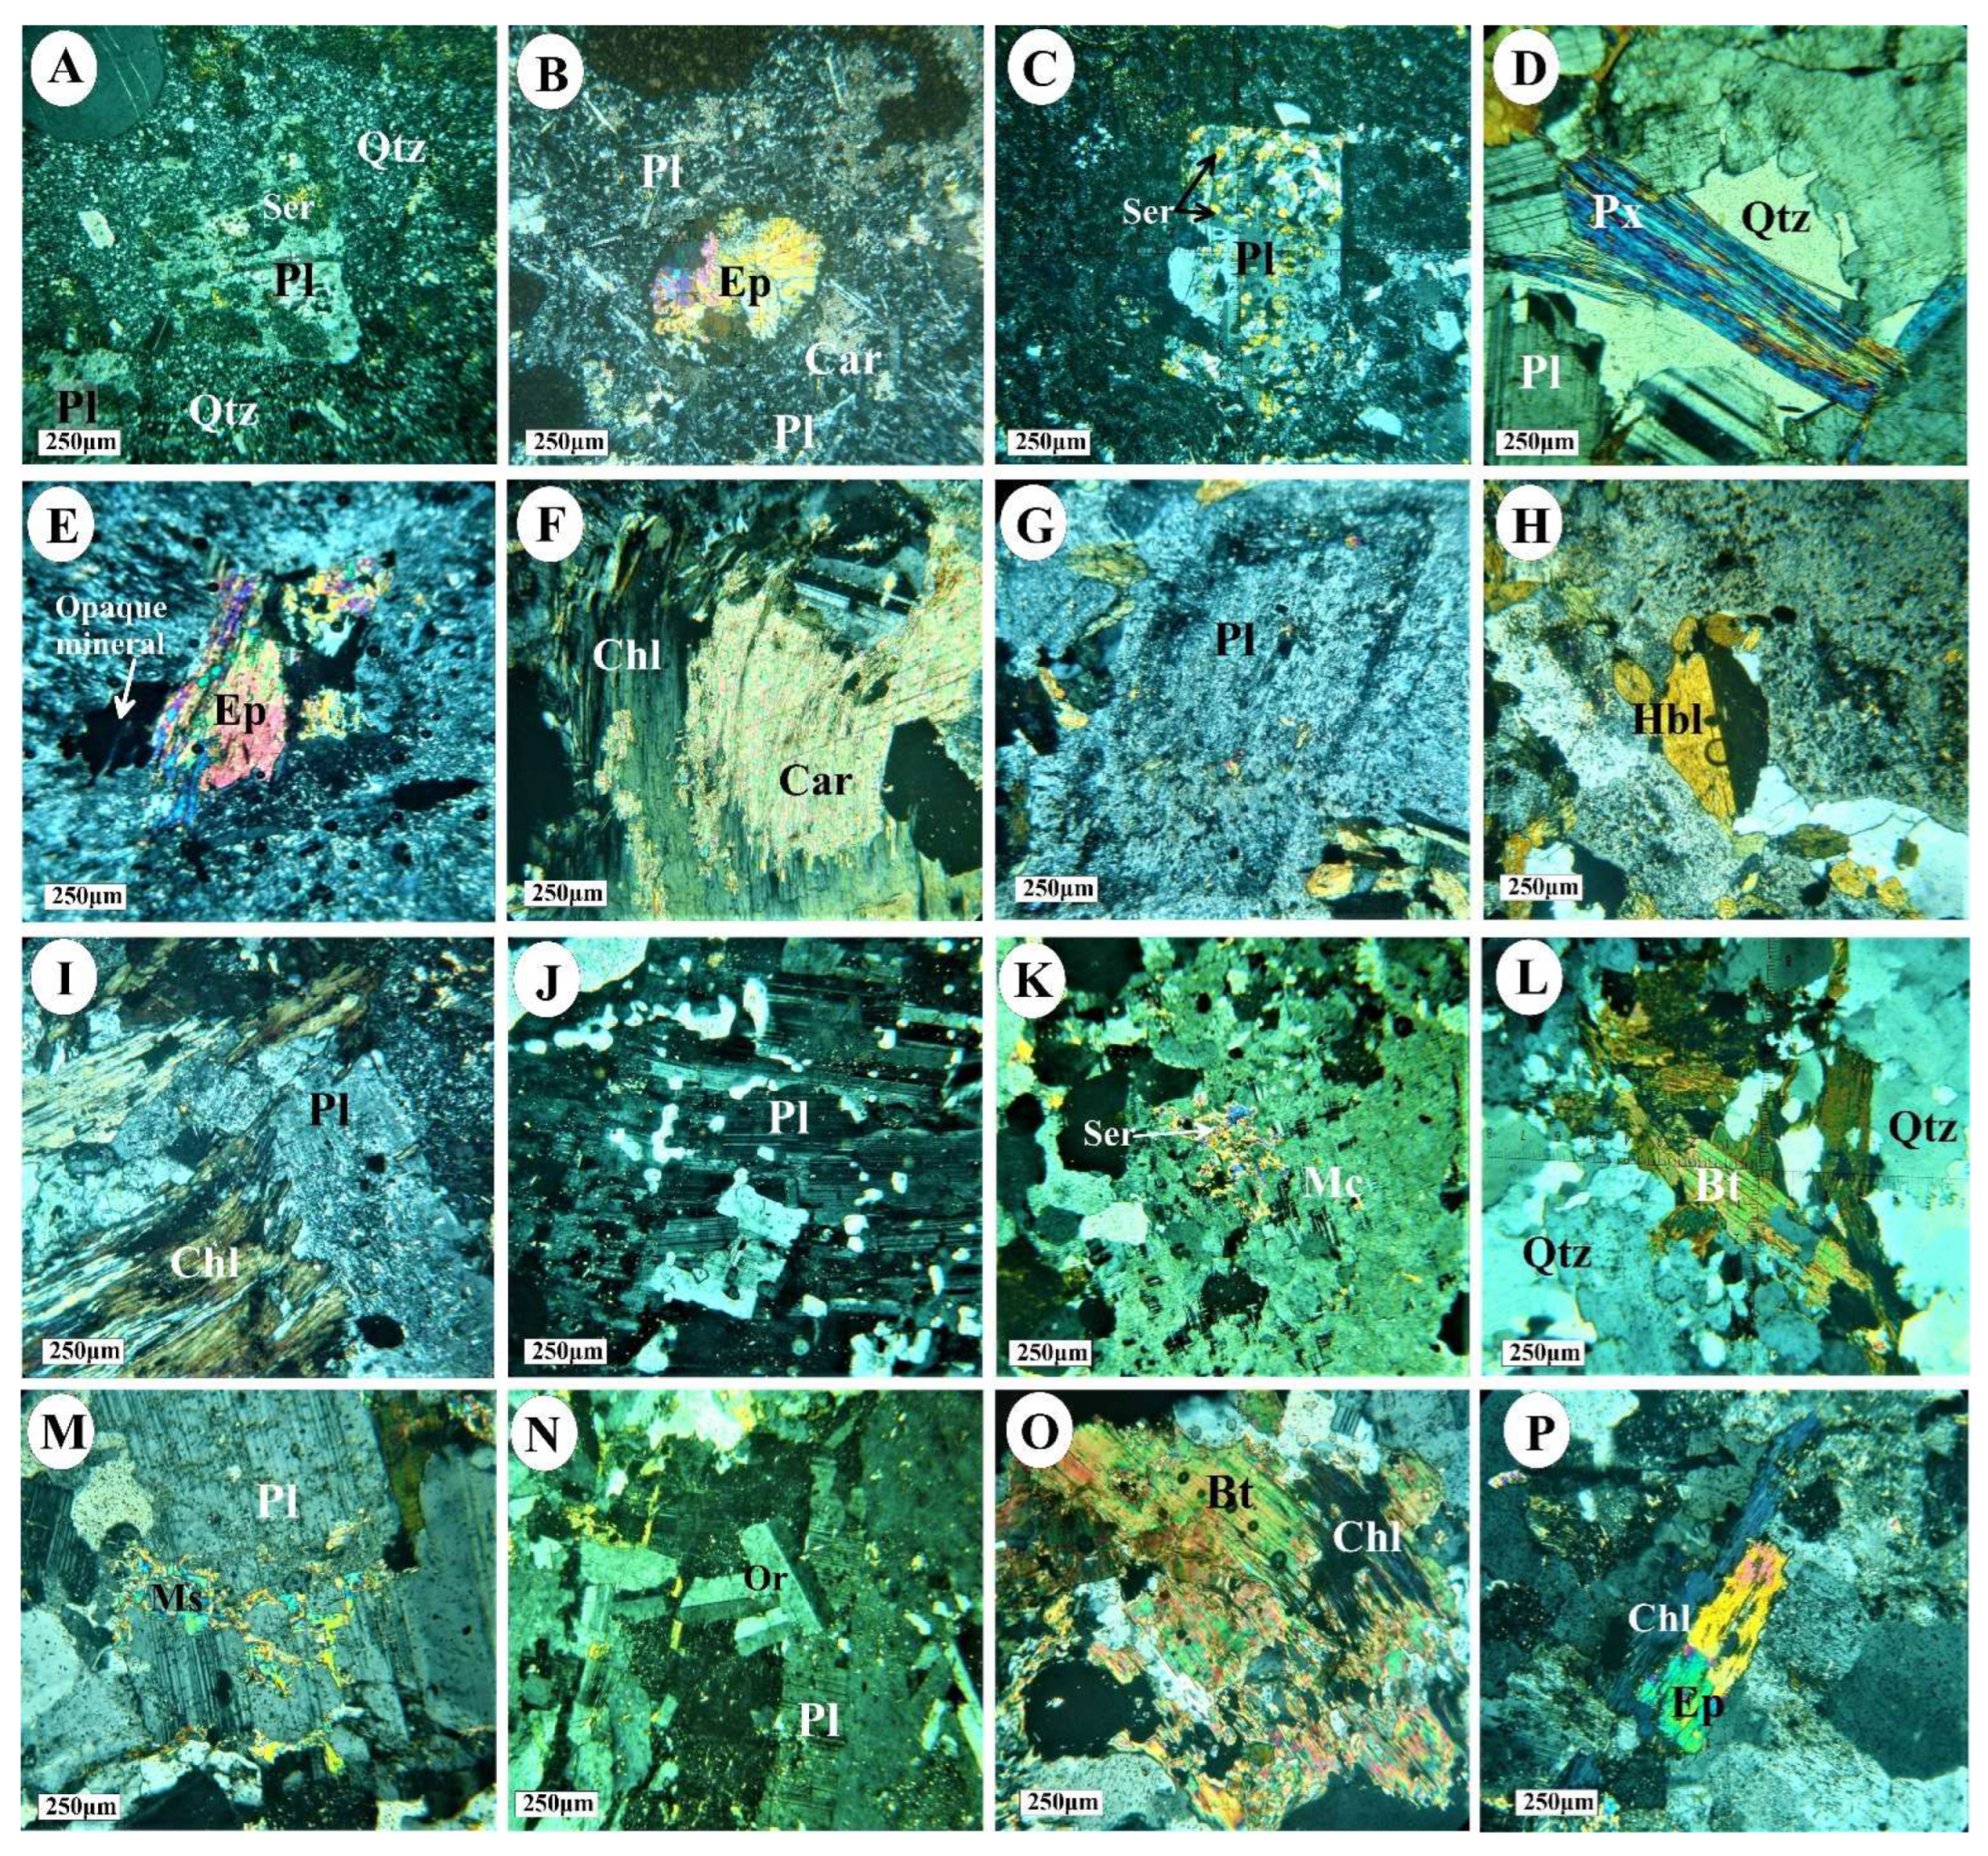
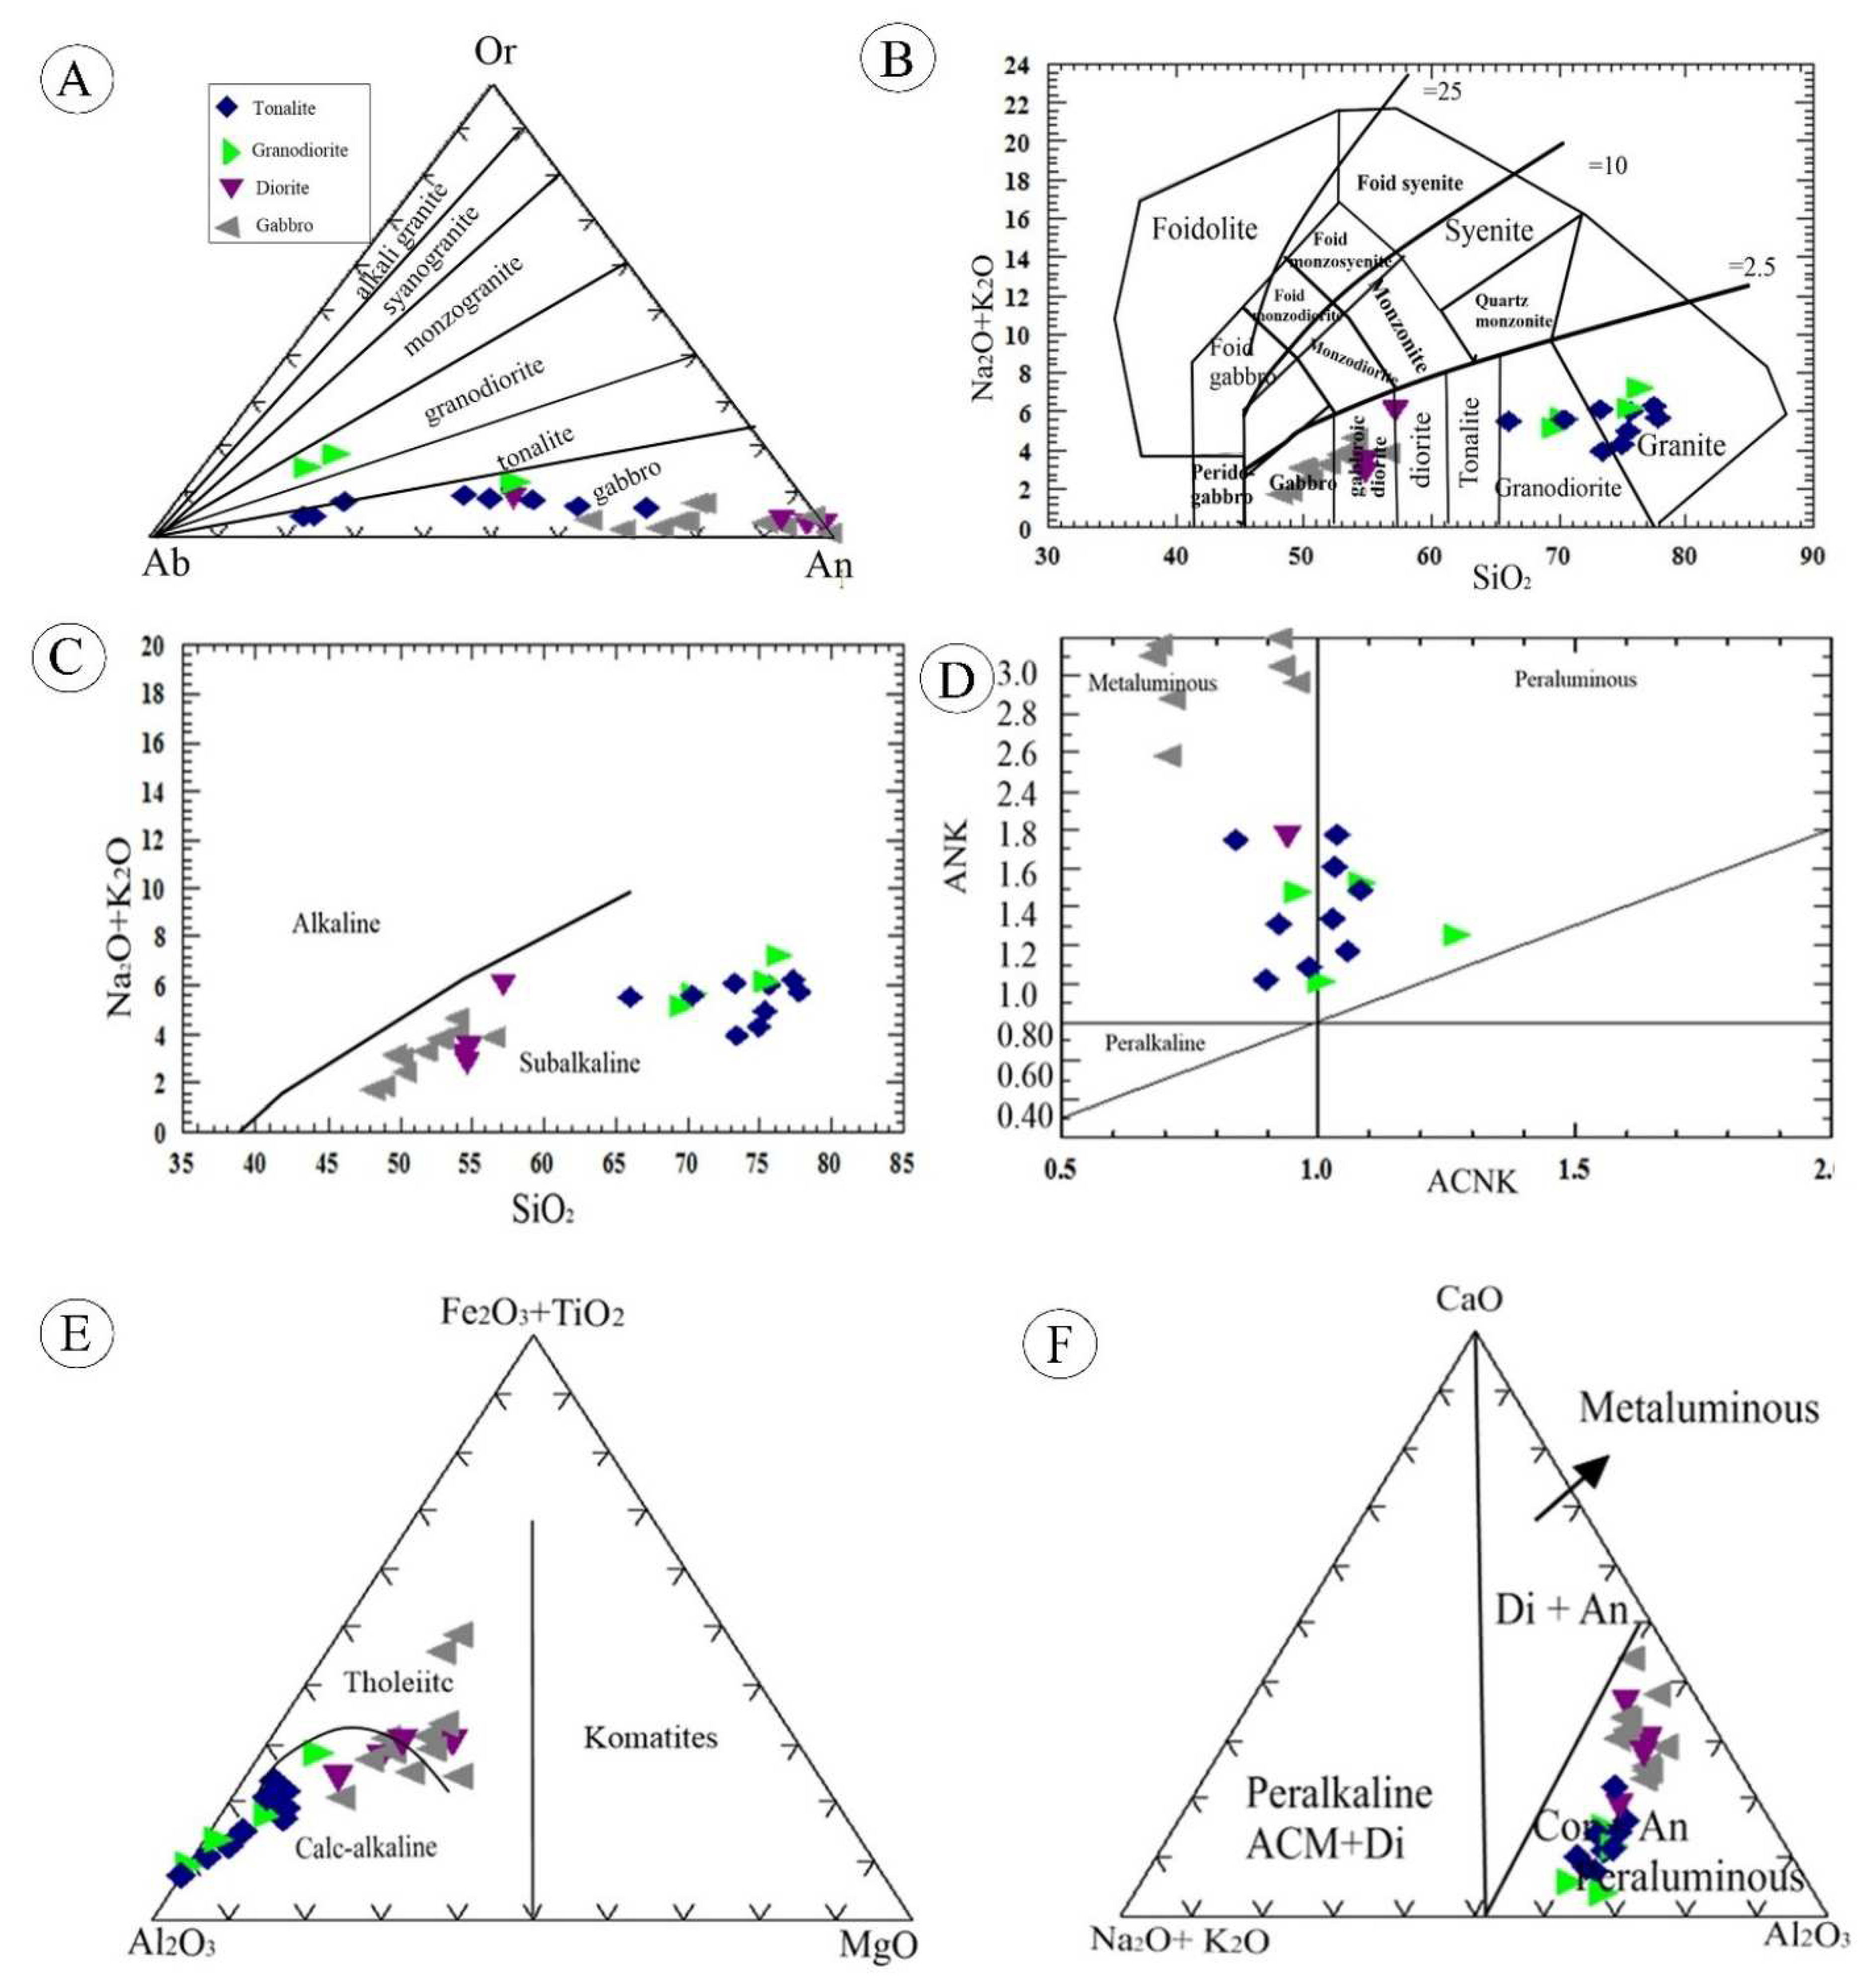
4.1. Petrographic Characterization
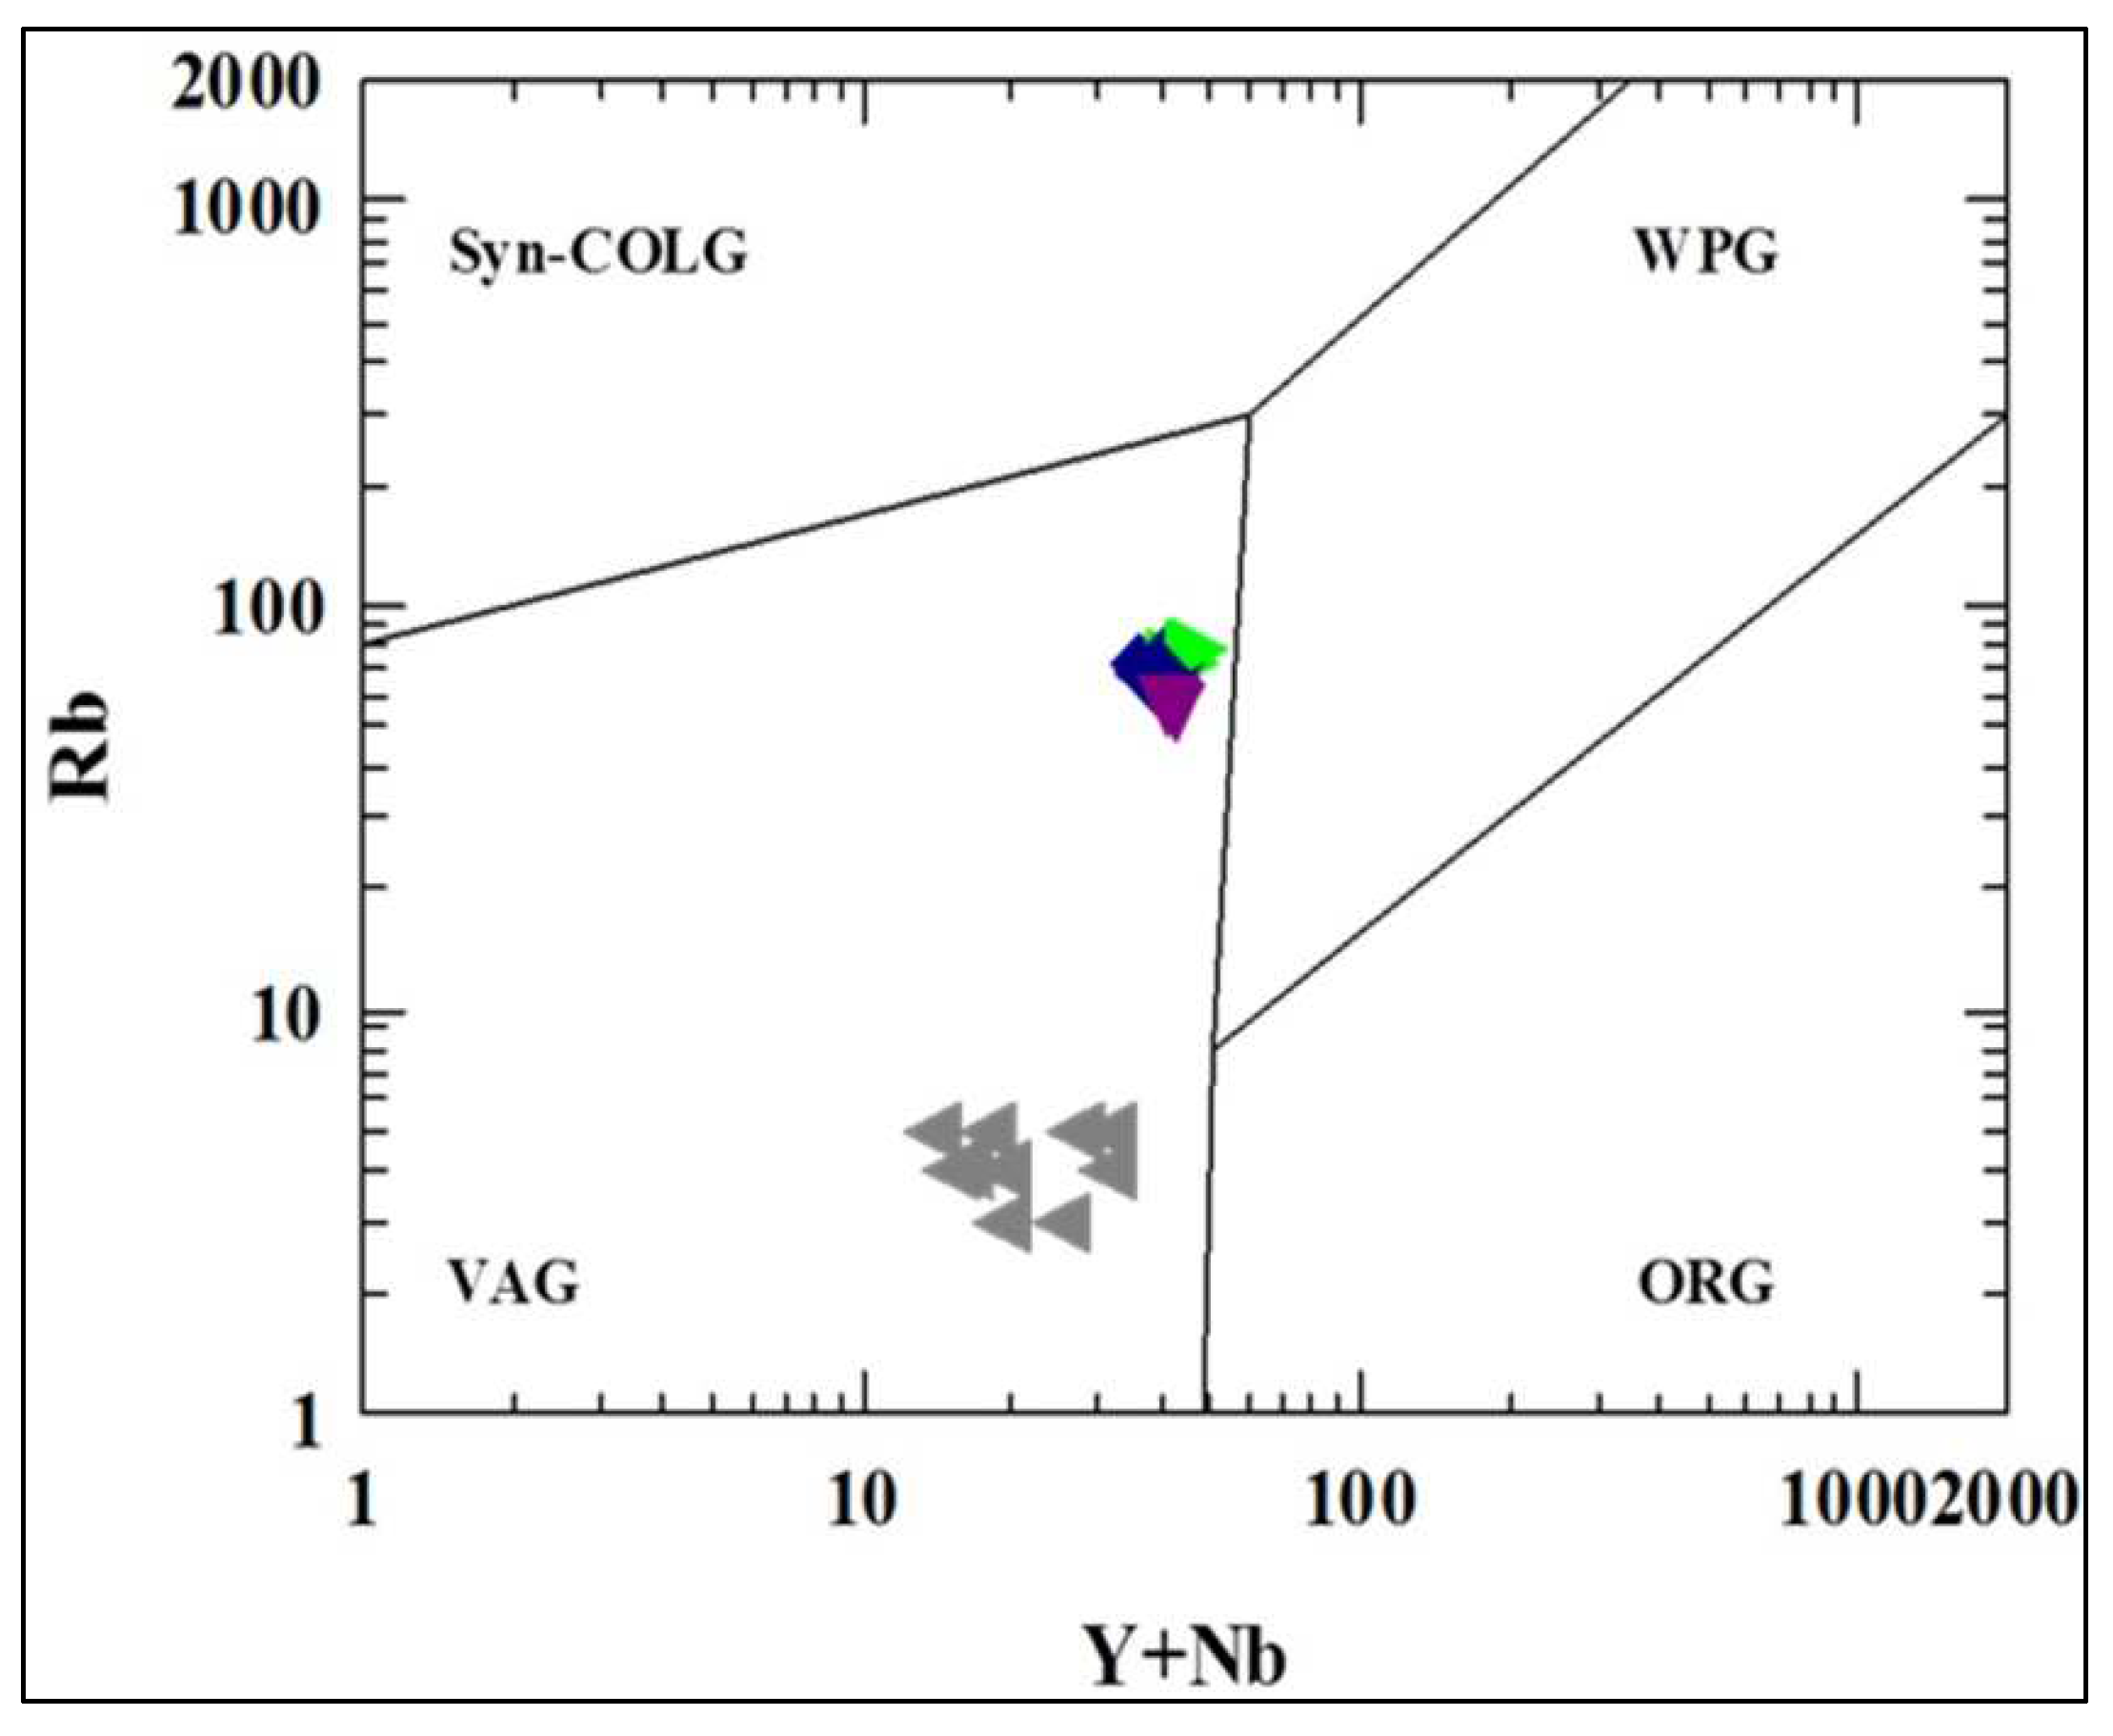
4.2. Geochemical Characterization
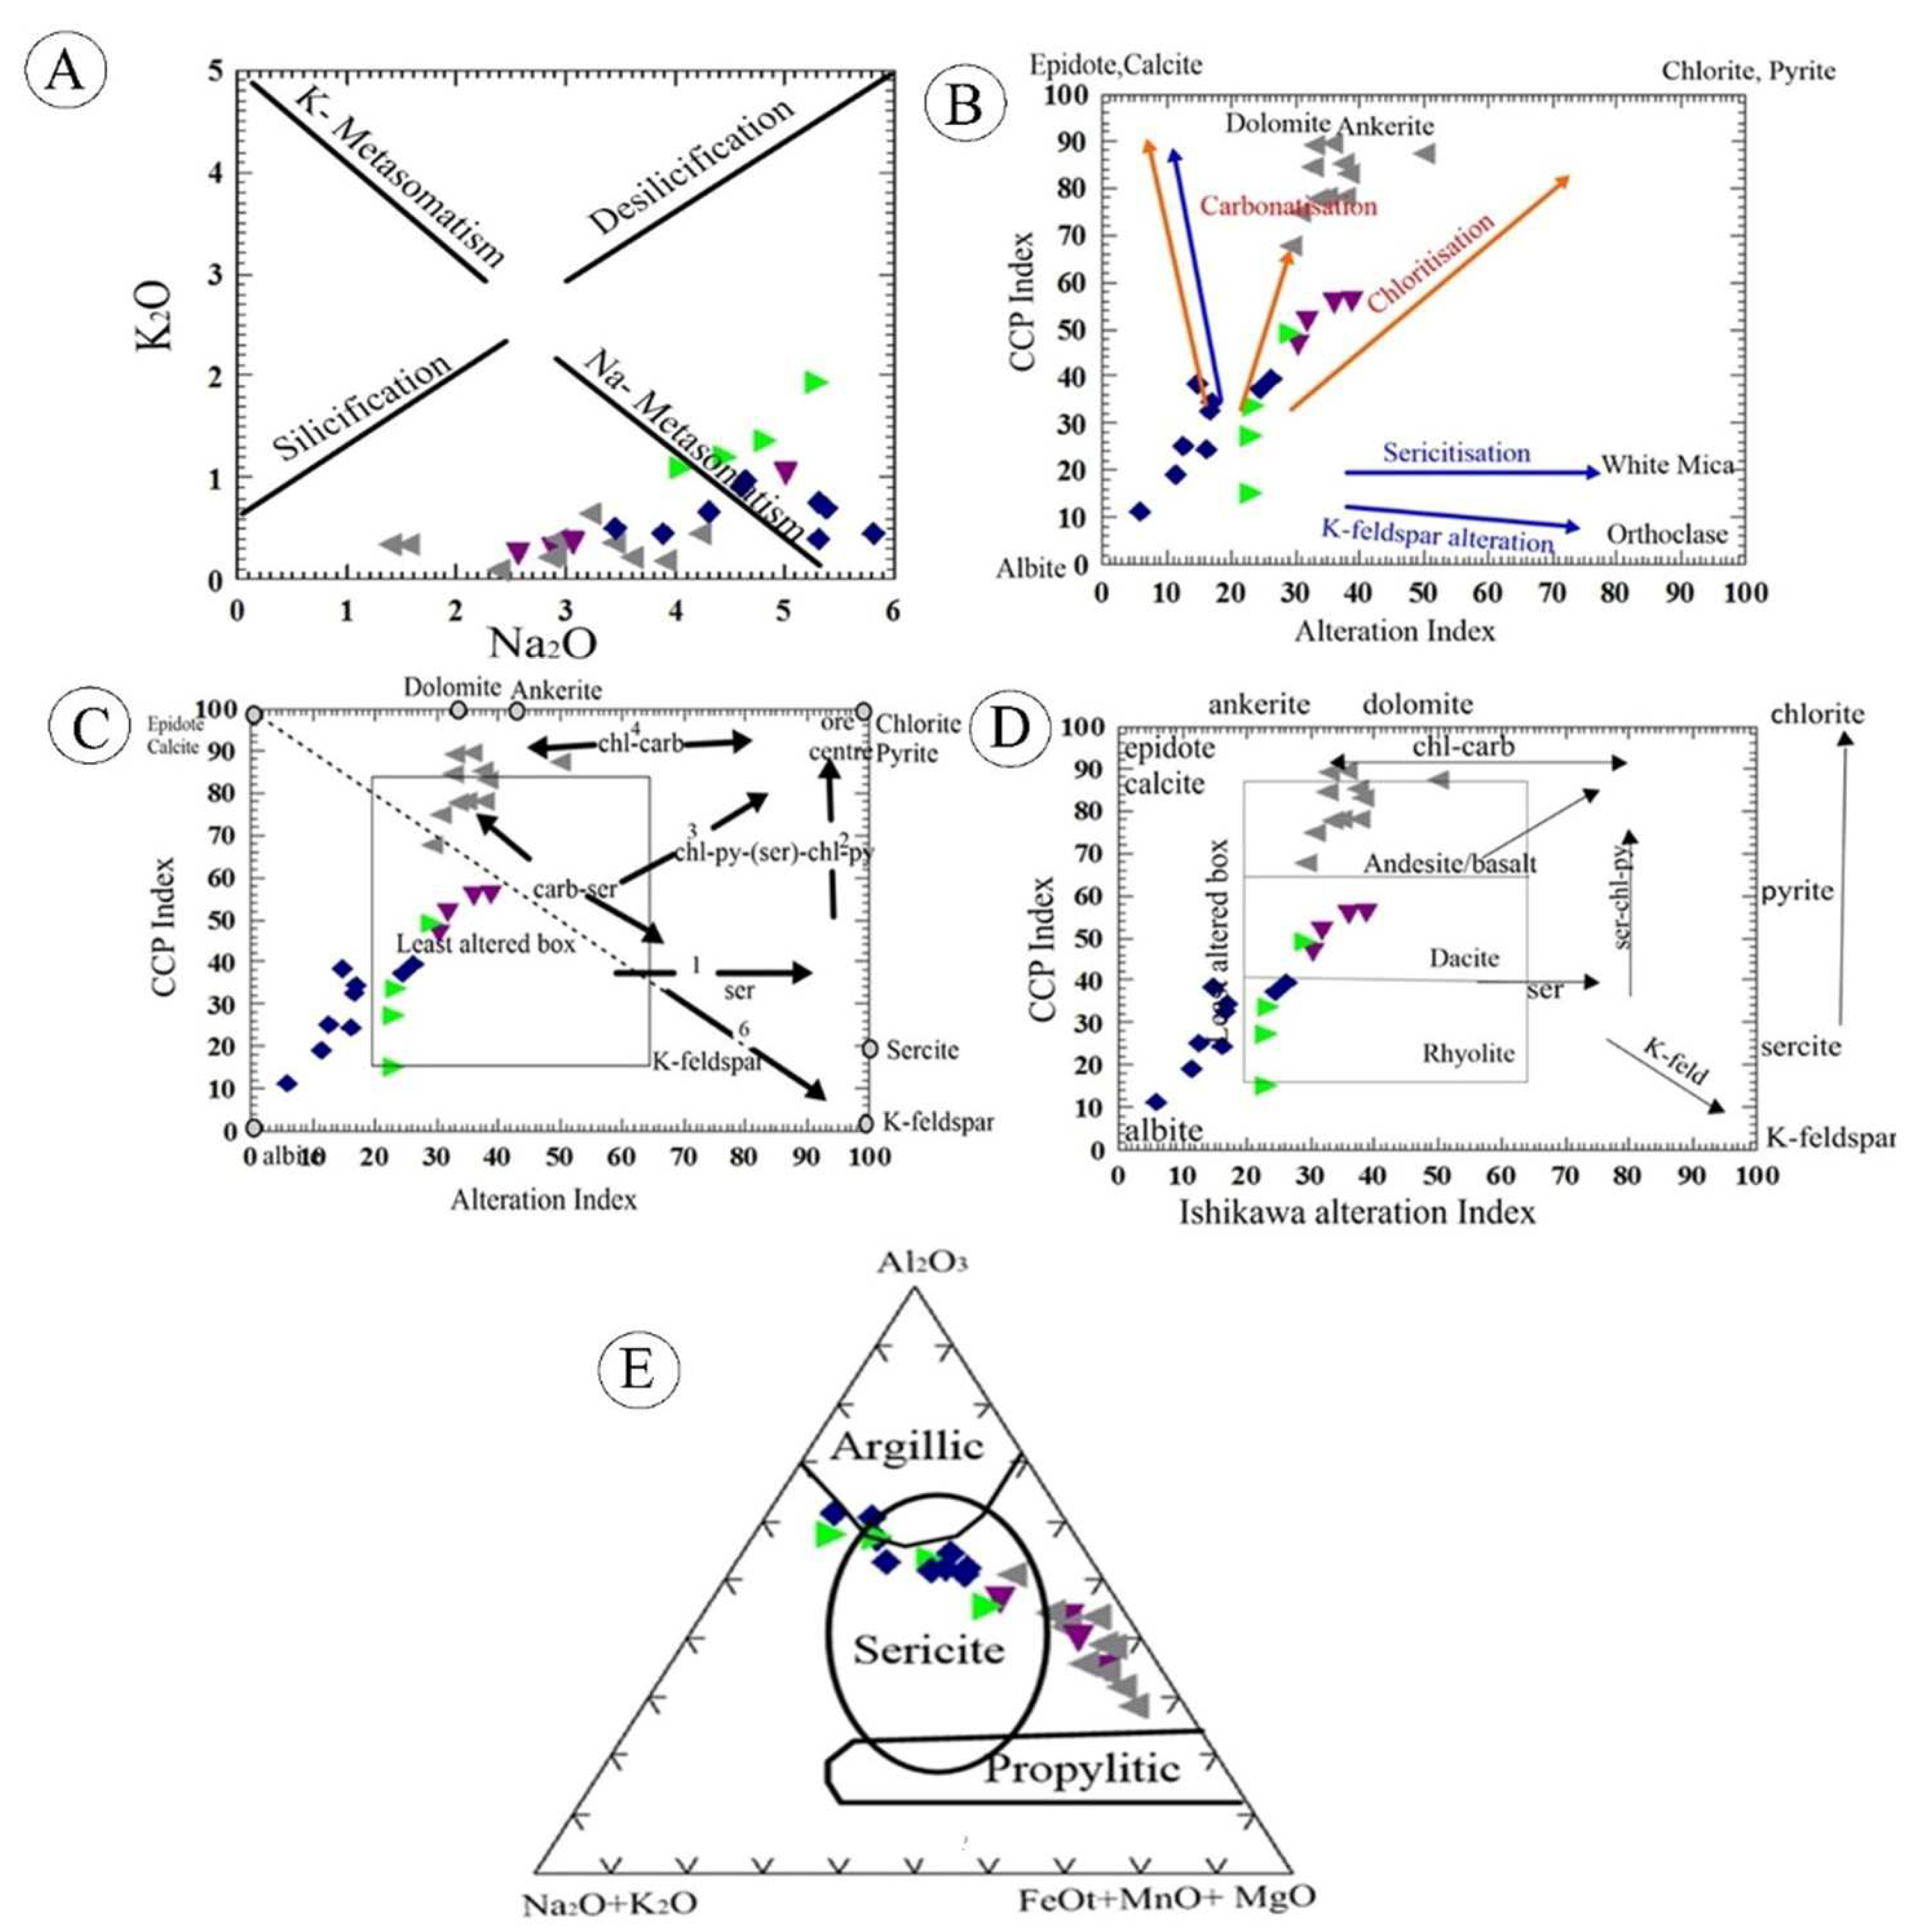
4.3. Geochemistry of Hydrothermal Alteration
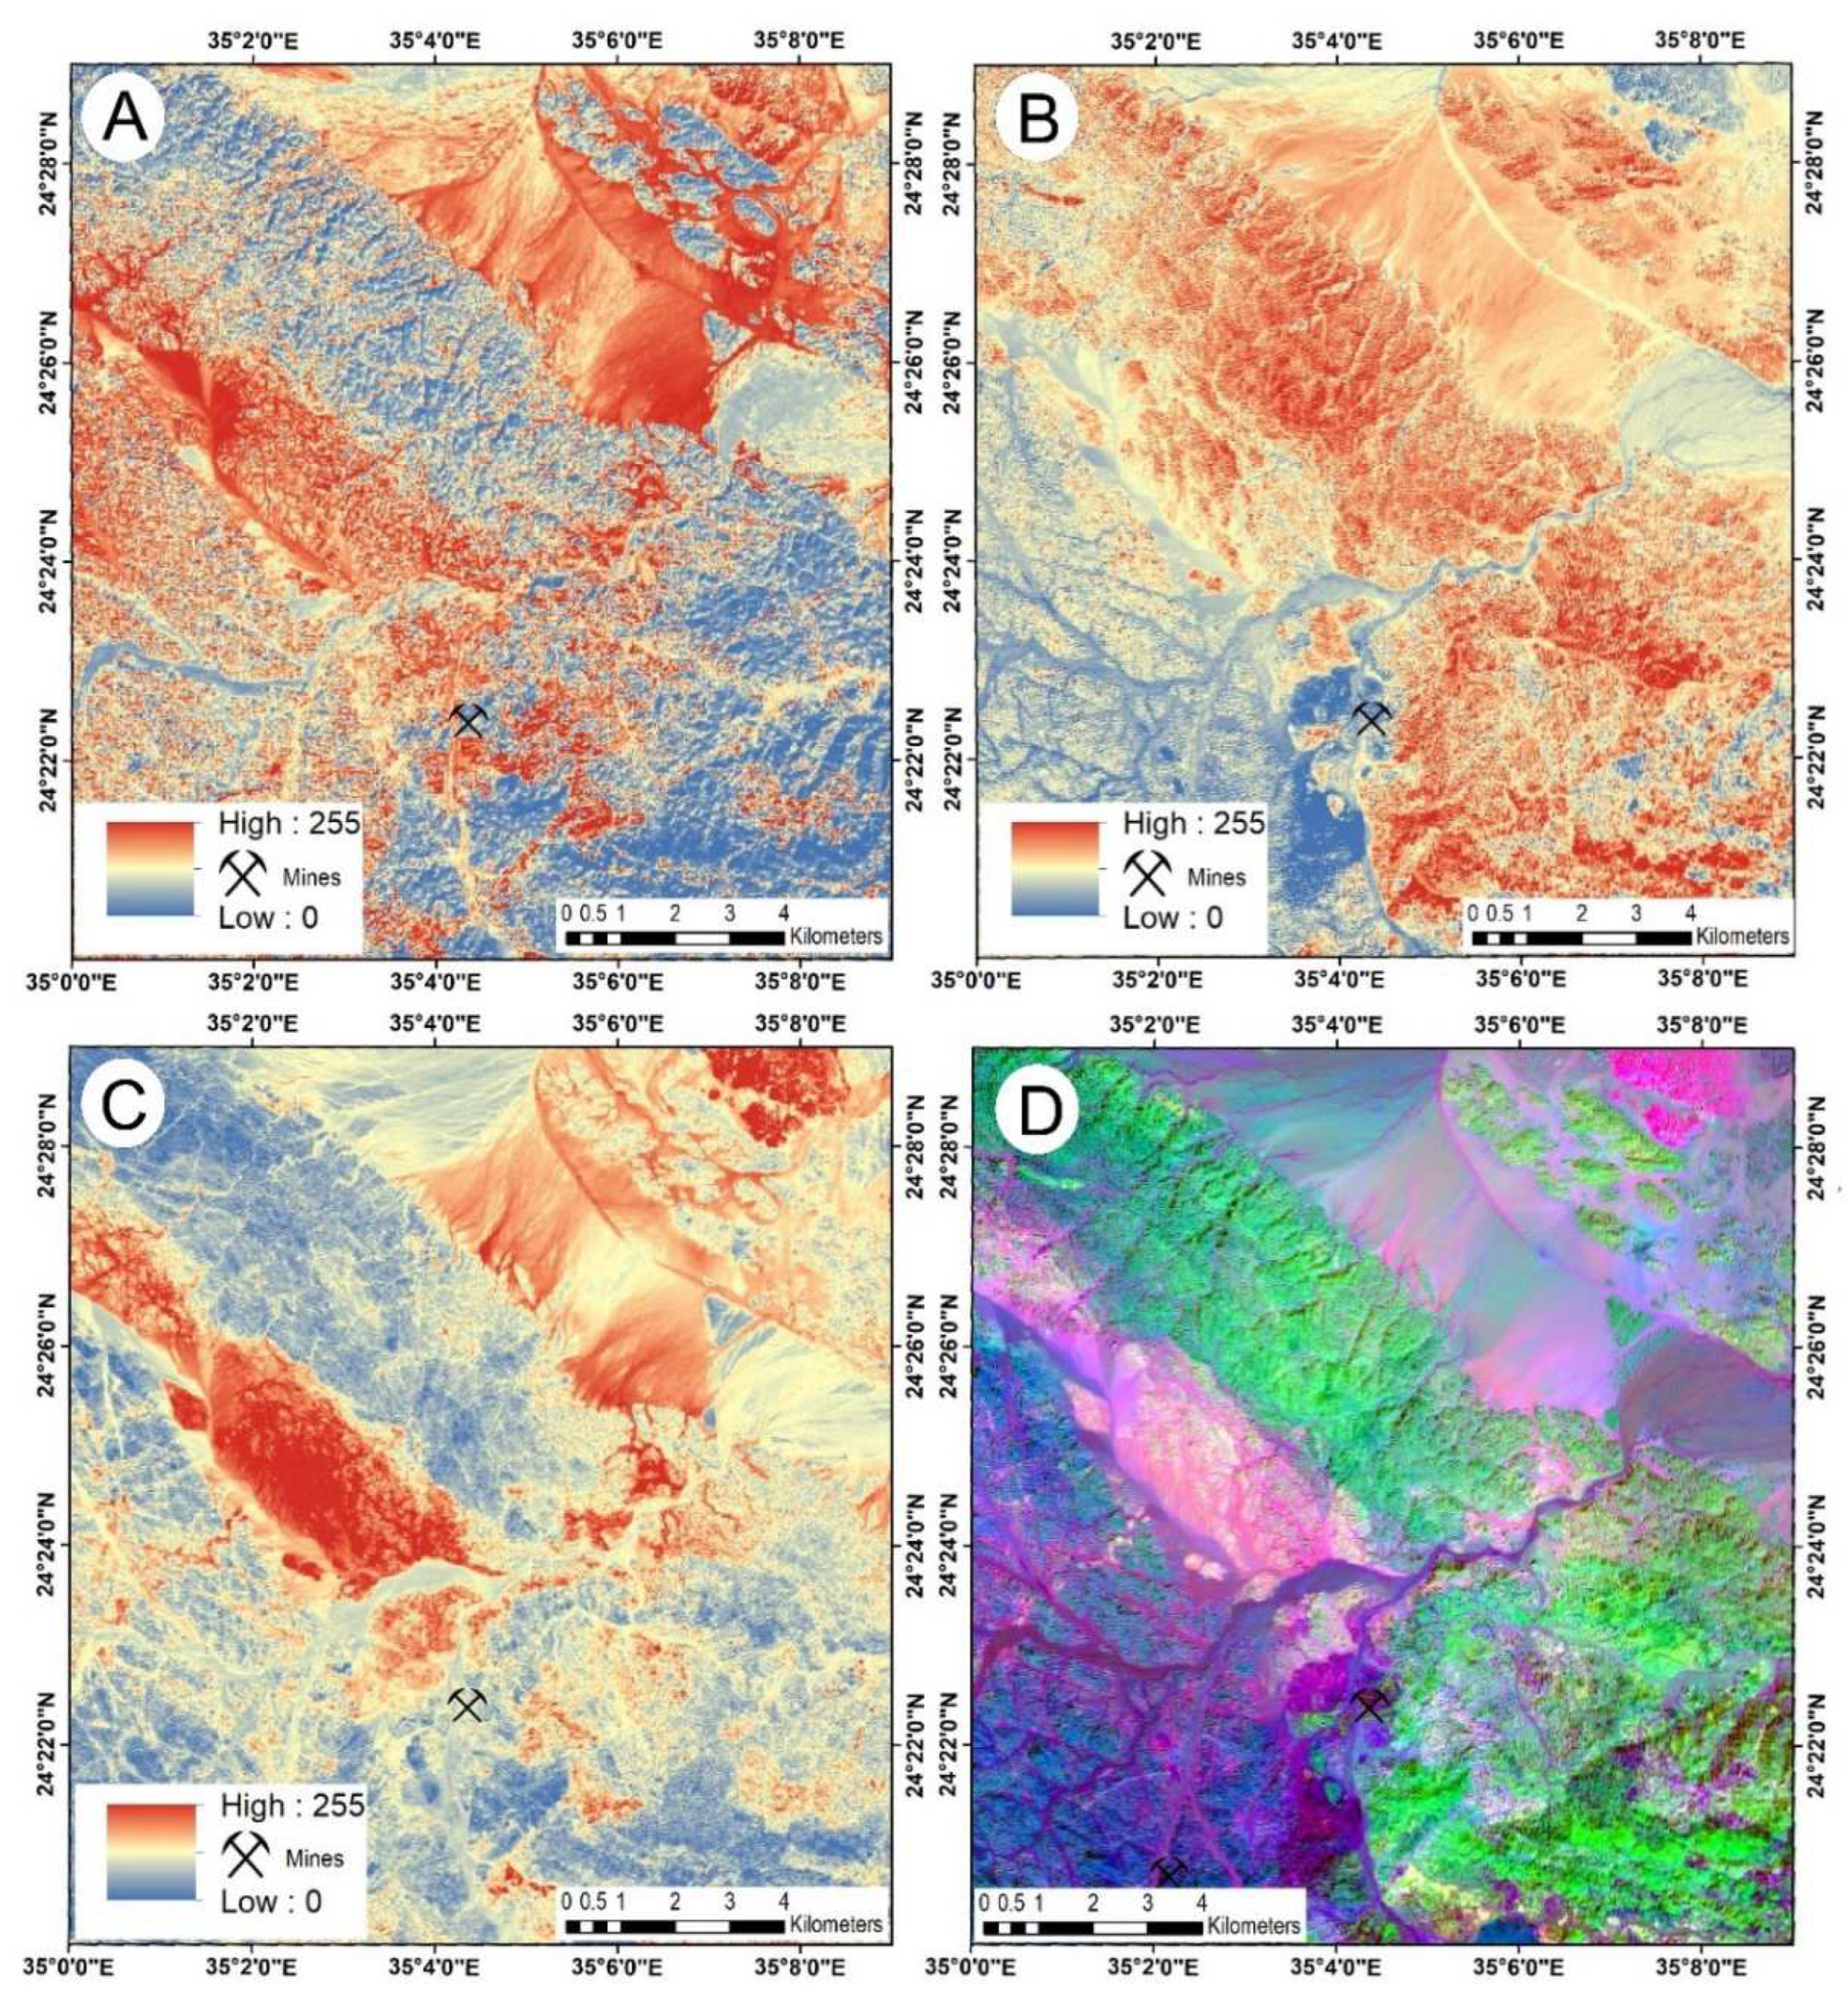
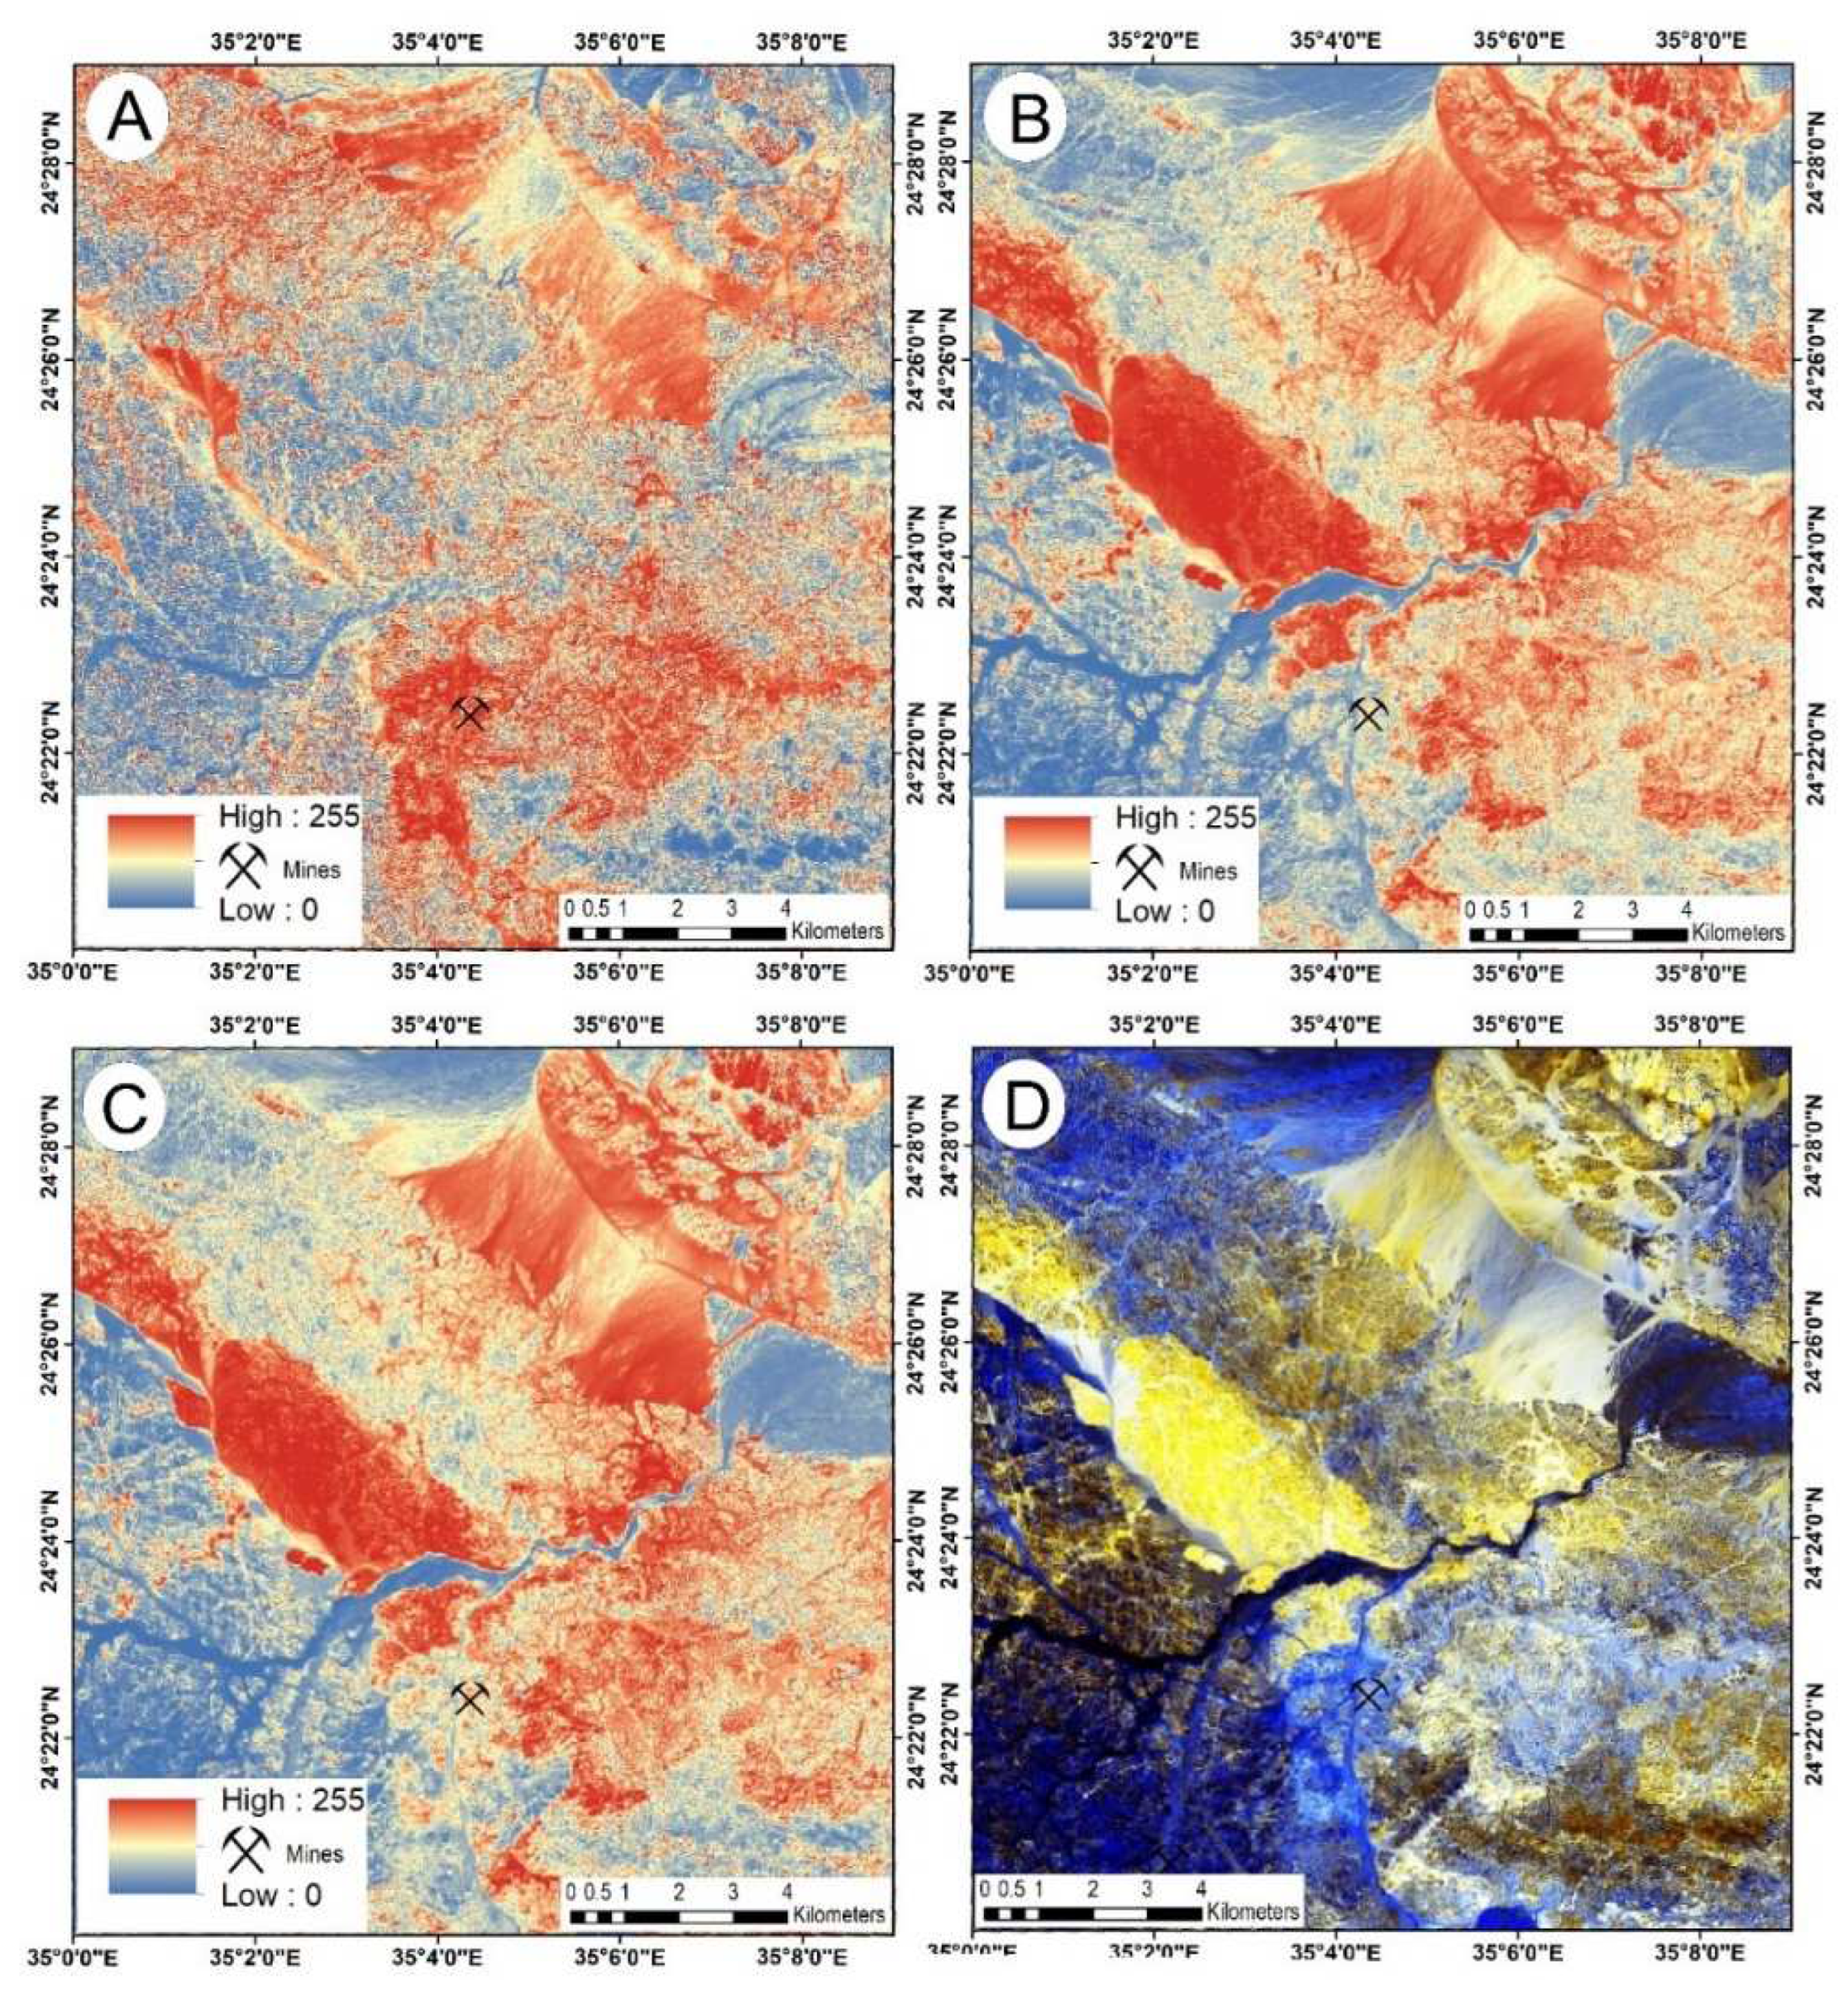
4.4. Alteration Mapping with Landsat 8 Imagery
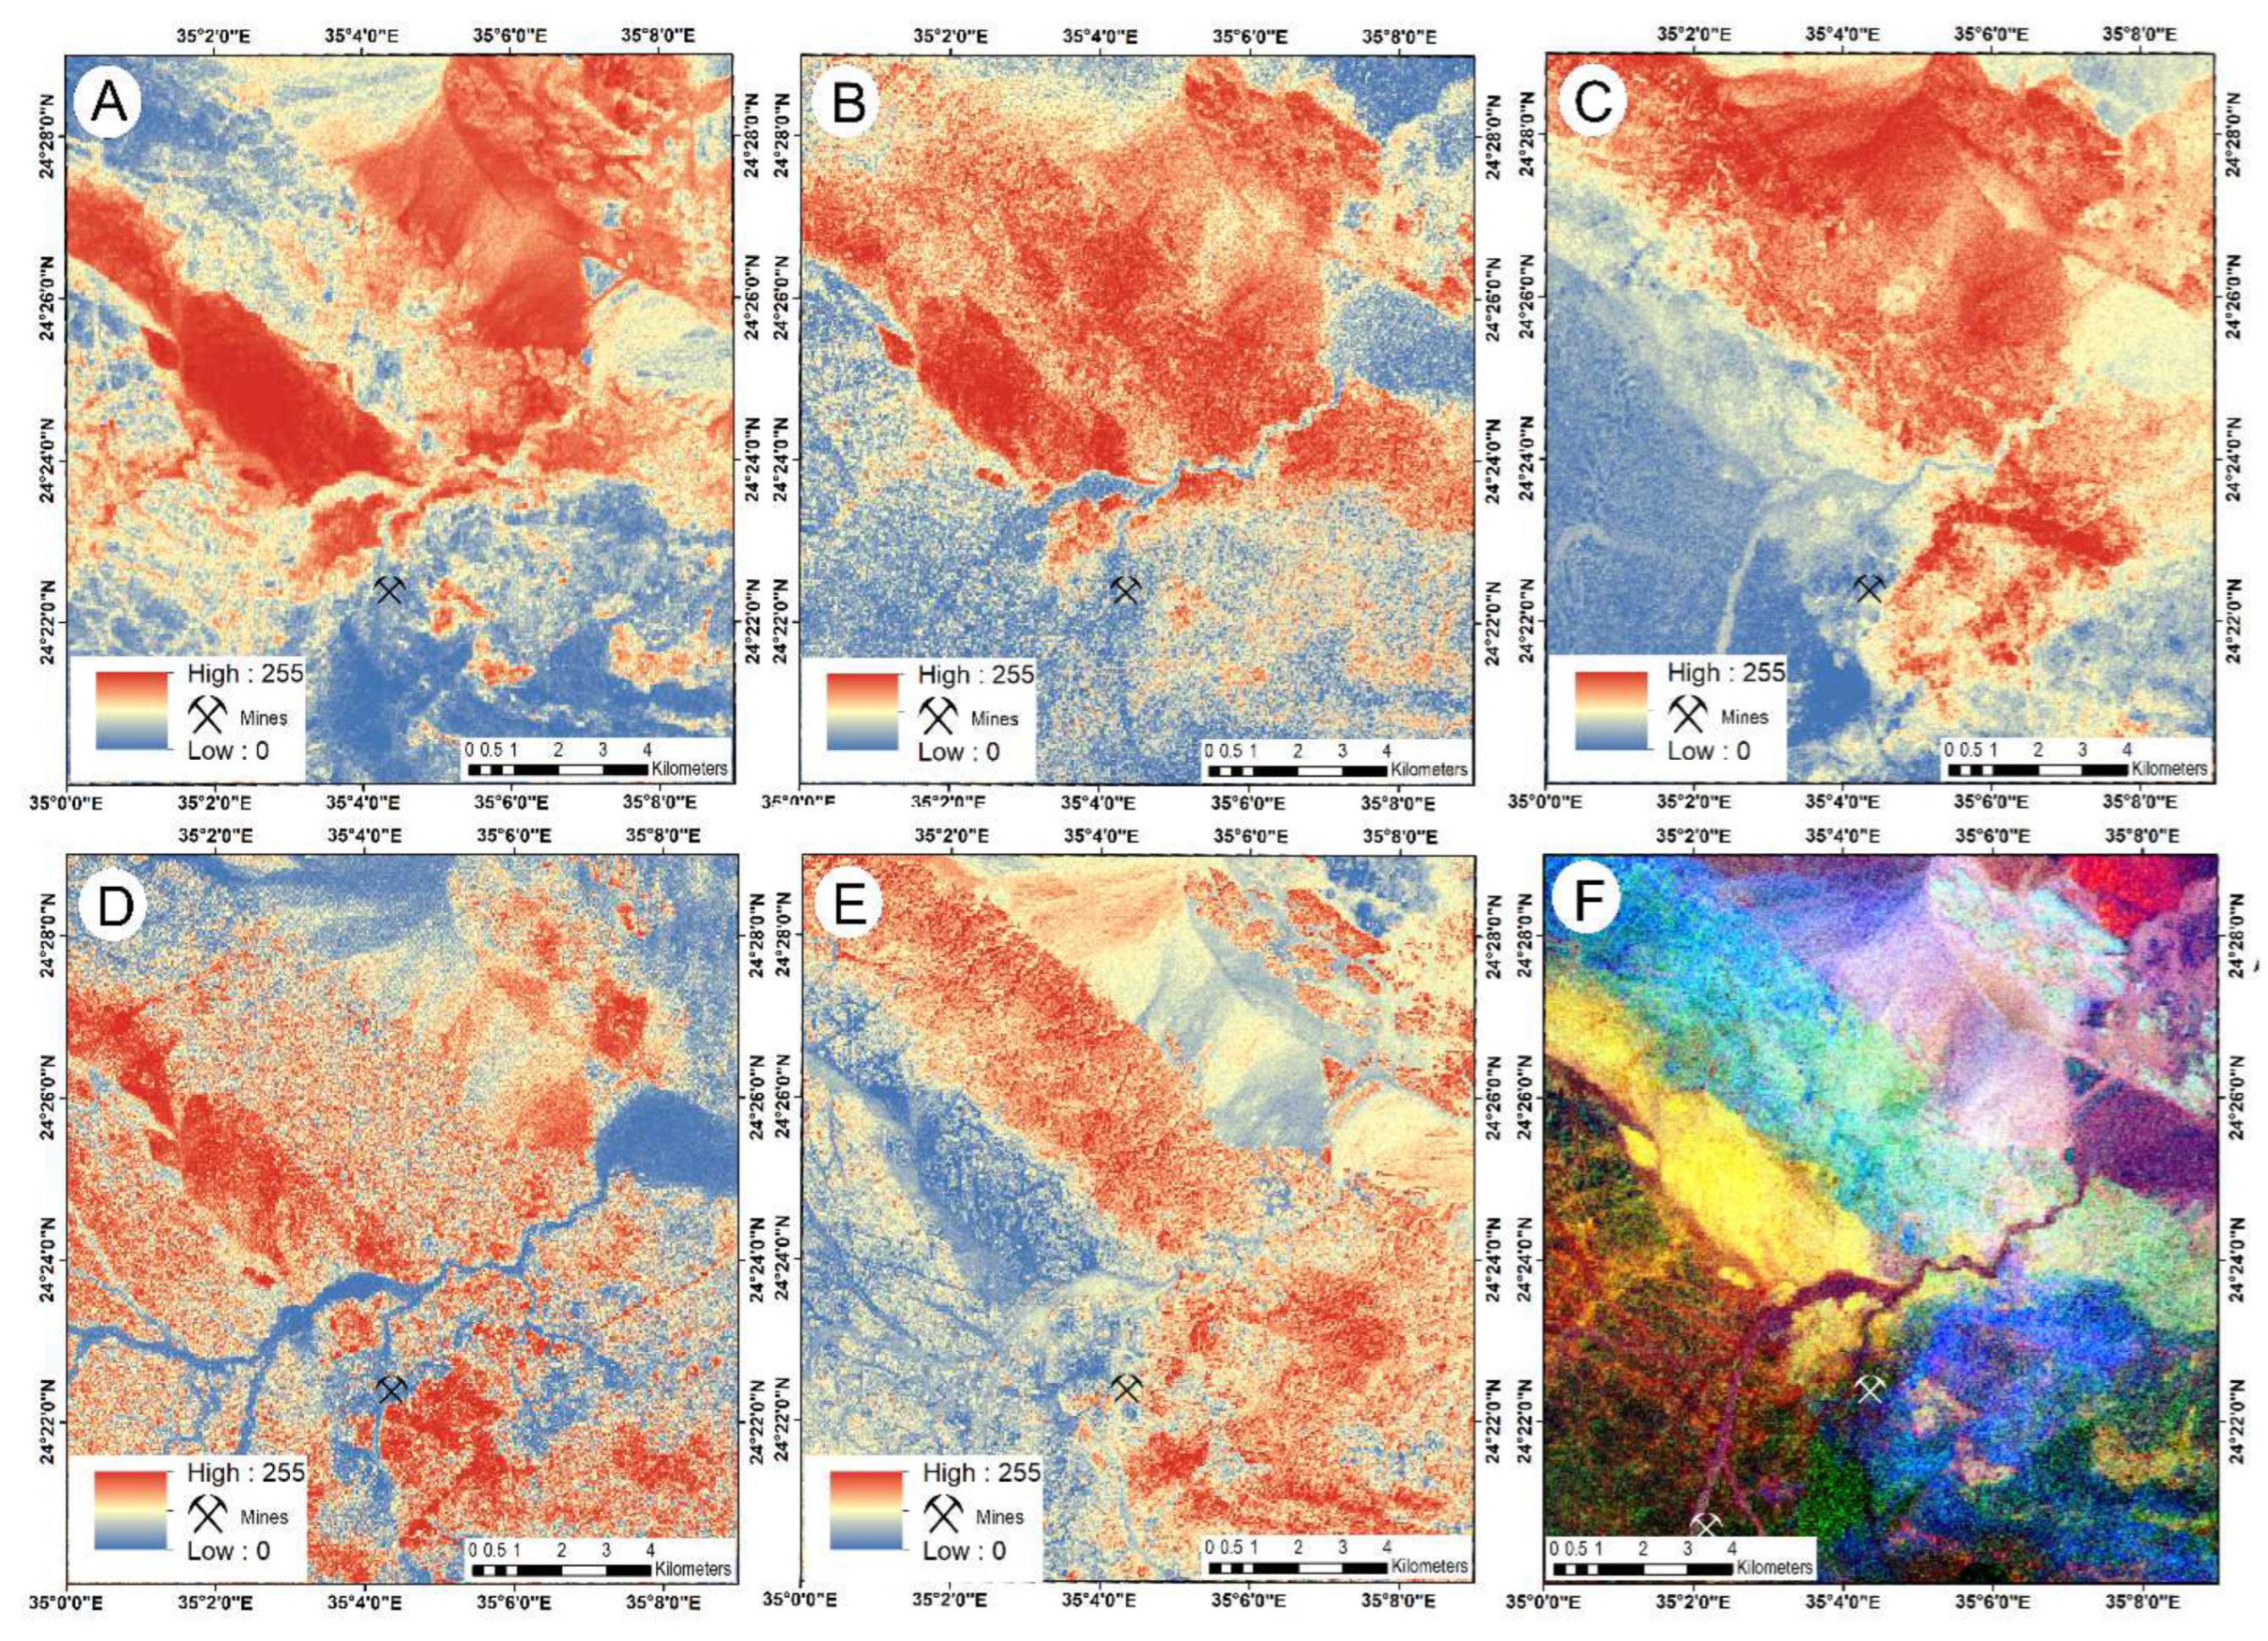
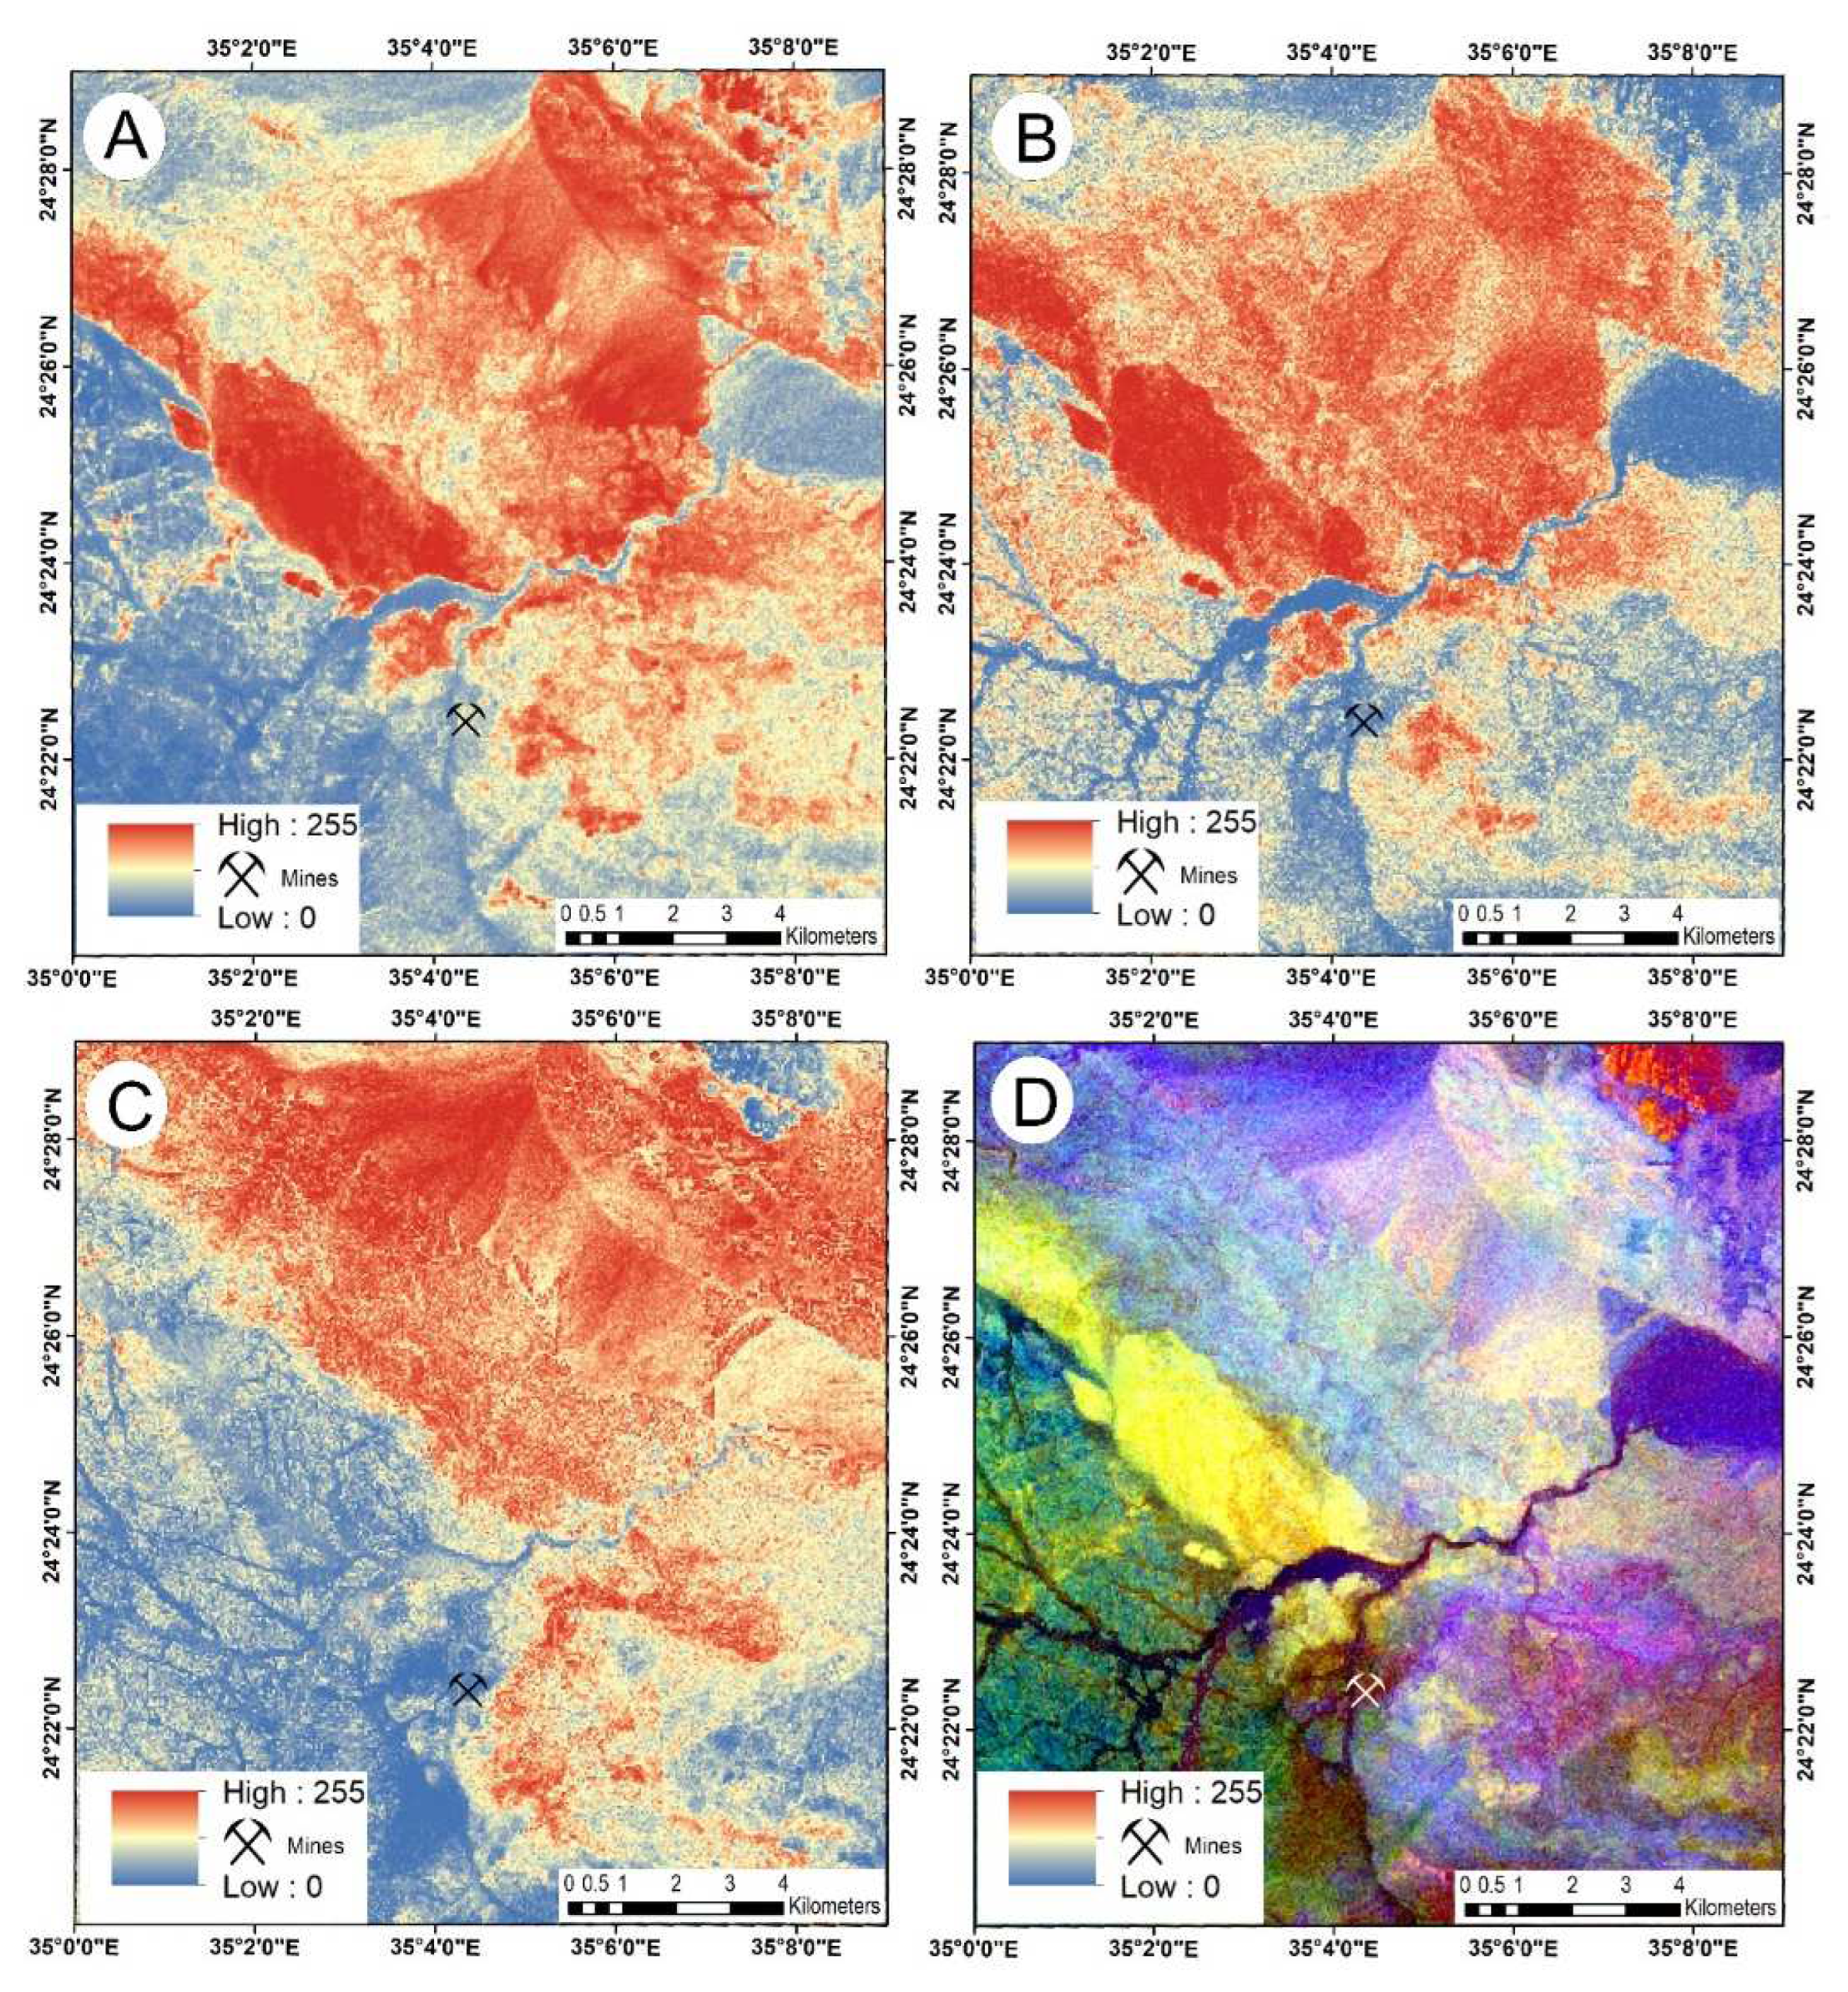
4.5. Alteration Mapping with ASTER Imagery
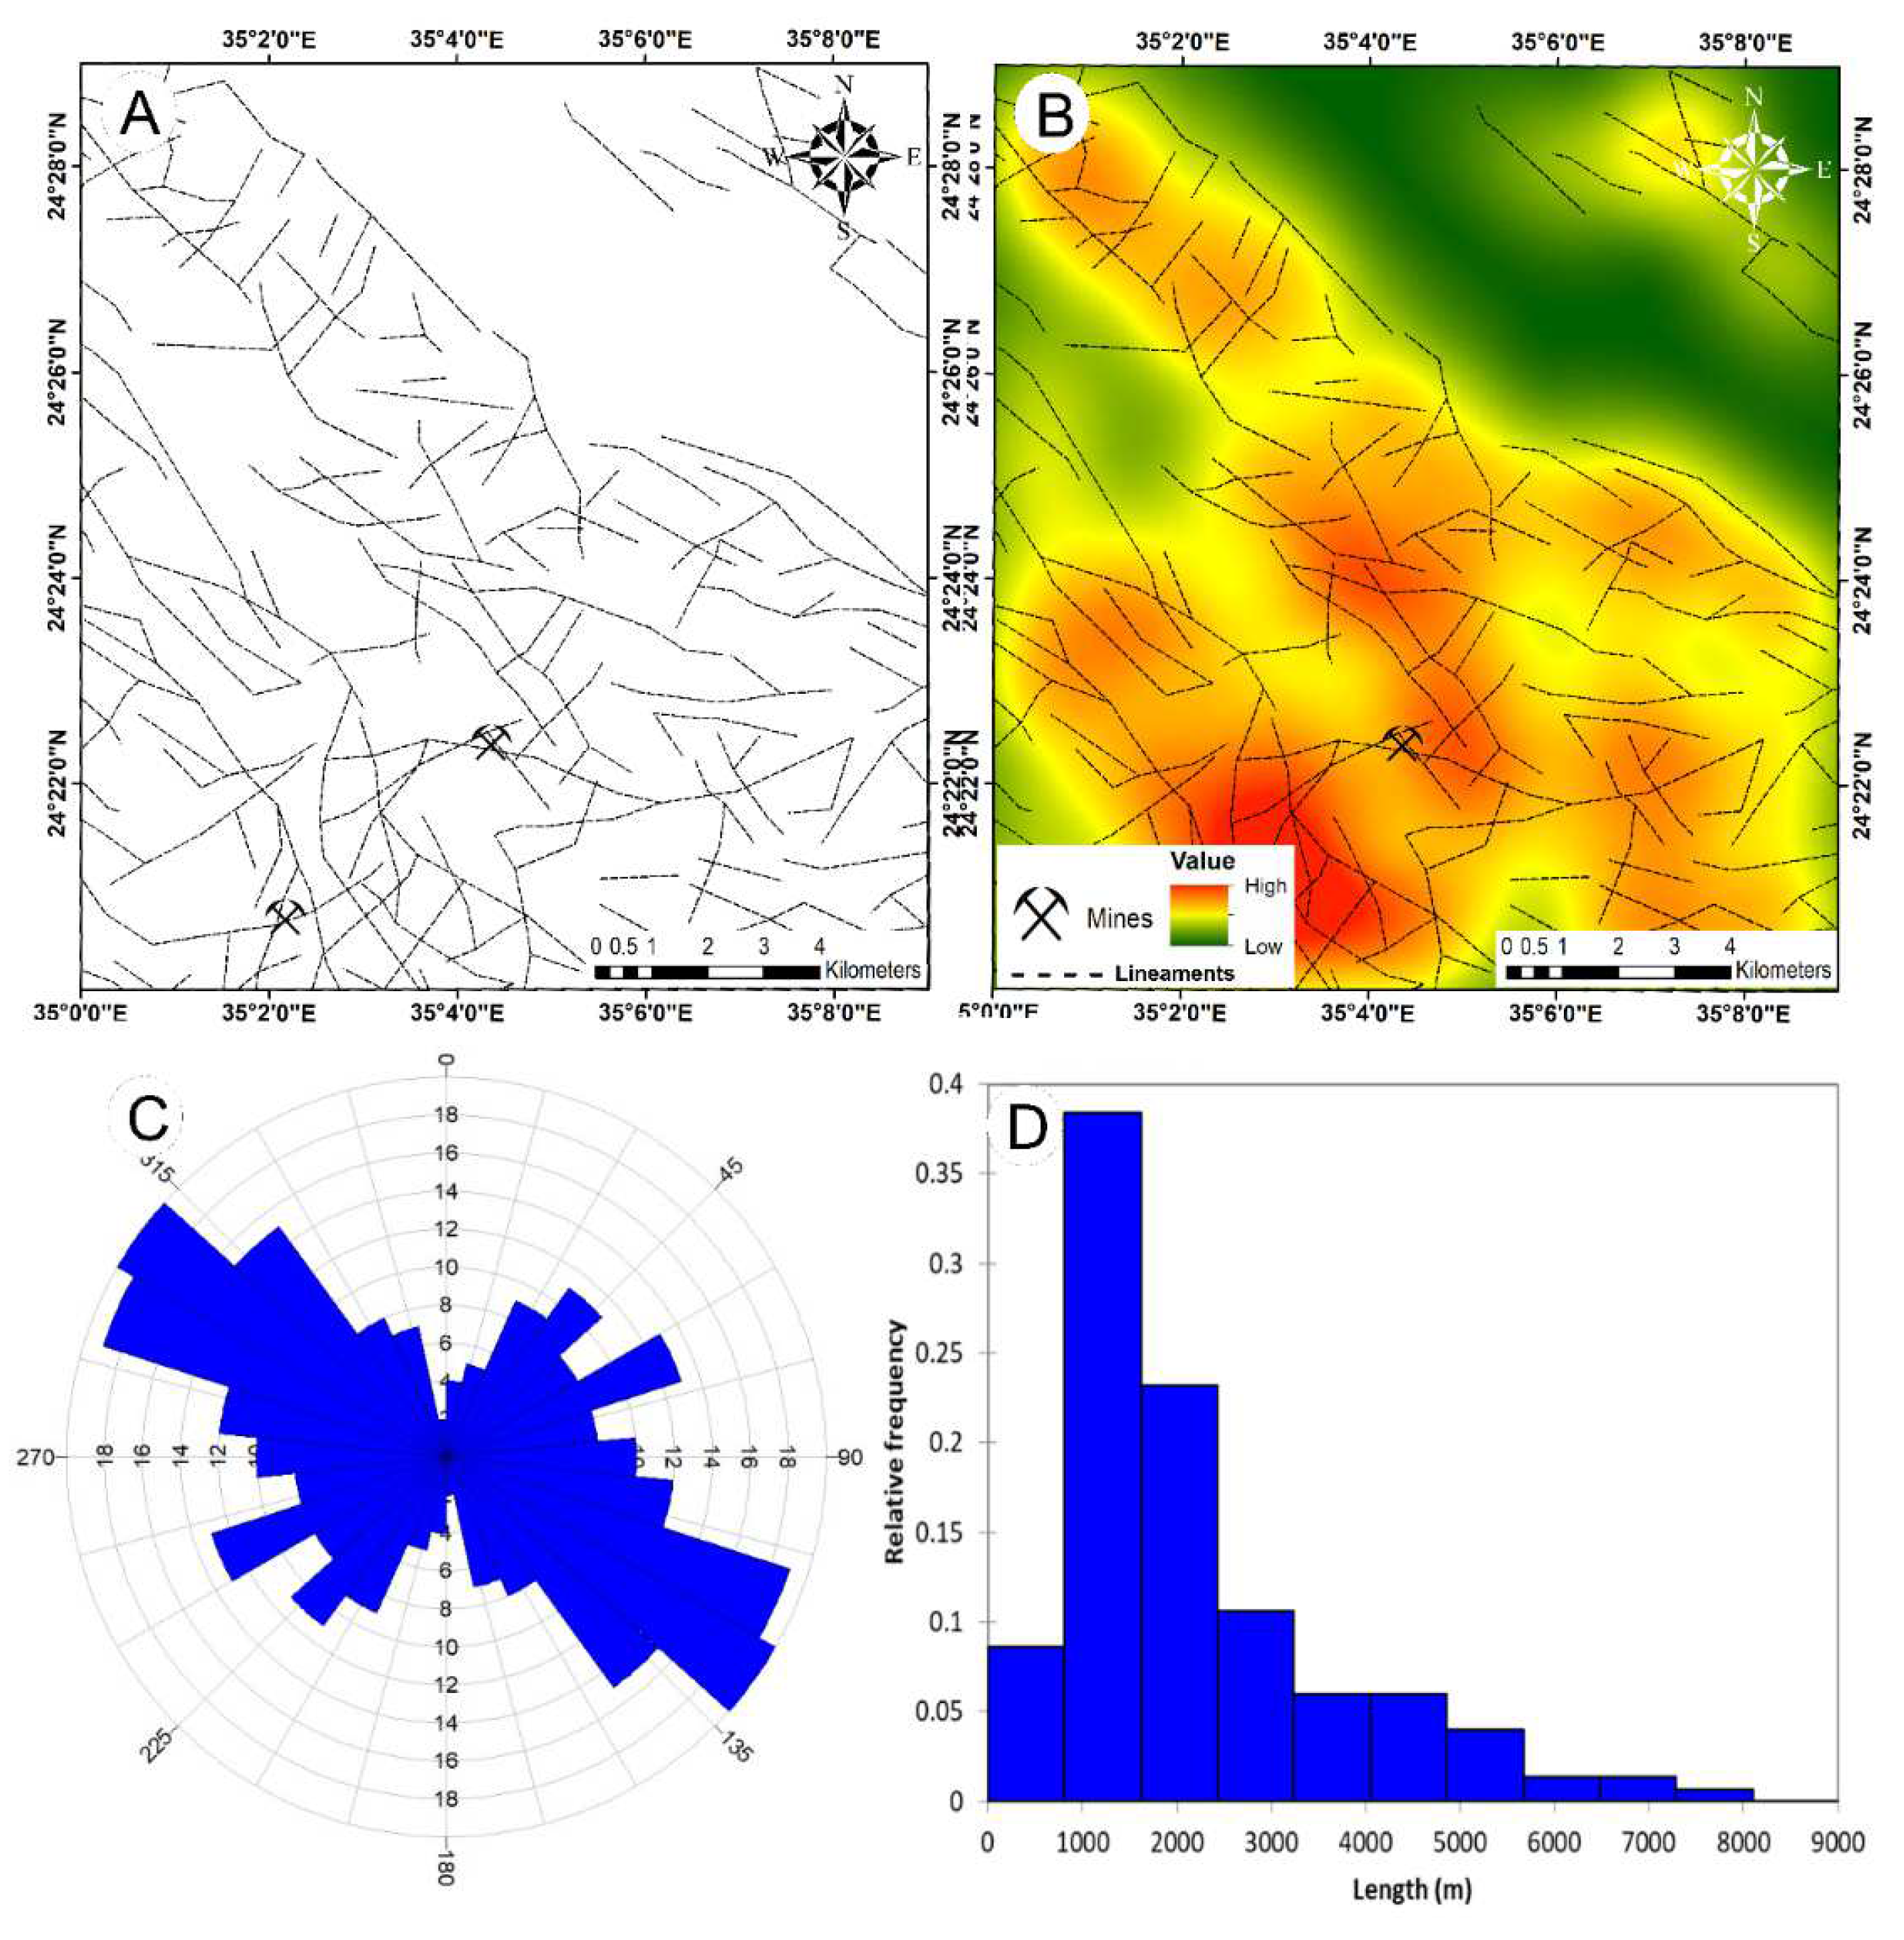
4.6. Application of Lineament Analysis
5. Conclusions
- This paper demonstrates that combining remote sensing data with petrographic and geochemical characterization to define hydrothermal alteration zones is a useful technique.
- The primary goal of the proposed Landsat 8 and ASTER investigations was to categorize the various types of hydrothermal alteration and structural lineaments around the Abu–Ghalaga area.
- According to Landsat 8 imaging, band ratio 6/7 was used to demonstrate clay change, band ratio 6/5 was used to differentiate zones of ferrous iron alterations, and band ratio 4/2 was used to highlight differences in ferric iron.
- On the other hand, ASTER mapping of hydrothermal alteration using band-ratio was implemented using band ratios 4/6, 5/6, 5/8, 2/1, and (5/3+1/2). Argillic alteration was recorded on band ratio 4/6, phyllic alteration was displayed on band ratio 5/6, propylitic alteration was visible in band ratio 5/8 imagery, and ferric iron alteration was seen in band ratio 2/1 imagery. Band ratio (5/3+1/2) was used to show spatial variation in ferrous iron alteration.
- Rose diagram analysis revealed the main structure directions, with ENE–WSW being the most prominent.
- The study area has been subjected to great tectonic movements, especially those associated with the intervention of the biotite gneissose granites and gabbro. These led to the development of many joints, faults, and fractures in the central part of the region (behind the ilmenite mine).
- The basement rocks of the Wadi Abu Ghalaga area mainly consist of arc metavolcanic, gabbro–diorite, granodiorite, and tonalite.
- Field geologic studies demonstrate three forms of alteration: propylitic, phyllic, and argillic.
- Important alteration minerals according to petrographic investigations are epidotization, sericitization, muscovititization, kaolinitization, and chloritization, which are documented because of high deformation following regional metamorphism in the area.
- Geochemical results of the rock samples show chlorite–albite–sericite–kaolinite carbonate alteration.
Author Contributions
Funding
Data Availability Statement
Acknowledgments
Conflicts of Interest
References
- Honarmand, M.; Ranjbar, H.; Shahabpour, J. Application of principal component analysis and spectral angle mapper in the mapping of hydrothermal alteration in the Jebal–Barez Area, Southeastern Iran. Resour. Geol. 2012, 62, 119–139. [Google Scholar] [CrossRef]
- Shahriari, H.; Ranjbar, H.; Honarmand, M. Image segmentation for hydrothermal alteration mapping using PCA and concentration–area fractal model. Nat. Resour. Res. 2013, 22, 191–206. [Google Scholar] [CrossRef]
- Mahboob, M.A.; Atif, I.; Iqbal, J. Remote sensing and GIS applications for assessment of urban sprawl in Karachi, Pakistan. Sci. Technol. Dev. 2015, 34, 179–188. [Google Scholar] [CrossRef]
- Harris, J.R.; Rencz, A.N.; Ballantyne, B.; Sheridon, C. Mapping altered rocks using LANDSAT TM and lithogeochemical data: Sulphurets-Brucejack Lake district, British Columbia, Canada. Photogramm. Eng. Remote Sens. 1998, 64, 309–322. [Google Scholar]
- Frutuoso, R.; Lima, A.; Teodoro, A.C. Application of remote sensing data in gold exploration: Targeting hydrothermal alteration using Landsat 8 imagery in northern Portugal. Arab. J. Geosci. 2021, 14, 1–18. [Google Scholar] [CrossRef]
- Tende, A.W.; Mustapha, T.; Fru, M.I.N.; Gajere, J.N.; Aminu, M.D. Hybrid extraction of tectonic lineaments from digital elevation model. Appl. Geomat. 2022, 14, 163–180. [Google Scholar] [CrossRef]
- Basta, E.Z.; Takla, M.A. Mineralogy and origin of Abu Ghalaga ilmenite occurrence, Eastern Desert. J. Geol. 1968, 12, 87–124. [Google Scholar]
- El Ramly, M.F. A new geological map for the basement rocks in the Eastern and Southwestern desert of Egypt: Scale 1: 1,000,000. Ann. Geol. Surv. Egypt 1972, 2, 1–8. [Google Scholar]
- Salem, S.M.; El Gammal, E.A. Iron ore prospection East Aswan, Egypt, using remote sensing techniques. Egypt. J. Remote Sens. Sp. Sci. 2015, 18, 195–206. [Google Scholar] [CrossRef]
- Abdou, M.I.; Moustafa, M.A.E.-F.; Ahmed, H.E.-S.; El-Wahab, H.A. Utilization of Egyptian ilmenite ore for steel surface preparation in petroleum field. Engineering 2011, 3, 802. [Google Scholar] [CrossRef][Green Version]
- Maurice, A.E.; Basta, F.F.; Khiamy, A.A. Neoproterozoic nascent island arc volcanism from the Nubian Shield of Egypt: Magma genesis and generation of continental crust in intra-oceanic arcs. Lithos 2012, 132, 1–20. [Google Scholar] [CrossRef]
- Ramadan, A.M.; Farghaly, M.; Fathy, W.M.; Ahmed, M.M. Leaching and kinetics studies on processing of Abu-Ghalaga ilmenite ore. Int. Res. J. Eng. Tech. 2016, 3, 46–53. [Google Scholar]
- Salem, S.M. ASD field hyperspectral measurements for discrimination of the ferruginous rocks and the iron ore types at El Gedida-Ghorabi area, Bahariya Oasis, Western Desert, Egypt. Arab. J. Geosci. 2017, 10, 1–13. [Google Scholar] [CrossRef]
- Awad, H.A.; Nastavkin, A.V. Geochemical and Geotectonic Setting for Island Arc Related rocks on Um Taghir Area, Central Eastern Desert, Egypt. In Proceedings of the IOP Conference Series: Earth and Environmental Science, Vladivostok, Russia, 25–26 January 2021; IOP Publishing: Bristol, UK, 2021; Volume 720, p. 12049. [Google Scholar]
- Ali, K.A.; Andresen, A.; Stern, R.J.; Manton, W.I.; Omar, S.A.; Maurice, A.E. U-Pb zircon and Sr-Nd-Hf isotopic evidence for a juvenile origin of the c 634 Ma El-Shalul granite, Central Eastern Desert, Egypt. Geol. Mag. 2012, 149, 783–797. [Google Scholar] [CrossRef]
- Hassan, M.A.; Hashad, A.H. Precambrian of Egypt. In The Geology of Egypt; Routledge: London, UK, 1990; Volume 201, p. 248. [Google Scholar]
- Mohamed, F.H.; Moghazi, A.M.; Hassanen, M.A. Geochemistry, petrogenesis and tectonic setting of late Neoproterozoic Dokhan-type volcanic rocks in the Fatira area, eastern Egypt. Int. J. Earth Sci. 2000, 88, 764–777. [Google Scholar] [CrossRef]
- Ali, K.A.; Azer, M.K.; Gahlan, H.A.; Wilde, S.A.; Samuel, M.D.; Stern, R.J. Age constraints on the formation and emplacement of Neoproterozoic ophiolites along the Allaqi–Heiani Suture, South Eastern Desert of Egypt. Gondwana Res. 2010, 18, 583–595. [Google Scholar] [CrossRef]
- Stern, R.J.; Hedge, C.E. Geochronologic and isotopic constraints on late Precambrian crustal evolution in the Eastern Desert of Egypt. Am. J. Sci. 1985, 285, 91–127. [Google Scholar] [CrossRef]
- Willis, K.M.; Stern, R.J.; Clauer, N. Age and geochemistry of Late Precambrian sediments of the Hammamat Series from the Northeastern Desert of Egypt. Precambrian Res. 1988, 42, 173–187. [Google Scholar] [CrossRef]
- Moussa, E.M.M.; Stern, R.J.; Manton, W.I.; Ali, K.A. SHRIMP zircon dating and Sm/Nd isotopic investigations of Neoproterozoic granitoids, Eastern Desert, Egypt. Precambrian Res. 2008, 160, 341–356. [Google Scholar] [CrossRef]
- Wilde, S.A.; Youssef, K. Significance of SHRIMP U-Pb dating of the imperial porphyry and associated Dokhan volcanics, Gebel Dokhan, north Eastern Desert, Egypt. J. Afr. Earth Sci. 2000, 31, 403–413. [Google Scholar] [CrossRef]
- Hashad, A.H.; Al Shanti, A.M.S. Present status of geochronological data on the Egyptian basement complex. Evol. Miner. Arab. Shield 1980, 1, 31–46. [Google Scholar]
- Stern, R.J. Petrogenesis and tectonic setting of Late Precambrian ensimatic volcanic rocks, Central Eastern Desert of Egypt. Precambrian Res. 1981, 16, 195–230. [Google Scholar] [CrossRef]
- Ali, B.H.; Wilde, S.A.; Gabr, M.M.A. Granitoid evolution in Sinai, Egypt, based on precise SHRIMP U–Pb zircon geochronology. Gondwana Res. 2009, 15, 38–48. [Google Scholar] [CrossRef]
- Kröner, A.; Todt, W.; Hussein, I.M.; Mansour, M.; Rashwan, A. Dating of late Proterozoic ophiolites in Egypt and the Sudan using the single grain zircon evaporation technique. Precambrian Res. 1992, 59, 15–32. [Google Scholar] [CrossRef]
- Abdel-Monem, A.A.; Hurley, P.M. U-Pb dating of zircons from psammitic gneisses, Wadi Abu Rosheid-Wadi Sikait area, Egypt. In Evolution and Mineralization of the Arabian-Nubian Shield: Proceedings of a Symposium; Pergamon Press: Oxford, UK, 1979; Volume 1, p. 165. [Google Scholar]
- Abrams, M.; Crippen, R.; Fujisada, H. ASTER global digital elevation model (GDEM) and ASTER global water body dataset (ASTWBD). Remote Sens. 2020, 12, 1156. [Google Scholar] [CrossRef]
- dos Santos, M.A.; van Lier, Q.D.; van Dam, J.C.; Freire, A.H. Determination of empirical parameters for root water uptake models. Hydrol. Earth Syst. Sci. Discuss. 2016, 21, 473–493. [Google Scholar] [CrossRef]
- Richter, R.; Schläpfer, D.; Müller, A. Operational atmospheric correction for imaging spectrometers accounting for the smile effect. IEEE Trans. Geosci. Remote Sens. 2010, 49, 1772–1780. [Google Scholar] [CrossRef]
- Wambo, J.D.T.; Pour, A.B.; Ganno, S.; Asimow, P.D.; Zoheir, B.; dos Reis Salles, R.; Nzenti, J.P.; Pradhan, B.; Muslim, A.M. Identifying high potential zones of gold mineralization in a sub-tropical region using Landsat-8 and ASTER remote sensing data: A case study of the Ngoura-Colomines goldfield, eastern Cameroon. Ore Geol. Rev. 2020, 122, 103530. [Google Scholar] [CrossRef]
- Traore, M.; Wambo, J.D.T.; Ndepete, C.P.; Tekin, S.; Pour, A.B.; Muslim, A.M. Lithological and alteration mineral mapping for alluvial gold exploration in the south east of Birao area, Central African Republic using Landsat-8 Operational Land Imager (OLI) data. J. Afr. Earth Sci. 2020, 170, 103933. [Google Scholar] [CrossRef]
- Andongma, W.T.; Gajere, J.N.; Amuda, A.K.; Edmond, R.R.D.; Faisal, M.; Yusuf, Y.D. Mapping of hydrothermal alterations related to gold mineralization within parts of the Malumfashi Schist Belt, North-Western Nigeria. Egypt. J. Remote Sens. Sp. Sci. 2021, 24, 401–417. [Google Scholar] [CrossRef]
- San, B.T.; Sumer, E.O.; Gurcay, B. Comparison of band ratioing and spectral indices methods for detecting alunite and kaolinite minerals using ASTER data in Biga region, Turkey. In Proceedings ISPRS; ISPRS: Hannover, Germany, 2004. [Google Scholar]
- Inzana, J.; Kusky, T.; Higgs, G.; Tucker, R. Supervised classifications of Landsat TM band ratio images and Landsat TM band ratio image with radar for geological interpretations of central Madagascar. J. Afr. Earth Sci. 2003, 37, 59–72. [Google Scholar] [CrossRef]
- Nair, A.; Mathew, G. Lithological discrimination of the phenaimata felsic–mafic complex, Gujarat, India, using the advanced spaceborne thermal emission and reflection radiometer (ASTER). Int. J. Remote Sens. 2012, 33, 198–219. [Google Scholar] [CrossRef]
- da Cunha Frutuoso, R.M. Mapping Hydrothermal Gold Mineralization Using Landsat 8 Data. A Case of Study in Chaves License, Portugal. 2015. Available online: https://repositorio-aberto.up.pt/bitstream/10216/86528/2/127594.pdf (accessed on 6 June 2022).
- Sheikhrahimi, A.; Pour, A.B.; Pradhan, B.; Zoheir, B. Mapping hydrothermal alteration zones and lineaments associated with orogenic gold mineralization using ASTER data: A case study from the Sanandaj-Sirjan Zone, Iran. Adv. Sp. Res. 2019, 63, 3315–3332. [Google Scholar] [CrossRef]
- Ghulam, A.; Amer, R.; Kusky, T.M. Mineral exploration and alteration zone mapping in Eastern Desert of Egypt using ASTER Data. In Proceedings of the ASPRS 2010 Annual Conference, San Diego, CA, USA, 26–30 April 2010. [Google Scholar]
- Crosta, A.P.; MOORE, J.M. Geological mapping using Landsat thematic mapper imagery in Almeria Province, South-East Spain. Int. J. Remote Sens. 1989, 10, 505–514. [Google Scholar] [CrossRef]
- Bell, F.G. The physical and mechanical properties of the fell sandstones, Northumberland, England. Eng. Geol. 1978, 12, 1–29. [Google Scholar] [CrossRef]
- Tripp, G.I.; Vearncombe, J.R. Fault/fracture density and mineralization: A contouring method for targeting in gold exploration. J. Struct. Geol. 2004, 26, 1087–1108. [Google Scholar] [CrossRef]
- Sadiq, S.; Muhammad, U.; Fuchs, M. Investigation of landslides with natural lineaments derived from integrated manual and automatic techniques applied on geospatial data. Nat. Hazards 2022, 110, 2141–2162. [Google Scholar] [CrossRef]
- Abdul Malik, N.F.; Garba, I.; Danbatta, U.A.; Hamza, H. Delineation and correlation of lineaments using landsat-7 ETM+, DEM and aeromagnetic datasets: Basement complex of shanono, northwestern Nigeria. J. Geol. Geophys 2018, 7, 445. [Google Scholar]
- Weerasekara, W.L.; Mayadunna, B.B.; Senanayake, I.P.; Dissanayake, D. Integrated remote sensing and GIS in lineament mapping for groundwater exploration–A case study in Ambalantota, Sri Lanka. In Proceeding of SAITM Research Symposium on Engineering Advancements; South Asian Institute of Technology and Medicine: Malabe, Sri Lanka, 2014; p. 62e65. [Google Scholar]
- Immaculate, N.-F.M.; Tende, A.W.; Fouateu, Y.R.; Marc, A.F.Q. Remote sensing for geological investigation of Mayo Kila and environs, north west region of Cameroon. Am. J. Earth Sci. 2020, 7, 1–12. [Google Scholar]
- Hung, L.Q.; Batelaan, O.; De Smedt, F. Lineament extraction and analysis, comparison of LANDSAT ETM and ASTER imagery. Case study: Suoimuoi tropical karst catchment, Vietnam. In Proceedings of the Remote Sensing for Environmental Monitoring, GIS Applications, and Geology V, Bruges, Belgium, 19–22 September 2005; Volume 5983, pp. 182–193. [Google Scholar]
- Ridley, J. Ore Deposit Geology; Cambridge University Press: Cambridge, UK, 2013; ISBN 1107022223. [Google Scholar]
- Hall, A. The influence of secondary alteration on the ammonium content of granites, exemplified by the Rosses complex of Donegal. Mineral. Mag. 1993, 57, 591–598. [Google Scholar] [CrossRef]
- Browne, P.R.L. Hydrothermal alteration in active geothermal fields. Annu. Rev. Earth Planet. Sci. 1978, 6, 229–250. [Google Scholar] [CrossRef]
- Streckeisen, A. Classification of the Common Igneous Rocks by Means of Their Chemical Composition: A Provisional Attempt. Neues Jahrb. Mineral. 1976, 1, 1. [Google Scholar]
- Irvine, T.N.J.; Baragar, W.R.A. A guide to the chemical classification of the common volcanic rocks. Can. J. Earth Sci. 1971, 8, 523–548. [Google Scholar] [CrossRef]
- Maniar, P.D.; Piccoli, P.M. Tectonic discrimination of granitoids. Geol. Soc. Am. Bull. 1989, 101, 635–643. [Google Scholar] [CrossRef]
- Jensen, L.S. A new plot for classifying subalkalic volcanic rocks. Ont. Div. Mines Misc. Pap. 1976, 66, 1–22. [Google Scholar]
- Green, T.; Roberts, D. The Holonda porphyrite, Norwegian Caledonides: Geochemistry and tectonic setting of Early–Mid. Ordovician shoshonitic volcanism. J. Geol. Soc. 1998, 155, 131–142. [Google Scholar] [CrossRef]
- Pearce, J.A.; Harris, N.B.W.; Tindle, A.G. Trace element discrimination diagrams for the tectonic interpretation of granitic rocks. J. Petrol. 1984, 25, 956–983. [Google Scholar] [CrossRef]
- Middlemost, E.A.K. Naming materials in the magma/igneous rock system. Earth-Sci. Rev. 1994, 37, 215–224. [Google Scholar] [CrossRef]
- Shand, S.J. On the relations between silica, alumina, and the bases in eruptive rocks, considered as a means of classification. Geol. Mag. 1927, 64, 446–449. [Google Scholar] [CrossRef]
- Cuney, M.; Friedrich, M. Physicochemical and crystal-chemical controls on accessory mineral paragenesis in granitoids: Implications for uranium metallogenesis. Bull. Mineral. 1987, 110, 235–247. [Google Scholar] [CrossRef]
- Large, R.R.; Gemmell, J.B.; Paulick, H.; Huston, D.L. The alteration box plot: A simple approach to understanding the relationship between alteration mineralogy and lithogeochemistry associated with volcanic-hosted massive sulfide deposits. Econ. Geol. 2001, 96, 957–971. [Google Scholar] [CrossRef]
- Ishikawa, Y.; Sawaguchi, T.; Iwaya, S.; Horiuchi, M. Delineation of prospecting targets for Kuroko deposits based on modes of volcanism of underlying dacite and alteration haloes. Min. Geol. 1976, 26, 105–117. [Google Scholar]
- Meyer, C. Wall Rock Alteration. In Geochemistry of Hydrothermal Ore Deposits; John Wiley & Sons: Hoboken, NJ, USA, 1967; pp. 166–235. [Google Scholar]
- Wu, M.; Zhou, K.; Wang, Q.; Wang, J. Mapping hydrothermal zoning pattern of porphyry Cu deposit using absorption feature parameters calculated from ASTER data. Remote Sens. 2019, 11, 1729. [Google Scholar] [CrossRef]
- Moradi, R.; Boomeri, M. Remote sensing detection of altered zones associated with Cu-Mo mineralization in North of Zahedan, SE Iran using Landsat-8 data. Yerbilimleri 2017, 38, 275–294. [Google Scholar]
- Mia, B.; Fujimitsu, Y. Mapping hydrothermal altered mineral deposits using Landsat 7 ETM+ image in and around Kuju volcano, Kyushu, Japan. J. Earth Syst. Sci. 2012, 121, 1049–1057. [Google Scholar] [CrossRef]
- Zoheir, B.; Emam, A. Integrating geologic and satellite imagery data for high-resolution mapping and gold exploration targets in the South Eastern Desert, Egypt. J. Afr. Earth Sci. 2012, 66, 22–34. [Google Scholar] [CrossRef]
- Kamel, M.; Youssef, M.; Hassan, M.; Bagash, F. Utilization of ETM+ Landsat data in geologic mapping of wadi Ghadir-Gabal Zabara area, Central Eastern Desert, Egypt. Egypt. J. Remote Sens. Sp. Sci. 2016, 19, 343–360. [Google Scholar] [CrossRef][Green Version]
- Shirmard, H.; Farahbakhsh, E.; Beiranvand Pour, A.; Muslim, A.M.; Müller, R.D.; Chandra, R. Integration of selective dimensionality reduction techniques for mineral exploration using ASTER satellite data. Remote Sens. 2020, 12, 1261. [Google Scholar] [CrossRef]
- Fatima, K.; Khattak, M.U.K.; Kausar, A.B.; Toqeer, M.; Haider, N.; Rehman, A.U. Minerals identification and mapping using ASTER satellite image. J. Appl. Remote Sens. 2017, 11, 46006. [Google Scholar] [CrossRef]
- Yusuf, S.N.; Kuku, A.Y.; Ibrahim, Y.; Kasidi, S. Tectono-metamorphic deformation and structures of Mubi-Hong area, NE, Nigeria. Niger. J. Technol. Dev. 2019, 16, 201–212. [Google Scholar] [CrossRef]
- Ananaba, S.E.; Ajakaiye, D.E. Evidence of tectonic control of mineralization in Nigeria from lineament density analysis A Landsat-study. Int. J. Remote Sens. 1987, 8, 1445–1453. [Google Scholar] [CrossRef]
- Ibrahim, I.H. Impact of Structural Lineaments on Mineralized Occurrences in North Abu Rusheid-Sikait Area, South Eastern Desert, Egypt. In Proceedings of the 5th Tunisian Days of Applied Geology JTGA 2013, Hammamet, Tunisia, 17–20 May 2013; pp. 227–251. [Google Scholar]


| Rock Units | Age | Authors | |
|---|---|---|---|
| Post-orogenic stage | Post-orogenic to anorogenic; Ultrabasic–basic intrusion, Felsites and A-type granites (El-Sibai–Gharib). | 610–550 | [16,19] |
| Hammamat group (sandstone, conglomerate, greywacke, and volcaniclastics). | 600–585 | [20,21] | |
| Orogenic stage | Dokhan volcanics (andesite and rhyolite flows, pyroclastics, and dyke swarms. | 600–550 | [19,22] |
| Calc–alkaline granites (quartz diorite–trondhjemitetonalite–granodiorite). | 800–614 | [16,19,23] | |
| Island arc assemblage: arc metavolcanics and metagabbro–diorite complexes. | 850–620 | [19,24,25] | |
| Ophiolites sequence; Serpentinites, metagabbro, old metavolcanics (OMV), sheeted dykes, and pillow lava. | 810–730 | [18,26] | |
| Juvenile continental crust | Metasediments (gneisses, amphibolites and migmatites) (e.g., Hafafit, Sikait, Meatiq). | 1770–1900 | [4,27] |
| Bands | Wavelength (Micrometers) | Resolution (Meters) | |
|---|---|---|---|
| Band 1 | Coastal aerosol | 0.43–0.45 | 30 |
| Band 2 | Blue | 0.45–0.51 | 30 |
| Band 3 | Green | 0.53–0.59 | 30 |
| Band 4 | Red | 0.64–0.67 | 30 |
| Band 5 | Near Infrared (NIR) | 0.85–0.88 | 30 |
| Band 6 | SWIR 1 | 1.57–1.65 | 30 |
| Band 7 | SWIR 2 | 2.11–2.29 | 30 |
| Band 8 | Panchromatic | 0.50–0.68 | 15 |
| Band 9 | Cirrus | 1.36–1.38 | 30 |
| Band 10 | Thermal Infrared (TIRS) 1 | 10.6–11.19 | 100 |
| Band 11 | Thermal Infrared (TIRS) 2 | 11.50–12.51 | 100 |
| Band | Label | Wavelength (µm) | Resolution (m) | Nadir or Backward | Description |
|---|---|---|---|---|---|
| B1 | VNIR_Band1 | 0.520–0.60 | 15 | Nadir | Visible green/yellow |
| B2 | VNIR_Band2 | 0.630–0.690 | 15 | Nadir | Visible red |
| B3N | VNIR_Band3N | 0.760–0.860 | 15 | Nadir | Near infrared |
| B3B | VNIR_Band3B | 0.760–0.860 | 15 | Backward | |
| B4 | SWIR_Band4 | 1.600–1.700 | 30 | Nadir | Short-wave infrared |
| B5 | SWIR_Band5 | 2.145–2.185 | 30 | Nadir | |
| B6 | SWIR_Band6 | 2.185–2.225 | 30 | Nadir | |
| B7 | SWIR_Band7 | 2.235–2.285 | 30 | Nadir | |
| B8 | SWIR_Band8 | 2.295–2.365 | 30 | Nadir | |
| B9 | SWIR_Band9 | 2.360–2.430 | 30 | Nadir | |
| B10 | TIR_Band10 | 8.125–8.475 | 90 | Nadir | Long-wave infrared |
| B11 | TIR_Band11 | 8.475–8.825 | 90 | Nadir | or thermal IR |
| B12 | TIR_Band12 | 8.925–9.275 | 90 | Nadir | |
| B13 | TIR_Band13 | 10.250–10.950 | 90 | Nadir | |
| B14 | TIR_Band14 | 10.950–11.650 | 90 | Nadir |
| Sn | Parameter Settings | Parameter Value |
|---|---|---|
| 1 | Filter Radius (Pixels) | 5 |
| 2 | Edge Gradient Threshold | 10 |
| 3 | Curved Length Threshold (Pixels) | 10 |
| 4 | Line fitting Error Threshold (Pixels) | 3 |
| 5 | Angular difference Threshold (Degrees) | 30 |
| 6 | Linking Distance Threshold (Pixels) | 20 |
| Rock Types | Mineralogical Composition | Texture | Alteration Types |
|---|---|---|---|
| Metarhyolite | Quartz, sanadine, plagioclase | Spherulitic, porphyritic | Kaolinite, epidote, carbonate, sericite |
| Metabasalt | Plagioclase and pyroxene | Vesicular or spilite | Chlorite |
| Metaandesite | Plagioclase, hornblende, pyroxene | Porphyritic | Chlorite, epidote. |
| Metagabbros | Clinopyroxene, plagioclase, and hornblende | Diabasic, subophitic, schiller | Epidote, chlorite, carbonate. |
| Diorite | Plagioclase, biotite, hornblende, and pyroxene | Hypidiomorphic | Epidote, chlorite, kaolinite. |
| Biotite granodiorites | Quartz, plagioclase, microcline, and biotite | Hypidiomorphic, poikilitic, graphic | Sericite, epidote. |
| Tonalites | Quartz, plagioclase, orthoclase, and biotite | Hypidiomorphic granular, gneissose | Chlorite, epidote, muscovite. |
| Rock Type | Tonalite | Granodiorite | Diorite | |||||||||||||||||
|---|---|---|---|---|---|---|---|---|---|---|---|---|---|---|---|---|---|---|---|---|
| S. No. | 1A | 5A | 8A | 8A1 | 11A | 17A | 18A | 47A | 48A | Av | 2A | 4A | 12A | 19A | Av | 3A | 9A | 10A | 14A | Av |
| SiO2 | 75.65 | 70.36 | 75 | 77.76 | 66.03 | 73.26 | 77.37 | 73.48 | 75.36 | 73.81 | 75.54 | 69.7 | 76.36 | 70.41 | 73.00 | 57.15 | 54.82 | 54.34 | 54.71 | 55.26 |
| TiO2 | 0.17 | 0.32 | 0.29 | 0.14 | 0.35 | 0.1 | 0.03 | 0.34 | 0.36 | 0.23 | 0.2 | 0.86 | 0.1 | 0.35 | 0.38 | 0.69 | 0.94 | 0.86 | 0.63 | 0.78 |
| A12O3 | 13.08 | 14.63 | 12.44 | 11.22 | 16.94 | 14.73 | 12.94 | 12.13 | 11.75 | 13.32 | 13.74 | 13.55 | 13.11 | 14.51 | 13.73 | 18.47 | 16.79 | 18.1 | 14.32 | 16.92 |
| Fe2O3 | 1.8 | 3.5 | 3.85 | 1.99 | 3.62 | 1.72 | 1.03 | 3.4 | 2.93 | 2.65 | 2 | 5.24 | 1.27 | 3.14 | 2.91 | 6.3 | 8.77 | 8.18 | 8.91 | 8.04 |
| FeO | 1.62 | 3.14 | 3.5 | 1.8 | 3.3 | 1.55 | 0.93 | 3.1 | 2.64 | 2.40 | 1.8 | 4.7 | 1.14 | 2.83 | 2.62 | 5.7 | 7.9 | 7.4 | 8.02 | 7.26 |
| MnO | 0 | 0 | 0.01 | 0 | 0 | 0 | 0 | 0.01 | 0.01 | 0.00 | 0.01 | 0.01 | 0.01 | 0 | 0.01 | 0.01 | 0.02 | 0.02 | 0.02 | 0.02 |
| MgO | 0.58 | 1.63 | 0.71 | 0.61 | 1.98 | 0.32 | 0.01 | 1.14 | 0.75 | 0.86 | 0.31 | 1.65 | 0.03 | 1.23 | 0.81 | 3.61 | 5.72 | 5.27 | 7.65 | 5.56 |
| CaO | 1.56 | 2.65 | 2.84 | 1.85 | 4.28 | 2.6 | 1.71 | 4.54 | 2.72 | 2.75 | 0.77 | 2.54 | 1.24 | 3.56 | 2.03 | 5.68 | 7.77 | 9.02 | 9.86 | 8.08 |
| Na2O | 5.31 | 4.65 | 3.89 | 5.31 | 4.61 | 5.38 | 5.81 | 3.46 | 4.31 | 4.75 | 4.83 | 4.06 | 5.29 | 4.46 | 4.66 | 5.01 | 3.06 | 2.88 | 2.56 | 3.38 |
| K2O | 0.75 | 0.97 | 0.45 | 0.4 | 0.92 | 0.7 | 0.46 | 0.51 | 0.66 | 0.65 | 1.37 | 1.09 | 1.93 | 1.21 | 1.40 | 1.05 | 0.37 | 0.3 | 0.25 | 0.49 |
| P2O5 | 0.02 | 0.06 | 0.01 | 0.01 | 0.03 | 0.01 | 0.01 | 0.03 | 0.02 | 0.02 | 0 | 0.07 | 0.01 | 0.05 | 0.03 | 0.11 | 0.06 | 0.09 | 0.01 | 0.07 |
| Cl | 0.01 | 0.01 | 0.01 | 0.01 | 0.01 | 0.01 | 0.01 | 0.01 | 0.01 | 0.01 | 0.01 | 0.01 | 0.01 | 0.01 | 0.01 | 0.01 | 0.01 | 0.01 | 0.01 | 0.01 |
| SO3 | 0.04 | 0.02 | 0.02 | 0.02 | 0.02 | 0.02 | 0.01 | 0.01 | 0.01 | 0.02 | 0.01 | 0.04 | 0.01 | 0.01 | 0.02 | 0.04 | 0.03 | 0.01 | 0.02 | 0.03 |
| LOI | 0.74 | 0.88 | 0.19 | 0.41 | 0.9 | 0.89 | 0.49 | 0.65 | 0.81 | 0.66 | 0.93 | 0.88 | 0.39 | 0.78 | 0.75 | 1.57 | 1.33 | 0.63 | 0.76 | 1.07 |
| Total | 101.3 | 102.8 | 103.2 | 101.5 | 102.9 | 101.2 | 100.8 | 102.8 | 102.3 | 102.1 | 101.5 | 104.4 | 100.9 | 102.5 | 102.3 | 105.4 | 107.5 | 107.1 | 107.7 | 106.7 |
| Na2O/K2O | 7.08 | 4.8 | 8.64 | 13.3 | 5.01 | 7.7 | 12.63 | 6.78 | 6.53 | 8.1 | 3.53 | 3.72 | 2.74 | 3.7 | 3.4 | 4.8 | 8.3 | 9.6 | 10.24 | 8.2 |
| Rare earth elements (ppm) | ||||||||||||||||||||
| Ce | 8.12 | 9.83 | 9.54 | 14.47 | 10.66 | 8.07 | 7.32 | 18.8 | 14.95 | 11.1 | 10.13 | 16 | 10.08 | 20 | 14.1 | 8.86 | 6 | 4.44 | 1.53 | 4.97 |
| Dy | 0 | 0 | 0 | 0 | 0 | 0 | 0 | 2.8 | 0.56 | 0.37 | 0 | 0 | 0 | 0 | 0.0 | 0 | 0 | 0 | 0 | 0.00 |
| Er | 0 | 0 | 0.08 | 0 | 0 | 0 | 0 | 4.22 | 3.57 | 0.87 | 0 | 0 | 0 | 0 | 0.0 | 1.13 | 2.2 | 0.66 | 0.22 | 0.86 |
| Gd | 0.85 | 1.66 | 4.26 | 2.34 | 1.72 | 0 | 0.04 | 8.45 | 5.74 | 2.78 | 0.18 | 3.21 | 0.41 | 1.37 | 1.3 | 6.8 | 8.5 | 5.48 | 6.23 | 6.11 |
| Nd | 15.7 | 21.11 | 26.19 | 17.04 | 27.86 | 7.4 | 5.18 | 35.6 | 34.5 | 21.8 | 13.4 | 45.02 | 15.8 | 23.5 | 24.4 | 57.68 | 74.18 | 50.99 | 40.28 | 51.8 |
| Pr | 0.68 | 2.7 | 3.82 | 1.83 | 3.15 | 3.74 | 2.19 | 6.6 | 4.4 | 3.23 | 0.22 | 3.33 | 1 | 5.7 | 2.6 | 7.3 | 9.99 | 8.34 | 9.69 | 8.58 |
| Sm | 0 | 0 | 0 | 0 | 0 | 0 | 0 | 2.7 | 0.75 | 0.38 | 0 | 0 | 0 | 0 | 0.0 | 0.17 | 0.11 | 0 | 0 | 0.06 |
| Y | 5.06 | 3.71 | 18.8 | 17.43 | 3.26 | 0 | 4.83 | 54.7 | 38.8 | 16.3 | 2.8 | 6.78 | 4.95 | 1.5 | 4.0 | 11.5 | 13.52 | 9.63 | 9.84 | 9.14 |
| Yb | 0.71 | 0.62 | 2.41 | 2.3 | 0.57 | 0 | 0.08 | 4.96 | 4.1. | 1.46 | 0.6 | 1 | 0.74 | 0 | 0.6 | 1.72 | 2.57 | 1.82 | 2.01 | 1.76 |
| CIPW normative minerals | ||||||||||||||||||||
| Q | 38.0 | 30.87 | 43.03 | 40.77 | 22.71 | 32.89 | 38.23 | 38.2 | 38.67 | 35.93 | 40.42 | 33.03 | 35.27 | 30 | 34.7 | - | 9.69 | 9.08 | - | 4.7 |
| Or | 4.65 | 5.37 | 2.79 | 2.36 | 5.44 | 4.14 | 2.83 | 3.22 | 4.14 | 3.88 | 8.55 | 6.44 | 11.41 | 7.15 | 8.4 | 6.81 | 2.19 | 1.77 | 1.68 | 3.1 |
| An | 13.9 | 23.6 | 28.8 | 10.8 | 33.9 | 36.98 | 13.14 | 34.4 | 22 | 24.17 | 8.1 | 25.1 | 11.4 | 28.8 | 18.4 | 35.8 | 53.4 | 58.4 | 52.35 | 50.0 |
| Ab | 39.1 | 28.09 | 18.42 | 39.6 | 25.87 | 21.1 | 44.23 | 11.96 | 22.28 | 27.86 | 57.59 | 20.99 | 39.17 | 24.84 | 35.6 | 34.8 | 3.35 | 1.38 | - | 9.9 |
| Di | - | - | - | 2.78 | - | - | 0.36 | 4.18 | 1.68 | 2.25 | - | - | - | 1 | 1.0 | 1.74 | 2.65 | 6.77 | 15.72 | 6.7 |
| Hy | 2.04 | 6.41 | 3.38 | 1.58 | 7.42 | 2.06 | 0.64 | 7.31 | 6.55 | 4.15 | 1.57 | 7.01 | 0.97 | 4.6 | 3.5 | 17.57 | 17.27 | 15.31 | 27.2 | 19.3 |
| Mt | 1.35 | 5.07 | 2.89 | 2.89 | 5.25 | 2.49 | 1.49 | 0.26 | 0.22 | 2.43 | 1.51 | 7.6 | 1.84 | 4.55 | 3.9 | 0.49 | 12.72 | 11.86 | 0.72 | 6.4 |
| Ilm | 0.18 | 0.61 | 0.31 | 0.27 | 0.66 | 0.19 | 0.06 | 0.37 | 0.39 | 0.34 | 0.22 | 1.63 | 0.19 | 0.66 | 0.7 | 0.78 | 1.79 | 1.63 | 0.74 | 1.2 |
| Ap | 0.04 | 0.14 | 0.02 | 0.02 | 0.07 | 0.02 | 0.02 | 0.06 | 0.04 | 0.05 | - | 0.16 | 0.02 | 0.12 | 0.1 | 0.25 | 0.14 | 0.21 | 0.02 | 0.2 |
| c | 0.56 | 1.34 | 0.31 | - | 0.7 | 0.47 | - | - | - | 0.68 | 2.01 | 1.28 | 0.13 | - | 1.1 | - | - | - | - | 0.0 |
| Hm | 0.02 | 0.02 | 0.02 | 0.02 | 0.02 | 0.02 | 0.02 | 0.02 | 0.02 | 0.02 | 0.02 | 0.02 | 0.02 | 0.02 | 0.0 | 0.02 | 0.02 | 0.02 | 0.03 | 0.0 |
| NS | 0.07 | 0.07 | 0.02 | 0.04 | 0.04 | 0.0 | 0.0 | 0.0 | 0.0 | 0.03 | 0.02 | 0.07 | 0.02 | 0.0 | 0.0 | 0.04 | 0.04 | 0.05 | 0.04 | 0.0 |
| Rock Type | Gabbro | |||||||||||
|---|---|---|---|---|---|---|---|---|---|---|---|---|
| S. No. | 7A | 15A | 32A | 33A | 34A | 35A | 36A | 37A | 42A | 45A | 46A | Av. |
| SiO2 | 50.35 | 51.7 | 53.92 | 52.77 | 50.03 | 53.97 | 49.69 | 52.9 | 56.54 | 48.8 | 48.1 | 51.7 |
| TiO2 | 0.87 | 1.08 | 0.64 | 1.11 | 4.35 | 0.94 | 4.89 | 1.48 | 0.5 | 0.58 | 0.51 | 1.5 |
| A12O3 | 17.45 | 15.21 | 20.54 | 18.6 | 14.5 | 18.94 | 13.5 | 18.14 | 14.33 | 16.36 | 19.01 | 17.0 |
| Fe2O3 | 8.03 | 10.22 | 5.97 | 8.78 | 12.56 | 8.06 | 13.71 | 8.95 | 8.75 | 9.19 | 8.41 | 9.3 |
| FeO | 7.22 | 9.2 | 5.37 | 7.9 | 11.3 | 7.3 | 12.33 | 8.1 | 7.87 | 8.27 | 7.57 | 8.4 |
| MnO | 0.01 | 0.04 | 0 | 0.01 | 0.01 | 0.02 | 0.02 | 0.02 | 0.04 | 0.02 | 0.02 | 0.0 |
| MgO | 10.23 | 7.3 | 4.53 | 5.76 | 5.5 | 4.89 | 6.05 | 5.14 | 6.07 | 7.45 | 7.5 | 6.4 |
| CaO | 8.01 | 9.48 | 7.74 | 7.47 | 8.91 | 7.57 | 7.67 | 7.48 | 7.87 | 14.45 | 12.69 | 9.0 |
| Na2O | 2.38 | 2.92 | 4.22 | 3.61 | 2.84 | 3.91 | 2.9 | 3.44 | 3.22 | 1.55 | 1.39 | 2.9 |
| K2O | 0.1 | 0.4 | 0.45 | 0.21 | 0.21 | 0.19 | 0.24 | 0.36 | 0.65 | 0.35 | 0.34 | 0.3 |
| P2O5 | 0.03 | 0.1 | 0.02 | 0.09 | 0.22 | 0.05 | 0.27 | 0.1 | 0.01 | 0.01 | 0.01 | 0.1 |
| Cl | 0.01 | 0.01 | 0.01 | 0.01 | 0.01 | 0.01 | 0.01 | 0.01 | 0.01 | 0.01 | 0.01 | 0.0 |
| SO3 | 0.02 | 0.02 | 0.01 | 0.01 | 0.01 | 0.01 | 0.01 | 0.06 | 0.02 | 0.02 | 0.01 | 0.0 |
| LOI | 2.2 | 1.22 | 1.66 | 1.27 | 0.55 | 1.16 | 0.65 | 1.62 | 1.7 | 0.92 | 1.7 | 1.3 |
| Total | 106.91 | 108.9 | 105.08 | 107.6 | 111 | 107.02 | 111.94 | 107.8 | 107.58 | 107.98 | 107.2 | 108.1 |
| Na2O/K2O | 23.8 | 7.3 | 9.38 | 17.2 | 13.52 | 20.6 | 12.1 | 9.56 | 4.95 | 4.43 | 4.1 | 11.5 |
| Rare earth elements (ppm) | ||||||||||||
| Ce | 4.03 | 9.73 | 3.47 | 4.74 | 18.14 | 5.6 | 19.37 | 18.9 | 1.98 | 4.28 | 0.96 | 8.3 |
| Er | 0.08 | 3.11 | 0.5 | 2.83 | 12.88 | 2.1 | 16.6 | 3.85 | 0.56 | 0.61 | 0.48 | 4.0 |
| Gd | 3.56 | 10.44 | 3.54 | 7.23 | 14.29 | 6.2 | 14.6 | 7.6 | 6.72 | 7.37 | 8.5 | 8.2 |
| Nd | 35.94 | 77.25 | 39.2 | 80.1 | 263 | 63.2 | 333 | 1.04 | 32.8 | 35.5 | 28.3 | 89.9 |
| Pr | 7.6 | 10.9 | 8.12 | 9.13 | 12.3 | 8.3 | 11.4 | 9.7 | 10.2 | 15.65 | 11.8 | 10.5 |
| Sm | 0 | 1.66 | 0 | 0 | 2.79 | 0 | 3.02 | 0.28 | 0 | 0 | 2.79 | 1.0 |
| Tb | 0 | 0 | 0 | 0 | 2.72 | 0 | 3.6 | 0.07 | 0 | 0 | 0 | 0.6 |
| Y | 1.23 | 26.08 | 0 | 1.95 | 10.5 | 2.9 | 15.2 | 4.3 | 6.5 | 8.35 | 4.7 | 7.4 |
| Yb | 0.7 | 3.44 | 0 | 0.46 | 1.99 | 0.42 | 2.04 | 0.62 | 1.06 | 1.14 | 0.66 | 1.1 |
| CIPW normative minerals | ||||||||||||
| Q | - | - | - | - | - | - | - | - | 1.55 | 1.39 | - | 1.5 |
| Or | 0.68 | 2.69 | 2.94 | 1.39 | 1.42 | 1.25 | 1.63 | 2.39 | 4.36 | 4.36 | 2.3 | 3.7 |
| An | 61.47 | 51.3 | 48.8 | 51.4 | 51.1 | 49.1 | 47.4 | 52.3 | 44.8 | 44.4 | 47.1 | 45.4 |
| Ab | - | 4.72 | 26.37 | 16.98 | 3.31 | 21.29 | 4.56 | 13.72 | 8.99 | 9.56 | 12.96 | 10.5 |
| Di | 1.99 | 13.68 | 1.66 | 1.72 | 11.9 | 2.49 | 9.49 | 2.26 | 11.44 | 11.55 | 13.08 | 12.0 |
| Hy | 20.95 | 10.04 | 12.97 | 17.45 | 15.72 | 18.58 | 17.77 | 21.68 | 27.42 | 27.38 | 7.7 | 20.8 |
| Mt | 0.66 | 0.83 | 0.47 | 0.7 | 1.03 | 0.64 | 1.12 | 0.72 | 0.7 | 0.7 | 0.69 | 0.7 |
| Ilm | 1.02 | 1.26 | 0.72 | 1.27 | 5.08 | 1.07 | 5.74 | 1.7 | 0.58 | 0.58 | 0.6 | 0.6 |
| Ap | 0.06 | 0.21 | 0.04 | 0.19 | 0.47 | 0.1 | 0.57 | 0.21 | 0.02 | 0.02 | 0.02 | 0.0 |
| Hm | 0.03 | 0.03 | 0.02 | 0.02 | 0.03 | 0.02 | 0.03 | 0.02 | 0.03 | 0.03 | 0.03 | 0.0 |
| NS | 0.04 | 0.02 | 0.0 | 0.0 | 0.0 | 0.0 | 0.0 | 0.1 | 0.1 | 0.0 | 0.0 | 0.1 |
| Ol | 13.1 | 15.23 | 5.97 | 8.86 | 9.94 | 5.43 | 11.67 | 4.88 | - | - | 15.17 | 8.2 |
| Eigenvector | Band 2 | Band 4 | Band 5 | Band 6 |
|---|---|---|---|---|
| PC 1 | 0.273741 | 0.464852 | 0.53607 | 0.649313 |
| PC 2 | 0.399449 | 0.421209 | 0.331573 | −0.7437 |
| PC 3 | 0.730148 | 0.104788 | −0.65623 | 0.158943 |
| PC 4 | 0.482069 | −0.7717 | 0.414786 | 0.006789 |
| Eigenvector | Band 2 | Band 5 | Band 6 | Band 7 |
|---|---|---|---|---|
| PC 1 | 0.262994 | 0.515968 | 0.630105 | 0.517281 |
| PC 2 | 0.430685 | 0.634116 | −0.19731 | −0.61113 |
| PC 3 | 0.358168 | 0.10182 | −0.71682 | 0.589505 |
| PC 4 | 0.785532 | −0.56684 | 0.224062 | −0.10691 |
| Eigenvector | Band 1 | Band 4 | Band 6 | Band 7 |
|---|---|---|---|---|
| PC1 | 0.358965 | 0.663078 | 0.445818 | 0.482408 |
| PC2 | −0.19213 | 0.741133 | −0.44609 | −0.46348 |
| PC3 | 0.907729 | −0.10509 | −0.34811 | −0.2093 |
| PC4 | −0.10128 | 0.002287 | −0.6936 | 0.713207 |
| Eigenvector | Band 1 | Band 3 | Band 5 | Band 6 |
|---|---|---|---|---|
| PC1 | 0.407388 | 0.563083 | 0.51611 | 0.500603 |
| PC2 | 0.35935 | 0.624838 | −0.509 | −0.47049 |
| PC3 | 0.50742 | −0.33813 | −0.5679 | 0.552887 |
| PC4 | 0.6689 | −0.42212 | 0.389918 | −0.47154 |
| Eigenvector | Band 1 | Band 3 | Band 5 | Band 8 |
|---|---|---|---|---|
| PC 1 | 0.425347 | 0.591601 | 0.53095 | 0.432644 |
| PC2 | −0.16961 | −0.36918 | 0.840096 | −0.35941 |
| PC3 | −0.39785 | −0.39938 | 0.095173 | 0.820458 |
| PC4 | −0.795 | 0.595155 | 0.057209 | −0.10244 |
Publisher’s Note: MDPI stays neutral with regard to jurisdictional claims in published maps and institutional affiliations. |
© 2022 by the authors. Licensee MDPI, Basel, Switzerland. This article is an open access article distributed under the terms and conditions of the Creative Commons Attribution (CC BY) license (https://creativecommons.org/licenses/by/4.0/).
Share and Cite
El-Desoky, H.M.; Tende, A.W.; Abdel-Rahman, A.M.; Ene, A.; Awad, H.A.; Fahmy, W.; El-Awny, H.; Zakaly, H.M.H. Hydrothermal Alteration Mapping Using Landsat 8 and ASTER Data and Geochemical Characteristics of Precambrian Rocks in the Egyptian Shield: A Case Study from Abu Ghalaga, Southeastern Desert, Egypt. Remote Sens. 2022, 14, 3456. https://doi.org/10.3390/rs14143456
El-Desoky HM, Tende AW, Abdel-Rahman AM, Ene A, Awad HA, Fahmy W, El-Awny H, Zakaly HMH. Hydrothermal Alteration Mapping Using Landsat 8 and ASTER Data and Geochemical Characteristics of Precambrian Rocks in the Egyptian Shield: A Case Study from Abu Ghalaga, Southeastern Desert, Egypt. Remote Sensing. 2022; 14(14):3456. https://doi.org/10.3390/rs14143456
Chicago/Turabian StyleEl-Desoky, Hatem M., Andongma W. Tende, Ahmed M. Abdel-Rahman, Antoaneta Ene, Hamdy A. Awad, Wael Fahmy, Hamada El-Awny, and Hesham M. H. Zakaly. 2022. "Hydrothermal Alteration Mapping Using Landsat 8 and ASTER Data and Geochemical Characteristics of Precambrian Rocks in the Egyptian Shield: A Case Study from Abu Ghalaga, Southeastern Desert, Egypt" Remote Sensing 14, no. 14: 3456. https://doi.org/10.3390/rs14143456
APA StyleEl-Desoky, H. M., Tende, A. W., Abdel-Rahman, A. M., Ene, A., Awad, H. A., Fahmy, W., El-Awny, H., & Zakaly, H. M. H. (2022). Hydrothermal Alteration Mapping Using Landsat 8 and ASTER Data and Geochemical Characteristics of Precambrian Rocks in the Egyptian Shield: A Case Study from Abu Ghalaga, Southeastern Desert, Egypt. Remote Sensing, 14(14), 3456. https://doi.org/10.3390/rs14143456